A Simulation Based Experiment For Comparing AMHS Performance In A Semiconductor Fabrication Facility
|
|
|
- Norma Gordon
- 6 years ago
- Views:
Transcription

1 University of Nebraska - Lincoln DigitalCommons@University of Nebraska - Lincoln Industrial and Management Systems Engineering Faculty Publications Industrial and Management Systems Engineering 2002 A Simulation Based Experiment For Comparing AMHS Performance In A Semiconductor Fabrication Facility Gerald Mackulak Arizona State University at the Tempe Campus Paul Savory University of Nebraska at Lincoln, psavory2@gmail.com Follow this and additional works at: Part of the Industrial Engineering Commons, Operational Research Commons, and the Other Operations Research, Systems Engineering and Industrial Engineering Commons Mackulak, Gerald and Savory, Paul, "A Simulation Based Experiment For Comparing AMHS Performance In A Semiconductor Fabrication Facility" (2002). Industrial and Management Systems Engineering Faculty Publications This Article is brought to you for free and open access by the Industrial and Management Systems Engineering at DigitalCommons@University of Nebraska - Lincoln. It has been accepted for inclusion in Industrial and Management Systems Engineering Faculty Publications by an authorized administrator of DigitalCommons@University of Nebraska - Lincoln.
2 G.T. Mackulak and P. Savory (2002), A Simulation Based Experiment For Comparing AMHS Performance In A Semiconductor Fabrication Facility, IEEE Transactions on Semiconductor Manufacturing. Volume 14, No. 3, pp A SIMULATION BASED EXPERIMENT FOR COMPARING AMHS PERFORMANCE IN A SEMICONDUCTOR FABRICATION FACILITY Gerald T. Mackulak, Ph.D. Department of Industrial Engineering Arizona State University Paul Savory, Ph.D. Department of Industrial and Management Systems Engineering University of Nebraska ALL CORRESPONDENCE AND CORRECTIONS SHOULD BE ADDRESSED TO: Mailing: Dr. Gerald Mackulak Phone: (480) Industrial Engineering mackulak@asu.edu PO Box Arizona State University Tempe, AZ
3 G.T. Mackulak and P. Savory (2002), A Simulation Based Experiment For Comparing AMHS Performance In A Semiconductor Fabrication Facility, IEEE Transactions on Semiconductor Manufacturing. Volume 14, No. 3, pp A SIMULATION BASED EXPERIMENT FOR COMPARING AMHS PERFORMANCE IN A SEMICONDUCTOR FABRICATION FACILITY Abstract As the cost and complexity of constructing a semiconductor fabrication facility increases, responsive tools are needed for designing and planning its operations. Discrete-event simulation paired with design of experiments is an effective combination. This article demonstrates how simulation in combination with design of experiments is used to compare the intrabay layout of two automated material handling systems. The difference in stocker robot utilization, number of vehicle moves per hour, and average delivery time for the two intrabay layouts will be compared using a fractional factorial experimental design. The study demonstrates that the distributed storage option is preferable for maximizing manufacturing performance. Although the scope of this effort was restricted to a single situation, the solution procedure has general applicability as a tutorial for practitioners. 1.0 Introduction One of the key components in designing a semiconductor fabrication facility is defining the layout and operation of the automated material handling system (AMHS). As the semiconductor industry moves towards 300mm manufacturing, design of the AMHS is significant since not only will interbay movements be automated, but due to the size and weight of the wafer cassettes, intrabay movements will also be automated. Having the AMHS be the bottleneck of the factory s production is unacceptable if high throughput and low cycle times are desired. Appropriate analysis techniques and tools are needed to carefully explore and plan the operation of an AMHS [1]
4 G.T. Mackulak and P. Savory (2002), A Simulation Based Experiment For Comparing AMHS Performance In A Semiconductor Fabrication Facility, IEEE Transactions on Semiconductor Manufacturing. Volume 14, No. 3, pp Discrete-event simulation has become one of the most important operations research techniques for analyzing a manufacturing system [2]. It s uses range from comparing alternative system designs to answering capacity and feasibility questions. In comparison, experimental design is an approach for systematically comparing a set of scenarios and testing the statistical significance between their results. An effective combination is to create a discrete-event simulation model of a system and then use experimental design to compare the results from running the model under varying conditions. The resulting analysis will provide decision makers with insight into the options available and the impact of each on production. The remaining sections of this paper demonstrate using discrete-event simulation with experimental design for comparing two AMHS systems. The difference in stocker robot utilization, number of vehicle moves per hour, and average delivery time for two different intrabay layouts, distributed storage versus central storage, on an AMHS delivery system will be compared. Section 2 describes the two intrabay layouts. Section 3 outlines the experimental design. Section 4 discusses the simulation model development and output analysis. Section 5 presents the results for the distributed storage system. Section 6 discusses the results for the central storage system. Section 7 summarizes the analysis, compares the two intrabay layouts, and offers some concluding remarks. 2.0 Intrabay Layouts The two intrabay layout configurations are presented in Figure 1. The length of the bays were initially 100 feet. This is in accordance with the recommendations of the International 300mm Initiative [3]. The total length of the bays for the central storage system was modified to be 120 feet as a result of inline rotating devices being added to the layout. The initial number of - 2 -
5 G.T. Mackulak and P. Savory (2002), A Simulation Based Experiment For Comparing AMHS Performance In A Semiconductor Fabrication Facility, IEEE Transactions on Semiconductor Manufacturing. Volume 14, No. 3, pp tools for the distributed storage system is 20 (10 on each side of bay), and 40 for the central storage system (20 in each bay). During the experimental analysis, when the number of tools is increased, the bay length is proportionally increased. In the distributed system (Figure 1a), one stocker serves one intrabay of tools, while in the central storage system (Figure 1b), one stocker serves both bays of tools in the intrabay. The distributed storage system uses one stocker per intrabay. In comparison, the central storage system requires only one stocker for multiple bays (this study uses one stocker per two bays). Furthermore, the distributed layout is such that the bays are connected at certain points so that product can transfer from one bay to the next without having to go through the stocker-interbay interface point. < Figure 1 Approximately Here > A robot cycle is defined as the movement of the robot from its existing unloaded position to the point of pickup, the loading of the item, and the subsequent delivery of the item to its destination. The reverse set of operations would also constitute a robot cycle. Figure 2 highlights the four move types which are considered single robot cycles: (1) Movement from the interbay system input point to the stocker shelf; (2) Movement from the stocker shelf to the intrabay system pickup point; (3) Movement from the intrabay system drop-off point back to the stocker shelf, and (4) Movement from the stocker shelf back to the interbay pickup point. < Figure 2 Approximately Here > The number of robot cycles per move is a function of the number of bays supplied by a single stocker. Obviously the robot stocker cycle time has an impact on the maximum number of bays that can be handled by a single stocker since robot utilization will eventually become the system limiting factor
6 G.T. Mackulak and P. Savory (2002), A Simulation Based Experiment For Comparing AMHS Performance In A Semiconductor Fabrication Facility, IEEE Transactions on Semiconductor Manufacturing. Volume 14, No. 3, pp Assuming that product can go directly from bay one to bay two in the central storage system eliminates half of these robot move cycles. If we assume that tool storage is currently not available, we still save two robot cycles per movement by using the central storage system since the moves in and out of the interbay system (between bays) are eliminated. Regular operation in the distributed system requires all four robot moves. The difference in the centralized storage layout is that robot moves 3 and 4 are not needed since the lot is traveling to the next bay on the same vehicle (i.e., the required robot moves are reduced to 50% compared to regular operation). If storage is not available at the next tool location, the product will need to return and be stored in the stocker. 3.0 Experimental Design The goal of this study is to determine the number of vehicles moves, stocker utilization, and the average delivery times for the two different layouts. The average delivery time will be the key measure for determining AMHS performance. Delivery time is defined to begin when the lot in a stocker makes the request for a transporter and ends only when it has been transported and delivered to its destination (i.e., the next station in its visitation sequence). Stocker utilization is defined as the average load of the stockers over the total capacity. In order to avoid having to use alternative stockers, a load/capacity ratio is assumed. Finally, it is assumed that the lot arrival rate remains constant. To determine the functional differences between the central and distributed storage systems, it is necessary to define a set of varying conditions under which the simulation model will be run. The first task to accomplish this involves identifying those factors that are believed to impact the delivery time profiles of both system. Following a review of industry practices and - 4 -
7 G.T. Mackulak and P. Savory (2002), A Simulation Based Experiment For Comparing AMHS Performance In A Semiconductor Fabrication Facility, IEEE Transactions on Semiconductor Manufacturing. Volume 14, No. 3, pp team member semiconductor experience, it was determined that five factors can significantly impact system performance. These five factors include: (1) the number of storage locations each containing a single front opening unified pod (FOUP) per input/output port (this concept relates to the queuing space available at each I/O port), (2) tool processing time, (3) speed of the overhead hoist vehicles (OHVs), (4) stocker cycle time, and (5) total number of tools employed in each bay. With the identification of the important factors, it is next necessary to develop a suitable range for each. The ranges are based on the guidelines outlined by the International 300mm Initiative [3]. The five experimental factors and the range of parameter values are summarized in Table 1. < Table 1 Approximately Here > Next, it is necessary to determine an efficient experimental design for investigating the effects of the factors for each of the two systems. Since one of the objectives of the study is to determine which of the five parameters significantly contributes to the resulting delivery time performance in each system, it is assumed that a one-quarter fraction of a five-factor factorial experiment will be suitable for the investigation of both storage system strategies [4]. The resolution III design requires eight simulation replications for each scenario and returns a detailed estimation of the main system effects. Unfortunately, since this experimental design results in the aliasing of two-factor interactions with main effects and other two-factor interactions, the results of the initial experiments will not be suitable for the estimation of all interactions between parameters [4]. However, it is hypothesized that only a subgroup of the five factors will be revealed as being significant to the performance of either system
8 G.T. Mackulak and P. Savory (2002), A Simulation Based Experiment For Comparing AMHS Performance In A Semiconductor Fabrication Facility, IEEE Transactions on Semiconductor Manufacturing. Volume 14, No. 3, pp The experimental design will be augmented with a single center replication in order to provide an estimate of curvature due to the potential presence of quadratic effects. Prior team experience in semiconductor fabrication suggests that such quadratic effects will range from nominal to non-existent. The inclusion of a single center point in each of the simulation experiments will provide a necessary check to this experimental design assumption. If present, further simulation experiments involving additional replications may prove to be necessary. However, the presence of a minor amount of curvature may be handled by an appropriate transformation of the response variable [4]. 4.0 Simulation Model Development and Output Analysis Models for both of the bay layouts were built using proprietary AutoMod simulation models of a major AMHS vendor. Using these models, which are near 100% emulators of the actual vehicle routing and control logic, ensured accurate results while minimizing time on model creation, verification, and validation. For each scenario of the experimental design, the average delivery time, the average number of vehicle moves, and the robot utilization was collected and stored in a data file as an hourly average. Each scenario required approximately 25 minutes of run time. Overall, over 250 hours of computer time was needed to run all the simulation scenarios. The output from each of the nine simulation replications conducted for each system is analyzed to provide an estimate of the average values of each of the three response variables. The statistical program Design-Expert is used to appropriately analyze the results. A half normal probability plot is used to aid in the determination of significant effects with regard to each of the three response variables. The resulting half normal probability plots for each system are - 6 -
9 G.T. Mackulak and P. Savory (2002), A Simulation Based Experiment For Comparing AMHS Performance In A Semiconductor Fabrication Facility, IEEE Transactions on Semiconductor Manufacturing. Volume 14, No. 3, pp displayed in Figures 3 and 4. Factors not on the plot line indicate they have a significant impact on the response variable. < Figure 3 Approximately Here > < Figure 4 Approximately Here > 5.0 DISTRIBUTED STORAGE SYSTEM The results from the simulation experiments conducted on the distributed storage system are presented in Table 2. Based on the estimates calculated for each response variable in addition to the corresponding half normal plots (Figure 3), the significant effects were chosen for inclusion in the regression models of the simulation data. The average delivery time model includes the vehicle speed and the number of tools in the bay. Tool process time is found to be the only significant effect with regard to the robot utilization response. Finally, the tool process time and the number of tools in the bay are the significant effects employed in the construction of the regression model concerning the vehicle moves per hour response. < Table 2 Approximately Here > Tables 3 5 show the analysis of variance and t-tests of model coefficients for the three response variables. To remove a mild degree of curvature in the response variable, both the models for the average delivery time and vehicles moves per hour require transformations in the response [4]. The average delivery time model involves a natural log transformation on the response while the vehicle moves per hour model fits the data to the inverse of the response. The regression models determined for each response variable are also provided in Tables 3 5. All three regression models provide suitable fits to the experimental data with regard to the model F- values as well as the resulting adjusted R 2 values. In addition, the t-tests on all of the regression - 7 -
10 G.T. Mackulak and P. Savory (2002), A Simulation Based Experiment For Comparing AMHS Performance In A Semiconductor Fabrication Facility, IEEE Transactions on Semiconductor Manufacturing. Volume 14, No. 3, pp coefficients in each model provide p-values well below the five percent level. Analysis of the residuals for each model indicates no major violation of the assumptions of normality and equal variance in the model errors. < Table 3 Approximately Here > < Table 4 Approximately Here > < Table 5 Approximately Here > Figure 5 presents the response surface for the average delivery time. The average delivery time experiences a notable increase with an increase in the number of tools in the bay while the response slightly decreases with an increase in vehicle speed. These results are intuitively correct in that an expanded number of tools employed per bay will serve to increase the distance traveled within the bay while an increased track speed might serve to promote congestion within the system. < Figure 5 Approximately Here > The main effect plot for the robot utilization response is provided in Figure 6. The simulation results appear reasonable in that a decrease in the required tool process time would allow a greater number of FOUPs to be processed in a given amount of time. This increase in stocker demand would certainly result in increased robot utilization as displayed in the main effect plot. < Figure 6 Approximately Here > Figure 7 illustrates the response surface observed for the vehicle moves per hour. Decreasing the tool process time at the low level of the number of tools in the bay results in a minor increase in the response. Vehicle moves per hour is dramatically increased by decreasing the tool process time at the high level of the number of tools in the bay. It is assumed that the - 8 -
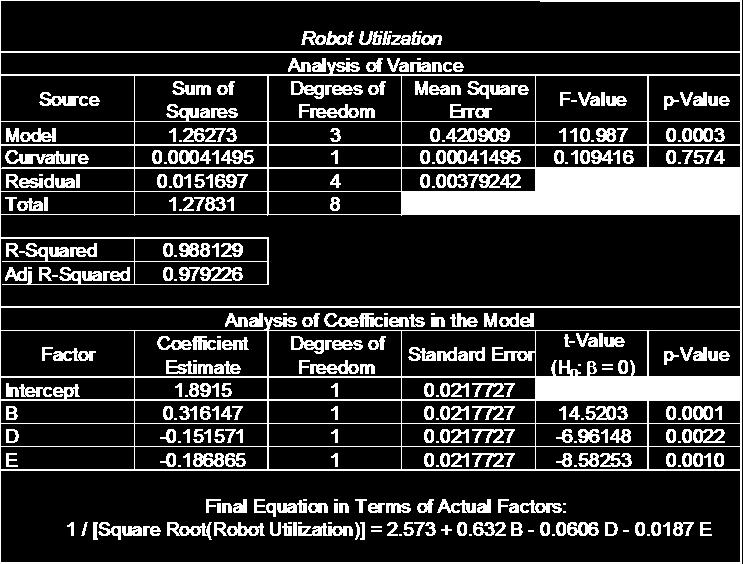
11 G.T. Mackulak and P. Savory (2002), A Simulation Based Experiment For Comparing AMHS Performance In A Semiconductor Fabrication Facility, IEEE Transactions on Semiconductor Manufacturing. Volume 14, No. 3, pp response is impacted in such a manner due to the excessive demand placed on the AMHS as a result of decreasing the tool process time within a bay of extreme distance. As such, the material handling vehicles are required to perform an increased number of moves per hour in order to meet demand. < Figure 7 Approximately Here > 6.0 CENTRAL STORAGE SYSTEM The results from the simulation experiments conducted on the central storage system are presented in Table 6. The significant effects are chosen for inclusion in the regression models based on the estimates calculated for each response variable in addition to the corresponding half normal plots (Figure 4). As in the case of the distributed storage system, the vehicle speed and number of tools in the bay are found to be the significant effects in regard to the average delivery time response. Unlike the distributed storage system, the significant effects determined for the robot utilization response includes not only the tool process time but also the stocker cycle time and the number of tools in the bay. < Table 6 Approximately Here > The results of the analysis of variance and t-tests of the model coefficients conducted for each of the three models chosen for the corresponding system responses are presented in Tables 7 9. All three models require the use of an appropriate transform on the response variable in order to either treat curvature in the underlying system or eliminate the existence of inequality of variance in the residuals [4]. As in the case of the distributed storage system, the average delivery time model requires the use of a natural log transformation on the response. The regression model developed for the robot utilization response employs the use of an inverse square root transformation. This is - 9 -
12 G.T. Mackulak and P. Savory (2002), A Simulation Based Experiment For Comparing AMHS Performance In A Semiconductor Fabrication Facility, IEEE Transactions on Semiconductor Manufacturing. Volume 14, No. 3, pp compared to corresponding distributed storage scenario model where no transformation is required. Instead of an inverse transformation on the response as required for the distributed storage system, the central storage scheme needs an inverse one-quarter power transformation to treat curvature in the model for the vehicle moves per hour response. The three regression models for the central storage system all provide good fits to the experimental data with regard to the analysis of variance, R 2 values, and t-tests on the coefficients. Analysis of the residuals indicates no major violations of the model assumptions for all three response variables. < Table 7 Approximately Here > < Table 8 Approximately Here > < Table 9 Approximately Here > Figures 8 10 show the response surfaces generated from the models developed for the average delivery time, robot utilization, and vehicle moves per hour responses. Like the distributed storage system, the central storage strategy experiences a notable increase in the average delivery time with increasing number of tools in the bay and a mild decrease in the response with increasing vehicle speed. In addition, the required number of vehicle moves per hour dramatically increases with decreasing tool process time at the maximum value of the number of tools in the bay. In terms of robot utilization, the response experiences an increase with decreasing tool process time. However, while the robot utilization in the distributed storage scheme is only affected by the tool process time, the same response in the central storage scenario is a function of not only the tool process time but also the stocker cycle time and the number of tools in the bay. < Figure 8 Approximately Here > < Figure 9 Approximately Here > < Figure 10 Approximately Here >
13 G.T. Mackulak and P. Savory (2002), A Simulation Based Experiment For Comparing AMHS Performance In A Semiconductor Fabrication Facility, IEEE Transactions on Semiconductor Manufacturing. Volume 14, No. 3, pp Concluding Remarks The goal of this study was to present a simulation-based methodology for estimating semiconductor AMHS performance and secondly to quantify performance differences between distributed and centralized stocker layouts. The study uses a combination of alternative layout designs and design of experiment techniques to identify the factors that significantly impact average delivery time and continues by illustrating how this information can be used to infer system performance. The methodology is useful as a template for anyone attempting to perform a comparison of a semiconductor material handling system. In addition, the specific results for the modeled scenario offers insight and general guidelines for layout design. Comparisons in this study were made over a realistic ranges of selected system factors (Table 1), which included queue space at I/O ports, tool processing time, AMHS vehicle speed, stocker robot cycle time, and tools in the bay. The simulation analysis was performed using a sophisticated and significantly detailed AMHS simulation model. Although there is an infinite number of possible factors that could have been altered, the five used in this study are the most significant and/or visible in most material handling studies. These five are also the factors that can have a major impact on the philosophy of the handling system design and final system cost. The comparisons of this study were to explore whether centralized storage is preferable to distributed storage in terms of selected quantifiable performance metrics. We purposely did not perform a cost analysis since the costing of these systems has a high degree of variability depending on customer, volume, past purchase agreements, and specialized interface requirements. Our hope is that the presented analysis will provide incentives for others to further investigate performance differences of these approaches. Unfortunately, equipment vendors are
14 G.T. Mackulak and P. Savory (2002), A Simulation Based Experiment For Comparing AMHS Performance In A Semiconductor Fabrication Facility, IEEE Transactions on Semiconductor Manufacturing. Volume 14, No. 3, pp unlikely to share proprietary factors and costing information with an independent third party for such a comprehensive comparison to be conducted. The conclusion of this study is that the average delivery time produced for the distributed system is strictly less than the value produced by the centralized system. This conclusion holds in spite of the fact that the centralized system requires significantly fewer robot cycles per move on the average. One must therefore conclude that although the robot cycles needed to move product are reduced, the impact of greater distances offset this advantage. In all cases, increasing vehicle speed improves performance, but not to the extent one might expect. For example, doubling vehicle speed did not significantly reduce delivery time. Common assumptions regarding vehicle speed tend to be opposite of this result. It is commonly assumed that performance is near linearly related to vehicle speed, while in actuality, blockage and routing play larger roles. Comparing Figure 5 with Figure 8 shows that average delivery time is slightly higher for the central storage system. The delivery time for the distributed storage system varies from a low of 3.07 minutes to a high of 4.84 minutes. In comparison, the delivery times for the central storage system range from a low of 3.21 minutes to a high of 4.98 minutes. This difference, at the extremes, translates to about an average of eight seconds per move. Eight seconds a move may appear to be small, but if one considers that a typical semiconductor facility may require 500 moves per hour, the impact translates to a savings of one to two vehicles, given certain availability and utilization assumptions. Figure 6 and Figure 9 compare stocker robot utilization. Again, the distributed storage system outperforms the central storage scheme. The robot utilization resulting from the distributed storage scenario ranges from 0.24 (when tool process time is at the high level) to
15 G.T. Mackulak and P. Savory (2002), A Simulation Based Experiment For Comparing AMHS Performance In A Semiconductor Fabrication Facility, IEEE Transactions on Semiconductor Manufacturing. Volume 14, No. 3, pp (when tool process time is at the low level). For the central storage scheme, robot utilization varies from a low of 0.17 (when the tool process time is at the high level, the stocker cycle time is at the low level, and the number of tools in the bay is at the low level) to a high of 0.52 (when tool process time is at the low level, the stocker cycle time is at the high level, and the number of tools in the bay is at the high level). Again, this study did not consider the sizing of the stockers which may further favor the distributed system. If the centralized stocker requires more storage locations because of the two bay service zone, the average robot cycle time will probably also increase, further increasing the centralized systems average delivery time. However, if cost is considered, the centralized stocker may have the advantage of using a single robot and subsequent lower cost. The number of vehicles moves per hour can be compared with Figure 7 and Figure 10. For the distributed storage system, the low value is moves per hour when the significant factors of tool process time and stocker cycle time are set at the high and the low levels respectively. Alternatively, the high value of vehicle moves per hour is 58.1 when tool process time is at the low level and stocker cycle time is at the high level. For the central storage option, the values range from to a high of Although vehicle moves per hour are typically quoted on AMHS designs, they have relatively little value to a steady state operation working at less than full capacity. If the design is adequate, the moves per hour will be approximately the same, regardless of the storage approach used. The centralized system should however require fewer robot cycles to conduct these moves. Though this study indicates that the tool-to-tool movements does not result in a reduction in average move times. The comparison demonstrates that the distributed storage option is slightly preferable for maximizing manufacturing performance in terms of the three performance variables. This may
16 G.T. Mackulak and P. Savory (2002), A Simulation Based Experiment For Comparing AMHS Performance In A Semiconductor Fabrication Facility, IEEE Transactions on Semiconductor Manufacturing. Volume 14, No. 3, pp not be true for all systems since it depends on the performance values of the factors and the physical layout of the system. Although the scope of this effort was restricted to a two-bay problem, the solution procedure of combining discrete-event simulation with experimental design has general applicability to practitioners. One must remember that simulation is non-optimizing, it only estimates the effects of a given operation policy. As such, there are two statistical problems associated with simulation studies: (1) the strategic problems concerned with the design of a set of experiments, and (2) the difficulties concerned with how each experiment is conducted. As we have demonstrated, if one combines discrete-event simulation with the techniques and tools of design of experiments, a practitioner can systematically simulate the impact of varying conditions on a system and correctly compare the results. ACKNOWLEDGEMENTS We wish to thank project team members: James David, Ernesto Galaz, Fredrik Malmgren, Joakim Yngve, Miki Fukunari, and Siroos Sokhan-Sanj. REFERENCES [1] T.J. Jefferson, D. Pillai, Throughput analysis and Modeling of 300mm Intrabay Transport Vehicles, in Proceedings of International Conference on Semiconductor Manufacturing Operational Modeling and Simulation, 1999, pp [2] M.S. Lane, A.H. Mansour, and J.L. Harper, Operations research techniques: A longitudinal update , Interfaces, vol. 23, no. 2, pp , March-April [3] E. Bass and J. Eddy, Metrics for 300 mm Automated Material Handling (AMHS) and Production Equipment Interfaces, Technology Transfer # A-TR, International 300 mm Initiative, p. 13, December 12,
17 G.T. Mackulak and P. Savory (2002), A Simulation Based Experiment For Comparing AMHS Performance In A Semiconductor Fabrication Facility, IEEE Transactions on Semiconductor Manufacturing. Volume 14, No. 3, pp [4] D.C. Montgomery, Design and Analysis of Experiments, 4th ed: New York: John Wiley & Sons, Inc.,
18 Paper: A Simulation Based Experiment for Comparing AMHS Performance in a Semiconductor Fabrication Facility Table Captions TABLE 1: Design factors and allowable ranges TABLE 2: Experimental Results for the simulation of the distributed storage system TABLE 3: Experimental analysis of the average delivery time response for the simulation of the distributed storage system. TABLE 4: Experimental analysis of the robot utilization response for the simulation of the distributed storage system. TABLE 5: Experimental analysis of the vehicle moves per hour response for the simulation of the distributed storage system TABLE 6: Experimental results for the simulation of the central storage system. TABLE 7: Experimental analysis of the average delivery time response for the simulation of the central storage system. TABLE 8: Experimental analysis of the robot utilization response for the simulation of the central storage system. TABLE 9: Experimental Analysis of the vehicle moves per hour response for the simulation of the central storage system.
19 Table 1 FACTOR DESCRIPTION UNITS LOW HIGH A # of FOUPs per I/O Port Number 1 5 B Tool Processing time lot/hour C Vehicle Speed feet/minute D Stocker Cycle Time Seconds E # Tools in Bay number 10 30
20 Table 2 Experimental Trial Standard Order Run Order DISTRIBUTED STORAGE SYSTEM A B Factor C D E Tool Process Number of Foups per Vehicle Speed Stocker Cycle Time Number of Tools in Bay Robot Utilization Response Vehicle Moves per Hour Average Delivery Time I/O Port Time (#) (lots/hr) (ft/min) (sec) {#) (%) (moves/hr) (min)


21 Table 3

22 Table 4
23 Table 5
24 Table 6 Experimental Trial Standard Order Run Order SCHEME B: CENTRAL STORAGE Factor A B C D E Tool Process Number of Foups per Vehicle Speed Stocker Cycle Time Number of Tools in Bay Robot Utilization Response Vehicle Moves per Hour Average Delivery Time I/O Port Time (#) (lots/hr) (ft/min) (sec) {#) (%) (moves/hr) (min)

25 Table 7

26 Table 8
27 Table 9
28 Paper: A Simulation Based Experiment for Comparing AMHS Performance in a Semiconductor Fabrication Facility Figure Captions FIGURE 1: The layout of the distributed storage system (a) and the central storage system (b). The X on the track indicate the tool I/O and stocker I/O. FIGURE 2: Definitio of stocker robot cycles. FIGURE 3: Half normal probability plots for the distributed storage system for each of the three response variables. FIGURE 4: Half normal probability plots for the central storage system for each of the three response variables. FIGURE 5: Response surface of the average delivery time response for the distributed storage system. FIGURE 6: Main effect plot with regard to the robot utilization response for the distributed storage system. FIGURE 7: Response surface of the vehicle moves per hour response for the distributed storage system. FIGURE 8: Response surface of the average delivery time response for the central storage system. FIGURE 9: Response surface of the robot utilization response for the central storage system. FIGURE 10: Response Surface of the vehicle moves per hour response for the central storage system.
29 Figure 1 (a) (b)
30 Figure 2 Interbay track 4 1 Internal buffer Output IO 2 3 Input IO Intrabay track
31 Figure 3 Robot Utilization Tool Process Time Effect 1.0/Vehicle Moves per Hour Ln(Average Delivery Time) # of Tools in Bay Tool Process Time Vehicle Speed # of Tools in Bay Effect Effect
32 Figure 4 1.0/Sqrt(Robot Utilization) 99 Tool Process Time # of Tools in Bay 20 0 Stocker Cycle Time Effect Vehicle Moves per Hour Ln(Average Delivery Time) 99 Tool Process Time # of Tools in Bay # of Tools in Bay Vehicle Speed Effect Effect
33 Figure Average Delivery Time # of Tools in Bay Vehicle Speed
34 Figure 6 Effect Graph Predicted Robot Utilization B- B+ Tool Process Time
35 Figure Vehicle Moves per Hour # of Tools in Bay Tool Process Time
36 Figure Average Delivery Time # of Tools in Bay Vehicle Speed
37 Figure Robot Utilization # of Tools in Bay Tool Process Time
38 Figure Vehicle Moves per Hour # of Tools in Bay Tool Process Time
SIMULATION BASED COMPARISON OF SEMICONDUCTOR AMHS ALTERNATIVES: CONTINUOUS FLOW VS. OVERHEAD MONORAIL
 SAT Simulations- und Automations- Technologie GmbH Gesellschaft für IT-Consulting und Systemintegration Proceedings of the 2 Winter Simulation Conference J. A. Joines, R. R. Barton, K. Kang, and P. A.
Performance evaluation of an automated material handling system for a wafer fab
 Robotics and Computer-Integrated Manufacturing 20 (2004) 91 100 Performance evaluation of an automated material handling system for a wafer fab F.K. Wang a, *, J.T. Lin b a Department of Industrial Engineering
OPTIMIZATION OF AMHS DESIGN FOR A SEMICONDUCTOR FOUNDRY FAB BY USING SIMULATION MODELING. Jacky Tung Tina Sheen Merlin Kao C.H.
 Proceedings of the 2013 Winter Simulation Conference R. Pasupathy, S. H. Kim, A. Tolk, R. Hill, and M. E. Kuhl, eds OPTIMIZATION OF AMHS DESIGN FOR A SEMICONDUCTOR FOUNDRY FAB BY USING SIMULATION MODELING
The Preemptive Stocker Dispatching Rule of Automatic Material Handling System in 300 mm Semiconductor Manufacturing Factories
 Journal of Physics: Conference Series PAPER OPEN ACCESS The Preemptive Stocker Dispatching Rule of Automatic Material Handling System in 300 mm Semiconductor Manufacturing Factories To cite this article:
Proceedings of the 2016 Winter Simulation Conference T. M. K. Roeder, P. I. Frazier, R. Szechtman, E. Zhou, T. Huschka, and S. E. Chick, eds.
 Proceedings of the 2016 Winter Simulation Conference T. M. K. Roeder, P. I. Frazier, R. Szechtman, E. Zhou, T. Huschka, and S. E. Chick, eds. DECENTRALIZED DISPATCHING FOR BLOCKING AVOIDANCE IN AUTOMATED
Metrics for 300 mm Automated Material Handling Systems (AMHS) and Production Equipment Interfaces: Revision 1.0
 and Production Equipment Interfaces: Revision 1.0") Metrics for 300 mm Automated Material Handling Systems (AMHS) and Production Equipment Interfaces: Revision 1.0 SEMATECH and the SEMATECH logo are registered service marks of SEMATECH, Inc. and the logo
Metrics for 300 mm Automated Material Handling Systems (AMHS) and Production Equipment Interfaces: Revision 1.0 SEMATECH and the SEMATECH logo are registered service marks of SEMATECH, Inc. and the logo
Near-Balanced Incomplete Block Designs with An Application to Poster Competitions
 Near-Balanced Incomplete Block Designs with An Application to Poster Competitions arxiv:1806.00034v1 [stat.ap] 31 May 2018 Xiaoyue Niu and James L. Rosenberger Department of Statistics, The Pennsylvania
MATERIAL HANDLING IN FLEXIBLE MANUFACTURING SYSTEM Mr. Neeraj Nirmal 1, Mr. Neeraj Dahiya 2
 International Journal of Computer Science and Management Studies, Vol. 11, Issue 02, Aug 2011 40 MATERIAL HANDLING IN FLEXIBLE MANUFACTURING SYSTEM Mr. Neeraj Nirmal 1, Mr. Neeraj Dahiya 2 1 M.Tech. Scholar,
The Secrets to HCM Consistency Using Simulation Models
 The Secrets to HCM Consistency Using Simulation Models Ronald T. Milam, AICP David Stanek, PE Chris Breiland Fehr & Peers 2990 Lava Ridge Court, Suite 200 Roseville, CA 95661 r.milam@fehrandpeers.com (916)
CONGESTION-AWARE DYNAMIC ROUTING IN AUTOMATED MATERIAL HANDLING SYSTEMS
 CONGESTION-AWARE DYNAMIC ROUTING IN AUTOMATED MATERIAL HANDLING SYSTEMS A Thesis Presented to The Academic Faculty by Kelly K. Bartlett In Partial Fulfillment of the Requirements for the Degree Doctor
Alumina supply study for a smelter expansion
 Abstract Alumina supply study for a smelter expansion Laszlo Tikasz 1, Shawqi Al-Hashimi 2, Jacques Caissy 3, Robert I. McCulloch 4 1. Senior Specialist Modeling & Simulation 3. Senior Reduction Specialist
An Employee Thermal Comfort Model for Semiconductor Manufacturing
 An Employee Thermal Comfort Model for Semiconductor Manufacturing Author Information Robbie Walls Corporate Ergonomist Intel Corporation MS CH10-22 5000 W. Chandler Blvd. Chandler, AZ 85226 Phone: (480)
300 mm Integrated Vision for Semiconductor Factories
 Japan 300mm Semiconductor Technology Conference / EIAJ (J300E) 300 mm Integrated Vision for Semiconductor Factories I300I and J300E November 1999 Version 3.0 Table of Contents INDEX OF REVISIONS... 1
A TUTORIAL ON ERGONOMIC AND PROCESS MODELING USING QUEST AND IGRIP. Deidra L. Donald
 Proceedings of the 1998 Winter Simulation Conference D.J. Medeiros, E.F. Watson, J.S. Carson and M.S. Manivannan, eds. A TUTORIAL ON ERGONOMIC AND PROCESS MODELING USING QUEST AND IGRIP Deidra L. Donald
PRODUCT-MIX ANALYSIS WITH DISCRETE EVENT SIMULATION. Raid Al-Aomar. Classic Advanced Development Systems, Inc. Troy, MI 48083, U.S.A.
 Proceedings of the 2000 Winter Simulation Conference J. A. Joines, R. R. Barton, K. Kang, and P. A. Fishwick, eds. PRODUCT-MIX ANALYSIS WITH DISCRETE EVENT SIMULATION Raid Al-Aomar Classic Advanced Development
CHAPTER 1 INTRODUCTION
 1 CHAPTER 1 INTRODUCTION 1.1 MANUFACTURING SYSTEM Manufacturing, a branch of industry, is the application of tools and processes for the transformation of raw materials into finished products. The manufacturing
PLANNING AND CONTROL FOR A WARRANTY SERVICE FACILITY
 Proceedings of the 2 Winter Simulation Conference M. E. Kuhl, N. M. Steiger, F. B. Armstrong, and J. A. Joines, eds. PLANNING AND CONTROL FOR A WARRANTY SERVICE FACILITY Amir Messih Eaton Corporation Power
Design of Experiment. Jill Williams and Adam Krinke. Fuel Cell Project
 Design of Experiment Jill Williams and Adam Krinke Fuel Cell Project Spring 2005 Introduction The Proton Exchange Membrane (PEM) fuel cell requires a relatively stringent environment for operation. The
Backend Wafer Carrier Global Joint Guidance for 300 mm Semiconductor Factories
 Backend Wafer Carrier Global Joint Guidance for 300 mm Semiconductor Factories International SEMATECH Technology Transfer # 00023901A-ENG SEMATECH and the SEMATECH logo are registered service marks of
SIMULATION OF A FULL 300MM SEMICONDUCTOR MANUFACTURING PLANT WITH MATERIAL HANDLING CONSTRAINTS
 Proceedings of the 2009 Winter Simulation Conference M. D. Rossetti, R. R. Hill, B. Johansson, A. Dunkin, and R. G. Ingalls, eds. SIMULATION OF A FULL 300MM SEMICONDUCTOR MANUFACTURING PLANT WITH MATERIAL
Simulation-based Energy and Cycle Time Analysis of Shuttle-based Storage and Retrieval System
 Georgia Southern University Digital Commons@Georgia Southern 14th IMHRC Proceedings (Karlsruhe, Germany 2016) Progress in Material Handling Research 2016 Simulation-based Energy and Cycle Time Analysis
A Hit-Rate Based Dispatching Rule For Semiconductor Manufacturing
 International Journal of Industrial Engineering, 15(1), 73-82, 2008. A Hit-Rate Based Dispatching Rule For Semiconductor Manufacturing Muh-Cherng Wu and Ting-Uao Hung Department of Industrial Engineering
Design and Operational Analysis of Tandem AGV Systems
 Proceedings of the 2008 Industrial Engineering Research Conference J. Fowler and S. Mason. eds. Design and Operational Analysis of Tandem AGV Systems Sijie Liu, Tarek Y. ELMekkawy, Sherif A. Fahmy Department
Mileage savings from optimization of coordinated trucking 1
 Mileage savings from optimization of coordinated trucking 1 T.P. McDonald Associate Professor Biosystems Engineering Auburn University, Auburn, AL K. Haridass Former Graduate Research Assistant Industrial
Discrete Event Simulation: A comparative study using Empirical Modelling as a new approach.
 Discrete Event Simulation: A comparative study using Empirical Modelling as a new approach. 0301941 Abstract This study introduces Empirical Modelling as a new approach to create Discrete Event Simulations
AN EXPERIMENTAL ANALYSIS OF ADVERTISING STRATEGIES
 AN EXPERIMENTAL ANALYSIS OF ADVERTISING STRATEGIES AND ADVERTISING FUNCTIONS Kenneth Goosen Micro Business Publications, Inc. krgoosen@cei.net ABSTRACT This paper explores the relationship of different
Use and interpretation of statistical quality control charts
 International Journal for Quality in Health Care 1998; Volume 10, Number I: pp. 69-73 Methodology matters VIII 'Methodology Matters' is a series of intermittently appearing articles on methodology. Suggestions
Advanced Automation based on Standards
 Advanced Automation based on Standards How other industries can profit from automation concepts in semiconductor manufacturing 14 th AIS User Conference Dresden June 26 th, 2014 Dr. Martin Schellenberger
Oracle Real-Time Scheduler Benchmark
 An Oracle White Paper November 2012 Oracle Real-Time Scheduler Benchmark Demonstrates Superior Scalability for Large Service Organizations Introduction Large service organizations with greater than 5,000
CELLULAR BASED DISPATCH POLICIES FOR REAL-TIME VEHICLE ROUTING. February 22, Randolph Hall Boontariga Kaseemson
 CELLULAR BASED DISPATCH POLICIES FOR REAL-TIME VEHICLE ROUTING February 22, 2005 Randolph Hall Boontariga Kaseemson Department of Industrial and Systems Engineering University of Southern California Los
Optimizing Inplant Supply Chain in Steel Plants by Integrating Lean Manufacturing and Theory of Constrains through Dynamic Simulation
 Optimizing Inplant Supply Chain in Steel Plants by Integrating Lean Manufacturing and Theory of Constrains through Dynamic Simulation Atanu Mukherjee, President, Dastur Business and Technology Consulting,
REDUCING MANUFACTURING CYCLE TIME OF WAFER FAB WITH SIMULATION
 Computer Integrated Manufacturing. J. Winsor, AI Sivakumar and R Gay, eds. World Scientific, (July 1995), pp 889-896. REDUCING MANUFACTURING CYCLE TIME OF WAFER FAB WITH SIMULATION Giam Kim Toh, Ui Wei
Modeling Truck Traffic Volume Growth Congestion
 Modeling Truck Traffic Volume Growth Congestion By Mr. Gregory Harris, P. E. (Principal Investigator) Office of Freight, Logistics and Transportation The University of Alabama in Huntsville Huntsville,
Ten Requirements for Effective Process Control
 Published in ASQ Quality Progress and won the Paper of the Year Award in 2002. Ten Requirements for Effective Process Control Thomas A. Little Ph.D. Thomas A. Little Consulting 12401 N Wildflower Lane
A SIMULATION BASED APPROACH FOR DOCK ALLOCATION IN A FOOD DISTRIBUTION CENTER
 Proceedings of the 2008 Winter Simulation Conference S. J. Mason, R. R. Hill, L. Mönch, O. Rose, T. Jefferson, J. W. Fowler eds. A SIMULATION BASED APPROACH FOR DOCK ALLOCATION IN A FOOD DISTRIBUTION CENTER
Bottleneck Detection of Manufacturing Systems Using Data Driven Method
 Proceedings of the 2007 IEEE International Symposium on Assembly and Manufacturing Ann Arbor, Michigan, USA, July 22-25, 2007 MoB2.1 Bottleneck Detection of Manufacturing Systems Using Data Driven Method
As government agencies and businesses become
 RESEARCH FEATURE A Formal Process for Evaluating COTS Software s A software product evaluation process grounded in mathematics and decision theory can effectively determine product quality and suitability
Numerical investigation of tradeoffs in production-inventory control policies with advance demand information
 Numerical investigation of tradeoffs in production-inventory control policies with advance demand information George Liberopoulos and telios oukoumialos University of Thessaly, Department of Mechanical
Proceedings of the 2016 Winter Simulation Conference T. M. K. Roeder, P. I. Frazier, R. Szechtman, E. Zhou, T. Huschka, and S. E. Chick, eds.
 Proceedings of the 2016 Winter Simulation Conference T. M. K. Roeder, P. I. Frazier, R. Szechtman, E. Zhou, T. Huschka, and S. E. Chick, eds. AUTOMATED TRANSPORTATION OF AUXILIARY RESOURCES IN A SEMICONDUCTOR
Justifying Simulation. Why use simulation? Accurate Depiction of Reality. Insightful system evaluations
 Why use simulation? Accurate Depiction of Reality Anyone can perform a simple analysis manually. However, as the complexity of the analysis increases, so does the need to employ computer-based tools. While
Simulation Design Approach for the Selection of Alternative Commercial Passenger Aircraft Seating Configurations
 Available online at http://docs.lib.purdue.edu/jate Journal of Aviation Technology and Engineering 2:1 (2012) 100 104 DOI: 10.5703/1288284314861 Simulation Design Approach for the Selection of Alternative
Designing Full Potential Transportation Networks
 Designing Full Potential Transportation Networks What Got You Here, Won t Get You There Many supply chains are the product of history, developed over time as a company grows with expanding product lines
UNIT III GROUP TECHNOLOGY AND FMS
 UNIT III GROUP TECHNOLOGY AND FMS GROUP TECHNOLOGY Group technology is a manufacturing technique and philosophy to increase production efficiency by exploiting the underlying sameness of component shape,
CASE STUDY: SIMULATION OF THE CALL CENTER ENVIRONMENT FOR COMPARING COMPETING CALL ROUTING TECHNOLOGIES FOR BUSINESS CASE ROI PROJECTION
 Proceedings of the 1999 Winter Simulation Conference P. A. Farrington, H. B. Nembhard, D. T. Sturrock, and G. W. Evans, eds. CASE STUDY: SIMULATION OF THE CALL CENTER ENVIRONMENT FOR COMPARING COMPETING
COMPARISON OF BOTTLENECK DETECTION METHODS FOR AGV SYSTEMS. Christoph Roser Masaru Nakano Minoru Tanaka
 Roser, Christoph, Masaru Nakano, and Minoru Tanaka. Comparison of Bottleneck Detection Methods for AGV Systems. In Winter Simulation Conference, edited by S. Chick, Paul J Sanchez, David Ferrin, and Douglas
Proceedings of the 2012 Winter Simulation Conference C. Laroque, J. Himmelspach, R. Pasupathy, O. Rose, and A.M. Uhrmacher, eds
 Proceedings of the 0 Winter Simulation Conference C. Laroque, J. Himmelspach, R. Pasupathy, O. Rose, and A.M. Uhrmacher, eds OPTIMAL BATCH PROCESS ADMISSION CONTROL IN TANDEM QUEUEING SYSTEMS WITH QUEUE
A SORTATION SYSTEM MODEL. Arun Jayaraman Ramu Narayanaswamy Ali K. Gunal
 A SORTATION SYSTEM MODEL Arun Jayaraman Ramu Narayanaswamy Ali K. Gunal Production Modeling Corporation 3 Parklane Boulevard, Suite 910 West Dearborn, Michigan 48126, U.S.A. ABSTRACT Automotive manufacturing
UPDATE OF THE SIGNAL TIMING MANUAL
 Project No. 3-103 COPY NO. X UPDATE OF THE SIGNAL TIMING MANUAL PRELIMINARY DRAFT FINAL REPORT Prepared for National Cooperative Highway Research Program Transportation Research Board of The National Academies
Determining the Maximum Allowable Headway
 36 Determining the Maximum Allowable Headway The purpose of this activity is to give you the opportunity to determine the maximum allowable headway (MAH) for your intersection. Select an MAH VISSIM input
Oracle Utilities Mobile Workforce Management Benchmark
 Oracle Utilities Mobile Workforce Management Benchmark Demonstrates Superior Scalability for Large Field Service Organizations O R A C L E W H I T E P A P E R F E B R U A R Y 2 0 1 6 Introduction Large
Simulation based Performance Analysis of an End-of-Aisle Automated Storage and Retrieval System
 Simulation based Performance Analysis of an End-of-Aisle Automated Storage and Retrieval System Behnam Bahrami, El-Houssaine Aghezzaf and Veronique Limère Department of Industrial Management, Ghent University,
CENTER FOR NEXT GENERATION LOGISTICS Intelligent, Adaptive, Automated. Center Overview
 Center Overview 26 April 2015! 1 of 9! EXECUTIVE SUMMARY Competitive pressures to improve the performance of global supply chains with respect to various key metrics continue unabated. The volume, velocity,
The Use of Simulation for Bulk Cargo Terminal Planning and Design
 The Use of Simulation for Bulk Cargo Terminal Planning and Design What is Simulation Simulation is the imitation of real system Based on knowledge and assumptions of system To obtain insights in the behavior
A+ ACADEMY HIGH SCHOOL
 TRAFFIC MANAGEMENT PLAN FOR A+ ACADEMY HIGH SCHOOL IN DALLAS, TEXAS Prepared for: A+ Charter Schools, Inc. 8225 Bruton Road Dallas, Texas 75217 Prepared by: Texas Registered Engineering Firm F-3199 400
AUTOMATED WAREHOUSE DESIGN USING VISUAL INTERACTIVE SIMULATION
 AUTOMATED WAREHOUSE DESIGN USING VISUAL INTERACTIVE SIMULATION António C. Brito José A. Basto Universidade do Porto, Faculdade de Engenharia, Departamento de Engenharia Mecânica e Gestão Industrial Rua
Labor Management Software
 Labor Management Software GoalPost Labor Management Software Software Intelligence That Delivers GoalPost Labor Management Software (LMS) from Honeywell Intelligrated provides on-demand intelligence to
AUTOSCHED TUTORIAL. Bill Lindler. AutoSimulations 655 E. Medical Drive Bountiful, Utah 84010, U.S.A.
 AUTOSCHED TUTORIAL Bill Lindler AutoSimulations 655 E. Medical Drive Bountiful, Utah 84010, U.S.A. ABSTRACT The AutoSched TM finite capacity planning and scheduling tool helps you increase throughput,
PULL REPLENISHMENT PERFORMANCE AS A FUNCTION OF DEMAND RATES AND SETUP TIMES UNDER OPTIMAL SETTINGS. Silvanus T. Enns
 Proceedings of the 2007 Winter Simulation Conference S. G. Henderson, B. Biller, M.-H. Hsieh, J. Shortle, J. D. Tew, and R. R. Barton, eds. PULL REPLENISHMENT PERFORMANCE AS A FUNCTION OF DEMAND RATES
IoT Analytics. in Manufacturing: equipment condition. plant utilization. supplier performance. physical environment
 IoT in Manufacturing: HOW TO GET VALUE QUICKLY FROM YOUR Io T PROJECTS equipment condition plant utilization supplier performance physical environment www.vitria.com TABLE OF CONTENTS I. INTRODUCTION LEADING
Utilization vs. Throughput: Bottleneck Detection in AGV Systems
 Utilization vs. Throughput: Bottleneck Detection in AGV Systems Christoph Roser Masaru Nakano Minoru Tanaka Toyota Central Research and Development Laboratories Nagakute, Aichi 480-1192, JAPAN ABSTRACT
LINKS Tutorial #4: Forecasting. Katrina A. Zalatan & Randall G. Chapman
 LINKS Tutorial #4: Forecasting Katrina A. Zalatan & Randall G. Chapman LINKS firms are evaluated on financial, operating, and customer-related results. Planning is the process you go through to make decisions
AUTOMATING HEALTHCARE CLAIM PROCESSING
 PROFILES AUTOMATING HEALTHCARE CLAIM PROCESSING How Splunk Software Helps to Manage and Control Both Processes and Costs Use Cases Troubleshooting Services Delivery Streamlining Internal Processes Page
The use of the Animate Transfer toolbar and various transportation-related modules will be illustrated in three examples in the sequel.
 316 Modeling Transportation Systems button of the Animate toolbar. A graphical Storage T-bar graphically depicts the entities in a storage facility. The Seize button allows the modeler to define a so-called
An Application of Causal Analysis to the Software Modification Process
 SOFTWARE PRACTICE AND EXPERIENCE, VOL. 23(10), 1095 1105 (OCTOBER 1993) An Application of Causal Analysis to the Software Modification Process james s. collofello Computer Science Department, Arizona State
Smart Distribution Applications and Technologies - Program 124
 Smart Distribution Applications and Technologies - Program 124 Program Description Program Overview New technologies will be critical to future smart grid operation. These technologies will include advanced
Unified Employee Desktop. Best Practice Guide
 Unified Employee Desktop Best Practice Guide Table of Contents Introduction... 3 1. Decide Where to Start... 4 2. Design Your Process... 4 3. Deploy Your Integration Strategy... 5 4. Use Contextual Knowledge
TRANSPORTATION MANHATTAN ACTIVE. A Comprehensive Solution for Complex Logistics Networks. With Manhattan Active Transportation you can:
 MANHATTAN ACTIVE TRANSPORTATION A Comprehensive Solution for Complex Logistics Networks LOGISTICS COMPLEXITIES AND SERVICE-LEVEL EXPECTATIONS have increased dramatically in today s world. Supply chains
PICK PATH OPTIMIZATION. An enhanced algorithmic approach
 PICK PATH OPTIMIZATION An enhanced algorithmic approach Abstract Simulated annealing, enhanced with certain heuristic modifications, provides an optimized algorithm for picking parts from a warehouse or
Overview of Statistics used in QbD Throughout the Product Lifecycle
 Overview of Statistics used in QbD Throughout the Product Lifecycle August 2014 The Windshire Group, LLC Comprehensive CMC Consulting Presentation format and purpose Method name What it is used for and/or
Effect of laser-welding parameters on the heat input and weld-bead profile
 Effect of laser-welding parameters on the heat input and weld-bead profile K. Y. Benyounis *, A. G. Olabi and M. S. J. Hashmi School of Mechanical and Manufacturing Engineering. Dublin City University,
Analyzing Controllable Factors Influencing Cycle Time Distribution in. Semiconductor Industries. Tanushree Salvi
 Analyzing Controllable Factors Influencing Cycle Time Distribution in Semiconductor Industries by Tanushree Salvi A Thesis Presented in Partial Fulfillment of the Requirements for the Degree Master of
Maricopa Advanced Technology Education Center
 Skill Standards for Technicians in the Highly Automated Manufacturing Environment Maricopa Advanced Technology Education Center Sponsors and Contributing Organizations The development of Skill Standards
REQUIREMENTS FOR THE CALIBRATION OF TRAFFIC SIMULATION MODELS
 REQUIREMENTS FOR THE CALIBRATION OF TRAFFIC SIMULATION MODELS Bruce R. Hellinga Department of Civil Engineering University of Waterloo Waterloo, ON N2L 3G1 ABSTRACT The recent emphasis on utilising advanced
WorkloadWisdom Storage performance analytics for comprehensive workload insight
 DATASHEET Storage performance analytics for comprehensive workload insight software is the industry s only automated workload acquisition, workload analysis, workload modeling, and workload performance
Technical Note OPTIMIZATION OF THE PARAMETERS OF FEEDWATER CONTROL SYSTEM FOR OPR1000 NUCLEAR POWER PLANTS
 Technical Note OPTIMIZATION OF THE PARAMETERS OF FEEDWATER CONTROL SYSTEM FOR OPR1000 NUCLEAR POWER PLANTS UNG SOO KIM *, IN HO SONG, JONG JOO SOHN and EUN KEE KIM Safety Analysis Department, KEPCO Engineering
OPERATING SYSTEMS. Systems and Models. CS 3502 Spring Chapter 03
 OPERATING SYSTEMS CS 3502 Spring 2018 Systems and Models Chapter 03 Systems and Models A system is the part of the real world under study. It is composed of a set of entities interacting among themselves
A CIOview White Paper by Scott McCready
 A CIOview White Paper by Scott McCready 1 Table of Contents How to Craft an Effective ROI Analysis... 3 ROI Analysis is Here to Stay... 3 When is an ROI Analysis Not Necessary?... 3 It s More About the
E-Business Advanced Procurement Update and Roadmap. David Hope-Ross, Senior Director Procurement & SCM
 E-Business Advanced Procurement Update and Roadmap David Hope-Ross, Senior Director Procurement & SCM Safe Harbor Statement The following is intended to outline our general product direction. It is intended
Container Transfer Logistics at Multimodal Container Terminals
 Container Transfer Logistics at Multimodal Container Terminals Erhan Kozan School of Mathematical Sciences, Queensland University of Technology Brisbane Qld 4001 Australia e.kozan@qut.edu.au Abstract:
RELATIONSHIP BETWEEN TRAFFIC FLOW AND SAFETY OF FREEWAYS IN CHINA: A CASE STUDY OF JINGJINTANG FREEWAY
 RELATIONSHIP BETWEEN TRAFFIC FLOW AND SAFETY OF FREEWAYS IN CHINA: A CASE STUDY OF JINGJINTANG FREEWAY Liande ZHONG, PhD Associate professor, Certified Safety Engineer, Research Institute of Highway, Ministry
ViziRail Description
 ViziRail Description Table of Contents ViziRail Train Scheduling Software... 3 Timetabling and Trains... 4 Train Graphing... 9 Possessions... 14 Speed Restrictions... 16 Train Notices... 17 Train Control
Brewster Transfer Station Traffic Flow Alternatives
 Brewster Transfer Station Traffic Flow Alternatives September 28, 2012 Brewster Transfer Station Traffic Flow Alternatives The Town of Brewster Department of Public Works (DPW) Department contacted Cape
Network and Route Performance Management
 Solution in Detail Passenger Travel and Leisure Executive Summary Solution Overview Contact Us Network and Route Performance Running a Profitable Travel and Leisure Business Running Profitably Controlling
Integrated Capacity Analysis Working Group - Long Term Refinement Topics Scoping Document
 Integrated Capacity Analysis Working Group - Long Term Refinement Topics Scoping Document Prepared for the ICA Working Group by More Than Smart Background: A June 7, 2017 Assigned Commissioner Ruling (ACR)
The Evolving Role of Automation in Intel Microprocessor Development and Manufacturing
 The Evolving Role of Automation in Intel Microprocessor Development and Manufacturing Kumud M. Srinivasan, Logic Technology Development, Intel Corporation Index words: automation, 300mm, D1C, information
OPTIMAL ALLOCATION OF WORK IN A TWO-STEP PRODUCTION PROCESS USING CIRCULATING PALLETS. Arne Thesen
 Arne Thesen: Optimal allocation of work... /3/98 :5 PM Page OPTIMAL ALLOCATION OF WORK IN A TWO-STEP PRODUCTION PROCESS USING CIRCULATING PALLETS. Arne Thesen Department of Industrial Engineering, University
Travel Time Analysis of an Open-Rack Miniload AS/RS under Class-Based Storage Assignments
 IACSIT International Journal of Engineering and Technology, Vol. 8, No. 1, February 2016 Travel Time Analysis of an Open-Rack Miniload AS/RS under Class-Based Storage Assignments Mohammadreza Vasili and
Simulation of an Order Picking System in a Pharmaceutical Warehouse
 Simulation of an Order Picking System in a Pharmaceutical Warehouse João Pedro Jorge 1,5, Zafeiris Kokkinogenis 2,4,5, Rosaldo J. F. Rossetti 2,3,5, Manuel A. P. Marques 1,5 1 Department of Industrial
Best Practices for Measuring the Customer Experience and Success of the Labor Model
 WHITE PAPER Best Practices for Measuring the Customer Experience and Success of the Labor Model Part 3 of a 3-Part Series: Measuring the Success of a Retail Labor Model Stephen Strohecker, Kronos Retail
Addressing UNIX and NT server performance
 IBM Global Services Addressing UNIX and NT server performance Key Topics Evaluating server performance Determining responsibilities and skills Resolving existing performance problems Assessing data for
QUESTION 2 What conclusion is most correct about the Experimental Design shown here with the response in the far right column?
 QUESTION 1 When a Belt Poka-Yoke's a defect out of the process entirely then she should track the activity with a robust SPC system on the characteristic of interest in the defect as an early warning system.
Oracle Production Scheduling. Maximize shop floor throughput and optimize resource utilization
 Oracle Production Scheduling Maximize shop floor throughput and optimize resource utilization Typical Scheduling Challenges How can you: Sequence orders to best use your production resources? Offload production
CASE STUDY 1 Heathrow Airport Limited & Border Force
 CASE STUDY 1 Heathrow Airport Limited & Border Force Page 1 Table of Contents EXECUTIVE SUMMARY... 3 1 CUSTOMER NAME... 4 2 BUSINESS CASE BUSINESS DRIVERS... 4 3 CHALLENGE... 4 4 SOLUTION DESCRIPTION...
MANUFACTURING PROCESS MANAGEMENT USING A FLEXIBLE MODELING AND SIMULATION APPROACH. Duilio Curcio Francesco Longo Giovanni Mirabelli
 Proceedings of the 2007 Winter Simulation Conference S. G. Henderson, B. Biller, M.-H. Hsieh, J. Shortle, J. D. Tew, and R. R. Barton, eds. MANUFACTURING PROCESS MANAGEMENT USING A FLEXIBLE MODELING AND
Enterprise Performance Management Bridging the Gap from Strategy to Operations
 Enterprise Performance Management Bridging the Gap from Strategy to Operations A White Paper by Guident Technologies, Inc. Adam Getz Business Intelligence Architect May, 2007 2007 Guident 1 Summary In
data sheet ORACLE ENTERPRISE PLANNING AND BUDGETING 11i
 data sheet ORACLE ENTERPRISE PLANNING AND BUDGETING 11i Oracle Enterprise Planning and Budgeting provides finance and business managers with the right information and self-service tools to help them understand
The Challenges of Container Terminal Development. Ashebir Jacob, PE September 10, 2013
 The Challenges of Container Terminal Development Ashebir Jacob, PE September 10, 2013 State of Containerization Since its inception, the container shipping industry has done their best to increase the
FULLY AUTONOMOUS VEHICLES: ANALYZING TRANSPORTATION NETWORK PERFORMANCE AND OPERATING SCENARIOS IN THE GREATER TORONTO AREA, CANADA
 FULLY AUTONOMOUS VEHICLES: ANALYZING TRANSPORTATION NETWORK PERFORMANCE AND OPERATING SCENARIOS IN THE GREATER TORONTO AREA, CANADA Bradley, University of Toronto Proceedings of the 52nd Annual Conference
Simulation-based Smart Operation Management System for Semiconductor Manufacturing
 Simulation-based Smart Operation Management System for Semiconductor Manufacturing Byoung K. Choi 1*, and Byung H. Kim 2 1 Dept of Industrial & Systems Engineering, KAIST, Yuseong-gu, Daejeon, Republic
CROSS-DOCKING: SCHEDULING OF INCOMING AND OUTGOING SEMI TRAILERS
 CROSS-DOCKING: SCHEDULING OF INCOMING AND OUTGOING SEMI TRAILERS 1 th International Conference on Production Research P.Baptiste, M.Y.Maknoon Département de mathématiques et génie industriel, Ecole polytechnique