MEPS Preparatory and Orientation Weeks. Lectures by Kristin Bernhardt. Master of Science in Economic Policy. March 2012
|
|
|
- Hector Fox
- 6 years ago
- Views:
Transcription

1 MEPS Preparatory and Orientation Weeks Master of Science in Economic Policy March 2012 Lectures by Kristin Bernhardt
2 Fundamentals of Microeconomics 1. Introduction 2. Markets 3. Consumers and Households 4. Enterprises 5. The Public Sector
3
4 What s ECONOMICS?? Economy: one who manages a household (Greece) Economics: How does a society manage its scarce resources
5 Ten Principles of Economics 1. People face tradeoffs Efficiency & Equity 2. The cost of something is what you give up to get it Opportunity Cost 3. Rational people think at the margin Marginal changes 4. People respond to incentives 5. Trade can make everyone better off
6 Ten Principles of Economics 6. Markets are usually a good way to organize economic activity Market Economy 7. Governments can sometimes improve market outcomes Market Failure 8. The standard of living depends on a country s production Productivity 9. Prices rise when the government prints too much money 10. Society faces a short-run tradeoff between inflation and unemployment

7 Figure 1 The Circular Flow Revenue Goods and services sold MARKETS FOR GOODS AND SERVICES Firms sell Households buy Spending Goods and services bought FIRMS Produce and sell goods and services Hire and use factors of production HOUSEHOLDS Buy and consume goods and services Own and sell factors of production Factors of production Wages, rent, and profit MARKETS FOR FACTORS OF PRODUCTION Households sell Firms buy Labor, land, and capital Income = Flow of inputs and outputs = Flow of dollars Copyright 2004 South-Western
8 The Principle of Comparative Advantage There are two ways to measure differences in costs of production: 1. The comparison among producers of a good according to their productivity. Absolute Advantage 2. The opportunity cost of sacrificing one good for another. Comparative Advantage
9 The Principle of Comparative Advantage A needs only 10 minutes to produce an ounce of potatoes, whereas B needs 15 minutes. A needs only 20 minutes to produce an ounce of meat, whereas B needs 60 minutes. A has an absolute advantage in the production of both meat and potatoes. Who has the comparative advantage??
10 The Principle of Comparative Advantage 1 oz of Meat 1 oz of Potatoes A 4 oz Potatoes ¼ oz Meat B 2 oz Potatoes ½ Meat Individual A has a comparative advantage in the production of meat, but individual B has a comparative advantage in the production of potatoes.

11 2.1 Supply-Demand 2.2 Efficiency of Markets 2.3 Elasticity 2.4 Taxation 2.5 World Price and Comparative Advantage
12 Markets Modern microeconomics is about supply, demand, and market equilibrium. A competitive market is a market in which there are many buyers and sellers so that each has a negligible impact on the market price. Perfect Competition Products are the same Numerous buyers and sellers so that each has no influence over price Buyers and sellers are price takers
13 Market Forms Monopoly One seller, and seller controls price Oligopoly Few sellers Not always aggressive competition Monopolistic Competition Many sellers Slightly differentiated products Each seller may set price for its own product
14 MARKET EFFICIENCY Three Insights Concerning Market Outcomes Free markets allocate the supply of goods to the buyers who value them most highly, as measured by their willingness to pay. Free markets allocate the demand for goods to the sellers who can produce them at least cost. Free markets produce the quantity of goods that maximizes the sum of consumer and producer surplus. Because the equilibrium outcome is an efficient allocation of resources, the social planner can leave the market outcome as he/she finds it. -> laissez faire
15 Market Power If a market system is not perfectly competitive, market power may result. Market power is the ability to influence prices. Market power can cause markets to be inefficient because it keeps price and quantity from the equilibrium of supply and demand.
16 2.1 Supply-Demand-Diagram Economists use the model of supply and demand to analyze competitive markets. Excess Supply 8 6 Price of Bread Surplus Supply Equilibrium Price Excess Demand 4 2 Shortage Demand 0 Equilibrium Quantity Quantity of Bread
17 Demand The demand curve shows how the quantity of a good depends upon the price. According to the law of demand, as the price of a good falls, the quantity demanded rises. Therefore, the demand curve slopes downward. In addition to price, other determinants of how much consumers want to buy include income, the prices of complements and substitutes, tastes, expectations, and the number of buyers. If one of these factors changes, the demand curve shifts.
18 Supply The supply curve shows how the quantity of a good supplied depends upon the price. According to the law of supply, as the price of a good rises, the quantity supplied rises. Therefore, the supply curve slopes upward. In addition to price, other determinants of how much producers want to sell include input prices, technology, expectations, and the number of sellers. If one of these factors changes, the supply curve shifts.
19 Supply and Demand To analyze how any event influences a market, we use the supply-and-demand diagram to examine how the even affects the equilibrium price and quantity. In market economies, prices are the signals that guide economic decisions and thereby allocate resources.
20 2.2 Efficiency of Markets Market equilibrium reflects the way markets allocate scarce resources. Whether the market allocation is desirable can be addressed by welfare economics. Welfare economics is the study of how the allocation of resources affects economic wellbeing. Buyers and sellers receive benefits from taking part in the market. The equilibrium in a market maximizes the total welfare of buyers and sellers.
21 Surplus Consumer surplus is the buyer s willingness to pay for a good minus the amount the buyer actually pays for it. Consumer surplus measures economic welfare from the buyer s side. Producer surplus is the amount a seller is paid for a good minus the seller s cost. It measures the benefit to sellers participating in a market. Producer surplus measures economic welfare from the seller s side.
22 Figure 1 Consumer and Producer Surplus in the Market Equilibrium Price A D Supply Equilibrium price Consumer surplus Producer surplus E B Demand C 0 Equilibrium Quantity quantity Copyright 2003 Southwestern/Thomson Learning
23 2.3 Elasticity allows us to analyze supply and demand with greater precision. is a measure of how much buyers and sellers respond to changes in market conditions.
24 The Price Elasticity of Demand Price elasticity of demand is a measure of how much the quantity demanded of a good responds to a change in the price of that good., =, <0= Giffen- good, >0= normal good Price elasticity of demand = Percentage change in quantity demanded Percentage change in price
25 The Price Elasticity of Demand Inelastic Demand Quantity demanded does not respond strongly to price changes. Price elasticity of demand is less than one. Elastic Demand Quantity demanded responds strongly to changes in price. Price elasticity of demand is greater than one.
26 The Price Elasticity of Demand a d b c e (a) Perfectly Inelastic Demand: Elasticity Equals 0 (b) Inelastic Demand: Elasticity Is Less Than 1 (c) Unit Elastic Demand: Elasticity Equals 1 (d) Elastic Demand: Elasticity Is Greater Than 1 (e) Perfectly Elastic Demand: Elasticity Equals Infinity
27 Total revenue and the Price Elasticity of Demand Total revenue is the amount paid by buyers and received by sellers of a good. With an inelastic demand curve, an increase in price leads to a decrease in quantity that is proportionately smaller. Thus, total revenue increases. With an elastic demand curve, an increase in the price leads to a decrease in quantity demanded that is proportionately larger. Thus, total revenue decreases.
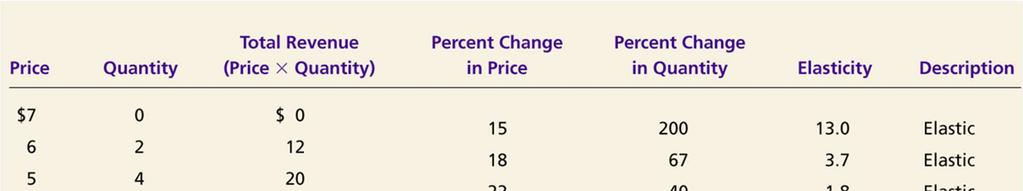
28 Elasticity of a Linear Demand Curve
29 The Income Elasticity of Demand Income elasticity of demand measures how much the quantity demanded of a good responds to a change in consumers income., =, <0= inferior good, >0= superior good Income elasticity of demand = Percentage change in quantity demanded Percentage change in income
30 Cross-Price-Elasticity of Demand, =, >0= substitutive goods, <0= complementary goods
31 The Price Elasticity of Supply Price elasticity of supply is a measure of how much the quantity supplied of a good responds to a change in the price of that good. Price elasticity of supply = Percentage change in quantity supplied Percentage change in price
32 The Price Elasticity of Supply a b c d e (a) Perfectly Inelastic Supply: Elasticity Equals 0 (b) Inelastic Supply: Elasticity Is Less Than 1 (c) Unit Elastic Supply: Elasticity Equals 1 (d) Elastic Supply: Elasticity Is Greater Than 1 (e) Perfectly Elastic Supply: Elasticity Equals Infinity
33 2.4 Taxation Tax incidence is the study of who bears the burden of a tax. Taxes result in a change in the market equilibrium. Buyers pay more and sellers receive less, regardless of whom the tax is levied on.
34 Figure 2 Tax on Buyers Price of Ice-Cream Price Cone buyers pay $3.30 Price without tax Price sellers receive Tax ($0.50) Equilibrium with tax Supply, S 1 Equilibrium without tax A tax on buyers shifts the demand curve downward by the size of the tax ($0.50). D 1 D Quantity of Ice-Cream Cones Copyright 2003 Southwestern/Thomson Learning
35 Figure 3 Tax on Sellers Price of Ice-Cream Price Cone buyers pay $3.30 Price without tax Price sellers receive Equilibrium with tax Tax ($0.50) S 2 S 1 A tax on sellers shifts the supply curve upward by the amount of the tax ($0.50). Equilibrium without tax Demand, D Quantity of Ice-Cream Cones Copyright 2003 Southwestern/Thomson Learning
36 Figure 4 Payroll Tax Wage Labor supply Wage firms pay Wage without tax Tax wedge Wage workers receive Labor demand 0 Quantity of Labor Copyright 2003 Southwestern/Thomson Learn
37 Elasticity and Tax Incidence In what proportions is the burden of the tax divided? How do the effects of taxes on sellers compare to those levied on buyers? The answers to these questions depend on the elasticity of demand and the elasticity of supply.
38 Figure 5 How the Burden of a Tax Is Divided (a) Elastic Supply, Inelastic Demand Price Price buyers pay 1. When supply is more elastic than demand... Supply Price without tax Price sellers receive Tax the incidence of the tax falls more heavily on consumers than on producers. Demand 0 Quantity Copyright 2003 Southwestern/Thomson Learn
39 Figure 6 How the Burden of a Tax Is Divided (b) Inelastic Supply, Elastic Demand Price Price buyers pay Price without tax Tax 1. When demand is more elastic than supply... Supply than on consumers. Price sellers receive the incidence of the tax falls more heavily on producers... Demand 0 Quantity Copyright 2003 Southwestern/Thomson Learn
40 Elasticity and Tax Incidence The incidence of a tax refers to who bears the burden of a tax. The incidence of a tax does not depend on whether the tax is levied on buyers or sellers. The incidence of the tax depends on the price elasticities of supply and demand. The burden tends to fall on the side of the market that is less elastic.
41 The Deadweight Loss of Taxation A tax places a wedge between the price buyers pay and the price sellers receive. Tax Revenue T = the size of the tax Q = the quantity of the good sold T Q= the government s tax revenue
42 Figure 7 Tax Revenue Price Supply Price buyers pay Price sellers receive Tax revenue (T Q) Size of tax (T) Quantity sold (Q) Demand 0 Quantity with tax Quantity without tax Quantity Copyright 2004 South-Western
43 Figure 8 How a Tax Effects Welfare Price Price buyers pay Price without tax Price sellers receive = PB = P1 = PS A B D F C E Supply Demand 0 Q2 Q1 Quantity Copyright 2004 South-Western

44 How a Tax affects Welfare The losses to buyers and sellers exceed the revenue raised by the government. This fall in total surplus is called the deadweight loss.
45 DETERMINANTS OF THE DEADWEIGHT LOSS The magnitude of the deadweight loss depends on how much the quantity supplied and quantity demanded respond to changes in the price. That, in turn, depends on the price elasticity of supply and demand. The greater the elasticities of demand and supply: the larger will be the decline in equilibrium quantity and, the greater the deadweight loss of a tax.
46 Figure 9 Tax Distortions and Elasticities Price (a) Inelastic Supply Supply Size of tax When supply is relatively inelastic, the deadweight loss of a tax is small. Demand 0 Quantity Copyright 2004 South-Western
47 Figure 10 Tax Distortions and Elasticities Price (b) Elastic Supply When supply is relatively elastic, the deadweight loss of a tax is large. Size of tax Supply Demand 0 Quantity Copyright 2004 South-Western
48 Figure 11 Tax Distortions and Elasticities Price (c) Inelastic Demand Supply Size of tax When demand is relatively inelastic, the deadweight loss of a tax is small. Demand 0 Quantity Copyright 2004 South-Western
49 Figure 12 Tax Distortions and Elasticities Price (d) Elastic Demand Supply Size of tax Demand When demand is relatively elastic, the deadweight loss of a tax is large. 0 Quantity Copyright 2004 South-Western
50 DEADWEIGHT LOSS AND TAX REVENUE AS TAXES VARY Some economists argue that labor taxes are highly distorting and believe that labor supply is more elastic. Some examples of workers who may respond more to incentives: Workers who can adjust the number of hours they work Families with second earners Elderly who can choose when to retire Workers in the underground economy (i.e., those engaging in illegal activity)
51 Figure 13 Deadweight Loss and Tax Revenue from Three Taxes of Different Sizes Price (a) Small Tax Deadweight loss Supply P B Tax revenue P S Demand 0 Q 2 Q 1 Quantity Copyright 2004 South-Western
52 Figure 14 Deadweight Loss and Tax Revenue from Three Taxes of Different Sizes Price (b) Medium Tax P B Deadweight loss Supply Tax revenue P S Demand 0 Q 2 Q 1 Quantity Copyright 2004 South-Western
53 Figure 15 Deadweight Loss and Tax Revenue from Three Taxes of Different Sizes Price P B (c) Large Tax Tax revenue Deadweight loss Supply Demand P S 0 Q 2 Q 1 Quantity Copyright 2004 South-Western
54 Figure 16 How Deadweight Loss and Tax Revenue Vary with the Size of a Tax Tax Revenue (b) Revenue (the Laffer curve) 0 Tax Size Copyright 2004 South-Western

55 3.1 The Theory of Consumer Choice 3.2 Income and Substitution Effects 3.3 The Optimal Labor Supply
56 3.1 The Theory of Consumer Choice The theory of consumer choice addresses the following questions: Do all demand curves slope downward? How do wages affect labor supply? How do interest rates affect household saving?
57 The Budget Constraint The budget constraint depicts the limit on the consumption bundles that a consumer can afford. People consume less than they desire because their spending is constrained, or limited, by their income. The budget constraint shows the various combinations of goods the consumer can afford given his or her income and the prices of the two goods. Any point on the budget constraint line indicates the consumer s combination or tradeoff between two goods.
58 Figure 1 The Consumer s Budget Constraint Quantity of Pepsi 500 B 250 C Consumer s budget constraint A Quantity of Pizza Copyright 2004 South-Western
59 The Budget Constraint: What consumers can afford The slope of the budget constraint line equals the relative price of the two goods, that is, the price of one good compared to the price of the other. It measures the rate at which the consumer can trade one good for the other.
60 Indifference Curves An indifference curve is a curve that shows consumption bundles that give the consumer the same level of satisfaction. Four properties of indifferent curves: Higher indifference curves are preferred to lower ones. Indifference curves are downward sloping. Indifference curves do not cross. Indifference curves are bowed inward.
61 Representing Preferences with Indifferent Curves The Consumer s Preferences The consumer is indifferent, or equally happy, with the combinations shown at points A, B, and C because they are all on the same curve. The Marginal Rate of Substitution The slope at any point on an indifference curve is the marginal rate of substitution. It is the rate at which a consumer is willing to trade one good for another. It is the amount of one good that a consumer requires as compensation to give up one unit of the other good.
62 Figure 2 The Consumer s Preferences Quantity of Pepsi C B D MRS 1 A I 2 Indifference curve, I 1 0 Quantity of Pizza Copyright 2004 South-Western
63 Two extreme Examples of Indifferent Curves Perfect Substitutes Two goods with straight-line indifference curves are perfect substitutes. The marginal rate of substitution is a fixed number. Perfect Complements Two goods with right-angle indifference curves are perfect complements.


64 Figure 3 Perfect Substitutes and Perfect Complements Copyright 2004 South-Western
65 The Consumer s Optimal Choices Combining the indifference curve and the budget constraint determines the consumer s optimal choice. Consumer optimum occurs at the point where the highest indifference curve and the budget constraint are tangent. The consumer chooses consumption of the two goods so that the marginal rate of substitution equals the relative price.
66 Figure 4 The Consumer s Optimum Quantity of Pepsi Optimum B A I 3 I 1 I 2 Budget constraint 0 Quantity of Pizza Copyright 2004 South-Western
67 The Consumer s Optimal Choice Budgetrestriction: + Budget Line: Optimal Choice: = = The marginal rate of substitution equals the negative price ratio. Utility Function: (, )
68 Maximization with Budget Restriction Max, subject to = + Lagrangian:,, =, ( + ) FOC: = =0 = =0 = =0 = = Marshall s Demand Function: = (,, ) = (,, )
69 Minimization under given Utility Level Min + subject to, = Lagrangian:,, = + [, ] FOC: = =0 = =0 =, + =0 = = Hick s Demand Function: = (,, ) = (,, )
70 3.2 Income and Substitution Effects The Income Effect The income effect is the change in consumption that results when a price change moves the consumer to a higher or lower indifference curve. The Substitution Effect The substitution effect is the change in consumption that results when a price change moves the consumer along an indifference curve to a point with a different marginal rate of substitution.
71 Income and Substitution Effects A Change in Price: Substitution Effect A price change first causes the consumer to move from one point on an indifference curve to another on the same curve. Illustrated by movement from point A to point B. A Change in Price: Income Effect After moving from one point to another on the same curve, the consumer will move to another indifference curve. Illustrated by movement from point B to point C.
72 Figure 8 Income and Substitution Effects Quantity of Pepsi New budget constraint Income effect Substitution effect B Initial budget constraint C New optimum Initial optimum A I 2 I 1 0 Substitution effect Income effect Quantity of Pizza Copyright 2004 South-Western
73 Elasticities Income-Elasticity, = (In-built)Price-Elatisicity, = Cross-Price-Elasticity, = With i=1,2 and j i.
74 Slutzky-Equation The total effect: is devided into = (with = ) a Substitution Effect, which equals the reaction of Hick s demand on a price change and a Income Effect.
75 3.3 The Optimal Labor Supply How do wages affect labor supply? If the substitution effect is greater than the income effect for the worker, he or she works more. If the income effect is greater than the substitution effect, he or she works less.
76 Figure 9 The Work-Leisure Decision Consumption $5,000 Optimum 2,000 I 3 I 2 I Hours of Leisure Copyright 2004 South-Western
77 Figure 10 An Increase in the Wage (a) For a person with these preferences the labor supply curve slopes upward. Consumption Wage Labor supply 1. When the wage rises... BC 1 BC 2 I 2 I 1 0 Hours of 0 Hours of Labor hours of leisure decrease... Leisure and hours of labor increase. Supplied Copyright 2004 South-Western
78 Figure 11 An Increase in the Wage (b) For a person with these preferences the labor supply curve slopes backward. Consumption Wage BC 2 1. When the wage rises... BC 1 Labor supply I 1 I 2 0 Hours of 0 Hours of Labor hours of leisure increase... Leisure and hours of labor decrease. Supplied Copyright 2004 South-Western
79 Optimal labor supply Budgetrestriction = Utility Function = (,,,, ) Budget line With = and = > = = =
80 Optimal labor supply Lagrangian:,, =, + ( ) = = Slutzky Equation for Leisure: = +( ) SE= Leisure is more expensive now IE= Income is higher.

81 4.1 The Costs of Production 4.2 Firms in Competitive Markets 4.3 Monopoly Theory 4.4 Oligopoly Theory
82 4.1 The Costs of Production Total Revenue: The amount a firm receives for the sale of its output. Total Cost: The market value of the inputs a firm uses in production. Profit is the firm s total revenue minus its total cost. Profit = Total revenue - Total cost
83 Costs as Opportunity Costs A firm s cost of production includes all the opportunity costs of making its output of goods and services. Explicit and Implicit Costs A firm s cost of production include explicit costs and implicit costs. Explicit costs are input costs that require a direct outlay of money by the firm. Implicit costs are input costs that do not require an outlay of money by the firm.
84 Production and Costs The production function shows the relationship between quantity of inputs used to make a good and the quantity of output of that good. The marginal product of any input in the production process is the increase in output that arises from an additional unit of that input. Diminishing marginal product is the property whereby the marginal product of an input declines as the quantity of the input increases. Example: As more and more workers are hired at a firm, each additional worker contributes less and less to production because the firm has a limited amount of equipment.
85 Fixed and Variable Costs Fixed costs are those costs that do not vary with the quantity of output produced. Variable costs are those costs that do vary with the quantity of output produced. Total Costs Total Fixed Costs (TFC) Total Variable Costs (TVC) Total Costs (TC) TC = TFC + TVC
86 Average Costs Average costs can be determined by dividing the firm s costs by the quantity of output it produces. The average cost is the cost of each typical unit of product. Average Costs: Average Fixed Costs (AFC) Average Variable Costs (AVC) Average Total Costs (ATC) ATC = AFC + AVC
87 Marginal Costs Marginal cost (MC) measures the increase in total cost that arises from an extra unit of production. Marginal cost helps answer the following question: How much does it cost to produce an additional unit of output?
88 Figure 1 Average-Cost and Marginal-Cost Curves Costs $ MC ATC AVC AFC Quantity of Output (glasses of lemonade per hour) Copyright 2004 South-Western
89 Elasticities Elasticity to Scale = = Partial Product Elasticity = (, ) = = (, ) (, ) = =
90 Economies and Diseconomies of Scale Economies of scale refer to the property whereby the long-run average total cost falls as the quantity of output increases. Diseconomies of scale refer to the property whereby the long-run average total cost rises as the quantity of output increases. Constant returns to scale refers to the property whereby the long-run average total cost stays the same as the quantity of output increases.
91 Definition Production Function = (, ) If, function has > = <, holds for all (K,L) and all >1,then the production returns to scale. >1 =1 <1
92 Figure 2 Average Total Cost in the Short and Long Run Average Total Cost ATC in short run with small factory ATC in short run with medium factory ATC in short run with large factory ATC in long run $12,000 10,000 Economies of scale Constant returns to scale Diseconomies of scale 0 1,000 1,200 Quantity of Cars per Day Copyright 2004 South-Western
93 Production Maximization Max F(, ) subject to = + Lagrange-Function: L(,, )= (, )+ ( + ) First Order Conditions: L = =0 L = =0 L = + =0 = =
94 4.2 Firms in Competitive Markets A perfectly competitive market has the following characteristics: There are many buyers and sellers in the market. The goods offered by the various sellers are largely the same. Firms can freely enter or exit the market. A competitive market has many buyers and sellers trading identical products so that each buyer and seller is a price taker. Buyers and sellers must accept the price determined by the market.
95 The Revenue of a Competitive Firm Total revenue for a firm is the selling price times the quantity sold. TR = (P Q) Average revenue tells us how much revenue a firm receives for the typical unit sold. TR = (P Q)/Q=P Marginal revenue is the change in total revenue from an additional unit sold. MR = TR/ Q
96 Figure 4 Profit Maximization for a Competitive Firm Costs and Revenue The firm maximizes profit by producing the quantity at which marginal cost equals marginal revenue. MC MC 2 ATC P = MR 1 = MR 2 AVC P = AR = MR MC 1 0 Q 1 Q MAX Q 2 Quantity Copyright 2004 South-Western
97 Profit Maximization Profit Profit Maximization = ( ) ( ) = =0 = ( ) Marginal Revenue = Marginal Profit
98 Profit Maximation Profit Equation FOC = ( ) = = ( ) In a market with free entry and exit, profits are driven to zero in the long run and all firms produce at the efficient scale. In the long run, the number of firms adjusts to drive the market back to the zero-profit equilibrium.
99 4.3 Monopoly Theory A firm is considered a monopoly if... it is the sole seller of its product. its product does not have close substitutes. The fundamental cause of monopoly is barriers to entry. Its sources are: Ownership of a key resource. The government gives a single firm the exclusive right to produce some good. Costs of production make a single producer more efficient than a large number of producers.
100 Natural Monopolies An industry is a natural monopoly when a single firm can supply a good or service to an entire market at a smaller cost than could two or more firms. A natural monopoly arises when there are economies of scale over the relevant range of output.
101 Figure 7 Economies of Scale as a Cause of Monopoly Cost Average total cost 0 Quantity of Output Copyright 2004 South-Western
102 Figure 8 Demand Curves for Competitive and Monopoly Firms (a) A Competitive Firm s Demand Curve (b) A Monopolist s Demand Curve Price Price Demand Demand 0 Quantity of Output 0 Quantity of Output Copyright 2004 South-Western
103 A Monopoly s Revenue Total Revenue P Q = TR Average Revenue TR/Q = AR = P Marginal Revenue TR/ Q = MR
104 A Monopoly s Revenue A Monopoly s Marginal Revenue A monopolist s marginal revenue is always less than the price of its good. The demand curve is downward sloping. When a monopoly drops the price to sell one more unit, the revenue received from previously sold units also decreases. When a monopoly increases the amount it sells, it has two effects on total revenue (P Q). The output effect more output is sold, so Q is higher. The price effect price falls, so P is lower.
105 Figure 9 Demand and Marginal-Revenue Curves for a Monopoly Price $ Marginal revenue Demand (average revenue) Quantity of Water Copyright 2004 South-Western
106 Figure 10 Profit Maximization for a Monopoly Costs and Revenue Monopoly price and then the demand curve shows the price consistent with this quantity. B 1. The intersection of the marginal-revenue curve and the marginal-cost curve determines the profit-maximizing quantity... A Average total cost Marginal cost Demand Marginal revenue 0 Q Q MAX Q Quantity Copyright 2004 South-Western
107 Figure 11 The Monopolist s Profit Costs and Revenue Marginal cost Monopoly price E B Monopoly profit Average total cost Average total cost D C Demand Marginal revenue 0 Q MAX Quantity Copyright 2004 South-Western
108 Monopoly Profit Maximation For Monopolies the same profit maximization equation as for firms in competitive markets holds: = ( )= ( ) 1 1,
109 The Welfare Cost of Monopoly In contrast to a competitive firm, the monopoly charges a price above the marginal cost. From the standpoint of consumers, this high price makes monopoly undesirable. However, from the standpoint of the owners of the firm, the high price makes monopoly very desirable.
110 The Deadweight Loss Because a monopoly sets its price above marginal cost, it places a wedge between the consumer s willingness to pay and the producer s cost. This wedge causes the quantity sold to fall short of the social optimum.
111 Figure 12 The Inefficiency of Monopoly Price Deadweight loss Marginal cost Monopoly price Marginal revenue Demand 0 Monopoly quantity Efficient quantity Quantity Copyright 2004 South-Western
112 Public Policy towards Monopolies Government responds to the problem of monopoly in one of four ways. Making monopolized industries more competitive. Regulating the behavior of monopolies. Turning some private monopolies into public enterprises. Doing nothing at all.
113 Price Discrimination Price discrimination is the business practice of selling the same good at different prices to different customers, even though the costs for producing for the two customers are the same. Perfect Price Discrimination Perfect price discrimination refers to the situation when the monopolist knows exactly the willingness to pay of each customer and can charge each customer a different price.
114 Figure 13 Welfare with and without Price Discrimination Price (a) Monopolist with Single Price Consumer surplus Monopoly price Profit Deadweight loss Marginal cost Marginal revenue Demand 0 Quantity sold Quantity Copyright 2004 South-Western
115 4.4 Oligopoly Theory Types of Imperfectly Competitive Markets Oligopoly Only a few sellers, each offering a similar or identical product to the others. Monopolistic Competition Many firms selling products that are similar but not identical.
116 Characteristics of an Oligopoly Market Few sellers offering similar or identical products. Interdependent firms. Best off cooperating and acting like a monopolist by producing a small quantity of output and charging a price above marginal cost. A duopoly is an oligopoly with only two members. It is the simplest type of oligopoly.
117 Competition, Monopolies and Cartels The duopolists may agree on a monopoly outcome. Collusion An agreement among firms in a market about quantities to produce or prices to charge. Cartel A group of firms acting in unison.
118 GAME THEORY AND THE ECONOMICS OF COOPERATION Game theory is the study of how people behave in strategic situations. Strategic decisions are those in which each person, in deciding what actions to take, must consider how others might respond to that action.
119 The Prisoners Dilemma The prisoners dilemma provides insight into the difficulty in maintaining cooperation. Often people (firms) fail to cooperate with one another even when cooperation would make them better off. The prisoners dilemma is a particular game between two captured prisoners that illustrates why cooperation is difficult to maintain even when it is mutually beneficial.
120 Figure 14 The Prisoners Dilemma Bonnie s Decision Confess Bonnie gets 8 years Remain Silent Bonnie gets 20 years Confess Clyde s Decision Clyde gets 8 years Bonnie goes free Clyde goes free Bonnie gets 1 year Remain Silent Clyde gets 20 years Clyde gets 1 year Copyright 2003 Southwestern/Thomson Learning
121 The Prisoners Dilemma The dominant strategy is the best strategy for a player to follow regardless of the strategies chosen by the other players. Cooperation is difficult to maintain, because cooperation is not in the best interest of the individual player.
122 Figure 15 An Oligopoly Game Iraq s Decision High Production Iraq gets $40 billion Low Production Iraq gets $30 billion Iran s Decision High Production Low Production Iran gets $40 billion Iraq gets $60 billion Iran gets $30 billion Iran gets $60 billion Iraq gets $50 billion Iran gets $50 billion Copyright 2003 Southwestern/Thomson Learning

123 5.1 Externalities 5.2 Public Goods
124 5.1 Externalities An externality refers to the uncompensated impact of one person s actions on the well-being of a bystander. Externalities are created when a market outcome affects individuals other than buyers and sellers in that market. Externalities cause welfare in a market to depend on more than just the value to the buyers and cost to the sellers. Externalities cause markets to be inefficient, and thus fail to maximize total surplus.
125 Negative Externalities When the impact on the bystander is adverse, the externality is called a negative externality. Automobile exhaust Cigarette smoking Barking dogs (loud pets) Loud stereos in an apartment building Negative externalities lead markets to produce a larger quantity than is socially desirable.
126 Externalities and Market Inefficiency The Market for Aluminum The quantity produced and consumed in the market equilibrium is efficient in the sense that it maximizes the sum of producer and consumer surplus. If the aluminum factories emit pollution (a negative externality), then the cost to society of producing aluminum is larger than the cost to aluminum producers. For each unit of aluminum produced, the social cost includes the private costs of the producers plus the cost to those bystanders adversely affected by the pollution.
127 Figure 1 Pollution and the Social Optimum Price of Aluminum Cost of pollution Social cost Supply (private cost) Optimum Equilibrium Demand (private value) 0 Q OPTIMUM Q MARKET Quantity of Aluminum Copyright 2004 South-Western
128 Internalizing an Externality The intersection of the demand curve and the socialcost curve determines the optimal output level. The socially optimal output level is less than the market equilibrium quantity. Internalizing an externality involves altering incentives so that people take account of the external effects of their actions. The government can internalize an externality by imposing a tax on the producer to reduce the equilibrium quantity to the socially desirable quantity.
129 Positive Externalities When the impact on the bystander is beneficial, the externality is called a positive externality. Immunizations Restored historic buildings Research into new technologies Positive externalities lead markets to produce a larger quantity than is socially desirable.
130 Figure 2 Education and the Social Optimum Price of Education Supply (private cost) Social value Demand (private value) 0 Q MARKET Q OPTIMUM Quantity of Education Copyright 2004 South-Western
131 Positive Externalities The intersection of the supply curve and the social-value curve determines the optimal output level. The optimal output level is more than the equilibrium quantity. The market produces a smaller quantity than is socially desirable. The social value of the good exceeds the private value of the good.
132 The Coase Theorem The Coase Theorem is a proposition that if private parties can bargain without cost over the allocation of resources, they can solve the problem of externalities on their own. Transactions Costs Transaction costs are the costs that parties incur in the process of agreeing to and following through on a bargain.
133 Public Policy towards Externalities When externalities are significant and private solutions are not found, government may attempt to solve the problem through Command-and-Control Policies Usually take the form of regulations: Forbid certain behaviors. Require certain behaviors. Examples: Requirements that all students be immunized. Stipulations on pollution emission levels set by the Environmental Protection Agency (EPA).
134 Public Policy towards Externalities 2. Market-Based Policies Government uses taxes and subsidies to align private incentives with social efficiency. Pigovian taxes are taxes enacted to correct the effects of a negative externality.
135 Figure 3 The Equivalence of Pigovian Taxes and Pollution Permits Price of Pollution (a) Pigovian Tax 1. A Pigovian tax sets the price of pollution... P 0 Q which, together with the demand curve, determines the quantity of pollution. Pigovian tax Demand for pollution rights Quantity of Pollution Copyright 2004 South-Western
136 Figure 4 The Equivalence of Pigovian Taxes and Pollution Permits (b) Pollution Permits Price of Pollution Supply of pollution permits P which, together with the demand curve, determines the price of pollution. Q Demand for pollution rights 1. Pollution permits set the quantity of pollution... Quantity of Pollution Copyright 2004 South-Western
137 5.2 Public Goods Free goods provide a special challenge for economic analysis. When a good does not have a price attached to it, private markets cannot ensure that the good is produced and consumed in the proper amounts. In such cases, government policy can potentially remedy the market failure that results, and raise economic well-being.
138 The Different Kind of Goods When one is thinking about the various goods in the economy, it is useful to group them according to two characteristics: Excludability refers to the property of a good whereby a person can be prevented from using it. Rivalry refers to the property of a good whereby one person s use diminishes other people s use.
139 The Different Kind of Goods Four Types of Goods: Private Goods Are both, excludable and rival. Public Goods Are neither excludable nor rival. Common Resources Are rival but not excludable. Natural Monopolies Are excludable but not rival.
140 Figure 5 Four Types of Goods Yes Rival? No Excludable? Yes No Private Goods Ice-cream cones Clothing Congested toll roads Common Resources Fish in the ocean The environment Congested nontoll roads Natural Monopolies Fire protection Cable TV Uncongested toll roads Public Goods Tornado siren National defense Uncongested nontoll roads Copyright 2004 South-Western
141 The Free-Rider Problem A free-rider is a person who receives the benefit of a good but avoids paying for it. Since people cannot be excluded from enjoying the benefits of a public good, individuals may withhold paying for the good hoping that others will pay for it. The free-rider problem prevents private markets from supplying public goods.
142 The Free-Rider Problem Solving the Free-Rider Problem: The government can decide to provide the public good if the total benefits exceed the costs. The government can make everyone better off by providing the public good and paying for it with tax revenue. Important Public Goods: National Defense Basic Research Fighting Poverty
143 The Difficult Job of Cost-Benefit Analysis Cost benefit analysis refers to a study that compares the costs and benefits to society of providing a public good. In order to decide whether to provide a public good or not, the total benefits of all those who use the good must be compared to the costs of providing and maintaining the public good. It is difficult to do because of the absence of prices needed to estimate social benefits and resource costs. The value of life, the consumer s time, and aesthetics are difficult to assess.
144 Common Ressources Common resources, like public goods, are not excludable. They are available free of charge to anyone who wishes to use them. Common resources are rival goods because one person s use of the common resource reduces other people s use.
145 The Tragedy of Common Ressources The Tragedy of the Commons is a parable that illustrates why common resources get used more than is desirable from the standpoint of society as a whole. Common resources tend to be used excessively when individuals are not charged for their usage. This is similar to a negative externality. Important Common Ressources: Clean air and water Congested roads Fish, whales, and other wildlife
146 Conclusion: The Importance of Property Rights: The market fails to allocate resources efficiently when property rights are not well-established (i.e. some item of value does not have an owner with the legal authority to control it). When the absence of property rights causes a market failure, the government can potentially solve the problem.
Microeconomics Exam Notes
 Microeconomics Exam Notes Opportunity Cost What you give up to get it Production Possibility Frontier Maximum attainable combination of two products (Concept of Opportunity Cost). Main Decision Makers:
Eco402 - Microeconomics Glossary By
 Eco402 - Microeconomics Glossary By Break-even point : the point at which price equals the minimum of average total cost. Externalities : the spillover effects of production or consumption for which no
Eastern Mediterranean University Faculty of Business and Economics Department of Economics Fall Semester
 Eastern Mediterranean University Faculty of Business and Economics Department of Economics 2016-17 Fall Semester Duration: 110 minutes ECON101 - Introduction to Economics I Final Exam Type A 11 January
Chapter 1: The Ten Lessons in Economics
 Textbook Notes Page 1 Chapter 1: The Ten Lessons in Economics Saturday, 25 May 2013 1:09 PM Economics: The study of how society manages its scarce resources Individual Decision-Making Lesson 1: People
Week One What is economics? Chapter 1
 Week One What is economics? Chapter 1 Economics: is the social science that studies the choices that individuals, businesses, governments, and entire societies make as they cope with scarcity and the incentives
2000 AP Microeconomics Exam Answers
 2000 AP Microeconomics Exam Answers 1. B Scarcity is the main economic problem!!! 2. D If the wages of farm workers and movie theater employee increase, the supply of popcorn and movies will decrease (shift
Chapter 1- Introduction
 Chapter 1- Introduction A SIMPLE ECONOMY Central PROBLEMS OF AN ECONOMY: scarcity of resources problem of choice Every society has to decide on how to use its scarce resources. Production, exchange and
Lecture 12. Monopoly
 Lecture 12 Monopoly By the end of this lecture, you should understand: why some markets have only one seller how a monopoly determines the quantity to produce and the price to charge how the monopoly s
Section I (20 questions; 1 mark each)
") Foundation Course in Managerial Economics- Solution Set- 1 Final Examination Marks- 100 Section I (20 questions; 1 mark each) 1. Which of the following statements is not true? a. Societies face an important
Foundation Course in Managerial Economics- Solution Set- 1 Final Examination Marks- 100 Section I (20 questions; 1 mark each) 1. Which of the following statements is not true? a. Societies face an important
Microeconomics: MIE1102
 TEXT CHAPTERS TOPICS 1, 2 ECONOMICS, ECONOMIC SYSTEMS, MARKET ECONOMY 3 DEMAND AND SUPPLY. MARKET EQUILIBRIUM 4 ELASTICITY OF DEMAND AND SUPPLY 5 DEMAND & CONSUMER BEHAVIOR 6 PRODUCTION FUNCTION 7 COSTS
MICRO FINAL EXAM Study Guide
 AP MICROECONOMICS-217 Name: MICRO FINAL EXAM Study Guide Instructions: Please fight senioritis! Study & be efficient with your time. DUE: Friday April 28 th (Multiple choice block 4/26 th or 27 th Free
I enjoy teaching this class. Good luck and have a nice Holiday!!
 ECON 202-501 Fall 2008 Xiaoyong Cao Final Exam Form A Instructions: The exam consists of 2 parts. Part I has 35 multiple choice problems. You need to fill the answers in the table given in Part II of the
AP Microeconomics. Content Skills Learning Targets Assessment Resources & Technology
 St. Michael Albertville High School Teacher: Matthew Rooker AP Microeconomics October 2014 Content Skills Learning Targets Assessment Resources & Technology November 2014 Content Skills Learning Targets
Economics I. Part 1: Introduction. 1. Ten principles of economics. FUSL ECGE 1 er bac 1 e Quadrimestre 2012 Samuel Desguin. W.
 Economics I W. Vergote In class, chapters are seen in this order: 1, 2, 3, 4, 5, 6, 7, 8, 21, 13, 14, 10, 11, 15, 16, and 17. Chapter 9, 12, 17, 18, 19 and 20 are not to be studied. Part 1: Introduction
AP Microeconomics Review With Answers
 AP Microeconomics Review With Answers 1. Firm in Perfect Competition (Long-Run Equilibrium) 2. Monopoly Industry with comparison of price & output of a Perfectly Competitive Industry (which means show
CLEP Microeconomics Practice Test
 Practice Test Time 90 Minutes 80 Questions For each of the questions below, choose the best answer from the choices given. 1. In economics, the opportunity cost of an item or entity is (A) the out-of-pocket
Monopoly. Cost. Average total cost. Quantity of Output
 While a competitive firm is a price taker, a monopoly firm is a price maker. A firm is considered a monopoly if... it is the sole seller of its product. its product does not have close substitutes. The
Microeconomics. More Tutorial at
 Microeconomics 1. Suppose a firm in a perfectly competitive market produces and sells 8 units of output and has a marginal revenue of $8.00. What would be the firm s total revenue if it instead produced
Supply, Demand, and Government Policies. Copyright 2004 South-Western
 Supply, Demand, and Government Policies Copyright 2004 South-Western Supply, Demand, and Government Policies In a free, unregulated market system, market forces establish equilibrium prices and exchange
Section I (20 questions; 1 mark each)
") Foundation Course in Managerial Economics Examination Marks- 100, Time 3 hours Section I (20 questions; 1 mark each) 1. Which of the following statements is not true: a. Rich countries also face problems
Foundation Course in Managerial Economics Examination Marks- 100, Time 3 hours Section I (20 questions; 1 mark each) 1. Which of the following statements is not true: a. Rich countries also face problems
Econ 200 Fall Opportunity Cost and the Gains from Trade Supply and Demand Firms and Industries
 Econ 200 Fall 2012 Microeconomics Opportunity Cost and the Gains from Trade Supply and Demand Firms and Industries Macroeconomics The Data of Macroeconomics Growth Saving and Investment Money and Exchange
SHORT QUESTIONS AND ANSWERS FOR ECO402
 SHORT QUESTIONS AND ANSWERS FOR ECO402 Question: How does opportunity cost relate to problem of scarcity? Answer: The problem of scarcity exists because of limited production. Thus, each society must make
Principles of BABY THOMAS 2016
 Principles of 1 UNIT I INTRODUCTION TO MACROECONOMICS Learning Objectives 1. Introduction to economics, meaning and definition of economics, Principles of economics 2. Economic models, the circular flow
AP Microeconomics Review Session #3 Key Terms & Concepts
 The Firm, Profit, and the Costs of Production 1. Explicit vs. implicit costs 2. Short-run vs. long-run decisions 3. Fixed inputs vs. variable inputs 4. Short-run production measures: be able to calculate/graph
Principles of Microeconomics Module 5.1. Understanding Profit
 Principles of Microeconomics Module 5.1 Understanding Profit 180 Production Choices of Firms All firms have one goal in mind: MAX PROFITS PROFITS = TOTAL REVENUE TOTAL COST Two ways to reach this goal:
Externalities. PowerPoint Slides prepared by: Andreea CHIRITESCU Eastern Illinois University
 10 Externalities PowerPoint Slides prepared by: Andreea CHIRITESCU Eastern Illinois University 1 Externalities Government action can sometimes improve upon market outcomes Why markets sometimes fail to
BUSINESS ECONOMICS (PAPER IV-PART I)
") BUSINESS ECONOMICS (PAPER IV-PART I) (60 MARKS) Q1: Macroeconomics is also called economics (a) applied (b) aggregate (c) experimental (d) none Q2: A Study of how increase in the corporate income tax rate
BUSINESS ECONOMICS (PAPER IV-PART I) (60 MARKS) Q1: Macroeconomics is also called economics (a) applied (b) aggregate (c) experimental (d) none Q2: A Study of how increase in the corporate income tax rate
A Planned Course Statement for. Economics, AP. Length of Period (mins.) 41 Total Clock Hours: 123. Periods per Cycle: 6 Length of Course (yrs.) 1.
 41 Total Clock Hours: 123. Periods per Cycle: 6 Length of Course (yrs.) 1.") East Penn School District Secondary Curriculum A Planned Course Statement for Economics, AP Course # 266 Grade(s) 12 Department: Social Studies Length of Period (mins.) 41 Total Clock Hours: 123 Periods
East Penn School District Secondary Curriculum A Planned Course Statement for Economics, AP Course # 266 Grade(s) 12 Department: Social Studies Length of Period (mins.) 41 Total Clock Hours: 123 Periods
Many sellers: There are many firms competing for the same group of customers.
 Microeconomics 2 Chapter 16 Monopolistic Competition 16-1 Between monopoly and perfect Competition One type of imperfectly competitive market is an oligopoly, a market with only a few sellers, each offering
Monopoly. While a competitive firm is a price taker, a monopoly firm is a price maker.
 Monopoly Monopoly While a competitive firm is a price taker, a monopoly firm is a price maker. Monopoly A firm is considered a monopoly if... it is the sole seller of its product. its product does not
Market structures. Why Monopolies Arise. Why Monopolies Arise. Market power. Monopoly. Monopoly resources
 Market structures Why Monopolies Arise Market power Alters the relationship between a firm s costs and the selling price Charges a price that exceeds marginal cost A high price reduces the quantity purchased
2007 Thomson South-Western
 Public Goods and Common Resources The best things in life are free... Free goods provide a special challenge for economic analysis. Most goods in our economy are allocated in markets Public Goods and Common
FINAL. January 17, 2011 GROUP A
 EC101 Sections 04 Fall 2010 NAME: ID #: SECTION: Instructions: FINAL January 17, 2011 GROUP A You have 90 minutes to complete the exam. There will be no extensions. Students are not allowed to go out of
Monopoly. Chapter 15
 Monopoly Chapter 15 Monopoly While a competitive firm is a price taker, a monopoly firm is a price maker. Monopoly u A firm is considered a monopoly if... it is the sole seller of its product. its product
Principles of Economics. January 2018
 Principles of Economics January 2018 Monopoly Contents Market structures 14 Monopoly 15 Monopolistic competition 16 Oligopoly Principles of Economics January 2018 2 / 39 Monopoly Market power In a competitive
Monopoly. PowerPoint Slides prepared by: Andreea CHIRITESCU Eastern Illinois University
 15 Monopoly PowerPoint Slides prepared by: Andreea CHIRITESCU Eastern Illinois University 1 Market power Why Monopolies Arise Alters the relationship between a firm s costs and the selling price Monopoly
Econ Microeconomics Notes
 Econ 120 - Microeconomics Notes Daniel Bramucci December 1, 2016 1 Section 1 - Thinking like an economist 1.1 Definitions Cost-Benefit Principle An action should be taken only when its benefit exceeds
a) I, II and III. b) I c) II and III only. d) I and III only. 2. Refer to the PPF diagram below. PPF
 I, II and III. b) I c) II and III only. d) I and III only. 2. Refer to the PPF diagram below. PPF") 1. Suppose that - at a given level of an economic activity - marginal social cost is greater than marginal social benefit. Which of the following statements is TRUE? I. Social surplus would be higher at
1. Suppose that - at a given level of an economic activity - marginal social cost is greater than marginal social benefit. Which of the following statements is TRUE? I. Social surplus would be higher at
JANUARY EXAMINATIONS 2008
 No. of Pages: (A) 9 No. of Questions: 38 EC1000A micro 2008 JANUARY EXAMINATIONS 2008 Subject Title of Paper ECONOMICS EC1000 MICROECONOMICS Time Allowed Two Hours (2 Hours) Instructions to candidates
FINALTERM EXAMINATION FALL 2006
 FINALTERM EXAMINATION FALL 2006 QUESTION NO: 1 (MARKS: 1) - PLEASE CHOOSE ONE Compared to the equilibrium price and quantity sold in a competitive market, a monopolist Will charge a price and sell a quantity.
4. A situation in which the number of competing firms is relatively small is known as A. Monopoly B. Oligopoly C. Monopsony D. Perfect competition
 1. Demand is a function of A. Firm B. Cost C. Price D. Product 2. The kinked demand curve explains A. Demand flexibility B. Demand rigidity C. Price flexibility D. Price rigidity 3. Imperfect competition
ECON 101 KONG Midterm 2 CMP Review Session. Presented by Benji Huang
 ECON 101 KONG Midterm 2 CMP Review Session Presented by Benji Huang Chapter 5 Efficiency and Equity Benefit, Cost, Surplus Consumers (1) A consumer benefits from the consumption of a product this benefit
Review Chapters 1 & 2
 Review Chapters 1 & 2 ECON 1 Midterm 1 Review Session Scarcity or No Free Lunch Principle. Cost-Benefit Principle. Reservation Price. Economic Surplus = Benefit Cost. Opportunity Cost (DO NOT FORGET!!).
1.3. Levels and Rates of Change Levels: example, wages and income versus Rates: example, inflation and growth Example: Box 1.3
 1 Chapter 1 1.1. Scarcity, Choice, Opportunity Cost Definition of Economics: Resources versus Wants Wants: more and better unlimited Versus Needs: essential limited Versus Demand: ability to pay + want
Microeconomics. Use the graph below to answer question number 3
 More Tutorial at Microeconomics 1. Opportunity costs are the values of the: a. minimal budgets of families on welfare b. hidden charges passed on to consumers c. monetary costs of goods and services *
Microeconomics. Use the graph below to answer question number 3
 More Tutorial at Microeconomics 1. Opportunity costs are the values of the: a. minimal budgets of families on welfare b. hidden charges passed on to consumers c. monetary costs of goods and services *
5-3 - Copyright 2017 Pearson Education, Inc. All Rights Reserved
 Chapter 5 Lecture - Externalities, Environmental Policy, and Public Goods 1 What s the Best Level of Pollution? Is there a way to know what is the optimal level of pollution for a society? No pollution
Microeconomics. Use the Following Graph to Answer Question 3
 More Tutorial at www.dumblittledoctor.com Microeconomics 1. To an economist, a good is scarce when: *a. the amount of the good available is less than the amount that people want when the good's price equals
 Question # 1 of 15 ( Start time: 01:24:42 PM ) Total Marks: 1 A person with a diminishing marginal utility of income: Will be risk averse. Will be risk neutral. Will be risk loving. Cannot decide without
ECON December 4, 2008 Exam 3
 Name Portion of ID# Multiple Choice: Identify the letter of the choice that best completes the statement or answers the question. 1. A fundamental source of monopoly market power arises from a. perfectly
6) The mailing must be postmarked by June 15. 7) If you have any questions please me at
 The mailing must be postmarked by June 15. 7) If you have any questions please me at") Examination Instructions: 1) Answer the examination only after you have read the honesty pledge below. 2) The multiple choice section will be taken in WebCT and a tutorial for using WebCT is to be found
Examination Instructions: 1) Answer the examination only after you have read the honesty pledge below. 2) The multiple choice section will be taken in WebCT and a tutorial for using WebCT is to be found
CONTENTS. Introduction to the Series. 1 Introduction to Economics 5 2 Competitive Markets, Demand and Supply Elasticities 37
 CONTENTS Introduction to the Series iv 1 Introduction to Economics 5 2 Competitive Markets, Demand and Supply 17 3 Elasticities 37 4 Government Intervention in Markets 44 5 Market Failure 53 6 Costs of
Firm Behavior and the Costs of Production
 Firm Behavior and the Costs of Production WHAT ARE COSTS? The Firm s Objective The economic goal of the firm is to maximize profits. Total Revenue, Total Cost, and Profit Total Revenue, Total Cost, and
To produce more beach balls, you must give up ever increasing quantities of ice cream cones.
 Unit 01: Basic Concepts (Macro/Micro) Scarcity The Economic Problem: Unlimited wants, limited economic resources Factors of Production: -Land -Labor -Capital -Entrepreneurship Big 3 Questions: -What to
Unit 6 Perfect Competition and Monopoly - Practice Problems
 Unit 6 Perfect Competition and Monopoly - Practice Problems Multiple Choice Identify the choice that best completes the statement or answers the question. 1. One characteristic of a perfectly competitive
Preview from Notesale.co.uk Page 6 of 89
 Guns Butter 200 0 175 75 130 125 70 150 0 160 What it shows: the maximum combinations of two goods an economy can produce with its existing resources and technology; an economy can produce at points on
ECONOMICS SOLUTION BOOK 2ND PUC. Unit 6. I. Choose the correct answer (each question carries 1 mark)
") Unit 6 I. Choose the correct answer (each question carries 1 mark) 1. A market structure which produces heterogenous products is called: a) Monopoly b) Monopolistic competition c) Perfect competition d)
Unit 6 I. Choose the correct answer (each question carries 1 mark) 1. A market structure which produces heterogenous products is called: a) Monopoly b) Monopolistic competition c) Perfect competition d)
ECON 102 Brown Final Exam (New Material) Practice Exam Solutions
 Practice Exam Solutions") www.liontutors.com ECON 102 Brown Final Exam (New Material) Practice Exam Solutions 1. B A very large percent of their earnings comes from economic rent 2. B Any funds left, after everyone who has a claim
www.liontutors.com ECON 102 Brown Final Exam (New Material) Practice Exam Solutions 1. B A very large percent of their earnings comes from economic rent 2. B Any funds left, after everyone who has a claim
INTI COLLEGE MALAYSIA FOUNDATION IN BUSINESS INFORMATION TECHNOLOGY (CFP) ECO105: ECONOMICS 1 FINAL EXAMINATION: JANUARY 2006 SESSION
 ECO105: ECONOMICS 1 FINAL EXAMINATION: JANUARY 2006 SESSION") ECO105 (F) / Page 1 of 12 Section A INTI COLLEGE MALAYSIA FOUNDATION IN BUSINESS INFORMATION TECHNOLOGY (CFP) ECO105: ECONOMICS 1 FINAL EXAMINATION: JANUARY 2006 SESSION Instructions: This section consists
ECO105 (F) / Page 1 of 12 Section A INTI COLLEGE MALAYSIA FOUNDATION IN BUSINESS INFORMATION TECHNOLOGY (CFP) ECO105: ECONOMICS 1 FINAL EXAMINATION: JANUARY 2006 SESSION Instructions: This section consists
Lecture 10. The costs of production
 Lecture 10 The costs of production By the end of this lecture, you should understand: what items are included in a firm s costs of production the link between a firm s production process and its total
DAY AND TIME YOUR SECTION MEETS: ENTER THE NUMBER UNDER "SPECIAL CODES" ON THE SCANTRON SHEET
 SECOND HOURLY EXAMINATION ECON 200 Spring 2008 Version B STUDENT'S NAME: STUDENT'S IDENTIFICATION NUMBER: DAY AND TIME YOUR SECTION MEETS: ENTER THE NUMBER 246135 UNDER "SPECIAL CODES" ON THE SCANTRON
Welfare economics part 2 (producer surplus) Application of welfare economics: The Costs of Taxation & International Trade
 Application of welfare economics: The Costs of Taxation & International Trade") Welfare economics part 2 (producer surplus) Application of welfare economics: The Costs of Taxation & International Trade Dr. Anna Kowalska-Pyzalska Department of Operations Research Presentation is based
Welfare economics part 2 (producer surplus) Application of welfare economics: The Costs of Taxation & International Trade Dr. Anna Kowalska-Pyzalska Department of Operations Research Presentation is based
2007 Thomson South-Western
 BETWEEN MONOPOLY AND PERFECT COMPETITION Imperfect competition refers to those market structures that fall between perfect competition and pure monopoly. Imperfect competition includes industries in which
5 FIRM BEHAVIOR AND THE ORGANIZATION OF INDUSTRY
 5 FIRM BEHAVIOR AND THE ORGANIZATION OF INDUSTRY The s of Production 1 Copyright 2004 South-Western The Market Forces of Supply and Demand Supply and demand are the two words that economists use most often.
Imperfect Competition. Imperfect competition refers to those market structures that fall between perfect competition and pure monopoly.
 Oligopoly Imperfect Competition Imperfect competition refers to those market structures that fall between perfect competition and pure monopoly. Imperfect Competition Imperfect competition includes industries
MULTIPLE CHOICE. Choose the one alternative that best completes the statement or answers the question.
 AUBG, Fall 2015, Principles Micro with P. Stankov, Sample MT2 NOTE: The actual no. of questions on the actual MT will be 30, each for 0.67 grade points. MULTIPLE CHOICE. Choose the one alternative that
full revision of micro economics
 www.examhelplogger.com full revision of micro economics JOIN CLASS 12 TH FREE BATCH ON WHATS APP M 98 91 291 604 MICRO ECONOMICS Studies The Behaviour Of An Individual Economic Unit. Example : Demand Of
Monopolistic Competition. Chapter 17
 Monopolistic Competition Chapter 17 The Four Types of Market Structure Number of Firms? Many firms One firm Few firms Differentiated products Type of Products? Identical products Monopoly Oligopoly Monopolistic
Page 1. AP Economics Mid-Term January 2006 NAME: Date:
 AP Economics Mid-Term January 2006 NAME: Date: 1. Rationality, in the case of firms, is taken to mean that they strive to A. maximize profits. B. charge the highest possible price. C. maximize revenues.
ECON 251 Exam 2 Pink. Fall 2012
 ECON 251 Exam 2 Pink Use the table below to answer the following four questions The table below shows Harry s total utility from consuming beer and wine. The price of beer is $2 per bottle. The price of
INTRODUCTION ECONOMIC PROFITS
 INTRODUCTION This chapter addresses the following key questions: What are profits? What are the unique characteristics of competitive firms? How much output will a competitive firm produce? Chapter 7 THE
ECON 1101 Microeconomics Notes. Table of Contents
 ECON 1101 Microeconomics Notes Table of Contents Comparative Advantage and the Reason for Trade... 2 Perfectly Competitive Markets... 3 Demand... 6 Special Lecture... Error! Bookmark not defined. Demand
GACE Economics Assessment Test I (038) Curriculum Crosswalk
 Curriculum Crosswalk") Subarea I. Fundamental Economic Concepts (20%) Objective 1: Demonstrates an understanding of the fundamental concepts of economics A. Understands the concepts of scarcity, choice, and opportunity cost
Subarea I. Fundamental Economic Concepts (20%) Objective 1: Demonstrates an understanding of the fundamental concepts of economics A. Understands the concepts of scarcity, choice, and opportunity cost
Micro Semester Review Name:
 Micro Semester Review Name: The following review is set up to emphasize certain concepts, graphs and terms. It is the responsibility of the individual teachers to emphasize and review the analysis aspects
ECON 101: Principles of Microeconomics Discussion Section Week 12 TA: Kanit Kuevibulvanich
 Important Concepts: Monopoly ECON 101: Principles of Microeconomics Discussion Section Week 12 Comparison of Perfectly Competitive Market and Monopoly Market Perfect Competition Monopoly Number of Participants
2010 Pearson Education Canada
 What Is Perfect Competition? Perfect competition is an industry in which Many firms sell identical products to many buyers. There are no restrictions to entry into the industry. Established firms have
5. A Positive Statement A. attempts to explain how the world actually is or how the world actually functions.
 ECON 2100 (Summer 2009 Section 04) Final Exam Answer Key Multiple Choice Questions: (2 points each) 1. The Principle states that since people have unlimited needs/wants but only a limited amount of resources,
short run long run short run consumer surplus producer surplus marginal revenue
 Test 3 Econ 3144 Name Fall 2005 Dr. Rupp 20 Multiple Choice Questions (50 points) & 4 Discussion (50 points) Signature I have neither given nor received aid on this exam Use this table to answer questions
DEFINITIONS A 42. Benjamin Disraeli. I hate definitions.
 DEFINITIONS I hate definitions. Benjamin Disraeli adverse selection: opportunism characterized by an informed person s benefiting from trading or otherwise contracting with a less informed person who does
Monopoly. Basic Economics Chapter 15. Why Monopolies Arise. Monopoly
 1 Why Monopolies Arise Basic Economics Chapter 15 Monopoly Monopoly - The monopolist is a firm that is the sole seller of a product (or service) without close substitutes - The monopolist is a price maker
iv. The monopolist will receive economic profits as long as price is greater than the average total cost
 Chapter 15: Monopoly (Lecture Outline) -------------------------------------------------------------------------------------------------------------------------- Monopolies have no close competitors and,
Monopoly CHAPTER. Goals. Outcomes
 CHAPTER 15 Monopoly Goals in this chapter you will Learn why some markets have only one seller Analyze how a monopoly determines the quantity to produce and the price to charge See how the monopoly s decisions
1 of 14 5/1/2014 4:56 PM
 1 of 14 5/1/2014 4:56 PM Any point on the budget constraint Gives the consumer the highest level of utility. Represent a combination of two goods that are affordable. Represents combinations of two goods
MICROECONOMIC FOUNDATIONS OF COST-BENEFIT ANALYSIS. Townley, Chapter 4
 MICROECONOMIC FOUNDATIONS OF COST-BENEFIT ANALYSIS Townley, Chapter 4 Review of Basic Microeconomics Slides cover the following topics from textbook: Input markets. Decision making on the margin. Pricing
Essential Questions Content Skills Assessments Standards/PIs Resources/Notes. Discriminates between scarcity and shortage.
 Map: AP Economics Type: Consensus Grade Level: 12 School Year: 2010-2011 Author: Jessica Cartusciello District/Building: Island Trees/Island Trees High School Created: 06/28/2010 Last Updated: 07/22/2010
INTI COLLEGE MALAYSIA BUSINESS FOUNDATION PROGRAMME ECO 181: INTRODUCTORY ECONOMICS FINAL EXAMINATION: AUGUST 2003 SESSION
 ECO 181 (F) / Page 1 of 15 INTI COLLEGE MALAYSIA BUSINESS FOUNDATION PROGRAMME ECO 181: INTRODUCTORY ECONOMICS FINAL EXAMINATION: AUGUST 2003 SESSION SECTION A There are SIXTY questions on this paper.
14.01 Principles of Microeconomics, Fall 2007 Chia-Hui Chen November 7, Lecture 22
 Monopoly. Principles of Microeconomics, Fall Chia-Hui Chen November, Lecture Monopoly Outline. Chap : Monopoly. Chap : Shift in Demand and Effect of Tax Monopoly The monopolist is the single supply-side
ECO402_Final_Term_Solved_Quizzes By
 ECO402_Final_Term_Solved_Quizzes By http://www.vustudents.net 1. The "perfect information" assumption of perfect competition includes all of the following except one. Which one? Consumers know their preferences.
23 Perfect Competition
 23 Perfect Competition Learning Objectives After you have studied this chapter, you should be able to 1. define price taker, total revenues, marginal revenue, short-run shutdown price, short-run breakeven
Econ Lecture l Final for Fall Section 1: Multiple Choice (2 points each) Please circle the best answer for the following 25 questions.
 Please circle the best answer for the following 25 questions.") Name Student ID # Section # Econ 1101 - Lecture l Final for Fall 1997 Section 1: Multiple Choice (2 points each) Please circle the best answer for the following 25 questions. 1. The benefit to a firm of
Name Student ID # Section # Econ 1101 - Lecture l Final for Fall 1997 Section 1: Multiple Choice (2 points each) Please circle the best answer for the following 25 questions. 1. The benefit to a firm of
Indicate whether the sentence or statement is True or False. Mark "A" if the statement is True or "B" if it is False.
 2004 SLC Economics Page 1 Indicate whether the sentence or statement is True or False. Mark "A" if the statement is True or "B" if it is False. 1. The marginal social cost equals the marginal private cost
Bremen School District 228 Social Studies Common Assessment 2: Midterm
 Bremen School District 228 Social Studies Common Assessment 2: Midterm AP Microeconomics 55 Minutes 60 Questions Directions: Each of the questions or incomplete statements in this exam is followed by five
Chapter 5: Price Controls: Multiple Choice Questions Chapter 6: Elasticity Multiple Choice Questions
 Chapter 5: Price Controls: Multiple Choice Questions 1. ANSWER: d. ceiling. 2. ANSWER: a. a shortage, which cannot be eliminated through market adjustment. 3. ANSWER: b. the equilibrium price is below
UNIT 1 INTRODUCTION. Q. 1 PPC is concave because of: A. Law of diminishing returns. B. Law of DMU. C. Both D. None
 UNIT 1 INTRODUCTION Q. 1 PPC is concave because of: A. Law of diminishing returns. B. Law of DMU C. Both D. None Q2. PPC is downward sloping because of: a) MRT is diminishing b) Constant MRT c) Increasing
Lecture 11. Firms in competitive markets
 Lecture 11 Firms in competitive markets By the end of this lecture, you should understand: what characteristics make a market competitive how competitive firms decide how much output to produce how competitive
Thanksgiving Handout Economics 101 Fall 2000
 Thanksgiving Handout Economics 101 Fall 2000 The purpose of this handout is to provide a variety of problems illustrating many of the ideas that we have discussed in class this semester. The questions
Solutions to Quick Quizzes. point (inside the frontier), and point C is an infeasible point (outside the frontier). Quantity of Clothing Produced
, and point C is an infeasible point (outside the frontier). Quantity of Clothing Produced") Chapter 1 1. There are many possible answers. 2. There are many possible answers. 3. The three principles that describe how the economy as a whole works are: (1) a country s standard of living depends
Chapter 1 1. There are many possible answers. 2. There are many possible answers. 3. The three principles that describe how the economy as a whole works are: (1) a country s standard of living depends
Policy Evaluation Tools. Willingness to Pay and Demand. Consumer Surplus (CS) Evaluating Gov t Policy - Econ of NA - RIT - Dr.
 Evaluating Gov t Policy - Econ of NA - RIT - Dr.") Policy Evaluation Tools Evaluating Gov t Policy - Econ of NA - RIT - Dr. Jeffrey Burnette In economics we like to measure the impact government policies have on the economy and separate winners and losers.
Policy Evaluation Tools Evaluating Gov t Policy - Econ of NA - RIT - Dr. Jeffrey Burnette In economics we like to measure the impact government policies have on the economy and separate winners and losers.
Perfect Competition CHAPTER14
 Perfect Competition CHAPTER14 MARKET TYPES The four market types are Perfect competition Monopoly Monopolistic competition Oligopoly MARKET TYPES Perfect Competition Perfect competition exists when Many
Practice Exam 3: S201 Walker Fall with answers to MC
 Practice Exam 3: S201 Walker Fall 2007 - with answers to MC Print Your Name: I. Multiple Choice (3 points each) 1. If marginal utility is falling then A. total utility must be falling. B. marginal utility