CROPPING, TILLAGE, AND LAND MANAGEMENT PRACTICES IN SOUTHWESTERN ONTARIO
|
|
|
- Myron Lawrence
- 6 years ago
- Views:
Transcription
1 CROPPING, TILLAGE, AND LAND MANAGEMENT PRACTICES IN SOUTHWESTERN ONTARIO 1984 by Dr. Gregory J. Wall & Elizabeth E. Vaughan Agriculture Canada and Galen Driver Soil and Water Management Branch - OMAF November 1985
2
3 Table of Contents List of Tables TABLE OF CONTENTS Page i ii 1.0 SUMMARY INTRODUCTION METHODOLOGY RESULTS AND DISCUSSION CROPPING PRACTICES Crops Grown Crop Rotation Winter Cover Crop Strip Cropping Cross Slope Cropping Clover Plowdown Changes TILLAGE PRACTICES Primary Tillage Secondary Tillage Changes SOIL AND WATER CONSERVATION MEASURES Water and Wind Erosion Soil Compaction and Poor Soil Structure Land Management Practices Changes BIBLIOGRAPHY APPENDICES A. Questionnaire and Instructions 50 B. Selected Results 54 C. Cropping Practices 58 D. Tillage Practices 71 E. Soil and Water Conservation Measures 80 i
4
5 LIST OF TABLES Page Table 1. Farms Surveyed in the Study Area 12 Table 2. The Nature of Farm Enterprises in the Study Area 14 Table 3. The Percentage of Cropland in the Study Area 17 Table 4. Crop Rotations in the Study Area 19 Table 5. Cropping Practices in the Study Area 22 Table 6. Reasons For Changing Cropping Practices 25 Table 7. Primary Tillage Practices in the Study Area 28 Table 8. Secondary Tillage Practices in the Study Area 30 Table 9. Reasons For Changing Tillage Practices in the Past Five Years 32 Table 10. Potential Soil and Water Problems in the Study Area 36 Table 11. Land Management Practices in the Study Area 38 Table 12. Table 13. Percentage of Farmers with Stream Buffer Strips in the Study Area 41 The Percentage of Farmers Intending to Adopt Various Management Practices 44 Table 14. Reasons For Not Adopting New Practices 46 Table 15. Sources of Information Used By Farmers 48 ii
6
7 1.0 SUMMARY Technological advances in agriculture have allowed farmers to work larger acreages and obtain higher yields than ever before. Unfortunately this success has not been achieved without creating additional problems. Among these perceived problems are accelerated rates of soil and water degradation as indicated by economic losses associated with increasing rates of soil, nutrient, and pesticide losses. In an effort to inventory current awareness of these soil and water degradation problems and progress toward implementing solutions, a survey of agricultural tillage, cropping and land management practices was conducted throughout eleven counties in Southern Ontario. The data collected was compiled to create an inventory of the nature and extent of soil and water conservation practices in the study area that might serve as a benchmark against which future progress in the implementation of soil and water conservation programs might be evaluated. The survey involved on-site interviews with 1026 farmers randomly selected in eleven counties of Southwestern Ontario. The interview was based on a questionnaire designed to provide information concerning the nature and extent of cropping, tillage,and land management practices in an agriculturally intensive area of Ontario. The results also provided information regarding how farmers perceive soil degradation problems. It was anticipated that a further understanding of farmers perception of this problem could aid extension specialists in their attempt to promote implementaion of conservation practices. According to survey results, farmers in the study area are aware of wind and water erosion on their properties. Approximately 56% of the farmers surveyed indicated the 1
8 presence of water erosion, and 33% observed wind erosion on their farmland. Ditch bank erosion was also identified as a problem by 41% of the farmers in the study area. Additional forms of soil degradation perceived as problems were soil compaction and poor soil structure. Approximately 42% of the farmers identified soil compaction problems and 25% mentioned poor soil structure. Farmers were asked to state the type of soil tillage. equipment that they were using. Moldboard tillage was employed by the majority (65%) of farmers surveyed. On average, 55% of the farmers in the study area moldboard plow in the fall, while 10% plow in the spring. The chisel plow was the dominant conservation tillage practice reported but only employed on <10% of farmland in the study area. Secondary tillage methods were employed mainly in the spring and varied considerably between counties. Approximately 39% of the farmers in the study area used a field cultivator, 33% disced, 26% used a spring tooth cultivator, and a remaining ten percent utilized cultimulchers and cultipackers. Approximately 31% of the farmers have changed tillage practices in the last five years. Based on those who changed, 35% gave the primary reason for change as a desire to reduce erosion. Additional reasons were to maintain or improve soil structure (26%), and to reduce production costs (19%). The principal crop grown in the study area was corn (37%), followed by forage (20%), beans (15%), wheat (10%), and cereal (10%). Crop rotations were grouped into 2
9 five categories based on combinations of row crops, cereals, and forage. Contrary to popular belief, only 8% of the farmers in the study area practiced continuous row cropping. Approximately 40% of the farmers rotated row crops and cereals (rotation 2) and about 33% of the farmers favoured a rotation of row crops, cereal, and forage (rotation 3). This indicates that over 70% of the farmers include cereals in their rotations. Although cropping and tillage practices help to control soil losses, other soil and water degradation problems require specialized land management control measures such as grassed waterways, drop structures, tile outlet protection, gully control and cattle access ways. Approximately 23% of the farmers surveyed had grassed waterways, 26% had drop structures, 55% employed tile outlet protection, 18% employed gully controls, and 23% had cattle access ways. An additional soil and water conservation control measure for land with watercourses are buffer strips of varying widths. Approximately 63% of the farmers surveyed had a stream or open ditch on their property. About 81% of these farmers reported the presence of buffer strips. The widths of these buffer strips were grouped into seven categories. The most common width was 0-6 feet as indicated by 47% of the farmers with buffer strips. Approximately 16% employed a width of 7-14 feet, 10% had a width of feet, 4% had strips 2749 feet wide, 3% had a width between feet, and 17% of the farmers had buffer strips greater than 100 feet wide. Although many farmers in the study area indicated an awareness of existing and potential soil and water problems, less than half of them (44%) wanted to adopt new practices. Of this group, 34% wanted to adopt better tillage techniques which would 3
10 include, conservation tillage, chisel plow, ridge tillage, and zero tillage. Approximately 16% of the farmers intended to adopt new and improved crop rotations, 13% were interested in tile drainage systems, 12% wanted to employ various structural erosion controls, 10% intended to incorporate legume plowdown, 5% wished to reduce tillage depth, and an additional 5% wanted to utilize a variety of conservation cropping techniques for erosion control. While a large percentage (44%) of farmers expressed interest in adopting soil and water conservation practices, these same farmers suggest several reasons that are preventing them from proceeding. Approximately 44% quoted poor economics as their primary reason for not adopting new practices. Another 30% stated their reasons as being lack of available knowledge, assistance, equipment, and time. Additional reasons given included, existing physical restrictions (ie. soil drainage, stones, limited land base), working rented land, management practices already in place on the farm, farmers perceive problems with implementation, and unproven performance. Farmers who had implemented soil and water management practices credited several different sources of information. The majority of the farmers (38%) perceived the primary information source as being personal experience and common knowledge. Also, 32% felt farm media and meetings were influential factors in their adoption of new practices. Other sources utilized by these farmers included the Soil and Crop Improvement Association, OMAF extension staff, neighbours, family, University of Guelph, colleges, experimental farms, and company representatives. 4
11 The results of this study would appear to represent a suitable baseline source of information on farmers perceptions of soil and water conservation problems in Southwestern Ontario. In addition, the nature and extent of current soil and water conservation practices have been documented. It is felt that these data may serve as a useful benchmark against which future progress in implementation of soil and water conservation practices may be evaluated. While the data sets are sufficiently large to provide useful information on trends in southwestern Ontario, care should be exercised in taking data from any single county in the study area and drawing broad conclusions. 5
12 2.0 INTRODUCTION Research in the Great Lakes Basin has determined conclusively that agriculture contributes sediment, nutrients and environmentally hazardous chemicals to the watersheds draining into the Great Lakes. A pollution problem once thought to originate solely from industrial waste and sewage discharge is now also recognized as the result of rural non-point pollution sources. These non-point pollutants are often difficult to trace even though evidence indicates an agricultural origin. Since agriculture occupies such a large land- base, the potential for influence on the environment is quite substantial. Technological advances in farming have enabled farmers to grow crops on land previously regarded as unsuitable. They have resulted in increased crop production and yields, thereby enabling the farmer to meet the higher demands for specific row crops. In some areas, however, intensified agriculture has resulted in overworked soils, increased pesticide and fertilizer usage, loss of soil, and disregard of soil conservation cropping, tillage, and land management practices. While these practices may require additional time and land space, they are often considered as essential for the future of the land. As well as degrading farm land, there is also concern regarding water quality. Increased use of fertilizer and pesticides has increased the possibility of additional nutrient losses and contamination of surface and groundwater (Switzer-Howse, 1982). The ultimate effect of some agricultural pesticides on the ecosystem is still unknown. Also, evidence indicates that the rate of eutrophication of the Great Lakes has increased in direct relation to the increase in agricultural activity (IJC, 1978). 6
13 These problems originate on the farmland and may be attributed to soil erosion and its agents, wind and water. Soil erosion is a naturally occurring process on all farmland whose magnitude is controlled by the interplay of a number of factors including rainfall, runoff, soil erodibility, slope length and gradient, vegetation, and cropping practices. Soil erosion and associated problems are best dealt with at the source in order to control the pollution problem and to conserve valuable cropland most efficiently. Conservation practices are methods employed by farmers to protect, maintain, and improve their farmland. Ultimately, conservation management protects surface and subsurface soil and inhibits the process of soil degradation. Specific cropping, tillage, and land management practices can result in improved soil conditions and higher crop yields. In an attempt to reduce phosphorus loadings to the Great Lake in accordance with the Canada-United States 1978 Great Lakes Water Quality Agreement, the Canadian Federal/Provincial Phosphorus Task Force has proposed a phosphorus load reduction plan for the Great Lakes. The proposed Canadian plan for Lake Erie calls for a 200 tonne phosphorus reduction from agricultural cropland sources. To achieve the program objective there must be a 0.5kg/ha reduction of total phosphorus over 400,000 hectares of cropland. This proposed phosphorus reduction may be achieved through the adoption of improved soil management and conservation practices from contributing farmland. In order to document the nature and extent of implementation of soil and water conservation practices to serve as a benchmark against which future progress may be evaluated against, a survey of farmers practices and perceptions conducted in southwestern Ontario. The objectives of this study were as follows: 7
14 a) to develop a method to inventory the nature and extent of implementation of soil and water conservation practices on farmland in eleven counties in Southwestern Ontario. b) to compile the resultant data into an inventory of cropping, tillage, and land management practices being conducted in the study area at this point in time (1984). 8
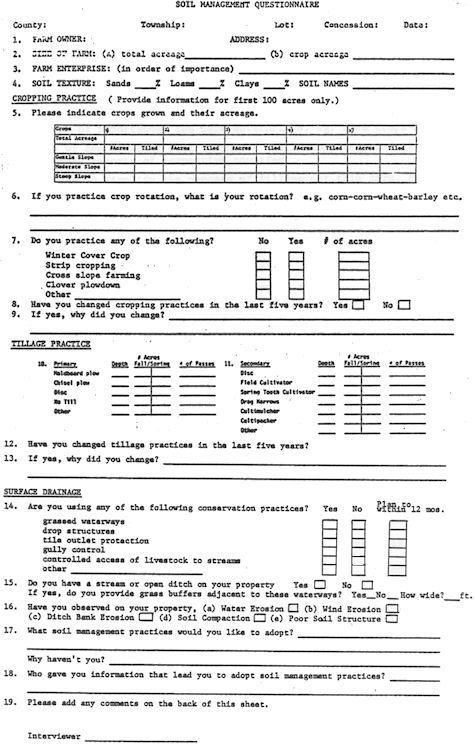
15 3.0 METHODOLOGY A questionnaire was designed by the Ontario Institute of Pedology (O.I.P.) in cooperation with the Ontario Ministry of Agriculture and Food (OMAF), to provide insight into the extent and use of conservation practices in eleven counties in Southern Ontario. The counties of Brant, Elgin, Essex, Haldimand-Norfolk, Huron, Kent, Lambton, Middlesex, Oxford, Perth, and Waterloo were chosen as the study area because of the intense agricultural activity in this region. The purpose of this questionnaire was to create an inventory of the nature and extent of soil and water conservation practices utilized by the farmers within the study area. The questionnaire consisted of four sections. The first was background information including total acreage to be surveyed, the nature of farm enterprise and perceptions with regard to soil and water degradation problems. The remaining three portions focused on the utilization of various conservation practices. The precise headings were Cropping, Tillage, and Surface Drainage Practices. Each section was designed to be answered quickly and efficiently by the landowner in an on-site interview. The addition of an instruction sheet ensured consistent consideration of each question by the interviewer. Copies of both documents can be found in Appendix A. During the summer of 1984, each of the eleven counties was divided into quartiles from which farms were randomly selected. Staff from county offices of the Plant Industry Branch of the Ontario Ministry of Agriculture and Food conducted the on site interviews. Farm size or enterprise did not influence the selection process to ensure that the final 9
16 results for each county were based on representative farming practices in that county. The available manpower in each county was organized and instructed by OMAF and OIP personnel prior to the actual sampling. 10
17 4.0 RESULTS AND DISCUSSION An inventory of the use of soil and water conservation practices on farmland was conducted in the eleven counties of Brant, Elgin, Essex, Haldimand-Norfolk, Huron, Kent Lambton, Middlesex, Oxford, Perth, and Waterloo. The eleven counties chosen are among the most intensively farmed land in the province with a corresponding high potential for soil erosion problems (Driver and Wall, 1982). The questionnaire concerned the extent and location of cropping, tillage, and land management practices in the study area. The survey was conducted and completed during the summer of 1984 by OMAF field staff. Copies of the questionnaire and the instructions to ensure correct completion, are found in Appendix A. Initially, the plan was to sample approximately 100 farms per county. However, due to differences in county size, farm size, time and manpower this value varied slightly from county to county. The final number of farms surveyed totalled The distribution of completed surveys ranged from 67 in Essex county to 120 in Middlesex county, as indicated in Table 1. A significant factor when considering the adoption of conservation management practices is the primary farm enterprise. Specific soil and water conservation needs of a farmer will depend upon his enterprise and the range of cropping and machinery options available. The principal enterprise of the farmers surveyed in the study area was cashcrops (38%) (see Table 1). Approximately 23% were dairy farmers, 13% were beef farmers, 13% had swine farms, and 6% had tobacco farms. These values are not necessarily 11
18 TABLE 1: Farms Surveyed In The Study Area COUNTY # Of Farms Surveyed Brant 100 Elgin 74 Essex 67 Haldimand-Norfolk 100 Huron 100 Kent 99 Lambton 78 Middlesex 120 Oxford 100 Perth 100 Waterloo 86 Total
19 representative of each county and may differ from census values since they represent landowners perceptions of their principle enterprise. Care should be exercised in taking data from any single county in the study area and drawing broad conclusions. The percent of cashcrop farms ranged from a low of 3% in Waterloo county to a high of 87% in Essex county. Most values fell within the 30 to 50 percentile range; however, a couple of high values occur in Lambton (62%) and Kent (76%). Dairy farm enterprises were most prevalent in Oxford (37%), Perth (44%), and Waterloo (44%) counties. However, the percentages of dairy farms in Essex (0%), Kent (3%), and Lambton (1%) counties were all less than 5%. The remaining values were between 15 and 30 percent as indicated in Table 2. The percentages of swine and beef farmers both ranged from lows of 1% (swine) and 3% (beef) in Essex county to highs of 25% (swine) in Huron and 28% (beef) in Waterloo. It is interesting to note that a high number of farmers in Perth (19%) and Waterloo (19%) counties had swine farms. Huron (17%), Middlesex (17%), and Oxford (16%) counties exhibited the highest percentage of beef farmers excluding Waterloo county. The 6% of the farmers who had tobacco farms in the study area were concentrated in basically four counties: Haldimand-Norfolk - 30% Elgin - 24% Brant - 11% Oxford - 5% 13
20 The number of farmers surveyed in the remaining counties whose primary enterprise was tobacco, was negligible. Table 2 provides the percentage of farm enterprises in each county in the study area. Appendix B provides graphical representations of these data. TABLE 2: The Nature Of Farm Enterprises In The Study Area COUNTY Beef Cashcrop Dairy Hort. Poultry Swine Tobacco Brant Elgin Essex Hald-Nor Huron Kent Lambton Middlesex Oxford Perth Waterloo All The primary enterprise as indicated by the percentage of farmers in the study area. 14
21 A good soil management program can help control soil and water as well as wind erosion problems. Such a program utilizes conservation practices involving cropping and tillage management as well as implementing special drainage control practices where necessary. Not all erosion control practices will fit into every farm management scheme. If, however, a problem exists, the adoption of one or more of the available control measures can remedy the situation. The choice of any conservation practices should be appropriate to the problem and also economically practical. According to Moore, Ketcheson, and Fish (1982), the following factors are involved in effective erosion control: a) maintaining good soil structure; b) protecting the soil surface by adequate crop and residue cover; and c) using special erosion control practices where necessary. Maintaining the soil structure and protecting the soil surface can be achieved by proper cropping and tillage practices. Specific crops such as forage actually improve soil structure as does optimum tillage practices. Special practices including grassed waterways, drop structures, tile outlet protection, and buffers provide solutions to specific land management problems. For the purpose of this questionnaire, conservation practices were generalized into three categories as follows: cropping, tillage, and drainage practices. The following discussion considers each of these three categories of soil and water conservation control. 15
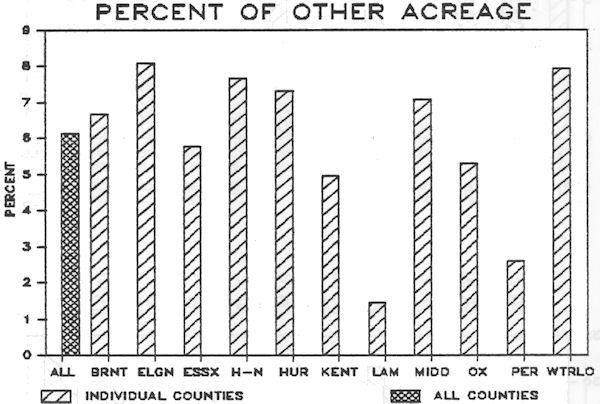
22 4.1 CROPPING PRACTICES CROPS GROWN The type of crop grown and how it is managed will influence the productivity and erosion potential of the land. Fallow land. for example, has the highest erosion potential of any cropping system. Conversely, forage provides a good vegetative cover that will protect the soil from erosion by dissipating the energy of wind and water as well as promoting good soil structure. In order to determine crop distribution in Southern Ontario, farmers were asked to state the crops grown on their land and the acreage of each. The percent of crop acreage is calculated on the sum of the crop acreage for each county. Crops of significant acreage to be included were corn, wheat, cereal, soybean, tobacco and forage. Corn was the crop grown most extensively in all the counties (37%), followed by forage (20%), beans (15%), wheat (10%), cereal (10%), and tobacco (2%) (Table 3). In the counties of Oxford, Brant, Kent, and Middlesex, corn constitutes approximately half of the total crop acreage for each county (Table 3). Values range from a high of 51% in Oxford to a low of 17% in Essex. Although 20% of the total crop acreage in the study area was forage, the county distribution varied considerably. Values ranged from a low of 1% in Essex to a high of 34% in Waterloo county. Haldimand-Norfolk county also had a noticeably high percentage of forage acreage (32%). Another crop of significance was beans (15%). Again, this value fluctuated from a low of 1% in Waterloo to a high of 50% in Essex. Lambton also contained a substantial percentage (40%) of bean acres. The remaining crops of wheat, cereal, and tobacco had a crop percentage of 10% 16
23 TABLE 3: The Percentage Of Cropland In The Study Area COUNTY Corn Wheat Cereal Beans Forage Tobacco Other Brant Elgin Essex Hald-Nor Huron Kent Lambton Middlesex Oxford Perth Waterloo All
24 10%, and 2%, respectively. Essex had the highest percentage of wheat acreage (25%), followed by Lambton county with 18% of the crop acreage recorded in wheat. The counties of Perth and Waterloo had respective values of 20% and 21% of their crop acreage in cereal. Table 3 provides the recorded crop acreages and the resultant percentage of each crop grown in the eleven counties. Appendix B graphically illustrates the crop distribution in the study area CROP ROTATION A crop rotation including cereals and forages, is often essential for maintaining soil structure and yields. Although rotating row crops is preferable to continuous cropping, it is not as effective at controlling erosion as is a rotation including forages. Winter cereals and forage crops provide vegetative cover during winter and early spring runoff thereby assisting in erosion control during this period of typically high runoff. In addition, a good crop rotation reduces the buildup of insect and disease problems associated with continuous cropping. This management scheme may not be practical for all farmers if a market does not exist for alternate crops of forage or cereal. The five types of rotations recorded are: 1) row crops; 2) row crops and cereals; 3) row crops, cereal, and forage; 4) row crops and forage; 5) cereal and forage. 18
25 Survey results (Table 4) indicate that approximately 75% of the farmers practice rotations of row crops with cereal and forage. More specifically, about 40% rotate row crops and cereals, and 33% rotate row crops, cereals, and forage. TABLE 4: Crop Rotations In The Study Area COUNTY ROTATIONS (%): 1 a 2 b 3 c 4 # 5 Brant Elgin Essex Hald-Nor Huron Kent Lambton Middlesex Oxford Perth Waterloo All Expressed as the percentage of farmers in each county practicing each type of rotation. a b c # Rotation 1 - Row Crops Rotation 2 - Row Crops and Cereals Rotation 3 - Row Crops, Cereal, and Forage Rotation 4 - Row Crops and Forage Rotation 5 - Cereal and Forage 19
26 Approximately 8% of the interviewed farmers grow row crops continuously, followed by 6% rotating just row crops and forage, and only 3% with a rotation of cereal and forage. The primary rotation of row crops and cereals (rotation two in Table 4) was predominant in Essex county. Here, 75% of the farmers surveyed practiced this rotation of row crops and cereals. In Lambton and Kent, 65% and 53% of the farmers favoured this rotation. Considerably few farmers in Waterloo county practiced this rotation (7%). Instead, rotation 3 of row crops, cereals, and forage was the principal rotation as it was practiced by 66% of the farmers. Perth was a close second with 57%, followed by Huron and Oxford with 46% and 45%, respectively. Values for the remaining seven counties ranged from 37% in Haldimand-Norfolk to only 5% in Kent. Surprisingly, continuous row cropping (rotation 1)was relatively scarce in the study area. On average, only 8% of these farmers practice this type of rotation. Kent and Elgin counties were considerably higher than this average with values of 26% and 15%, respectively. In the remaining counties, less than 10% of the farmers in each employed this rotation. Table 4 provides the percentage of farmers in each county practicing each of the five rotations. Graphs illustrating the distribution of this cropping practice in the study area are found in Appendix C WINTER COVER CROP During the winter months many agricultural fields are left bare, subject to the winter 20
27 elements of the temperate climate of Southern Ontario. Severe erosion has been associated with runoff events and freeze-thaw phenomenon in soils during this period. A vegetative cover over winter can provide soil protection during this critical period. Crops such as winter wheat or winter rye can provide erosion control by providing a protective cover. The percentage of farmers in Southern Ontario employing a winter cover crop was quite high (45%) (Table 5). In the counties of Perth, Haldimand-Norfolk, and Brant, over three-quarters of the farmers practiced winter cover cropping (86%, 80%, and 76%, respectively). Lambton had an unusually low percentage (1%) of winter cover crop in comparison to the other counties in the region. Table 5 provides values for all eleven counties, and Appendix C contains a graph illustrating the percentage of winter cover crop acreages in Southern Ontario STRIP CROPPING Strip cropping is a method used to control erosion on long, smooth slopes. When compared to up-down cropping, strip cropping across the slope has been reported to reduce soil losses by as much as 60% (Moore, Ketcheson, and Fish, 1982). According to the survey results, only 6 percent of the farmers in Southern Ontario practice strip cropping (Table 5). The counties with the greatest amount of farmer participation are Elgin (14%), Haldimand-Norfolk (14%), and Oxford (13%). Again, the percentage of strip cropped acres in Lambton county were negligible. Values for all eleven counties are found in Table 5 and graphically illustrated in Appendix C. 21
28 TABLE 5: Cropping Practices In The Study Area COUNTY Winter Cover Crop % Strip Cropping % Cross Slope % Clover Plowdown % Brant Elgin Essex 24 1 <1 19 Hald-Nor Huron Kent Lambton 1 <1 <1 33 Middlesex Oxford Perth Waterloo All Expressed as the percentage of farmers employing these practices. Percentages for each county do not sum to 100% because a farmer may employ more than one practice on his property. 22
29 4.1.5 CROSS SLOPE CROPPING Cross slope cropping is the practice of farming perpendicular to the slope. Instead of up-down slope cropping. farming the crop across the slope can reduce soil loss by 25% (Moore et al, 1982). Only 5% of the farmers in Southern Ontario employ cross-slope farming. Oxford, with 11% of the farmers cross-slope cropping, had the highest percentage. Values for Lambton, Essex, Kent, and Haldimand-Norfolk were negligible but could reflect the lack of slope gradient in these areas. Table 5 includes all values and is graphically represented in Appendix C CLOVER PLOWDOWN Clover is frequently seeded with a companion grain crop because it is more tolerant to competition than other legumes. Early spring seeding is preferred to summer or fall seeding because it enables early removal of the companion crop, thereby reducing competition and preparing the clover for fall plowdown. Although it can have a first, second, and even third cut, it is recommended that the crop be plowed the year following seeding. From a soil conservation viewpoint, the establishment and growth of clover is quite beneficial. Because nitrogen fixation is a function of the clover's root nodules,a great deal of nitrogen is added to the soil during fall plowdown for the succeeding crops. In the study area 37% of the farmers practice clover plowdown (Table 5). Just less than half the farmers in Perth, Brant, and Haldimand-Norfolk (45%, 42%, and 42%, respectively) employ a clover plowdown. The remaining eight counties ranged from a low of 19% in Essex county to a high of 37% in Huron county. County distributions of each of 23
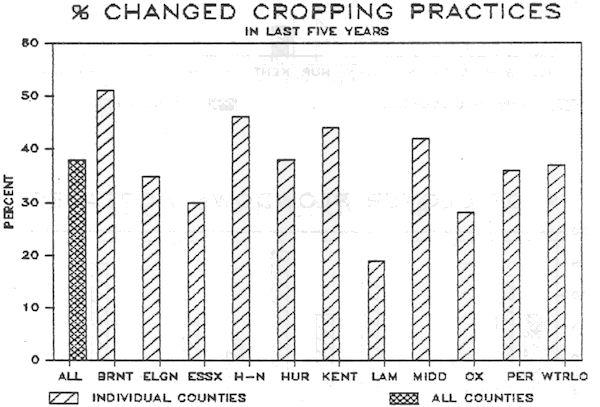
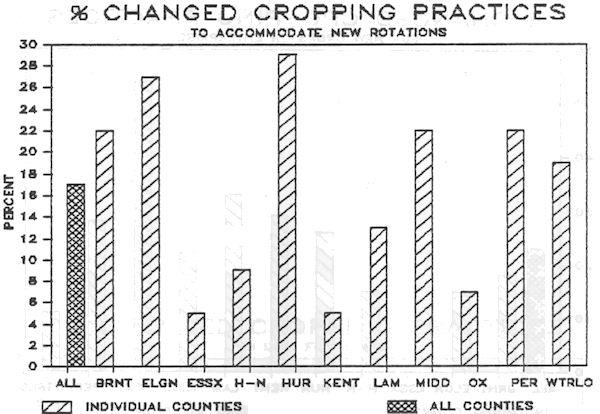
30 these practices are graphically presented in Appendix C CHANGES Understanding why farmers have changed soil and crop management practices in the past may aid conservationists and soil and crop specialists in their attempt to encourage farmers-towards better land management. Survey results (Table 6) indicate that 38% of the farmers changed cropping practices in the past five years. The distribution of those who had changed varied throughout the study area. Approximately 51% of these farmers who changed were in Brant county, 46% in Haldimand-Norfolk, and 44% in Kent. Values for the remaining counties ranged from 19% in Lambton to 42% in Middlesex. Farmers who stated that they had changed cropping practices in the last five years listed several reasons why as follows: 1) stop erosion; 2) improved yields; 3) poor soil structure (compaction, organic material, internal drainage); 4) more plowdown; 5) changed crops/enterprise/landbase; 6) reduce tillage; 7) economic reasons; 8) more rotation; 9) changed fertilizer, herbicide or pesticide usage. The main reasons for changing were economics (7), and the fact that the farmer had changed to new crops or a new enterprise (5) (Table 6). 24
31 TABLE 6: Reasons For Changing Cropping Practices COUNTY % of Farmers Who Changed REASONS (%): 1 a 2 b 3 c 4 d 5 e 6 f 7 g 8 h 9 Brant Elgin Essex Hald-Nor Huron Kent Lambton Middlesex Oxford Perth Waterloo All < a b c d e f g h Reason 1 - Stop erosion; Reason 2 - Improve yields; Reason 3 - Poor soil structure - compaction, O.M., internal drainage; Reason 4 - More plowdown; Reason 5 - Changed to new crops/enterprise/land base; Reason 6 - Reduced tillage; Reason 7 - Economic reasons; Reason 8 - More rotation; Reason 9 - Changed fertilizer, herbicide, or pesticide usage. NOTE : The values for each reason were calculated by the percentage of farmers for each county who changed cropping practices. 25
32 The percentages in each county for each change were calculated by the percentage of farmers in each county who stated that they had changed cropping practices. For example, a total of 38% of the farmers in the study area changed cropping practices in the past five years. Approximately 51% of the farmers in Brant county stated that they had changed cropping practices. According to Table 6, 8% of the farmers who changed practices in Brant county did so for economic reasons. About 23% of the farmers in the study area stated that they had changed for new crops or enterprises. Farmers in every county except Essex gave this as a reason. Excluding Essex, values ranged from 11% in Waterloo to 33% in Lambton. The highest value was in Oxford where 54% of the 23% who did change, changed for this reason. A total of 22% of the farmers surveyed changed cropping practices for economic reasons. In Haldimand-Norfolk, approximately 46% of the people who had changed gave this reason. Regional values ranged from a low of 8% in Brant county to a high of 35% in Elgin, excluding Haldimand-Norfolk. 26
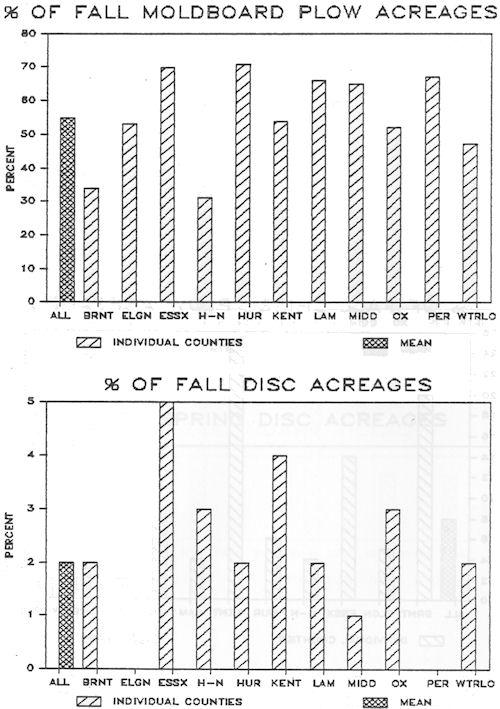
33 4.2 TILLAGE PRACTICES The purpose of a soil conservation tillage program is to leave the soil surface roughened and with as much residue on it as is practical to reduce soil erosion potential and promote soil tilth. Conditions such as these enhance infiltration, reduce runoff, promote soil structure, and minimize soil loss. Another major benefit of conservation tillage is cost and time savings. Adoption of good tillage techniques on most farms results in lower costs for equipment, labour, and fuel because of the reduced number of trips over the field PRIMARY TILLAGE Moldboard plow tillage is still the most common practice in the eleven counties surveyed. This is the use of a moldboard plow in the fall and spring for seedbed preparation. On average, 55% of the total recorded farm acreage in Southern Ontario is fall moldboard plowed (Table 7). Huron and Essex counties have the highest percentage of farmland in fall moldboard plow tillage (71% and 70%, respectively). The county with the least moldboard plowing is Haldimand-Norfolk where only 31% of the farmland is moldboard plowed in the fall. The other primary tillage machines listed in Table 7 are considered once-over erosion control tools and include the chisel plow, off-set discs or heavy tandem discs, and the no-till planter. All have distinct advantages and disadvantages, and therefore must be practically assessed for each situation. Approximately, 9% of the farmland surveyed is chisel plowed in the fall and only 27
34 TABLE 7: Primary Tillage Practices In The Study Area FALL SPRING COUNTY MP a CP b D c NT d MP a CP b D c NT d Brant Elgin Essex Hald-Nor Huron Kent Lambton Middlesex Oxford Perth Waterloo Mean Expressed as a percentage of the total recorded acres in each county. Percentages may not sum to 100% because farmers may employ more than one tillage practice. a b c d MP CP D NT - Moldboard Plow - Chisel Plow - Disc - No Till 28
35 one percent in the spring. However, in the fall most values are either well above or below the mean. In the counties of Kent, Brant, and Essex the percent of farmland chisel plowed was 25%, 20%, and 14%, respectively. Values for the remaining counties were less than 8%. The chisel plow is considered effective on erodible, sloping soils and leaves approximately % of the residue on the surface. The chisel plow was seldom used in the spring as a method of primary tillage. No-till planters and primary disc tillage were virtually nonexistent in the eleven counties surveyed. The few acres tilled by these methods are given in Table 7. The greatest amount of disced farmland was 7% in the spring in Essex county SECONDARY TILLAGE A variety of secondary tillage methods are employed in the study area during the spring. On average, less than two percent of the eleven counties surveyed utilized secondary tillage practices in the fall. In the spring, 33% of the study area is disced, 39% is field cultivated, and 26% is spring tooth cultivated (Table 8). The counties with the highest percentage of farmland being tilled by these three methods are Brant (53% disced), Lambton (61% field cultivated), and Essex (63% spring tooth cultivated). Almost half of the farmland surveyed in both Elgin and Essex is disced in the spring (47% and 46%). In Brant, Elgin, and Essex counties 53%, 47%, and 46% of the recorded farm acreage is disced in the spring. The remaining percentage of disced land ranged from a high of 38% in Oxford, to a low of 17% in Perth. In addition, close to half of Huron and Perth counties are field cultivated in the spring (52% and 46%). Values ranged from these highs to a low of 32% in Essex County. 29
36 TABLE 8: Secondary Tillage Practices In The Study Area FALL SPRING COUNTY D a FC b STC c DH d CM e CP f D a FC b STC c DH d CM e CP f Brant Elgin Essex Hald-Nor Huron Kent Lambton Middlesex Oxford Perth Waterloo Mean 2 2 <1 <1 <1 < Expressed as a percentage of total farm acreage. Percentages do not sum to 100% for each county because a farmer may employ more than one practice. a b c d e f D FC STC DH CM CP - Disc - Field Cultivator - Spring Tooth Cultivator - Drag Harrows - Cultimulcher - Cultipacker 30
37 Substantially lower values of 16% and 17% were recorded in Oxford and Haldimand-Norfolk counties, respectively. Although 26% of the study area is spring tooth cultivated, this value is not representative of most counties. This secondary tillage practice appears to be concentrated in the counties of Essex, Oxford, and Kent (63%, 38%, and 46%), while in the counties of Lambton, Brant, and Waterloo its use is relatively less (5%, 11%, and 12% respectively). Close to 16% of the total recorded farmland is drag harrowed. This secondary tillage practice is concentrated in the counties of Huron (31%), Oxford (32%), and Perth (31%). The lowest values for this practice are 3% in Haldimand-Norfolk and 6% in Kent county. According to the survey, 34% of the farmland recorded in Essex county is cultimulched in the spring. This value is much higher than the average value of 5% of the total recorded farm acreage in the study area being cultimulched. Table 8 lists the percentage of total farm acres in each county practicing each of the secondary tillage methods. Appendix D provides the graphical distribution of these practices in the study area CHANGES Approximately, 31% of the farmers surveyed have changed tillage practices in the last five years (Table 9). The majority of these people came from the counties of Brant (46%), Haldimand-Norfolk (36%), Kent (47%), and Middlesex (40%). However, the remaining counties also contributed. At least 18% of the farmers in each county had 31
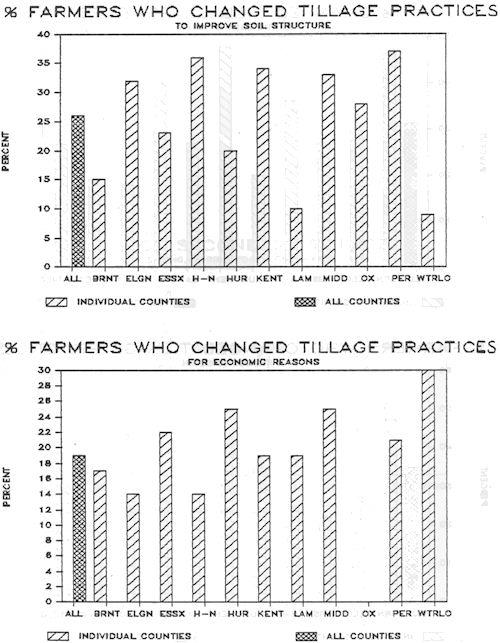
38 TABLE 9: Reasons For Changing Tillage Practices In The Past Five Years COUNTY Farmers Who Have Changed REASONS (%): 1 a 2 b 3 c 4 d 5 e Brant Elgin Essex Hald-Nor Huron Kent Lambton Middlesex Oxford Perth Waterloo All Expressed as a percentage of people who have changed practices. a b c d e Reason 1 Reason 2 Reason 3 Reason 4 Reason 5 - Reduce erosion - more surface residue, - Maintain or build soil structure, - Reduce production costs - fuel, number of passes, - Improve yields, - Change crops/equipment. 32
39 changed tillage practices. Before any farming practices can be altered it is essential to understand why a farmer employs certain methods. The farmers in the study area who have changed tillage practices in the past five years gave several reasons as follows: 1) to reduce erosion by leaving more surface residue; 2) to maintain or build soil structure; 3) to reduce production costs, ie. use less fuel by decreasing the number of passes; 4) to improve yields; 5) have changed crops and consequently equipment. The primary reasons for changing were to reduce erosion (reason 1), to improve soil structure (reason 2), and because of economics (reason 3). Approximately 35% of the 31% who changed, did so to reduce erosion (Table 9). In Brant, 52% of the farmers who changed gave this as a reason. High percentages of farmers gave this reason in the counties of Oxford (50%), Kent (43%), and Waterloo (39%). The lowest value was in Perth where only 16% of the farmers who had changed tillage practices gave erosion reduction as a primary reason for doing so. About 26% of the farmers who had changed practices stated that they did so to improve the soil structure. This was a popular response in the counties of Perth (37%), Haldimand-Norfolk (36%), Kent (34%), Middlesex (33%), Oxford (28%), and Perth (37%). Only 9% in Waterloo and 10% in Lambton changed tillage practices for this reason. Values for the remaining counties can be found in Table 9. Appendix D contains graphs illustrating data in this table. 33
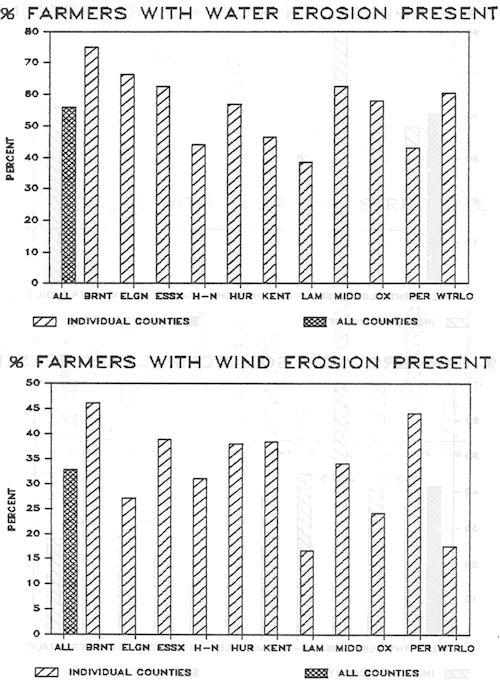
40 4.3 SOIL AND WATER CONSERVATION MEASURES Although cropping and tillage practices help to control erosion, some problems require more specialized land management practices. Uncontrolled runoff can create major water and ditch bank erosion problems which demand long-term solutions such as grassed waterways, drop structures, tile outlet protection, buffers and other water erosion control measures. If precautions are not taken to control surface and subsurface runoff the end result may create serious on-site soil loss and off-site water quality problems WATER AND WIND EROSION Soil erosion by water or wind removes the most important portion of the surface soil needed for agricultural production (Switzer-Howse, 1982). In cultivated fields the rate of erosion can often exceed the rate of soil formation. The erosion potential varies from field to field and is affected by the soil type, plant cover, topographic features, rainfall and snowmelt runoff. Both wind and water can effectively transport valuable sediment away from the site. Often soil erosion goes undetected because transport methods such as sheet erosion occur uniformly over the slope at rates that may be difficult to recognize in any single year. During periods of minimum soil protective vegetation (late fall to early spring) the soil is exposed to the energy of falling rain and runoff which initiates soil movement. Rills and gullies (the products of concentrated flow) form at these times, enhancing the rate and amount of sediment transport. According to the survey results, farmers in the study area are aware of wind and water erosion on their properties. About 56% stated that water erosion was present on 34
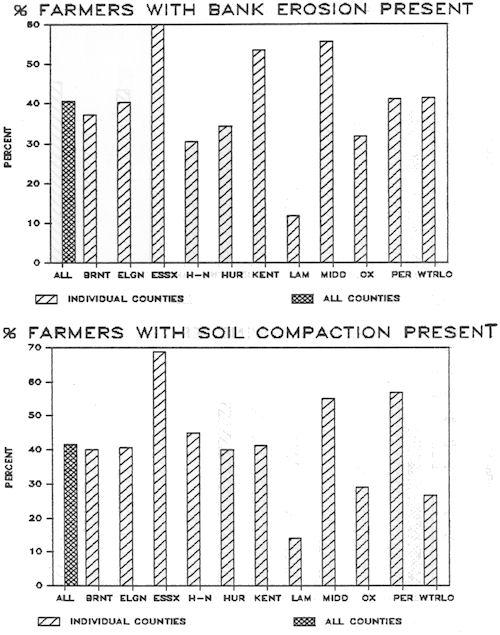
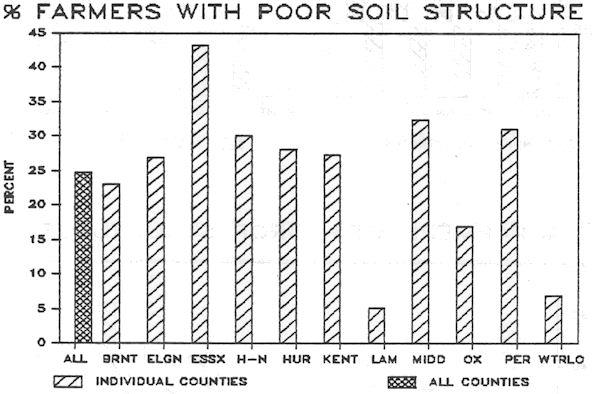
41 their farms (Table 10).Three-quarters of the farmers surveyed in Brant county observed water erosion on their farms. There was also high recognition of water erosion in Elgin (66%), Essex (63%), Middlesex (60%), and Waterloo (60%). These values indicate both a potentially severe erosion problem and a high degree of farmer awareness. As indicated in Table 10, approximately 33% of the farmers in the study area observed wind erosion on their farmland. The counties indicating a high degree of wind erosion are Brant (46%), Perth (44%), Huron (38%), and Kent (38%). Farmers perceived wind erosion to be less of a problem in Lambton and Waterloo counties where only 17% of the farmers in each county observed this type of erosion. Another form of soil loss is ditch bank or streambank erosion. Streams or open ditches without soil conserving protection risk sediment accumulations and associated water quality impairment. This type of problem is often not dealt with until serious damage is done. In the eleven counties surveyed, 41% of the farmers observed ditch bank erosion on their farmland (Table 10). Most values ranged from a low of 31% in Haldimand-Norfolk, to a high of 60% in Essex. Lambton was unusually low as only 12% of the farmers surveyed observed ditch bank erosion on their property. It is apparent that most farmers perceive ditch bank erosion as a fairly serious problem SOIL COMPACTION AND POOR SOIL STRUCTURE The presence of soil compaction and poor soil structure is often more difficult to detect than erosion. Usually severe damage occurs prior to identification of the problem. The percentage of farmers observing these problems in the eleven counties varied from 35
42 TABLE 10: Potential Soil And Water Problems In The Study Area COUNTY Water Erosion Wind Erosion Ditch Bank Erosion Soil Compaction Poor Soil Structure Brant Elgin Essex Hald-Nor Huron Kent Lambton Middlesex Oxford Perth Waterloo All Expressed as the percentage of farmers who observed these problems on their property. 36
43 county to county. Forty-two percent of the farmers observed soil compaction and 25% were aware of poor soil structure (Table 10). However, the degree of awareness fluctuated from a low of 14% soil compaction in Lambton to a high of 69% in Essex. Only 5% of the farmers in Lambton observed poor soil structure while 43% of the farmers in Essex were aware of poor soil structure. Values for the other nine counties fall between these two extremes and are listed in Table 10. Appendix E contains graphical descriptions of this table LAND MANAGEMENT PRACTICES Improved cropping and tillage practices are sometimes not enough to protect soil and water quality. Special support measures may need to be adapted to the farm conservation scheme. Good surface and subsurface drainage can be achieved most efficiently by implementing good soil management techniques in combination with water management techniques such as grassed waterways, drop structures, tile drainage, tile outlet protection, gully control and grass buffers adjacent to waterways. The design and construction of these water management systems will be different for each site, requiring qualified assistance and consultation before implementation. This will minimize costs by ensuring that the appropriate support system is installed. Many of these land management practices have been put into effect in Southwestern Ontario. The percentages of farmers in each county employing these conservation practices are listed in Table 11. Approximately 23% of the total farmers surveyed have grassed waterways. However, the distribution of these grassed waterways throughout the eleven counties varies considerably from county to county. 37
44 TABLE 11: Land Management Practices In The Study Area COUNTY Grass Waterway Drop Structure Tile Outlet Protection Gully Control Cattle Access Brant Elgin Essex Hald-Nor Huron Kent Lambton Middlesex Oxford Perth Waterloo All Expressed as the percentage of farmers in each county employing these conservation practices. Percentages for each county may not sum to 100; because farmers may employ more than one practice. 38
45 Utilization of this practice ranged from lows of one percent and five percent in Kent and Lambton counties to highs of 39% and 43% in Brant and Elgin, respectively. The values between these limits are listed in Table 11. About 26% of the farmers surveyed had drop structures. However, this value does not describe the degree of variation between counties. The two extremes ranged from a high of over half the farmers in Perth county (52%), to a low of approximately zero in Waterloo county. It should be noted that Essex, Middlesex, and Oxford all had a high number of farmers employing drop structures (34%, 42%, and 45%, respectively). Evidently farmers perceive tile outlet protection to be an important land management measure as 55% of the farmers surveyed employ this practice (Table 11). Again, there was a considerable range of values from 22% in Lambton county to a high of 88% in Perth. Counties where over half the farmers utilize tile outlet protection were Huron (57%), Kent (78%), Middlesex (67%) and Perth (88%). The counties of Brant, Oxford, and Waterloo all had 49% utilization. Gully controls and cattle access ways were of less significance as land management measures. Approximately 18% of the farmers reported gully controls and 23% had cattle accesses, as recorded in Table 11. In Lambton only 4% of the farmers had gully control structures, but in Elgin 38% were using them. Other counties worth noting were Perth (32%), Oxford (23%), and Middlesex (23%). Another land management practice employed in the study area is controlled cattle access ways to water courses. Approximately 23% percent of the farmers in the eleven counties have controlled cattle access ways (Table 11). Perth has an unusually high number of farmers with cattle accesses (79%), as compared to the lower end of the range, 39
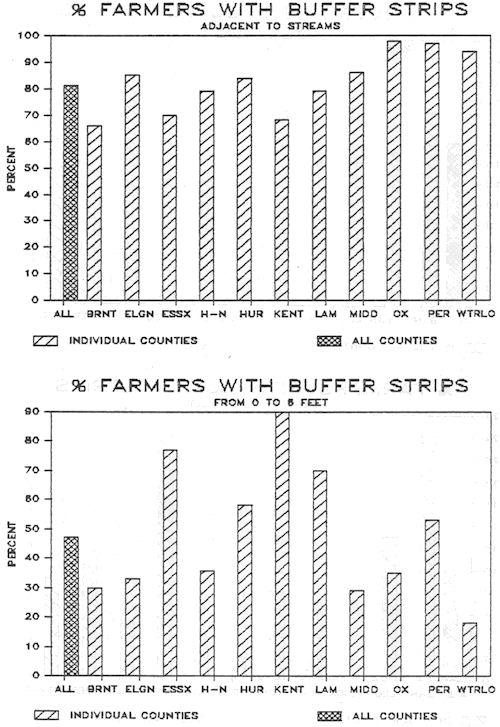
46 ie. 7% in Lambton and 9% in Kent. Complete sets of values for these land management practices are provided in Table 11. Graphical representations of the county distributions are in Appendix E. BUFFER STRIPS A vegetated area (buffer strip) beside a watercourse can reduce runoff velocity, prevent erosion and trap sediment before it reaches the stream, thereby protecting water quality (Switzer-Howse, 1982). The effectiveness of a buffer strip depends on width, volume of runoff, type and condition of vegetation. Widths vary depending on the soil type, vegetation, topography, and drainage area of a site. Farmers in the study area were asked to state if streams and buffer strips were present on their properties. According to survey results reported in Table 12, 81% of the total farmers surveyed implemented this practice. The reported width of the buffer strips were as follows (see Table 12): - 47% of these buffers were 0-6 feet wide, - 16% were 7-14 feet wide, - 10% were feet wide, - 4% were feet wide, - 3% were feet wide, and - 17% were greater than 100 feet wide (pasture, forest, swamp). The wider the buffer, the more effective it is for soil and water conservation control. However, wide buffer strips are not always practical for the farmer. 40
47 TABLE 12: Percentage Of Farmers With Stream Buffer Strips In The Study Area COUNTY # Of Farmers % Of Farmers With Buffer Strip Widths (Feet): With Streams With Buffers >100 Brant Elgin Essex Hald-Nor Huron Kent Lambton Middlesex Oxford Perth Waterloo All The percentages of farmers with different buffer strip widths for each county may not necessarily sum to 100%. This is because not all farmers with buffer strips stated a width. 41
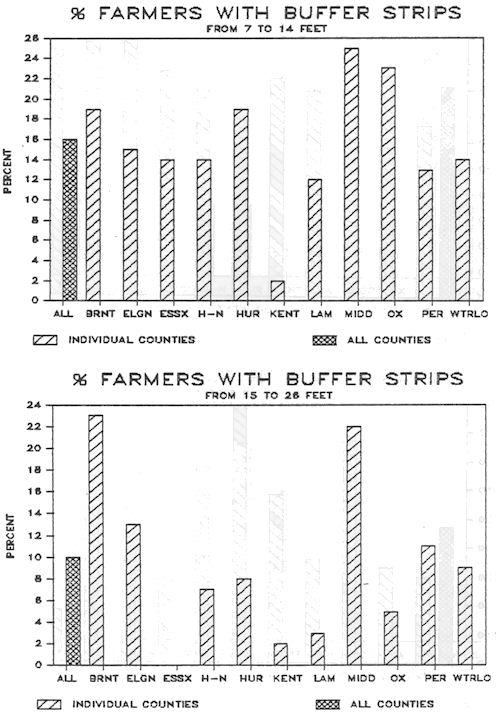
48 The majority of farmers favoured buffers of a width between zero and six feet. Values for buffers (0-6 ft) ranged from highs of 90%, 77%, and 70% in Kent, Essex, and Lambton, respectively, to a low of 18% in Waterloo. The next width category of 7-14 feet was popular in every county except Kent. Excluding Kent county, the values range from 12% in Lambton to 25% in Middlesex. In Kent county only 2% of the farmers have buffer strips of this width. Surprisingly, 17% of the farmers surveyed had buffer strips greater than 100 feet. However, this is explained by the inclusion of pasture, forest, and swamp, in this category. The counties with a high percentage of these buffers were Haldimand-Norfolk, Brant and Waterloo with 27%, 28% and 36%, respectively. Each of the remaining three categories (15-26 feet, feet, and feet) had less than 10% of farmers with buffer strips. A few observations of interest are the highs of 23% and 22% in Brant and Middlesex counties in the 15 to 26 feet category, and the highs of 10% in Elgin county in both the 27 to 49 feet category and the 50 to 100 feet category. Table 12 provides the percentage of farmers with streams and buffer strips in Southern Ontario. It also includes the percentage of buffer strips in each width category. Appendix E contains graphs illustrating this table CHANGES This soil management survey provided information about cropping, tillage, and land management practices in eleven counties in Southern Ontario. Although these farmers appear to be aware of existing and potential soil and water problems, less than half of the 42
49 farmers surveyed (44%) wanted to adopt new or additional soil management practices (Table 13). The percentage of farmers in each county intending to adopt ranged from a low of 29% in Oxford to a high of 73% in Elgin. An unusually low value of farmers intending to adopt was recorded for Lambton county (13%). Most values were in the 40 to 50 percentile range. Practices that farmers did wish to adopt included the following: 1) conservation tillage, soil saver, chisel plow, ridge tillage, zero tillage; 2) reduced tillage depth/reduced number of passes; 3) structural erosion control (windbreaks, waterways etc.) 4) crop rotation;. 5) tile drainage; 6) legume plowdown; 7) cover cropping, surface residue management for erosion control; 8) soil testing; and 9) increased use of manure. About 34% of the farmers surveyed wanted to adopt better tillage practices which would include, conservation tillage, soil saver, chisel plow, ridge tillage, and zero tillage (Table 13). The second most popular management practice that farmers intend to adopt is crop rotation. Approximately 16% of the farmers surveyed wanted to adopt this cropping practice. This value is fairly representative of all eleven counties, although low percentages were recorded for Middlesex (2%) and Waterloo (6%) and relatively high values for Haldimand-Norfolk (29%) and Oxford (24%). As indicated in Table 13, approximately 13% of the farmers in the study area intending to adopt new management practices were interested in tile drainage systems. 43
50 TABLE 13: The Percentage Of Farmers Intending To Adopt Various Management Practices COUNTY % Of Farmers Intending To Adopt CT a RT b EC c CR d TD e L f CC g ST h M * Brant Elgin Essex Hald-Nor Huron Kent Lambton Middlesex Oxford Perth Waterloo All CT - Conservation tillage, ie. soil saver chisel plow, ridge tillage, zero tillage; RT - Reduced tillage depth/reduced number of passes; EC - Structural erosion control ( windbreaks, waterways, etc.); CR - Crop rotation; TD - Tile drainage; L - Legume; CC - Cover cropping, surface residue management for erosion control; ST - Soil testing; * M - Increased use of manure. a b c d e f g h 44
51 Also, 12% would like to employ various structural erosion controls, 10% want to incorporate legume plowdown, 5% want to reduce tillage depth and an additional 5% want to utilize a variety of conservation cropping practices for erosion control. The percentages of farmers in each county who intend to implement each of these practices are provided in Table 13. Appendix E contains graphical representations of this table. Although 44% of the farmers surveyed want to adopt several of these management practices, many will not for various reasons. Approximately 32% (Table 14) of the farmers gave the following eight reasons why they will not implement new measures: 1) lack of available knowledge, assistance or equipment; 2) lack of time; 3) poor economics, eg. no markets, lack of money; 4) no requirements for management practices on the farm or already in place; 5) existing physical restrictions, ie. soil drainage, stones, limited land base; 6) rented land; 7) unproven performance, ie. does not please the farmer. The primary reason appeared to be poor economics, as indicated by 44% of the farmers considering new practices. Either there are no markets available for the alternate crops included in conservation cropping practices, or a lack of money prevents farmers from investing in a new practice. In the eleven counties, the percentages of farmers who gave this reason ranged from only 5% in Brant to 63% in Essex (Table 14). Most values were in the forty percentile range. Besides economics, other major reasons for not adopting soil management practices were lack of time, available knowledge, assistance, and equipment. Approximately 16% of the farmers considering new practices stated reason 1, and 14% of these farmers stated 45
52 TABLE 14: Reasons For Not Adopting New Practices COUNTY % Of Farmers Considering New Practices REASONS (%): 1 a 2 b 3 c 4 d 5 e 6 f 7 g 8 h Brant Elgin Essex Hald-Nor Huron Kent Lambton Middlesex Oxford Perth Waterloo All Expressed as the percentage of farmers considering new practices and their reasons for not adopting them. a b c d e f g h Reason 1 - Lack of available knowledge, assistance and/or equipment; Reason 2 - Lack of time; Reason 3 - Poor economics, eg. no markets, lack of money; Reason 4 - No requirements for management practices on the farm or already in place; Reason 5 - Existing physical restrictions ie. soil drainage, stones, limited land base; Reason 6 - Rented land; Reason 7 - Perceived problems (insects, weeds, yield decline) Reason 8 - Unproven performance ie. does not satisfy farmer. 46
53 reason 2 as being their major deterrent (Table 14). The remaining reasons (4 to 8) were not as common (<10%) among the farmers surveyed. Table 14 describes the issue more completely and may be supplemented with the graphs in Appendix E. Those farmers who have adopted soil management practices utilized several sources of information: 1) personal experience and common knowledge; 2) farm media and meetings; 3) demonstrations; 4) Soil and Crop Improvement Association or OMAF; 5) neighbours, other farmers/family; 6) University of Guelph/colleges/experimental farms; 7) company representatives, ie. seed chemical, fertilizer and implement dealers; 8) farm organizations. Approximately 64% of the farmers surveyed utilized the preceding sources of information. Based on these farmers surveyed, results indicated that 38% regarded personal experience and common knowledge as their primary source. An additional 32% considered farm media and meetings to be their main source of information. Approximately 10% perceived the Soil and Crop Improvement Association and OMAF as their major sources. The aforementioned values are representative of the farmers in the study area who utilized these sources of information when considering and adopting soil management practices. A breakdown of the values according to county is provided in Table
54 TABLE 15: Sources Of Information Used By Farmers COUNTY % Of Farmers SOURCES (%): Utilizing Sources 1 a 2 b 3 c 4 d 5 e 6 f 7 g 8 h Brant Elgin Essex Hald-Nor Huron Kent Lambton Middlesex Oxford Perth Waterloo All < <1 Expressed as the percentage of farmers who utilized each source of information. a b c d e f g h Source 1 - Personal experience and common knowledge; Source 2 - Farm media and meetings; Source 3 - Demonstrations; Source 4 - Soil and Crop Improvement Association and OMAF; Source 5 - Neighbours, other farmers and/or family; Source 6 - University of Guelph/Colleges/Experimental Farms; Source 7 - Company representatives (seed, chemical, fertilizer and/or implement dealers; Source 8 - Farm organizations. 48
55 5.0 BIBLIOGRAPHY Arnold, J.B., Wall, G.J., Moore, N.. Baldwin, C.S. January Soil Erosion Causes and Effects. Ministry of Agriculture and Food Factsheet. Federal/Provincial Phosphorus Task Force. April Proposed Canadian Federal/Provincial Phosphorus Load Reduction Plan for the Great Lakes. Prepared for submission to the International Joint Commission. International Joint Commission, 1978.Eutrophication of the Great Lakes Environmental Management Strategy for the Great Lakes System. PLUARG Final Report to the IJC, Windsor, Ontario. Magleby, R., Gadsby, D., Colacicco, D., and Thigpen, J Trends in Conservation Tillage Use. Journal of Soil and Water Conservation Vol.40 Number 3 pp Ministry of Natural Resources, Ontario Ministry of Agriculture and Food, Ministry of the Environment Practical Guide for Agricultural Erosion Control. Moore, Ketcheson, and Fish. Reprinted July Control of Soil Erosion. Ministry of Agriculture and Food Factsheet. Switzer-Howse, K.D Agricultural Management Practices For Improved Water Quality in the Canadian Great Lakes Basin. Research Branch, Agriculture Canada. 49
56
57 APPENDIX A Questionnaire and Instructions 50
58
59 51
60 INSTRUCTIONS FOR QUESTIONNAIRE 1. Name of farm owner and mailing address of the home farm. 2. The total number of farm acres, and the total number of crop acres, excluding woodlots and unimproved pasture. 3. List in order of importance, the farm enterprises. eg. cash crops-hogs-hort. etc. 4. Percentages of the dominant soil textures. Soil names reported if known, as per soil survey reports of respective counties. NOTE: In order to simplify the process of filling out this form, the remainder of the questionnaire with respect to Cropping, Tillage, and Drainage Practices, applies only to the first 100 acres of farmland adjacent to the main farm buildings. If more than 100 acres are farmed and different cropping, tillage and drainage practices are employed, a second sheet may be filled out for another 100 acres of the farm. Otherwise a single sheet is required. 5. (a) Print in name of crop. (b) Approximate number of acres of this crop on the first 100 acres of farmland. (c) gentle slope -<5%, suitable for all crops. moderate slope %, some limitations for row crops. steep slope - >10%, few row crops. (d) under Tiled, fill in number of acres. e.g. Crops. Total Acreage : # Acres Tiled Gentle Slope: Moderate Slope: Steep Slope. 6. Print in all crop rotations. eg. corn, corn, corn, hay, hay. 7. Definitions: (a) Winter Cover Crop - crops providing vegetative cover for fields usually left bare over winter. eg. winter rye. (b) Strip Cropping - series of alternating strips of crops. eg. forage, cereal or row crops. (c) Cross Slope Farming - sloping fields are worked and planted across the slope. (d) Clover Plowdown - red clover grown by itself or as a companion to a row crop for the purpose of soil protection and ultimate soil incorporation. 8. Check appropriate box. 9. Fill in the blank. eg. declining yield of row crops. 52
61 10. More than one implement may be used, therefore fill in all information for each type. Depth - fill in number in inches. # of Acres Fall/Spring - Print in number of acres for each. # of Passes - number of trips over field. 11. Same as above 12. Check appropriate box. 13. Fill in blank, eg. changed plowing methods for energy conservation and increasing crop residue. 14. Definitions: (a) grassed waterways - vegetated channels designed to accumulate and carry water runoff from open fields to a drainage outlet. (b) drop structures - diverts surface water flow underground through a tile to an outlet. (c) tile outlet protection - stabilizing soils surrounding tile outlets to drainage ways with rip-rap. (d) gully control - any conservation practice to reduce the spreading of gullies. (e) controlled access of livestock to streams - construction of fences and prefabricated cement structures to minimize cattle access to streambanks and water. 15. Check box(es) and report width in feet. 16. Check relevant box(es). 17. Fill in the blanks. 18. Fill in the blank. eg. conservation authorities, neighbours/friends, etc. 53
62
63 APPENDIX B Selected Results 54
64
65 55
66 56
67 57
68
69 APPENDIX C Cropping Practices 58
70
71 59
72 60
73 61
74 62
75 63
76 64
77 65
78 66
79 67
80 68
81 69
82 70
83 APPENDIX D Tillage Practices 71
84
85 72
86 73
87 74
88 75
89 76
90 77
91 78
92 79
93 APPENDIX E Soil and Water Conservation Measures 80
94
95 81
96 82
97 83
98 84
99 85
100 86
101 87
102 88
Degradation of the resource Fertility loss Organic matter Tilth degradation. Water quality Sediment Nutrients
 Near Blue River ca. 1980 Degradation of the resource Fertility loss Organic matter Tilth degradation Water quality Sediment Nutrients Program cost Cheaper to prevent Still expensive Long-term productivity
Grassed Waterway Improvement and Gully Restoration
 Revised April 2007 Agdex 573-5 Grassed Waterway Improvement and Gully Restoration Each year, tonnes of topsoil are eroded from localized areas on some Alberta farms. This loss is serious for several reasons:
Animal, Plant & Soil Science. D2-4 Conservation Tillage Practices
 Animal, Plant & Soil Science D2-4 Conservation Tillage Practices Interest Approach Ask students what challenges the first farmers faced as colonists moved across North America. Some of the challenges involved
Unit E: Basic Principles of Soil Science. Lesson 8: Employing Conservation Tillage Practices
 Unit E: Basic Principles of Soil Science Lesson 8: Employing Conservation Tillage Practices 1 Terms Conservation tillage Continuous cropping Conventional tillage Crop rotation Double cropping Organic farming
AGRICULTURAL & APPLIED ECONOMICS
 University of Wisconsin-Madison February 2001 Staff Paper No. 439 A Study of Costs of Compliance Related to Non-Point Pollution: Rules for Wisconsin Crop Producers By T. Randall Fortenbery AGRICULTURAL
Conservation Practices. Conservation Choices. These five icons will show the benefits each practice offers... 6/4/2014
 Conservation Choices Your guide to conservation and environmental farming practices. Conservation Choices These five icons will show the benefits each practice offers... The practice reduces soil erosion
Watercourses and Wetlands and Agricultural Activities
 Watercourses and Wetlands and Agricultural Activities Watercourses and regulated wetlands can be found throughout New Brunswick, including on agricultural lands. The Clean Water Act defines a watercourse
Conservation Practices for Landlords There is growing concern over the possible
 Conservation Practices for Landlords There is growing concern over the possible impact of rented land on soil conservation. Concerns regarding conservation practices are not new; however, the recent increase
MANURE MANAGEMENT IMPACTS ON PHOSPHORUS LOSS WITH SURFACE RUNOFF AND ON-FARM PHOSPHORUS INDEX IMPLEMENTATION. AN OVERVIEW OF ONGOING RESEARCH
 MANURE MANAGEMENT IMPACTS ON PHOSPHORUS LOSS WITH SURFACE RUNOFF AND ON-FARM PHOSPHORUS INDEX IMPLEMENTATION. AN OVERVIEW OF ONGOING RESEARCH Antonio P. Mallarino, professor Brett. L. Allen and Mazhar
December 2002 Issue # PHOSPHORUS MANAGEMENT ON HIGH PHOSPHORUS SOILS. Angela Ebeling, Keith Kelling, and Larry Bundy 1/ Introduction
 December 2002 Issue #12 2002 PHOSPHORUS MANAGEMENT ON HIGH PHOSPHORUS SOILS Angela Ebeling, Keith Kelling, and Larry Bundy 1/ Introduction Soil phosphorus (P) is important for crop production. Phosphorus
Introduction. Manure Management Facts Prioritization and Rotation of Fields for Manure Application. July 2014
 Manure Management Facts Prioritization and Rotation of Fields for Manure Application July 2014 Introduction Farmers apply synthetic fertilizer and manure to their land to replace the nutrients removed
HOW CHANGES IN NUTRIENT MANAGEMENT REGULATIONS WILL AFFECT FORAGE PRODUCTION
 HOW CHANGES IN NUTRIENT MANAGEMENT REGULATIONS WILL AFFECT FORAGE PRODUCTION Dick Wolkowski and Larry Bundy Department of Soil Science University of Wisconsin What are the issues Forage producers typically
ENVIRONMENTAL ASSESSMENT: GRAZING MANAGEMENT
 ENVIRONMENTAL ASSESSMENT: GRAZING MANAGEMENT Environmental Benefits of Pasture The environmental benefits of well-managed pasture include reduced soil erosion, improved air and water quality, better plant
Integrating erosion and phosphorus runoff assessment with nutrient management planning in SnapPlus
 Integrating erosion and phosphorus runoff assessment with nutrient management planning in SnapPlus L Laura Ward Good Department of Soil Science University of Wisconsin-Madison What is nutrient management
IS FALL TILLAGE FOLLOWING SOYBEAN HARVEST NECESSARY? 1/
 IS FALL TILLAGE FOLLOWING SOYBEAN HARVEST NECESSARY? / Introduction As growers look for opportunities to enhance profit margins, the need for fall tillage following soybean harvest is questioned. Although
GLASI GLASI. Priority Subwatershed Project. Great Lakes Agricultural Stewardship Initiative
 GLASI GLASI Great Lakes Agricultural Stewardship Initiative Priority Subwatershed Project Wigle Creek Priority Subwatershed Project Essex Region Conservation Authority Up to $75,000 per eligible farm business
beneficial management practices
 beneficial management practices introduction Phosphorus is an essential nutrient for crop growth. Alberta soils are generally deficient or low in phosphorus for optimum crop production (
Efficient Fertilizer Use Soil Sampling for High Yield Agriculture: by Dr. Harold Reetz
 SECTION CONTENTS: Soil Sampling Sampling Procedures Sampling Patterns Options Auxiliary Data Layers Sampling Under Different Tillage Systems Identifying Missed Opportunities Through Intensive Sampling
Role of Soils in Water Quality. Mike Marshall Extension Associate Texas A&M-Institute of Renewable Natural Resources
 Role of Soils in Water Quality Mike Marshall Extension Associate Texas A&M-Institute of Renewable Natural Resources Water Quality in Texas Water is a finite resource that can be impaired by pollution from
Assessing Benefits of Winter Crops
 Assessing Benefits of Winter Crops Winter Crops for Bioenergy Workshop March 29, 2011 Presentation for Penn State Bioenergy Short Course Series 2011 Dan Dostie, State Resource Conservationist, USDA NRCS,
Erosion, Erosion, Everywhere
 Erosion, Erosion, Everywhere Main Objectives 1.Capable of describing the magnitude of accelerated soil erosion in the past and at the present. 2.Comprehend the mechanics and the factors influencing water
V. Eligible Practices A. Cost-Share Practices
 V. Eligible Practices A. Cost-Share Practices Sheet and Rill/Gully Erosion Resource Concern... 9 DSL-01 Permanent Vegetative Cover Establishment... 9 DSL-02 Permanent Vegetative Cover Improvement... 11
Optimizing yield while minimizing phosphorus water quality impacts: Some do s and don ts
 13 Integrated Crop Management Conference - Iowa State University 165 Optimizing yield while minimizing phosphorus water quality impacts: Some do s and don ts Antonio P. Mallarino, professor and Extension
From the Ground Up- Field Soil Considerations
 From the Ground Up- Field Soil Considerations Ted Bilderback Nursery Extension Specialist Department of Horticulture Science North Carolina State University Ted_Bilderback@ncsu.edu http://www.ces.ncsu.edu/depts/hort/nursery/
Farmland Health Check-Up Guide
 Farmland Health Check-Up Guide Introduction The Farmland Health Check-Up is a tool that helps farmers identify priority actions that improve soil health, reduce soil and nutrient loss, and improve pollinator
LAND STEWARDSHIP CROPPING SYSTEMS FOR CORN AND SOYBEAN PRODUCTION IN ONTARIO
 LAND STEWARDSHIP CROPPING SYSTEMS FOR CORN AND SOYBEAN PRODUCTION IN ONTARIO FINAL REPORT B.D. KAY, T.J. VYN, R.W. SHEARD JANUARY 15, 1993 TABLE OF CONTENTS ACKNOWLEDGEMENTS 4 EXECUTIVE SUMMARY 5 Crop
University of Wisconsin Discovery Farms Staff 2013 Wisconsin Corn / Soy Expo Wisconsin Dells, WI
 University of Wisconsin Discovery Farms Staff 2013 Wisconsin Corn / Soy Expo Wisconsin Dells, WI Overview 1. UW-Discovery Farms, unique program and information, since 2001 Data from private working farms
Agricultural Chemicals and Groundwater Protection
 Economic Considerations of Nutrient Management BMPs Concern about nutrients from fertilizers and manure degrading water supplies has resulted in a search for nutrient management approaches that protect
Soil Erosion Causes and Effects
 Soil Erosion Causes and Effects J. Ritter, P.Eng. ORDER NO. 12-053 AGDEX 572/751 OCTOBER 2012 (replaces OMAFRA Factsheet, Soil Erosion Causes and Effects, Order No. 87-040) Soil erosion is a naturally
Integrating Agricultural Land Management into a Watershed Response Model
 Integrating Agricultural Land Management into a Watershed Response Model Adam Freihoefer, Tom Beneke, & Aaron Ruesch Wisconsin Department of Natural Resources NCASI Northern Region Meeting May 6, 2014
This section provides useful information on the characteristics of soil and important soil management practices.
 7.0 SOIL MANAGEMENT This section provides useful information on the characteristics of soil and important soil management practices. What Is Soil? The four main components of soil are mineral and organic
Conservation Practices for Water Quality: Sediment & Nutrient Control. Trap Sediments/Trap Nutrients on the Field. Improve Soil Health.
 Conservation Practices for Water Quality: Sediment & Nutrient Control. Trap Sediments/Trap Nutrients on the Field. Improve Soil Health. Sediment Conservation Cover Cover Crop Critical Area Planting Field
Best Management Practices (BMPs) are structural
 are structural") Agriculture and Natural Resources WATER QUALITY: Controlling Nonpoint Source (NPS) Pollution A L A B A M A A & M A N D A U B U R N U N I V E R S I T I E S ANR-790-4.2.3 The Rural Environment And NPS Pollution
Agriculture and Natural Resources WATER QUALITY: Controlling Nonpoint Source (NPS) Pollution A L A B A M A A & M A N D A U B U R N U N I V E R S I T I E S ANR-790-4.2.3 The Rural Environment And NPS Pollution
Minnesota Agricultural Water Quality Certification Program Program Update
 Minnesota Agricultural Water Quality Certification Program Program Update Brad Redlin MAWQCP Program Manager Memorandum of Understanding Support for a voluntary program Coordinate and prioritize funding
SEED
 PROTECTS THE SOIL SAVES YOU MONEY www.pennington.com 1-800-285-SEED WHO IS PENNINGTON SEED? Pennington has a long history in the farming industry starting with the first members of the Pennington family
Nutrient Management in Kentucky
 IP-71 Nutrient Management in Kentucky Nutrient Management Focus Group, Environmental and Natural Resource Issues Task Force AGRICULTURE & NATURAL RESOURCES FAMILY & CONSUMER SCIENCES 4-H/YOUTH DEVELOPMENT
Clean Water ~ Green Spaces. Rural and Agricultural Landowner Water Quality & Natural Areas Restoration Grant Program Guidelines
 Clean Water ~ Green Spaces Rural and Agricultural Landowner Water Quality & Natural Areas Restoration Grant Program Guidelines Revised September 2018 ELIGIBILITY GUIDELINES All projects must be pre-approved
Appendix X: Non-Point Source Pollution
 Appendix X: Non-Point Source Pollution Sources Nonpoint source of pollution, unlike pollution from industrial and sewage treatment plants, comes from many different sources. Nonpoint source pollution is
Action Packet for Agriculture
 Pennsylvania Water Quality Action Packet for Agriculture A Self Assessment and Planning Tool for Water Quality Protection Under the PA Clean Streams Law Funded by Pennsylvania Department of Environmental
Managing Erosion in Vineyard Blocks and Avenues
 Managing Erosion in Vineyard Blocks and Avenues Preventing Erosion and Flow Concentration Managing Concentrated Storm Runoff and Sediment Delivery from Vineyards Evaluating drainage and erosion to comply
FIELD SCALE TESTS OF THE MODIFIED MOLDBOARD PLOW
 TECHNOLOGY EVALUATION AND DEVELOPMENT SUB-PROGRAM FIELD SCALE TESTS OF THE MODIFIED MOLDBOARD PLOW FINAL REPORT October, 1991 Prepared by: CONSERVATION MANAGEMENT SYSTEMS A Division of ECOLOGISTICS LIMITED,
Fertilizer placement for ridge-till and no-till systems
 Leopold Center Completed Grant Reports Leopold Center for Sustainable Agriculture 1998 Fertilizer placement for ridge-till and no-till systems Antonio P. Mallarino Iowa State University, apmallar@iastate.edu
Agronomic and soil quality trends after five years of different tillage and crop rotations across Iowa
 21 Integrated Crop Management Conference - Iowa State University 185 Agronomic and soil quality trends after five years of different tillage and crop rotations across Iowa Mahdi Al-Kaisi, associate professor
Agriculture in the Great Lakes Basin Stewardship and Innovation
 Agriculture in the Great Lakes Basin Stewardship and Innovation November 2008 AGRICULTURE IS IMPORTANT IN THE GREAT LAKES BASIN The Great Lakes Basin provides 20 per cent of the world s fresh surface water,
orking Trees for Water Quality
 W Agroforestry orking Trees for Water Quality Working Trees: a partner in watershed management. Agroforestry helps to protect water quality while achieving both landowner and community objectives. Water
Agriculture and Society: Part II. PA E & E Standards 4.4
 Agriculture and Society: Part II PA E & E Standards 4.4 Let s get Dirty! 1. All agriculture ultimately depends on the soil. What is soil? Soil is the upper layer of the land surface that contains pieces
Tillage Practices and Sugar Beet Yields 1
 Tillage Practices and Sugar Beet Yields 1 R. L. COOK 2 Sugar beets produce the highest yields on the dark-colored soils which have been brought under cultivation recently. Over a period of years, growers
USC BMP Definitions - Agricultural Best Management Practices (including NEIEN Code Id)
") USC BMP Definitions - Agricultural Best Management Practices (including NEIEN Code Id) Animal Waste Management Systems or Waste Storage Facility (840, 23) Practices designed for proper handling, storage,
USC BMP Definitions - Agricultural Best Management Practices (including NEIEN Code Id) Animal Waste Management Systems or Waste Storage Facility (840, 23) Practices designed for proper handling, storage,
Developing Ontario s Agricultural Soil Health and Conservation Strategy
 Developing Ontario s Agricultural Soil Health and Conservation Strategy Ontario Ministry of Agriculture, Food and Rural Affairs January 2017 Outline Provide background on development of a soil strategy
Modeling Sediment and Nutrient Loads Input to Great Lakes and Effects of Agricultural Conservation Practices on Water Quality
 Modeling Sediment and Nutrient Loads Input to Great Lakes and Effects of Agricultural Conservation Practices on Water Quality C. Santhi and CEAP National Assessment Team Texas A&M University System, Temple,
15. Soil Salinity SUMMARY THE ISSUE
 15. Soil Salinity AUTHORS: B.H. Wiebe, R.G. Eilers, W.D. Eilers and J.A. Brierley INDICATOR NAME: Risk of Soil Salinization STATUS: Provincial coverage (AB, SK, MB), 1981 to 2001 SUMMARY At very low levels,
Making Watersheds More Resilient to Climate Change A Response in the Grand River Watershed, Ontario Canada:
 Making Watersheds More Resilient to Climate Change A Response in the Grand River Watershed, Ontario Canada: Joe Farwell 1 Dwight Boyd 2 Tracey Ryan 3 1 Assistant Chief Administrative Officer/Resource Management
Agricultural Land Use and Management in the West Souris River Watershed
 Agricultural Land Use and Management in the West Souris River Watershed Submitted by Agriculture and Agri-Food Canada Agri-Environment Services Branch (AESB) and Manitoba Agriculture Food and Rural Initiatives
AGRONOMY 375 Exam II Key November 2, 2018
 1 AGRONOMY 375 Exam II Key November 2, 2018 3 pts 1. a) Latitude, previous crop residue, and soil drainage all influence soil temperature, which is critical in determining early season corn crop growth
Revised Universal Soil Loss Equation
 Revised Universal Soil Loss Equation April 2003 Sustainable Agriculture Resource Section AGDEX # 572/751 In April 2002, the Agricultural Crop Rotation Act (ACRA) was adopted to protect water and soil quality
Soil Organic Matter. Soil degradation has become a major concern in. What is organic matter? Organic matter in virgin and cultivated soils
 Agdex 6- Soil degradation has become a major concern in Canada. Erosion, salinization, acidification and loss of organic matter are the main forms of soil deterioration. This factsheet deals with the role
Soil and Water Conservation Research under Intensive Potato Production Systems in New Brunswick
 Agri-Food Soil and Water Conservation Research under Intensive Potato Production Systems in New Brunswick T. L. Chow 1, H.W. Rees 1, and J.-L, Daigle 2 Quebec New Brunswick Technical Exchange Workshop
Saturated Buffer. Subsurface Drainage PURPOSE N REDUCTION LOCATION COST BARRIERS
 Saturated Buffer To intercept tile drainage prior to discharging to surface waters and redistribute the water laterally in the soil profile of the streamside buffer. Subsurface drainage, also known as
THE EFFECT OF SPLIT APPLICATIONS OF NITROGEN ON CORN YIELD UNDER RIDGE AND NO-TILL CONDITIONS
 TECHNOLOGY EVALUATION AND DEVELOPMENT SUB-PROGRAM THE EFFECT OF SPLIT APPLICATIONS OF NITROGEN ON CORN YIELD UNDER RIDGE AND NO-TILL CONDITIONS FINAL REPORT October, 1991 Prepared by: Under the Direction
New Practices for Nutrient Reduction: STRIPs and Saturated Buffers. Matthew Helmers and Tom Isenhart Iowa State University
 New Practices for Nutrient Reduction: STRIPs and Saturated Buffers Matthew Helmers and Tom Isenhart Iowa State University Situation Increasing concern for local and regional waters Substantial demand for
Land Application and Nutrient Management
 MODULE D Land Application and Nutrient Management Figure 34-13. Relationship between the concentration of dissolved P in subsurface drainage from 30 cm deep lysimeters and the Mehlich-3 extractable soil
Antonio Mallarino Professor, Department of Agronomy. Introduction
 2003 Integrated Crop Management Conference - Iowa State University 121 USING THE IOWA PHOSPHORUS INDEX FOR AGRONOMIC AND ENVIRONMENTAL MANAGEMENT OF FERTILIZER AND MANURE PHOSPHORUS Antonio Mallarino Professor,
Soil and farm practices data concerning the case study Svratka were collected according to questionnaire 1 by the expert on soil protection.
 Soil and farm practices data concerning the case study Svratka were collected according to questionnaire 1 by the expert on soil protection. Farmers in the case study region were interviewed according
FARMLAND AGREEMENTS. A guide to sustainable land rental in Ontario.
 FARMLAND AGREEMENTS A guide to sustainable land rental in Ontario www.farmlandagreements.ca Larry Davis, Brant County One farmer s experience. Larry Davis farms in Brant County, where he grows corn, soybeans
Business Planning and Economics of Forage Establishment and Cost of Production in Nova Scotia
 Business Planning and Economics of Forage Establishment and Cost of Production in Nova Scotia Prepared by: Christina Jones, Economist, Nova Scotia Department of Agriculture Although care has been taken
SOIL MANAGEMENT How to address concerns identified in your Environmental Farm Plan Worksheet #15
 INFOSHEET #15 SOIL MANAGEMENT How to address concerns identified in your Environmental Farm Plan Worksheet #15 Based on Environmental Farm Plan Workbook, 4th ed. 2013 This infosheet outlines options to
The Science of Integrated Crop Livestock Systems
 The Science of Integrated Crop Livestock Systems Alan J. Franzluebbers Ecologist TN MS AL GA MD VA NC SC FL Watkinsville GA Why? Production Farms operating on marginal profit Economic vulnerability with
Re: Recommendations for Regulating Phosphorus from Livestock Operations in Manitoba
 Manitoba Conservation Operations Division Headquarters Environmental Programs Box 46, 200 Saulteaux Crescent Winnipeg MB R3J 3W3 Telephone: (204) 945-8553 http://www.gov.mb.ca/conservation May 6, 2005
Crop Rotation GUIDELINES
 Crop Rotation GUIDELINES crop handbook Crop Rotation Crop Rotation: general considerations 3 Crop Rotation historical 5 Cash crop system - Areas with sufficient moisture 6 Cash crop in dryer conditions
Re: Response to New Horizons: Ontario's Draft Agricultural Soil Health and Conservation Strategy
 Paul Smith December 31, 2017 Senior Policy Advisor Agricultural Soil Health and Conservation Strategy Ministry of Agriculture, Food and Rural Affairs 1 Stone Road West, 2 nd floor Guelph, ON N1G 4Y2 Re:
Addressing Economic & Environmental Risks While No-Tilling
 19th 18th 20th Annual National No-Tillage Conference Cincinnati, Des St. Louis, Moines, Missouri Ohio Iowa * * * Jan. 12-15, 13-16, 11-14, 2011 2010 2012 Addressing Economic & Environmental Risks While
WATERSHED. Maitland Valley. Report Card 201
 Maitland Valley WATERSHED Report Card 201 The Maitland Valley Conservation Authority has prepared this report card as a summary on the state of our forests, wetlands, surface water, and ground water resources.
Nutrient Management in. A presentation to the West Metro Water Alliance
 Nutrient Management in Developing and Agricultural Areas A presentation to the West Metro Water Alliance Chris Meehan, P.E. May 25, 2011 Agenda Physical Improvements Planning Improvements How to get it
Section 1 Estimating the Use Value of Agricultural Land
 Section 1 Estimating the Use Value of Agricultural Land The State Land Evaluation Advisory Council (SLEAC) is required to base its estimates of the use value of agricultural and horticultural lands on
EXTENSION Know how. Know now. EC195 (Revised August 2012)
") EXTENSION Know how. Know now. EC195 (Revised August 2012) The Nebraska Phosphorus Index (2012): Background And Users Guide Charles S. Wortmann, Extension Soils Specialist Charles A. Shapiro, Extension
EXTENSION Know how. Know now. EC195 (Revised August 2012) The Nebraska Phosphorus Index (2012): Background And Users Guide Charles S. Wortmann, Extension Soils Specialist Charles A. Shapiro, Extension
Interpretations and Management of Soil
 Interpretations and Management of Soil Lesson 12: Interpretations and Management of Soil The first steps in evaluating soils involve learning how to identify horizons and site characteristics, and how
Farm A Syst. Soil Conservation Management PENNSYLVANIA WORKSHEET 11
 PENNSYLVANIA Farm A Syst F ARM EVALUATION SYSTEM WORKSHEET 11 Soil Conservation Management WHY BE CONCERNED? Soil conservation protects a valuable resource and reduces the offfarm direct impacts of sediment
Research and Extension
 Research and Extension INTRODUCTION Vegetative filter strips, in conjunction with sediment basins, are recognized by the Kansas Department of Health and Environment (KDHE) as an effective system for controlling
Unit E: Basic Principles of Soil Science. Lesson 7: Understanding Soil Erosion and Management Practices
 Unit E: Basic Principles of Soil Science Lesson 7: Understanding Soil Erosion and Management Practices 1 Important Terms Accelerated erosion Conservation tillage Cover crops Diversion ditches Geologic
Agriculture Action Packet DRAFT Attachment # FARM MAP EXAMPLE DRAFT
 Attachment # FARM MAP EXAMPLE Attachment # Conservation Systems to Meet the PA E&S Guidelines to be Used as an Interim Guideline when a Plan Meeting Soil Loss (T) Cannot be Obtained Guiding Principles
Conservation Tillage in Oklahoma: Perceptions and Demographics of Producers
 Conservation Tillage in Oklahoma: Perceptions and Demographics of Producers E-1019 Oklahoma Cooperative Extension Service Division of Agricultural Sciences and Natural Resources Oklahoma State University
A Toolbox for Water Management. By Nick Schneider, Winnebago County Ag Agent and Doral Kemper
 A Toolbox for Water Management By Nick Schneider, Winnebago County Ag Agent and Doral Kemper On-Farm Bioreactors by Madeline Fisher, Crops and Soils, Nov-Dec 2010 AKA: Denitrifying biofilter reactors Removes
Soil Degradation. Lesson Plan NRES B2-9
 Soil Degradation Lesson Plan NRES B2-9 Objectives 1. What is soil degradation? 2. How can construction result in soil degradation? 3. What are the sources of contamination, and how do they result in soil
Resource Conserving Crop Rotation & Alternative Livestock Watering System
 Ken Teske Pottawatomie County Resource Conserving Crop Rotation & Alternative Livestock Watering System Cooperator: Ken Teske 19900 Golden Belt Road Onaga, Ks. 66521 Water Quality Concerns: Run-off of
Conservation. Conservation Practice. Cover 327. What is it? How it Works. Which Resource Concerns? Where it Works Best
 Cover 327 Cover - Perennial vegetation cover that protects soil and water resources on land retired from agricultural production. Wind After harvest, a cover crop such as rye, oats or a legume is planted.
Planting and Harvesting Crops
 Planting and Harvesting Crops Chesapeake Bay Program Agricultural Workgroup s Building a Better Bay Model Workshop 05/22/2013 Gary Shenk Chesapeake Bay Program s Integrated Analysis Coordinator Photos
Reducing Phosphorus Loss to Lake Erie: Application & Timing of Nutrients. Ontario Ministry of Agriculture, Food and Rural Affairs (OMAFRA)
") Reducing Phosphorus Loss to Lake Erie: Application & Timing of Nutrients Ontario Ministry of Agriculture, Food and Rural Affairs (OMAFRA) Great Lakes Commission Joint Action Plan The Great Lakes Commission
Reducing Phosphorus Loss to Lake Erie: Application & Timing of Nutrients Ontario Ministry of Agriculture, Food and Rural Affairs (OMAFRA) Great Lakes Commission Joint Action Plan The Great Lakes Commission
The Phosphorus Management Tool
 The Phosphorus Management Tool Heather Hutchinson Nutrient Management Specialist June 18, 2013 Understanding Phosphorus Why are soils high in phosphorus? Why is phosphorus a problem? How is phosphorus
Digging Deeper Soil in Atlantic Canada
 DESCRIPTION Soil erosion is one of the most important environmental issue in Atlantic Canada. Students in this region need to be familiar with soil conservation practices. & & & OBECTIVES to develop an
International Research and Development. Designing a Crop Rotation Plan with Farmers
 International Research and Development Designing a Crop Rotation Plan with Farmers University of Agriculture, Faisalabad, June, 2011 Definition A system of farming in which a regular succession of different
Recommended Resources: The following resources may be useful in teaching this lesson:
 Unit E: Basic Principles of Soil Science Lesson 7: Understanding Soil Erosion and Management Practices Student Learning Objectives: Instruction in this lesson should result in students achieving the following
Protecting Your Water and Air Resources
 Protecting Your Water and Air Resources Montana Agri-Business Association Convention (Feb 1, 2013) by Clain Jones, Extension Soil Fertility Specialist and Adam Sigler, Extension Associate Water Quality
Strip Tillage. Increased nutrient and water storage capacity
 Strip Tillage Disturbs 30 % of surface Meant to provide seed bed and increase soil temp in row. Remaining residues minimize wind and water erosion. Allows for potential increases in soil organic matter
Site Condition Evaluation & Environmental Benefits Report
 Site Evaluation & Environmental Benefits Report Background The New York State Conservation Reserve Enhancement Program is a collaborative effort between the USDA and the State of New York. The goal of
Attachment # 1. Commonwealth of Pennsylvania. Pennsylvania Code. Title 25. Environmental Protection. Department of Environmental Protection
 Attachment # 1 Commonwealth of Pennsylvania Pennsylvania Code Title 25. Environmental Protection Department of Environmental Protection Chapter 102.4 1 Attachment #1 Pennsylvania Code, 102.4 Erosion and
Controlling runon and runoff:
 Chapter 8. Surface Water Management This chapter explores: runon and runoff what they are, and the risks associated with them. various management options runon reductions, runoff catchbasins, vegetated
Modeling the Impacts of Agricultural Conservation Strategies on Water Quality in the Des Moines Watershed
 Modeling the Impacts of Agricultural Conservation Strategies on Water Quality in the Des Moines Watershed Presenter: Jeff Arnold, Supervisory Research Engineer, USDA-ARS C. Santhi, M. White, M. Di Luzio
THE EFFECT OF THE COMBINED HARVESTER- THRESHER ON FARM ORGANIZATION IN SOUTHWESTERN KANSAS AND NORTHWESTERN OKLAHOMA¹ INTRODUCTION
 THE EFFECT OF THE COMBINED HARVESTER- THRESHER ON FARM ORGANIZATION IN SOUTHWESTERN KANSAS AND NORTHWESTERN OKLAHOMA¹ INTRODUCTION Farming in the southern great plains region has undergone rapid changes
Vertical Tillage: Does it Help the Transition to No-till?
 Vertical Tillage: Does it Help the Transition to No-till? Greg Stewart and Horst Bohner, Ontario Ministry of Agriculture, Food and Rural Affairs Tony Vyn, Purdue University and Ken Janovicek, University
STRATEGY FOR SOIL AND WATER MANAGEMENT IN THE THAMES RIVER BASIN. A final report of the Thames River Implementation Committee
 STRATEGY FOR SOIL AND WATER MANAGEMENT IN THE THAMES RIVER BASIN A final report of the Thames River Implementation Committee August, 1982 ACKNOWLEDGEMENT Since the formation of the Thames River Implementation