Statistical Questions from CPV Monitoring of Bioreactor Data
|
|
|
- Jade Merritt
- 6 years ago
- Views:
Transcription
1 Statistical Questions from CPV Monitoring of Bioreactor Data Craig Bernier Principal Statistician Design to Value and Quality Engineering Janssen Pharmaceutical Companies of Johnson and Johnson
2 Individual Value CPV Statistics Assay Control Chart Example Trending of Typical CQA of a Product Much support around developing procedures, teaching control charts, and providing backup to more complex questions. As per the 20 Guidance: UCL=0.50 _ X=97.2 The data should be statistically trended and reviewed by trained personnel Observation LCL=92.92 We recommend that a statistician or person with adequate training in statistical process control techniques develop the data collection plan and statistical methods and procedures used in measuring and evaluating process stability and process capability.
3 Common Statistical Questions for CPV Data failed the Normality test Do I have to transform the Data? How should I transform the data? or What transformation do I use? What Shewhart tests to apply? Long Term vs Short Term sd Can I use Levey Jennings Chart? 2
4 Common Statistical Question for CPV For dissolution do I just chart the averages? Or Individuals? For individuals do I use: Individuals chart? X-bar / R, or X-bar / S? Should we use the I-MR R/S (Between / Within) charts? Do I have to calculate Process Capability? How often? Use Cpk or Ppk? Confidence intervals? 3
5 Statistically Related Questions If I see a point outside the control limits, do I have to open an investigation? The control limits are to 3 decimals, but the spec is one decimal? The data is rounded to same precision as the specification. Do I need to ask for unrounded data? 4
6 Somewhat Statistically Related Questions How often do I need to trend / report? Why? How to evaluate risks, prioritize actions from CPV reports? Do I need to trend Yields? Do I need to trend CMA (Critical Material Attributes)? CPP (Critical Process Parameters)? Is Minitab/JMP/R Validated? 5
7 More Complex Statistical Questions For Example: How to monitor longitudinal data from the bioreactor during CPV? Multiple CPV parameters (e.g. Viable Cell Density, Viability, IgG content, ph) Daily offline measurements for each batch Unique data profile across culture period Up to 60 days depending on product 6

8 Upstream Production Process Stage : Preculture and expansion Stage 2: Production by continuous perfusion in bioreactor continuous perfusion bioreactor 7
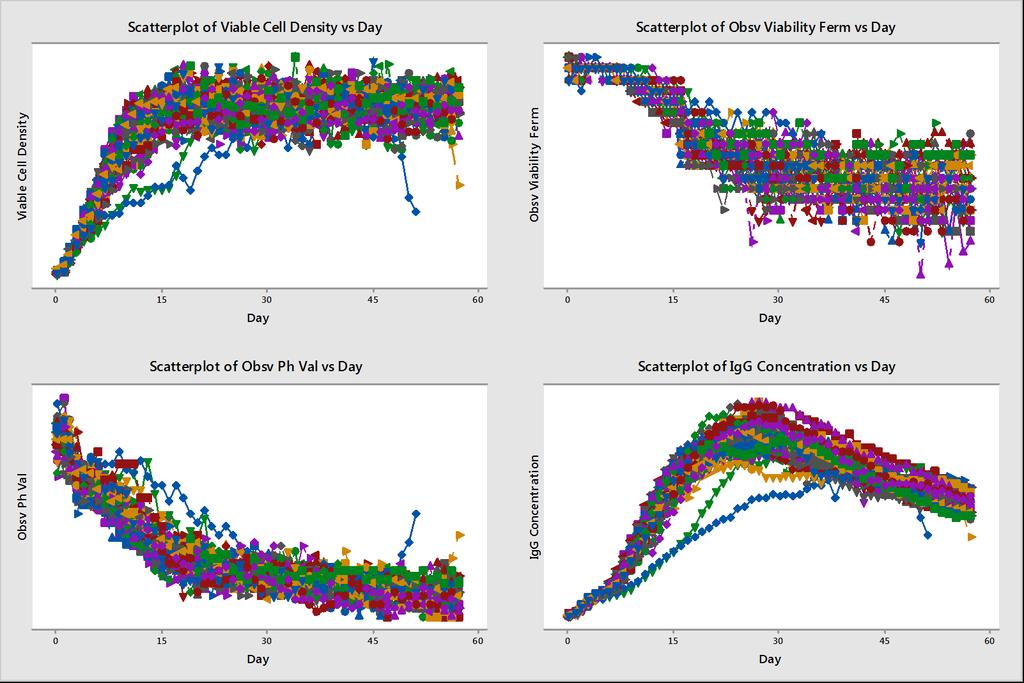
9 Bioreactor Data 8

10 Problem How to evaluate cell growth data over time for trending purposes. When is a batch acting differently than usual what tool to use to detect special cause variability?
11 Problem Continued Initial solution from our practitioners. This type of trending shows a sample average and some expected variability around that model. Essentially mean +/- 3sd at each day A very nice solution to be able to detect unusual results and potential special cause variability Some challenges though

12 Problem Continued We do not have the ability to monitor the process over time as we usually desire in CPV Is process trending up / down? Another challenge is that this approach allows for multiple chances for a batch to signal. What to do about a batch that has a single point or a couple points outside the range but in general follows a typical pattern
13 Alternate approach Trending of residuals from average at each day This approach captures the deviations from average across time as the current approach. But also allows us to then trend the batches over time potentially using typical control chart methods.

14 Plot Individuals Autocorrelation exists due to the nature of the data
15 StDev Mean Plot Averages and sd Time Series Plot of Residuals Mean Batch Batch 5 Batch 0 Batch 5 Batch 20 Batch 25 Batch Batch 30 Batch 35 Batch 40 Batch 45 Time Series Plot of StDev Batch Batch 5 Batch 0 Batch 5 Batch 20 Batch 25 Batch Batch 30 Batch 35 Batch 40 Batch 45
16 Sample StDev Individual Value Charting of Average Residuals I chart of Residuals Means UCL= _ X= LCL= Batch Batch 6 Batch Batch 6 Batch 2 Batch 26 Batch Batch 3 Batch 36 Batch 4 Batch 46 Batch 3 omitted from calculations S Chart of SRES UCL=.093 _ S= Batch Batch 6 Batch Batch 6 Batch 2 Batch 26 Batch Batch 3 Batch 36 Batch 4 Batch 46 LCL=0.567 *Standard X-bar chart shows variability more than within batch variability. We use I-MR R/S type approach
17 Batches of interest identified Control Charts signaled at Batch 2, Batch 2, and Batch 3. (as well as Batch 6)
18 Sample Mean Trend Data by Test Date Potential additional benefit of evaluating the residuals is that we could also plot the data by test date Xbar Chart of SRES by Test Date _Qtr 20xx UCL=0.586 Are test results unusually high / low on a particular day indicating some lab variability? _ X= LCL= Date
19 References Montgomery, Douglas C. Introduction to Statistical Quality Control 7th edition, Wiley, 203. *Note: Montgomery text page discusses various works with some examples on monitoring autocorrelated data as well as profile monitoring. 8
20 Questions Thanks to: Tim Overkleeft Wendy de Wit Kevin Pipkins Clemens Haerder David Enck
Daniel Y. Peng, Ph.D.
 Using Control Charts to Evaluate Process Variability Daniel Y. Peng, Ph.D. Quality Assessment Lead Office of Process and Facility (OPF) OPQ/CDER/FDA PQRI 205 Annual Meeting North Bethesda, Maryland October
Product Robustness: Reducing Variability and Ensuring Delivery of Superior Quality Products to Patients
 Product Robustness: Reducing Variability and Ensuring Delivery of Superior Quality Products to Patients Dafni Bika, Jennifer Walsh and Tara Nestor Global Manufacturing Science and Technology Bristol-Myers
ISPE s Process Capability Team
 4 September 7 INDUSTRY MATURITY IN THE ASSESSMENT AND USE OF PROCESS CAPABILITY Arne Zilian Head MS&T Processes & Standards Novartis Pharma AG Process Validation Statistics Conference 5 September 7 ISPE
Product, Process Knowledge & SPC: PV Lifecycle Approach IFPAC January 2016, Arlington, VA
 Product, Process Knowledge & SPC: PV Lifecycle Approach IFPAC January 2016, Arlington, VA Naheed Sayeed Manager, Technical Operations Process Validation, Apotex Inc. 1 Process Validation Life Cycle Stage
Managing Quality in Pharmaceutical Industry Using Six Sigma. Edited by Mahmoud Farouk Moussa TQM, CSSBB, MBA
 Managing Quality in Pharmaceutical Industry Using Six Sigma Edited by Mahmoud Farouk Moussa TQM, CSSBB, MBA Outlines Pharmaceutical Manufacturing Process and Drug Product Quality. Process Excellence Approach
Measurement Systems Analysis
 Measurement Systems Analysis Components and Acceptance Criteria Rev: 11/06/2012 Purpose To understand key concepts of measurement systems analysis To understand potential sources of measurement error and
Lifecycle Approach to Process Validation
 Lifecycle Approach to Process Validation Best Practices and Strategies July 19 th, 2016 Patrick Donohue, Drug Product Development, Janssen R&D Disclaimer The contents of this presentation are my personal
Process Validation Guidelines. by Pramote Cholayudth Thai Industrial Pharmacist Association (TIPA)
") Process Validation Guidelines by Pramote Cholayudth cpramote2000@yahoo.com Thai Industrial Pharmacist Association (TIPA) September 19, 2016 1 2 Process Validation References Hierarchy Law Regulatory Guidelines
Process Validation Guidelines by Pramote Cholayudth cpramote2000@yahoo.com Thai Industrial Pharmacist Association (TIPA) September 19, 2016 1 2 Process Validation References Hierarchy Law Regulatory Guidelines
A COMPARATIVE FRAMEWORK BETWEEN NEW PRODUCT & LEGACY PRODUCT PROCESS VALIDATION
 A COMPARATIVE FRAMEWORK BETWEEN NEW PRODUCT & LEGACY PRODUCT PROCESS VALIDATION By Mark Mitchell, Principal Consultant, Process and Engineering, Pharmatech Associates, Inc. PHARMATECH WHITE PAPER.DOCX
QUICK & DIRTY GRR PROCEDURE TO RANK TEST METHOD VARIABILITY
 QUICK & DIRTY GRR PROCEDURE TO RANK TEST METHOD VARIABILITY Mike Mercer, Quality Engineering Specialist, 3M, St. Paul, MN Steve Cox, Lean Six Sigma Coach, 3M, St. Paul, MN Introduction One of the first
Use and interpretation of statistical quality control charts
 International Journal for Quality in Health Care 1998; Volume 10, Number I: pp. 69-73 Methodology matters VIII 'Methodology Matters' is a series of intermittently appearing articles on methodology. Suggestions
Graphical methods for data from a fermentation process. Antje Christensen Per Rexen Novo Nordisk A/S
 Graphical methods for data from a fermentation process Antje Christensen Per Rexen Novo Nordisk A/S Agenda The Process The Project Data Graphs Slide No. 2 17 October 2002 Fall Technical 2002 The Process:
Online Student Guide Types of Control Charts
 Online Student Guide Types of Control Charts OpusWorks 2016, All Rights Reserved 1 Table of Contents LEARNING OBJECTIVES... 4 INTRODUCTION... 4 DETECTION VS. PREVENTION... 5 CONTROL CHART UTILIZATION...
LO1: Understand how inspection and testing methods and processes improve quality control
 Unit 19: Inspection and testing LO1: Understand how inspection and testing methods and processes improve quality control SPC moving range charts Instructions and answers for teachers These instructions
A Practical Guide to Selecting the Right Control Chart
 A Practical Guide to Selecting the Right Control Chart InfinityQS International, Inc. 12601 Fair Lakes Circle Suite 250 Fairfax, VA 22033 www.infinityqs.com Introduction Control charts were invented in
with an Example of for an HPLC Procedure
 Peer Reviewed: Analytical Procedure Journal of Validation Technology The Use of the Analytical Target Profile in the Lifecycle of an Analytical Procedure with an Example of for an HPLC Procedure Jane Weitzel,
Chapter 9A. Process Capability & SPC
 1 Chapter 9A Process Capability & SPC 2 OBJECTIVES Process Variation Process Capability Process Control Procedures Variable data Attribute data Acceptance Sampling Operating Characteristic Curve 3 Basic
PLANNING AND CONTROL FOR A WARRANTY SERVICE FACILITY
 Proceedings of the 2 Winter Simulation Conference M. E. Kuhl, N. M. Steiger, F. B. Armstrong, and J. A. Joines, eds. PLANNING AND CONTROL FOR A WARRANTY SERVICE FACILITY Amir Messih Eaton Corporation Power
Combining Laboratory and Process Data on the PI System. Copyright 2013 OSIsoft, LLC.
 Combining Laboratory and Process Data on the PI System Presented by Kevin Crean Kevin Crean Automation and Control Engineer Manufacturing Systems - Janssen Pharmaceutical 2 Agenda Introduction Janssen
Process Validation& Contents Uniformity in Tablets via Quality Tools and Process Capabilities
 IOSR Journal of Pharmacy and Biological Sciences (IOSR-JPBS) e-issn: 2278-3008, p-issn:2319-7676. Volume 9, Issue 1 Ver. IV (Jan. 2014), PP 67-74 Process Validation& Contents Uniformity in Tablets via
Principal approach to CPV :
 Principal approach to CPV : Integration with Quality Systems & Operating Mechanisms J. Gampfer, Baxalta, Vienna Austria Baxalta Principal Approach to CPV J. Gampfer Page 1 Baxalta Principal Approach to
Identifying and Controlling CPPs and CMAs
 March 2018, BioPharm International Publication Identifying and Controlling CPPs and CMAs Thomas A. Little Ph.D. 2/22/2018 President/CEO Thomas A. Little Consulting, BioAssay Sciences 12401 N Wildflower
NHS Improvement An Overview of Statistical Process Control (SPC) October 2011
 October 2011") NHS Improvement An Overview of Statistical Process Control (SPC) October 2011 Statistical Process Control Charts (X, Moving R Charts) What is Statistical Process Control (SPC)? We all know that measurement
NHS Improvement An Overview of Statistical Process Control (SPC) October 2011 Statistical Process Control Charts (X, Moving R Charts) What is Statistical Process Control (SPC)? We all know that measurement
Chapter 9A. Process Capability & SPC
 1 Chapter 9A Process Capability & SPC 2 OBJECTIVES Process Variation Process Capability Process Control Procedures Variable data Attribute data Acceptance Sampling Operating Characteristic Curve 3 Basic
Understanding and accounting for product
 Understanding and Modeling Product and Process Variation Variation understanding and modeling is a core component of modern drug development. Understanding and accounting for product and process variation
Process Robustness: Development to Life Cycle Management. Presented By J. Richard Creekmore US Technology Manager AstraZeneca Pharmaceuticals
 Process Robustness: Development to Life Cycle Management Presented By J. Richard Creekmore US Technology Manager AstraZeneca Pharmaceuticals Introduction You ve heard it before: Complaints about the robustness
Analytical QbD Applied to Analytical Methods for Therapeutic Proteins Opportunities & Challenges
 Analytical QbD Applied to Analytical Methods for Therapeutic Proteins Opportunities & Challenges Annick GERVAIS, PhD Analytical Sciences Biologicals, UCB CASSS CMC Strategy Forum, Copenhagen, 05 May 2015
Engenharia e Tecnologia Espaciais ETE Engenharia e Gerenciamento de Sistemas Espaciais
 Engenharia e Tecnologia Espaciais ETE Engenharia e Gerenciamento de Sistemas Espaciais SITEMA DE GESTÃO DA QUALIDADE SEIS SIGMA 14.12.2009 SUMÁRIO Introdução ao Sistema de Gestão da Qualidade SEIS SIGMA
Monitoring validated processes by using SPC
 Monitoring validated processes by using SPC Content Monitoring validated process effectively Using SPC / Control charts to monitor processes Separating Signal from Noise System Approach Risk Analysis Protocol/Report
Quality by Design for Legacy Products A Contradiction?
 Quality by Design for Legacy Products A Contradiction? Qualification and Verification of Manufacturing Process throughout the Product Life Cycle Dr. Joerg Gampfer WCBP 2015- CASSS Conference Washington
Process Validation Guidelines. Report highlights 23 rd February 2018
 Process Validation Guidelines Report highlights 23 rd February 2018 Process validation is an important element of pharmaceutical quality system An effective system provides assurance of the continued capability
PCI Pharmaceutical Consulting
 PCI Pharmaceutical Consulting The Role of the QP: before & after Annex 16 Presented by: Karen Ginsbury For IFF, Denmark March 2016 Responsibility Authority Responsibility Authority Having the duty to perform
Transforming your Historical Metrics to a Futuristic State
 Transforming your Historical Metrics to a Futuristic State Forrest W. Breyfogle III CEO, Smarter Solutions, Inc. SmarterSolutions.com +1 512.918.0280 Forrest@SmarterSolutions.com Copyright 1992 2014. All
Application of Quality by Design in formulation and process Development
 21 st EAFP Annual Conference, Quality Assurance in Pharmacy Education, May 14-16, 2015 Application of Quality by Design in formulation and process Development Stavros N. Politis, Pharmacist, MSc, PhD Laboratory
Welcome to the course, Evaluating the Measurement System. The Measurement System is all the elements that make up the use of a particular gage.
 Welcome to the course, Evaluating the Measurement System. The Measurement System is all the elements that make up the use of a particular gage. Parts, people, the environment, and the gage itself are all
Chapter 7 -Control Charts for Variables. Lecturer : Asst. Prof. Dr. Emine ATASOYLU
 Chapter 7 -Control Charts for Variables Lecturer : Asst. Prof. Dr. Emine ATASOYLU Control Charts for Variables Chapter 6 Introduced the fundamentals of control charts. Chapter 7: details of control charts
Materials and Methods. Introduction
 Three-Stage Approach of Hybridoma Media Optimization Steven C. Peppers, Terrell K. Johnson, Damon L. Talley, and Matthew V. Caple Sigma-Aldrich Corporation, P.O. Box 1458, St. Louis, Missouri 63178 Abstract
Lifecycle Approach to Specification Setting
 Lifecycle Approach to Specification Setting David Christopher Schering-Plough IPAC-RS Conference September 24, 2008 IPAC-RS Conference 2008 1 Challenge: Process Understanding Integrate Product Product
SQL*LIMS Stability Analytics Software
 SQL*LIMS Stability Analytics SQL*LIMS Stability Analytics Software Real-Time Analysis At-Your-Fingertips A purpose-built analytics solution that puts meaningful information at the fingertips of your Stability
Chapter 5 Introduction to Statistical Quality Control, 7th Edition by Douglas C. Montgomery. Copyright (c) 2012 John Wiley & Sons, Inc.
 2012 John Wiley & Sons, Inc.") 1 Learning Objectives 2 Basic SPC Tools 3 5.2 Chance and Assignable Causes of Variation A process is operating with only chance causes of variation present is said to be in statistical control. A process
1 Learning Objectives 2 Basic SPC Tools 3 5.2 Chance and Assignable Causes of Variation A process is operating with only chance causes of variation present is said to be in statistical control. A process
Quality Control Charts
 Quality Control Charts General Purpose In all production processes, we need to monitor the extent to which our products meet specifications. In the most general terms, there are two "enemies" of product
Quantitative Methods. Presenting Data in Tables and Charts. Basic Business Statistics, 10e 2006 Prentice-Hall, Inc. Chap 2-1
 Quantitative Methods Presenting Data in Tables and Charts Basic Business Statistics, 10e 2006 Prentice-Hall, Inc. Chap 2-1 Learning Objectives In this chapter you learn: To develop tables and charts for
Solving Statistical Mysteries What Does the FDA Want?
 3 7 25Temperature(degC) 40 3.4 6.6 2.6 3.6 75 Humidity % 1.6 5.3 50 No Base Present Yes Solving Statistical Mysteries What Does the FDA Want? Ronald D. Snee, PhD IVT Statistics in Validation Conference
Regulatory and Strategic Considerations: What is CPV? (contd) Industry case studies provided highly detailed illustrations of how CPV is designed and
 Industry case studies provided highly detailed illustrations of how CPV is designed and") Regulatory and Strategic Considerations: What is CPV? FDA affirmed we share the goal of safe, effective products from controlled, efficient processes. They gave comprehensive overview of the regulatory
Regulatory and Strategic Considerations: What is CPV? FDA affirmed we share the goal of safe, effective products from controlled, efficient processes. They gave comprehensive overview of the regulatory
Statistics Quality: Control - Statistical Process Control and Using Control Charts
 Statistics Quality: Control - Statistical Process Control and Using Control Charts Processes Processing an application for admission to a university and deciding whether or not to admit the student. Reviewing
The materials required over the next two modules include:
 Meet with the Math Instructor and verify that the statistics modules have been completed and that students will be again reviewing these kinds of data over the next two quality modules. The Math Instructor
Developing and implementing statistical process control tools in a Jordanian company. R.H. Fouad* and Salman D. Al-Shobaki
 Int. J. Manufacturing Technology and Management, Vol. 17, No. 4, 2009 337 Developing and implementing statistical process control tools in a Jordanian company R.H. Fouad* and Salman D. Al-Shobaki Department
Application of Quality by Design (QbD) in product development. James E. Polli September 16, 2015
 in product development. James E. Polli September 16, 2015") Application of Quality by Design (QbD) in product development James E. Polli jpolli@rx.umaryland.edu September 16, 2015 Pharmaceutical Equivalence Same active ingredient(s) Same dosage form Same route
Application of Quality by Design (QbD) in product development James E. Polli jpolli@rx.umaryland.edu September 16, 2015 Pharmaceutical Equivalence Same active ingredient(s) Same dosage form Same route
Computer Science and Software Engineering University of Wisconsin - Platteville 3. Statistical Process Control
 Computer Science and Software Engineering University of Wisconsin - Platteville 3. Statistical Process Control Yan Shi SE 3730 / CS 5730 Lecture Notes Outline About Deming and Statistical Process Control
APFCB. Improving Laboratory Performance Through Quality Control. Designing an Appropriate QC Procedure for Your Laboratory QUALITY CONTROL
 APFCB Improving Laboratory Performance Through Quality Control Designing an Appropriate QC Procedure for Your Laboratory - Five simple steps for QC success By Sarah Kee, BSc PGCE QC Scientific Consultant,
How Will You Know That a Change Is An Improvement?
 How will you know How Will You Know That a Change Is An Improvement? Robert Lloyd, PhD John Boulton, MD Day 2 Concurrent Breakout Session 15 September 2014 1. If the change(s) you have made signal a true
Unit3: Foundationsforinference. 1. Variability in estimates and CLT. Sta Fall Lab attendance & lateness Peer evaluations
 Announcements Unit3: Foundationsforinference 1. Variability in estimates and CLT Sta 101 - Fall 2015 Duke University, Department of Statistical Science Lab attendance & lateness Peer evaluations Dr. Monod
Section 7-3 Estimating a Population Mean: σ Known
 Section 7-3 Estimating a Population Mean: σ Known Created by Erin Hodgess, Houston, Texas Revised to accompany 10 th Edition, Tom Wegleitner, Centreville, VA Slide 1 Key Concept Use sample data to find
Chapter 19. Confidence Intervals for Proportions. Copyright 2012, 2008, 2005 Pearson Education, Inc.
 Chapter 19 Confidence Intervals for Proportions Copyright 2012, 2008, 2005 Pearson Education, Inc. Standard Error Both of the sampling distributions we ve looked at are Normal. For proportions For means
Clare Simpson 21 st November Content courtesy of Steve Jones, Paul Illot, Bert Frohlich, Thomas Ryll Biopharm Services
 Modelling a technology roadmap for acceleration of global industry innovation Presentation to Wales Life Science Hub, Health Economics Special Interest Group Clare Simpson 21 st November 2016 Content courtesy
ICH Q12 Technical and Regulatory Considerations for Pharmaceutical Product Lifecycle Management
 ICH Q12 Technical and Regulatory Considerations for Pharmaceutical Product Lifecycle Management Keith O. Webber, Ph.D. Sr. Director, Global Regulator Affairs Rx Perrigo Company, plc Q U A L I T Y A F F
Test Method Validation of In-Vitro Diagnostic Products. Tim Carr QA Manager, Beckman Coulter
 Test Method Validation of In-Vitro Diagnostic Products Tim Carr QA Manager, Beckman Coulter IVD Overview What is an In-Vitro Diagnostic Test IVDs are medical devices and accessories Used to perform tests
Application of PAT for Tablet Analysis. Case examples from Novartis Lorenz Liesum, Lead PAT Hamburg, 19 th of April 2013
 Application of PAT for Tablet Analysis Case examples from Novartis Lorenz Liesum, Lead PAT Hamburg, 19 th of April 2013 Agenda PAT@Novartis Organization Business Drivers and Cases NIR Spectroscopy for
Inspection. Implementation of ICH Q8, Q9, Q10
 Implementation of ICH Q8, Q9, Q10 International Conference on Harmonisation of Technical Requirements for Registration of Pharmaceuticals for Human Use Outline Aim of - as a key part of the regulatory
Cleaning Validation in a Biologics Facility Case Study. CBE Pty Ltd
 Cleaning Validation in a Biologics Facility Case Study CBE Pty Ltd This training program is copyright to CBE Pty Ltd and may not be modified, reproduced, sold, loaned, hired or traded in any form without
THE INTERNATIONAL UNIVERSITY (IU) Department of Industrial System Engineering
 Department of Industrial System Engineering") MIDTERM EXAMINATION Head of Department of Industrial & Systems Engineering QUALITY MANAGEMENT Duration: 120 minutes Lecturer: Student ID: Date: Mar. 21, 2013 Name: Assoc Prof. Ho Thanh Phong Luu Van Thanh
MIDTERM EXAMINATION Head of Department of Industrial & Systems Engineering QUALITY MANAGEMENT Duration: 120 minutes Lecturer: Student ID: Date: Mar. 21, 2013 Name: Assoc Prof. Ho Thanh Phong Luu Van Thanh
Application of statistical techniques in the evaluation of packaging processes
 Rochester Institute of Technology RIT Scholar Works Theses Thesis/Dissertation Collections 1997 Application of statistical techniques in the evaluation of packaging processes Mark Harris Follow this and
MICRO AND MACRO LEVEL ANALYSIS OF LABOR PRODUCTIVITY
 International Journal of Civil Engineering and Technology (IJCIET) Volume 8, Issue 8, August 2017, pp. 500 507, Article ID: IJCIET_08_08_052 Available online at http://http://ww www.iaeme.com/ijciet/issues.asp?jtype=ijciet&v
Process Capability and relationship to Quality management
 Process Capability and relationship to Quality management Oct. 6, 2015 Barbara Allen, Ph.D. Global Quality Systems Eli Lilly and Company Core Objective Safely & reliably manufacture quality medicines for
The Comet Assay How to recognise Good Data
 The Comet Assay How to recognise Good Data William Barfield 4 th September 2015 ICAW Content Regulatory Genetic Toxicology JaCVAM trial overview and results Protocols Historical control data Statistics
Eden Approach To Bioprocess Characterisation. Philip Mellors p USP Development & Transfer Team Leader
 Eden Approach To Bioprocess Characterisation Philip Mellors p USP Development & Transfer Team Leader Process Characterisation What is Process Characterisation? A late stage study that evaluates the process
Statistical Tools for Similarity Assessment of Quality Attributes
 Statistical Tools for Similarity Assessment of Quality Attributes Aili Cheng, Ph.D, Director, Pfizer Statistics FDA-PQRI Conference on Evolving Product Quality Sept 16-17, 2014 1 Comparability vs. Similarity
30 important questions of Data Interpretation - I (Quantitative Aptitude)
") IBPS PO PDF IBPS PO Prep Module by: 30 important questions of Data Interpretation - I (Quantitative Aptitude). Page 1 of 9 DIRECTIONS Q.1 to Q. 5: Study the following graph and table carefully and answer
IBPS PO PDF IBPS PO Prep Module by: 30 important questions of Data Interpretation - I (Quantitative Aptitude). Page 1 of 9 DIRECTIONS Q.1 to Q. 5: Study the following graph and table carefully and answer
Regulatory Assessment
 Implementation of ICH Q8, Q9, Q10 Regulatory Assessment International Conference on Harmonisation of Technical Requirements for Registration of Pharmaceuticals for Human Use Presentation Overview Goal
Continuous Manufacturing: An Industry View
 Novartis Pharmaceuticals Continuous Manufacturing: An Industry View Diane Zezza Novartis Pharmaceuticals FDA/PQRI Conference on Advancing Product Quality March 22, 2017 Where are we today? Continuous Manufacturing
How to Identify Critical Quality Attributes and Critical Process Parameters
 How to Identify Critical Quality Attributes and Critical Process Parameters Jennifer Maguire, Ph.D. Daniel Peng, Ph.D. Office of Process and Facility (OPF) OPQ/CDER/FDA FDA/PQRI 2 nd Conference North Bethesda,
A Comparison of Statistical Process Control (SPC) and On-Line Multivariate Analyses (MVA) for. Plastics Injection Molding
 and On-Line Multivariate Analyses (MVA) for. Plastics Injection Molding") A Comparison of Statistical Process Control (SPC) and On-Line Multivariate Analyses (MVA) for Plastics Injection Molding David O. Kazmer, Sarah Westerdale Univ. Mass. Lowell Daniel Hazen MKS Instruments
A Comparison of Statistical Process Control (SPC) and On-Line Multivariate Analyses (MVA) for Plastics Injection Molding David O. Kazmer, Sarah Westerdale Univ. Mass. Lowell Daniel Hazen MKS Instruments
Application note. Guideline for validation of analytical methods using Cedex Bio, Cedex Bio HT, and Cedex HiRes Analyzers.
 Application note Guideline for validation of analytical methods using Cedex Bio, Cedex Bio HT, and Cedex HiRes Analyzers April 216 Doerthe Druhmann, Sabrina Schuette, Dr. Dirk Ponsel Pharma Biotech, Penzberg,
1 of 9 2/7/ :53 PM. Identification of Out-of-Trend Stability Results, Part II PhRMA CMC Statistics, Stability Expert Teams
 1 of 9 2/7/2006 10:53 PM Identification of Out-of-Trend Stability Results, Part II PhRMA CMC Statistics, Stability Expert Teams 2 of 9 2/7/2006 10:53 PM Oct 2, 2005 By: PhRMA CMC Statistics, Stability
Contributed to AIChE 2006 Annual Meeting, San Francisco, CA. With the rapid growth of biotechnology and the PAT (Process Analytical Technology)
") Bio-reactor monitoring with multiway-pca and Model Based-PCA Yang Zhang and Thomas F. Edgar Department of Chemical Engineering University of Texas at Austin, TX 78712 Contributed to AIChE 2006 Annual Meeting,
Bio-reactor monitoring with multiway-pca and Model Based-PCA Yang Zhang and Thomas F. Edgar Department of Chemical Engineering University of Texas at Austin, TX 78712 Contributed to AIChE 2006 Annual Meeting,
Methods for Identifying Out-of-Trend Data in Analysis of Stability Measurements Part I: Regression Control Chart
 Peer-Reviewed Methods for Identifying Out-of-Trend Data in Analysis of Stability Measurements Part I: Regression Control Chart Máté Mihalovits and Sándor Kemény Submitted: March 22, 2017 Accepted: June
many quality problems remain invisible to consumers
 Quality Management 1. Define Quality and TQM. 2. What are the ISO standards and why are they important? 3. What is Six Sigma? 4. Explain how benchmarking is used? 5. What are quality robust products and
Abstract. Materials and Methods. Introduction
 The Performance of Serum-Free and Animal Component-Free Media for Multiple Hybridoma Cell Lines and Culture Systems Heather N. Loke, Steven C. Peppers, Daniel W. Allison, Damon L. Talley, and Matthew V.
Sample Mean Range
 Lesson 14 Statistical Process Control Homework Solved Problem #2: see textbook Solved Problem #4: see textbook Solved Problem #5: see textbook Solved Problem #6: see textbook (manual problem) #1: Checkout
VICH Topic GL2 (Validation: Methodology) GUIDELINE ON VALIDATION OF ANALYTICAL PROCEDURES: METHODOLOGY
 GUIDELINE ON VALIDATION OF ANALYTICAL PROCEDURES: METHODOLOGY") The European Agency for the Evaluation of Medicinal Products Veterinary Medicines Evaluation Unit CVMP/VICH/591/98-FINAL London, 10 December 1998 VICH Topic GL2 (Validation: Methodology) Step 7 Consensus
The European Agency for the Evaluation of Medicinal Products Veterinary Medicines Evaluation Unit CVMP/VICH/591/98-FINAL London, 10 December 1998 VICH Topic GL2 (Validation: Methodology) Step 7 Consensus
PMDA Perspective: Regulatory Updates on Process Validation Standard
 CMC Strategy Forum Japan 2014 Tokyo, Japan, December 8-9, 2014 PMDA Perspective: Regulatory Updates on Validation Standard Kazunobu Oyama, PhD Office of Cellular and Tissue-based Products PMDA, Japan Disclaimer:
FDA Quality Metrics Guidance
 FDA Quality Metrics Guidance Marlène García Swider, Ph.D., CQM, CSSBB Institute of Validation Technology Quality Metrics Conference February 22 24, 2016 Coronado Island, San Diego, CA Personal Claim This
VALIDATION OF THE GRADER S ABILITY USING MEASUREMENT SYSTEM ANALYSIS
 VOL., NO. 5, AUGUST ISSN 8-8 - Asian Research Publishing Network (ARPN). All rights reserved. VALIDATION OF THE GRADER S ABILITY USING MEASUREMENT SYSTEM ANALYSIS Ivan Gunawan and Dwi Agustin Nuriani Sirodj
Application of statistical tools and techniques in Quality Management
 Application of statistical tools and techniques in Quality Management Asst. Professor Dr Predrag Djordjevic University of Belgrade, Technical Faculty in Bor, Serbia QUALITY IN SOCIETY The concept was known
The Use Of Shewart Control Chart In Quality Assessment Of Nimafoam. Adamawa State, Nigeria.
 The Use Of Shewart Control Chart In Quality Assessment Of Nimafoam 1 Balogun O.S., Akingbade T.J. and 1 Akinrefon A.A. 1 Department of Statistics and Operations Research, Modibbo Adama University of Technology,
Benefits of a Standardized PI System
 Benefits of a Standardized PI System Presented by Axel Wils Agenda Introduction Standardized Content, Execution & Visualization Real Examples Other Focus Areas Next Steps 2 What is SPIRIT? Standardize
Do Timber Prices Follow a Random Walk or are They Mean-Reverting? by Jack Lutz 1
 Do Timber Prices Follow a Random Walk or are They Mean-Reverting? by Jack Lutz 1 Abstract 2 Timber price forecasts are important components of timberland investment analysis. Two techniques are widely
Quality Management (PQM01) Chapter 04 - Quality Control
 Chapter 04 - Quality Control") Quality Management (PQM01) Chapter 04 - Quality Control Slide 1 Slide 2 Involves monitoring specific project results to determine if they comply with relevant quality standards, and identifying ways to
Quality Management (PQM01) Chapter 04 - Quality Control Slide 1 Slide 2 Involves monitoring specific project results to determine if they comply with relevant quality standards, and identifying ways to
Six Sigma Black Belt Study Guides
 Six Sigma Black Belt Study Guides 1 www.pmtutor.org Powered by POeT Solvers Limited. Overview of Six Sigma DMAIC Define Define the project targets and customer (internal and external) deliverables. Measure
This document is a preview generated by EVS
 TECHNICAL REPORT RAPPORT TECHNIQUE TECHNISCHER BERICHT CEN/TR 16369 October 2012 ICS 91.100.30; 03.120.30 English Version Use of control charts in the production of concrete Utilisation des cartes de contrôle
Current Features of USFDA and EMA Process Validation Guidance
 Human Journals Review Article April 2016 Vol.:6, Issue:1 All rights are reserved by Patwekar S.L et al. Current Features of USFDA and EMA Process Validation Guidance Keywords: Pharmaceutical validation,
Risk-Based Approach to Method Transfer Jeffrey Staecker, Ph.D. Principal Consultant, BioPhia Consulting
 Risk-Based Approach to Method Transfer Jeffrey Staecker, Ph.D. Principal Consultant, BioPhia Consulting Today s Discussion Background FMEA perspective on method transfer Application examples Wrap-up Abbreviations/Definition
Biopharmaceutical Method Transfer as part of the Quality System.
 Biopharmaceutical Method Transfer as part of the Quality System. Jeffrey Staecker, Ph.D. Principal Consultant, BioPhia Consulting jstaecker@biophia.com 608-698-9918 Experience Involved in method and process
Seven Basic Tools of Quality Control: The Appropriate Techniques for Solving Quality Problems in the Organizations Neyestani, Behnam
 www.ssoar.info Seven Basic Tools of Quality Control: The Appropriate Techniques for Solving Quality Problems in the Organizations Neyestani, Behnam Preprint / Preprint Arbeitspapier / working paper Empfohlene
Report No Air & Emissions Proficiency Testing Program. Round 9. Particulate Matter on Filter Paper. March 2017
 Report No. 1016 Air & Emissions Proficiency Testing Program Round 9 Particulate Matter on Filter Paper March 2017 Acknowledgments PTA wishes to gratefully acknowledge the technical assistance provided
Composite Structure Engineering Safety Awareness Course
 Composite Structure Engineering Safety Awareness Course Definition of A- and B-basis Values and An In-depth Look at CMH-17 Statistical Analysis Techniques Yeow Ng 1 A-Basis and B-Basis Definitions Design
Case Studies ZoBio
 Case Studies 2011 ZoBio ZoBio Corporate Overview Founded as Dutch BV 11/2004 Full access to all lab facilities of UL Self funded (grants and commercial activities) Doubled income 5 consecutive years 9
Address for Correspondence
 Research Paper OPTIMIZATION OF CRITICAL TO QUALITY PARAMETERS OF VERTICAL SPINDLE SURFACE GRINDER 1 Maheshkumar A. Sutar, 2 Anil R. Acharya Address for Correspondence 1 Student, 2 Professor, Government