BEHAVIOUR OF PARTIALLY ENCASED COMPOSITE COLUMNS MADE WITH HIGH PERFORMANCE CONCRETE
|
|
|
- Joan Singleton
- 6 years ago
- Views:
Transcription
1 University of Alberta Department of Civil & Environmental Engineering Structural Engineering Report No. 262 BEHAVIOUR OF PARTIALLY ENCASED COMPOSITE COLUMNS MADE WITH HIGH PERFORMANCE CONCRETE by Brent S. Prickett and Robert G. Driver January 2006
2 Behaviour of Partially Encased Composite Columns Made with High Performance Concrete by Brent S. Prickett and Robert G. Driver Structural Engineering Report 262 Department of Civil and Environmental Engineering University of Alberta Edmonton, Alberta, Canada January 2006
3 Abstract Partially encased composite (PEC) columns consist of a built-up thin-walled I-shaped steel section with links welded between opposing flanges that is infilled with concrete between the flanges. The Canadian steel design standard, CAN/CSA S16-01, permits PEC columns with normal-strength concrete under concentric axial load only. To address these limitations, eleven full-scale PEC columns with high-strength concrete were tested under either concentric or eccentric axial loading. In seven concentric tests, concrete type and link spacing were studied. In four eccentric tests, bending axis and various eccentricities were studied. Test results indicate that the columns attain full composite behaviour, but have a more brittle failure mode than those with normal-strength concrete. However, smaller link spacings or the addition of steel fibres to the concrete improves the failure mode. The current design criteria are conservative for concentrically-loaded high-strength PEC columns. Load moment interaction diagrams agree well with test results from the eccentrically-loaded PEC columns in either orientation. i
4 Acknowledgements This research project was funded by the Natural Sciences and Engineering Research Council of Canada and The Canam Group, Inc. The first author wishes also to acknowledge personal financial support from The Alberta Ingenuity Fund, the University of Alberta, and the Province of Alberta. The first author would also like to thank R. Bannerman for her support and feedback throughout this project. Many other people contributed to the success of the research program. Those who made significant contributions are Dr. B. Massicotte of École Polytechnique de Montréal, R. Meltzer of MRT Construction Ltd. (concrete mix design), J. Dutton of Lafarge Canada Inc., L. Burden, R. Helfrich, J. Little, M. Begum, J. Liu, J. Chapman, and D. Kramar. The help provided by the staff at C-FER Technologies Inc., and in particular F. Wojcik, D. DeGeer, T. Roth, and C. Timms, is appreciated. Support of the research program in the form of construction material donation was received from Lafarge North America, Degussa Admixtures Inc. (Masterbuilders), Sika Canada Inc., and Bekaert Corporation, Building Products Division. Finally, the comments from the academic staff and the graduate students in the Department of Civil and Environmental Engineering at the University of Alberta are also appreciated. ii
5 Table of Contents 1.0 Introduction Background Objectives and Scope Report Organization Literature Review Introduction PEC Columns Fabricated with Standard Sections Hunaiti and Fattah (1994) Elnashai and Broderick (1994) Plumier et al. (1995) PEC Columns Fabricated with Thin-Walled Built-Up Sections Tremblay et al. (1998) Chicoine et al. (2002a) Chicoine et al. (2003) Chicoine et al. (2002b) Bouchereau and Toupin (2003) Begum et al. (2005) Test Program and PEC Column Fabrication Test Program Test Specimen Descriptions Explanation of Test Parameters Column Fabrication Steel Section Fabrication Concrete Mix Design Concrete Placement iii
6 4.0 Material Properties Steel Properties Steel Plate Properties Steel Rod Properties Concrete Properties Concrete Cylinder Test Program and Applicable Standards Concrete Cylinder Results and Analysis Test Setup and Procedures Introduction Testing Machine and Data Acquisition System Setup and Instrumentation for Concentrically-Loaded PEC Columns Setup and Installation Procedure Linear Potentiometers Strain Gauges Setup and Instrumentation for Eccentrically-Loaded PEC Columns Setup and Installation Procedure Linear Potentiometers Strain Gauges Loading Protocols for Concentric and Eccentric Tests Concentric Test Loading Protocol Eccentric Test Loading Protocol Experimental Results for Concentrically Loaded Columns Observations and Failure Modes General Discussion Column H Column H Column H Column H Column H iv
7 6.1.7 Column H Column H Data Obtained from Instrumentation Longitudinal Strain Measured with Linear Potentiometers Longitudinal Strain Measured with Strain Gauges Transverse Strain Measurements and Transverse Stresses Link Stresses Comparison of Column Behaviour to Constituent Behaviour Experimental Results for Eccentrically Loaded Columns Observations and Failure Modes General Discussion Column H Column H Column H Column H Data Obtained from Instrumentation Longitudinal Strain Measured from Linear Potentiometers Longitudinal Strain Measured from Strain Gauges Moment versus Curvature Transverse Strain Measurements and Transverse Stresses Link Strains and Stress Interaction Diagrams for PEC Columns Summary, Conclusions, and Recommendations Summary Conclusions Concentric Load Tests Eccentric Load Tests Recommendations Design v
8 8.3.2 Future Research Appendix A Shop Drawings of the Steel Section and the Rocker End Fixtures Appendix B Local Imperfections in the Steel Flange Appendix C Compression Tests on Grout Appendix D Results of Ancillary Concrete Cylinder Tests Appendix E Additional Results from the Concentrically-Loaded Column Tests Appendix F Additional Results from the Eccentrically-Loaded Column Tests vi
9 List of Tables Table 3-1 Characteristics of Test Specimens Table 3-2 Concrete Mix Design at SSD Conditions Table 4-1 Tensile Test Results for Steel Plate Table 4-2 Tensile Test Results for Steel Rod Table 4-3 Test Region Concrete Cylinder Properties Table 5-1 Strain Gauge Nomenclature for Concentric and Eccentric Setups Table 6-1 Test Load Summary for Concentrically Loaded Columns Table 6-2 Overall Column Test Results Obtained from Lino Pots Table 6-3 Biaxial Stress State of the Steel Plate at Yielding Table 6-4 Link Strain at Peak Load Summary for Concentrically Loaded Columns Table 7-1 Peak Load Summary for Eccentrically Loaded Columns Table 7-2 Overall Column Test Results Obtained from Lino Pots Table 7-3 Biaxial Stress State of the Steel Plate at Yielding Table 7-4 Link Strain Summary for Eccentrically Loaded Columns vii
10 List of Figures Figure 1-1 Cross-Section of a PEC Column... 5 Figure 2-1 Composite Column Types: (a) Concrete Filled Tubes, (b) Fully Encased, (c) Partially Encased Standard Section, and (d) Partially Encased Thin- Walled Built-Up Section Figure 3-1 Geometry of PEC Columns in (a) Steel-Side Elevation, (b) Concrete-Side Elevation, and (c) Plan View Figure 3-2 Bare Steel Section of PEC Column Figure 3-3 Void in Concrete (within ellipse) at Link Created by Bridging of 60 mm Steel Fibres (École Polytechnique) Figure 3-4 Elevation of Workability Meter at (a) Start and (b) End of Testing (dimensions in mm) Figure 3-5 SFR Concrete Workability Meter Results Figure 3-6 Mock Column before Casting Figure 3-7 Column with Formwork for Bottom Lift Figure 3-8 Column with Formwork for Middle Lift Figure 3-9 Column with Formwork for Top Lift Figure 3-10 Intentional Gap at the Top of the Column Figure 3-11 Top Gap Infilled with Grout Figure 4-1 Concrete Mix Placement and Schedule Figure 4-2 Concrete Cylinder Strain Apparatus on a Concrete Cylinder in (a) Plan View and (b) Elevation View Figure 4-3 Typical Stress-versus-Strain Curve for Normal-Strength Concrete (taken from Mix 3) Figure 4-4 Typical Stress-versus-Strain Curve for High-Strength Concrete (taken from Mix 14) Figure 4-5 Typical Stress-versus-Strain Curve for SFR High-Strength Concrete (taken from Mix 7) viii
11 Figure 5-1 Concentric Load Test Setup (South Steel and East Concrete Faces) Figure 5-2 Vertical Lino Pot Layout for Concentrically Loaded Columns in (a) North or South Elevation View and (b) Plan View Figure 5-3 Strain Gauge Layout for Concentrically Loaded Columns at (a) Link Level and (b) Midway between Link Levels Figure 5-4 Eccentric Load Test Setup (North Steel and East Concrete Faces) Figure 5-5 Column Placement on Rocker Assembly for Bending about (a, b) the Strong Axis and (c, d) the Weak Axis Figure 5-6 Rotation and Translation of Rockers Figure 5-7 Vertical Lino Pot Layout for Eccentrically Loaded Columns for Bending about (a) the Strong Axis and (b) the Weak Axis Figure 5-8 Horizontal Lino Pot Layout for Strong-Axis Eccentrically Loaded Columns in (a) South Elevation View and (b) Plan View Figure 5-9 Horizontal Lino Pot Layout for Weak-Axis Eccentrically Loaded Columns in (a) North Elevation View and (b) Plan View Figure 5-10 Strain Gauge Layout for Eccentrically Loaded Columns at (a) Link Level and (b) Midway between Link Levels Figure 6-1 Zone Schematics for Concentrically Loaded PEC Columns with a Link Spacing of (a) 120 mm, (b) 200 mm, and (c) 400 mm Figure 6-2 Crack Pattern on West Face of H1 and Buckle of SW flange in Zone 5 (after test) NW Flange Buckle in Zone 6 not shown Figure 6-3 Crushed Concrete and NE and SE Flange Buckles in Zone 5 on the East Face of H1 (after test) Figure 6-4 Crushed Concrete and NW and SW Flange Buckles in Zone 2 and a Second Buckle of the SW Flange in Zone 3 on the West Face of H2 (after test) Figure 6-5 Crushed Concrete and NE and SE Flange Buckles in Zone 3 on the East Face of H2 (after test) ix
12 Figure 6-6 Crushed Concrete and NW and SW Flange Buckles in Zone 5 on the West Face of H3 and Link Weld Fractures at Elevation 880 and 1000 mm (after test) Figure 6-7 Crushed Concrete and SE Flange Buckle in Zone 3 on the East Face of H3 (after test) NE Flange Buckle in Zone 3 not shown Figure 6-8 Links Fractured from Weld on the West Face (Column H3) Figure 6-9 Weld Fractured from Link on the East Face (Column H3) Figure 6-10 Crushed Concrete and SW Flange Buckle in Zone 4 and NW Flange Buckle in Zone 3 on the West Face of H4 and Link Weld Fracture at Elevation 1000 mm (after test) Figure 6-11 Crushed Concrete and NE Flange Buckle in Zone 2 on the East Face of H4 (after test) SE Flange Buckle in Zone 2 not shown Figure 6-12 Crushed Concrete and NW and SW Flange Buckles in Zone 3 on the West Face of H5 (after test) Figure 6-13 Crushed Concrete and NE and SE Flange Buckles in Zone 2 on the East Face of H5 (after test) Figure 6-14 Crushed Concrete and NW and SW Flange Buckles in Zone 2 on the West Face of H6 (after test) Figure 6-15 Crushed Concrete and SE Flange Buckle in Zone 4 and NE Flange Buckle in Zone 3 on the East Face of H6 (after test) Figure 6-16 Crushed Concrete and NW and SW Flange Buckles in Zone 2 on the West Face of H7 (after test) Figure 6-17 Crushed Concrete and NE and SE Flange Buckles in Zone 3 on the East Face of H7 (after test) Figure 6-18 Column Load versus Average Overall Longitudinal Strain, ε a. Inset: Close-Up of Peak Load Region Figure 6-19 Alternatives for Improving the Column Failure Mode Figure 6-20 Typical Gauge Strains versus Average Overall Strain (from Column H6) Figure 6-21 Typical Load versus Longitudinal Strain (from Column H6) Figure 6-22 NW Flange Strain Behaviour for Column H x
13 Figure 6-23 Typical Buckled Flange Strain Behaviour for Concentrically Loaded PEC Columns (taken from Column H2 NW Flange) Figure 6-24 Link Strain versus Column Strain for High-Strength Concentrically Loaded PEC Columns with and without Steel Fibre Reinforcement Figure 6-25 Column Behaviour of H1 by Constituent Strength Figure 6-26 Column Behaviour of H2 by Constituent Strength Figure 6-27 Column Behaviour of H3 by Constituent Strength Figure 6-28 Column Behaviour of H4 by Constituent Strength Figure 6-29 Column Behaviour of H5 by Constituent Strength Figure 6-30 Column Behaviour of H6 by Constituent Strength with the Adjusted Concrete Cylinder Strength (55.4 MPa) Figure 6-31 Column Behaviour of H7 by Constituent Strength with the Adjusted Concrete Cylinder Strength (60.2 MPa) Figure 7-1 Zone Schematic for Eccentrically Loaded PEC Columns with a Link Spacing of 240 mm Figure 7-2 Crushed Concrete and SW Flange Buckle in Zone 3 on the West Face of H8 (after test) Figure 7-3 Crushed Concrete and SE Flange Buckle in Zone 3 on the East Face of H8 (after test) Figure 7-4 Crushed Concrete and SW Flange Buckle in Zone 3 on the West Face of H9 (after test) Figure 7-5 Crushed Concrete and SE Flange Buckle in Zone 2 on the East Face of H9 (after test) Figure 7-6 Crushed Concrete and SW and NW Flange Buckles in Zone 4 on the West Face of H10 (after test) Figure 7-7 Tension Crack Pattern on the East Face of H10 (after test) Figure 7-8 Crushed Concrete and SW and NW Flange Buckles in Zone 4 on the West Face of H11 (after test) Figure 7-9 Tension Crack Pattern on the East Face of H11 (after test) xi
14 Figure 7-10 Average Strain Distribution due to an Eccentric Load on a PEC Column (Strong-Axis Bending) Figure 7-11 Load versus Strain for Column H Figure 7-12 Load versus Strain for Column H Figure 7-13 Load versus Strain for Column H Figure 7-14 Load versus Overall Strain for Column H Figure 7-15 Typical Average Strain Calculated from Lino Pot Strain Distribution versus Strain Measured by Strain Gauges (taken from Column H9) Figure 7-16 Buckling Behaviour of SE Compression Flange of Column H Figure 7-17 Moment versus Curvature for Eccentrically Loaded PEC Columns Figure 7-18 PEC Column Interaction Diagram for Strong-Axis Bending Figure 7-19 PEC Column Interaction Diagram for Weak-Axis Bending Figure 7-20 Assumed Strain Diagram for PEC Column Interaction Diagram (Strong- Axis Bending) xii
15 List of Symbols a Local initial imperfection amplitude A c A r A s A se b/t b b c b e Cross-sectional area of concrete Cross-sectional area of additional reinforcing steel bars Cross-sectional area of steel shape Effective cross-sectional area of steel shape Width-to-thickness ratio Unsupported flange width Width of concrete stress block Effective flange width b f Full flange width (equals 2b) C c C ec C r C u d D e r E E c (EI) e (EI) PEC f c Total force in concrete stress block Euler buckling load for PEC column Cross-sectional PEC column strength Design capacity for PEC column Column depth Sustained dead load on the column Rocker translation Modulus of elasticity for steel Modulus of elasticity for concrete Effective stiffness for PEC column Theoretical stiffness for cracked PEC column Measured concrete stress (not maximum) f c Maximum measured concrete strength; Design concrete stress f yr F s F y I c I s Yield strength of additional reinforcing steel bars Measured steel strength (not maximum) Maximum measured steel strength Moment of inertia for the concrete section Moment of inertial for the steel section xiii
16 k KL L M u n P u r s t T x α α 1 β 1 ε a ε L ε RS ε T ε y θ λ λ p ν σ L σ T σ VM Ψ Plate buckling coefficient Effective column length Column Length Measured moment at peak load Empirical factor used to relate effective flange width to actual flange width Measured peak load Rocker radius Link spacing Plate thickness Total sustained load on the column Flange depth measurement used for initial imperfection calculation Empirical factor to account for initial imperfections and residual stresses Ratio of average stress in rectangular concrete compression block to concrete strength (CSA 2004c) Ratio of depth of rectangular concrete compression block to depth to the neutral axis (CSA 2004c) Average overall column strain Longitudinal strains in the steel section Residual strains in the steel section Transverse strains in the steel section Yield strain of steel Angle of rocker rotation Column slenderness parameter Steel flange slenderness parameter Poisson s ratio for steel Longitudinal stress in the steel section Transverse stress in the steel section von Mises equivalent stress Parameter to account for size effects on PEC columns xiv
17 1.0 Introduction 1.1 Background Composite columns are constructed using various combinations of steel and concrete in an attempt to utilize the beneficial properties of each material in an economical manner. A partially encased composite (PEC) column is a type of composite column that generally consists of an H-shaped steel section with concrete cast between the flanges. One of the advantages of this type of column over fully encased columns is that it requires formwork on only two sides of the column. In the mid-1990s, the Canam Group Inc. (Canam) developed a new design for PEC columns intended to make it more economical, particularly for mid- and high-rise steel structures. Since then, Canam and several North American universities, led primarily by École Polytechnique de Montréal, have been involved in an aggressive research program to better understand PEC column behaviour and establish design rules. This program has led to the inclusion of PEC columns in the Canadian standard for design of steel structures, CSA S16-01 (CSA 2001). These design provisions permit the use of PEC columns only when loaded concentrically and they contain limitations on the permissible concrete strength (must be less than 40 MPa). The new PEC columns utilize bare steel sections to carry a portion of the dead load and the construction live loads, so that the speed of erection of all-steel construction is maintained. The columns are then cast with the floors and once the concrete has cured, the columns then rely on composite action to support the full dead load and occupancy live load of the building. A typical section of the Canam-type of PEC column is depicted in Figure 1-1. It is composed of a thin-walled welded steel H-shaped section, approximately square in overall dimensions, that is infilled with normal-strength concrete. The H-shape is fabricated from steel plates having the same thickness that are welded continuously along the web flange junction. The width-to-thickness ratios of the flanges, b/t, and the web, (d-2t)/t, are high, and as such the bare steel section is prone to local buckling. Local buckling of the web is prevented by the presence of concrete after curing, but to increase 1
18 the local-buckling resistance of the flanges, links (sometimes referred to as tie bars) are welded between opposing flange tips at regular intervals along the column length. These links also tend to provide some confinement to the concrete. Existing research into thin-walled PEC columns includes only columns fabricated with normal-strength concrete (less than 34 MPa). High-performance concrete (HPC), which generally implies primarily higher strength, has been used successfully in reinforced concrete columns (especially in high-rise construction) and is becoming a regular choice of designers. Concrete strengths of 60 MPa are not uncommon. By providing higher strength, the use of HPC reduces column size, thereby increasing useable floor space. However, high-strength concrete tends to be stiffer and more brittle than normal-strength concrete. The addition of steel fibres to high-strength concrete should produce a HPC with increased ductility. To utilize the advantages of HPC in PEC columns, additional research is required. 1.2 Objectives and Scope The primary objective of this research project is to study the behaviour of PEC columns made with high performance concrete. The main issues to be addressed are: to evaluate the ultimate load and failure mode of PEC columns made with highstrength concrete under concentric and eccentric loading; to determine whether the capacity equations of CSA S16-01 that are currently limited to a concrete strength of 40 MPa can be extended to include PEC columns with higher strength concrete; to propose a means of designing PEC columns made with high-strength concrete that are subjected to both axial load and flexure; to examine whether the current design requirements of CSA S16-01 relating to allowable values of the link size and spacing are adequate for PEC columns made with high-strength concrete; to examine whether the current design requirements of CSA S16-01 relating to allowable flange width-to-thickness ratios are adequate for PEC columns made with high-strength concrete; 2
19 to examine whether the presence of steel-fibres in the concrete improves the failure mode of PEC columns to evaluate the effects of transverse stresses in PEC columns made with high-strength concrete. To achieve the objectives listed above, a total of eleven full-scale PEC columns measuring 400 mm 400 mm 2000 mm were constructed and tested. Seven of these columns were tested under concentric loading. They consisted of two columns with normal-strength concrete, three columns with high-strength concrete, and two columns with high-strength concrete containing steel fibres. Within these sub-groups, the columns varied with respect to the spacing of the transverse links. The other four columns were identical and were cast with high-strength concrete. They were tested under eccentric loading. The amount of eccentricity and the orientation of the columns were varied. 1.3 Report Organization This report is divided into eight chapters. An overview of each remaining chapter follows. Chapter two includes a review of literature pertaining to PEC columns made with standard steel sections and with thin-walled built-up sections (Canam-type of PEC column). The evolution of the CSA S16-01 (CSA 2001) design equations is described. Chapter three presents the test program and details the PEC column parameters to be examined. It also includes a description of the fabrication of the steel section and the placement of the concrete used in the columns. The mix designs of the four types of concrete used in this study are explained. Proportioning the ratio of fine to coarse aggregate with the use of a workability meter in order to achieve good rheological properties is also described. Chapter four presents the mechanical material properties of the steel and concrete used in the fabrication of the PEC columns. These properties were measured during ancillary testing. 3
20 Chapter five presents the test setup for PEC columns loaded concentrically and for the PEC columns loaded eccentrically. A description of the instrumentation, end fixtures, and general loading protocol is included. Chapter six presents the results and observations of the concentrically-loaded PEC column tests. The observations are presented with an overview that is followed by specific observations for each test specimen. The results include longitudinal strains (with a focus on flange buckling) at various locations on the cross-section at a link-level and a mid-link-level elevation, transverse stresses measured in the steel section, axial stresses in the links, and a comparison of measured column strength to strength calculated from the constituent materials. Chapter seven presents the results and observations of the eccentrically-loaded PEC column tests in a similar manner to the description of the concentrically-loaded column results in chapter six. In addition to those observations and results, the moment-versuscurvature relation is examined and the column results are compared to load-versusmoment interaction diagrams. Chapter eight presents a summary of the testing program, conclusions drawn from the results presented in Chapters 6 and 7, and recommendations for design of PEC columns and future research. 4
21 b f t b Link t d Welded Steel H-Shape Concrete Figure 1-1 Cross-Section of a PEC Column 5
22 2.0 Literature Review 2.1 Introduction Composite columns are constructed using various combinations of steel and concrete in an attempt to utilise the beneficial properties of each material. They are typically categorised into three groups: concrete filled tubes (CFT), fully encased composite (FEC) columns, and partially encased composite (PEC) columns (see Figure 2-1). Both CFT and FEC columns have limitations and characteristics that can present construction and erection challenges. For example, CFT sizes are limited and fixed beam-to-column connections require additional fabrication for circular tube shapes. FEC columns require full form-work to support the wet concrete, which can be quite complex at the beam-to-column connections. Nevertheless, CFT and FEC columns can be a practical choice for certain projects. CFT and FEC columns have been studied extensively. However, their behaviour is fundamentally different from PEC columns and they will not be discussed in this review. PEC columns are constructed by infilling an I-shaped (or H-shaped) steel section with concrete between the opposing flanges. Initially, PEC columns were constructed using standard sized rolled steel sections; however, they can also be constructed from thin-walled built-up sections with transverse links to inhibit local buckling of the flanges. Research has also been conducted on PEC columns with additional longitudinal steel reinforcement in an attempt to improve their behaviour. 2.2 PEC Columns Fabricated with Standard Sections Hunaiti and Fattah (1994) Hunaiti and Fattah (1994) tested 19 PEC columns under monotonic eccentric axial loading. The columns were sorted into two groups. The purpose of the first group was to determine if PEC columns would act compositely without additional shear connectors. The purpose of the second group was to determine the behaviour of PEC columns fabricated with either shear connectors or batten plates at various load 6
23 eccentricities. All columns were fabricated from IPE steel sections (German standard size) and had an effective length of 2.4 m. The flange width-tothickness ratio (b/t) for all specimens was 5.9. The first group consisted of ten PEC columns. Of these, five were made with low strength concrete (9.7 MPa) and five were made with normal strength concrete (32.5 MPa). The load eccentricity at one end of the column was 70 mm, while the eccentricity at the other end varied among tests. For all ten tests, the researchers observed that there were no signs of local buckling of the steel flanges or any distortion of the cross-section. Therefore, Hunaiti and Fattah (1994) concluded that the columns were able to develop the full flexural strength of the standard section and that full composite behaviour was achieved. The second group consisted of a total of nine PEC columns. Of these, three had shear studs welded along the centreline of the web, three had 190 mm 20 mm 3 mm steel batten plates welded between the tips of opposing flanges on both sides, and the remaining three had no additional steel added. All were cast with 51 MPa concrete. Each column type was tested at eccentricities of 30 mm, 50 mm, and 70 mm. For each eccentricity, the columns had similar column strength, regardless of whether additional steel was used. From these results, Hunaiti and Fattah (1994) concluded no additional steel was required to achieve full composite behaviour between the infilled concrete and the steel section. However, the researchers recommended the use of mechanical shear connectors in design because the concrete in real structures is affected by factors that are not present in a laboratory setting, such as deceased bond between the steel and the concrete as the concrete ages Elnashai and Broderick (1994) Elnashai and Broderick (1994) tested four PEC columns under cyclic and pseudodynamic loading. All were fabricated with 845 mm long, UC steel sections (British standard size) and infilled with 28 MPa concrete. The b/t ratio for the steel flanges was Before casting the columns, 6 mm diameter steel rods were welded between opposing flanges on both sides of the column to act as transverse links and 7
24 provide increased confinement for the concrete. The rods used by Elnashai and Broderick (1994) were similar to the battens used by Hunaiti and Fattah (1994) except that the rods were welded 10 mm in from the flange tip while the battens were welded at the flange tip. The column behaviour under these loading conditions was compared to previous tests by Elnashai et al. (1991) wherein the columns had, in addition to the transverse links, four 10 mm diameter longitudinal reinforcing bars tied with 6 mm diameter stirrups. The researchers concluded that the capacity of the PEC columns with only the transverse links was marginally less than the PEC columns with the additional reinforcing bars. However, they stated that the fabrication cost savings of the link-only PEC columns significantly offset the minor capacity loss and made the link-only PEC columns a more attractive alternative Plumier et al. (1995) Plumier et al. (1995) tested 12 full-sized test specimens that consisted of a PEC column connected to a PEC beam. The specimens were tested under cyclic loading to examine primarily the behaviour of the joint region. The PEC beams were constructed from 1500 mm long (from the working point in the joint) HE 260 A steel sections (European standard size) that were infilled with 53 MPa concrete. The beam sections were modified by welding 6 mm diameter transverse links 30 mm from the flange tips. The links were spaced at a 150 mm. Two additional 6 mm diameter longitudinal bars were also added at mid-depth. The PEC columns were constructed from 3000 mm long (between inflection points above and below the joint) HE 300 B steel sections that were also infilled with 53 MPa concrete. Similar to the PEC beams, the PEC columns were modified with transverse links and additional longitudinal bars. The b/t ratios for the PEC beams and columns were 10.4 and 14.3, respectively. Two fixed-connection types were used to attach the beams to the columns: bolted and welded. For each connection type, they used three different web thicknesses and two different cyclic testing procedures (total of six specimens per connection type). From these tests, Plumier et al. (1995) observed that neither the connection type nor the web thickness affected the performance of the specimen. Furthermore, they noted that all yielding took place in the 8
25 beams and that the beam flanges always buckled outward due to the presence of the concrete. 2.3 PEC Columns Fabricated with Thin-Walled Built-Up Sections Tremblay et al. (1998) In 1996, a collaboration between The Canam Group Inc. and École Polytechnique de Montréal resulted in a new design concept for a partially encased composite (PEC) column (see Figure 2-1d). The Canam type of PEC column is significantly different from previous research because the steel section was fabricated from relatively thin plates to make the section lighter than standard sections. However, the thin plates are more susceptible to local buckling. Therefore, transverse links, similar to those used by Elnashai and Broderick (1994), were required to prevent local buckling of the bare steel shape. For the initial phase of the research program, six PEC stub columns were tested and analysed by Tremblay et al. (1998). Each column had a square cross-section (either 300 mm 300 mm or 450 mm 450 mm) and a length that was five times the crosssection dimension. As well, each column was fabricated with CSA-G W grade steel and was cast with normal strength concrete (ranging from 32 to 34 MPa). The main parameters examined were the spacing of the links (ranging from half of the cross-section depth to the full cross-section depth), the flange b/t ratio (ranging from 23.2 to 35.4), and the overall size of the columns (as noted above). The b/t ratio for this type of PEC column was much higher than that for PEC columns fabricated from standard shapes (ranged from 5.9 to 14.3) making it more susceptible to local buckling. In addition to the composite columns, ten bare steel specimens of similar dimensions were tested to determine the capacity with a variety of steel shapes (including smooth rod, deformed bar, and steel plate) used as transverse links (Filion 1998). The capacity of the bare steel section was calculated using Canadian standard CSA S (CSA 1994), which uses a reduced effective cross-sectional area in calculating the capacity of members susceptible to local buckling. The mean test-to-predicted ratio of the bare steel columns was 1.22 (Filion 1998), with a low value of The high test-to- 9
26 predicted ratio indicates that the design capacity of the bare steel shape is generally conservative regardless of what steel shape was used as the transverse link. The failure mechanism was similar for all of the composite columns in this study. Failure occurred by crushing of the concrete combined with local buckling of the steel flange near the crushed concrete. Tremblay et al. (1998) observed that columns having larger link spacings exhibited a faster degradation of post-peak strength than columns with smaller link spacings. The researchers concluded that smaller link spacings result in a more ductile response. The column with the largest width-to-thickness ratio had a lower strength than similar columns with stockier flanges and exhibited a sharper drop in post-peak strength. Tremblay et al. (1998) developed a mathematical model to predict the strength of the PEC stub columns. The model calculates the contribution from the steel and the concrete separately and then adds them to predict the overall column strength, C r : C = 0. 85A f + A F (2.1) r c c se In Equation (2.1), 0.85 is a factor that relates concrete cylinder strength to in-situ concrete strength, A c is the cross-sectional area of concrete, f c is the concrete cylinder strength, and F y is the yield strength of the steel. The thin-walled steel section is susceptible to local buckling, so its full cross-sectional area is reduced to an effective steel area, A se, using the effective width method based on von Karman s formula as follows: ( s / b) ( d 2 t + ) se b e y A = t 4 (2.2) b e 1 = α b 1.0 (2.3) λ p 2 ( ν ) b 12 1 Fy λ p = (2.4) 2 t π Ek k = + ( s / b) + ( 2 3ν ) (2.5) π 3π In Equation (2.2), t is the thickness of the steel plate, d is the depth of the crosssection, and b e is the effective half-flange width as calculated using Equation (2.3). In Equation (2.3), α is an empirical factor to account for initial imperfections and residual 10
27 stresses taken by Tremblay et al. (1998) as 0.6, λ p is a slenderness parameter for the flanges as calculated in Equation (2.4), and b is the actual half-flange width. In Equation (2.4), E and ν are Poisson s ratio and Young s modulus for steel. Also in Equation (2.4), k is the plate buckling coefficient calculated using Equation (2.5), wherein s is the centre-to-centre link spacing. Equation (2.5) was developed from energy methods that assumed that the flanges buckled outward between adjacent links. The use of this model (Equations 2.1 to 2.5) produced results that predicted the test results within 3%. Tremblay et al. (1998) recommended that larger specimens be tested to determine if size variations affected the validity of their model Chicoine et al. (2002a) As an extension of the research presented by Tremblay et al. (1998), Chicoine et al. (2002a) tested five PEC stub columns measuring 600 mm 600 mm 3000 mm to determine if size effects were present in the model presented in the earlier work. The columns had 16 mm diameter links, spaced at either 300 mm or 600 mm, and were cast with 34 MPa concrete. Chicoine et al. (2002a) also studied the effects of additional reinforcement by including reinforcing bars and stirrups in one of the five specimens. As well, the transverse stresses in the steel section and the links due to the lateral expansion of the concrete were recorded to determine if they reduced the capacity of the steel section. The bare steel section was studied to determine the shape and extent of local imperfections between the links. Due to the fabrication process, shrinkage of the welds between the web and flanges tends to cause the flanges to bend inward before the links (with a length consistent with the nominal column dimension) are inserted between them and welded in place. Thus, the flanges tend to have a slight residual inward bow between adjacent links. Chicoine et al. (2002a) determined that the local imperfections were more pronounced when the link spacing was larger. Furthermore, comparing with previously tested specimens, they concluded that the local imperfections, when normalized by link spacing, were less on larger specimens. Chicoine et al. (2002a) speculated that the slight 11
28 inward imperfections benefit the local buckling resistance of the steel flange after the concrete has been placed. The failure mechanism observed by Chicoine et al. (2002a) was consistent with previous tests; the concrete crushed as the steel flanges buckled. Nevertheless, it was noted that local buckling began at 75% of the peak load in specimens where the link spacing was equal to the column depth, d. For the columns with link spacings equal to 0.5d, the flanges did not buckle until the peak load and the PEC column underwent a more ductile failure. From these observations, Chicoine et al. (2002a) recommended that PEC columns be designed with a link spacing of 0.5d. The longitudinal and transverse stresses in the steel plate were calculated from strain measurements by assuming a bi-axial stress state. The von Mises stress was also calculated. For all five columns, the transverse stress was found to be negligible and the longitudinal stress to be similar to the von Mises stress until the peak load was reached. Therefore, the researchers concluded that the lateral expansion of the concrete did not induce significant transverse stress in the steel section. Thus, the axial capacity of the column is unaffected by the lateral expansion of the concrete. The columns with links spaced at 0.5d experienced higher stresses (296 to 303 MPa) than the columns with links spaced at d (90 to 151 MPa). Chicoine et al. (2002a) concluded that the higher stresses were due to the increased confinement of the concrete provided by the closer spaced bars. Also, they noted that the increase in link stresses was nearly proportional to the decrease in link spacing. From their results, two conclusions were reached. First, the cross-sectional area of the link should be the greater of: (1) times the column depth, d, times the plate thickness, t; or (2) 100 mm 2. Second, the weld connecting the link to the flanges should be designed such that the link can develop its full yield strength. The capacity prediction model by Tremblay et al. (1998) was found to be less accurate for the 600 mm 600 mm columns than for the smaller specimens tested in the previous research. Therefore, Chicoine et al. (2002a) proposed two significant modifications to the design equations of Tremblay et al. (1998). First, in another paper by the same authors (Tremblay et al., 2000a), it was proposed that Equation (2.3) be 12
29 replaced by Equation (2.6) with n being taken as 1.0 because it resulted in a better fit for the expanded test data set: 2n ( ) ( 1/ 1+ n) b e = b λ (2.6) p Second, the 0.85 term in Equation (2.1) was replaced by the variable Ψ, which accounts for the concrete size effects on the cross-section strength: 22 Ψ = (0.85 Ψ 0.97) (2.7) b Equation (2.1) was therefore rewritten, also including an additional term to account for the possible presence of longitudinal reinforcement, as: C = ΨA f + A F + A f (2.8) r c c se y where A r and f yr are the cross-sectional area and yield strength of the reinforcing bars, respectively. In addition to the five PEC stub columns, three PEC slender columns measuring 450 mm 450 mm 9.75 m were tested (Tremblay et al. 2000b) to measure the global buckling behaviour. Only one slender column was tested with a concentric load and its test load-to-predicted ratio was 1.3. The predicted load for this column was calculated using Equation(2.9). The double exponential format is similar to other slender column capacity calculations found in CSA S16-01 (CSA 2001) ( ) ( 1+ 1/1.34) r yr C = λ (2.9) u C r λ = C C r ec (2.10) EI e C ec = EI 2 π EI = s e ( KL) 2 0.6Ec I c + 1+ D / T (2.11) (2.12) In Equation (2.9), λ is the slenderness parameter defined in Equation (2.10) and C r is the cross-sectional capacity defined in Equation (2.8). In Equation (2.10), C ec is the Euler buckling load for the column defined in Equation (2.11). In Equation (2.11), EI e is the effective stiffness for the composite column defined in Equation (2.12) and KL is the column effective length. In Equation (2.12), E and E c are the moduli of elasticity of the 13
30 steel and the concrete, respectively, I s and I c are the moments of inertia for the steel and the concrete, respectively, and D/T it the ratio of dead load to total column load. For the further development of PEC columns, Chicoine et al. (2002a) recommend the testing of columns in bending due to eccentric loading and the development of a validated finite element model Chicoine et al. (2003) To study the long term behaviour and strength of PEC columns, Chicoine et al. (2003) constructed seven PEC columns to determine the effects of shrinkage, creep, and loading sequence on the axial capacity. Five of the columns measured 300 mm 300 mm 1500 mm. The other two had cross-sectional dimensions of 450 mm 450 mm, with lengths of 2350 mm and 900 mm. The loading sequence was designed to simulate the actual loading sequence in a building. First, the bare steel section was loaded to 100 MPa (compression). Then the concrete was cast into the loaded steel section. Next, 14 days after casting, the columns were loaded to the expected long-term service load and held for 136 days. Finally, 150 days after casting, the columns were loaded to failure. Only a few of the columns went through the entire loading sequence. The others experienced only a part of the sequence, so that their individual results could be extracted from the overall behaviour. This testing scheme allowed the researchers to determine the load distribution between the steel and the concrete at all stages of the test. Strain measurements were taken throughout the 150-day test period. From the results, Chicoine et al. (2003) determined that the compressive stress in the steel due to the shrinkage of the concrete was about 7 MPa. The creep strains obtained during the same period were found to obey accepted models for concrete. The average test-to-predicted ratio for the column capacity (tested after 150 days) was 1.10 based on Equation (2.9), with λ set to 0. From these results, Chicoine et al. (2003) concluded that the axial capacity equation based on short term loading tests, Equation (2.9) (from Chicoine et al. 2002a), could be used to predict the long term axial capacity. 14
31 2.3.4 Chicoine et al. (2002b) Following their own recommendations, Chicoine et al. (2002b) developed a finite element model that agreed with existing test data and that could be used to predict the long term behaviour of PEC columns. Three changes to the existing design equations were recommended in this work. First, to better fit the experimental data, the factor Ψ was reduced by a factor of Second, the value of n = 1.0 in Equation (2.6) may be overly conservative. By adding the long-term tests to the database collected by Tremblay et al. (2000b), Chicoine et al. (2002b) calculated a mean test-to-predicted ratio of 1.00 when n = 2.0 and a ratio of 1.03 when n = 1.5. Considering that larger imperfections than those measured on the test specimens would be acceptable under the fabrication tolerances of the Canadian steel design standard (CSA 2001), the researchers recommended that n = 1.5 be used. Third, the plate stiffness coefficient, k (Equation 2.5), was modified based on the results of elastic finite element buckling analyses of steel column flanges. Its new form, presented in Equation (2.13), assumes a Poisson s ratio of 0.3 in the constants k = ( s / b) , (1 s/b 2) 2 (2.13) ( s / b) It was also noted that their model predicted that the long-term effects on the column due to the shrinkage and creep of the concrete would not adversely affect the axial capacity of the column. Chicoine et al. (2002b) found that, while their model accurately predicted column capacity and strain at peak load, the failure mode could only be predicted properly by implementing initial outward flange imperfections rather than inward, as observed in the test specimens. This was attributed to the inability of the model to reproduce the rapid volumetric expansion of the concrete near peak loading. For the same reason, the model could not trace the post-peak behaviour of the columns. The design equations included in CSA S16-01 (CSA 2001) are based on those presented in this paper, with the exception that the concrete strength multiplier, 0.92Ψ, was replaced with the conservative constant value of 0.8 as follows (excluding resistance factors): 15
32 2.68 ( )( ) ( 0.8A f ' + A F + A f 1+ 1/1.34) C = λ (2.14) u c c se y r yr The variables in Equation (2.14) are calculated using Equations 2.2, 2.4, 2.6, 2.10, 2.11, 2.12 and 2.13, with n taken as Bouchereau and Toupin (2003) Bouchereau and Toupin (2003) tested 22 PEC columns and two PEC beams to determine their behaviour in bending and under cyclic loading. All 22 columns were of dimension 450 mm 450 mm 2250 mm, with 16 mm diameter links spaced at 300 mm (0.67d). The two beams were of dimension 450 mm 450 mm 5000 mm, with 16 mm diameter links spaced at 300 mm. All 24 specimens were fabricated with CSA-G W grade steel plate and 34 MPa concrete. The plate thickness for all 24 specimens was 9.53 mm, resulting in a flange width-to-thickness ratio of Eleven columns and one beam had four additional 20M reinforcing bars tied with 10M stirrups. Thirteen static tests were performed, including six specimens with additional steel reinforcement, and 11 cyclic tests were performed, including six specimens with additional steel reinforcement. The cyclic loading pattern contained a combination of both large and small amplitude cycles. Bouchereau and Toupin (2003) compared the results from cyclic tests with the results from companion static tests. They concluded that a PEC column had similar capacity whether the column was tested cyclically or statically. Furthermore, there was no significant difference in post-peak strength between columns tested cyclically or statically. The use of additional steel bar reinforcement confirmed the previous findings that it increased the ductility of the column with a marginal increase in ultimate column strength. Bouchereau and Toupin (2003) noted that their specimens failed in a ductile manner when subjected to cyclic loading, regardless of the presence of additional steel reinforcement. The column test results were compared to column interaction diagrams constructed by assuming a linear strain distribution across the cross-section. The strain at one extreme fibre was set to the concrete crushing strain and the strain at the other 16
33 extreme fibre was varied to establish points on the diagram in a manner similar to that generally used for deriving interaction diagrams for reinforced concrete columns. A crushing strain of 3500 με was assumed for the concrete. The model neglected local imperfections and local buckling of the steel section. Despite these omissions, the test results fit reasonably well on the PEC column interaction diagram Bouchereau and Toupin (2003) recommended that the PEC column interaction curves could be improved by considering local buckling of the flanges, residual stresses in the steel section, and confinement of the concrete, although it would increase the complexity in producing the interaction diagrams Begum et al. (2005) To improve on the numerical model of PEC columns produced by Chicoine et al. (2002b), Begum et al. (2005) used a damage plasticity model to simulate the concrete behaviour and a dynamic explicit solution strategy. The researchers postulated that the material model would improve the results around the peak load because it is capable of predicting volumetric expansion under low confinement pressures. Moreover, the dynamic explicit method has the potential to predict results in the range beyond the peak load. The stub column test results from Tremblay et al. (1998) and Chicoine et al. (2002a) were compared to numerical model. The mean experimental-to-numerical ratio for the column peak load and longitudinal strain at peak load were 1.00 and 0.98, respectively. The model also gave good agreement with the post-peak response and the failure mode observed during testing. 2.4 Summary and Conclusions The literature review has shown that extensive research has refined the design equation (Equation 2.14) for concentrically-loaded PEC columns. However, the concrete strength allowed in PEC columns by CSA S16-01 (CSA 2001) is restricted to a maximum of 40 MPa because the test specimens used in that research never exceeded 34MPa. Since reinforced concrete columns regularly exceed 40 MPa, this limitation needs to be 17
34 increased to make PEC columns a competitive alternative. Therefore, PEC columns made with high-strength concrete should be tested and the results should be directly compared to the existing research presented in Sections to Furthermore, PEC columns made with high-strength concrete should be tested eccentrically to determine if the interaction diagrams proposed in Section predict well the behaviour of PEC columns under combined axial loading and flexure. 18
 Fully Encased, (c) Partially Encased Standard Section, and (d) Partially Encased Thin-Walled Built-Up Section")
35 (a) (b) b f (c) (d) t b Link t d Welded Steel H-Shape Concrete Figure 2-1 Composite Column Types: (a) Concrete Filled Tubes, (b) Fully Encased, (c) Partially Encased Standard Section, and (d) Partially Encased Thin-Walled Built-Up Section 19
36 3.0 Test Program and PEC Column Fabrication 3.1 Test Program Test Specimen Descriptions Eleven full-scale partially encased composite (PEC) stub columns measuring 400 mm 400 mm 2000 mm were constructed. Figure 3-1 shows typical PEC column geometric parameters. Parameters illustrated in the concrete-side elevation view (Figure 3-1b) are the column length, L, and the centre-to-centre spacing of the links, s. Parameters illustrated in the plan view (Figure 3-1c) are the column depth, d, the overall flange width, b f, the flange width, b (equals half of b f ), and the plate thickness, t. The bare steel section was fabricated from CSA-G W grade steel plate (CSA 2004d). The nominal plate thickness was 7.9 mm, but measured values ranged from 7.95 to 8.02 mm. The nominal flange width-to-thickness ratio for the columns was 25. This value is lower than the maximum flange width-to-thickness ratio of 32 specified by CSA S16-01 (CSA 2001). Four different link spacings were used to study the effect of link spacing on column behaviour. Often, it is more descriptive to discuss link spacing as it relates to the column depth, d, because previous research has found that column behaviour changes with link spacing as it relates to d instead of an absolute value (see Chapter 2). The columns having a link spacing of 400 mm or 1.0d (H2, H5, and H7) have a link diameter of 16 mm to satisfy the requirements of CSA S16-01 Clause (CSA 2001). A link diameter of 12.7 mm satisfies these conditions for the other link spacings of 120, 200 and 240 mm (0.3d, 0.5d, and 0.6d, respectively). The links are set back from the flange tips so that there is 30 mm of clear concrete cover between the link and the concrete face, regardless of the link diameter. Of the eleven columns, seven were cast with high-strength (nominally 60 MPa) concrete, two were cast with steel-fibre reinforced (SFR) high-strength (nominally 60 MPa) concrete, and two were cast with normal-strength (nominally 30 MPa) concrete in the test region. More detail on the concrete used in the PEC columns can be found in Section A summary of the PEC columns characteristics is listed in Table
37 The end zones of the columns (400 mm of column length at each end) were strengthened to prevent possible failure at these locations due to uneven loading. Additional links were added so that the link spacing was 50 mm for the first 100 mm of the end zone and 75 mm from 100 mm to 400 mm (illustrated in Figure 3-1). To further strengthen the end zones, a very-high-strength concrete (nominally 80 MPa) was used Explanation of Test Parameters Test specimens H1 through H7 were designed to examine the behaviour of concentrically loaded PEC columns made with high-strength concrete. Columns H1 and H2 were cast with normal-strength concrete and served as control specimens that could be compared directly to previous research. Columns H3, H4, and H5 were cast with high-strength concrete to investigate their behaviour and failure mode, as well as to evaluate their capacity against existing design equations. Column H3 was fabricated with a 0.3d link spacing to evaluate its ductility and post-peak response versus H4 and H5, which have 0.5d and 1.0d link spacings, respectively. Test specimens H6 and H7 were fabricated with SFR high-strength concrete to evaluate their ductility and post-peak response versus H4 and H5, respectively, primarily to assess the potential benefits of using steel fibres to improve the failure mode. As the smaller link spacing of H3 and the SFR concrete of H6 and H7 were both expected to improve the ductility and post-peak response, the smaller link spacing and the steel fibres are compared to assess which option provides a more ductile response. If the response is similar, the closer link spacing may be a more economical choice if the column is used in a frame, since ductility is required in the plastic moment regions to enable a plastic hinge to form. Since plastic hinges extend over only a small segment of the column length, the link spacing would only need to be decreased in that region. Conversely, if SFR concrete were to be used instead of localised small link spacing, the entire column would have to contain SFR concrete or the SFR concrete would have to be poured in very specific lifts that would cause construction delays. Either of the two SFR concrete options would likely be more expensive than welding in extra bars during the steel section fabrication. 21
38 Test specimens H8 though H11 were designed to have identical physical properties, so that the eccentric loading parameters could be studied. The links were spaced at 0.6d because this spacing is near to the upper limit permitted by standard S16-01 and could be divided equally into the 1200 mm test region. Moreover, it is similar to the ⅔d spacing used in the eccentric load tests of Bouchereau and Toupin (2003). The parameters varied for H8 through H11 are the load eccentricity and the column orientation. Columns H8 and H9 were oriented so that bending took place about the strong axis and they were designed to have eccentricities of 25 mm and 100 mm, respectively. Columns H10 and H11 were oriented so that bending took place about the weak axis and they were designed to have eccentricities of 25 mm and 75 mm, respectively. The eccentricities were chosen so that the failure load would be close to either 85% or 55% of the maximum cross-section capacity in pure compression (C u from Equation 2.14). These two failure loads were chosen because 85% of the axial capacity is the highest permissible design load for reinforced concrete columns and 55% will typically produce a strain state across the cross-section where one side of the column is in compression and the other is in considerable tension. A PEC column interaction diagram (derived using the methods described in Section 2.3.5) was used to determine the required eccentricities. To simplify the test setup, the values obtained from the interaction diagrams were rounded to the nearest 25 mm (more information on the test setup can be found in Section 5.3). 3.2 Column Fabrication Steel Section Fabrication The steel sections were fabricated by The Canam Group Inc. in Laval, Quebec during the fall of Canam constructed them according to the design drawings in Appendix A. The steel sections were fabricated using a similar process to previous PEC column tests conducted at École Polytechnique de Montréal. First, the web and the flanges are cut from the same steel plate so that the mill rolling direction of the plate matches the longitudinal axis of the steel section. Second, they are fillet welded continuously on both 22
39 sides of the web along both web-flange junctions. As the built-up section cools, the opposing flanges tend to curl slightly inward. Third, the links, cut to the required nominal dimension, are forced between the opposing flanges and then welded in place. Finally, 25 mm plates are welded onto the ends of the section to ensure even loading of the column during testing. Figure 3-2 shows the completed steel section. Installation of the links restores the flanges to their design locations; however, the flange lengths between the links retain a slightly inward imperfection (although a few outward imperfections were also observed). The initial local imperfections between the links tended to be more pronounced with higher link spacing: mean measured values of 0.05 mm for 0.3d spacing, 0.31 mm for 0.5d spacing, 0.43 mm for 0.6d spacing, and 1.02 mm for 1.0d spacing. This trend occurs because smaller link spacings reduce the unsupported flange length. The frequency of occurrence of outward local imperfections between the links tended to decrease with higher link spacings: 13 out of 40 measurements for 0.3d spacing, 5 out of 72 for 0.5d spacing, 2 out of 80 for 0.6d spacing, and 0 out of 36 for 1.0d spacing. The majority of the outward imperfections in Column H3 (0.3d) occurred in the NW and SE flanges. Initial imperfection data for the flanges can be found in Appendix B Concrete Mix Design Concrete Constituents The main properties of interest during the mix design were strength and workability. Trial batches of all mixes were made to ensure the desired properties were obtained. To minimise problems during casting, all concrete was designed to be semiself-consolidating concrete (SSCC) to provide good rheological properties. To cast the PEC columns, four types of concrete were used: normal-strength, high-strength, SFR high-strength, and very-high-strength. Their mix designs are presented in Table 3-2. The concrete was made with locally available materials. CSA Standard A23.1 (CSA 2004a) Group 1, 14 mm crush coarse aggregate was used. The fine aggregate satisfied CSA Standard A23.1 and had a fineness module of Both aggregates are typical of the Edmonton area. Lafarge type-10 cement was used in all four concrete 23
40 types, Masterbuilders silica fume and Glenium 3030 high-range water reducer (superplasticizer) were used in the high-strength, SFR high-strength, and the very-highstrength concrete, and Lafarge fly ash was used in the very-high-strength concrete only. The steel fibres used were Bekaert Dramix 65/35. The length of these fibres is 35 mm and the diameter is 0.55 mm. This size was chosen because the clear space between the links and the formwork is 30 mm. Initially, 60 mm steel fibres were chosen as they were readily available. However, during the pouring of a mock column (H-section built of plywood instead of concrete and steel reinforcing bars used for links) with a 30 mm clear space, it was found that voids in the concrete are likely to form due to bridging if the fibres are much longer than the clear space dimension (see Figure 3-3). Each end of the steel fibre is deformed to resist against pull-out. As shipped, the steel fibres are grouped together, like staples, with water-soluble glue. As the glue dissolves in the mixer, individual fibres are released from the group. This provides a good distribution of fibres in the mix and prevents initial clumping of the fibres when added to the mix. The normal-strength concrete mix design was typical of normal-strength concrete previously batched at the University of Alberta. The constituent proportions were selected primarily based on experience with the mix. The high-strength concrete required silica fume and superplasticizer to achieve the desired properties. Silica fume was added to avoid bleeding and superplasticizer was added to facilitate placement of the concrete. Silica fume is approximately 1/100 the size of cement, it has more surface area per unit of volume, and holds more water in the paste. The addition of too much silica fume is uneconomical and will greatly increase the heat of hydration. An increased heat of hydration can prevent the concrete from achieving its full strength. The internal temperature of the concrete during the first 40 hours was monitored at several locations in some columns with thermocouples using a digital logging thermometer and was confirmed not to be excessive. The SFR high-strength concrete was formulated to have similar properties to those of the unreinforced high-strength concrete. The quantity of steel fibres in the mix (80 kg/m 3 ) accounts for 1% of the total volume. This amount was chosen because there are enough fibres to influence the ductility of the concrete, but not so many that the concrete is difficult to batch and place. A workability meter was used to proportion the 24
41 quantities of sand and gravel. The workability meter is discussed further in Section The very-high-strength concrete required fly ash, silica fume, and superplasticizer to achieve the desired properties. A portion of the cement was replaced with fly ash to reduce the heat of hydration. Fly ash hydrates slower than cement, thereby producing heat at a slower rate. As well, fly ash is less expensive compared to cement, so it is typically found in concrete containing large quantities of cementitious material. During trial batching, fly ash was observed to improve the rheological properties of the concrete. The silica fume was added to inhibit bleeding and superplasticizer was added to facilitate placement of the concrete Use of a Workability Meter for SFR Concrete Mix Design A workability meter is a tool used to measure the flow of vibrated concrete. The workability meter used for optimizing the mix design of the SFR high-strength concrete was adapted from the French standard, AFNOR NF P (AFNOR 1988) and is illustrated in Figure 3-4a. The workability meter is placed on a vibration table and the mould side of the meter is filled to the top with wet concrete. The concrete should not be compacted, but care must be taken to eliminate air voids when placing the concrete. To begin the test, the vibration table is turned on while simultaneously removing the gate by sliding it upwards. The test is complete when the concrete has covered ⅔ of the timer line (Figure 3-4b). The time required to complete the test is recorded. Viscous concrete will require more time to reach the timer line than fluid concrete. A workability meter is useful for finding the optimum ratio of fine aggregate to coarse aggregate for maximum workability. By varying this ratio and recording the times obtained from a workability meter, a plot of time versus fine aggregate to coarse aggregate ratio can be generated. The minimum value of the plot is the optimum ratio of fine to coarse aggregate. For the fibre concrete mix described in Section , the optimum ratio of fine aggregate to coarse aggregate was found to be 1.07 by weight based on a parabolic least squares regression of the test data (Figure 3-5). The actual value used in the mix for the test columns was The reason for the adjustment is that 25
42 the sample used to obtain the moisture content of the fine aggregate did not accurately represent the characteristics of the fine aggregate in the bin during the batching of the test columns. While the fine aggregate was being added to the mixer, it was observed that it appeared moister than the pre-batching sample had been. Another small sample was taken and the actual amount of fine aggregate that had been used in the column concrete was found after batching to be less than originally calculated. Thus, a slightly lower fine aggregate to coarse aggregate ratio was used for the test columns. As can be seen from Figure 3-5, this difference has a very small effect on workability. The times obtained with the workability meter are dependent on the following factors: the concrete ingredients, the vibrating energy, the workability meter dimensions, and the surface friction between the concrete and the meter. Therefore, the readings are more meaningful when compared with each other than when compared to a fixed value. The workability meter can be used for quality control if the factors listed above are standardised Concrete Placement All concrete was produced in the batching facility of the I.F. Morrison Structural Engineering Laboratory at the University of Alberta. This option allowed tighter control on the batching procedures as compared to ready-mix concrete. Due to the capacity of the mixer, two columns were cast per day for four casting days and three were cast on the fifth day. Concrete cylinders (100 mm diameter) were also cast in order to determine the material properties of the concrete (see Chapter 4). In order to test and practice the batching, placing, and vibration techniques, and to assess the quality of the resulting concrete finish around the links, a mock column (see Figure 3-6) similar to the one discussed previously was constructed and cast with 60 MPa concrete on one side and SFR concrete on the other. The operation was successfully executed and the resulting quality of the concrete surfaces was good. Of particular note, no bridging of the steel fibres occurred at the link locations. Since the column end zones were designed to have higher strength concrete than the test region (see Figure 3-1), three different lifts were required for each column. 26
43 Formwork was placed in corresponding lifts so that the bottom and middle lifts could be placed from the side of the column and only the top lift was placed through the four 76 mm diameter holes in the top end plate. Figure 3-7 shows the first level of formwork. Concrete was placed with pails up to the top of the formwork. Figure 3-8 shows the second level of formwork and the chute that was used. The chute facilitated placement of the test-region concrete. It also provided the steel-fibre reinforced concrete with a sufficient amount of kinetic energy to randomly distribute the steel fibres within the column. Figure 3-9 shows the top level of formwork and the hopper that was used on top of the column. The hopper contained the overflow as the concrete passed through the top plate openings. The top lift of concrete was intentionally left one inch below the top end plate and subsequently grouted to accommodate concrete shrinkage (Figures 3-10 and 3-11). The individual lifts of concrete were placed in rapid succession to prevent cold joints. Each lift was internally vibrated into the previous lift, although care was taken not to over-vibrate the semi-self-consolidating concrete. The end zones were each placed in one lift and the test region was placed in three lifts. Formwork was removed after 24 hours. The columns were then wrapped in plastic for 7 days. After the plastic was removed, the columns were air cured until testing. The remaining top gap was filled with Sikadur AG Grout Rapid, which is a highstrength, non-shrinkage, fast-setting epoxy grout. This was done one week before testing began. To determine the strength of the grout, a 25 mm thick sample was cast between two plates. The grout sandwich was then compressed to determine the stress-versusstrain curve of the material. The grout had a 24-hour compressive strength of 97 MPa. More information on this test can be found in Appendix C. 27
44 28 Table 3-1 Characteristics of Test Specimens Section Length Flange Width- Link Nominal Thickness Steel Fibre to- Concrete Column b f d L of Plate, t Thickness, b/t Spacing Diameter Density Strength (mm) (mm) (mm) (mm) Ratio of d (mm) (kg/m 3 ) (MPa) H d H d H d H d H d H d H d H d H d H d H d
45 Table 3-2 Concrete Mix Design at Saturated Surface Dry (SSD) Conditions Material Normal Strength High Strength SFR High Strength Very-High Strength Water (kg) Cement (kg) Silica Fume (kg) Fly Ash (kg) Coarse Aggregate (kg) Fine Aggregate (kg) Superplasticizer (L) Steel Fibres (kg) W/C Ratio* * The W/C ratio is the ratio of water to total cementitious materials (cement, fly ash, and silica fume). 29
 Figure 3-1 Geometry of PEC Columns in (a) Steel-Side Elevation, (b) Concrete-Side Elevation, and (c) Plan")
46 Elevation (mm) Closer Link Spacing in 1 d End Zone 1200 Link 800 L s Test Region Closer Link Spacing in 1 d End Zone (a) (b) Welded Steel H-Shape t Link typ typ t d b b f (c) Figure 3-1 Geometry of PEC Columns in (a) Steel-Side Elevation, (b) Concrete-Side Elevation, and (c) Plan View 30

47 Figure 3-2 Bare Steel Section of PEC Column 31

 TIMER LINE")
 Start and (b) End of Testing")
48 Figure 3-3 Void in Concrete (within ellipse) at Link Created by Bridging of 60 mm Steel Fibres (École Polytechnique) a) 310 TIMER LINE 130 GATE CONCRETE DEPTH = 340 b) TIMER LINE CONCRETE Figure 3-4 Elevation of Workability Meter at (a) Start and (b) End of Testing (dimensions in mm) 32


49 Time (s) Fine Aggregate to Coarse Aggregate Ratio (by Weight) Figure 3-5 SFR Concrete Workability Meter Results Figure 3-6 Mock Column before Casting 33


50 Formwork for bottom lift Figure 3-7 Column with Formwork for Bottom Lift Formwork for middle lift Chute Column H11 Column H10 Column H3 Figure 3-8 Column with Formwork for Middle Lift 34


51 25 mm space between top lift formwork and top end Overflow hopper Figure 3-9 Column with Formwork for Top Lift 25 mm gap Figure 3-10 Intentional Gap at the Top of the Column 35


52 Grout Thickness Figure 3-11 Top Gap Infilled with Grout 36
53 4.0 Material Properties 4.1 Steel Properties Steel Plate Properties All steel plates used to construct the 11 steel sections of the columns were produced in a single heat that met the requirements of G40.21 grade 350W (CSA 2004d). Six tension coupons were tested to determine the material properties. Three of the coupons were cut parallel to the rolling direction of the plate (corresponds to the longitudinal column axis) and three were cut transverse to the rolling direction. The coupons were tested according to ASTM Standard A370 (ASTM 2003). All coupon tests were conducted in an MTS 1000 universal testing machine, with a tensile capacity of 1000 kn, at the I.F. Morrison Structural Engineering Laboratory at the University of Alberta. Load measurements were taken using the internal load cell of the MTS An extensometer with a 50 mm gauge length was used to measure elongations. Two strain gauges were applied to the first specimen to confirm the extensometer readings. The readings from the extensometer and the strain gauges were in agreement, so only the extensometer was used for the remaining tests. Three static readings were taken on the yield plateau and one static reading was taken at the ultimate load. The extensometer remained in place right up to the rupture strain. The stress-versus-strain curves generated are typical of hot-rolled structural grade steels. The results of the steel-plate tension coupon tests can be found in Table 4-1. The results are grouped by the column axis to which they corresponded: longitudinal or transverse. The coefficient of variation of each of the parameters presented is low (1.5% or less) within each group, except for that of the rupture strain in the transverse group (4.6%). The coefficients of variation are also low if the longitudinal and transverse groups are combined (1.0% or less), with the exception of the hardening strain (3.2%) and the rupture strain (4.0%). These latter two strain parameters tend to be more variable than the others within a heat of steel and are considered to be within typical levels of variability. This suggests that the material properties can be considered independent of the rolling direction for this heat of steel plate. 37
54 4.1.2 Steel Rod Properties All links of a particular diameter were cut from rods from the same heat of steel, as were additional pieces acquired for material testing. Four tension coupons were tested from the steel rods. Two of the coupons were cut from the 16 mm steel rod used as links on three of the specimens (H2, H5, and H7). The other two were cut from the 12.7 mm steel rod used as links on the remaining specimens (H1, H3, H4, H6, H8, H9, H10, and H11). The coupons were tested according to ASTM Standard A370 (ASTM 2003). All coupon tests were conducted in an MTS 1000 universal testing machine at the I.F. Morrison Structural Engineering Laboratory at the University of Alberta. Loads and strains were measured in the same way as for the plate coupons. Again, two strain gauges were applied to the first specimen to confirm the extensometer readings. Two static readings were taken on the yield plateau, and one static reading was taken at the ultimate load. Due to the large strains achieved, the extensometer was removed after the ultimate load, but before fracture of the coupon. Following fracture, the two coupon pieces were fit together at the fracture surface and the final elongation was measured across the initial 50 mm gauge length with digital callipers. The final elongation is used to determine the rupture strain. The stress-versus-strain curves generated are typical of hot-formed steel rod. The results of the steel-rod tension coupon tests can be found in Table 4-2. The coefficients of variation for the yield stress, ultimate stress, elastic modulus, and yield strain are low for both sizes of steel rod (2.0% or less). The coefficients of variation are somewhat higher for the hardening strain (up to 9.2%) and the rupture strain (up to 4.6%). Measurement error arising from fitting the two pieces together after the test may account for some of the scatter in the rupture strains. 4.2 Concrete Properties Concrete Cylinder Test Program and Applicable Standards A total of 21 mixes were required to batch the 11 partially encased composite (PEC) columns. The placement and batch date of each mix is illustrated in Figure
55 The numbers inside the schematics of the columns in the figure indicate the concrete mix that was placed in that lift. The date to the right the column indicates the respective casting date (year 2005). For example, column H9 was cast with mix 13 in the bottom zone, mix 15 in the middle zone, and mix 16 in the top zone. All three of these mixes were batched on April 27, All three zones of each column were cast within a period of about 4 hours. As discussed in Section 3.2.3, the columns were cast in pairs, except for columns H3, H10, and H11, which were cast together. In order to determine the material properties, 100 mm diameter concrete cylinders were cast from each mix according to CSA Standard A23.2-3C (CSA 2004b). Some of the cylinders were placed near the columns and cured under the same environmental conditions, as described in Chapter 3, to determine the concrete strength, the elastic modulus, the strain at peak load, and the Poisson s ratio on the test date. These mechanical properties were used to analyse the test specimen behaviour. The remaining cylinders were moist-cured according to CSA Standard A23.2-3C and tested at 28 days to determine the concrete strength (CSA 2004b). The 28-day strength of the moist-cured concrete was measured because this value is typically used to determine the design strength of concrete, f c, and would be used in the design of partially encased composite columns (see Equation 2.14). To obtain the concrete strength and the strain at peak load, cylinders were tested according to CSA Standard A23.2 (CSA 2004b). To obtain the elastic modulus and the Poisson s ratio, cylinders were tested according to ASTM Standard C469 (ASTM 2002). The elastic modulus can be determined according to either standard, but ASTM Standard C469 provides an assessment of repeatability, as each cylinder is loaded three times (ASTM 2002). CSA Standard A23.2 specifies that the cylinder be loaded only once (CSA 2004b). As dictated by both standards, the elastic modulus is the secant modulus taken at 40% of the peak strength on a stress-versus-strain curve. All cylinders were capped with a high-strength capping compound prior to testing to ensure uniform bearing in the testing machine. Cylinders tested according to CSA Standard A23.2 were tested using an MTS 2700 compression testing machine, with a capacity of 2670 kn, at the I.F. Morrison Structures Laboratory at the University of Alberta. Stresses were obtained using load data from the MTS 2700 load cell. Proper calibration of the load cell was verified before 39
56 and after the test to ensure accuracy. Strains were obtained using the apparatus illustrated in Figure 4-2. The apparatus consisted of two collars connected near the top and bottom of the concrete cylinder with pointed clamping screws. One linear variable displacement transducer (LVDT) was suspended from each side of the top collar. The other end of each LVDT (an extension of the spindle core) rested on the bottom collar, resulting in a gauge length of approximately 100 mm. The use of two LVDTs improved the accuracy of the readings. Measurements taken of the initial distance between the collar attachment points (i.e., at the clamping screws) allowed for calculation of the strains from the average LVDT displacement measurements. Cylinders tested according to ASTM Standard C469 to obtain the elastic modulus and Poisson s ratio were loaded using an Amsler compression testing machine, which has a capacity of 1000 kn. Load readings were recorded from the Amsler s dial gauge. Load readings from the Amsler were compared to readings from an independent load cell to ensure accuracy. The apparatus used to measure the relevant displacements, with a pair of dial gauges oriented in perpendicular directions, is illustrated in ASTM Standard C469 Section 4 (ASTM 2002) Concrete Cylinder Results and Analysis Although material properties were determined for all 21 mixes, the mixes placed within the test region are the focus of this section. This is because the test-region concrete properties govern the column behaviour. It is worth noting, however, that the average test-day strength of the end-zone concrete was 76 MPa, considerably higher than in the test region. Additional information on the end-zone concrete material properties can be found in Appendix D. The concrete properties of the test-region mixes are summarized in Table 4-3. Strength values presented in the table are the average of three to five cylinder tests. For all cases, the test-region strength was lower than the end zone strengths within the same column. The Poisson s ratio and the elastic modulus were not obtained for mixes 3 (column H1), 7 (column H6), and 11 (column H4) because the cylinders allotted for testing were damaged. Instead, the values reported in Table 4-3 for these mixes are the average for that particular concrete type. Typical stress-versus-strain 40
57 curves for the normal strength concrete, high-strength concrete, and steel-fibre reinforced (SFR) high-strength concrete obtained from this study are illustrated in Figures 4-3 to 4-5, respectively. Stress-versus-strain curves for all test-region mixes can be found in Appendix D. The normal-strength concrete and the high-strength concrete mixes had material properties similar to the expected values obtained from trial batching. Both concrete types had a slight gain from the 28-day, moist-cured strength to the test-day, air-cured strength. The normal-strength concrete and the high-strength concrete gained 1.6 MPa and 2.0 MPa, respectively, on average. Considering that the typical concrete density for the mixes was 2300 kg/m 3, the elastic moduli for the normal-strength concrete (23.3 GPa) and high-strength concrete (28.8 GPa) are within typical ranges for Canadian concretes (19.8 GPa to 29.7 GPa and 26.4 GPa to 39.6 GPa, respectively) as noted in CSA Standard A23.3 Clause (CSA 2004c). The average strain at peak stress for the normalstrength concrete is 2225 με, which is a typical value. However, the corresponding value for the high-strength concrete is 2992 με, which is slightly higher than typical values. The Poisson s ratio for the normal-strength concrete (0.13) is typical of accepted values (0.11 to 0.21) for normal-strength concrete (MacGregor and Bartlett 2000). Typical values of the Poisson s ratio for high-strength concrete are comparable to those of normal-strength concrete according to the American Concrete Institute s Manual of Concrete Practice report 363R-92 (ACI 1997). Therefore, the Poisson s ratio for the high-strength concrete (0.16) is also within the typical range. The SFR high-strength concrete did not perform as the trial batches indicated it would. Unlike the other types of concrete, the SFR high-strength concrete lost strength from the 28-day moist-cured to the test day air-cured concrete. This happened despite the fact that all concrete cylinders were sampled, cured, and prepared for testing in a similar manner. The high-strength concrete had a similar mix design to the SFR high-strength concrete (see Chapter 3), and it had a strength gain of 3.4% (2.0 MPa) from the 28-day test strengths to the test-day strengths. If the SFR high-strength concrete had had a similar strength gain (3.4%), the test-day strengths would have been 60.2 MPa for Mix 6 and 55.4 MPa for Mix 7. However, the actual test day strengths were 52.9 MPa and 49.3 MPa, respectively. The elastic modulus for the SFR high-strength concrete 41
58 (24.8 GPa) was within the typical range (24.4 GPa to 36.6 GPa for 51.1 MPa concrete) noted in CSA Standard A23.3 Clause (CSA 2004a). The average strain at peak stress for the SFR high-strength concrete is 2670 με, which is lower than the highstrength concrete (2992 με). However, if the stress-versus-strain curve of the SFR highstrength concrete (Figure 4-5) would have continued up to the speculated concrete strength (strength gain of 3.4%), then the average strain at peak stress would have been similar to that of the high-strength concrete. 42
59 Static Yield Stress 1 Static Yield Stress 2 Table 4-1 Tensile Test Results for Steel Plate Static Yield Stress 3 Average Static Yield Stress Static Ultimate Stress Elastic Yield Hardening Rupture Coupon Modulus Strain Strain Strain (MPa) (MPa) (MPa) (MPa) (MPa) (MPa) (με) (με) (με) Longitudinal L L L Average Std. Dev Coeff. Var (%) Transverse T T T Average Std. Dev Coeff. Var (%) Combined Average Std. Dev Coeff. Var (%)
60 Static Yield Stress 1 Table 4-2 Tensile Test Results for Steel Rod Static Yield Stress 2 Average Static Yield Stress Static Ultimate Stress Elastic Yield Hardening Rupture Coupon Modulus Strain Strain Strain (MPa) (MPa) (MPa) (MPa) (MPa) (με) (με) (με) 12.7 mm Link R R Average Std. Dev Coeff. Var (%) mm Link R R Average Std. Dev Coeff. Var (%)
61 45 Table 4-3 Test Region Concrete Cylinder Properties Strength Strain Concrete Type Column Mix 28 day Test day Strength Increase (28 day to Test day) Elastic Modulus at Peak Load (MPa) (MPa) (MPa) (%) (GPa) (με) Normal Strength Poisson s Ratio H % * H % Average % High Strength H % H % * H % H % H % H % H % Average % SFR High Strength H % * H % Average % * Average value for the concrete type used.
62 4 Apr-19 4 Apr Apr Apr Apr-25 8 Apr-22 3 Apr-19 2 Apr Apr Apr Apr-25 7 Apr-22 1 Apr-19 1 Apr Apr-29 9 Apr-25 9 Apr-25 5 Apr-22 H1 H2 H3 H4 H5 H6 8 Apr Apr Apr Apr Apr Apr Apr Apr Apr Apr-29 5 Apr Apr Apr Apr Apr-29 H7 H8 H9 H10 H11 Figure 4-1 Concrete Mix Placement and Schedule

 Plan View and (b) Elevation View")
63 LVDT (a) Screw Concrete Cylinder (b) Figure 4-2 Concrete Cylinder Strain Apparatus on a Concrete Cylinder in (a) Plan View and (b) Elevation View 47
64 40 30 Stress (MPa) Strain (με) Figure 4-3 Typical Stress-versus-Strain Curve for Normal-Strength Concrete (taken from Mix 3) Stress (MPa) Strain (με) Figure 4-4 Typical Stress-versus-Strain Curve for High-Strength Concrete (taken from Mix 14) 48
65 Stress (MPa) Strain (με) Figure 4-5 Typical Stress-versus-Strain Curve for SFR High-Strength Concrete (taken from Mix 7) 49
66 5.0 Test Setup and Procedures 5.1 Introduction All partially encased composite (PEC) columns were tested at the C-FER Technologies Inc. laboratory in Edmonton, AB during June and July, Seven of the columns (H1 through H7) were tested with fixed-end conditions and loaded concentrically. The remaining four columns (H8 through H11) were tested with pinnedend conditions and loaded eccentrically. The two test setups (concentric and eccentric) required a different combination of end fixtures and instrumentation, but they utilised the same testing machine and data acquisition system. 5.2 Testing Machine and Data Acquisition System All tests were performed using a Universal Testing System (UTS) machine that has a loading capacity of 15 MN. The UTS actuator, which is attached to a moveable crosshead, applies a compressive force from above and has a maximum stroke of 250 mm. The base of the UTS sits on a strong floor. The data acquisition system used consisted of Pacific Instruments 3210 signal conditioners, a National Instruments PCI 6052 data acquisition board, and a PC running LabVIEW data acquisition software. A total of 41 data acquisition channels were required to monitor the instrumentation used on the eccentric axial tests, while 30 channels were needed for the concentric tests. Each data channel, with the exception of the UTS load and stroke channels, was verified before each test to ensure correct readings. Strain gauge channels were verified by shunt calibration using two known resistances. Displacement channels were verified by moving the instrumentation a known distance and comparing it to the channel output. The UTS instruments are frequently calibrated and their channels verified according to a regular schedule. Real-time graphs of the key data were displayed during loading to assist in controlling the tests. 50
67 Laboratory safety regulations do not permit personnel near the UTS while it is operating, so a stationary video recorder was placed beside the UTS. The video recorder provided a feed to a monitor near the computer, creating a safe observation centre. An additional stationary digital camera with a zoom lens was placed at the periphery of the test area and was used to take photographs of the specimens during the tests. 5.3 Setup and Instrumentation for Concentrically-Loaded PEC Columns Setup and Installation Procedure The test setup was similar for each of the seven columns (H1 through H7) tested with a concentric axial load. The column was placed in the UTS and grouted at both ends to provide uniform bearing and a fixed end condition. Figure 5-1 shows the concentric load test setup. The procedure used to ready the specimen was the same for all seven tests. First, the specimen was centred underneath the UTS actuator. Second, the column was aligned vertically with the aid of an external collar system that has three levelling screws and guide bars oriented in the two orthogonal plan directions. Third, the column was lifted by an amount just sufficient to place the grout underneath and then lowered into the grout. The external collar system ensured that the column returned to the original plan position and also remained plumb. However, the vertical alignment was rechecked at this stage. Finally, after the bottom grout had gained sufficient strength to support the weight of the column (a minimum of 2 hours), the external collar system was removed and the top of the column grouted. The grout was then allowed to cure for 16 hours before testing. The average grout thickness at each end of the column was 2 mm. The grout used was Con-Spec Rapid Repair Mortar that was found to have a confined compressive strength greater than 160 MPa on an 8 mm thick sample. More information on this test can be found in Appendix C. Before the test began, an external clamping collar was installed at the top of the column. The top 25 mm of the column was filled with an epoxy grout (see Section 3.2.3) 51
68 that was stronger than the concrete, but had a lower modulus of elasticity (4 GPa see Appendix C). As such, the collar was installed to eliminate any possibility of premature flange buckling in the top 25 mm. It is shown in Figure Linear Potentiometers Eight linear potentiometers (lino pots) were aligned vertically to measure the axial shortening of the column. Figure 5-2 is a schematic showing the configuration of the vertical lino pots. Lino pots 1 and 2 measured vertical displacements across the 3d test region, where d is the nominal dimension of the column, (elevation 400 mm to 1600 mm) that were used to calculate the average vertical strain for the column. These lino pots were placed in opposite corners to assess whether the column was undergoing uniform strain across the cross-section. The remaining six lino pots were used to measure the vertical displacements across the individual sections of length d in the 3d test region: bottom (elevation 400 mm to 800 mm), middle (elevation 800 mm to 1200 mm), and top (elevation 1200 mm to 1600 mm). For each individual d section, one lino pot was placed on each side of the column adjacent to the column web. The first letter of their names indicates in which section they are located (for example, B3 is located in the bottom section of the test region). The average of the two lino pots from each section was used to calculate the vertical strain in that section. For a concentric test, horizontal displacements are expected to be negligible. To confirm this, another two lino pots (CT1 and CT2) were used to measure the horizontal displacements of the column at mid-height (elevation 1000 mm). (CT is an acronym for column transverse, meaning that the lino pot is transverse to the longitudinal column axis.) CT1 measured the north south displacement from a stationary object and CT2 measured the east west displacement. For Columns H1 through H7, the average out-ofplane measurement taken at the respective peak load from CT1 or CT2 was 0.19 mm. The maximum observed value was 0.58 mm, thereby confirming that horizontal displacements were negligible. 52
69 5.3.3 Strain Gauges A total of 18 strain gauges were used on each of the concentrically loaded columns, as shown in Figure 5-3. Table 5-1 lists the nomenclature used to identify the strain gauges, which is based on their location and orientation. Inside indicates that the gauge is on the side of the steel flange surrounded by concrete, while outside indicates that the gauge is on the exterior side of the steel flange. Longitudinal and transverse refer to the gauge orientation and are with respect to the column axis. Ten gauges were used at the link level and eight were used midway between link levels. The link levels were not the same for all specimens because the link spacings varied among the specimens. Columns H1, H4, and H6 had a link spacing of 200 mm, so the gauged link level was at an elevation of 1000 mm and the midway level was at an elevation of 1100 mm. Columns H2, H5, and H7 had a link spacing of 400 mm, so the gauged link level was at an elevation of 1200 mm and the midway level was at an elevation of 1000 mm. Column H3 had a link spacing of 120 mm, so the gauged link level was at an elevation of 1000 mm and the midway level was at an elevation of 1060 mm. The strain gauges located at the link levels were used to monitor three strain types: link strains, transverse plate strains, and longitudinal plate strains. Gauges LI and LO were used to monitor the strain in the link. One is placed on either side because the link is expected to bend outward as the concrete expands laterally. Two gauges allowed the calculation of the force and bending moment in the link. Gauges BNWFOT and BNWFIT were used to measure the transverse (lateral) strain in the flange. Two gauges were used, one on the inside of the flange (BNWFIT) and one on the outside (BNWFOT), to detect any strain gradient across the flange thickness. The six longitudinal strain gauges (BNWFIL, BNWFOL, BWWL, BEWL, BSEFIL, and BSEFOL) were used to measure longitudinal strains at various locations on the crosssection. The strain gauge locations allow for the calculation of a possible bending moment due to uneven loading. The gauges are paired to increase the accuracy of the reading and to permit detection of the onset of local buckling. The strain gauges placed at the midway levels were placed to monitor two strain types: transverse and longitudinal plate strains. Gauges MEWT and MWWT were used 53
70 to measure the transverse (lateral) strain in the web. Two gauges were used, one on the east side of the web (MEWT) and one on the west side of the web (MWWT), to detect any strain gradient across the web. The six longitudinal strain gauges (MNWFIL, MNWFOL, MWWL, MEWL, MSEFIL, and MSEFOL) were used to measure vertical strains at various locations on the cross-section. As with the link levels, the strain gauge locations allow for the calculation of a possible bending moment due to uneven loading and the gauges are paired to increase the accuracy of the reading and assist in detecting the onset of local buckling. Furthermore, these six gauges can be compared to their companion gauges at the link level to determine if the longitudinal strains are consistent over the column length. The transverse strain gauges were placed in the regions of the maximum expected transverse stress. The flange gauges were mounted at the link level because the link was expected to induce a higher transverse strain in the flange as it pushed outward due to lateral expansion of the concrete. The transverse strain in the web should be higher at the mid-link level because at that location only the web supports the flange from outward movement directly (the flange acts predominantly as a cantilever between links). Conversely, at the link level the flange is supported by the web and the link, so both contribute to resisting lateral movement of the flange (the flange acts similar to a beam with two supports). 5.4 Setup and Instrumentation for Eccentrically-Loaded PEC Columns Setup and Installation Procedure The test setup was similar for each of the four columns (H8 through H11) tested with an eccentric axial load. The column was placed and grouted between rocker end fixtures in the UTS that allowed for a pinned column end condition. Figure 5-4 depicts the eccentric load test setup. Shop drawings of the rockers are included in Appendix A. The rocker end fixtures can be assembled to accommodate predefined eccentricities. The assemblies used for specimens H8 though H11 are shown in 54
71 Figure 5-5. The test eccentricities were set by using a combination of the rocker alignment (either 0 mm in the centre position or 100 mm in the offset position) and spacer plates (25 mm thick). Vertical bearing plates (reinforced using a stiff collar assembly, shown in Figure 5-4) are used to prevent the column from slipping when the rocker is in the inclined position. The procedure used to ready the specimens was the same for all four tests. First, the rockers were levelled and rotated in a horizontal plane until their axes of rotation were precisely parallel to each other and the initial eccentricity was set using the spacer plates on the rocker assembly. Second, the column was placed on the rockers for either strong-axis bending (Figure 5-5a and b) or weak-axis bending (Figure 5-5c and d) and was then aligned vertically with the aid of the same external collar system used for the concentrically loaded column tests. Third, the column was lifted and grouted underneath. The external collar system ensured that the column returns to the plumb position and the correct location in plan. However, the vertical alignment was rechecked and the measured eccentricity, which varied from the nominal values by no more than 2 mm, was recorded (see Chapter 7). The grout used was the same as that used for the concentrically loaded columns. Finally, after the bottom grout cured for a minimum of 2 hours, the external collar system was removed and the top of the column was grouted. Again, the grout was allowed cure for 16 hours before testing and the average grout thickness was 2 mm. Before the test began, an external clamping collar was installed at the top of the column. Similar to the concentric tests, the top 25 mm of the column was filled with an epoxy grout (see Section 3.2.3). To prevent possible premature flange buckling in the top 25 mm an external support collar was installed, as shown in Figure 5-4. As the rockers rotate they also translate, as illustrated in Figure 5-6, but the contact point where the load is applied remains directly below the centre of rotation located on the rocker surface in contact with the column. Therefore, the translation of the rocker must be subtracted from measurements of the lateral deflections to a stationary point when determining the second-order eccentricities along the column height. The rocker translation (or contact point translation), e r, is calculated as follows: 55
72 e r = rθ (5.1) where r is the radius of rocker (250 mm) and θ is the angle of rotation (measured in radians). Although Equation (5.1) is valid for small angles only, the maximum rotation observed at the peak load was only radians (0.7 degrees). To calculate the additional eccentricity, clinometers were attached to the end plates to measure rotation Linear Potentiometers Four lino pots were aligned vertically to measure the axial displacements of the column. Figure 5-7a shows the configuration of the vertical lino pots for the strong-axis bending tests (Columns H8 and H9) and Figure 5-7b shows the weak-axis bending tests (Columns H10 and H11). The lino pots are named according to the flange to which they are connected. All four lino pots have a gauge length of 720 mm (3s) and were attached to the column at elevations of 640 mm and 1360 mm. The adjacent links prevented any significant lateral translation of the connection point of the lino pots, which would result in erroneous readings. The readings obtained were used to calculate the strain gradient across the cross-section. Although the bending moment varied along the length of the column due to the second order effects, the moment was expected to be nearly constant over the gauge length for most of the load history. The remaining seven lino pots were used to measure the horizontal displacements of the column as it bends. A different layout of horizontal lino pots had to be used for each bending direction because the lino pots were attached only to the steel. Figure 5-8 illustrates the strong-axis configuration and Figure 5-9 illustrates the weak-axis configuration. Five lino pots (CT1 through CT5) were used to measure the in-plane profile of the column. The in-plane measurements from CT3 allowed for the calculation of the mid-height eccentricity, which was expected to be the maximum for the column. For strong-axis bending, the translation was measured at the column centreline, so potential small torsional rotations would not affect the column profile measurements. Nevertheless, any twist could be assessed using CT6 and CT7, along with any out-ofplane translation. For weak-axis bending, the translation was not measured at the column centreline because attachment of the lino pots to the concrete would result in the loss of 56
73 the measurements entirely when spalling occurred. Therefore, CT6 and CT3 were used to permit an assessment of any torsional rotation. CT7 was used to measure out-of-plane movement. For both strong-axis and weak-axis bending, significant out-of-plane movement was not expected since the rockers allow rotation in one plane only. For strong-axis bending (Columns H8 and H9), CT6 and CT7 both measured less than 0.13 mm at the peak load and they differed by only 0.07 mm, confirming that out-ofplane and torsional movement was insignificant. For weak-axis bending, (Columns H10 and H11), CT3 and CT6 differed by less than 2% of their average at the peak load and CT7 measured a maximum value of 0.1 mm at the peak load. Therefore, torsional and out-of-plane movements are considered negligible Strain Gauges A total of 26 strain gauges were used on each of the concentrically loaded columns, the layout of which is shown in Figure Table 5-1 lists the strain gauge nomenclature used. Fourteen gauges were used at the link level and twelve were used midway between link levels. The link levels were the same for all specimens because they had identical link spacings. The gauged link level was at an elevation of 1120 mm and the midway level was at an elevation of 1000 mm. The strain gauges placed at the link level were placed to monitor three strain types, as was done for the concentrically loaded cases. Gauges LI and LO were used to monitor the strain in the link. For weak-axis bending, they were placed on the link that was on the compression side of bending (west side) because this is the side where the link would be expected to strain the most while resisting local buckling of the flange plate and confining the concrete to some degree. For strong-axis bending, both links should experience similar strains since they are perpendicular to the bending axis. Since the choice is arbitrary (with respect to the strain), the gauges were placed on the west side, as for the columns with weak-axis bending, to avoid placement mistakes. One strain gauge was placed on either side of the link because the link was expected to bend outward as the concrete expanded laterally. Two gauges allowed the calculation of the force and 57
74 bending moment in the link. Gauges BSWFOT and BSWFIT were used to measure the transverse (lateral) strain in the flange. Two gauges were used, one on the inside of the flange (BSWFIT) and one on the outside (BSWFOT), to detect any strain gradient across the flange. As described for the concentrically loaded columns, the flange was expected to experience more transverse stress at the link level due to the presence of the links. The transverse gauges were placed on the SW flange because it is on the compression side during both strong-axis and weak-axis bending tests. The ten longitudinal strain gauges (BNWFIL, BNWFOL, BNEFIL, BNEFOL, BWWL, BEWL, BSWFIL, BSWFOL, BSEFIL, and BSEFOL) were used to measure vertical strains at various locations on the cross-section. The strain gauge locations allowed for an accurate calculation of the strain gradient across the cross-section due to the eccentric load. The gauges are paired to increase the accuracy of the reading and to permit detection of the onset of local buckling. The strain gauges placed at the midway levels were placed to monitor two strain types. Gauges MEWT and MWWT were used to measure the transverse (lateral) strain in the web, in part to assess the confining effect of the web on the concrete. As in the concentric load tests, the transverse strain gauges were placed on the web at the mid-link level because only the web is present at this level to confine the concrete and, therefore, the highest transverse stresses are expected at this level. Two gauges were used, one on the east side of the web (MEWT) and one on the west side of the web (MWWT), to detect any strain gradient across the web. The ten longitudinal strain gauges (MNWFIL, MNWFOL, MNEFIL, MNEFOL, MWWL, MEWL, MSWFIL, MSWFOL, MSEFIL, and MSEFOL) were used in a similar manner to their companion gauges at the link level. Furthermore, these ten gauges can be compared to their companion gauges at the link level to determine if the longitudinal strains are consistent over the column length. 5.5 Loading Protocols for Concentric and Eccentric Tests For each type of test (concentric and eccentric loading), a loading protocol was established to standardise tests within the test type and to reduce the effects of dynamic loading. Displacement control of the UTS actuator was used for both test types. 58
75 5.5.1 Concentric Test Loading Protocol The loading procedure was similar for each of the seven tests (Columns H1 to H7). Four primary stroke rates (0.06, 0.08, 0.1, and 1.0 mm/min) were used to control the UTS. The test began at a stroke rate of 0.06 mm/min until the load reached approximately 1000 kn, during which the electronic data were scrutinised to ensure that all channels were functioning properly. Following this, the stroke rate was increased to 0.08 mm/min until the real-time graphs of the column behaviour indicated that the column stiffness was decreasing (typically about 80% of the peak load). To minimise dynamic effects, the stroke rate was then decreased back to 0.06 mm/min until failure of the column occurred. If the failure resulted in a sudden drop in column capacity, the displacement of the UTS was held constant until the measured UTS load had stabilised and photographs had been taken. Loading was then continued at a stroke rate of 0.06 mm/min, but was increased to 0.1 mm/min once no rapid change in load was observed. If the failure resulted in a gradual drop in capacity, the stroke rate was held at 0.06 mm/min until the column capacity had been reduced to below 85% of the peak load. Then, the rate was increased to 0.1 mm/min. Regardless of the failure type, once the degradation of post-peak strength began to slow significantly, defining a reasonably stable residual strength plateau, the stroke rate was increased to 1.0 mm/min until the average reading from the overall lino pots (Lino Pots 1 and 2) had reached 20 mm. The column was then unloaded and the unloading behaviour was recorded. During the initial phase of loading, the overall linear potentiometer measurements from Lino Pots 1 and 2 (see Section 5.3.2) were visually compared to each other to ensure that the column was being loaded uniformly. Post-testing alignment checks confirmed that the columns were properly aligned. For each concentric test (Columns H1 through H7), the individual lino pot readings were within 5% (1%, 1%, 3%, 5%, 5%, 2%, and 2%, respectively) of their average at 20% of the peak load, indicating that the column was loaded evenly and aligned properly. Any variations to this general loading protocol for individual tests were recorded during the test and are included in the test observations (see Section 6.1). 59
76 5.5.2 Eccentric Test Loading Protocol The loading procedure was similar for each of the four eccentric tests (Columns H8 to H11). Three primary stroke rates (0.06, 0.08, and 0.1 mm/min) were used to control the UTS. The loading procedure throughout the test was similar to the concentric loading protocol. The only significant difference occurred during the last phase of testing (post-peak plateau), as the eccentric tests were only increased to 0.1 mm/min until the end of the test (the concentric tests were increased to 1.0 mm/min). The test ended when 10 mm of vertical displacement had been reached on the compression side of the column. During the initial phase of loading, the longitudinal strain measurements (see Section 5.4.3) were visually compared to ensure that the column was properly aligned. Since a strain gradient existed, the strain gauges that were compared had to be the same distance from the neutral axis. Therefore, the strain-gauge comparison groups depended on the bending direction. Post-testing alignment checks confirmed that Columns H8 though H11 were aligned properly. For strong-axis bending, the SW and SE flange strains were compared at approximately 1000 kn. The strains in the individual flanges varied by 1% and 3% from their average for Columns H8 and H9, respectively. For weak-axis bending, the SE and NE flange strains were compared at approximately 1000 kn. Strains in the individual flanges varied by 1% and 5% from their average for Columns H10 and H11, respectively. Any variations to this general loading protocol for individual tests were recorded during the test and are included in the test observations (see Section 7.1). 60
77 Table 5-1 Strain Gauge Nomenclature for Concentric and Eccentric Setups Strain Gauge Designation Location and Orientation LO Link Outside LI Link Inside BNWFOL Bar (Link) Level North West Flange Outside Longitudinal BNWFIL Bar (Link) Level North West Flange Inside Longitudinal BNWFOT Bar (Link) Level North West Flange Outside Transverse BNWFIT Bar (Link) Level North West Flange Inside Transverse BSWFOL Bar (Link) Level South West Flange Outside Longitudinal BSWFIL Bar (Link) Level South West Flange Inside Longitudinal BSWFOT Bar (Link) Level South West Flange Outside Transverse BSWFIT Bar (Link) Level South West Flange Inside Transverse BNEFOL Bar (Link) Level North East Flange Outside Longitudinal BNEFIL Bar (Link) Level North East Flange Inside Longitudinal BSEFOL Bar (Link) Level South East Flange Outside Longitudinal BSEFIL Bar (Link) Level South East Flange Inside Longitudinal BWWL Bar (Link) Level West Web Longitudinal BEWL Bar (Link) Level East Web Longitudinal MNWFOL Mid Link Level North West Flange Outside Longitudinal MNWFIL Mid-Link Level North West Flange Inside Longitudinal MSWFOL Mid-Link Level South West Flange Outside Longitudinal MSWFIL Mid-Link Level South West Flange Inside Longitudinal MNEFOL Mid-Link Level North East Flange Outside Longitudinal MNEFIL Mid-Link Level North East Flange Inside Longitudinal MSEFOL Mid-Link Level South East Flange Outside Longitudinal MSEFIL Mid-Link Level South East Flange Inside Longitudinal MWWL Mid-Link Level West Web Longitudinal MEWL Mid-Link Level East Web Longitudinal MWWT Mid-Link Level West Web Transverse MEWT Mid-Link Level East Web Transverse 61

78 Flange Support Collar External Levelling Collar Figure 5-1 Concentric Load Test Setup (South Steel and East Concrete Faces) 62
79 Elevation (mm) Lino Pot B3, M4, T5 400 N B6, M7, T8 2 (a) (b) Figure 5-2 Vertical Lino Pot Layout for Concentrically Loaded Columns in (a) North or South Elevation View and (b) Plan View 63
80 BNWFOT a) BNWFOL BNWFIL BNWFIT N LO LI BWWL BEWL b) 75 mm BSEFIL BSEFOL MNWFOL MNWFIL MWWL MEWL MWWT MEWT 75 mm N 200 mm 200 mm MSEFIL MSEFOL 75 mm 75 mm Longitudinal Strain Gauge Transverse Strain Gauge Figure 5-3 Strain Gauge Layout for Concentrically Loaded Columns at (a) Link Level and (b) Midway between Link Levels 64


81 Flange Support Collar Stiff Collar Assembly for Vertical Rocker Bearing Plate Figure 5-4 Eccentric Load Test Setup (North Steel and East Concrete Faces) 65
82 a) H8 25 mm Bearing Plate b) H9 25 mm Bearing Plate 25 mm Spacer Plate e=25 mm e=100 mm c) H10 25 mm Bearing Plate d) H11 25 mm Spacer Plate 25 mm Spacer Plate 25 mm Bearing Plate e=25 mm e=75 mm Figure 5-5 Column Placement on Rocker Assembly for Bending about (a, b) the Strong Axis and (c, d) the Weak Axis Centre of Curvature e r After Rotation r θ Before Rotation e r P final P initial Figure 5-6 Rotation and Translation of Rockers 66
83 Tension NW NE 470 mm Compression SW SE 75 mm 75 mm (a) Attached to the flange edge NW NE Lino Pot Compression Tension SW SE 470 mm (b) Figure 5-7 Vertical Lino Pot Layout for Eccentrically Loaded Columns for Bending about (a) the Strong Axis and (b) the Weak Axis 67
84 2000 CT 1 Welded Nut and Thread Elevation (mm) CT 2 CT 3 CT 6, CT mm N CT 7 CT 6 Welded Nut and Thread CT 1, CT 2, CT 3, CT 4, CT 5 (b) 500 CT 4 0 CT mm Note: CT 1 and CT 5 are connected to the end plates. Lino Pot (a) Figure 5-8 Horizontal Lino Pot Layout for Strong-Axis Eccentrically Loaded Columns in (a) South Elevation View and (b) Plan View 68
85 2000 CT 1 Welded Nut and Thread 1500 CT mm N CT 6 Elevation (mm) 1000 CT 7 CT 3, CT 6 CT 1, CT2, CT3, CT4, CT5 Welded Nut and Thread CT 7 (b) 500 CT 4 0 CT mm Note: CT 1 and CT 5 are connected to the end plates. Lino Pot (a) Figure 5-9 Horizontal Lino Pot Layout for Weak-Axis Eccentrically Loaded Columns in (a) North Elevation View and (b) Plan View 69
86 a) Strong-Axis Tension Side BNWFOL BNEFOL b) Weak-Axis Compression Side LO 75 mm Weak-Axis Compression Side BNWFIL BNEFIL LI BWWL BEWL BSWFIT BSWFIL BSEFIL BSWFOL BSEFOL BSWFOT Strong-Axis Compression Side Strong-Axis Tension Side MNWFOL MNEFOL MNWFIL MNEFIL MWWL MEWL MWWT MEWT MSWFIL MSEFIL MSWFOL MSEFOL N 75 mm N 200 mm 200 mm Weak-Axis Tension Side Weak-Axis Tension Side 75 mm 75 mm Strong-Axis Compression Side Longitudinal Strain Gauge Transverse Strain Gauge Figure 5-10 Strain Gauge Layout for Eccentrically Loaded Columns at (a) Link Level and (b) Midway between Link Levels 70
87 6.0 Experimental Results for Concentrically Loaded Columns 6.1 Observations and Failure Modes General Discussion A summary of the peak test loads and predicted loads for the seven partially encased composite (PEC) columns that were loaded concentrically (H1 through H7) is presented in Table 6-1. The predicted column load was computed using Equation (2.14), as described in Chapter 2. Since the test specimens are stub columns, their slenderness parameter, λ, was set to zero for the calculation of the column capacity. For all seven test specimens, the test load exceeded the predicted capacity. The columns containing steel fibre reinforcement (SFR), H6 and H7, have the highest test-to-predicted load ratios, 1.30 and 1.28, respectively. If the predicted strength of columns H6 and H7 were calculated using the speculated concrete strengths of 55.4 MPa and 60.2 MPa (as discussed in Section 4.2.2), respectively, their test-to-predicted ratios would have been 1.21 and 1.17, respectively, which would have been similar to the values obtained from Columns H1 through H5. All columns had a similar failure mode concrete crushing combined with local buckling of the steel flanges except for column H3 which had a link weld fracture followed by concrete crushing combined with local buckling of the flanges. No local buckling of the flanges was observed for any of the columns before the peak load was reached. Although the failure modes were similar for all columns, the point at which the failure (marked by a sudden drop in load-bearing capacity) occurred, as compared to the peak capacity, was different depending on the presence or absence of steel fibres. Columns cast with high-strength concrete (H3, H4, and H5) exhibited sudden failure at their peak load. Conversely, columns cast with SFR high-strength concrete (H6 and H7) showed a period of gradual strength decline after the peak load was reached before a sudden failure occurred. Typically, the failure region was located between adjacent links. By removing the crushed non-fibrous concrete after the test, distinct shear-failure planes were exposed. The depths of the shear planes related to the link spacing. For the closest link spacing 71
88 (120 mm), the shear-failure plane was only as deep as the links themselves. This resulted in small amounts of concrete spalling off of the column. However, for the largest link spacing (400 mm), the shear-failure plane extended to a point closer to the web than the concrete surface. This resulted in large pieces of concrete exploding out of the column as failure took place. The relationship between the shear-plane depth and the link spacing was expected since the closer link spacing provides a higher degree of confinement to the concrete. This relationship could not be confirmed directly for the SFR concrete because the fibres kept the concrete intact and made identifying the shear planes difficult. However, the crack patterns on and near the surface suggested that it is also true for the SFR concrete. The following sections describe observations made during the individual tests and the detailed loading protocol that was used, along with issues related to instrumentation that may be influential in the interpretation of the test data. To aid in the discussion of the progressive failure of the individual PEC columns, a schematic of the PEC columns is presented in Figure 6-1. In this figure, the test region of the column is broken down into concrete zones separated by the links. Since three different link spacings were used, three different schematics are required. Column H3 had a cross-section dimension, d, of 400 mm and a link spacing of 120 mm (0.3d). Therefore, Column H3 has ten zones and is represented by Figure 6-1a. Columns H1, H4, and H6 had a cross-section dimension, d, of 400 mm and a link spacing of 200 mm (0.5d). Therefore, Columns H1, H4, and H6 have six zones and are represented by Figure 6-1b. Columns H2, H5, and H7 had a cross-section dimension, d, of 400 mm and a link spacing of 400 mm (1.0d). Therefore, Columns H2, H5, and H7 have three zones and are represented by Figure 6-1c. Typically, the failure mechanism that occurred was contained within a single zone Column H1 During the pre-test verification of the data acquisition channels, it was noted that the strain gauge BEWL was not working properly. This gauge was on the web and was inaccessible after the column was cast, so it could not be replaced. Therefore, the longitudinal web strain at the link level was measured by BWWL only. 72
89 The column was initially loaded at a stroke rate of 0.06 mm/min. This rate was held at 0.06 mm/min until the peak load (7380 kn) was reached. Following the peak, the rate continued at 0.06 mm/min while the post-peak strength slowly declined. Once the column capacity had decreased to 6400 kn, the rate was increased to 0.08 mm/min. When the capacity had further decreased to 5600 kn, the rate was increased to 1.0 mm/min and held for the rest of the test. The test was stopped and the column was unloaded when the average overall displacement reached 20 mm. The locations of interest during the failure are discussed using the zone schematic illustrated in Figure 6-1b, which is described in Section Before the failure load was reached, local buckling of the flanges was not observed. Failure of the column was gradual. After the peak load was reached, the first cracks occurred at elevation 1200 mm on the west face and local buckling of the SW flange in Zone 5 began. At the same time on the east face, concrete crushed in Zone 5 and local buckling was observed on the SE and NE flanges in Zone 5. Within one minute, more pronounced cracks reached the west face, indicating that the concrete had crushed and the NW flange began to buckle in Zone 6. Near the end of the test, large pieces of concrete spalled off the east face in Zone 5, exposing the links. At the end of the test, cracks were observed on the west face at the link elevations 800, 1000, and 1200 mm, and the concrete in Zone 5 had advanced slightly outward (approximately 5 mm) from the column. The fillet welds of the links did not fracture during testing. The post-peak strength decline for this specimen was the most gradual of all specimens tested. Figure 6-2 and Figure 6-3 show the failure mode on the west and east faces, respectively. The photographs were taken following the test Column H2 All data acquisition channels were found to be working properly during the pretest verification. The column was initially loaded at a stroke rate of 0.06 mm/min and then increased to 0.08 mm/min at 785 kn. This rate was held until approximately 5700 kn. At this load, the load-versus-displacement curve indicated that the column was beginning 73
90 to soften. To minimise dynamic effects, the rate was decreased to 0.06 mm/min until the peak load was reached (7570 kn). Following the peak load, the rate of 0.06 mm/min was maintained and the column capacity gradually declined. At 4880 kn, the rate was then increased to 0.08 mm/min. When the column capacity declined to approximately 4500 kn, the rate was increased to 0.2 mm/min. At 4720 kn, the column capacity was beginning to stabilise so the rate was increased to 1.0 mm/min and held until the end of the test. The test was stopped and the column was unloaded when the average overall displacement reached 20 mm. The locations of interest during the failure are discussed using the zone schematic illustrated in Figure 6-1c, which is described in Section Before the failure load was reached, local buckling of the flanges was not observed. Failure of the column was gradual. After the peak load was reached, local buckling of the SW flange began in Zone 2 and was immediately followed by local buckling of the NW flange in Zone 2. Cracks were observed on the west face at the link elevations 800 and 1200 mm. On the east face, local buckling of the SE and NE flanges in Zone 3 occurred concurrently with the concrete crushing in Zone 3 after the peak load. Cracks were observed at link elevations 1200 and 1600 mm. During the post-peak loading, a single piece of concrete advanced outward along a failure plane in Zone 3. Near the end of the test, a second local buckle began on the SW flange in Zone 3. After the test was completed, the large pieces of concrete from the east and west side were removed to expose the links and the concrete failure planes The west-face concrete that had crushed in Zone 2 advanced outward along a failure plane in Zone 2. The failure plane was 110 mm deep from the surface. The cracks and the advancing concrete on the west face occurred after the local buckling of the SW and NW flanges in Zone 2, but preceded the second local buckle of the SW flange in Zone 3. On the east face, the failure plane in Zone 3 was 85 mm deep from the surface. The fillet welds of the links did not fracture during testing. Figure 6-4 and Figure 6-5 show the failure mode on the west and east faces, respectively. 74
91 6.1.4 Column H3 During the pre-test verification of the data acquisition channels, it was noted that strain gauge MSEFOL was not working. The lead wires from the gauge were damaged during the test setup. This gauge was located on the outside steel face, so the lead wires were repaired. All other data acquisition channels were found to be working properly during the pre-test verification. The column was initially loaded at a stroke rate of 0.06 mm/min and then increased to 0.08 mm/min at 650 kn. This rate was held at 0.08 mm/min until approximately 10,000 kn. At this load, the load-versus-displacement curve indicated that the column was beginning to soften. To minimise dynamic effects, the rate was decreased to 0.06 mm/min until failure. A sudden drop in capacity occurred immediately after reaching the peak load (12,340 kn). Two bangs were heard as the link welds fractured at the peak load. The UTS stroke was held until the measured load had stabilised at approximately 7000 kn. Then the column was reloaded at a stroke rate of 0.06 mm/min until the column capacity had decreased to 6790 kn. The rate was then increased to 0.08 mm/min and then to 0.2 mm/min until the column capacity had decreased to 6370 kn. At this point in the test, the capacity was beginning to stabilise so the stroke rate was raised again to 1.0 mm/min and held until the end of the test. An additional loud bang was heard near the end of the test (5770 kn) as a third link weld fractured. The test was stopped and the column was unloaded when the average overall displacement reached 20 mm. It was also noted during the test that the strains measured by MSEFOL were substantially different than similar gauges. It is likely that the gauge was damaged when its lead wires were repaired before the test. The readings from this gauge were proportionally matched to MSEFIL s initial, linear readings. Therefore, MSEFIL was used to represent the average strain for the SE flange in the initial loading stages. The non-linear behaviour measured by MSEFOL in the latter loading stages was adjusted in the same proportion as in the initial stage. The locations of interest during the failure of the column are discussed using the zone schematic illustrated in Figure 6-1a, which is described in Section Before the failure load was reached, local buckling of the flanges was not observed. 75
92 Failure of the column was sudden. At peak load, the fillet welds between the link at elevation 1000 mm and the SW flange and between the link at elevation 760 mm and the SE flange fractured. Immediately thereafter, the west-face concrete in Zone 5 crushed as the SW and NW flanges buckled and the east-face concrete in Zone 3 crushed as the SE and NE flanges buckled. Throughout the post-peak loading, a large vertical crack propagated along the centreline of the west face from Zone 5 into Zone 10, but not into the top end zone. Near the end of the test, the weld between the link at elevation 880 mm and the SW flange fractured. At the end of the test, the west-face concrete in Zone 6 advanced outward 20 mm at the bottom of Zone 6 and the east-face concrete advanced outward 10 mm at the bottom of Zone 4. Since the welds fractured, the unsupported flange length increased resulting in final buckle lengths that were approximately 200 mm and extended into adjacent zones. Figure 6-6 and Figure 6-7 show the failure mode on the west and east faces, respectively. Figure 6-8 is a photograph that focuses on the fracture surface of the links on the west side. The longitudinal lines along the fracture surface indicate that the link was sheared from the weld. Figure 6-9 shows the fractured weld surface. The conical surface indicates that rupture occurred in the heat affected zone at the weld-link interface Column H4 All data acquisition channels were found to be working properly during the pretest verification. The column was initially loaded at a stroke rate of 0.04 mm/min until 2200 kn. At this load, it was noticed that one linear potentiometer (Lino Pot T8) was not responding. The load was decreased to 1200 kn and the lino pot was replaced. According to the lab safety rules, the load had to be reduced to approximately half of the maximum experienced load before a technician could enter the test area. After the successful replacement, the test continued at a stroke rate of 0.04 mm/min until the load reached 2000 kn. Following this, the rate was increased to 0.06 mm/min until failure. Failure occurred approximately five minutes after the peak load (11,860 kn) was reached. The measured column load was dropping steadily after the peak and then 76
93 dropped abruptly at 90% of the peak load (from 10,720 to 9590 kn). The UTS stroke was held until the measured load had stabilised at approximately 6300 kn. Loading was continued at a stroke rate of 0.06 mm/min and then 0.08 mm/min until capacity had decreased to approximately 5000 kn. A bang was heard as a link weld fractured at 5500 kn, but the stroke rate was not paused. At 5000 kn, the capacity was beginning to stabilise so the rate was increased to 1.0 mm/min and held until the end of the test. The test was stopped and the column was unloaded when the average overall displacement had reached 20 mm. The locations of interest during the failure are discussed using the zone schematic illustrated in Figure 6-1b, which is described in Section Before the failure load was reached, local buckling of the flanges was not observed. Failure of the column was sudden. During the failure, cracks were evident at elevation 900 mm and light spalling of the concrete was taking place on the west face. After the sudden drop in capacity, the west-face concrete in Zone 4 was crushed and the SW and NW flanges buckled in Zone 4 and Zone 3, respectively. On the east face, the concrete in Zone 2 crushed as the SE and NE flanges underwent local buckling. During the post-peak loading, a thin, vertical crack propagated along the centreline of the west face from Zone 3 into Zone 2. The fillet weld between the link at elevation 1000 mm and the SW flange fractured midway through the post-peak period. After the test, the westface concrete in Zone 5 advanced outward 15 mm at the bottom of Zone 5 and the eastface concrete in Zone 2 advanced outward 25 mm at the bottom of Zone 2. The link welds did not fracture on the east face. Figure 6-10 and Figure 6-11 show the failure mode of concrete crushing with combined local buckling of the steel flange on the west and east faces, respectively Column H5 All data acquisition channels were found to be working properly during the pretest verification. The column was initially loaded at a stroke rate of 0.06 mm/min and then increased to 0.08 mm/min at 1200 kn. The rate was held at 0.08 mm/min until 8500 kn. 77
94 At this load, the load-versus-displacement curve indicated that the column was beginning to soften. To minimise dynamic effects, the rate was decreased to 0.06 mm/min until failure, which occurred immediately after a peak load of 12,390 kn was reached. The UTS stroke was held until the measured load had stabilised at approximately 3800 kn. Then the column was reloaded at a stroke rate of 0.06 mm/min. The column load increased up to 4400 kn and stabilised. The rate was increased to 0.1 mm/min and then to 1.0 mm/min and held until the end of the test. The test was stopped and the column was unloaded when the average overall displacement had reached 20 mm. The locations of interest during the failure are discussed using the zone schematic illustrated in Figure 6-1c, which is described in Section Before the failure load was reached, local buckling of the flanges was not observed. Failure of the column was brittle and explosive. On the west face, the concrete in Zone 3 crushed and a large piece of concrete was ejected from the column, landing near the column base. As this occurred, the SW and NW flanges underwent local buckling in Zone 3. On the east face, the concrete in Zone 2 crushed and a large piece of concrete was ejected from the column, landing approximately 300 mm away from the column base. At the same time, the SE and NE flanges underwent local buckling in Zone 2. The fillet welds of the links did not fracture during testing. Figure 6-12 and Figure 6-13 show Zones 3 and 2 on the west and east faces, respectively. Since the concrete has exploded out of the column, the concrete shear planes are visible Column H6 All data acquisition channels were found to be working properly during the pretest verification. The column was initially loaded at a stroke rate of 0.06 mm/min and then increased to 0.08 mm/min at 1100 kn. This rate was held until 9000 kn. At this load, the load-versus-displacement curve indicated that the column was losing stiffness. To minimise dynamic effects, the rate was decreased to 0.06 mm/min until failure. The column reached its peak load (12,180 kn) and then began to decrease gradually. After a gradual decrease to 11,730 kn (96% of the peak load), there was a sudden drop in 78
95 column capacity. The UTS stroke was held until the measured load had stabilised at approximately 5590 kn. Then the column was reloaded at a rate of 0.06 mm/min. The column capacity increased slightly to 5800 kn and stabilised. The rate was further increased to 0.1 mm/min and then to 1.0 mm/min and held until the end of the test. The test was stopped and the column was unloaded when the average overall displacement had reached 20 mm. The locations of interest during the failure are discussed using the zone schematic illustrated in Figure 6-1b, which is described in Section Before the failure load was reached, local buckling of the flanges was not observed. Failure of the column was sudden after a gradual decline from the peak load. There were no signs of cracking at the peak load on either concrete face. When the load dropped quickly after the peak, cracks were evident on the west face at elevation 400 mm and the concrete crushed in Zone 2. When the cracks formed, the SW and NW flanges buckled in Zone 2. On the east face, cracks were evident on the surface at elevation 1100 mm and the concrete crushed in Zone 4. Simultaneously, the SE flange buckled in Zone 4, while the NE flange buckled in Zone 3. During post-peak loading, the cracks grew and light spalling of the concrete continued on both concrete faces, but the concrete remained intact. The steel fibres prevented the concrete from separating. The fillet welds of the links did not fracture during testing. Figure 6-14 and Figure 6-15 show the crushed concrete and the local buckles on the west and east faces, respectively Column H7 During the pre-test verification of the data acquisition channels, strain gauge MWWT was not working properly. This gauge was on the web and was inaccessible after the column was cast, so it could not be replaced. Therefore, MEWT is used to represent the average transverse strain for the web at the mid-link level. The column was initially loaded at a stroke rate of 0.06 mm/min and then increased to 0.08 mm/min at 500 kn. This rate was held until approximately 10,000 kn. At this load, the load-versus-displacement curve indicated that the column was beginning to soften. To minimise dynamic effects, the rate was decreased to 0.06 mm/min until 79
96 failure. The column reached its peak load (11,890 kn) and then began to decrease gradually. After a small, gradual decrease in column capacity to 11,780 kn (99% of the peak load), there was a sudden drop in column strength. The UTS stroke was held until the capacity had stabilised at approximately 5300 kn. Then the column was reloaded at a stroke rate of 0.08 mm/min. The column capacity increased slightly to 5600 kn and then began to decrease. Once the column capacity began to stabilise, the rate was increased to 1.0 mm/min and held until the end of the test. The test was stopped and the column was unloaded when the average overall displacement had reached 20 mm. The locations of interest during the failure are discussed using the zone schematic illustrated in Figure 6-1c, which is described in Section Before the failure load was reached, local buckling of the flanges was not observed. Failure of the column was sudden after a minimal amount of gradual decline from the peak load. There were no signs of cracking at the peak load on either concrete face. When the load dropped quickly after the peak, cracks were evident on the west-face at elevation 700 mm and the concrete crushed in Zone 2. When the cracks formed, the SW and NW flanges buckled in Zone 2. On the east face, cracks were evident on the surface at elevation 1500 mm and the concrete crushed in Zone 3. Simultaneously, the SE and NE flanges buckled in Zone 3. As the post-peak loading continued, the cracks grew and light spalling of the concrete continued on both the concrete faces, but the concrete remained intact. The steel fibres prevented the concrete from separating completely. The fillet welds of the links did not fracture during testing. Figure 6-16 and Figure 6-17 show the crushed concrete and the local buckles on the west and east faces, respectively. 6.2 Data Obtained from Instrumentation In this section, data obtained from the instrumentation used on the concentrically loaded columns is analysed to determine their behaviour. Information regarding the location and nomenclature of the instrumentation described herein can be found in Section
97 6.2.1 Longitudinal Strain Measured with Linear Potentiometers The displacements measured by the eight vertical linear potentiometers (lino pots) were used to calculate longitudinal column strains over the test region (between 400 mm and 1600 mm). Two of these lino pots (Lino Pots 1 and 2 see Figure 5-2) were used to measure the overall column shortening, which represents the global behaviour of the column. The average overall strain, ε a, was calculated by averaging the overall shortening of the column measured by Lino Pots 1 and 2 and dividing it by the initial length (1200 mm) between the attachment points. The other six lino pots (Lino Pots B3, M4, T5, B6, M7, and T8) were used to measure shortening over smaller sections to capture the localised column behaviour. The smaller section strains for the bottom (between elevations 400 mm and 800 mm), middle (between elevations 800 mm and 1200 mm), and top (between elevations 1200 mm and 1600 mm) sections were calculated by dividing the average measurements from Lino Pots B3 and B6, Lino Pots M4 and M7, and Lino Pots T5 and T8, respectively, by the initial length between the attachment points (400 mm). The smaller section strains were similar to each other (within 5%) and to the overall column strain measurements until near the measured column peak load, P u. Following the peak load, the smaller sections that did not contain the failure region relaxed, while those that did contain the failure experienced large strains. Graphs illustrating the relationship between the local and overall strains versus load for each column can be found in Appendix E (Figures E-1 to E-7). Figure 6-18 shows the load-versus-average-overall-strain curves for Columns H1 though H7. Important parameters associated with this figure are summarised in Table 6-2. The plots of H1 and H2 in Figure 6-18 show that the behaviour of the PEC columns made with normal-strength concrete was linear up to approximately 0.5P u. Beyond 0.5P u, there is a gradual decrease in the stiffness until approximately 1900 με when the column behaviour becomes very non-linear. The secant moduli at 0.4P u were 5.0 and 5.1 kn/με for Columns H1 and H2, respectively. The plots of the PEC columns made with high-strength concrete, with and without steel fibres, (H3 through H7) show linear behaviour up to approximately 0.75P u. Their secant moduli (measured at 0.4P u ) varied between 5.5 and 5.8 kn/με. The average stiffness (secant modulus) of the high-strength PEC columns (Columns H3 through H5) is 12% higher than that of the normal-strength 81
98 columns. This appears to be directly related to the difference in the secant moduli of the concrete materials themselves (Chapter 4); the average measured value for the normal high-strength concrete is about 22% higher than that for the normal strength concrete. When the stiffness of the steel section is considered, the expected increase in column stiffness is 14% (when the concrete stiffness is increased by 22%). However, there are no significant differences in the secant moduli among Columns H3 through H7 despite the fact that the average measured value of the steel fibre reinforced (SFR) high-strength concrete in Columns H6 and H7 was less than the average measured value of the highstrength concrete in Columns H3 through H5. This suggests that the steel fibres may have improved the stiffness of the column. However, this is not a typical benefit of adding steel fibres to concrete. Considering this and the uncertainty in the concrete material response for the SFR high-strength concrete (lower-than-expected concrete strength by 3.4%), no definitive conclusions can be made about the addition of steel fibres to improve the column stiffness. Since the secant moduli of columns made with the same concrete but with different link spacing were similar (Columns H1 and H2, Columns H4 and H5, and Columns H6 and H7), the link spacing did not affect the initial column stiffness appreciably. The PEC column failure mode improved as the link spacing decreased, regardless of the type of concrete used. For the normal-strength concrete columns (H1 and H2), the overall strain at peak load was higher for Column H1 (2793 με) which had 0.5d link spacing compared to Column H2 (2081 με) which had 1.0d link spacing. This agrees with the observation of Chicoine et al. (2002a) that closer link spacing results in more ductile behaviour for PEC columns cast with normal-strength concrete. For the highstrength concrete columns (H3, H4, and H5), the overall strain at peak load of Column H3 (3420 με) which had 0.3d link spacing was higher than Columns H4 and H5, which had link spacings of 0.5d and 1.0d, respectively. However, Column H4 did not have a higher overall strain at peak load than Column H5 (2835 versus 2903 με). The discrepancy is likely caused by the lower peak load of Column H4 (11,860 kn) compared with Columns H3 and H5, which had a similar peak loads (12,340 and 12,390 kn, respectively). If the plot of Column H4 were to be extended past its own peak load in Figure 6-18 up to the peak load of Column H3 or H5, then Column H4 would have had a 82
99 strain at peak load of approximately 3200 με. This value would fit between those of Columns H3 and H5 (3420 and 2903 με), thereby supporting the trend of an improved failure mode with closer link spacing. For the SFR high-strength concrete columns (H6 and H7), the overall strain at peak load was higher for Column H6 (3003 με) which had 0.5d link spacing compared to Column H7 (2828 με) which had 1.0d link spacing. This also supports the trend of an improved failure mode with closer link spacing. The steel fibres increased the ductile behaviour of the PEC columns somewhat at the peak load. The PEC columns that were fabricated with SFR high-strength concrete were able to sustain the applied load slightly longer than their non-steel fibre counterparts. Examining the behaviour of Columns H3 through H7 near the peak (peak region close-up is shown in Figure 6-18), it can be seen that the PEC columns cast with SFR high-strength concrete (H6 and H7) have a gradual rounding of the load-versusstrain curve at the peak load. By comparison, the curves for the companion columns without steel fibres (H4 and H5) have a sudden drop at or very near the peak load. This sudden drop is evident in Column H3 as well. This behaviour can be attributed to the material behaviour of the concrete used in the column. Comparing the stress-versusstrain curves of SFR high-strength concrete (Figure 4-4) with non-sfr high-strength concrete (Figure 4-3) shows that the SFR high-strength concrete can undergo more postpeak strain before fracture than high-strength concrete (440 με versus 320 με). This is an expected advantage when steel fibres are added to concrete due to their role in inhibiting crack propagation. Adding steel fibres to the high-strength concrete or decreasing the link spacing to 0.3d both improved the column failure mode. Column H3, which had non-sfr concrete and a link spacing of 0.3d, and Column H6, which had SFR concrete and a link spacing of 0.5d, reached much higher strains than Column H4, which had non-sfr concrete and a link spacing of 0.5d (Figure 6-19). Although the column with the closer link spacing reached the higher strain at peak load (3420 με compared to 3003 με), the shape of the curve indicates a more gradual failure when steel fibres were added. Therefore, both options improve the failure mode. The post-peak response of the test specimens was improved by closer link spacing, regardless of what type of concrete was used in the column. For normal-strength 83
100 concrete, Column H1 (0.5d link spacing) had a higher residual capacity than Column H2 (1.0d link spacing). For high-strength concrete, Column H3 (0.3d link spacing) had the highest residual capacity followed by Column H4 (0.5d link spacing) and then Column H5 (1.0d link spacing). Finally, for SFR high-strength concrete, Column H6 (0.5d link spacing) had a higher residual capacity than Column H7 (1.0d link spacing). The increased concrete confinement caused by smaller link spacing had a greater effect on retaining column capacity than adding steel fibres. Column H3 had a higher residual capacity than Column H6 after failure (6600 kn versus 5600 kn) and throughout the post-peak region Longitudinal Strain Measured with Strain Gauges Longitudinal strain gauges were placed at a single link elevation and at an adjacent mid-link level near the mid-height of each column. The exact placement locations of each gauge can be found in Section For each column (H1 through H7), the readings of the strain gauges were compared to the average overall strain, ε a, to determine the validity of the measurements. Figure 6-20 shows a plot of longitudinal strain gauge measurements versus the overall column strain, ε a, taken from Column H6. The behaviour exhibited by Column H6 is characteristic of Columns H1 through H7. Plots for all concentrically-loaded PEC columns can be found in Appendix E (Figures E-8 to E-14). When the slope of the curves in Figure 6-20 equals 1.0, the longitudinal gauges are straining at the same rate as the overall column. The three vertical lines represent important strain levels in the column. From left to right, they are the link-level flange yield strain, the mid-link-level web yield strain, and the average overall strain at peak load. The link-level flange yield strain and the mid-link-level web yield strain are calculated using a biaxial stress state. The calculation procedure is detailed in the next section. The web is straining at the same rate as the overall column until the web yield marker is reached for both the mid-link level (MW) and link level (BW) web measurements. Therefore, the longitudinal web strains are not affected locally by the presence of links up to this point. However, this trend is different for the flanges. The 84
101 link-level flanges (BNWF and BSEF) begin to yield locally before the overall column reaches 1000 με. However, the mid-link level flanges (MNWF and MSEF) do not yield early. This same trend can be noted by examining the load-versus-strain behaviour for Column H6 (Figure 6-21). Similar plots for all columns (H1 through H7) can be found in Appendix E (Figures E-15 to E-21). In Figure 6-21, the plot of the average column strain is similar to the plot of MNWF, MSEF, MW, and BW strain up to about 1800 με. However, the plots of BNWF and BSEF strain show early yielding. Therefore, the longitudinal flange strains are affected by the presence of the links. This may be due to residual stresses caused by the welding of the links (the gauges were only about 25 mm from the weld toe) or to strains caused by shrinkage of the concrete. Chicoine et al. (2003) found that shrinkage of the concrete induced only a small average residual stress in the steel (about 7 MPa). However, the average measurement would not capture the localised stresses induced at the link... Regardless of the cause, the premature yielding of the steel flanges at the link level did not reduce the capacity of the column because the ductility of the steel allowed it to retain its capacity until the column failed. Furthermore, the links present at the locations of premature yielding prevented the column flanges from buckling. As described in Section 5.3.3, each column (H1 through H7) had a longitudinal strain gauge on each side of the NW and SE flanges at the mid-link level that could measure the strains on a potential buckle. Longitudinal strain gauge pairs were also located at the link level, but buckles could not form at this level unless the link weld fractured. Close examination of the mid-link level pairs showed good agreement of strain inside and outside of the flanges until the peak load was reached for Columns H1 through H7, indicating that local buckling had not taken place, with the exception of Column H3. Plots of the strain-versus-column load obtained from the strain-gauge pairs at mid-link level for the NW and SE flanges of Columns H1 through H7 can be found in Appendix E (Figures E-22 to E-35). Slight differences in the slopes of the inner and outer gauge curves in these plots may be caused by initial flange imperfections or slight gauge misalignment (i.e., not perfectly vertical). The large variation of the strain curves for the gauges on H3 indicate that the onset of local buckling occurred at approximately 75% of the peak load. The sudden divergence of the plots of the inner and outer gauge strains in 85
102 Figure 6-22 indicates that a significant strain gradient (flexure) developed across the plate thickness. Although, Figure 6-22 illustrates the behaviour of the NW flange only, the same behaviour was evident to a lesser extent in the SE flange. The formation of local buckles in the flanges of Column H3 is likely due to the large number of initial outward imperfections that were present only in H3 (see Section 3.2.1). These imperfections tend to reduce the capacity of the column and less column load is required for the buckle to develop. In spite of the fact that buckles were starting to form, Column H3 failed by fracture of the link weld adjacent to this gauge pair. Concrete crushing and local buckling followed. In some cases, the gauge pairs were placed where the local buckles eventually formed. Columns H2, H5, H6, and H7 had strain gauges situated directly on the flange local buckles. Figure 6-23 is the load-versus-strain curve for the buckled NW flange of Column H2, which is typical of the captured buckles that formed. Since the gauges were placed on the outside and inside of the flange, local buckling could be observed by relating the two curves. Before a buckle forms, the inside and outside gauges experience the same strain. However, when the buckle forms, it causes a strain gradient across the flange thickness. For Columns H5, H6, and H7, the gauges were close to the apex of the buckle. As such, the inner gauge experienced greater than average compressive strain and the outer gauge experienced less than average compressive strain as the outward buckle formed. For Column H2, the gauges were away from the apex of the buckle, past the buckle s inflection point. As such, the inner gauge experienced less than average compressive strain and the outer gauge experienced greater that average compressive strain. For all of the gauge-captured buckles mentioned above, local buckling occurred after the peak load was reached Transverse Strain Measurements and Transverse Stresses To assess the effect on the steel shape of confinement pressure caused by the lateral expansion of the concrete, a biaxial stress state was assumed. 86
103 σ L E 1 ν ε L + ε RS = 2 (6.1) σ T 1 υ ν 1 ε T υε RS In Equation (6.1), σ L and σ T are the longitudinal and transverse stresses, respectively, E is the measured elastic modulus of the steel plate (202,100 MPa), ν is the Poisson s ratio for steel (0.3), ε L and ε T are the longitudinal and transverse strains, respectively, measured by the strain gauges, and ε RS is the residual longitudinal strain corresponding to the residual stress in the steel section arising principally from weld shrinkage. The residual strain pattern used was adapted from a 450 mm 450 mm 9.5 mm section tested by Tremblay et al. (2000b). The residual strain used on the web and the flange at the gauge locations were 223 με compression and 406 με compression, respectively. Equation (6.1) assumes no residual stress in the transverse direction because the steel shape is free to deform in this direction. The von Mises criterion was then used to evaluate the yielding of the biaxial stress state as follows: σ = σ σ σ + σ F (6.2) 2 VM 2 L L T 2 T 2 y In Equation (6.2), σ VM is the von Mises equivalent stress and F y is the static uniaxial yield strength of the steel plate (394 MPa). The plate yields when σ VM equals F y. As illustrated in Section 5.3.3, two pairs of strain gauges, each consisting of a longitudinal and a transverse strain gauge, were placed on the inside and outside of the NW flange at the link level to obtain ε L and ε T. Similarly, another two pairs were placed on both sides of the web at the mid-link level. A summary of the transverse stresses at yielding for the flange and web is presented in Table 6-3 for each of the concentrically loaded columns. The values reported are the average values measured by strain gauge pairs on both sides of the flange or web. In Table 6-3, the ratio P/P u is the ratio of the column load when the steel reached yield to the peak column load, and σ L /σ VM is the ratio of longitudinal stress to the von Mises stress when the steel yields. When the von Mises yield criterion was satisfied, σ L /σ VM was close to 1.0 for each column (H1 through H7) for both the flange and web and σ T ranged from 28 MPa compression to 28 MPa tension. Therefore, the transverse stress had a negligible influence on the axial capacity of the steel section in the flange and the web. 87
104 The flanges of the PEC columns at the link level yielded well before the peak column load was reached. This agrees with the observations shown in Figure 6-20 Columns H1 and H2 yielded before the peak load at 0.7P u. This is much lower than the values obtained by Chicoine et al. (2002a) that indicate yielding happened near the peak load. However, the values reported by Chicoine et al. (2002a) are obtained by combining a longitudinal strain measured at the mid-link level with the transverse strain measured at the link level. Figure 6-20 shows that the longitudinal strains at the mid-link level are significantly different from the longitudinal strains at the link level. Therefore, the two sets of data cannot be compared. A comparison of the flange results of Columns H4 and H5 (0.62P u and 0.50P u, respectively) to Columns H1 and H2 (both 0.7P u ) indicates that the PEC columns made with high-strength concrete yielded sooner relative to their peak load. However, the average column strain at peak load for Columns H4 and H5 (2869 με) is much higher than that of Columns H1 and H2 (2437 με). Therefore, the lower ratio merely reflects the fact that Columns H4 and H5 had a strain at peak load much higher than the yield strain for the steel plate (1950 με). Comparing average column strains at peak load to the yield strain from the uniaxial tension test is valid because the transverse stresses are negligible. The flange results for Columns H6 and H7 (0.56P u and 0.54P u, respectively) are similar to those of Columns H5 and H4, and Columns H6 and H7 had similar average column strain at peak load (2916 με) to Columns H4 and H5. Therefore, the argument for the lower P/P u ratio is also relevant for Columns H6 and H7. The webs of the PEC columns at the mid-link level yielded near the peak load for Columns H1 through H3, but yielded well before the peak column load was reached for the other columns (H4 through H7). The values obtained for Columns H1 and H2 (0.95P u and 0.94P u, respectively) are similar to those of Chicoine et al. (2002a) where yielding happened near the peak load. A comparison of the web results of Columns H4 and H5 (0.77P u and 0.76P u, respectively) to Columns H1 and H2 (0.95P u and 0.94P u, respectively) indicates that the PEC columns made with high-strength concrete yielded sooner relative to the peak load, which is a similar observation as for the flanges. The lower ratio again reflects the fact that Columns H4 and H5 had a strain at peak load much higher than the yield strain for the steel plate (1950 με). The web results for Columns H6 88
105 and H7 (0.74P u and 0.77P u, respectively) are similar to those of Columns H5 and H4. Columns H6 and H7 had similar average peak column strain (2916 με) to Columns H4 and H5 (2869 με). Therefore, the argument for the lower P/P u ratio is relevant for Columns H6 and H Link Stresses The link strains were measured by a pair of strain gauges, LI and LO, placed on the inside and the outside of the link, respectively. For Columns H1 and H2, the strains measured on the link were small, but there was a slight difference between them indicating that the link was bending slightly. For Columns H3 through H7, the strains measured on the inside and the outside of the link for a particular column were similar, indicating that outward bending of the link was negligible before the peak column load. Table 6-4 is a summary of the link strains at the peak column load. Plots of link strain versus column load for Columns H1 through H7 can be found in Appendix E (Figures E-36 to E-42). The average link strain at the peak load increases approximately proportionally with the column strain at peak load for Columns H1 to H5. The link strain also increases with the strain at peak load for the SFR concrete columns (H6 and H7), but at a higher proportion. The maximum link stresses occurred in the SFR columns, as Columns H6 and H7 reached 256 MPa and 213 MPa, respectively. The non-sfr columns only reached an average link stress of 138 MPa (45% of the yield stress). Figure 6-24 is a plot of link strain versus average column strain for Columns H3 through H7 from which an exponential relationship between the link strain and the column strain can be observed. The higher link strains of the SFR columns (H6 and H7) are caused by the increased column ductility at higher levels of column strain; the peak column strains are sustained for a longer period (see Figure 6-18). During this sustained period, the concrete continued to expand laterally causing increased link strains. This resulted in an abrupt increase in link strain near the average column strain at peak load. This behaviour also results in a plateau at the peak of the link-strain-versus-column-load curve (see Appendix E). By comparison, the non-sfr columns (H3 through H5) reach their peak 89
106 without the sustained straining. At their peak, the load drops suddenly and the links are unloaded Comparison of Column Behaviour to Constituent Behaviour The strength of PEC stub columns is a summation of the strength of the steel section and the strength of the concrete section (see Equation 2.14). The strength of the steel section is reduced to account for its susceptibility to local flange buckling by lowering the cross-sectional steel area from the full area, A s, to an effective area, A se. However, observations made during testing and information obtained from the analysis of the measurements indicates that in general buckling did not occur before the peak load. The early onset of local buckling in Column H3 was caused by unusual initial outward local imperfections and even then buckling did not occur until after a link weld had fractured. The behaviour of the steel and the concrete can be superimposed as a means to study the overall column behaviour. Figures 6-25 through 6-31 illustrate the superimposed constituent strengths compared to the actual column behaviour for Columns H1 through H7. In these figures, the concrete strength is calculated by multiplying the concrete area, A c, by the corresponding measured concrete stress, f c, from the average cylinder test curve for that mix. Similarly, the steel strength is calculated by multiplying A se by the steel stress, F s, measured from the tension coupons. At the peak load for each column, F s equals F y and f c equals f c. Four combinations of superimposed constituent strengths are illustrated to compare to the actual column behaviour. To compare to Equation 2.14, the steel and concrete strength plots are combined and plotted as A se F s +0.8A c f c. (Although A se is only defined at the peak load of each column, where it is multiplied by F y to obtain the effective capacity of the steel section with buckled flanges, for simplicity it is multiplied by F s throughout the load history.) Since local buckling was not observed before the peak load, a plot of A s F s +0.8A c f c is also shown in the figures. In addition to these two plots, plots of A s F s +0.9A c f c and A s F s +A c f c are included in the figures to determine how conservative the factor 0.8 is in Equation
107 The summation of the material behaviour provides a simple model to compare to the actual column behaviour. For Column H1 (Figure 6-25), the measured column load is greater than that predicted by A s F s +0.8A c f c for the majority of the pre-peak behaviour and is close to A s F s +0.9A c f c at low column loads. Therefore, the column utilizes the full steel section, A s. The column reaches its peak load at a higher strain than the constituent summation predicts. The higher strains achieved by the column are due to the concrete confinement provided by the small link spacing (0.5d) in the steel shape. Therefore, the 0.5d link spacing improved the failure mode of PEC columns. Past the peak column load, the constituent summation predictions drop rapidly as the concrete material model does not benefit from any confinement. For Column H2 (Figure 6-26), the measured column load is greater than that predicted by A s F s +0.9A c f c for the majority of the pre-peak behaviour and is similar to those predictions at the peak column load. Therefore, the column utilizes the full steel section, A s, and more than 80% of the concrete strength. The constituent summation predicts the peak well because the peak column strain was similar to the peak concrete cylinder strain. This indicates that a PEC column with 1.0d link spacing does not confine the normal-strength concrete enough to improve its failure mode. Of course, the links benefit the steel section as they reduce the unbraced flange length. At the peak column load, a large piece of crushed concrete fell out of the column, which reduced A c. Therefore, the constituent-summation predictions are not valid after the peak load because A c had been substantially changed and the predictions do not include that reduction. For Column H3 (Figure 6-27), the measured column load is similar to that predicted by A s F s +0.9A c f c until the peak load of the constituent model is reached. Therefore, the column utilizes the full steel section, A s, and more than 80% of the concrete strength. The constituent summation under-predicts the peak strain because the peak concrete cylinder strain was lower than the column strain at peak load. The concrete material model indicates a sudden failure at the peak. However, when confined within the steel shape with small link spacing (0.3d), higher strains are achieved, resulting in an improved failure mode. Post-peak behaviour cannot be compared because 91
108 the constituent summation predictions did not reach the average column strain at the peak load. For Column H4 (Figure 6-28), the measured column behaviour is between that predicted by A s F s +0.8A c f c and A s F s +0.9A c f c until the peak load of the column is reached, although it is close to the A s F s +0.9A c f prediction at the peak load. Therefore, the column utilizes the full steel section, A s. The constituent summations slightly over-predict the strain at peak load by 160 με (5.6%). Variation between the concrete cylinders and the column concrete may be a potential reason for this difference. It appears as though a link spacing of 0.5d does not result in significant confinement of the high-strength concrete. Post-peak behaviour of the column follows a similar path line to the constituent summation prediction. For Column H5 (Figure 6-29), the measured column behaviour is similar to that predicted by A s F s +0.9A c f c until the peak load of the column is reached. Therefore, the column utilizes the full steel section, A s, and more than 80% of the concrete strength. The constituent summation over-predicts the peak strain by 260 με (9.0%). This is similar to Column H4. However, at failure Column H5 had a large piece of crushed concrete fall out of the column, reducing A c (as in Column H2). Therefore, the constituent summation predictions are not valid after the column strain at peak load because A c had been substantially changed and the predictions do not include the reduction. For Column H6 (Figure 6-30), the constituent summations use an adjusted stressversus-strain curve to predict the concrete contribution. The ordinates of the curve were increased (3.4%) based on the expected increase in concrete strength (3.4%) from the 28-day cylinder strength to the column test date (see Section 4.2.2). Using the unadjusted concrete strength would result in a measured column strength exceeding that predicted by A s F s +A c f c, which would require high levels of concrete confinement that were not observed in the other columns. Since the concrete material curve is not based on the actual test date cylinders, the strength of the column cannot be compared to the constituent summation curves directly. However, the shapes of the actual and predicted curves can be compared. The initial, nearly-linear behaviour of the column is predicted well until the near the constituent-summation peak. The constituent summation under- 92
109 predicts the strain at peak load because the peak concrete cylinder strain was lower than the peak column strain. Regardless of the strain at peak load, both the concrete material curve and the measured column curve indicate a gradual failure at their respective peaks. Therefore, the column ductility is somewhat increased by the presence of the ductile SFR concrete and some degree of confinement due to the links. Similar to Column H6, Column H7 (Figure 6-31) uses the adjusted concrete strength in the constituent summations. Again, using the unadjusted strength would result in the measured column behaviour exceeding that predicted by A s F s +A c f c. The behaviour of the column is predicted well until very near the column peak load, as the concrete cylinder peak strain and the column strain at peak load were similar. The concrete material curve indicates a gradual failure after the peak, which is similar to the column curve. Therefore, the column ductility is increased by the presence of the ductile SFR concrete, with perhaps a nominal benefit from confinement due to the presence of the links. For all plots, the steel strength curve has a kink when the yield strength is reached. When the steel strength is combined with the concrete strength to form the superimposed strength curves, a change in slope is observed on the strength curves at the same strain. The measured column curves also exhibit a change in slope at a similar strain, but the presence of residual strains in the steel section of the PEC column shifts the location to slightly lower strains. However, the presence of the kink in both the predicted and measured curves confirms the validity of the simple constituent summation method. Regardless of the link spacing used in each specimen (Columns H1 through H7), the column behaviour exceeded the plots of both A se F s +0.8A c f c and A s F s +0.8A c f c, and was typically closer to the curve defined by A s F s +0.9A c f c. This indicates that the column utilizes the full steel section, A s, and it need not be reduced to an effective area, A se. This conclusion is supported by the observation that the flanges generally did not buckle before the peak column load was reached, as discussed previously. The constituent summation results also indicate that the coefficient 0.8 on the concrete strength is conservative for the columns tested. 93
110 Table 6-1 Test Load Summary for Concentrically Loaded Columns Peak Test Column Load (kn) H H H H H H H Failure Mode Concrete Crushing Flanges Buckling Concrete Crushing Flanges Buckling Link Weld Fracture Concrete Crushing Flanges Buckling Concrete Crushing Flanges Buckling Concrete Crushing Flanges Buckling Concrete Crushing Flanges Buckling Concrete Crushing Flanges Buckling Predicted Load Test/Predicted (kn) Table 6-2 Overall Column Test Results Obtained from Lino Pots Column Overall Strain at Peak Load Secant Modulus at 0.4 P u Peak Test Load, P u (kn) (με) (kn/με) H H H H H H H
111 H1 Table 6-3 Biaxial Stress State of the Steel Plate at Yielding Location P/P u σ L σ T σ VM σ L /σ VM (MPa) (MPa) (MPa) Flange Web H2 H3 H4 H5 H6 Flange Web Flange Web Flange Web Flange Web Flange Web Flange H7 Web Note: Tension is negative 95
112 Table 6-4 Link Strain at Peak Load Summary for Concentrically Loaded Columns Column Overall Strain at Peak Load Average Tensile Link Strain Average Tensile Link Stress Peak Load % Yield Stress (kn) (με) (με) (MPa) (307 MPa) H % H % H % H % H % H % H % 96
113 Elevation (mm) Zone Elevation (mm) Zone Elevation (mm) Zone 97 (a) 2000 (b) 2000 (c) Top Top End End Zone Zone Bottom End Zone Bottom End Zone Top End Zone Bottom End Zone East/West Face East/West Face East/West Face Figure 6-1 Zone Schematics for Concentrically Loaded PEC Columns with a Link Spacing of (a) 120 mm, (b) 200 mm, and (c) 400 mm


")

 Figure 6-5")

114 Figure 6-2 Crack Pattern on West Face of H1 and Buckle of SW flange in Zone 5 (after test) NW Flange Buckle in Zone 6 not shown Figure 6-3 Crushed Concrete and NE and SE Flange Buckles in Zone 5 on the East Face of H1 (after test) Figure 6-4 Crushed Concrete and NW and SW Flange Buckles in Zone 2 and a Second Buckle of the SW Flange in Zone 3 on the West Face of H2 (after test) Figure 6-5 Crushed Concrete and NE and SE Flange Buckles in Zone 3 on the East Face of H2 (after test) 98


 NE Flange Buckle in Zone 3 not")


115 Figure 6-6 Crushed Concrete and NW and SW Flange Buckles in Zone 5 on the West Face of H3 and Link Weld Fractures at Elevation 880 and 1000 mm (after test) Figure 6-7 Crushed Concrete and SE Flange Buckle in Zone 3 on the East Face of H3 (after test) NE Flange Buckle in Zone 3 not shown Shear Lines Figure 6-8 Links Fractured from Weld on the West Face (Column H3) Figure 6-9 Weld Fractured from Link on the East Face (Column H3) 99


 SE Flange")

 Figure 6-13")

116 Figure 6-10 Crushed Concrete and SW Flange Buckle in Zone 4 and NW Flange Buckle in Zone 3 on the West Face of H4 and Link Weld Fracture at Elevation 1000 mm (after test) Figure 6-11 Crushed Concrete and NE Flange Buckle in Zone 2 on the East Face of H4 (after test) SE Flange Buckle in Zone 2 not shown Figure 6-12 Crushed Concrete and NW and SW Flange Buckles in Zone 3 on the West Face of H5 (after test) Figure 6-13 Crushed Concrete and NE and SE Flange Buckles in Zone 2 on the East Face of H5 (after test) 100

 Figure 6-15")

 Figure")


 101")
117 Figure 6-14 Crushed Concrete and NW and SW Flange Buckles in Zone 2 on the West Face of H6 (after test) Figure 6-15 Crushed Concrete and SE Flange Buckle in Zone 4 and NE Flange Buckle in Zone 3 on the East Face of H6 (after test) Figure 6-16 Crushed Concrete and NW and SW Flange Buckles in Zone 2 on the West Face of H7 (after test) Figure 6-17 Crushed Concrete and NE and SE Flange Buckles in Zone 3 on the East Face of H7 (after test) 101
118 H5 H7 H4 H6 H Load (kn) Load (kn) H1 H3 H Strain (με) H4 H5 H7 H Strain (με) Figure 6-18 Column Load versus Average Overall Longitudinal Strain, ε a. Inset: Close-Up of Peak Load Region
119 H6 H3 Load (kn) H Strain (με) Figure 6-19 Alternatives for Improving the Column Failure Mode Longitudinal Gauge Strain (με) Flange Yields Web Yields Column Strain at Peak Load BNWF BSEF MW BW 0 MNWF MSEF Average Overall Strain, ε a (με) Figure 6-20 Typical Gauge Strains versus Average Overall Strain (from Column H6) 103
120 Flange Yields MSEF MNWF BW Web Yields Load (kn) Average Column Strain MW BNWF BSEF Column Strain at Peak Load Longitudinal Strain (με) Figure 6-21 Typical Load versus Longitudinal Strain (from Column H6) Column Load (kn) NW Flange Average NW Outside NW Inside Strain (με) Figure 6-22 NW Flange Strain Behaviour for Column H3 104
121 Column Load (kn) NW Flange Average NW Outside NW Inside Strain (με) Figure 6-23 Typical Buckled Flange Strain Behaviour for Concentrically Loaded PEC Columns (taken from Column H2 NW Flange) 1000 Average Link Tensile Strain (με) SFR (H6 and H7) Non-SFR (H3, H4, and H5) Average Column Compressive Strain (με) Figure 6-24 Link Strain versus Column Strain for High-Strength Concentrically Loaded PEC Columns with and without Steel Fibre Reinforcement 105
122 Average Strain at Peak Column Load Measured Column Behaviour Load (kn) 5000 A s F s +A c f c A s F s +0.9A c f c A s F s +0.8A c f c A se F s +0.8A c f c Steel Strength Concrete Strength Strain (με) Figure 6-25 Column Behaviour of H1 by Constituent Strength Average Strain at Peak Column Load Load (kn) Steel Strength Concrete Strength A s F s +A c f c A s F s +0.9A c f c A s F s +0.8A c f c A se F s +0.8A c f c Measured Column Behaviour Strain (με) Figure 6-26 Column Behaviour of H2 by Constituent Strength 106
123 Load (kn) Average Strain at Peak Column Load A s F s +A c f c A s F s +0.9A c f c A s F s +0.8A c f c A se F s +0.8A c f c Measured Column Behaviour Steel Strength Concrete Strength Strain (με) Figure 6-27 Column Behaviour of H3 by Constituent Strength Average Strain at Peak Column Load Load (kn) Steel Strength Concrete Strength Strain (με) A s F s +A c f c A s F s +0.9A c f c A s F s +0.8A c f c A se F s +0.8A c f c Measured Column Behaviour Figure 6-28 Column Behaviour of H4 by Constituent Strength 107
124 Average Strain at Peak Column Load A s F s +A c f c A s F s +0.9A c f c A s F s +0.8A c f c A se F s +0.8A c f c Load (kn) Measured Column Behaviour Steel Strength Concrete Strength Strain (με) Figure 6-29 Column Behaviour of H5 by Constituent Strength Average Strain at Peak Column Load Measured Column Behaviour Load (kn) Steel Strength Concrete Strength Strain (με) A s F s +A c f c A s F s +0.9A c f c A s F s +0.8A c f c A se F s +0.8A c f c Figure 6-30 Column Behaviour of H6 by Constituent Strength with the Adjusted Concrete Cylinder Strength (55.4 MPa) 108
125 Average Strain at Peak Column Load Measured Column Behaviour Load (kn) A s F s +A c f c A s F s +0.9A c f c A s F s +0.8A c f c A se F s +0.8A c f c Steel Strength Concrete Strength Strain (με) Figure 6-31 Column Behaviour of H7 by Constituent Strength with the Adjusted Concrete Cylinder Strength (60.2 MPa) 109
126 7.0 Experimental Results for Eccentrically Loaded Columns 7.1 Observations and Failure Modes General Discussion Four identical partially encased composite (PEC) columns (H8 through H11) were loaded eccentrically according to the test setup and procedures described in Chapter 5. Columns H8 and H9 were bent about the strong axis and Columns H10 and H11 were bent about the weak axis. The measured eccentricities for Columns H8 through H11 were 23, 100, 25 and 74 mm, respectively. As mentioned in Section 5.4.1, the measured eccentricities were all within 2 mm of the target eccentricity after the columns had been aligned. All columns had a similar failure mode: concrete crushing combined with local buckling of the steel flange as a plastic hinge was formed. Columns bent about their strong axis exhibited a more gradual hinge formation because the flange provided continuous confinement to the concrete face undergoing the highest compressive strain. Columns bent about their weak axis showed a more sudden hinge formation because the concrete face undergoing the highest compressive strain was only periodically supported laterally by the transverse links. A summary of the failure loads and moments, predicted loads and moments, and failure modes for Columns H8 through H11 is presented in Table 6-1. The failure values shown in the table are the peak axial load and the concurrent second-order moment at the mid-height. The predicted values reported were computed by using a load moment interaction diagram, the details of which are included in Section The point where the measured load-versus-moment curve (measured moment includes second-order effects) crosses the failure envelope on the interaction diagram is the predicted capacity. For all four test specimens, the peak column capacity exceeded the predicted capacity for both load and moment. Columns bent about the strong-axis (H8 and H9) had slightly higher test-to-predicted ratios for load and moment than columns bent about the weakaxis (H10 and H11). In strong-axis bending, the presence of the steel flange along the compression face prevents the concrete from advancing outward and from spalling, both of which would have reduced the column capacity. 110
127 The following sections describe both the loading protocol and the observations made during the individual bending tests. To aid in the discussion of the progressive failure of the individual PEC columns during the test, a schematic of the PEC columns is illustrated in Figure 6-1. In this figure, the test region of the column is broken down into five concrete zones separated by the links. Typically, the failure mechanism occurred within a single zone. Note that the transverse link welds did not fail during any of the eccentric-load tests Column H8 A load of 30 kn was placed on the column using the UTS to ensure that the rockers would not slip before the test began. All data acquisition channels were found to be working properly during the pre-test verification. The column was initially loaded at a stroke rate of 0.06 mm/min until the load reached 1620 kn. The rate was then increased to 0.08 mm/min. When the load reached 3800 kn, the rate was further increased to 0.1 mm/min. At 9160 kn, the load-versusdisplacement curves indicated that the column stiffness was decreasing. To minimise dynamic effects, the stroke rate was decreased to 0.08 mm/min until the peak load (10,920 kn) was reached. Following the peak load, the rate was maintained at 0.08 mm/min and the column capacity decreased steadily (within a few minutes) to approximately 6600 kn. The UTS stroke was then held and photographs were taken. The loading was then continued at a rate of 0.08 mm/min until the average displacement of the SW and SE (compression face) linear potentiometers (lino pots) had reached 10 mm. Then the column was unloaded and the test was stopped. The locations of interest during the failure are described using the zone schematic illustrated in Figure 6-1, which is described in Section Before the failure load was reached, local buckling was not visually observed, but the instrumentation suggested some buckling had begun to take place (see Section 7.2.2). Local buckles formed in Zone 3 on the SW and SE flanges, which were on the compression side. The SE flange buckled slightly before the peak load was reached, but the SW flange buckled at the peak load. On the west concrete face, concrete crushing began in Zone 3 at the SW flange, 111
128 progressed northward throughout the post-peak testing, and ended at approximately 75 mm from the NW flange. Similarly on the east concrete face, crushing began in Zone 3 at the SE flange and ended at approximately 30 mm from the NE flange. The final crush patterns on the west and east faces are shown in Figures 7-2 and 7-3, respectively. For both faces, the crushing intensity was most severe near the buckles, where the concrete on the west and east faces advanced outwards 12 and 15 mm, respectively Column H9 A load of 20 kn was placed on the column using the UTS to ensure that the rockers would not slip before the test began. All data acquisition channels were found to be working properly during the pre-test verification. The column was initially loaded at a stroke rate of 0.06 mm/min until the load reached 1050 kn. The rate was then increased to 0.08 mm/min until the peak load (7259kN) was reached. Following the peak load, the rate was maintained at 0.08 mm/min and the column capacity decreased steadily to approximately 5400 kn. The column capacity was stabilising, so the rate was increased to 0.1 mm/min and held until the end of the test. The test was stopped and the column was unloaded after the SW lino pot (on the compression face) had reached 10 mm of displacement. Local buckles in the steel flange did not form before the peak load. Unlike Column H8, flange buckles did not form at the same elevation. Local buckles formed in Zone 3 on the SW flange and in Zone 2 on the SE flange, which were on the compression side. On the west concrete face, concrete crushing began in Zone 3 at the SW flange, progressed northward throughout the post-peak testing, and ended at approximately 100 mm from the NW flange. Similarly, the east face concrete crushed in Zone 2 near the SE flange, progressed northward, and ended at approximately 50 mm from the NE flange. The final crush patterns on the west and east faces are shown in Figures 7-4 and 7-5, respectively. The concrete advancement near the buckles was 10 and 15 mm for the west and east faces, respectively, which is similar to Column H8. Small, horizontal 112
129 tension cracks formed on the west and east faces (near the north column edge) during post-peak testing. Tension cracks were expected with the larger load eccentricity Column H10 A load of 22 kn was placed on the column using the UTS to ensure that the rockers would not slip before the test began. All data acquisition channels were found to be working properly during the pre-test verification. The column was initially loaded at a stroke rate of 0.06 mm/min until the load reached approximately 2400 kn. The rate was then increased to 0.08 mm/min. When the load reached 3300 kn, the rate was further increased to 0.1 mm/min. At 9000 kn, the load-versus-displacement curves indicated that the column stiffness was decreasing. To minimise dynamic effects, the rate was decreased to 0.08 mm/min until the peak load (9737 kn) was reached. At the peak load, the column failed suddenly and the column capacity dropped to 5700 kn. The UTS stroke was held constant and the capacity stabilised at 5200 kn. The loading was then continued at a stroke rate of 0.08 mm/min. The column capacity increased to 5550 kn and then began to decrease again. After the capacity had decreased to 5450 kn, the stroke rate was increased to 0.1 mm/min until the end of the test. The test was stopped and the column unloaded when the average displacement of the NW and SW lino pots (on the compression face) had reached 10 mm. Local buckling of the steel flange was not observed before the peak load. In weak-axis bending, the entire west concrete face is in compression. As such, the west face failed in a similar manner to concentrically loaded columns. The concrete crushed in Zone 4 and local buckles formed in the SW and NW flanges in Zone 4. As well, the concrete advanced outward 15 mm at the bottom of Zone 4. Figure 6-6 shows the west face after the test. Large horizontal cracks formed on the east side (tension side) from the SE flange to the NE flange. The widest crack formed at an elevation of 1360 mm, which is a link elevation that borders the top of Zone 4. Other horizontal cracks were spaced approximately 120 mm (half link spacing) from the widest crack. However, the width of these cracks decreased away from the widest crack. Figure 6-7 shows the crack pattern on the east face after the test. 113
130 7.1.5 Column H11 A load of 12 kn was placed on the column using the UTS to ensure that the rockers would not slip before the test began. All data acquisition channels were found to be working properly during the pre-test verification. The column was initially loaded at a stroke rate of 0.06 mm/min until the load reached approximately 1035 kn. The rate was then increased to 0.08 mm/min. The column reached the peak load of 6370 kn and failed suddenly. At failure, the UTS stroke was held and the column capacity stabilised at 3800 kn. The loading was then continued at a stroke rate of 0.06 mm/min. The column capacity increased to 3850 kn and then began to decrease again. After the capacity had fallen to 3800 kn, the stroke rate was increased to 0.08 mm/min. The rate was further increased to 0.1 mm/min when the capacity had fallen to 3750 kn and maintained until the end of the test. The test was stopped and the column unloaded when the displacement of the SW lino pot (on the compression face) had reached 10 mm. Local buckling was not observed before the peak load. On the west, compression face, the concrete crushed in Zone 4 and local buckles formed on the SW and NW flanges in Zone 4, which was similar to Column H10. However, the concrete did not advance as far outward (10 mm versus 15 mm for Column H10). Figure 6-10 shows the west face after the test. Large horizontal cracks formed on the east side (tension side) from the SE flange to the NE flange. The widest crack (final width of 3 mm) formed at an elevation of 1360 mm, which is a link elevation that borders the top of Zone 4. The second largest crack formed at an elevation of approximately 1240 mm, which is the midlink level of Zone 4. Neither of these cracks were present before the peak load. During post-peak loading, a third crack (much smaller than the first two) formed at an elevation of 1120 mm, which is a link elevation that borders the bottom of Zone 4. Therefore, all of the significant tension cracks on the east side were within Zone 4. Figure 6-11 shows the crack pattern on the east face after the test. 114
131 7.2 Data Obtained from Instrumentation In this section, data obtained from the instrumentation used on the eccentrically loaded columns is analysed to determine the PEC column behaviour. Information regarding the location of the instrumentation described herein can be found in Section Longitudinal Strain Measured from Linear Potentiometers Four linear potentiometers (lino pots) were used to measure longitudinal strain over a 3d mid-section (elevation of 640 to 1360 mm). One lino pot was placed in each corner of the column (NW, NE, SW, and SE). Since the column was loaded eccentrically, the strain in the cross-section can be considered to be a combination of the axial compressive strain, which is constant across the cross-section, and the flexural strain, which varies across the cross-section. The strain distribution of a PEC column bent about its strong axis is illustrated in Figure The average strain at the tension lino pots (NW and NE) was calculated by dividing the average reading by their initial gauge length (720 mm). The average strain at the compression lino pots (SW and SE) was calculated the same way. The distribution of the strain across the cross-section was assumed to be linear between the average tensile strain at the NW and NE lino pots and the average compressive strain at the SW and SE lino pots. The lateral distance between the lino pots and the column affects how much strain the lino pots measure. To standardise the results, the strains at the column edges ( extreme fibre in Figure 7-10), which were 35 mm from the respective lino pot pair, are presented in subsequent discussions. A similar linear strain distribution was assumed for columns bent about their weak axis (not shown), where the lino pot pairs were also 35 mm from the compression and tension faces and the gauge lengths for the lino pots were also 720 mm. Depending on the magnitude of the eccentricity, both sides of the column may be in compression or one side may be in compression and the other in tension. Columns H8 and H10 had a small eccentricity (23 and 25 mm respectively), so their entire cross-sections were in compression. Conversely, Columns H9 and H11 had enough eccentricity (100 and 74 mm, respectively) so that one side of the column was in compression and the other in 115
132 tension. To differentiate the column sides, they are referred to according to their flexural state. Therefore, the compressive side will always be in compression, but the tensile side may be in tension or a smaller compression, as mentioned above. In strong-axis bending, the north face of the column was the tension side and the south face was the compression side, while in weak-axis bending, the east face of the column was the tension side and the west face was the compression side. The average of the four lino pots (NW, NE, SW, and SE) is the overall average for the column, which was located at the column centreline. The curvatures of the columns (used in subsequent sections) were calculated by dividing the difference of the average measured compressive strain and the average measured tensile strain by the lateral distance between the lino pot locations (470 mm). By assuming a constant strain over an individual lino-pot gauge length, the curvature is assumed to be constant over the gauge length. The load-versus-strain relationships for Columns H8 through H11 are shown in Figure 7-11 through Figure 7-14, respectively. Table 6-2 is a summary of the average strains, as well as the tensile and compressive extreme fibre strains at the peak load obtained from these figures. As expected, the amount of load eccentricity is reflected in the degree of separation between the curves in Figures 7-11 to 7-14 for the tension and compression sides of the columns. The strong-axis bending curves for Columns H8 and H9 are linear to approximately 8100 kn (0.75P u ) and 5700 kn (0.80P u ), respectively, while the weak-axis bending curves for Columns H10 and H11 are linear to approximately 7700 kn (0.80P u ) and 5300 kn (0.8P u ), respectively The compressive side reached higher strains for the columns bent about their strong axis. Columns H8 and H9 reached 4035 and 4742 με, respectively, while Columns H10 and H11 only reached 3118 and 3498 με, respectively. Columns bent about their strong axis had higher peak strains because the flange provided continuous confinement to the concrete undergoing the highest compressive strain. Furthermore, this concrete was 8 mm in from the extreme fibre, so it experienced slightly less strain than the extreme steel fibre. Columns bent about their weak axis did not have much confinement for the extreme concrete fibre, which was only periodically supported by the 116
133 transverse links. As such, the compression strains measured at the column were similar to typical unconfined concrete crushing strains. The secant moduli (axial stiffnesses) taken from the load-versus-average-strain response at 40% of the peak load (0.4P u ) are reported in Table 7-2. They were lower for the columns with more eccentricity. Columns H8 and H10, which had eccentricities of 23 and 25 mm, respectively, had a stiffness of 6.0 kn/με, while Columns H9 and H11, which had eccentricities of 100 and 74 mm, respectively, had a stiffness of 5.6 kn/με (6.7% lower). The columns with the larger eccentricities had some cross-sectional area in tension. When the concrete was in tension, cracking of the concrete occurred and the overall stiffness was reduced. Regardless of the small difference in column stiffness between these two groups, the range of values of stiffness measured for Columns H8 to H11 (5.6 to 6.0 kn/με) is similar to the range of values measured for Columns H3 to H7 (5.5 to 5.8 kn/με), which were loaded concentrically and had a range of link spacings Longitudinal Strain Measured from Strain Gauges The distribution of strain that was calculated in the last section from lino pot measurements can be verified by comparing it to strain gauge measurements. Figure 7-15 shows this comparison for Column H9, which is typical for Columns H8 through H11. Plots for Columns H8, H10, and H11 are included in Appendix F (Figures F-1 to F-4). In Figure 7-15, the link level tension flange is the average measurement of strain gauges BNWFOL, BNWFIL, BNEFOL, and BNEFIL, plotted against the average strain in the tension flange obtained from the lino pot strain distribution (see Figure 7-10). Similarly, the mid-link level tension flange is the average measurement of strain gauges MNWFOL, MNWFIL, MNEFOL, and MNEFIL, plotted against the average strain in the tension flange determined from the lino pots. The link level web and the mid-link level web are the average measurements of BEWL and BWWL, and of MEWL and MWWL, respectively, plotted against the average strain in the web (see Figure 7-10). The link level compression flange and the mid-link level compression flange are the average measurements of BSWFOL, BSWFIL, BSEFOL, and BSEFIL, and of MSWFOL, MSWFIL, MSEFOL, and MSEFIL, respectively, plotted 117
134 against the average strain in the compression flange (see Figure 7-10). If the strain gauges were straining at the average rate, then the plot should have a one-to-one slope, which is included in Figure 7-15 for convenience. Figure 7-15 shows that the strain gauge readings and the calculated strains from the lino-pot strain distribution were similar. The strain in the web at the link level and at the mid-link level followed the one-to-to one slope until approximately 1850 με, which is close to the plate yield strain (1950 με). Therefore, the web had a uniform strain along the column length up to about 1850 με. The web strain was not uniform up to the nominal yield strain because there were residual strains in the steel section of the column due to welding the built-up steel shape. The compression flange at the mid-link level also followed the one-to-one slope until approximately 1800 με. Again, residual stresses caused early yielding. The subsequent deviation from the one-to-one slope implies that yielding did not commence uniformly along the column length. The compression flange at the link level differed from the mid-link level because it only followed the one-to-one slope until approximately 1300 με. This agrees with the results of the concentric tests (see Section 6.2.2), which found that the flanges at the link level began to yield significantly earlier than the flanges at the mid-link level. It was proposed in that discussion that the additional residual strains at the link level are caused by the welding of the links and by shrinkage of the concrete. This trend was similar for Columns H8, H10, and H11 (see Appendix F). The tension flange at the link level and at the mid-link level strained at a one-to-one slope until approximately 200 με. After this, the strain gauges strained slightly faster than the average strain distribution (the slope is slightly greater than one-to-one). The modulus of rupture for the concrete in Column H9 determined from the compressive strength is 4.8 MPa (CSA 2004c), which corresponds to a tensile strain of 170 με. Therefore, the change from a one-to-one slope to a higher slope at 200 με may reflect the formation of micro-cracks in the concrete near the strain gauges. The higher effective tensile stiffness over the column length, as compared to at a crack location, is known as tension stiffening. The steel near a crack would strain more than the average as the steel accepts the tensile load from the cracked concrete. Initial column imperfections and the associated alignment imperfections may also have contributed to the slightly higher rate. The tension flange for Column H11 also 118
135 experienced tensile strains similar to Column H9. However, the tensile strain gauge measurements were much smaller at peak for Column H11 (140 με) than Column H9 (620 με) because the strain gauges were much closer to the neutral axis (75 mm from the extreme fibre) in weak-axis bending (Column H11). Therefore, the effects of tension stiffening cannot be determined for Column H11. Since the strain gauge measurements agree well with the average overall strain distribution during the initial loading phase, the curvature obtained from the strain gauge measurements must also agree with the curvature from the average overall strain distribution over the same phase. The flanges of Columns H8 through H11 had a pair of longitudinal strain gauges located 75 mm from each flange tip, with one of each pair affixed on each side of the flange. The pairs allowed for an increased accuracy of the reading and for the detection of local buckling of the compression flange. Since a strain gradient exists across the column cross-section, a slight difference in strain for strong-axis bending is expected because the gauges on the outside of the flange are farther from the neutral axis than the inside gauges. In weak-axis bending, the inside and outside flange gauges are the same distance from the neutral axis, so the measurements should be similar..for strong-axis bending (Columns H8 and H9), the SW and SE flanges were the compression flanges, and for weak-axis bending (Columns H10 and H11), the SW and NW flanges were the compression flanges. Examination of these pairs showed signs of local buckling before the peak load on the SE flange of Column H8 (see Figure 7-16). The behaviour observed in Figure 7-16 was typical of the captured buckles that formed in concentrically-loaded PEC columns (more information describing the characteristics of local buckles on a loadversus-strain curve can be found in Section 6.2.2). No signs of local buckling before the peak were evident for Columns H9 through H11. The formation of a buckle in Column H8 is likely caused by initial geometric imperfections or variations in the material properties because a buckle did not form on the SW flange of H8, nor did buckles occur on Column H9, which was also bent about the strong axis. Plots showing the longitudinal strain, measured from the compression flange pairs, versus the column load for Columns H8 through H11 are included in Appendix F (Figures F-5 to F-12). 119
136 7.2.3 Moment versus Curvature The moment-versus-curvature relation can be used to determine the effective column stiffness and to quantify the ductility of a plastic hinge. The effective flexural stiffness for an eccentrically loaded column at a given load is the tangential slope of the moment-versus-curvature plot at that load. The stiffness of a PEC column decreases during eccentric loading as the concrete in the tension zone cracks, the concrete in the compression zone crushes, and the steel yields or buckles. The ductility of the column can be quantified by examining the peak moment region on the curve. An eccentrically loaded column with high ductility is able to sustain the peak moment over a large range of curvature. Figure 7-17 shows the moment-versus-curvature curves for Columns H8 through H11. In the figure, the moments are calculated by multiplying the column load by the mid-height eccentricity, which is determined by adding the initial eccentricity to the midheight deflection (measured by CT3) and subtracting the translation of the rockers. The rocker translation is calculated using Equation 5.1. The column curvature is the slope of the strain distribution measured by the lino pots (see Section 7.2.1). During the initial linear portion of the moment-versus-curvature diagram, the measured stiffness (slope of the curve) should be close to the theoretical initial (elastic) stiffness. The theoretical initial stiffness can be calculated by adding the steel section stiffness to the concrete stiffness as follows: ( EI ) EI S + EC I C PEC = (7.1) In Equation 7.1, (EI) PEC is the theoretical initial column stiffness, E is the elastic modulus of the steel plate (202,100 MPa), I s is the moment of inertia of the steel section, E c is the elastic modulus of the concrete (see Table 4-3), and I c is the moment of inertia of the concrete. In determining I c, the stiffness of the concrete in tension is neglected since cracking in tension takes place at low strains. Columns H8 and H10 were in compression over the entire cross-section, while Columns H9 and H11 experienced some tension on the cross-section. Column H11 experienced more tensile strain in its tension face than did Column H9. For Columns H9 and H11, the location of the neutral axis, which varied little between 10% and 50% of the peak moment (M u ), was determined using the average overall strain distribution. The neutral axis was 10 mm and 70 mm from the tension face 120
137 for Columns H9 and H11, respectively. The large variation of the neutral-axis location below 0.1M u can be attributed to a combination of seating of the columns in the testing machine and the fact that the measurement errors may have been significant as compared to the measurements themselves. Above 0.5M u, the neutral-axis location moves due to the increased second-order moment effects on the column and the non-linear behaviour of the material at these strains. For Column H9, the neutral axis was only 2 mm into the concrete section (10 mm from the tension face minus 8 mm flange thickness), so the concrete experienced negligible tension and I c was not reduced. Therefore, I c was reduced for Column H11 only. The theoretical initial column stiffness for columns bent about their strong axis (Columns H8 and H9) is and N mm 2, respectively, and about their weak axis (Columns H10 and H11) are and N mm 2, respectively. The initial measured column stiffnesses (initial slope of the moment-versus-curvature plot) for Columns H8 through H11 are , , , and N mm 2, respectively. These values are less than the theoretical stiffnesses by 5.4%, 6.4%, and 3.6% for Columns H8, H9, and H10, respectively, because the theoretical values do not consider geometric imperfections and material variability that are present in the actual columns. The theoretical stiffness of Column H11 is 1.6% less than the measured value ( N mm 2 ). The difference in these values results from the uncertainty in the determination of the neutral-axis location and the omission of the geometric imperfections and material variability in the calculation of the theoretical value. Nevertheless, the theoretical stiffnesses are all reasonable approximations of the measured values Transverse Strain Measurements and Transverse Stresses The transverse strains were measured on the SW flange (which was in longitudinal compression in all columns) at the link level and on the web at the mid-link level for all four columns. To analyse the confinement pressure on the steel shape due to the lateral expansion of the concrete, a biaxial stress state was assumed that was determined using the procedure and residual stress pattern described in Section A 121
138 summary of the transverse stresses at yielding (i.e., when the von Mises stress, σ VM, equals the steel yield stress, F y ) for the flange and web is presented in Table 7-3 for Columns H8 through H11. InTable 6-3Table 7-3, the transverse stresses, σ T, reported for the web are the average values of those measured on each side of the web. However, the flange bent outward, so both the inner and outer transverse stresses are reported. The ratio P/P u is the ratio of the column load when the steel yielded to the peak column load, and σ L /σ VM is the ratio of longitudinal stress to the von Mises stress when the steel yielded. Only the web of Column H11 reached the column peak load without yielding (P/P u equals 1.0) due to the steep strain gradient that resulted in a relatively low strain at the gauge location. When the von Mises criterion was reached, σ L /σ VM was slightly greater than 1.0 for each column (Columns H8 through H11) for both the flange and web, indicating that the transverse stress did not reduce the axial capacity of the steel section. Moreover, despite the fact that the measured transverse strains were tensile as a result of the Poisson effect, the average stress σ T ranged from 6 MPa compression to 51 MPa compression, implying that confinement of the concrete may not have been taking place at these load levels. (However, as mentioned in the previous section, the steel section provided significant confinement to the concrete during the hinge formation when the column was bent about its strong axis.) The compression flanges of all columns experienced a higher transverse compressive stress on the inside of the flange than on the outside as a result of a slight outward bend between the web and the link. For all columns, the link-level flange yielded at a lower P/P u than the web (mid-link level) due to the localised residual strains present near the links (see Section 7.2.2) and the strain distribution. The SW flange was oriented to always be a compression flange and was farther from the neutral axis than the web gauge location (see Figure 7-10). Therefore, at a given load, the SW flange was straining at a higher rate, which caused it to yield before the web. 122
139 7.2.5 Link Strains and Stress Link strains were measured on the inside and outside of a link that was at an elevation of 1120 mm on the west face. As shown in Figure 5-10, the link strain was measured using strain gauges that were placed half-way along the link s length. The strains and stresses in the links at the peak load are summarised in Table 7-4. Plots of the link strain versus column load are included in Appendix F (Figures F-13 to F-16). For Columns H8 and H10, with small eccentricities, a slight difference between the inner and outer strain gauges developed near the peak load (40 με and 80 με, respectively, at 0.95 P u ), indicating that the links were bending inward for Column H8 and outward for Column H10. The outward bending in Column H10 may have been due to the higher lateral dilation of the concrete under nearly pure compression. The inward bending of Column H8 may have been caused by an initial outward bend in the link being straightened as the tensile strain increased during the test or it could be a result of the strain gradient across the column cross-section causing a curvature reversal in the link. In any case, the degree of bending was small for both columns. For Columns H9 and H11, with larger eccentricities, there was a negligible difference between the inner and outer strain gauges. The strain at the peak load was less for columns bent about their strong axis (396 and 300 με for Columns H8 and H9, respectively) than columns bent about their weak-axis (596 and 449 με for Columns H10 and H11, respectively). For eccentrically loaded columns in strong-axis bending, the link strain will vary along the length of the link because the links are perpendicular to the bending axis of the column. The tensile strain gradient in the link along its length should be approximately proportional to the strain gradient across the column s cross-section. At the end of the link at the compression flange, the link prevents the flange from buckling outward, resulting in maximum link tension at that end. At the other end of the link, the column compression will be less (or tensile) and the link will not strain as much. The varying tensile stress is equilibrated by the bond stresses at the interface with the concrete. Column H8 had a higher measured strain in the link at the peak load (396 με) than Column H9 (300 με) because it had a lower strain gradient across the cross-section resulting in more tensile demand from the link at the tension face of the column. Therefore, the average demand, which theoretically occurs at the gauge location, will be 123
140 higher for a more uniform compressive strain (lower strain gradient). A link on the compression side during weak-axis bending should experience relatively constant tension along its length because both ends of the link inhibit flange buckling. This is similar to the concentrically loaded columns; however, unlike the concentrically loaded columns, the concrete expands less near the web due to the strain gradient. Column H10 had a higher measured strain in the link at the peak load (596 με) than Column H11 (449 με) because it had a smaller strain gradient across the cross-section resulting in more lateral concrete expansion at both ends of the link. Although the links on the tension side of the columns were not measured for strain, they were expected to strain the least because the flanges at either end of the links are not as susceptible to local buckling. More gauges would be required to accurately determine the tensile strain gradient along the link length Interaction Diagrams for PEC Columns Interaction diagrams were developed for the eccentrically loaded PEC columns tested in this study. Figure 7-18 shows strong-axis bending and Figure 7-19 shows weakaxis bending. The failure envelope on the interaction diagram represents the predicted failure for any combination of (unfactored) load and moment. Theoretically, if a particular combination of applied load and moment falls within the failure envelope, then the column has the capacity to support that combination. If it falls outside to the failure envelope, then the column is predicted to fail. The interaction diagrams shown in Figure 7-18 and Figure 7-19 were developed using methods similar to reinforced concrete column interaction diagrams. As such, they neglect the links present at distinct elevations. Multiple strain gradients were assumed for the column and then the load and moment capacities were calculated for each strain gradient. Since the degree of concrete confinement is small, for every strain gradient the extreme concrete fibre crushing strain was set at 3500 με. For weak-axis bending this fibre was at the edge of the concrete face, while for strong-axis bending, this fibre was inside of the compression flange (see Figure 7-20). The extreme tension strain was varied to generate different strain gradients, resulting in different points on the failure envelope. The values of extreme tension strain used to generate the failure curve in 124
141 Figure 7-18 and in Figure 7-19 were zero tension, 0.5 times the yield strain of steel, ε y, 0.75ε y, 1.0ε y, 1.5ε y, 2ε y, 3ε y, 5ε y, and 10ε y (10ε y results in a tensile load capacity for strong-axis bending and is not shown in Figure 7-18) Uniform compression on the crosssection was also used to determine points on the failure envelope. Uniform compression was calculated using the concentric load resistance given in Equation The load and moment capacities calculated for each strain gradient were based on the measured cross-sectional geometry and material properties. The concrete was assumed to have no tensile strength. To calculate the compressive force in the concrete, an equivalent rectangular compression block was assumed for the stress distribution in a manner similar to that used in the design of concrete columns (CSA 2004c). The concrete force at the ultimate condition was taken as: C = α 1 f ' b β c (7.2) c c c 1 α f ' 0.67 (7.3) 1 = c β f ' 0.67 (7.4) 1 = c In Equation 7.2, b c is the net width of the concrete block (392 mm in strong-axis bending and 384 mm in weak-axis bending), c is the distance from the neutral axis to the extreme concrete compression fibre (see Figure 7-20), and α 1 and β 1 are defined in Equations 7.3 and 7.4, respectively. For strong-axis bending, f c was set to 63.5 MPa because this was the average value measured for Columns H8 and H9 (individual batches differed by 3%). For weak-axis bending, f c was set to 65.4 MPa because this was the average value measured for Columns H10 and H11 (individual batches differed by 1%). The force resultant, C c, acts through the centre of the compression block. As mentioned in the previous paragraph, Equation 2.14 was used to calculate the capacity of the section in uniform compression. This approach effectively equates α 1 to 0.8, instead of 0.75, which was calculated using Equation 7.3. Although this is a discrepancy in the procedure, the use of 0.75 would decrease the uniform compressive capacity by 6% when the results of the concentrically-loaded PEC columns (see Chapter 6) show that Equation 2.14 is already conservative. Therefore, the uniform compressive capacity was not reduced using α 1. To avoid a discontinuity in the interaction diagrams, the transition is assumed 125
142 to be linear between the point corresponding to zero strain on the column tension face and the one corresponding to pure compression, as shown in Figures 7-18 and The steel section was discretised based on its orientation so that the individual pieces were under a nearly-uniform strain. For strong-axis bending, the flanges were each kept as one piece and the web was separated into ten pieces (see Figure 7-20). In weak-axis bending, the web was kept as one piece and each flange was each broken into ten pieces. The strain at the centre of each piece (calculated from the strain distribution) was assumed constant over that piece s area. The effect of the transverse stresses was neglected in determining the yield point in the steel section. If the piece had yielded (strain exceeds 1950 με in tension or compression), the force resultant for the individual piece was the area of the piece multiplied by the yield stress (394 MPa). If the piece had not yielded, the force resultant for the individual piece was the area of the piece multiplied by its strain and by the elastic modulus of steel the steel plate (202,100 MPa). If an individual flange piece was in compression, then the area of that piece was reduced to an effective area using Equations 2.4, 2.6, with n = 1.5, and 2.13 (by taking b and b e in Equation 2.6 to be the actual and effective widths, respectively, of the individual piece and all other variables, including b, in Equations 2.4 and 2.13 to be as defined in Chapter 2) to account for its susceptibility to local buckling. By so doing, for weak-axis bending the effective width may be somewhat underestimated since a strain gradient is present along the flange that was not assumed in the development of the effective width equations for concentric loading. The force resultant for an individual steel piece acts through the centre of that piece s area. The load capacity for the section is taken as the summation of the force resultants. The moment capacity for the section is the summation of each force resultant multiplied by its distance from the column centreline. The predicted load and moment capacities listed in Table 6-1 are the locations where the measured column behaviour crosses the failure envelope. For strong-axis bending (Figure 7-18), Columns H8 and H9 exceeded the capacities predicted by the interaction diagram failure envelope by 17 to 27%. The interaction diagram does not consider the effects of any concrete confinement provided by the steel section or the strain hardening of the steel at high strains. Since the load-versus-moment curves of 126
143 Columns H8 and H9 are quite linear, the second-order effects were minimal. Like the strong-axis bending, the predicted capacities of Columns H10 and H11 (see Figure 7-19) were exceeded, but by only 4 to 9%. The PEC interaction diagrams did not overestimate the column capacity as much in weak-axis bending because no flange is present to provide confinement for the concrete as it crushes at the extreme fibre. Second-order effects were also minimal for Columns H10 and H11, as their behaviour was quite linear. Although the interaction diagram does not consider concrete confinement provided by the steel section or the strain hardening of the steel, it still provides a good, conservative prediction of PEC column behaviour in both strong- and weak-axis bending over a large range of eccentricities. 127
144 128 Table 7-1 Peak Load Summary for Eccentrically Loaded Columns Initial Test Failure Predicted Test/Predicted Specimen Eccentricity Load Moment Mode Load Moment Load Moment (mm) (kn) (knm) (kn) (knm) H Local Buckling Concrete Crushing H Local Buckling Concrete Crushing H Concrete Crushing Local Buckling H Concrete Crushing Local Buckling
145 Column Table 7-2 Overall Column Test Results Obtained from Lino Pots Peak Test Load Average Strain at Peak Load Tension Side Strain at Peak Load Compression Side Strain at Peak Load Average Secant Modulus at 0.4P u (kn) (με) (με) (με) (kn/με) H H H H Note: Tension is negative H8 Table 7-3 Biaxial Stress State of the Steel Plate at Yielding Inner Outer Average Location P/P u σ L σ T σ T σ T σ VM σ L /σ VM (MPa) (MPa) (MPa) (MPa) (MPa) Flange Web H9 H10 H11 Flange Web Flange Web Flange Web Note: Tension is negative 129
146 Table 7-4 Link Strain Summary for Eccentrically Loaded Columns Column Peak Load Average Tensile Link Strain Average Tensile Link Stress % Yield (kn) (με) (MPa) (307 MPa) H % H % H % H % 130
147 Elevation (mm) Zone Top End Zone Bottom End Zone East/West Face Figure 7-1 Zone Schematic for Eccentrically Loaded PEC Columns with a Link Spacing of 240 mm 131


")


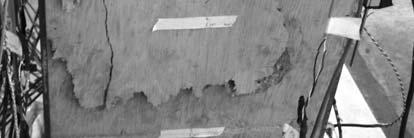
148 Figure 7-2 Crushed Concrete and SW Flange Buckle in Zone 3 on the West Face of H8 (after test) Figure 7-3 Crushed Concrete and SE Flange Buckle in Zone 3 on the East Face of H8 (after test) Figure 7-4 Crushed Concrete and SW Flange Buckle in Zone 3 on the West Face of H9 (after test) Figure 7-5 Crushed Concrete and SE Flange Buckle in Zone 2 on the East Face of H9 (after test) 132


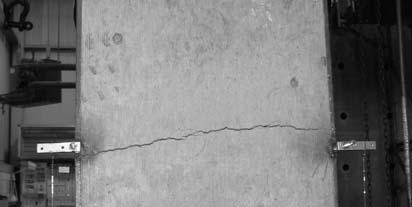
149 Figure 7-6 Crushed Concrete and SW and NW Flange Buckles in Zone 4 on the West Face of H10 (after test) Figure 7-7 Tension Crack Pattern on the East Face of H10 (after test) Figure 7-8 Crushed Concrete and SW and NW Flange Buckles in Zone 4 on the West Face of H11 (after test) Figure 7-9 Tension Crack Pattern on the East Face of H11 (after test) 133
150 470 mm 35 mm 35 mm PEC Column Cross-Section Lino Pot NORTH SOUTH 39 mm 39 mm 196 mm 196 mm Average Strain Distribution (-) Extreme Tension Fibre Neutral Axis Average Strain in Tension Flange Average Strain in Web (+) (+) Compression 0 (-) Tension Average Strain in Compression Flange Extreme Compression Fibre Figure 7-10 Average Strain Distribution due to an Eccentric Load on a PEC Column (Strong-Axis Bending) 134
151 Average Load (kn) Tension Face Compression Face Strain (με) Figure 7-11 Load versus Strain for Column H Load (kn) Average Tension Face Compression Face Strain (με) Figure 7-12 Load versus Strain for Column H9 135
152 Average Load (kn) Tension Face Compression Face Strain (με) Figure 7-13 Load versus Strain for Column H Load (kn) Average Tension Face Compression Face Strain (με) Figure 7-14 Load versus Overall Strain for Column H11 136
153 4000 Link Level Compression Flange 3000 Link Level Web Strain Gauge Strain (με) Mid-Link Level Web Mid-Link Level Compression Flange Mid-Link Level Tension Flange Link Level Tension Flange Lino Pot Overall Strain (με) Figure 7-15 Typical Average Strain Calculated from Lino Pot Strain Distribution versus Strain Measured by Strain Gauges (taken from Column H9) 137
154 12000 Column Load (kn) SE Flange Average SE Outside SE Inside Buckling Occurs Strain (με) Figure 7-16 Buckling Behaviour of SE Compression Flange of Column H8 800 H8 (e=23 mm) Moment (knm) H9 (e=100 mm) H10 (e=25 mm) H11 (e=74 mm) E E E E-05 Curvature (1/mm) Figure 7-17 Moment versus Curvature for Eccentrically Loaded PEC Columns 138
155 12000 C u Failure Envelope Load (kn) Column H8 Column H Moment (knm) Figure 7-18 PEC Column Interaction Diagram for Strong-Axis Bending C u Failure Envelope Load (kn) Column H Column H Moment (knm) Figure 7-19 PEC Column Interaction Diagram for Weak-Axis Bending 139
156 Neutral Axis c Concrete Crushing Strain (+) (+) Compression (-) Tension (-) Extreme Tension Strain Cross-Section Strain Diagram Figure 7-20 Assumed Strain Diagram for PEC Column Interaction Diagram (Strong-Axis Bending) 140
157 8.0 Summary, Conclusions, and Recommendations 8.1 Summary An experimental and analytical research project was undertaken to study the behaviour of partially encased composite (PEC) columns made with high performance concrete. PEC columns consist of a thin-walled welded H-shaped steel section with transverse links welded between the opposing flanges (to improve the buckling resistance of the flange) that is infilled with concrete between the flanges. Previous research studied the behaviour of PEC columns made with normalstrength concrete under concentric or eccentric loading. For this study, 11 PEC stub columns measuring 400 mm 400 mm 2000 mm were tested, with the primary variables being concrete type, link spacing, and load eccentricity. Besides the concrete type and the transverse-link spacing, all other parameters for the PEC columns satisfied the requirements of the Canadian steel design standard, CSA S16-01 (CSA 2001). Two groups of PEC columns were tested. The first group consisted of seven PEC columns that were tested under concentric axial loading. Three types of concrete (normal-strength, high-strength, and steel-fibre reinforced high-strength) and three different link spacings (120, 200, and 400 mm) were used in the columns. The normalstrength concrete was used as a control to permit a direct comparison with previous research and the steel fibres were used as a potential means of improving the failure mode of PEC columns constructed with high-strength concrete. The column behaviour was examined by considering the load-versus-strain response at various points in the cross-section, the transverse stresses in the steel shape (web, flange, and links), and the summation of the constituent behaviours (steel and concrete). The test capacities were compared to those predicted using the existing design provisions in S16-01 that were developed using test results for PEC columns with normal strength concrete. The second test group consisted of four identical PEC columns made with highstrength concrete and 240 mm link spacing that were tested under eccentric axial loading to determine their behaviour under a combination of axial force and bending. Rocker end fixtures allowed for a pin-ended connection for the eccentric tests. The parameters 141
158 investigated included the bending axis (strong-axis or weak-axis, as defined by flexural stiffness) and the amount of initial eccentricity of the load. Similar to the first group, the eccentrically-loaded column behaviour was examined by considered the load-versusstrain response at various points in the cross-section and the transverse stresses. In addition, the moment-versus-curvature response was studied. Load-versus-moment interaction diagrams were constructed to predict the column performance. 8.2 Conclusions Concentric Load Tests For all seven concentric tests, the failure mode was similar: concrete crushing combined with the steel flange buckling. The onset of local buckling occurred prior to the peak load in only one column that had atypical outward local imperfections in the steel flanges between the links. The failure of the columns made with the high-strength concrete was sudden, as compared to an equivalent column made with normal-strength column. The addition of steel fibres to the high-strength concrete resulted in a column failure that was somewhat more ductile. Ancillary test results from the steel fibre reinforced (SFR) concrete showed that the steel fibres increased the ductility of the concrete; therefore, the failure mode of the PEC column was influenced by the failure mode of the concrete within the column. For all concrete types, a decreased spacing of the transverse links resulted in a somewhat more ductile failure mode compared to the larger spacing. For all seven tests, longitudinal strains were found to be uniformly distributed across the steel cross-section at the link level and the mid-level, except for at the flange of the link-level. The flange at the link level was found to yield prematurely, which was attributed to the proximity of the gauge location to the link welds. This did not result in a decrease in the column capacity because the presence of the link prevented the flange from buckling. Link stresses at the peak column load were found to be highest (80% of the yield stress) in the columns made with steel-fibre reinforced high-strength concrete because these columns sustained their peak load over a larger strain range. Since the highest 142
159 stress measured was below the yield stress, the current design requirements for link crosssectional area and welding in CSA S16-01 (CSA 2001) are considered satisfactory. Similar to observations from previous tests on PEC columns made with normalstrength concrete, transverse strains in the steel did not reduce the axial capacity of the steel section. Moreover, the stress distribution indicated that the degree of confinement of the concrete within the steel section was low. The average test-to-predicted capacity ratio of the PEC columns that were made with high-strength concrete (with and without steel-fibre reinforcement) was For the non-fibrous high-strength concrete, the average ratio was Therefore, the design equations in CSA S16-01 (CSA 2001) that were used to calculate the predicted strength are conservative for use with PEC columns with high-strength concrete. These design calculations reduce the capacity of the steel flanges to account for their susceptibly to local buckling between the links. However, flange buckling was not observed before the peak load. Therefore, the full steel section could be used in the strength prediction, which results in a mean test-to-predicted capacity ratio for the specimens with high strength concrete of 1.16 (1.11 for the non-fibrous specimens). Moreover, increasing the concrete strength modifier from 0.8 (in S16-01) to 0.9, (and using the unreduced steel section) was found to give an improved prediction of the peak strength, with a mean testto-predicted strength ratio of 1.07 (1.03 for the non-fibrous specimens). Furthermore, this latter set of assumptions was used along with the load-versus-strain curves of the constituent materials to give a good prediction of the column behavioural history up to the peak strength Eccentric Load Tests For the four eccentric tests, the failure mode was similar: concrete crushing combined with steel flange buckling during the formation of a plastic hinge. However, the actual failure was different depending on about what axis bending took place. In strong-axis bending the extreme compression and tension fibres were steel, whereas in weak-axis bending they were concrete. As such, columns bent about the strong axis had a more gradual hinge formation because the steel flange provided continuous 143
160 confinement to the concrete undergoing the highest compressive strain, thus inhibiting spalling. Columns bent about the weak axis had a more sudden hinge formation because the concrete undergoing the highest compressive strain had no continual support. Local buckling was observed on one compression flange of Column H8 (e = 23 mm) at 90% of the peak load, but all other columns reached the peak load and the onset of local buckling simultaneously. The longitudinal-strain gradient across the cross-section was linear, as confirmed by the use of external linear potentiometers and internal strain gauges. Similar to the concentrically loaded specimens, the flange at the link level yielded prematurely. Slight variations (within 10%) in tensile strain between the linear potentiometer and strain gauge measurements indicate the tension stiffening of the PEC column. The initial stiffnesses of the four columns obtained from the moment-versus-curvature diagrams were within 2 to 6% of the theoretical value when the tensile stiffness of the concrete was neglected. Transverse strains measured in the flanges indicate that the flanges were slightly bending outward between the link and the web for all four specimens. However, the resulting stresses and the transverse stresses in the web did not decrease the capacity of the steel section. The maximum tensile stress in the links was found to be 44% of the yield stress. Therefore, the current design requirements for cross-sectional area and welding of the links in CSA S16-01 (CSA 2001) are also satisfactory for eccentric loading. Load-versus-moment interaction diagrams were used to estimate the capacity of the eccentrically-loaded PEC columns. A linear strain distribution was assumed for the construction of the diagrams, which was confirmed by the longitudinal measurements (as noted above). Considering that local buckling was observed prior to reaching the peak capacity during one of the four eccentric tests and it seemed to be influential in triggering failure in all cases, the steel flanges in compression were reduced to an effective area using the equations of CSA S16-01 (CSA 2001). Interaction curves formulated with this consideration resulted in average test-to-predicted ratios for column load and moment of 1.12 and 1.15, respectively, with minimum values of 1.04 and 1.04, respectively. The 144
161 procedure was significantly more conservative when predicting strength for strong-axis bending. Nevertheless, it provided a conservative strength prediction in all cases. 8.3 Recommendations The results obtained throughout this study have led to recommendations for the design of PEC columns made with high performance concrete and recommendations for future research Design In general, PEC columns with high-strength concrete behaved in a similar manner to those with normal-strength concrete, although the failure mode in some cases was more brittle. The current design procedures in S16-01 for concentrically loaded columns were found to give conservative predictions of strength and, as such, are considered to be adequate when extended to include high-strength concrete. Concrete up to 66 MPa was utilized in this study, so it seems reasonable to extend the current upper limit in S16-01 from 40 MPa to 70 MPa. Although local buckling was generally not observed during the concentric tests before the peak load (except for in one specimen that had an atypical number of outward initial imperfections in the flange), it is recommended that the reduced steel flange area used in the calculation of the design strength be retained because the maximum width-tothickness ratio, b/t, allowed by CSA S16-01 (CSA 2001), which is 32, was not studied in conjunction with this research. The width-to-thickness ratio of the flange used in this study was 25. Columns that were fabricated with a smaller link spacing exhibited an improved failure mode at the peak load for each type of concrete used in this study. Furthermore, a link spacing equal to the column depth resulted in a brittle failure regardless of the type of concrete used. Therefore, the design requirement of CSA S16-01 (CSA 2001) that limits the centre-to-centre spacing of links to a maximum of two-thirds of the column depth should not be increased. 145
162 The addition of steel fibres to the high-strength concrete improved the ductility of the column somewhat. However, the use of a very small link spacing (one-third of the column depth) had a similar effect. Although both options tend to improve the behaviour around the peak load, the closer link spacing is likely a more economical choice if the strain demand is isolated to a small region of the column length because the link spacing would only need to be decreased in that region. To use SFR high-strength concrete in that region would require the entire column to be cast with SFR concrete or to be cast in specific lifts that would require additional construction considerations. Either of the two SFR concrete options would likely be more expensive than welding in extra bars during the steel section fabrication. If steel-fibre reinforced concrete is used to cast PEC columns, then the length of the steel fibre should be less than or equal to the cover over the links to prevent bridging that could result in large air voids forming between the link and the formwork. The transverse strains measured during the concentric and eccentric tests were negligible and did not reduce the capacity of the PEC columns. Therefore, they need not be considered in design. Moreover, the strain distributions in the steel sections implied that the degree of confinement of the concrete was small and should therefore not be accounted for in design. For both concentric and eccentric tests, the cross-sectional area and welding of the links were determined from the design requirements of CSA S16-01 (CSA 2001). Since the link stress never exceeded 83% of the yield stress, the design requirements are considered adequate. Load moment interaction diagrams, as described in this report, can conveniently be used to design PEC columns that are not concentrically loaded because they conservatively predict the capacity and they are relatively easy to produce. Moreover, since they are routinely used for the design of reinforced concrete columns, the concepts are familiar to designers. 146
163 8.3.2 Future Research In total, nine tests were performed on PEC columns made with high-strength concrete. To fully extend the range of applications of PEC columns made with highstrength concrete, further testing is required to validate the design procedures of CSA S16-01 (CSA 2001) for concentrically loaded columns and the design procedures recommended herein for columns loaded under combined axial load and bending. For all nine tests, the flange b/t was 25 and local buckling generally did not occur before the peak load. Furthermore, strength predictions using the full steel area gave good approximations of column strength. However, the current maximum b/t ratio allowed by CSA S16-01 (CSA 2001) is 32. Therefore, a PEC column made with highperformance concrete having a b/t ratio of about 32 should be tested concentrically to determine if local buckling occurs before the peak load. The hinges that formed during the peak load were brittle in weak-axis bending. Previous research (including this study) has found that a smaller link spacing increases the ductility of the failure under concentric loading. Therefore, a smaller link spacing should be investigated to determine its effect on hinge ductility in weak-axis (and strongaxis) bending. All of the specimens tested in this study (concentric and eccentric) had early yielding of the flange at the link level. It was theorized that the early yielding was caused by localised residual stress in the steel caused by welding of the links and shrinkage of the concrete. To determine the influence of the welds, a residual stress evaluation should be performed on a steel section that has had links welded to it. To determine the influence of the concrete shrinkage, the steel strains should be measured periodically between the column s casting and testing dates. The existing numerical model developed by Begum et al. (2005) should be compared to the results obtained in this study to determine the adequacy of the model for use in predicting the behaviour of PEC columns with high-strength concrete. The model could then be used in conjunction with selected further physical tests to confirm the conclusions drawn from this experimental program. 147
164 Reference List ACI. (1997). ACI 363R-92, State-of-the-art report on high-strength concrete (reapproved in 1997). American Concrete Institute, Farmington Hills, MI. AFNOR. (1988). Concrete: Measuring the flow time of concrete and mortar using a workability meter. Association Française de Normalisation, Paris. ASTM. (2002). C469-02, Standard test method for static modulus of elasticity and Poisson s ratio of concrete in compression. American Society for Testing and Materials, Philadelphia, PA. ASTM. (2003). A370-03, Standard test methods and definitions for mechanical testing of steel products. American Society for Testing and Materials, Philadelphia, PA. Begum, M., Driver, R.G., and Elwi, A.E. (2005). Strength and stability simulations of partially encased composite columns under axial loads. Proc., 2005 SSRC Stability Conference, April 6-9, Montreal, Canada, pp Bouchereau, R. and Toupin, J.-D. (2003). Étude du comportement en compressionflexion des poteaux mixtes partiellement enrobés. Report EPM/CGS , Dept. Of Civil Engineering, École Polytechnique, Montreal (in French). CSA. (1994). CAN/CSA-S136-94, Cold formed steel structural members. Canadian Standards Association, Rexdale, ON. CSA. (2001). CSA S16-01, Limit states design of steel structures. Canadian Standards Association, Rexdale, ON. CSA. (2004a). CSA A , Concrete materials and methods of concrete construction. Canadian Standards Association, Rexdale, ON. 148
165 CSA. (2004b). CSA A , Methods of test and standard practices of concrete. Canadian Standards Association, Rexdale, ON. CSA. (2004c). CSA A , Design of concrete structures. Canadian Standards Association, Rexdale, ON. CSA. (2004d). CSA G , Structural quality steel. Canadian Standards Association, Rexdale, ON. Chicoine, T., Tremblay, R., Massicotte, B., Ricles, J., and Lu, L.-W. (2002a). Behaviour and strength of partially encased composite columns with built up shapes. Journal of Structural Engineering, ASCE, 128 (3), pp Chicoine, T., Massicotte, B., and Tremblay, R. (2002b). Finite element modelling and design of partially encased composite columns. Steel & Composite Structures, 2 (3), pp Chicoine, T., Massicotte, B., and Tremblay, R. (2003). Long-term behaviour and strength of partially encased composite columns with built up shapes. Journal of Structural Engineering, ASCE, 129 (2), pp Elnashai, A.S., Takanashai, K., Elghazouli, A.Y., and Dowling, P.J. (1991). Experimental behaviour of partially encased composite beam-columns under cyclic and dynamic loads. Proc., Institute of Civil Engineers, Part 2, 91, pp Elnashai, A.S., and Broderick, B.M. (1994). Seismic resistance of composite beamcolumns in multi-story structures. Part 1: Experimental studies. Journal of Constructional Steel Research, Elsevier, Oxford, UK, 30, pp
166 Fillion, I. (1998). Étude expérimentale des poteaux mixtes avec section d acier en I de classe 4. Report EPM/GCS-98-06, Dept. of Civil Engineering, École Polytechnique, Montreal (in French). Hunaiti, Y.M., and Fattah, B. Abdel. (1994). Design considerations of partially encased composite columns. Proc., Institute of Civil Engineers, Structures and Buildings, 106, pp MacGregor, J.G. and Bartlett, F.M. (2000). Reinforced concrete: mechanics and design, 1 st Canadian edition. Prentice-Hall Canada Inc., Scarborough, ON. Plumier, A., Abed, A. and Tilioune, B. (1995). Increase of buckling resistance and ductility of H-sections by encased concrete. Behaviour of Steel Structures in Seismic Areas: STESSA 94, ed. by F.M. Mazzolani and V. Gioncu, E&FN Spon, London, pp Tremblay, R., Massicotte, B., Filion, I., and Maranda, R. (1998). Experimental study on the behaviour of partially encased composite columns made with light welded H steel shapes under compressive axial loads. Proc., 1998 SSRC Annual Technical Meeting, Atlanta, pp Tremblay, R., Chicoine, T., Massicotte, B., Ricles, J., and Lu, L.-W. (2000a). Compressive strength of large scale partially-encased composite stub columns. Proc., 2000 SSRC Annual Technical Session & Meeting, Memphis, pp Tremblay, R., Chicoine, T., and Massicotte, B. (2000b). Design equation for the axial load capacity of partially encased non-compact columns. Proc., Composite Construction in Steel and Concrete IV, ASCE, ed. by J.F. Hajjar, M. Hosain, W.S. Easterling, and B.M. Sharooz, ASCE, Reston, VA, pp
167 Appendix A Shop Drawings of the Steel Section and the Rocker End Fixtures 151
168 152 Figure A-1 Bare Steel Section with 120 mm Link Spacing
169 153 Figure A-2 Bare Steel Section with 200 mm Link Spacing
170 154 Figure A-3 Bare Steel Section with 240 mm Link Spacing
171 155 Figure A-4 Bare Steel Section with 400 mm Link Spacing
172 156 Figure A-5 Rocker End-Fixture Assembly
173 157 Figure A-6 Rocking Block (curved surface has a radius of 250 mm)
174 158 Figure A-7 Adjustable Top Plate
175 159 Figure A-8 Cover Plate for Top Plate
176 160 Figure A-9 Base Block
177 161 Figure A-10 Top Plate to Cover Plate Connectors
178 162 Figure A-11 Rocking Block to Base Block Connectors
179 Appendix B Local Imperfections in the Steel Flange 163
180 Appendix B Local Imperfections in the Steel Flange This appendix includes the results of the initial local imperfection measurements made on the flanges of the bare steel sections. The initial local imperfections presented in this report were determined in the same manner as those presented by Chicoine et al. (2002a). The imperfections are illustrated in Figure B-1. The imperfection amplitude, a, is the difference between the average depth, x, measured at two adjacent links and the measured depth half-way between those same links (labelled M in the following tables). The initial imperfections were measured along the lines at the centre and at both flange edges for each flange. The lines were numbered 1 through 6 as illustrated in Figure B-1b, which shows line 1 being measured. Lines 1, 3, 4, and 6, were used to calculate flange local imperfection amplitude, while lines 2 and 5 were used to improve the detail of the measured transverse flange profile. The local imperfection results for Columns H1 through H11 are included in Tables B-1 through B-11. In the tables, inward imperfections are shown as positive. Additional spot checks were made after the columns had been cast and no significant differences were found. (a) Rigid Aluminum Bar A (b) x A Local Imperfection Amplitude ( a) Figure B-1 Initial Imperfection Measurements in (a) Longitudinal Side View and (b) Section A-A View 2 N 164
181 Table B-1 Local Flange Imperfections for Column H1 165 Depth, x Adjacent Link Average Flange Local Imperfection Amplitude, a Line Location Line Location Line Location Link Elevation (mm) (mm) (mm) (mm) (mm) (mm) (mm) (mm) (mm) (mm) (mm) (mm) (mm) (mm) (mm) M M M M M M Average Imperfection Amplitude 0.22 Number of Outward Imperfections 3
182 Table B-2 Local Flange Imperfections for Column H2 166 Depth, x Adjacent Link Average Flange Local Imperfection Amplitude, a Line Location Line Location Line Location Link Elevation (mm) (mm) (mm) (mm) (mm) (mm) (mm) (mm) (mm) (mm) (mm) (mm) (mm) (mm) (mm) M M M Average Imperfection Amplitude 0.91 Number of Outward Imperfections 0
183 Table B-3 Local Flange Imperfections for Column H3 167 Depth, x Adjacent Link Average Flange Local Imperfection Amplitude, a Line Location Line Location Line Location Link Elevation (mm) (mm) (mm) (mm) (mm) (mm) (mm) (mm) (mm) (mm) (mm) (mm) (mm) (mm) (mm) M M M M M M M M M M Average Imperfection Amplitude 0.05 Number of Outward Imperfections 13
184 Table B-4 Local Flange Imperfections for Column H4 168 Depth, x Adjacent Link Average Flange Local Imperfection Amplitude, a Line Location Line Location Line Location Link Elevation (mm) (mm) (mm) (mm) (mm) (mm) (mm) (mm) (mm) (mm) (mm) (mm) (mm) (mm) (mm) M M M M M M Average Imperfection Amplitude 0.33 Number of Outward Imperfections 1
185 Table B-5 Local Flange Imperfections for Column H5 169 Depth, x Adjacent Link Average Flange Local Imperfection Amplitude, a Line Location Line Location Line Location Link Elevation (mm) (mm) (mm) (mm) (mm) (mm) (mm) (mm) (mm) (mm) (mm) (mm) (mm) (mm) (mm) M M M Average Imperfection Amplitude 1.16 Number of Outward Imperfections 0
186 Table B-6 Local Flange Imperfections for Column H6 170 Depth, x Adjacent Link Average Flange Local Imperfection Amplitude, a Line Location Line Location Line Location Link Elevation (mm) (mm) (mm) (mm) (mm) (mm) (mm) (mm) (mm) (mm) (mm) (mm) (mm) (mm) (mm) M M M M M M Average Imperfection Amplitude 0.38 Number of Outward Imperfections 1
187 Table B-7 Local Flange Imperfections for Column H7 171 Depth, x Adjacent Link Average Flange Local Imperfection Amplitude, a Line Location Line Location Line Location Link Elevation (mm) (mm) (mm) (mm) (mm) (mm) (mm) (mm) (mm) (mm) (mm) (mm) (mm) (mm) (mm) M M M Average Imperfection Amplitude 1.00 Number of Outward Imperfections 0
188 Table B-8 Local Flange Imperfections for Column H8 172 Depth, x Adjacent Link Average Flange Local Imperfection Amplitude, a Line Location Line Location Line Location Link Elevation (mm) (mm) (mm) (mm) (mm) (mm) (mm) (mm) (mm) (mm) (mm) (mm) (mm) (mm) (mm) M M M M M Average Imperfection Amplitude 0.49 Number of Outward Imperfections 0
189 Table B-9 Local Flange Imperfections for Column H9 173 Depth, x Adjacent Link Average Flange Local Imperfection Amplitude, a Line Location Line Location Line Location Link Elevation (mm) (mm) (mm) (mm) (mm) (mm) (mm) (mm) (mm) (mm) (mm) (mm) (mm) (mm) (mm) M M M M M Average Imperfection Amplitude 0.45 Number of Outward Imperfections 0
190 Table B-10 Local Flange Imperfections for Column H Depth, x Adjacent Link Average Flange Local Imperfection Amplitude, a Line Location Line Location Line Location Link Elevation (mm) (mm) (mm) (mm) (mm) (mm) (mm) (mm) (mm) (mm) (mm) (mm) (mm) (mm) (mm) M M M M M Average Imperfection Amplitude 0.35 Number of Outward Imperfections 1
191 Table B-11 Local Flange Imperfections for Column H Depth, x Adjacent Link Average Flange Local Imperfection Amplitude, a Line Location Line Location Line Location Link Elevation (mm) (mm) (mm) (mm) (mm) (mm) (mm) (mm) (mm) (mm) (mm) (mm) (mm) (mm) (mm) M M M M M Average Imperfection Amplitude 0.42 Number of Outward Imperfections 1
192 Appendix C Compression Tests on Grout 176
193 Appendix C Compression Tests on Grout This appendix includes a description of the test setup and results from compression tests on the two grouts used during this study: Sikadur AG Grout Rapid as the top-gap grout (see Section 3.2.3) and Con-Spec Rapid Repair Mortar as the contact grout between the test specimen and the testing machine (see Section 5.3.1). For very thin layers of material in compression (relative to their other dimensions), the material near the centre benefits from confinement provided by the surrounding material. Therefore, the grout used in this study may have a higher capacity than the material specification sheet suggests. To mimic the grout application used during the column study, a thin layer of grout (similar to the application thickness) was cast between two steel plates forming a sandwich, as depicted in Figure C-1. The dimensions of the top-gap grout and the contact grout were 200 mm 140 mm 25 mm and 150 mm 110 mm 8 mm, respectively. The top-gap grout set for 24 hours and the contact grout set for 16 hours, both being less than the curing time that was expected to elapse prior to testing the column specimen. The grout sandwich was tested in compression in the MTS 2700 compression testing machine, with a capacity of 2670 kn, at the I.F. Morrison Structures Laboratory at the University of Alberta. The strain was calculated from the average displacement readings of two linear variable displacement transducers (LVDTs). The stress was calculated from the test machine load cell readings and the cross-sectional area of the grout sandwich. The stress-versus-strain curves for both grouts are shown in Figure C-2. In each test, the maximum capacity of the MTS 2700 was reached and then the specimen was unloaded. Therefore, the compressive capacities of the grouts were not reached. However, for their intended use, it was required that the top-gap grout and the contact grout have minimum compressive strengths of 81 and 52 MPa, respectively. These requirements were exceeded as the maximum measured compressive stresses were 96 and 158 MPa, respectively. The elastic moduli of the top-gap and contact grouts were 3.7 and 1.3 GPa, respectively. 177
 160 140 120 100 80 60 40")
 Figure C-2 Stress-versus-Strain Curves for")
194 LVDT Grout Layer Steel Spacer Plates Figure C-1 Top Gap Grout sandwich in the MTS 2700 Stress (MPa) Top-Gap Grout Contact Grout Strain (με) Figure C-2 Stress-versus-Strain Curves for Grout 178
Simulations of partially encased composite column under concentric loading using equivalent steel section
 4 th Annual Paper Meet and 1 st Civil Engineering Congress, December 22-24, 2011, Dhaka, Bangladesh ISBN: 978-984-33-4363-5 Noor, Amin, Bhuiyan, Chowdhury and Kakoli (eds) www.iebconferences.info Simulations
Seismic performance of New Steel Concrete Composite Beam-Columns
 Seismic performance of New Steel Concrete Composite Beam-Columns Toshiaki FUJIMOTO, Hiroshi KOMATSU, Tomoyuki SAKURADA & Noritaka MOROHASHI College of Industrial Technology, Nihon University, Japan SUMMARY:
In-plane testing of precast concrete wall panels with grouted sleeve
 In-plane testing of precast concrete wall panels with grouted sleeve P. Seifi, R.S. Henry & J.M. Ingham Department of Civil Engineering, University of Auckland, Auckland. 2017 NZSEE Conference ABSTRACT:
PRESTRESSED CONCRETE STRUCTURES. Amlan K. Sengupta, PhD PE Department of Civil Engineering Indian Institute of Technology Madras
 PRESTRESSED CONCRETE STRUCTURES Amlan K. Sengupta, PhD PE Department of Civil Engineering Indian Institute of Technology Madras Module 5: Analysis and Design for Shear and Torsion Lecture-23: Analysis
NEW COMPOSITE CONSTRUCTION OF HYBRID BEAMS COMBINING STEEL INVERTED T-SECTION AND RC FLANGE
 NEW COMPOSITE CONSTRUCTION OF HYBRID BEAMS COMBINING STEEL INVERTED T-SECTION AND RC FLANGE Alex Remennikov 1, Marcus Roche 2 ABSTRACT: Steel and concrete composite beams are typically formed by shear
10-COLUMNS: 10.1 Introduction.
 1 10-COLUMNS: 10.1 Introduction. Columns are vertical compression members of a structural frame intended to support the loadcarrying beams. They transmit loads from the upper floors to the lower levels
Journal of Asian Scientific Research EVALUATION OF RECTANGULAR CONCRETE-FILLED STEEL-HOLLOW SECTION BEAM-COLUMNS
 Journal of Asian Scientific Research journal homepage: http://www.aessweb.com/journals/5003 EVALUATION OF RECTANGULAR CONCRETE-FILLED STEEL-HOLLOW SECTION BEAM-COLUMNS Kamyar Bagherinejad 1 ---- Emad Hosseinpour
RESILIENT INFRASTRUCTURE June 1 4, 2016
 RESILIENT INFRASTRUCTURE June 1 4, 2016 MOMENT REDISTRIBUTION OF GFRP-RC CONTINUOUS T-BEAMS S. M. Hasanur Rahman M.Sc. Student, University of Manitoba, Canada Ehab El-Salakawy Professor and CRC in Durability
Angle Cleat Base Connections
 Missouri University of Science and Technology Scholars' Mine International Specialty Conference on Cold- Formed Steel Structures (2010) - 20th International Specialty Conference on Cold-Formed Steel Structures
Experimental research on reduced beam section to concrete-filled steel tubular column joints with RC slab
 Proceedings of the Tenth Pacific Conference on Earthquake Engineering Building an Earthquake-Resilient Pacific 6-8 November 15, Sydney, Australia Experimental research on reduced beam section to concrete-filled
Local and post-local buckling of steel tubes in thinwalled. circular concrete-filled steel tubular. columns
 University of Southern Queensland Faculty of Engineering and Surveying Local and post-local buckling of steel tubes in thinwalled circular concrete-filled steel tubular columns A dissertation submitted
Analysis and Design of Steel
 Analysis and Design of Steel and Composite Structures Qing Quan Liang CRC Press Taylor & Francis Croup Boca Raton London New York CRC Press is an imprint of the Taylor & Francis Croup, an informa business
TABLE OF CONTENTS FINITE ELEMENT MODELING OF CONCRETE FILLED DOUBLE SKIN
 TABLE OF CONTENTS SECTION 1 INTRODUCTION... 1 1.1 Introduction... 1 1.2 Objectives and Scope of Work... 2 1.2.1 Experimental Phase... 2 1.2.2 Analytical Phase... 3 1.3 Outline of the Report... 4 SECTION
mortarless masonry Design Manual Part 1 (IS 456:2000) Section 1 Page 1 IS 456:2000 PLAIN AND REINFORCED CONCRETE - CODE OF PRACTICE
 Section 1 Page 1 IS 456:2000 PLAIN AND REINFORCED CONCRETE - CODE OF PRACTICE") SECTION 1. mortarless masonry Design Manual Part 1 (IS 456:2000) Section 1 Page 1 1.1 Overview of IS 456:2000 IS 456:2000 PLAIN AND REINFORCED CONCRETE - CODE OF PRACTICE IS 456:2000 is the current Indian
SECTION 1. mortarless masonry Design Manual Part 1 (IS 456:2000) Section 1 Page 1 1.1 Overview of IS 456:2000 IS 456:2000 PLAIN AND REINFORCED CONCRETE - CODE OF PRACTICE IS 456:2000 is the current Indian
M. H. Lai a, J. C. M. Ho b,*
 Available online at www.sciencedirect.com Procedia Engineering 57 ( 2013 ) 662 669 11th International Conference on Modern Building Materials, Structures and Techniques, MBMST 2013 Uni-Axial Compression
composite elements, lateral loads, strain analysis, behavior Composite steel concrete elements made by steel and concrete are used in world wide almos
 V. Stoian *1, D. Dan 1, A. Fabian 1 Rezumat 唗 ţ ᗷ唷 唗 z z ţ z 唗 z ţ z ţ ţ z ţ 唗 ţ ţ 唗 唗 ţ z ţ ţ I ţ z ţ â ᗷ唷 ţ 唗ţ ᗷ唷 ᗷ唷 唗 ţ z ţ ţ ᗷ唷 ţ Ş ţ ᗷ唷 z ᗷ唷 ţ 唗 z 唗 ţ 唗 唗 唗 ᗷ唷 z z ţ ţ ᗷ唷 唗 ᗷ唷 z ţ 唗 唗 ţ z ţ ţ 唗 *
Reinforced Concrete Design. A Fundamental Approach - Fifth Edition
 CHAPTER REINFORCED CONCRETE Reinforced Concrete Design A Fundamental Approach - Fifth Edition Fifth Edition REINFORCED CONCRETE A. J. Clark School of Engineering Department of Civil and Environmental Engineering
STRUCTURAL PERFORMANCE OF STEEL-CONCRETE-STEEL SANDWICH COMPOSITE BEAMS WITH CHANNEL STEEL CONNECTORS
 Transactions, SMiRT-22 STRUCTURAL PERFORMANCE OF STEEL-CONCRETE-STEEL SANDWICH COMPOSITE BEAMS WITH CHANNEL STEEL CONNECTORS Meng Chu 1, Xiaobing Song 2, Honghui Ge 3 1 Senior Engineer, Shanghai nuclear
Ductility of Welded Steel Column to Cap Beam Connections Phase 2
 Ductility of Welded Steel Column to Cap Beam Connections Phase 2 Test 2 Summary Report 1 June 2011 1. Executive Summary Prepared for: Alaska Department of Transportation and Public Facilities Alaska University
CHAPTER 3 CODAL PROVISIONS AND DESIGN METHODS
 22 CHAPTER 3 CODAL PROVISIONS AND DESIGN METHODS 3.1 PREAMBLE The axial capacities of concrete-filled columns are predicted based on the provisions given in Eurocode4-1994 [10], AISC-2005[11], AISC- LRFD-1999
ABC-UTC. Research Progress Report (Feasibility Study) Title: Alternative ABC Connections Utilizing UHPC. March, 2017
 Title: Alternative ABC Connections Utilizing UHPC. March, 2017") ABC-UTC Research Progress Report (Feasibility Study) Title: Alternative ABC Connections Utilizing UHPC ABSTRACT March, 2017 Accelerated Bridge Construction (ABC) is a method of bridge construction designed
ABC-UTC Research Progress Report (Feasibility Study) Title: Alternative ABC Connections Utilizing UHPC ABSTRACT March, 2017 Accelerated Bridge Construction (ABC) is a method of bridge construction designed
The cracking behaviour of reinforced concrete beams under static and dynamic loading
 The cracking behaviour of reinforced concrete beams under static and dynamic loading J.A. Huffadine, A.G. van Bysterveldt, G.C. Clifton & G.W. Ferguson Department of Civil Engineering, University of Auckland,
Performance of Concrete Filled Steel Tubular Columns
 American Journal of Civil Engineering and Architecture, 217, Vol. 5, No. 2, 35-39 Available online at http:pubs.sciepub.comajcea521 Science and Education Publishing DOI:1.12691ajcea-5-2-1 Performance of
CHAPTER 5 FINITE ELEMENT MODELLING
 53 CHAPTER 5 FINITE ELEMENT MODELLING 5.1 GENERAL Reinforced concrete structures are largely employed in engineering practice in a variety of situations and applications. In most cases these structures
Axial load-bending moment diagrams of GFRP reinforced columns and GFRP encased square columns
 University of Wollongong Research Online Faculty of Engineering and Information Sciences - Papers: Part A Faculty of Engineering and Information Sciences 2017 Axial load-bending moment diagrams of GFRP
`Limit State of Collapse in Compression Design of an Axially Loaded Short Column
 `Limit State of Collapse in Compression Design of an Axially Loaded Short Column Cl.39, p-70, IS:456-2000 Members in compression are called columns and struts. The term column is reserved for members which
CFT Column-to-Cap Beam Connections for. Accelerated Bridge Construction in Seismic Regions. Lisa Marie Berg. Master of Science in Civil Engineering
 CFT Column-to-Cap Beam Connections for Accelerated Bridge Construction in Seismic Regions Lisa Marie Berg A thesis submitted in partial fulfillment of the requirements for the degree of Master of Science
Nonlinear Analysis of Shear Dominant Prestressed Concrete Beams using ANSYS
 Nonlinear Analysis of Shear Dominant Prestressed Concrete Beams using ANSYS Job Thomas Indian Institute of Science, Bangalore, India Ananth Ramaswamy Indian Institute of Science, Bangalore, India Abstract
AN INVESTIGATION OF SEISMIC RETROFIT OF COLUMNS IN BUILDINGS USING CONCRETE JACKET
 AN INVESTIGATION OF SEISMIC RETROFIT OF COLUMNS IN BUILDINGS USING CONCRETE JACKET Gnanasekaran, K. 1 and Amlan K. Sengupta 2 1 Ph.D. Scholar, Dept. of Civil Engineering, Indian Institute of Technology
A Guide for the Interpretation of Structural Design Options for Residential Concrete Structures
 CFA Technical Note: 008-2010 A Guide for the Interpretation of Structural Design Options for Residential Concrete Structures CFA Technical This CFA Technical Note is intended to serve as a guide to assist
Contents. Tables. Notation xii Latin upper case letters Latin lower case letters Greek upper case letters Greek lower case letters. Foreword.
 Tables x Notation xii Latin upper case letters Latin lower case letters Greek upper case letters Greek lower case letters xii xiv xvi xvi Foreword xviii 1 Introduction 1 1.1 Aims of the Manual 1 1.2 Eurocode
COLUMNS 1- Definition: The Egyptian code defines columns as : 2- Types of concrete columns
 COLUMNS 1- Definition: Columns are vertical compression members which carry primarily axial compression load; the axial load may be associated with bending moments in one or two directions, as shown in
Load capacity of slender reinforced concrete walls governed by flexural cracking strength of concrete
 Magazine of Concrete Research, 2000, 52, No. 3, June, 169±175 Load capacity of slender reinforced concrete walls governed by flexural cracking strength of concrete J. G. Sanjayan Monash University This
CHAPTER 3 BEHAVIOUR OF FERROCEMENT HOLLOW SLABS
 30 CHAPTER 3 BEHAVIOUR OF FERROCEMENT HOLLOW SLABS 3.1 INTRODUCTION There are numerous similarities between ferrocement and reinforced concrete. Both use similar matrix and reinforcement materials. They
(a) Pin-Pin P cr = (b) Fixed-Fixed P cr = (d) Fixed-Pin P cr =
 Pin-Pin P cr = (b) Fixed-Fixed P cr = (d) Fixed-Pin P cr =") 1. The most critical consideration in the design of rolled steel columns carrying axial loads is the (a) Percent elongation at yield and the net cross-sectional area (b) Critical bending strength and axial
1. The most critical consideration in the design of rolled steel columns carrying axial loads is the (a) Percent elongation at yield and the net cross-sectional area (b) Critical bending strength and axial
twenty two concrete construction: flat spanning systems, columns & frames Reinforced Concrete Design Reinforced Concrete Design
 ARCHITECTURAL STRUCTURES: FORM, BEHAVIOR, AND DESIGN DR. ANNE NICHOLS SUMMER 2014 lecture twenty two economical & common resist lateral loads concrete construction: flat spanning systems, columns & frames
CHAPTER III DYNAMIC BEHAVIOR OF A LABORATORY SPECIMEN
 CHAPTER III DYNAMIC BEHAVIOR OF A LABORATORY SPECIMEN To address the vibration response of a long span deck floor system, an experiment using a specimen that resembles the conditions found in the in-situ
EXPERIMENTAL STUDY ON THE SEISMIC PERFORMANCE OF EXTERNALLY CONFINED REINFORCED CONCRETE COLUMNS
 13th World Conference on Earthquake Engineering Vancouver, B.C., Canada August 1-6, 2004 Paper No. 578 EXPERIMENTAL STUDY ON THE SEISMIC PERFORMANCE OF EXTERNALLY CONFINED REINFORCED CONCRETE COLUMNS Munawar
Comparisons to Tests on Reinforced Concrete Members
 82 Chapter 6 Comparisons to Tests on Reinforced Concrete Members Finite element (FE) model predictions of laboratory test results of reinforced concrete members with various confinement methods are presented
Ultimate Capacity Estimate of Self-Compacting Concrete-Filled Small Diameter Steel Tubes under Axial Load
 University of Wollongong Research Online Faculty of Engineering and Information Sciences - Papers: Part B Faculty of Engineering and Information Sciences 2017 Ultimate Capacity Estimate of Self-Compacting
10.5 ECCENTRICALLY LOADED COLUMNS: AXIAL LOAD AND BENDING.
 13 10.5 ECCENTRICALLY LOADED COLUMNS: AXIAL LOAD AND BENDING. Members that are axially, i.e., concentrically, compressed occur rarely, if ever, in buildings and other structures. Components such as columns
5.4 Analysis for Torsion
 5.4 Analysis for Torsion This section covers the following topics. Stresses in an Uncracked Beam Crack Pattern Under Pure Torsion Components of Resistance for Pure Torsion Modes of Failure Effect of Prestressing
Axial load behaviour of pierced profiled composite walls
 Axial load behaviour of pierced profiled composite walls K M Anwar Hossain, 1 BScEng, MScEng, PhD, MASCE, MIEPNG, MBCS, RegE This paper compares the behaviour of a novel form of pierced and non-pierced
BFF1113 Engineering Materials DR. NOOR MAZNI ISMAIL FACULTY OF MANUFACTURING ENGINEERING
 BFF1113 Engineering Materials DR. NOOR MAZNI ISMAIL FACULTY OF MANUFACTURING ENGINEERING Course Guidelines: 1. Introduction to Engineering Materials 2. Bonding and Properties 3. Crystal Structures & Properties
A simple computational tool for the verification of concrete walls reinforced by embedded steel profiles.
 A simple computational tool for the verification of concrete walls reinforced by embedded steel profiles. T. Bogdan, H. Degée, A. Plumier University of Liège, Belgium C. Campian Technical University of
EXPERIMENTAL STUDY OF THE EFFECT OF REINFORCEMENT STABILITY ON THE CAPACITY OF REINFORCED CONCRETE COLUMNS
 13 th World Conference on Earthquake Engineering Vancouver, B.C., Canada August 1-, Paper No. 77 EXPERIMENTAL STUDY OF THE EFFECT OF REINFORCEMENT STABILITY ON THE CAPACITY OF REINFORCED CONCRETE COLUMNS
Contents. Foreword 1 Introduction 1
 Contents Notation x Foreword xiii 1 Introduction 1 1.1 Aims of the Manual 1 1.2 Eurocode system 1 1.3 Scope of the Manual 3 1.4 Contents of the Manual 4 1.5 Notation and terminology 4 2 General principles
Contents. 1.1 Introduction 1
 Contents PREFACE 1 ANCIENT MASONRY 1 1.1 Introduction 1 1.2 History of Masonry Materials 1 1.2.1 Stone 2 1.2.2 Clay Units 2 1.2.3 Calcium Silicate Units 4 1.2.4 Concrete Masonry Units 4 1.2.5 Mortars 5
Size Effect on the Load Carrying Capacity of Normal and Lightweight Concrete Filled Square Steel Tube Composite Columns
 Size Effect on the Load Carrying Capacity of Normal and Lightweight Concrete Filled Square Steel Tube Composite Columns Samoel Mahdi Saleh Department of Civil Engineering, College of Engineering, University
Thin-Walled Steel Enclosed Lightweight Foamcrete: A Novel Approach to Fabricate Sandwich Composite
 Australian Journal of Basic and Applied Sciences, 5(12): 1727-1733, 2011 ISSN 1991-8178 Thin-Walled Steel Enclosed Lightweight Foamcrete: A Novel Approach to Fabricate Sandwich Composite Md Azree Othuman
Compression Test for Precast Encased Composite Columns with Corrugated Steel Tube
 Compression Test for Precast Encased Composite Columns with Corrugated Steel Tube *Kwang-Won Jo 1) and Hong-Gun Park 2) 1), 2) Dept. of Architecture and Architectural Engineering, Seoul National Univ.,
7. SPECIFIC RULES FOR STEEL CONCRETE COMPOSITE BUILDINGS
 Page 130 7. SPECIFIC RULES FOR STEEL CONCRETE COMPOSITE BUILDINGS 7.1 General 7.1.1 Scope (1) P For the design of composite steel concrete buildings, Eurocode 4 applies. The following rules are additional
ME 207 Material Science I
 ME 207 Material Science I Chapter 4 Properties in Bending and Shear Dr. İbrahim H. Yılmaz http://web.adanabtu.edu.tr/iyilmaz Automotive Engineering Adana Science and Technology University Introduction
Compression Members. Columns I. Summary: Objectives: References: Contents:
 Compression Members Columns I Summary: Structural members subjected to axial compression are known as columns or struts. Stocky columns may not be affected by overall buckling. Stocky columns may fail
Seismic Behaviour of RC Shear Walls
 Ductile Detailing of RC Structures :: IS:13920-1993 1993 Short Course on Seismic Design of RC Structures Durgesh C. Rai Department of Civil Engineering, IIT Kanpur The material contained in this lecture
CHAPTER 1 INTRODUCTION
 CHAPTER 1 INTRODUCTION 1.0. GENERAL Modern civilization relies upon the continuing performance of civil engineering infrastructure ranging from industrial building to power station and bridges. For the
Moment curvature analysis of concrete flexural members confined with CFRP grids
 Materials Characterisation V 131 Moment curvature analysis of concrete flexural members confined with CFRP grids A. Michael & P. Christou Department of Civil Engineering, Frederick University, Cyprus Abstract
Slenderness ratio effect on the behavior of steel and carbon-frp reinforced concrete-filled FRP tubes
 Slenderness ratio effect on the behavior of steel and carbon-frp reinforced concrete-filled FRP tubes H. M. Mohamed 1, R. Masmoudi 2, and Y. Shao 3 1 Postdoctoral Fellow, University of Sherbrooke, Sherbrooke,
Flexure and Serviceability Limit State
 UNIT 3 Flexure and Serviceability Limit State Beam A structural member that support transverse (Perpendicular to the axis of the member) load is called a beam. Beams are subjected to bending moment and
Effects of Width-to-Thickness Ratio of RHS Column on the Elasto-Plastic Behavior of Composite Beam
 Memoirs of the Graduate Schools of Engineering and System Informatics Kobe University No. 6, pp. 1 6, 2014. doi:10.5047/gseku.e.2014.001 Effects of Width-to-Thickness Ratio of RHS Column on the Elasto-Plastic
Rajan s Book Chapter 3: Structural Design Fundamentals
 Rajan s Book Chapter 3: Structural Design Fundamentals What is Design? Design a process by which an acceptable solution is obtained. -- Feasible solution is acceptable, but desirable to have a minimum
twenty two concrete construction: flat spanning systems, columns & frames ARCHITECTURAL STRUCTURES: FORM, BEHAVIOR, AND DESIGN
 ARCHITECTURAL STRUCTURES: FORM, BEHAVIOR, AND DESIGN DR. ANNE NICHOLS SUMMER 2014 lecture twenty two concrete construction: http:// nisee.berkeley.edu/godden flat spanning systems, columns & frames Concrete
Hybrid-steel concrete connections under reversed cyclic loadings
 Hybrid-steel concrete connections under reversed cyclic loadings Bing Li, W.K. Yip and C.L. Leong Nanyang Technological University, Sch. of Civil & Env. Eng., Singapore 639798 ABSTRACT: The aim of the
Effect of Flange Width on Flexural Behavior of Reinforced Concrete T-Beam
 Effect of Flange Width on Flexural Behavior of Reinforced Concrete T-Beam Ofonime A. Harry Institute for Infrastructure and Environment, University of Edinburgh, UK Department of Civil Engineering Ndifreke
Experimental and numerical validation of the technical solution of a brace with pinned connections for seismic-resistant multi-story structures
 Experimental and numerical validation of the technical solution of a brace with pinned connections for seismic-resistant multi-story structures Ramona Gabor, Cristian Vulcu, Aurel Stratan, Dan Dubina Politehnica
KEYWORDS: partially grouted walls, slenderness limit, radius of gyration.
 13 TH C ANADIAN M ASONRY S YMPOSIUM H ALIFAX, C ANADA JUNE 4 TH JUNE 7 TH 2017 EVALUATION OF A REINFORCED BLOCK WALL SLENDERNESS LIMIT BASED ON RADIUS OF GYRATION Hagel, Mark 1 ; Cruz-Noguez, Carlos 2
Development of Composite Beam for Productivity
 Development of Composite Beam for Productivity W.J. Yang & H.B. Song & W.H. Yi Kwangwoon University, Seoul, Republic of Korea H.S. Kwak & H.J. Yoon & D.S. Park GS Engineering &Construction, Seoul, Republic
BS EN :2004 EN :2004 (E)
") Contents List 1. General 1.1 Scope 1.1.1 Scope of Eurocode 2 1.1.2 Scope of Part 1-1 of Eurocode 2 1.2 Normative references 1.2.1 General reference standards 1.2.2 Other reference standards 1.3 Assumptions
Contents List 1. General 1.1 Scope 1.1.1 Scope of Eurocode 2 1.1.2 Scope of Part 1-1 of Eurocode 2 1.2 Normative references 1.2.1 General reference standards 1.2.2 Other reference standards 1.3 Assumptions
UPGRADING SHEAR-STRENGTHENED RC BEAMS IN FATIGUE USING EXTERNALLY-BONDED CFRP
 UPGRADING SHEAR-STRENGTHENED RC BEAMS IN FATIGUE USING EXTERNALLY-BONDED CFRP Georges El-Saikaly 1 and Omar Chaallal 2 1 PhD candidate, Department of Construction Engineering, University of Quebec, École
twenty two concrete construction: flat spanning systems, columns & frames Reinforced Concrete Design Reinforced Concrete Design
 ARCHITECTURAL STRUCTURES: FORM, BEHAVIOR, AND DESIGN DR. ANNE NICHOLS SUMMER 2013 lecture twenty two economical & common resist lateral loads concrete construction: flat spanning systems, columns & frames
Encased Beam with Variable Upper Steel Flange Position
 Encased Beam with Variable Upper Steel Flange Position Ahmed Youssef Kamal Civil Engineering Department, Benha Faculty of Engineering, Benha University, Egypt. ABSTRACT Encased beam composite construction
Design of Composite Bridges Use of BS 5400: Part 5: 1979
 THE HIGHWAYS AGENCY THE SCOTTISH OFFICE DEVELOPMENT DEPARTMENT Amendment No.1, dated 10 December 1987 THE WELSH OFFICE Y SWYDDFA GYMREIG THE DEPARTMENT OF THE ENVIRONMENT FOR NORTHERN IRELAND Design of
Design of High Strength Concrete Filled Tubular Columns For Tall Buildings
 ctbuh.org/papers Title: Authors: Subject: Keywords: Design of High Strength Concrete Filled Tubular Columns For Tall Buildings Richard Liew, National University of Singapore Ming Xiang Xiong, National
CYCLIC BEHAVIOR OF AN INNOVATIVE STEEL SHEAR WALL SYSTEM
 13 th World Conference on Earthquake Engineering Vancouver, B.C., Canada August 1-6, 2004 Paper No. 2576 CYCLIC BEHAVIOR OF AN INNOVATIVE STEEL SHEAR WALL SYSTEM Qiuhong ZHAO 1 and Abolhassan ASTANEH-ASL
SEISMIC REHABILITATION OF REINFORCED CONCRETE BRIDGE COLUMNS IN MODERATE EARTHQUAKE REGIONS USING FRP COMPOSITES
 13 th World Conference on Earthquake Engineering Vancouver, B.C., Canada August 1-6, 24 Paper No. 58 SEISMIC REHABILITATION OF REINFORCED CONCRETE BRIDGE COLUMNS IN MODERATE EARTHQUAKE REGIONS USING FRP
Nonlinear Finite Element Analysis of Composite Cantilever Beam with External Prestressing
 Nonlinear Finite Element Analysis of Composite Cantilever Beam with External Prestressing R. I. Liban, N. Tayşi 1 Abstract This paper deals with a nonlinear finite element analysis to examine the behavior
Behaviour of Concrete Filled Rectangular Steel Tube Column
 IOSR Journal of Mechanical and Civil Engineering (IOSR-JMCE) ISSN: 2278-1684 Volume 4, Issue 2 (Nov. - Dec. 2012), PP 46-52 Behaviour of Concrete Filled Rectangular Steel Tube Column Anil Kumar Patidar
PORTAL FRAMES 1.0 INTRODUCTION
 36 PORTAL FRAMES 1.0 INTRODUCTION The basic structural form of portal frames was developed during the Second World War, driven by the need to achieve the low - cost building envelope. Now they are the
Question Paper Code : 11410
 Reg. No. : Question Paper Code : 11410 B.E./B.Tech. DEGREE EXAMINATION, APRIL/MAY 2011 Fourth Semester Mechanical Engineering ME 2254 STRENGTH OF MATERIALS (Common to Automobile Engineering and Production
INFLUENCE OF PRSTRESS LEVEL ON SHEAR BEHAVIOR OF SEGMENTAL CONCRETE BEAMS WITH EXTERNAL TENDONS
 - Technical Paper - INFLUENCE OF PRSTRESS LEVEL ON SHEAR BEHAVIOR OF SEGMENTAL CONCRETE BEAMS WITH EXTERNAL TENDONS Dinh Hung NGUYEN *1, Ken WATANABE *2, Junichiro NIWA *3 and Tsuyoshi HASEGAWA *4 ABSTRACT
Tests of R/C Beam-Column Joint with Variant Boundary Conditions and Irregular Details on Anchorage of Beam Bars
 October 1-17, 8, Beijing, China Tests of R/C Beam-Column Joint with Variant Boundary Conditions and Irregular Details on Anchorage of Beam Bars F. Kusuhara 1 and H. Shiohara 1 Assistant Professor, Dept.
CE 221: MECHANICS OF SOLIDS I CHAPTER 3: MECHANICAL PROPERTIES OF MATERIALS
 CE 221: MECHANICS OF SOLIDS I CHAPTER 3: MECHANICAL PROPERTIES OF MATERIALS By Dr. Krisada Chaiyasarn Department of Civil Engineering, Faculty of Engineering Thammasat university Outline Tension and compression
Marian A. GIZEJOWSKI Leslaw KWASNIEWSKI Wael SALAH
 Robustness of continuous steel-concrete composite beams of slender plain webbed and cellular open webbed sections Marian A. GIZEJOWSKI Leslaw KWASNIEWSKI Wael SALAH Faculty of Civil Engineering Warsaw
APPLICATIONS OF STRESS FIELDS TO ASSESS THE BEHAVIOR AND STRENGTH OF COUPLING BEAMS SUBJECTED TO SEISMIC ACTIONS
 Breña, Fernández Ruiz, Muttoni 3 rd fib International Congress 21 APPLICATIONS OF STRESS FIELDS TO ASSESS THE BEHAVIOR AND STRENGTH OF COUPLING BEAMS SUBJECTED TO SEISMIC ACTIONS Sergio F. Breña, University
THE STUDY OF THE OVER STRENGTH FACTOR OF STEEL PLATE SHEAR WALLS BY FINITE ELEMENT METHOD
 THE STUDY OF THE OVER STRENGTH FACTOR OF STEEL PLATE SHEAR WALLS BY FINITE ELEMENT METHOD Mahin Abdollahzadeh 1, *Arman Kabiri 1 and Ramin Amjadi 2 1 Department of Civil Engineering, Islamic Azad University,
Code No: R Set No. 1
 Code No: R059210303 Set No. 1 II B.Tech I Semester Regular Examinations, November 2006 MECHANICS OF SOLIDS ( Common to Mechanical Engineering, Mechatronics, Metallurgy & Material Technology, Production
Seismic Retrofit Of RC Columns With Inadequate Lap-Splice Length By External Post-Tensioned High-Strength Strips
 Seismic Retrofit Of RC Columns With Inadequate Lap-Splice Length By External Post-Tensioned High-Strength Strips M. Samadi Department of civil engineering., Mashhad Branch, Islamic Azad University, Mashhad,
11 Beams of two materials
 Beams of two materials.i Introduction Some beams used in engineering structures are composed of two materials. A timber joist, for example, may be reinforced by bolting steel plates to the flanges. Plain
Experiments on Stainless Steel Hollow Sections Part 2: Member Behaviour of Columns and Beams
 Gardner, L. and Nethercot, D. A. (2004). Experiments on stainless steel hollow sections Part 2: Member behaviour of columns and beams. Journal of Constructional Steel Research. 60(9), 1319-1332. Experiments
Available online at ScienceDirect. Procedia Engineering 125 (2015 )
") Available online at www.sciencedirect.com ScienceDirect Procedia Engineering 125 (2015 ) 918 924 The 5th International Conference of Euro Asia Civil Engineering Forum (EACEF-5) The effect of different
Available online at www.sciencedirect.com ScienceDirect Procedia Engineering 125 (2015 ) 918 924 The 5th International Conference of Euro Asia Civil Engineering Forum (EACEF-5) The effect of different
Behavior of Reinforced Concrete Walls with Mesh Reinforcement Subjected to Cyclic Loading
 17 Published in 5th International Symposium on Innovative Technologies in Engineering and Science 29-3 September 17 (ISITES17 Baku - Azerbaijan) Behavior of Reinforced Concrete Walls with Mesh Reinforcement
Fagà, Bianco, Bolognini, and Nascimbene 3rd fib International Congress
 COMPARISON BETWEEN NUMERICAL AND EXPERIMENTAL CYCLIC RESPONSE OF ALTERNATIVE COLUMN TO FOUNDATION CONNECTIONS OF REINFORCED CONCRETEC PRECAST STRUCTURES Ettore Fagà, Dr, EUCENTRE, Pavia, Italy Lorenzo
TMR 4195 DESIGN OF OFFSHORE STRUCTURES. Problem 1. In the ULS control it is necessary to consider the load cases given in Table 1.
 NTNU Faculty of Engineering Science and Technology Department of Marine Technology SOLUTION 4 & 5 TMR 4195 DESIGN OF OFFSHORE STRUCTURES Problem 1 In the ULS control it is necessary to consider the load
FINITE ELEMENT ANALYSIS OF REINFORCED CONCRETE BRIDGE PIER COLUMNS SUBJECTED TO SEISMIS LOADING
 FINITE ELEMENT ANALYSIS OF REINFORCED CONCRETE BRIDGE PIER COLUMNS SUBJECTED TO SEISMIS LOADING By Benjamin M. Schlick University of Massachusetts Amherst Department of Civil and Environmental Engineering
CHAPTER 4 STRENGTH AND STIFFNESS PREDICTIONS OF COMPOSITE SLABS BY FINITE ELEMENT MODEL
 CHAPTER 4 STRENGTH AND STIFFNESS PREDICTIONS OF COMPOSITE SLABS BY FINITE ELEMENT MODEL 4.1. General Successful use of the finite element method in many studies involving complex structures or interactions
International Journal of Advance Engineering and Research Development ANALYTICAL INVESTIGATION OF ENCASED COMPOSITE BEAMS UNDER FLEXURE AND TORSION
 Scientific Journal of Impact Factor (SJIF): 5.71 International Journal of Advance Engineering and Research Development Volume 5, Issue 04, April -2018 e-issn (O): 2348-4470 p-issn (P): 2348-6406 ANALYTICAL
Composite Column Force Transfer in Special Two-Story X-Braced Frames
 Proceedings of the 4th ASEAN Civil Engineering Conference Yogyakarta, 22-23 November 2011 Composite Column Force Transfer in Special Two-Story X-Braced Frames Junaedi Utomo Department of Civil Engineering,
Appendix M 2010 AASHTO Bridge Committee Agenda Item
 Appendix M 2010 AASHTO Bridge Committee Agenda Item 2010 AASHTO BRIDGE COMMITTEE AGENDA ITEM: SUBJECT: LRFD Bridge Design Specifications: Section 5, High-Strength Steel Reinforcement TECHNICAL COMMITTEE:
EFFECT OF SHORT METALLIC FIBERS IN MIXED REINFORCED HRFRC BEAMS : AN EXPERIMENTAL STUDY
 EFFECT OF SHORT METALLIC FIBERS IN MIXED REINFORCED HRFRC BEAMS : AN EXPERIMENTAL STUDY A.Si-Larbi,E.Ferrier,P.Hamelin Laboratoire Mécanique, matériaux & structures, Université Claude Bernard, Lyon I,
BEHAVIOUR OF FIBRE REINFORCED POLYMER REINFORCED CONCRETE BEAMS WITH FIBRE MESH SHEAR REINFORCEMENT
 Building Tomorrow s Society Bâtir la Société de Demain Fredericton, Canada June 13 June 16, 2018/ Juin 13 Juin 16, 2018 BEHAVIOUR OF FIBRE REINFORCED POLYMER REINFORCED CONCRETE BEAMS WITH FIBRE MESH SHEAR