Abstract. Preface. August 2005
|
|
|
- Britton Wells
- 6 years ago
- Views:
Transcription

1
2 Abstract The softwood lumber industry in the United States and Canada consists of about 1,067 sawmills. In 2005 these sawmills had a combined capacity of 189 million m 3 ( bf). In 2004, they employed about 99,000 people and produced 172 million m 3 (nominal) ( bf) of lumber. In the process, they consumed about 280 million m 3 ( ft 3 ) of timber. Employee productivity was near 2,125 m 3 (900,000 bf) per worker per year for dimension and stud mills but about half that for board, timber, and specialty mills. Average saw log size varied from 42 cm (16.6 in.) in British Columbia to 16 cm (6.2 in.) in the boreal region of eastern Canada. Average lumber recovery factors varied from 267 bf/m 3 (7.55 bf/ft 3 ) for timber mills to 236 bf/m 3 (6.6 bf/ft 3 ) for specialty mills. The average for dimension mills was 266 bf/m 3 (7.5 bf/ft 3 ). Strong underlying demand for housing, supported by demographic growth among young adults and generational low interest rates, are strong positives for the industry s prospects. Low interest rates, however, are threatened by rising inflation, the measurement of which depends on whether new home prices are included or not. Keywords: softwood sawmill capacity, employment, average log size, lumber recovery factor, market review August 2005 Spelter, Henry; Alderman, Matthew Profile 2005: Softwood sawmills in the United States and Canada. Research Paper FPL-RP-630. Madison, WI: U.S. Department of Agriculture, Forest Service, Forest Products Laboratory. 85 p. A limited number of free copies of this publication are available to the public from the Forest Products Laboratory, One Gifford Pinchot Drive, Madison, WI This publication is also available online at Laboratory publications are sent to hundreds of libraries in the United States and elsewhere. The Forest Products Laboratory is maintained in cooperation with the University of Wisconsin. This article was written and prepared by U.S. Government employees on official time, and it is therefore in the public domain and not subject to copyright. The use of trade or firm names in this publication is for reader information and does not imply endorsement by the United States Department of Agriculture (USDA) of any product or service. The U.S. Department of Agriculture (USDA) prohibits discrimination in all its programs and activities on the basis of race, color, national origin, age, disability, and where applicable, sex, marital status, familial status, parental status, religion, sexual orientation, genetic information, political beliefs, reprisal, or because all or a part of an individual s income is derived from any public assistance program. (Not all prohibited bases apply to all programs.) Persons with disabilities who require alternative means for communication of program information (Braille, large print, audiotape, etc.) should contact USDA s TARGET Center at (202) (voice and TDD). To file a complaint of discrimination, write to USDA, Director, Office of Civil Rights, 1400 Independence Avenue, S.W., Washington, D.C , or call (800) (voice) or (202) (TDD). USDA is an equal opportunity provider and employer. Preface This report updates Profile 2003: Softwood Sawmills in the United States and Canada, published April Profile 2005 contains updated information on location, ownership, and approximate capacities of 1,067 softwood sawmills in the United States and Canada. Additionally, it presents data on employment, lumber recovery, and average log sizes in the industry, along with an assessment of near-term prospective U.S. economic conditions. The information in this study was originally compiled from a variety of published sources. These included directories of wood-using industries published by regional United States and Canadian forestry departments, commercial directories such as the Big Book (Random Lengths Publications, Inc. 2005) and Madison s Canadian Lumber Directory (Madison s Canadian Lumber Reporter 2004), company press releases, Securities and Exchange Commission filings, and company web sites. In this 2005 update, we augmented these sources with extensive personal contacts and data gathered in conjunction with Timber Processing Magazine s annual survey of the top 200 U.S. sawmills. We also relied on data from Statistics Canada, the U.S. Department of Commerce (Census Bureau), the U.S. Department of Labor, and the Western Wood Products Association (WWPA) for supplementary information. The objective of the profiles is to present contemporary portraits of the softwood sawmilling industry. This sector is highly diverse with a multitude of public and private ownerships. Information about its activities is scattered and often withheld because of privacy or legal concerns. Thus, we are especially grateful to those many individuals whose openness made this project possible. Nevertheless, in data-gathering efforts of this size, omissions or inaccuracies are unavoidable, for which responsibility is ours. We ask readers to submit corrections by to Henry Spelter (hspelter@fs.fed.us). Further, in dealing with industry data on production and recoveries, we were presented with a variety of units reflecting the different measures used in sawmilling. To make data comparable, we converted them to common units. For lumber we took board foot volumes at face value and converted them to cubic meters based on 424 bf equaling 1 m 3. This ignores differences between nominal and actual lumber sizes; thus, the metric volumes are also nominal, not actual. Lumber recovery data present a bigger problem because they are reported in various measures of volume and weight in which the size of the timber affects the result. Accordingly, in converting the disparate units to a common cubic platform, we had to account for the confounding effect of timber size. Thus, unlike with lumber, specific rather than general conversion factors were used. This is laid out in detail in Appendix A Conversion of Recoveries in Various Units to Cubic Meters.
3 Profile 2005: Softwood Sawmills in the United States and Canada Henry Spelter, Economist Matthew Alderman, Economics Assistant Forest Products Laboratory, Madison, Wisconsin Introduction As of July 2005, the mainstream of the softwood lumber industry in the United States and Canada consisted of about 1,067 sawmills. These sawmills had a combined capacity of 189 million m 3 ( bf), employed about 99,000 people, produced about 172 million m 3 ( bf) of lumber, and in the process, consumed about 280 million m 3 ( ft 3 ) of wood. The capacities of these large, permanent plants are laid out in Appendix C and summarized in Table 1. This enumeration excludes small or seasonal operations, as their contributions to lumber production are minimal. In the following sections, we describe developments in the above aspects of the industry, present data on the size of the wood raw material and the efficiency of its use, and conclude with an overview of general economic conditions in the United States, which in large measure shapes the prospects of the North American softwood lumber sector. Capacity Appendix C lists sawmill locations and their capacities for 2000 to These data are summarized in Table 1. As described in the Preface, the information was obtained from a diverse set of sources. By necessity, data for 2005 and for the terminal years in previous reports were based on firms projections or extensions of previous data. These change as we obtain actual production figures and correct omissions, errors, or misclassifications. The possible extent of such revisions can be judged comparing current capacity estimates with those published in earlier reports (Table 2). The focus in this report is on capacity of primary mills. Remanufacturing plants have been excluded, and where we knew of sawmills finishing other plants rough green lumber, we reduced their capacities to avoid double counting. In a few cases we found it more convenient to represent an area s capacity by the primary planing mill and instead excluded the smaller satellite mills supplying it. Because sawmills have no standard pattern of operation, we also defined capacity as the production limit based on a mill s normal shift schedule rather than a fixed number of shifts. Most large mills run two shifts daily, but many run three and others only one. Shifts also range from the normal 8 hours a day to 9 or 10 hours and can vary as a result of market Table 1 Summary of capacity and production of U.S and Canadian softwood lumber sawmills, 1999 to 2005 Year Mills (no.) Capacity ( 10 6 m 3 ) Production ( 10 6 m 3 ) Capacity utilization (%) , , , , , , , Table 2 Reported capacity estimates Capacity estimates ( 10 6 m 3 ) Year Profile 2001 a Profile 2003 b Profile 2005 c a Spelter and McKeever bspelter and Alderman c 2005 data are from this report. conditions. Thus, the potential for physical output may be higher than the numbers we report. As so defined, U.S. and Canadian sawmill industry capacity grew from million m 3 ( bf) in 1995 to a projected million m 3 ( bf) in 2005 (Table 3). Capacity goes where the resource is and grows fastest where wood is most abundant and available. Thus, British Columbia s capacity rose the most, in particular during the past 2 years (Table 4) when large volumes of beetle-killed lodgepole pine became available. Once dead,
4 Research Paper FPL-RP-630 Table 3 North American softwood sawmill capacity estimates, 1995 to 2005 Capacity estimates ( 10 6 m 3 ) Year United States Canada Total Annual increase (%) Table 5 North American softwood sawmill production estimates by different sources Year Production estimates ( 10 6 m 3 ) Statistics Canada U.S. WWPA a U.S. Census Bureau Difference between U.S. estimates (%) a Western Wood Products Association. Table 4 Softwood sawmill capacity by region given in volume and indexed to 1999 Sawmill capacity Region Volume ( 10 6 m 3 ) U.S. South U.S. North U.S. West BC a Other Canada Total Indexed to 1999 U.S. South U.S. North U.S. West BC Other Canada Total abc, British Columbia. such trees have a limited shelf life for sawing into lumber and need to be processed within 5 to 10 years, depending on climatic conditions. Several companies expanded mills to allow greater use of this relatively short-term resource. Western U.S. sawmill capacity also grew strongly within the past 3 years, recovering ground lost in the early 1990s when reduced government timber sales led many mills to close. Coastal Washington, in particular, had four big greenfield plants started with a fifth on the way. A major incentive for this was consistently lower timber prices for the same species and grades than in nearby Oregon. Growth in the U.S. South was more modest but steady. Eastern Canadian capacity also showed steady growth through 2004 but recently plateaued. An official assessment of Quebec forestry determined that forests there have been overcut. New policies will lead to a 20% cutback in harvesting over the next 2 years, thus dimming further growth prospects in eastern Canada. Among the producing regions, only the U.S. North showed a loss, as the closure of several large mills in Maine was not offset by new construction. Log shortages, intensified by competition from mills in Canada, were reasons cited for limiting expansion. Capacity data are most useful for assessing market conditions in connection with production figures. Production data in Canada are compiled by a government statistical agency (Statistics Canada 2004), whereas in the United States both the government (U.S. Census Bureau 2004) and the Western Wood Products Association (WWPA) (2004) gather such information. Table 5 compares these various production estimates. For most of the years, data from the Census, which theoretically cover all U.S. producing sawmills, show higher volumes than the WWPA data. Over time, though, the differences have tended to decline, and in 2004 the Census estimate was lower. To investigate these production differences, we combined them with our estimates of capacity to calculate capacity utilization rates (Figs. 1 to 3). For the South, both production data fit within our estimates of capacity (utilization rates below 1) and also showed similar movements in year-toyear changes, with the gap between them narrowing in recent years. Likewise, both estimates of western output were within capacity and showed relatively stable relationships to each other through However, the preliminary 2003 Census-based data fell abruptly. Because the Census often revises its estimates in the year following initial publication, this discrepancy may disappear in the final figures. The largest systematic divergence occurred in the North, where WWPA estimates related to the Census and our 2
5 Profile 2005: Softwood Sawmills in the United States and Canada Figure 1 Capacity utilization estimates using U.S. Census and Western Wood Products Association (WWPA) production figures for U.S. South. Figure 4 Capacity utilization estimates using Statistics Canada production figures for east of Rockies (EOR) and British Columbia (BC). capacity estimates have risen over time. Approximately six large mills, mostly in Maine, produce most of the lumber in the North. The reported capacities and production volumes of these mills have not shown the kinds of increases implied by the WWPA estimates. Therefore, if more production is coming from the region, its source must be smaller operations, some of whose capacities we do not account for. If that is the case, however, the Census, which canvasses all operating mills, should have registered these volumes. The differences between these data remain to be resolved. The ratios between Statistics Canada productions and our capacities are shown in Figure 4. The production data fell below our capacity figures in each year except for 1999, when production exceeded our capacity east of the Rockies. Figure 2 Capacity utilization estimates using U.S. Census and Western Wood Products Association (WWPA) production figures for U.S. West. Figure 3 Capacity utilization estimates using U.S. Census and Western Wood Products Association (WWPA) production figures for U.S. North. Employment and Productivity In the United States, the U.S. Bureau of Labor Statistics (2004) tracks combined employment in sawmills, planing mills (both soft- and hardwoods), and wood preservation plants. By contrast, the data in this report are limited to softwood mills only and as such complement the U.S. Bureau of Labor Statistics more general data. By employment we mean only those who are directly involved in procuring, processing, administering, and selling wood at a site. Remote location staffs of large firms, loggers and haulers, and those employed by other non-lumber producing facilities within a complex fall outside of our definition, and we have attempted to remove data associated with them where practical. On that basis, we estimated employment in U.S. softwood sawmills in 2004 at 55,300 people compared to 66,200 in This 16% loss over the 9 years closely parallels the more general data available from the U.S. Bureau of Labor Statistics, which also shows a 16% decline, from 119,000 to 100,000 (Fig. 5). 3
6 Research Paper FPL-RP-630 Table North American softwood sawmill employment and productivity Board Specialty & & cedar Dimension Stud Timbers unknown Figure 5 Employment by all U.S. sawmills (Bureau of Labor Statistics (BLS), left scale), and U.S. softwood sawmills (Forest Products Laboratory (FPL), right scale). U.S. Employees (no.) Capacity ( 10 6 bf/yr) Capacity per employee ( 10 6 bf/yr) Canada Employees (no.) Capacity ( 10 6 bf/yr) Capacity per employee ( 10 6 bf/yr) 8,300 33,000 6,300 2,560 5,100 3,470 29,400 6,120 1,320 1, ,100 26,100 8, ,330 2,040 25,000 6, , Our estimates of Canadian softwood sawmill employment were about 49,200 people in 1995 compared to 43,500 in 2004, for a decline of 12%. This compares with estimates for all sawmills from Statistics Canada of 54,900 in 1995 and 45,600 in 2003, a 17% decline (Fig. 6). Figure 6 Employment by all Canadian sawmills (Statistics Canada, (SCan), left scale), and Canadian softwood sawmills (Forest Products Laboratory (FPL), right scale). Figure 7 Output per employee per year in U.S. and Canadian softwood sawmills. In terms of output per employee, our numbers indicate about a 45% improvement in the United States and 50% in Canada (Fig. 7). Canadian labor productivity has tended to be 5% to 15% higher than that of U.S. mills, and a closer look at 2004 productivities by type of mill indicates some reasons why (Table 6). Labor productivity (represented here against capacity) is least in value-added board, cedar, and specialty operations (Columns 1 and 5, Table 6), where greater product variety and thinner pieces require more labor per unit of output. Productivity in U.S. mills was lower in both categories. On the other hand, productivity is greatest in dimension mills, where production focuses on more standardized, high-volume commodities (Column 2, Table 6). Access to technology is unhindered and spreads freely across borders, resulting in no statistically significant differences between U.S. and Canadian mills. However, studs, even though they are similar high-volume commodities, showed higher productivity in the United States. The explanation lies partly in the raw material, which is smaller in boreal Canada where harsh growing conditions limit tree sizes. Smaller logs affect throughput per log and labor productivity. Also, many western U.S. mills sell lumber green, requiring fewer personnel to handle drying. Finally, timber mills, which are more prevalent in the United States, show about equal productivities. 4
7 Profile 2005: Softwood Sawmills in the United States and Canada Table North American average sawlog diameters by region, measured at small end in centimeters and inches Region Centimeters Inches Number of mills BC a Coast Pacific Northwest Interior BC Interior West Maritime b U.S. Midwest U.S. South Boreal c a BC, British Columbia. bincludes Canadian Provinces and parts of Quebec east of St. Lawrence River and states north of Massachusetts. c Includes Canadian Provinces east of British Columbia to the St. Lawrence River. Log Size and Lumber Recovery We explored two key operating characteristics of sawmilling: the log sizes being processed (small-end diameter) and lumber recoveries (board feet lumber per unit of log). We received information about average sawlog dimensions from 268 mills, accounting for 48.7 million m 3 ( bf, 28% of total production). Two hundred thirty five, representing 50.5 million m 3 ( bf, 29% of production) shared data on recoveries. Log Size One of sawmilling s major transitions has been the shift from large old-growth to smaller second-growth timber. Initially the resource consisted mainly of big virgin trees available in abundance in many parts of the continent. As one region s supply was exhausted, the industry migrated to another more remote region. By the 1950s, however, the easily accessible old-growth became scarce, forcing loggers to move to higher elevations and more remote locations to get suitable timber. Often these trees were smaller in proportion to the harshness of the environment where they grew. But what was small 40 years ago has a quaint ring today. The regearing of one mill to accommodate smaller logs with just an average of 300 bf per log was deemed newsworthy in 1960, even though such a log implies a small-end diameter of 40 to 48 cm (16 to 19 in.), depending on the version of Scribner scale used (The Lumberman 1960). Contemporary industry primarily harvests second-growth, smaller dimension trees that grew back in formerly cutover places or small virgin timber where harsh environments stunt tree growth. Technology- and regulation-driven improvements in treestem use have also backed this trend; standard minimum top sizes were 20 cm (8 in.) in the 1970s and are now 11.5 cm (4.5 in.) or smaller. To determine contemporary log sizes, we asked contacts to indicate the average small-end diameter of their logs. We derived regional averages by weighting each mill s average by its share of production. To display the results without revealing individual mill numbers, we aggregated the data into regions that would have a sufficiently large sample within ecologically homogeneous areas to enable aggregations of similar logs. The results are displayed in Table 7. The biggest logs were found in coastal British Columbia, where larger, older growth trees are still available. We note, however, that the sample was small and that six of the seven were specialty mills. Forty percent of coastal British Columbia capacity consists of dimension mills whose wood supply consists of smaller logs. A more realistic estimate of the average regional log size, therefore, is about 8 cm (3 in.) less than our sample average. United States coastal mills west of the Cascades, where old-growth timber is now scarce but growing conditions favor large trees, had the next biggest. In the interior of British Columbia, the predominant resource consists of lodgepole pine and white spruce. The former is a bigger version of jack pine found farther east. The log sizes used in this region reflect these resources and are similar to the logs used in the U.S. West interior. The greatest contrast in log size is found between maritime (25 cm, 9.9 in.) and boreal regions (15.9 cm, 6.2 in.). Proximity to the Atlantic Ocean moderates growing conditions in the maritime region so that tree growth, primarily of white pine and spruces, results in medium-size logs. Along similar latitudes, but farther inland, the climate becomes more continental and tree-growing conditions less favorable. Consequently, the white/black spruce jack pine balsam fir trees that predominate in the boreal forest grow more slowly and produce smaller girths. Historically, much of the boreal resource was most suited for pulp until advances in small-log sawmilling technology in the 1990s enabled their greater use for lumber as well. Chief among these were scanning systems capable of taking readings along the surface of a log to accurately map its shape; computers that determine in real time the optimal cuts; and positioning systems that enable the saws to carry out the prescribed cuts. All this has to occur at sufficiently high speeds (25 or more stud logs or 12 or so dimension logs per minute) to maintain production rates competitive with mills sawing larger timber. Also significant to the economics of small-log milling was finding value for trim ends and short pieces in finger-jointed studs and as webs in trusses, along with the use of smaller dimensions (2 by 3 s) in trusses and non-load-bearing partitions. In the U.S. South, where the timber economy has shifted to second-growth or plantation wood, average log sizes are lower still at around 22.5 cm (8.9 in.). In the U.S. Midwest, the forests consist primarily of hardwoods. The 25% or so that are softwoods consist mainly of medium-size white and red pine and smaller spruce pine fir found in the boreal region to the north. A few larger mills have been built to use 5
8 Research Paper FPL-RP-630 Table North American average sawlog diameters by product, measured at small end in centimeters and inches Mill type Centimeters Inches Number of mills Specialty Timbers Boards Dimension Studs Table 9 Example sawmill recovery ratios at various phases of sawmilling and resulting log recovery factors Loss category a Stud mill Dimension mill the latter, small-diameter material for commodity lumber production. A greater number of smaller mills specialize in white pine, sometimes in combination with hardwoods. The somewhat small size of the average log shown in Table 7 reflects the influence of the handful of large commodity mills. Sawlog size also tends to vary with the product (Table 8). Mills specializing in studs use the smallest sizes whereas specialty, timber, and board mills use largest. Log sizes in dimension mills fall in between. Lumber Recovery Recovery ratio LT SS DD ET PS Lumber recovery factor 264 bf/m bf/m bf/ft bf/ft 3 a LT, log trim; SS, slabs and sawdust; DD, due to drying; ET, edgings and trimmings; PS, planer shavings. Wood is the costliest component in sawmilling, so its use is a key variable. The amount of lumber recovered per log is affected by several steps in the sawing process. The first is bucking of trees into logs. Pieces with inadequate trim or broken ends result in more trim waste. Large end checks also lead to shorter usable lumber. At the saw, the set target size has to take into account drying shrinkage, planer allowance, and thickness variation caused by movement either of the saw or of the log itself because of the holding mechanism s inability to withstand the sawing stresses. The more variation present, the greater the target size has to be, reducing recovery. Measures that can lessen variation, and thus possibly increase recovery, include thicker sawblades that sway less but generate more sawdust, or slower feed speeds that decrease stress but at the cost of reduced throughput. Product mix also affects recoveries because smaller pieces require more sawlines. But nominal lumber sizes can also falsify recovery signals because thin pieces can be credited with more volume than they actually contain. Fence posts that are 14 mm (9/16 in.) thick but are counted as 25-mm (1-in.) boards, for example, can result in seemingly spectacular recovery numbers even while the saw performance may be poor. In drying, a combination of variable wood properties (moisture content, compression wood around knots, and juvenile wood) and uneven conditions within a kiln takes a toll. Pieces that warp or check excessively may have to be cut short or discarded. Recovery is further affected by edging and trimming of flitches, pieces that have wane on one or both edges. Edging and trimming decisions involve tradeoffs between getting the longest possible length or the greatest possible width, or cutting a long, tapered flitch into several pieces to minimize edging loss. The importance of edging is amplified as log size falls because more of the pieces have outside edges compared with large logs where the preponderance of boards comes from within the core with no wane. Wane allowances on manufactured lumber dramatically increase yields in small logs compared with sawing full-size pieces only. The complexity of the decisions is compounded by grade considerations that can yield more value even while sacrificing some volume. Optimizing edger systems that scan pieces and calculate the best solutions in real time have been widely deployed to deal with these complexities. Losses in the different stages of lumber production can be summarized as follows, where LRF stands for lumber recovery factor: LRF = (LT SS DD ET PS) 424/VA (bf/m 3 ), or LRF = (LT SS DD ET PS) 12/VA (bf/ft 3 ) LT = (1 fractional volume loss of log trim) SS = (1 fractional volume loss of slabs and sawdust) DD = (1 fractional volume loss due to drying) ET = (1 fractional volume loss in edgings and trimmings) PS = (1 fractional volume loss in planer shavings) VA = real to nominal lumber volume adjustment A stud mill exclusively sawing 2.4-m (8-ft) 2 by 4 s from small micro-sawtimber logs would have a nominal volume adjustment factor of 0.656; for example, ( )/(2 4). With values for LT through PS as shown in Table 9, it would reap a lumber recovery factor (LRF) of 264 bf/m 3 (7.5 bf/ft 3 ). By contrast, a dimension mill sawing a more diverse mix of products, from larger sawlogs, with a nominal adjustment factor of 0.70, and parameters as shown in Column 2 (Dimension mill), Table 9, would obtain a 6
9 Profile 2005: Softwood Sawmills in the United States and Canada Table 10a Average 2004 overrun, ±1 standard deviation Overrun (bf lumber/log unit) Scale Average a + std std Mills (no.) Int. ¼ inch Scribner small Scribner large Weight Bf/ton (S. Pine) Cord Bf/cord 494 na na 5 a Volume weighted. Table 10b Average 2004 North American lumber recovery factors, ±1 standard deviation Lumber recovery factor a (bf lumber/log unit) Average a + std std Mills (no.) Mill type Timber Dimension Board Stud Specialty Region U.S. West BC b Interior U.S. South Interior West U.S. Midwest Maritime c British Columbia Coast Boreal d aboard feet per cubic meter. To calculate per cubic feet, multiply by b BC, British Columbia. c Includes Canadian provinces and parts of Quebec east of St. Lawrence River, and states north of Massachusetts. d Includes Canadian Provinces east of British Columbia to the St. Lawrence River. higher LRF of 304 bf/m 3 (8.6 bf/ft 3 ). Values of variables LT through PS are outside the scope of this report. Instead we focus on their collective effects expressed though a processwide LRF. Measurement units of recovery vary, usually depending on how the timber is purchased. For the sake of clarity, the above-referenced LRF is preferred because the influence of log size on recovery is lower. Lumber recovery per cubic volume has become the standard measure of recovery in Canada. In the United States, however, where logs change hands on the basis of weight, cords, and a variety of log scales, there is no common standard. To create uniform, comparable data, we converted such recoveries from the various units to LRFs using the available information on average log sizes and the type of log scale involved. The details of these conversions are supplied in Appendix A. See Fonseca (2005) for a basic reference source on timber measurement conventions and conversions. For the benefit of mills that do not use LRFs, however, we show the data both in original units as reported and the larger standardized set (Tables 10a and 10b). Overruns, International ¼-inch log scale Overrun is a term for the amount by which actual recovery exceeds the log scale estimate. In the U.S. Northeast, Virginia, Maine, and parts of Michigan, mills scale softwood logs by the International ¼-inch log rule. Recoveries in this form were given by 13 mills. Among the board foot scales, this rule, by taking log taper partially into account, is the most accurate. Consequently, the average volume-weighted overrun was a relatively small 1.23 (23% more than predicted by the scale, Table 10a). Figure 8 illustrates the reported values relative to average log diameters (Note: two mills reported identical overruns and diameters, hence there are only 12 points on the chart.). Even this rule, however, tends to understate potential recoveries at the small end of the size range. When the data were converted to LRFs, the mill that achieved the highest overrun with 16.5-cm (6.5-in.) logs dropped below the sample average (Fig. 9). This indicates that, as a measure of recovery efficiency, overruns can mislead at the small end of sawable log sizes. Overruns, short-log Scribner scale Many mills in the U.S. West east of the Cascades, and some in the South and Midwest, measure recovery by the shortlog version (6.1 m (20 ft) or less) of the Scribner scale. We had 13 such results. The cohort weighted average was 1.51 (51% over scale, Table 10a). This scale s lower accuracy relative to the International ¼-inch scale is reflected in consistently higher overruns along the diameter spectrum. As before, converting these data into LRFs diminished the yield-boosting effect of declining log size. Overruns, long-log Scribner scale The long-log version (up to 12.2 m (40 ft)) of the Scribner rule is used in the U.S. coastal Pacific Northwest. The predictive accuracy of the rule is among the lowest, principally because of the longer allowed lengths, which increase the volume in the tapered portion of the log outside of the scaling cylinder, defined by the small-end diameter. Consequently, for the 22 mills the average overrun was 2.13, more than double the scaled volume. As with all board foot scales, overruns generally increase with declining log diameters. 7
10 Research Paper FPL-RP-630 Recovery in weight Weight scaling is widespread in the U.S. South and other places where small size and relatively uniform quality make individual log scaling uneconomic. Weight incorporates all parts of a log and is a proxy for cubic volume. Log weights can deviate from cubic because of variations in moisture content and specific gravity, but within the same species the deviations are relatively small and tend to even out in large log populations. Figure 8 Overrun (International ¼ inch log scale) compared to diameter, 13 measurements. Twenty-four weight recovery factors were provided, of which 22 were from the U.S. South. Among the recoveries from the U.S. South, the effect of diameter was muted and the opposite of that for overruns. That is, recoveries decreased with decreasing log size, which reflects the higher share of edging and slab volumes in small logs. The average lumber recovery was 221 bf/ton, or 4.5 tons per mbf (thousand board feet). Recovery in cords In some instances, log input is measured in cords. The cord is a quasi-cubic volume measure, but the amount of wood contained in a cord declines with log size and, therefore, recoveries also decline at smaller diameters. For the five observations reported in cords, the recovery of lumber averaged 494 bf/cord, but the data were too few to determine a trend. Figure 9 Lumber recovery factor (LRF) compared to diameter measurements for mills reporting overrun in International ¼-inch log scale. Figure 10 Lumber recovery factor (LRF) compared to diameter, 187 measurements. Recovery in cubic volume: lumber recovery factor This then brings us to our preferred measure of recovery, the LRFs, of which 113 gave both diameter and recovery. Combined with the 77 transformed recoveries originally measured in other units as described above, the total sample with both diameter and LRF was 190. The scatter of these LRFs against diameter is shown in Figure 10. Their weighted average was 263 bf/m 3 (7.4 bf/ft 3 ). The weighted average across the total sample (including the 44 where there was a recovery but not a diameter) was slightly lower at 261 bf/m 3 (7.4 bf/ft 3 ). The weighted average U.S. LRF is of additional interest. Concern about the adequacy of timber supplies in the 1970s led to inquiries about ways that the amount of lumber recoverable from the same input of logs could be increased (President s Advisory Panel on Timber and the Environment 1973). At the time, the estimate of national LRF was pegged at 6.5 bf/ft 3. Employing the best practices, it was projected that LRFs could be increased in the range from 300 to 320 bf/m 3 (8.5 bf/ft 3 to 9.1 bf/ft 3 ) for logs between 21 and 33 cm (8 and 13 in.) in diameter. Our sample showed an average U.S. LRF of 279 bf/m 3 (7.9 bf/ft 3 ). This indicates the industry is very close to the level thought realistically achievable for recovery (the smaller size of contemporary logs that constitute the input of most sawmills could account for much of the shortfall). 8

11 Profile 2005: Softwood Sawmills in the United States and Canada There was considerable variability between mills. As Figure 10 suggests, some of this can be ascribed to log size. As with weight, recoveries tend to fall with decreasing log diameter. This again reflects the increasing share of slabs and edgings when standard-size prismatic boards are extracted from basically round logs. Figure 11 Lumber recovery factors (LRF) by product, ±1 standard deviation, for 230 mills. Figure 12 Lumber recovery factors in Quebec, Canada, 1990 to 2004 for integrated and non-integrated mills compared with the Forest Products Laboratory (FPL) 2004 estimate for boreal region. Figure 13 Lumber yields relative to average log diameters for five modes of log measurement: International ¼ inch, Scribner small-log version, Scribner large-log version, weight (board feet (bf)/0.01 ton) and cubic volume (bf/0.01 m 3 ). Differences also were also seen by product type (Table 10b). Timber mills had the highest average LRF, partly reflecting the larger log sizes used by those mills and partly the fewer sawlines, and thus sawdust, required to generate such lumber. Dimension mills showed the next highest level followed by board mills. Lumber recovery in stud mills was the second lowest, reflecting the generally smaller logs used in stud production. Specialty mills obtained the lowest recovery, though in each case the distribution of LRFs was wide, as summarized in Figure 11. Western U.S. mills displayed the highest LRFs, whereas mills in the boreal region of Canada showed the lowest, which reflects in part the size of the log supply by region. An exception to the general effect of log diameters is the low LRF found in coastal British Columbia. This region has access to large logs but has a reputation for older, technologically dated mills. Outmoded technology could be one cause of lower yields. The stricter quality ( no wane ) standards of Japanese grading rules, where much of the region s supply is exported, could be another. The yield-enhancing effects of precision scanning and cutting technology conflict with the yield-reducing effects of smaller logs. Trade literature is amply supplied with anecdotal reports of one-time 10%, 15%, 20%, or more gains in yields following newly installed optimizing hardware but little information about lower yields stemming from the use of smaller logs. One 15-year record on yields in sawmilling is data from the Canadian Province of Quebec, summarized in Figure 12 (personal communication, André D Arcy, Quebec Ministry of Natural Resources, 2005). These data have little likely confounding effect from log sizes and showed 18% gains in yield achieved by all mills over 15 years, with integrated mills gaining 23% whereas nonintegrated mills showed 14% gains. The average for all mills in 2004 was 235 bf/m 3, close to 229 bf/m 3 found in our data for mills in the boreal region. Figure 13 summarizes the empirical relationships between diameter and the various log scales, derived by fitting curves to each data set. The three board-foot log scales increase exponentially as log size declines, whereas the weight and cubic measures of recovery show opposite but more muted tendencies. These curves can be used to standardize specific mill data obtained from particular batches of logs. If mill yields are higher than the relevant point on the curve for that diameter, it indicates yield performance above the norms found in this study, while below the line indicates the opposite. These empirical formulas are summarized in Appendix B (Table B-1). 9
12 Research Paper FPL-RP-630 Table 11 Effect of product type and region on lumber recovery factors (LRF) relative to U.S. board/specialty/timber mills Change in LRF (%) Product type U.S. Canada Board/specialty/timber Stud Dimension Over and above log size differences, other variables influence recovery and a further refinement of the LRF diameter relationship is to take those into account. As noted above, LRF varies with product type. Further, log measurement protocols affect apparent LRFs through different allowances for trim, defects, and diameter measurements. For example, in most Canadian Provinces, volume allowances for trim are not made, nor are deductions for some defects, which are instead accounted for in the grading rules. These differences can increase log input volumes, thus reducing LRFs. Multiple regression isolates the effects of these variables and more accurately partitions the population. Table 11 summarizes the effects of each of these variables on LRFs. These formulas are also contained in Appendix B. Economic Conditions and Outlook in United States Long-range economic events can be stripped down into three basic components: trend, cyclical, and random. The first two are subject to analysis and reasonably accurate prediction. The unfortunate tendency of the latter random element to intrude and often overwhelm the first two makes economic prognostication somewhat speculative. A fortuitous alignment of beneficial tendencies in U.S. trend and cyclical components has led to exceptionally favorable economic circumstances for the lumber industry. Housing has performed particularly well, with construction rising since the early 1990s, fueled by underlying demographics. Around the mid-1970s, births in the United States began to rise again as the maturing post-war baby boom generation arrived at its family-rearing stage. These demographics are now swelling the ranks of those entering adulthood and the mainstream of economic activity where the first requirement of an independent life is shelter (Fig. 14). Surging immigration reinforced this trend. These two demographic factors alone would have assured strong housing demand. But adding cyclical fuel was the extraordinarily low interest rates that have prevailed since Low interest rates followed the stock market collapse of 2000, the severity of which compelled the central bank (Federal Reserve) to reduce rates to generational lows in order to cushion the economy from the shock of the collapse in equities. The central bank has been able to maintain this policy thanks to worldwide trade liberalization that Figure 14 United States native-born 20-year-olds and new housing starts, 1961 to facilitated the emergence of China and other low-cost countries into the world trading arena. The new supply of low-cost goods undermined the power of domestic producers and unions to command higher prices and wages, thus moderating the potentially inflationary impact of extremely cheap credit. Housing, however, was another story. Young people, immigrants, and other low-income householders, who might otherwise have begun their consumption of shelter with apartments or mobile homes, were able to enter into singlefamily home ownership sooner. Home prices consequently inflated at rates double or more than the general rate of inflation, creating a windfall for home owners and generating a self-reinforcing cycle of demand for this appreciating asset class manifested in rising purchases of second homes and homes for investment. Consumers also used rising real estate values by borrowing against inflating home values to offset lagging wage income. The indebtedness of consumers relative to the underlying productivity of the economy has thus been increasing. Whereas some see that indebtedness as an increasing risk to the economy, others note that the rising indebtedness has occurred against a backdrop of rising asset values, thus keeping ratio of the overall debt to equity in balance. If real estate values, however, have become unsustainably high and were to revert to mean, then that could leave highly leveraged borrowers vulnerable. In grappling with these issues, many economists have noted similarities between the current economic environment and that of the early 1970s. Included in this are large excesses of government expenditures over income, low interest rates, large balance of trade deficits, high energy prices, and war expenditures. Until recently the use of the 1970s as an 10
13 Profile 2005: Softwood Sawmills in the United States and Canada Figure 15 Consumer price inflation, year-over-year, 1970 to 1973 compared with 2002 to Figure 16 Yen per dollar index (first period = 0), 1971 to 1973 compared with 2003 to Figure 17 Rate on Federal Funds, less inflation, 1970 to 1973 compared with 2002 to Figure 18 Consumer price index (CPI) with median new home prices compared with owners equivalent rent, 1996 to indicator of present trends has worked well. Several major divergences, however, have become evident in recent months. One is inflation, which, as officially measured by the consumer price index, has risen less sharply (Fig. 15). A second is the performance of the dollar, which in the previous period traded sharply lower, but thus far has performed better (Fig. 16). A third is interest rates, which have continued at low real levels despite ten increases (Fig. 17). Regarding inflation, we note that the definition of the contemporary consumer price index differs from its 1970s predecessor. Chief among the differences is the replacement of home prices by owners equivalent rent of primary residence. Until recently this has not mattered much because the changes in the two prices did not differ significantly. In 2004, however, they have diverged sharply, as shown by recalculating the consumer price index using home prices instead of the present day alternative. With that change, the 2004 inflation is almost twice the official rate (Fig. 18). Although not commented on much, the boom-like conditions in real estate have played a role in the Federal Reserve s ten successive quarter-point increases in its Federal Funds rate. Somewhat to the puzzlement of the Federal Reserve, however, their increases in short-term rates have not carried over into long-term rates, which are more determinative of mortgage markets and thus of housing. Some view this as indicative of tame long-term inflation expectations and thus a sign that the current up cycle has much life left in it. Others, however, point to the growing quantity of paper IOUs accumulating in Asian central banks as a result of Asian trade surpluses as the reason for the low long-term rates, casting the state of long-term credit in less favorable light. Nevertheless, the above-mentioned divergences in key financial indicators imply that the downward stage of the 1970s cycle that would be due around late 2005 or
14 Research Paper FPL-RP-630 will be, at the least, postponed. This means that the housing cycle is unlikely to wilt as it did in the mid-1970s, but also that the speculative excesses, and the ensuing danger from them, will continue to build. In a recent paper on housing market conditions, economists at the Federal Deposit Insurance Corporation (FDIC) have examined home market conditions in major U.S. metropolitan markets and found an unprecedented number in which conditions fit their definition of a boom (Angell and Williams 2005). The FDIC economists pointed to indicators of speculation in an expansion of subprime lending, high loan-to-value mortgages, growing use of home equity lines of credit, expanding use of adjustable rate mortgages, growing purchases of home as investments, and a widening home price consumer income gap. They noted that past booms tended to end in periods of price stagnation rather than collapse, and when the latter did occur, it was relatively rare and precipitated mostly by localized economic distress. In 2004, the broadening of the U.S. housing boom to more areas may imply a growing role for national factors, chiefly mortgage credit conditions. If those credit conditions should then stiffen, the likelihood of a less benign correction increases. In summarizing these discussions, we note primarily that the demographics of housing demand are good and point to many years of above-normal activity. Shorter term cyclical influences, however, may rest on less secure footing and, if they turn, could temporarily dampen the upward effects of demographics. Monetary authorities seem to be aware of the risks that out-of-control asset markets pose and have been attempting to slow them through a campaign of gradual interest rate hikes. But their approach of doing so in pre-telegraphed small steps may have worked against their intentions, as long-term rates have not increased. A likely course is the continuation of the present approach of quarter-point increases until a supposedly neutral rate at or around 4% is reached. At that point, if some of the interestsensitive sectors of the economy, such as small businesses and consumers (whose borrowing costs are tied to the shortterm prime rate) begin to show some weakness, the credit tightening would likely be relaxed. Under that scenario, a downturn in housing would be delayed, and if one does occur, is apt to be less severe than the down cycle. But, until some parts of the economy begin to show signs of less robust growth or weakening, the current spate of credit tightening is likely to continue. We can point with greater confidence to the likely evolution of lumber supply. The ability of the lumber industry to boost capacity and production is historically well demonstrated. The most recent manifestation of that occurred in the first half of 2005 when, despite continued good field activity and sales, a buildup of production overwhelmed even that strong level of demand, sending prices for most western species to a 20% or more correction. Despite the increased consolidation in fewer, larger firms, the ability of the industry to restrain its production appears limited until prices below breakeven levels force it to do so. Looking ahead, the availability of large volumes of beetle-killed timber in British Columbia, the resurgent second-growth on private lands in the U.S. Pacific Northwest, and the rising productivity of southern plantation timberlands imply few resource barriers to increasing capacity. Thus, oversupply rather than underdemand appears to pose the greater threat to lumber market stability and profits in the next few years. References Angell, Cynthia; Williams, Norman U.S. home prices: Does bust always follow boom? gov/bank/analytical/fyi/2005/050205fyi.html, Accessed July 25, Cahill, J Log scale conversion factors. In: Snellgrove, T., and others, eds. User s guide for cubic measurement. Published cooperatively by USDA Forest Service and University of Washington, College of Forest resources, Seattle, WA: Fonseca, Matthew M The measurement of roundwood: methodologies and conversion ratios. Wallingford, UK: CABI Publishing. Lumberman Large west coast production mill regeared to handle changed timber conditions. San Francisco: Miller Freeman Publications. Vol. 84(12): Madison s Canadian Lumber Reporter Madison s Canadian lumber directory 45th ed. Vancouver, British Columbia, Canada: Madison s Canadian Lumber Reporter. Miller Freeman Directory of the wood products industry. San Francisco, CA: Miller Freeman Publications, Inc. President s Advisory Panel on Timber and the Environment Final report of the President s advisory panel on timber and the environment. Superintendent of Documents, Washington, D.C.: U.S. Government Printing Office: Random Lengths Publications, Inc The big book. Eugene, OR: Random Lengths Publications, Inc. Spelter, Henry; Alderman, Matthew Profile 2003: Softwood sawmills in the United States and Canada. Res. Pap. FPL RP 608. Madison, WI: U.S. Department of Agriculture, Forest Service, Forest Products Laboratory. 79 p. Spelter, Henry; McKeever, Tim Profile 2001: Softwood sawmills in the United States and Canada. Res. Pap. FPL RP 594. Madison, WI: U.S. Department of Agriculture, Forest Service, Forest Products Laboratory. 73 p. 12
15 Profile 2005: Softwood Sawmills in the United States and Canada Statistics Canada Production, shipments and stocks on hand of sawmills east of the Rockies. Catalogue No Ottawa, Canada. Statistics Canada Production, shipments and stocks on hand of sawmills in British Columbia. Catalogue No Ottawa, Canada. U.S. Bureau of Labor Statistics ces/home.htm#data U.S. Census Bureau Lumber production and mill stocks: CIR series MA321T(03)-1. Washington DC. Western Wood Products Association Statistical yearbook of the western lumber industry. Portland, OR. Appendix A Conversion of Recoveries in Various Units to Cubic Meters Lumber recovery is measured in several ways. Each can serve its purpose as a standard of reference for a particular mill, but their variety complicates comparisons between mills. To provide an industry-wide standard, we converted each recovery based on a particular unit of measure to a cubic meter (foot) basis as follows: International ¼ inch The average volume of a log in terms of the International board foot rule is estimated from the formula definition for the International ¼-inch scale, using the average small-end log size (D) and assuming a (net) 16-ft- (4.8-m-) long log. The cubic volume is derived from the Smalian formula, again based on the small-end log diameter, a taper of 2 in. (51 mm), and the 16-ft (4.8-m) length. International ¼-inch bf (16-ft logs) = {0.22 [D 2 + (D + 0.5) 2 + (D + 1) 2 + (D + 1.5) 2 ] 0.71 [D + (D + 0.5) + (D + 1) + (D + 1.5)]} ft 3 volume inside bark = [D 2 + (D + 2) 2 ]/2 16 Overrun Int ¼ bf/ft 3 = bf, LT/ft 3 = LRF Scribner Decimal C scale, short-log version The Scribner board foot volume is estimated from an empirical conversion formula estimated by Cahill for populations of logs scaled according to protocols in the areas east of the Cascades for 20-ft (2.4-m) and shorter logs. bf LS/ft 3 LS = D 13.93/D Overrun ( D 13.93/D) = bf, LT/ft 3 = LRF Scribner Decimal C scale, long-log version The Scribner board foot volume is also estimated from an empirical conversion formula by Cahill for populations of logs scaled according to protocols in the areas west of the Cascades for 40-ft (16.2-m) or shorter logs. bf LS/ft 3 LS = D 88.18/D /D 2 Overrun ( D 88.18/D /D 2 ) = bf, LT/ft 3 = LRF Weight Recoveries expressed in board feet per ton were converted to cubic by multiplying the board feet per ton yield factor by 71 lb/ft 3 for southern pine and 64 lb/ft 3 for red pine. Cords Recoveries expressed in board feet per cord were converted to board feet per cubic foot by dividing the per cord yield factor by 73 ft 3 /cord. Appendix B Benchmarking Formulas Equations relating recoveries by various measures to log diameter can be used as industry benchmarks against which a particular mill s performance can be evaluated more precisely by eliminating the effect of log size. The numbers in parentheses are reference values derived at 10 in. (25 cm). International ¼ inch bf LT/bf Int ¼ LS = /D R 2 = 0.48 (1.21) Scribner, Dec C, short log bf LT/Scrib Short log LS = /D R 2 = 0.53 (1.46) Scribner Dec C, long log bf LT/Scrib Long log LS = D R 2 = 0.54 (2.11) bf/ton bf LT/ton LS = D R 2 = 0.04 (212) bf/m 3, all mills bf LT/m 3 LS = D R 2 = 0.07 (254) This last formula was re-estimated with additional explanatory variables to account for some of the systematic variability in the data. These additional variables were specific product types (dimension, stud, and by elimination, all others) and region (mills in Canada where log scaling protocols differ from U.S. practices in disallowing trim and some defects, and, again by elimination, mills in the United States and Alberta, where recorded log volumes exclude trim). 13
16 Research Paper FPL-RP-630 These result in the following specific formulas for various mill categories: United States Board & Specialty Timber Canada D (1a) D (1b) Stud D (2a) D (2b) Dimension D (3a) D (3b) Thus, for example, a dimension mill in Canada, except Alberta, would compare its results against the benchmark provided by Equation (3b), while a similar mill in the United States would more appropriately use Equation (3a). Likewise, in benchmarking timber costs, an allowance of 8% should be factored in (i.e., $60/m 3 in Canada would be the equivalent of $65/m 3 in the United States). Table B-1 Board foot/cubic meter, partitioned mills Variable Coefficient Standard error t-statistic Constant (log of) Diameter (log of) Dimension = 1, else Stud = 1, else Canada (excl. Alberta) = 1, else R Note: All variables were significantly different from zero at the 99% level of confidence. 14
17 Profile 2005: Softwood Sawmills in the United States and Canada Appendix C Sawmill Capacity and Timber Inventory by State and Province The following maps and tables show past and current capacity of sawmills and the availability of timber, by county, in the vicinity of these mills in 30 States. Information on timber density by county in Canada is not available; hence, those maps contain only sawmill sites. The maps, and their associated tables, are arranged in alphabetical order, as follows: Alabama Alberta Arizona, New Mexico, and Utah Arkansas British Columbia, North British Columbia, South East British Columbia, Vancouver California, northern Colorado, South Dakota, and Wyoming Florida Georgia Idaho Louisiana Maine Manitoba see Saskatchewan Maritime Provinces (New Brunswick, Newfoundland, Nova Scotia and Prince Edward Island) Maryland Michigan Minnesota Mississippi Missouri Montana New Brunswick see Maritime Provinces Newfoundland see Maritime Provinces New Hampshire see Vermont New Mexico see Arizona New York North Carolina Nova Scotia see Maritime Provinces Oklahoma Ontario Oregon Quebec Prince Edward Island see Maritime Provinces Saskatchewan and Manitoba South Carolina South Dakota see Colorado Tennessee Texas, eastern Utah see Arizona Vermont and New Hampshire Virginia Washington Wisconsin Wyoming see Colorado 15

18
19 Alabama Mill Former name Capacity / Production (1,000 m³) Mill Former name Capacity / Production (1,000 m³) I.D. Name or DBA Location I.D. Name or DBA Location Closed Mills 37 Olon Belcher Lum Co Brent Hampton Lum Sales Vance Pate Lum Co Carrollton U.S. For Ind Abbeville FP Abbeville Scotch Lum Co Fulton Sterling Lum Co Goodwater SE Wood-Jasper Sawmill Jasper Louisiana-Pacific Corp Evergreen Thomasville Lum Co Coastal Lum Co Thomasville McEntyre Lum Co East Gadsden T. R. Miller Mill Co Brewton D. J. Bondurant Lum Co Flomaton Weyerhaeuser Co McMillanBloedell Pine Hill International Pap Corp Moundville/Tusc Board Mills A. C. Swindle Quinton Jachin Lum Co Jachin Newton Lum Co Tuscaloosa Kornegay Lum Co Centreville Robins Lum Co Double Springs Littrell Bros Lum Co Vinemont J. H. Nash Lum Co Haleyville Littrell Lum Mill Decatur Garrison Sawmill Haleyville McShan Lum Co McShan Vance Lum Co Vance Specialty or Unknown Timber Mills 12 Bennett Lum Co Piedmont Gulf States Pap Moundville Brabham Lum Co Eufaula International Pap CorpUnion Camp CorpChapman Crosby Lum Co Bay Minette Rocky Creek Lum Co Mexia Custom Lum Mfg Co Dothan Valley Lum Co Hackleburg Dozier Lum Co Dozier Stud Mills 23 Earley Lum Co Carbon Hill Weyerhaeuser Co Millport East Alabama Lum Co Lafayette Dimension Mills 13 F.G. Lum Co Sylvania Boise Cascade Jackson Garrison Bros Lum Co Eufaula Bowater Lum Co Albertville Great Southern For Prod Haleyville Bowater Lum Co Prod For Alliance Westover KyKenKee Vance Dudley Lum Co Salem Lassiter Lum Co Silas Georgia-Pacific Corp Fayette LKL Lum Co Guthrie Lum Co Oakman Grayson Lum Corp Houston McKinney Lum Co Muscle Shoals Gulf Lum Co Mobile Millry Mill Co Millry Gulf States Pap Moundville Mooneyham Lum Co Blountsville Harrigan Lum Co Monroeville Pearson Lum Co Tuscaloosa International Pap CorpChampion Citronelle Phenix Lum Co Phenix City International Pap Corp Maplesville Seaman Tim Co Montevallo International Pap CorpUnion Camp CorpOpelika Sipsey River Tim Co Double Springs Jasper Lum Co W Jasper Sterling Lum & Sup Co Goodwater Mead Westvaco Georgia Kraft Cottonton Swift Lum Co Atmore M. C. Dixon Lum Co Eufaula W.G. Sullivan Lum Co Northport Softwood lumber (1,000 m³) Estimated capacity Number of sawmills Reported output (U.S. Census) Number employed ('000) Implied capacity utilization 89% 86% 85% 82%
20
21 Alberta Mill Former name Capacity / Production (1,000 m³) Mill Former name Capacity / Production (1,000 m³) I.D. Name or DBA Location I.D. Name or DBA Location Closed Mills 23 Millar Western Ind Whitecourt Johnson Bros F P Cowley For Prod Cowley Mostowich Lum Fox Creek Tara For Prod Calling Lake Northland F P Fort McMurray Calling Lake Lum Athabasca Rocky Wood Preservers Rocky Mtn Hse CanFor Hines Creek Spray Lake Cochrane Timber Mills 25 Sundance Edson Tall Pine Tim Lodgepole Timeu For Prod Spruceland Millworks Fort Assiniboine Stud Mills 1 Tolko Daishowa High Level Alberta Plywood Ltd Slave Lake Vanderwell Slave lake Carrier Janvier F P Ft. McMurray West Fraser Tim Co Hi-Atha Sawmill Hinton Carrier Lum Ltd Trout Lake West Fraser Tim Co Seehta For Prod Red Earth Creek Dimension mills 17 West Fraser Tim Co Zeidler For Ind Slave Lake Atlas Lum Blairmore West Fraser Tim Co Sunpine Sundre Boucher Bros Nampa West Fraser Tim Co Blue Ridge Whitecourt Buchanan Lum High Prairie Weyerhaeuser Can Drayton Valley C & C Wood Prod Weyerhaeuser CanGrande Cache Weyerhaeuser Can Grande Prairie CanFor Grande Prairie Specialty or Unknown 18 Ed Bobocel Lum Lac La Biche Evergreen Lum LaCrete LaCrete Sawmills LaCrete Hansen For Prod Eckville Manning Diverified F P Manning Wetkeg For Prod Keg River Millar Western Ind Boyle Zavisha Sawmills Hines Creek Softwood lumber (1,000 m³) Estimated capacity Number of sawmills Production (Stats Can) Number employed ('000) Implied capacity utilization 98% 95% 96% 99% 101%
22
23 Arizona/New Mexico/Utah Mill Former name Capacity / Production (1,000 m³) I.D. Name or DBA Location Closed Mills Reidhead Bros Lum Co Nutrioso Tricon Timber Pacific Studs & Lum Co Cimarron Idaho Tim Corp Rio Grande For Prod Espanola Mescalero For Prod Allied For Prod Alamogordo Dimension Mills 6 Fort Apache Tim Co White River Mescalero For Prod Mescalero Board Mills 5 Precision Pine Heber Specialty or Unknown 1 Blazzard Lum Co Kamas Fabrizzio Sawmill Duchesne Leavitt Lum Co Kamas Skyline For Res Utah For Prod Escalante Vallecitos Vaugn Bros Vallecitos Softwood lumber (1,000 m³) Estimated capacity Production (U.S. Census) Implied capacity utilization 112% 113% 105% 106% Number of sawmills Number employed ('000)

24
25 Arkansas Mill Former name Capacity / Production (1,000 m³) Mill Former name Capacity / Production (1,000 m³) I.D. Name or DBA Location I.D. Name or DBA Location Closed Mills 16 International Pap Corp Leola International Pap Corp Whelen Springs Pinecrest Lum Co Green Bay Pkg Plumerville Weyerhaeuser Co Mountain Pine Potlatch Corp Prescott Wood Lum Co Chidester Potlatch Corp Warren Stud Mills 5 Travis Lum Co Mansfield Georgia-Pacific Corp Crossett US Tim Co South Booneville Dimension Mills 28 West Fraser Tim Co Plum Creek Tim CoHuttig Anthony For Prod Urbana Weyerhaeuser Co Dierks Anthony Timberlands Bearden Lum Co Bearden Board Mills 14 Anthony Timberlands Malvern H G Toler & Son Leola Bean Lum Co Glenwood Ray White Lum Co Sparkman Bibler Brothers Nekoosa Pap Russellville Specialty or Unknown 13 Buddy Bean Lum Co Hot Springs C & M Lum Co Waldron Curt Bean Lum Co Amity Garland Gaston Lum CFreestone Sawmill Sparkman Deltic Tim Corp Ola Hixson Lum Sales Pine Bluff Deltic Tim Corp Waldo Lewis Lum & Mfg Co Cove Georgia-Pacific Corp El Dorado Mid-South Wood Prod Mena Idaho Tim Corp Carthage Scott County Lum Prod Waldron International Pap Corp Gurdon Softwood lumber (1,000 m³) Estimated capacity Number of sawmills Reported output (U.S. Census) Number employed ('000) Implied capacity utilization 87% 86% 86% 90%
26
27
28
29 British Columbia - Interior Mill Former name Capacity / Production (1,000 m³) Mill Former name Capacity / Production (1,000 m³) I.D. Name or DBA Location I.D. Name or DBA Location Closed Mills 76 Pope & Talbot Grand Forks Skeena Cellulose Repap Carnaby/S Hazelton Pope & Talbot Midway West Fraser Tim Co Wedeene River L Prince Rupert Sigurdson Bros Logging Co Hanceville Skeena Cellulose Repap Terrace Springer Creek For ProCanFor Slocan Atco Fruitvale Stuart Lake Lum Co Fort St. James J.S. Jones Boston Bar Tembec Crestbrook For Ind Canal Flats Poplar Creek Salmon Arm Tembec Crestbrook For Ind Elko Weyerhaeuser Can Vavenby The Pas Lum Co Prince George/B CanFor Balfour For Prod Taylor Tolko Lavington West Fraser Tim Co Skeena Cellulose Smithers Tolko Riverside FP Lumby/Lavington Tolko Louis Creek/Barriere Tolko Merritt CanFor Northwood Upper Fraser Tolko Ernst F P Quesnel C GED For Prod Westar Ind Kitwanga Tolko Riverside FP Williams La/Cree Canfor-B Slocan - B Quesnel Tolko Riverside Williams Lk/Lignu Louisiana-Pacific CorpEvans For Prod Malakwa West Fraser Tim Co Weldwood 100 Mile House Timber Mills 16 West Fraser Tim Co Babine For Prod Burns Lake Joe Kozek Sawmills Revelstoke West Fraser Tim Co Decker Lake Burns Lake North Star Planing Athalmer West Fraser Tim Co Chetwynd For Ind Chetwynd Stud Mills 52 West Fraser Tim Co Ainsworth Clinton/Chasm CanFor Slocan Fort Nelson West Fraser Tim Co Houston For Prod Houston CanFor Balfour For Prod Pr George/Clear Lak West Fraser Tim Co Eurocan Pulp&Pap LeJac/Fraser Lk Carrier Lum Ltd West Chilcotin For PAnahim Lake West Fraser Tim Co Weldwood Quesnel McBride For Ind Ltd West Fraser Tim Co McBride West Fraser Tim Co Quesnel Sinclair Ft. St. James West Fraser Tim Co Pac Inl Res Smithers Sinclair/L & M Lum Nechako Lum Vanderhoof West Fraser Tim Co Skeena Cellulose Terrace Sinclair Prince George West Fraser Tim Co Williams Lake Tolko Riverside FP Armstrong Weyerhaeuser Can Kamloops/Miss F Tolko Riverside FP Kelowna Weyerhaeuser Can Okanogan Falls Tolko Riverside FP Williams Lk/Soda Cr Weyerhaeuser Can Princeton Dimension Mills Cedar Mills 6 Abitibi Consolidated Donohue/Finlay MacKenzie Abfam Enterp. Queen Charlotte Aspen Planers Merritt C & C Wood Prod Little Valley For ProBella Coola Atco Park Siding Cooper Creek Cedar Salmon Arm CanFor Polar Div Bear Lake Gilbert Smith Glenn Propty Barriere CanFor Chetwynd Lakeside Tim Tappen CanFor Slocan Engen/Vanderhoof/P Meadow Creek Cedar Kaslo CanFor Fort St. John Paragon Ventures Custom Pre-Cut StuGrindrod CanFor Northwood Houston Paragon Ventures Custom Pre-Cut StuLumby CanFor Isle Pierre Isle Pierre Board Mills 5 CanFor Slocan MacKenzie Gorman Bros Westbank CanFor Slocan MacKenzie J H Huscroft Creston CanFor Northwood Pr George Specialty or Unknown 32 CanFor Rustad Bros/NWd Pr George Ardrew Merritt CanFor Slocan Radium Hot Spr C & C Wood Prod Quesnel CanFor Slocan Vavenby/Clearwater NW Specialty Lum CanFor Valemount Canfor-A Slocan - A Quesnel Downey Revelstoke Carrier Lum Ltd Pr George Federated Coop Canoe Dunkley Lum Strathnaver FSJ All Nations For Corp Fort St James Dunkley Lum Strathnaver Hilmoe For Pr Rock Creek Galloway Lum Galloway Kalesnikoff Thrums Hauer Bros Tete Janue/Valemou Kispiox For Prod Stege Logging South Hazelton Inter For Prod Adams Lake Chase Lytton Lum Ltd Lytton Kitwanga Lum Co Kitwanga Porcupine Wood Prod Salmo Pope & Talbot Castlegar Seel For Prod Edgewater Pope & Talbot CanFor Fort St. James Woodland Lum Prince George Wynndel Box & Lum Wynndel Softwood lumber (1,000 m³) Estimated capacity Number of sawmills Production (Stats Can) Number employed ('000) Implied capacity utilization 94% 88% 99% 94%
30
31 British Columbia - Coast Mill Former name Capacity / Production (1,000 m³) Mill Former name Capacity / Production (1,000 m³) I.D. Name or DBA Location I.D. Name or DBA Location Closed Mills 4 Andersen Pac For Prod Ruskin CIPA Lum Co Nanaimo Coulson Manufact Port Alberni TimberWest For FletchChall Youbou/Cowichan Delta Cedar Delta Bayside Port Mellon Errington Cedar Errington Doman-Western Lum Pacif For Prod(CIP) Tahsis Fraser Pulp chips Surrey Inter For Prod Fraser Mills Coquitlam Goldwood Ind Richmond Weyerhaeuser Can McMillan Bloedell Vancouver(Wh Pine) Inter For Prod FletchChall/BCFP Hammond/Maple Rd Doman Chemainus/Nanoose Mill&Tim Prod Flavelle Cedar Port Moody Inter For Prod Weldwood Squamish Terminal For Prod Richmond Western For Prod Inc FletchChall/BCFP Vancouver Terminal For Prod Vancouver Howe Sound West Coast Cellufibre Vancouver Twin River Cedar Empire Cedar Ruskin Inter For Prod Primex(Field mill) Courtenay Western For Prod Inc Doman Vancouver/silvertree Dimension Mills Timber Mills 27 Weyerhaeuser Can McMillan Bloedell Nanaimo/Isl Phoenix Mill&Tim Prod Surrey Weyerhaeuser Can McMillan Bloedell New Westminster Stag Teal Cedar Prod Surrey Weyerhaeuser Can McMillan Bloedell Pt Alberni(SOMASS) Dimension Mills Specialty or Unknown 13 Inter For Prod Western Whitewood New Westminster Franklin For Prod Port Alberni J.S. Jones Surrey Halo For Prod Y.N. For Corp Pitt Meadows TimberWest For FletchChall/CFI Campbell R/Elk Falls Inter For Prod Primex(Acorn mill) Delta Western For Prod Inc Doman Cowichan Bay Inter For Prod McKenzie Mills Surrey Western For Prod Inc Doman Duke Pt./Nanaimo Long Hoh Enterprises Qualicum Beach Western For Prod Inc Doman Ladysmith Lukwa Mills Ltd Port Hardy Western For Prod Inc Doman Ladysmith/Saltair S and R Sawmills Surrey/Pt Kells Weyerhaeuser Can McMillan Bloedell Chemainus/CSD Silvermere For Prod Slave Lake cedar Ruskin Weyerhaeuser Can McMillan Bloedell Pt Alberni(APD) Western For Prod Inc Doman Nanaimo Cedar Mills 20 Weyerhaeuser Can Coast Mtn HardwdsDelta A J For Prod Brackendale Softwood lumber (1,000 m³) Estimated capacity Number of sawmills Production (Stats Can) Number employed ('000) Implied capacity utilization 92% 91% 77% 74% 78%

32
33 California Mill Former name Capacity / Production (1,000 m³) Mill Former name Capacity / Production (1,000 m³) I.D. Name or DBA Location I.D. Name or DBA Location Closed Mills Redwood Mills Eel River Redcrest Big Creek Lum Co Davenport Sequoia For Ind Dinuba Britt Lum Co Arcata Sierra Pacific Ind Loyalton Mendocino For Prod Louisiana-Pacific Corp Ukiah Butler For Prod Redding Redwood Empire Cloverdale Beaver Lum Co Santa Clara Schmidbauer Lum Co Eureka Big Valley Lum Co Bieber Simpson Tim Co Orick sawmill Arcata Pacific Lum Co-Mill A Scotia Simpson Tim Co Korbel Pacific Lum Co-Mill B Scotia Dimension Mills Siskiyou For Prod P&M Cedar Prod Anderson Collins Pine Co Chester Wisconsin-California FP Redding Eel River Lum Prod Fortuna Big Valley Lum Co Burney Harwood Prod Branscomb Blue Lake For Prod Arcata Pacific Lum Co Scotia Georgia-Pacific Corp Fort Bragg Sierra For Prod Terra Bella Mendocino For Prod Louisiana-Pacific CorpFort Bragg Sierra Pacific Ind Anderson Pacific Lum Co Wetsel-Oviatt Lum CoElDorado Hills Sierra Pacific Ind Burney California Cedar P&M Cedar Prod McCloud Sierra Pacific Ind Michigan-California Camino Pacific Lum Co Louisiana-Pacific CorpCarlotta Sierra Pacific Ind Chinese Camp Sierra Pacific Ind Susanville Sierra Pacific Ind Lincoln Pacific Lum Co Fortuna Sierra Pacific Ind Quincy Timber Mills 10 Sierra Pacific Ind Shasta Lake Berry's Sawmill Cazadero Trinity River Lum Co Weaverville Sierra Pacific Ind Arcata Board Mills Stud Mills 6 Sierra Pacific Ind Oroville Sound Stud Anderson Sierra Pacific Ind Standard Softwood lumber (1,000 m³) Estimated capacity Number of sawmills Production (WWPA) Number employed ('000) Implied capacity utilization 89% 88% 90% 91%

34
35 Colorado/S. Dakota/Wyoming Mill Former name Capacity / Production (1,000 m³) I.D. Name or DBA Location Closed Mills Pope & Talbot Cambria Newcastle 42 U.S. For Ind South Fork Lum South Fork Louisiana-Pacific Corp Saratoga South Fork Lum Wheatland Timber Mills 2 Ayres & Baker Mt. View Bear Lodge For Prod Hullett Post & Pole Hulett Stud Mills 4 Wyoming Sawmills Sheridan Dimension MIlls 10 Neimann/Rushmore Continental Lum Co Hill City Board Mills 5 Big Horn Lum Co Laramie Cody Lum Co Cody Intermountain For Prod Montrose McLaughlin Sawmill Co Spearfish Neimann Sawmill Devils Tower FP Hulett Pleasant Logging & Milling Monte Vista Pope & Talbot Spearfish Specialty or Unknown 12 Delta Tim Co Lazear R.E. Linde Sawmills Custer South & Jones Evanston Softwood lumber (1,000 m³) Estimated capacity Production (WWPA) na na na na Implied capacity utilization na na na na Number of sawmills Number employed ('000)
36
37 Florida Mill Former name Capacity / Production (1,000 m³) I.D. Name or DBA Location Timber Mills 3 Grayson Lum Corp Louisiana-Pacific Corp Westbay Tatum Bros Lum Co Lawtey Stud Mills 5 Grayson Lum Corp Louisiana-Pacific Corp Marianna/Cypress Dimension Mills 2 Fleming Lum Co Crestview Georgia-Pacific Corp Cross City Georgia-Pacific Corp ITT Rayonier Palatka Gilman Building Prod Co Lake Butler Gilman Building Prod Co Maxville Gilman Building Prod Co Perry Great South Tim & Lum Daniels Lum Lake City International Pap Corp Champion McDavid International Pap Corp Champion Whitehouse North Florida Lum Co Bristol Pride of Florida Raiford Rex Lum LLC U.S. For Ind Graceville Suwannee Lum Mfg Co Cross City Board Mills 7 Sherrod Lum Co Greenville Specialty or Unknown 15 Franklin Lum Co Hilliard Softwood lumber (1,000 m³) Estimated capacity Reported output (U.S. Census) Implied capacity utilization 92% 95% 88% 75% Number of sawmills Number employed ('000)

38
39 Georgia Mill Former name Capacity / Production (1,000 m³) Mill Former name Capacity / Production (1,000 m³) I.D. Name or DBA Location I.D. Name or DBA Location Closed Mills 21 Jordan Lum & Sup Co Weyerhaeuser Co Barnesville International Pap Corp Champion Waycross Keadle Lbr Enterpr Thomaston International Pap Corp Washington Langdale For Prod Co Valdosta Frank G. Lake Lbr Co Monticello Metcalf Lbr Co Metcalfe Georgia Mountain Tim Cornelia Pollard Lum Co Appling J P Haynes Lum Co Canton Rayonier Baxley Georgia Lum Co Covington Rayonier Louisiana-Pacific Corp Eatonton Burgin Lum Co Cuthbert Rayonier Champion Swainsboro Mead Westvaco Greenville S L Miller & Sons Lum Armuchee Timber Mills 11 Temple-Inland Inland Container Rome Burt Lum Co Washington Tolleson Lum Co Perry Hogan&Storey Wood Prod Armuchee Tolleson Lum Co Container Inc Preston W D Cline & Sons Lum Co Dalton US Timber Southeastern For Prod Cordele Stud Mills 46 Varn Wood Prod Hoboken Georgia-Pacific Corp Monticello Board Mills 29 W M Sheppard Lum Co Brooklet Guess Brothers Lbr Co Tunnel Hill Dimension Mills 16 The Timbermen Inc Camak Balfour Lbr Co. Beadles Lum Co Thomasville Specialty or Unknown 40 Beadles Lum Co Moultrie Baldridge Bros Dalton Claude Howard Lum Co Statesboro Edgy Planing Mill Darien Del-Cook Lum Co Adel Evans Lum Co Sylvania Georgia-Pacific Corp Brunswick/Ste Hallman Wood Prod Eatonton Georgia-Pacific Corp Claxton Hubert Moore Lum Co Alapaha Georgia-Pacific Corp Warrenton Irvin Lum Co Cornelia Gilman Building Prod Co Blackshear J W Exley Lum Co Clyo Gilman Building Prod Co Dudley Little Suwannee Lbr Co Homerville Gilman Building Prod Co Fitzgerald Mount Yonah Lum Co Cleveland Griffin Lum Co Cordele Shearouse Lum Co Pooler Hogan Lum Co Cleveland Sparks Lum Co Ellijay International Pap Corp Federal Papbd Augusta Sutton Lum Co Tennga International Pap Corp Union Camp CorpFolkston Vaughn Lum Co Forsyth International Pap Corp Union Camp CorpMeldrim Softwood lumber (1,000 m³) Estimated capacity Number of sawmills Reported output (U.S. Census) Number employed ('000) Implied capacity utilization 95% 94% 97% 90%
40
41 Idaho Mill Former name Capacity / Production (1,000 m³) I.D. Name or DBA Location Closed Mills Poxleitner Sawmill Keuterville 9 Central Idaho For Prod Princeton 47 Camas Prairie Lum Craigmont 83 Boise Cascade Cascade/Emmett Crown Pacific Daw For Prod Coeur d'alene Riley Creek Lum Co Louisiana-Pacific Corp Bonners Ferry Stud Mills 3 Idaho Veneer Co Ceda-Pine Veneer Samuels Plummer FP Rayonier Plummer Regulus Stud Mill Saint Maries Riley Creek Lum Co Louisiana-Pacific Corp Moyie Springs Stimson Lum Co Idaho For Ind Inc Coeur d'alene-dearmond Stimson Lum Co Idaho For Ind Inc/Merritt Bro Priest River Dimension Mills 23 Bennett For Ind Shearer Lum Prod Elk City Bennett For Ind Grangeville Clearwater For Ind Kooskia Empire Lum Co Kamiah Evergreen For Prod New Meadows J D Lum Priest River Potlatch Corp Clearwater Lum Lewiston Potlatch Corp Saint Maries Riley Creek Lum Co Louisiana-Pacific Corp Chilco (Athol) Riley Creek Lum Co Laclede Three Rivers Tim Kamiah Board Mills 16 Bennett Lum Co Princeton Idaho Veneer Co Post Falls Konkolville Lum Co Orofino Malloy Lum Co Kingston Stimson Lum Co Idaho For Ind Inc Coeur d'alene-atlas Specialty or Unknown 25 Jensen Lum Co Ovid Welco Lum Co Naples Whiteman Lum Co Cataldo Softwood lumber (1,000 m³) Estimated capacity Reported output (WWPA) Implied capacity utilization 93% 89% 90% 90% Number of sawmills Number employed ('000)

42
43 Louisiana Mill Former name Capacity / Production (1,000 m³) I.D. Name or DBA Location Closed Mills Hunt Lum Co Martin Lum Co Castor 130 Angie Lum Co Angie Mimms Lum Co Mansfield International Pap Corp Springhill Leesville Lum Co Louisiana-Pacific Corp Bernice Stud Mills 10 Weyerhaeuser Co Cavenham Holden Weyerhaeuser Co Willamette Ind Taylor Weyerhaeuser Co Willamette Ind Zwolle Dimernsion Mills 3 Hood Ind International Pap Corp Coushatta Joe N. Miles & Sons Bogalusa Leesville Lum Co Leesville PBS Lum Mfg Freestone Sawmill Partners Winnfield Temple-Inland Dequincy West Fraser Tim Co Plum Creek Tim Co Joyce Weyerhaeuser Co Willamette Ind Dodson Specialty or Unknown 2 Almond Bros Lum Co Coushatta Conway Guiteau Lum Co Amite Ryan For Prod Covington Softwood lumber (1,000 m³) Estimated capacity Reported output (U.S. Census) Implied capacity utilization 93% 89% 78% 96% Number of sawmills Number employed ('000)

44
45 Maine Mill Former name Capacity / Production (1,000 m³) Mill Former name Capacity / Production (1,000 m³) I.D. Name or DBA Location I.D. Name or DBA Location Closed Mills 7 Pleasant River Lum CGerard Crete & FDover-Foxcroft Marriner Lum Co Brunswick 7 6 Stratton Lum Co Stratton Sherman Lum Co Sherman Station 17 Board Mills Cousineau Sonoco Co (Bake North Anson 42 9 Cold Stream Lum Co West Enfield Champion James River Tim COld Town Hammond Lum Co Belgrade International Pap Corp Champion Passadumkeag Hancock Lum Co P.H. ChadbourneBethel Canfor Daaquam Lum In Costigan Hancock Lum Co Casco Cousineau Strong Hancock Lum Co Pittsfield Louisiana-Pacific Corp Georgia-Pacific CoWoodland Haskel Lum Lincoln Richardson For Prod aka Crobb Box CoEllsworth Hillside Lum Westbrook R. Leon Williams Lum Co Clifton J D Irving Highland Lum CoDixfield Bailey Manufacturing Co Fryeburg Lavalley Lum Sanford Timber Mills 24 Limington Lum Co East Baldwin Great Brook Lum Co Lebanon Lovell Lum Co Lovell Stillwater Lum Stillwater Moose Creek Lum Co Turner Stud Mills 17 N C Hunt Jefferson Fraser Tim Ltd J Paul Levesque &Ashland Old Town Lum Co Kenduskeag Dimension Mills 10 Parker Lum Co Bradford Beaulieu Bros Lum Chapman R E Lowell Lum Burkfield Fraser Tim Ltd J Paul Levesque &Masardis Robbins Lum Searsmont J D Irving Pinkham Lum Co Ashland Thomas Hammond & Son East Hiram Moose River Lum Co Moose River Softwood lumber (1,000 m³) Estimated capacity Number of sawmills Reported output (U.S. Census) Number employed ('000) Implied capacity utilization 94% 89% 93% 98%
46
47 New Brunswick/Nova Scotia/Pr. Edward Island/Newfoundland Mill Former name Capacity / Production (1,000 m³) Mill Former name Capacity / Production (1,000 m³) I.D. Name or DBA Location I.D. Name or DBA Location Closed Mills 20 Bowater Bridgewater, NS Repap Newcastle, NB 24 1 Canada Bay Lum Co Roddickton,NFL Ashley Colter Boiestown, NB Comeau Lum Meteghan, NS J D Irving Lewis Sawmill Weymouth, NS Elmsdale Lum Co Elmsdale, NS Timber Mills 34 Fraser Timber Ltd Juniper Lum Co Ltd Juniper, NB H J Crabbe & Sons Ltd Bristol, NB Fraser Timber Ltd Nexfor Fraser Papers Plaster Rock, NB Hugh Park & Son Thorburn, NS J D Irving Grand Lake Tim Ltd Chipman, NB Stud Mills 35 J D Irving Deersd/Juniper, NB Bloomfield Lum Ltd Bloomfield,NFL J D Irving Sproule Lum Ltd Truro, NS Chaleur Sawmill Assoc Belledune, NB Jamestown Lum Co Ltd Lethbridge,NFL Delco For Prod Rexton, NB Lakeburn Lum Co Moncton, NB Deniso Lebel Gamco Lum Scotsburn, NS M L Wilkins&Son Ltd Fredericton, NB Devon Lum Co Fredericton, NB McTara Ltd Upp.Musquodoboit, NS H A Fawcett&Son Ltd Petitcodiac, NB N American For Prod St. Quentin, NB Harry Freeman & Son Greenfield, NS Newcastle Lum Co Newcastle, NB Hefler For Prod Ltd Lower Sackvill, NS T P Downey & Sons Hillsborough, NB J D Irving Georgetown Tim Georgetown, PEI Board Mills 44 J D Irving Deniso Lebel Kedgwick, NB J D Irving Doaktown, NB J D Irving St. Leonard, NB Specialty or Unknown 26 J D Irving Bayshore Lum Sussex, NB C F Dickson For Prod Westville, NS Ledwidge Lum Co Enfield, NS Hoeg Bros Lum S. Hampton, NS UPM Kymmene Stone Container Bathurst, NB Holdwright Lum Prod Queens Co., NS Dimension Mills 11 Julimar Lum Brookfield, NS A L Stuckless & Sons Glenwood,NFL Kingston Lum&Bldg Suppl Kingston, NS Adrien Arsenault Balmoral, NB Murray Reeves New Ross, NS Barrett Lum Co Lower Sackville, NS Russel White Lum Kennetcook, NS Blackville Lum Blackville, NB Williams Bros Ltd Barney's River, NS Bowater P F Alliance Baker Brook, NB Softwood lumber (1,000 m³) Estimated capacity Number of sawmills Production (Stats Can) Number employed ('000) Implied capacity utilization 94% 88% 90% 93% 98%
48
49 Maryland Mill Former name Capacity / Production (1,000 m³) I.D. Name or DBA Location Closed Mills Spicer Church Creek 12 Timber Mills 2 J. V. Wells Lum Co Sharptown Millville Lum Co J. Milton Laws Snow Hill Specialty or Unknown 3 Cropper Brothers Lum Co Willards Dorchester Lum Co Linkwood Paul M. Jones Lum Co Snow Hill St. Laurent Papbd Chesapeake Bldg Prod Princess Anne Softwood lumber (1,000 m³) Estimated capacity Reported output (U.S. Census) Implied capacity utilization 104% 110% 104% 73% Number of sawmills Number employed ('000)
50
51 Michigan Mill Former name Capacity / Production (1,000 m³) I.D. Name or DBA Location Timber Mills 3 Cedar River Lum Co Powers Pine Tech Lake City Stud MIlls 4 Potlatch Corp Louisiana-Pacific Corp Gwinn Dimension Mills 9 John A. Biewer Lum Co McBain Board Mills 7 AJD For Prod Grayling Aspen Lum Co Sagola Specialty or Unknown 1 Erickson Lum L'Anse Manistique Saw & Planing Manistique Matelski Lum Co Boyne Falls Softwood lumber (1,000 m³) Estimated capacity Reported output (U.S. Census) Implied capacity utilization 75% 85% 99% 99% Number of sawmills Number employed ('000)
52
53 Minnesota Mill Former name Capacity / Production (1,000 m³) I.D. Name or DBA Location Closed Mills Hedstrom Lum Co Midwest Tim Inc Two Harbors 24 Timber Mills 2 Page & Hill For Prod Big Falls Stud Mills 6 Potlatch Corp Bemidji Rajala Tim Co Deer River Dimension Mills 8 Cass For Prod Cass Lake Hedstrom Lum Co Grand Marais Board Mills 3 N. Lights Tim & Lum Nett Lake Res Orr Rajala Tim Co Bigfork Specialty or Unknown 9 Christensen For Prod Pine River Roosevelt Lum Roosevelt Softwood lumber (1,000 m³) Estimated capacity Reported output (U.S. Census) Implied capacity utilization 80% 80% 81% 75% Number of sawmills Number employed ('000)

54
55 Mississippi Mill Former name Capacity / Production (1,000 m³) Mill Former name Capacity / Production (1,000 m³) I.D. Name or DBA Location I.D. Name or DBA Location Closed Mills 19 Columbus Lbr Co Phillips Brothers LumBrookhaven Clark For Prod Leakesville Columbus Lbr Co Brookhaven Forbes Lum Co Sandy Hook Franklin Tim Co Bude Evergreen Lum Co Sandy Hook Georgia-Pacific Corp Bay Springs Neshoba Lum Louisiana-Pacific CorpPhiladelphia Georgia-Pacific Corp Columbia Wiggins Lum Co Wiggins Georgia-Pacific Corp New Augusta Pine Belt Wood Prod Louisiana-Pacific CorpHattiesburg Hankins Inc Ripley International Pap Corp Morton Hankins Lum Co Grenada Fisackerly Lum Co Winona Hazlehurst Lum Co Hazlehurst Hankins Lum Co Winona Hood Ind Longleaf For Prod Waynesboro Georgia-Pacific Corp Roxie Joe N. Miles & Sons Silver Creek Timber Mills 24 Mabry Lum Co Liberty Barge For Prod Macon Packaging Corp Tenneco Ackerman Byrd Lum Co Fernwood Shuqualak Lum Co Shuqualak Homan For Prod Fulton Southern Lum Co Hermanville Jack Batte & Sons Forest Weyerhaeuser Co Bruce Lincoln Lum Co Brookhaven Weyerhaeuser Co Cavenham Fernwood/McComb Rogers Lum Corp Columbia Weyerhaeuser Co Philadelphia Stud Mills Board Mills 14 Georgia-Pacific Corp Taylorsville Three S Enterprises Seago Lum Co McComb Dimension Mills Specialty or Unknown 2 A. V. Littrell Lum Mill Tishomingo Broadhead Lum & Mfg Co Mendenhall Bazor Lum Co Hankins Lum Co Quitman Foxworth & Thompson Foxworth Buchanan Lum Mid South Meridian Magnolia Lum Co Fernwood Softwood lumber (1,000 m³) Estimated capacity Number of sawmills Reported output (U.S. Census) Number employed ('000) Implied capacity utilization 93% 86% 87% 92%
56
57 Missouri Mill Former name Capacity / Production (1,000 m³) I.D. Name or DBA Location Closed Mills Frost Sawmill Birch Tree Specialty or Unknown 1 Arneson Tim Co Steelville Botkin Lum Co Farmington Softwood lumber (1,000 m³) Estimated capacity Production (U. S. Census) Implied capacity utilization 180% 173% 149% 141% Number of sawmills Number employed ('000)

58
59 Montana Mill Former name Capacity / Production (1,000 m³) I.D. Name or DBA Location Closed Mills Lumber Prod Co Dillon 12 American Stud Co Olney 118 Tongue River Lum Co N. Cheyenne Pine Co Ashland Watters Lum Co Thompson Falls Vinson Tim Prod Trout Creek Crowder Lum Co Berg Lum Co Lewistown Louisiana-Pacific Corp Belgrade Cascade Tim Laurel Timber Mills 10 Klinger Lum Co Kalispell Stud Mills 14 Eagle Stud Mill Missoula Mountain Lum Louisiana-Pacific Corp Deer Lodge Plum Creek Tim Co Fortine Plum Creek Tim Co Kalispell/Evergr R.Y. Tim Livingston R.Y. Tim Townsend Stimson Lum Co Bonner Dimension Mills 7 F.H. Stoltze Land&Lum Co Columbia Falls Lone Pine Tim Ind Eureka Owens and Hurst Lum Co Eureka Thompson River Lum Thompson Falls Board Mills 19 D & G Lum Co Three Forks Plum Creek Tim Co Columbia Falls Plum Creek Tim Co Pablo Pyramid Mountain Lum Seely Lake Specialty or Unknown 16 Blackfoot River Lum Co Victor North End Tim Prod Olney RBM Lum Columbia Falls Stillwater For Prod Kalispell Softwood lumber (1,000 m³) Estimated capacity Reported output (WWPA) Implied capacity utilization 89% 88% 91% 82% Number of sawmills Number employed ('000)

60
61 New York Mill Former name Capacity / Production (1,000 m³) I.D. Name or DBA Location Timber Mills 1 Angelica For Prod Angelica Lok-N-Logs Sherburne Ward Lum Co Jay Dimension Mills 21 Beechwood Lum Co Callicoon Brothers Lum Norwood Edmonds Lum Smyrna Fleischman Farms Atlanta G.W. Platt & Sons Westdale L J Valente, Inc. Averill Park Rynard G. Gundrum Lum Grafton Spink Lum Camden Urrey Lum Middleburgh Board Mills 14 Brown & Son Lum Co Chestertown Cooper Lum, Inc. Chestertown Cornwright Lum Corp Lewis Cote Wood Prod Groton Drake Lum Corp Schroon Lake Johnson Lum Co Carthage Mead Lum Queensbury Richard Baker & Sons Warrensburg Wood Prod Inc Ausable Forks Softwood lumber (1,000 m³) Estimated capacity Production (U.S. Census) Implied capacity utilization 112% 83% 70% 69% Number of sawmills Number employed ('000)

62
63 North Carolina Mill Former name Capacity / Production (1,000 m³) Mill Former name Capacity / Production (1,000 m³) I.D. Name or DBA Location I.D. Name or DBA Location Closed Mills 14 Troy Lum Co Troy Curtis Lum Co Mooresville 6 37 Weyerhaeuser Co Ayden/Greenv Waccamaw Lum Co Tabor City 6 33 Weyerhaeuser Co Plymouth Coastal Lum Co Arant Lum Co New Bern 24 Board Mills Louisiana-Pacific Corp Henderson F. L. Turlington Lbr Co Clinton Noonkester Lbr Mount Airy J W Jones Lum Co Elizabeth City C. G. Fox Lum Co Conover Jerry G. Williams & Sons Smithfield Bingham Lbr Co Denton Keener Lum Co Clinton Roanoke Lum Co Roanoke Rapids Keener Lum Co Smithfield Allen Bros Tim Co Rockingham Lampe&Malphrus Lum Co Smithfield Mebane Lum Co Mebane Parton Co Rutherfordton Hillsville Lum Co Trinity Randleman Lum Co Randleman Younce & Ralph Lum Co Pantego Sale Lum Co N. Wilkesboro Waters Lum Co Bostic Ward Lum Co Elizabethtown King Lum Co Seagrove Warmack Lum Co Cove City Timber Mills Specialty or Unknown 5 G & G Lum Co Union Grove Apex Lum Co Apex Hofler & Sons Lum Co Sunbury Bill Hanks Lum Co Danbury Stud Mills 9 Brittain Lum Co Statesville Weyerhaeuser Co New Bern Coxe Lewis Lum Co Ashton Lewis Lum CGatesville Dimension Mills 32 Evans Lum Co Albemarle For Prod Edenton Braxton Sawmill Graham Fortner Lum Co Hiddenite Evans Lum Co Lewiston F. S. Childers&Sons Lbr Co Taylorsville Georgia-Pacific Corp Ahoskie G & G Lum Co Catawba Georgia-Pacific Corp Champion Creedmoor L F Delp Lum Co Sparta Georgia-Pacific Corp Dudley McIntosh Lum Co Star Georgia-Pacific Corp Whiteville Piedmont Hardwd Lbr Co Mount Pleasan H W Culp Lum Co New London Pruitt Lum Co Louisburg International Pap Corp Riegelwood Randy Miller Lum Co Millers Creek International Pap Corp Union Camp Corp Seaboard Roger Carter Corp Kinston Jordan Lum & Sup Co Mount Gilead Shaver Wood Prod Cleveland Mason Lum Co Washington Toney Lum Co Louisburg New South J. L. Sizemore & SonsGraham Troy Lum Sales Corp Norman Wrenn Bros Siler City Softwood lumber (1,000 m³) Estimated capacity Number of sawmills Production (U.S. Census) Number employed ('000) Implied capacity utilization 80% 89% 93% 90%
64
65 Oklahoma Mill Former name Capacity / Production (1,000 m³) I.D. Name or DBA Location Dimension Mills 3 Bibler Brothers Georgia-Pacific Corp Idabel Weyerhaeuser Co Wright City Specialty or Unknown 1 Conner Ind Stilwell Wood Lum Co Idabel Softwood lumber (1,000 m³) Estimated capacity Production (U.S. Census) na na na na Implied capacity utilization na na na na Number of sawmills Number employed ('000)
66
67 Ontario Mill Former name Capacity / Production (1,000 m³) Mill Former name Capacity / Production (1,000 m³) I.D. Name or DBA Location I.D. Name or DBA Location Closed Mills 20 Domtar White River A&L Lafreniere Green For Lum Chapleau Lecours Lum Co Calstock Tembec Mattawa Liskeard Lum Ltd New Liskeard Domtar AGAWA Sault Ste. Marie Olav Haavaldsrud Tim Co Hornepayne Weyerhaeuser Avenor Dryden Pineal Lake Lum Chapleau Tembec Malette Kirkland Lake Tembec Weyerhaeuser Chapleau Tembec Excel For Prod Opasatika Tembec Malette Hearst Domtar E B Eddy Chapleau Tembec Malette Timmins Timber Mills 6 Weyerhaeuser Avenor Ear Falls Isidore Roy Ltd Sturgeon Falls Board Mills 40 L. Heidemann & Sons Eganville Ben Hokum & Son Killaloe Stud Mills 8 Bowater Ignace Saw Ignace Buchanan Lum McKenzie For Prod Hudson Goulard Lum (1971) Ltd Sturgeon Falls Gogama For Prod Ltd Levack Herb Shaw & Son Petawawa Kenora For Prod Kenora Manitou Lum Co Emo Tembec Malette/Normick P Cochrane Midway Lum Mills Thessalon Tembec Spruce Falls Inc Kapuskasing Murray Brothers Lum Co Madawaska Dimension Mills 42 Pembroke Lum Co Pembroke Bowater Thunder Bay Specialty or Unknown 9 Buchanan Lum Atikokan For Prod LtdAtikokan C A Spencer Lochiel Buchanan Lum Dubreuil For Prod Ltd Dubreuilville Cheminis Lum Larder Lake Buchanan Lum Long Lake For Prod Longlac Devlin Tim Co Tri Lake Tim inc Kenora Buchanan Lum Nakina For Prod Nakina Domtar LKGH Contracting LtRed Lake Buchanan Lum Northern Sawmills Thunder Bay Freymond Lum Ltd Bancroft Buchanan Lum Great West Tim Ltd Thunder Bay H&R Chartrand Noelville Domtar Elk Lake Planing MillsElk Lake McRae Mills Ltd Whitney Domtar EB Eddy Nairn Centre Portelance Lum Capreol Hanmer Domtar EB Eddy Timmins Trilake Tim Co Keewatin Softwood lumber (1,000 m³) Estimated capacity Number of sawmills Production (Stats Can) Number employed ('000) Implied capacity utilization 112% 108% 111% 108% 105%
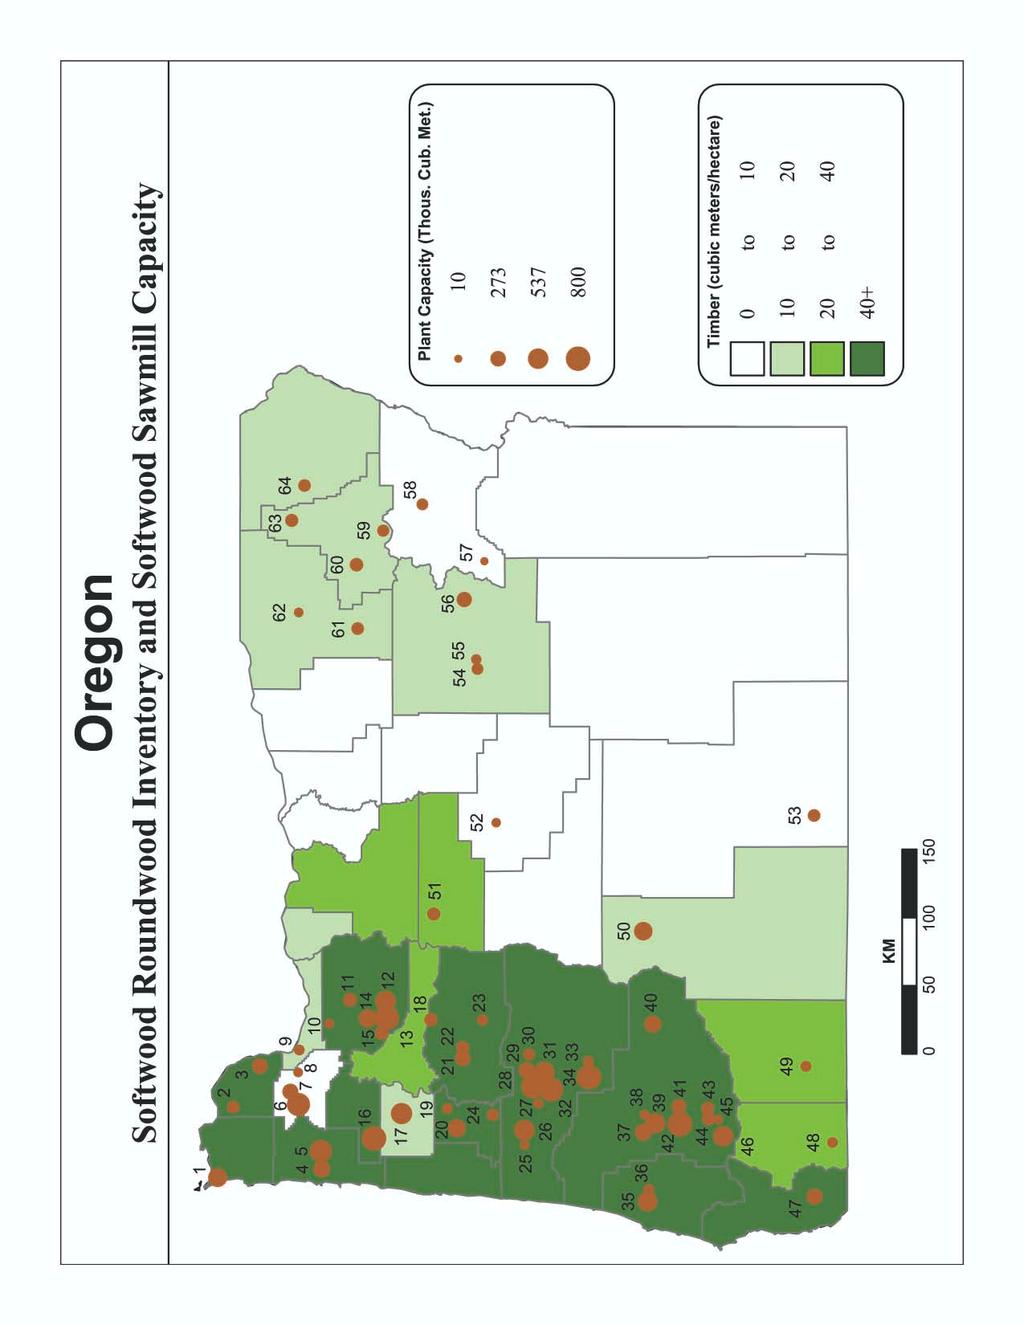
68
69 Oregon Mill Former name Capacity / Production (1,000 m³) Mill Former name Capacity / Production (1,000 m³) I.D. Name or DBA Location I.D. Name or DBA Location Closed Mills 15 Floragon For Prod Inc Molalla For Prod m Molalla P&M Cedar Roseburg Frank Lum Co Mill City QVL/Young&Morgan Young&Morgan Mill City/Lyons Frontier Kinzua Pilot Rock QVL/Hanel Hanel Lum Hood River Georgia-Pacific Corp Coos Bay Roseburg Dillard #1/Winst Georgia-Pacific Corp Diamond-B Philomath TreeSource WTD (Central Pt Lum Central Pt Hampton Affiliates Tillamook Lum Co Tillamook Joseph Tim Co Joseph Hampton Affiliates Willamina Lumb CoWillamina Ochoco Lum Co Prineville Mary's River Lum Co Corvallis/Philom Floragon For Prod IncAvison Lmbr Molalla Rosboro Mill "B" Springfield Crown Pacific Prineville RSG For Prod Estacada Lum Co Estacada Pacific Wood Preserv Taylor Lum & Treat C Sheridan RSG For Prod Olympic For Prod Mist Davidson Ind Mapleton RSG For Prod Molalla Hampton Affiliates Fort Hill Lum Grand Ronde Seneca Sawmill Eugene Timber Mills 36 Southport For Prod Coos Bay Allen For Prod Hillsboro Stimson Lum Co Forest Grove Burnt River Lum Co Great Wood Products Unity Sundance Springfield Hull-Oakes Monroe Superior Lum LLC Swanson Group Glendale Stimson Lum Co Clatskanie Swanson-Superior LLCSwanson Group Noti Weyerhaeuser Co Willamette Ind/BaumaLebanon Swanson Bros Noti Zip-O-Log Mills Eugene Warm Springs F P Warm Springs Stud Mills 34 Weyerhaeuser Co Cottage Grove Boise Cascade Elgin Weyerhaeuser Co Willamette Ind Dallas Douglas Co For Prod Winchester Weyerhaeuser Co Willamette Ind Eugene/coburg DR Johnson Lum Co Umpqua Lum Co Dillard Weyerhaeuser Co Willamette Ind Warrenton DR Johnson Lum Co North Powder L C North Powder Cedar Mills 56 DR Johnson Lum Co Prairie Wood Prod Prairie City Keller Lum Co Roseburg DR Johnson Lum Co Wallowa For Prod Wallowa Board Mills 14 Floragon For Prod IncAvison Lmbr Molalla Boise Cascade LaGrande Glide Lum Prod LLC Swanson Group Glide Boise Cascade Medford Rosboro Mill "A" Springfield Consolidated Pine Prineville Roseburg Dillard DR Johnson Lum Co Grant Western L C John Day South Coast Lum Brookings Inter For Prod Crown Pacific Gilchrist Stimson Lum Co Friesen Lum Co St. Helens Rough&Ready Cave Junction Stimson Lum Co Trask Riv Lum Co Tillamook U.S. Timber Baker City Sun Studs LLC Swanson Group Roseburg Specialty or Unknown 23 Triple T Studs Cascadia Arrowhead Tim Co Carver Weyerhaeuser Co Willamette Ind Lebanon C and D Lum Co Riddle Dimension Mills 53 Collins Pine Fremont Lakeview Alder Creek Lum Co Portland Herbert Lum Co Riddle Banks Lum Co Banks Ochoco Lum Co Malheur Lum Co John Day Blue Mtn Lum Prod Pendleton Starfire Lum Cottage Grove DR Johnson Lum Co Umpqua Lum Co Riddle Softwood lumber (1,000 m³) Estimated capacity Number of sawmills Reported output (WWPA) Number employed ('000) Implied capacity utilization 87% 90% 94% 90%
70
71 Quebec Mill Former name Capacity / Production (1,000 m³) Mill Former name Capacity / Production (1,000 m³) I.D. Name or DBA Location I.D. Name or DBA Location Closed Mills 12 Clermond Hamel St. Ephrem de Beauce Scierie Mailloux DeLisle Dallaire Henri Rademacher et Fils Sainte-Veronique Abitibi Consolidated Donohue/Scierie Lamontagne Saint Prime Domtar Matagami GDS Pabaced Multi Cedres Esprit-Saint Domtar Les Industrie Grondin lteesainte Marie Cedrico Lum Inc Bois Cepedia Sainte Florence Domtar Nabakatuk For Prod Waswanipi Kruger La Scierie Jacques Beaulieu Lte Longue Rive Francois Giguere Sainte Aurelie Bois Valin Saint Fulgence GDS Industries Scierie St Margurite Rivière-Saint-Jean Domtar Les Industrie Grondin ltee Saint Aurelie Gerard Crete & Fils Scierie Paquin Notre-Dame-de-Montauba Scierie Laterriere Laterriere Gerard Crete & Fils Saint Severin/Proulxville Tembec Scierie Davidson Mansfield et Pontefract Gerard Crete & Fils St.-Roch-de-Mekinac Tembec La Sarre Gestofor 43% abitibi-cons Saint Raymond Timber Mills 10 Ind Paquet St. Theophile Beaubois Coaticook Coaticook J A Fontaine & Fils St. Augustine-de-Woburn Groupe NBG Inc Bowater Riviere-Bleue J D Irving La Scierie Aime GaudreauPohenegamook La Scierie Martel Ltee Alma Jean Riopel St.-Theodore-de-Chertsy Stud Mills 124 Kruger Scierie Gallichan Launay Abitibi Consolidated Donohue/Quno Corp Baie Comeau/Pt Outardes Kruger Scierie Manic Ragueneau Abitibi Consolidated Donohue Champneuf Kruger Scierie Parent Trois Rivieres Abitibi Consolidated Donohue Lebel sur Quevillon/Comtoi La Scieries du Lac St. Jean Metabetchouan Abitibi Consolidated Donohue Saint Thomas Didyme Les Ind Piekougame Mashteuiatsh Abitibi Consolidated Donohue Senneterre Les Produits For DG Sainte Aurelie Barette Chapais Ltee Chapais Marcel Lauzon East Hereford Bowater P For Alliance Lac des Aigles Materiaux Blanchet Saint-Pamphile Cedrico Lum Inc Scierie Causap Causapscal Max Meilleur & Fils Ferme Neuve Cedrico Lum Inc Prod For LMC Inc La Martre Preparabois Lac Frontiere Cedrico Lum Inc Price Scierie Gaston Morin Mistassini Deniso Lebel Cap Chat Scierie Landrienne Landrienne Deniso Lebel Saint Michel du Squatec Scierie Norbois Inc Rivière-Pentecôte Deniso Lebel St. Joseph de Kamouraska Scierie P H LeMay&Fils St. Francois-de-Sales Domtar Prod For. Gatineau Grand Remous Scierie Saguenay Ltee 50% Abit-Cons La Baie Domtar Lebel sur Quevillon Tembec Bearn Domtar Malartic Temrex Tembec Nouvelle-Ouest Domtar Val D'Or Temrex Produit For St. Alphonse St.-Alphonse-de-Caplan GDS Bois Granval Grande Vallee Uniforet (Peribonka) L'Ascension GDS Bois Marsoui Marsoui Uniforet (Port Cartier) Port Cartier GDS Industries Pointe-à-la-Croix Cedar Mills 86 Gerard Crete & Fils La Tuque Scierie Ced-Or Inc Maniwaki Ind Maibec Saint-Pamphile Board Mills 60 Kruger Scierie HCN Inc Forestville Bois Omega Ltee Lac Superieur Les Chantiers de Chibogamou Ltee Chibougamau La Comp Common Plywd Rapides des Joachims Les Produits For Dube L'Isle-Verte La Comp Common Plywd Riviere-Kipawa Louisiana-Pacific Corp Forex St Michel des Saints Produits For Petit Paris 50% Abit-Cons St.-Ludger-de-Milot Lulumco Luceville Rene Bernard Beauceville-Ouest Materiaux Blanchet Amos Usine Sartigan Saint Honore Norbord-Optibois Precibois Barraute Specialty or Unknown 87 Produits For La Tuque 83% abit-cons La Tuque Abitibi Consolidated Donohue/Leo Cauchon Petit Saguenay Produits For Ouiatchouan Louisiana-Pacific Corp Lac Bouchette AD Bernier Lambton Produits For Saguenay inc. Coop For Laterriere Laterriere Alexandre Cote Scott-Junction Scierie Alexandre Lemay&Fils Saint-Bernard Almassa Baie Trinité inc. Bowater Baie Trinite Scierie LeDuc Daishowa Saint Emile Armand Duhamel & Fils Saint-Ignace-de-Stanbridg Scierie Opitciwan 45% Abit-Cons Obedjiwan Blanchette & Blanchette Saint Gerard Scierie Pekan Sainte Anne-des-Monts Bois de Sciage Lafontaine Sainte-Perpétue Tembec Nexfor La Sarre Bowater Métis inc. Fernand Bois Ltee Lac des Aigles Tembec Nexfor Senneterre Busque&Laflamme Inc Scierie Jules LaFlamme St. Benoit Labre Tembec Taschereau Claude Forget Inc Mont Tremblant Dimension Mills 93 Coop des Travailleurs Saint Tite Abitibi Consolidated Donohue/Quno Corp Baie Comeau/Pt Outardes E. Tremblay & Fils Saint Bruno/Alma Abitibi Consolidated Donohue Chibougamau GDS Linière Les Prod For Linière Saint-Côme-Linière Abitibi Consolidated Donohue Girardville GDS Pabaced St. Eusebe Abitibi Consolidated Donohue La Dore Gerard Crete & Fils Riviere Windigo Abitibi Consolidated Stone Consolidated La Tuque Irenee Grondin & Fils St. Zacharie Abitibi Consolidated Stone Consolidated Roberval Les Enterprises Atlas Low Abitibi Consolidated Stone Consolidated Saint Fulgence Les Manuf Warwick ltée Saint-Augustin-de-Woburn Abitibi Consolidated Donohue/Scierie du Gouffre Saint Hilarion Multibois Saint-Augustin-de-Woburn Assoc. Coop For de St Elzear St. Elzear Paul Vallee Lum Co St Isidore de Clifton Boisaco Prod For Saguenay Sacre-Coeur Produit For Labrieville Lac au Brochet Bowater P For Alliance Degelis Produits For Canbo Dolbeau Bowater P For Alliance Girardville Produits For Coulonge Fort Coulonge Bowater Manifor Maniwaki Richard Pelletier & Fils Saint-Michel-du-Squatec Bowater P For Alliance Mistassini Roland Castonguay&Fils Ltee Saint Felicien Bowater P For Alliance /Sc Mitis Price Scierie Amos Ltee Amos Bowater P For Alliance St Felicien Scierie Lefebvre&Pharande Davidson Canfor Bois Daaquam St Just de Bretenieres Scierie Rivest Scierie St Jean Matha St. Jean de Matha Carrier & Begin Saint Honore Scierie Tessier&LaChance Sainte Elizabeth Cedrico Lum Inc Bois Saumon /Theriault & TheriauLac au Saumon Wilfrid Paquet & Fils St. Theophile Claude Forget Inc. Scierie G M Dufour St. Faustin Softwood lumber (1,000 m³) Estimated capacity Number of sawmills Reported output (Stats Can) Number employed ('000) Implied capacity utilization 97% 88% 97% 87% 90%
72
73 Saskatchewan/Manitoba Mill Former name Capacity / Production (1,000 m³) I.D. Name or DBA Location Stud Mills 3 Clearwater For Prod Meadow Lake Norsask For Prod Meadow Lake,SAS Weyerhaeuser Can McMillan Bloedell Carrot River,SAS Dimension Mills 4 Green Lake Metis Green Lake,SAS L&M Prod Glaslyn,SAS South East For Prod Blumenort,MAN Spruce Prod Ltd Swan River,MAN Tolko The Pas,MAN Wapawekka Lum Ltd Buckland,SAS Waugh's Woods Ltd The Pas,MAN Weyerhaeuser Can Big River Lum Big River,SAS Zelensky-LaRonge LaRonge,SAS Specialty or Unknown 7 Provincial For Prod Prince Albert,SAS Roblin For Prod Roblin Softwood lumber (1,000 m³) Estimated capacity Production (Stats Can) Implied capacity utilization 100% 77% 84% 76% 88% Number of sawmills Number employed ('000)

74
75 South Carolina Mill Former name Capacity / Production (1,000 m³) I.D. Name or DBA Location Closed Mills Smurfit Stone Stone For Ind Orangeburg 130 Upchurch Walterboro B. L. Mims & Son Lum Co Edgefield Dickert Lum Co Newberry Georgia-Pacific Corp Varnville Umphlett Lum Co Moncks Corner Timber Mills 4 G&G/Cherokee Wd Prod Edwards Wood Products IncBlacksburg M.L. Corley&Sons Sawmill Lexington Stud Mills 5 Chester Wood Prod Weyerhaeuser Co Chester Georgia-Pacific Corp Russellville International Pap Corp Federal Papbd Newberry Dimension Mills 16 Charles Ingram Lum Co Effingham Chesterfield Lum Co Darlington Coastal Lum Co Walterboro Collums Lum Prod Allendale Elliott Sawmilling Co Estill Georgia-Pacific Corp McCormick Georgia-Pacific Corp Prosperity International Pap Corp Federal Papbd Johnston International Pap Corp Sampit Mead Westvaco Summerville New South Camden New South Conway Board Mills 19 Charleston Heartpine Co Jamestown Warren & Griffin Williams Specialty or Unknown 8 A & M Lum Eck Wood Products Hodges Cameron Lum Co Cameron C. M. Tucker Lum Co Pageland F. B. Davis Sawmill Richland Pennington Crossarm Co Holly Hill Ridge Lum Leesville Thrift Brothers Lum Co Westminster V. P. Kiser Lum Co Bowman Winchester Brothers Salem Softwood lumber (1,000 m³) Estimated capacity Production (U.S. Census) Implied capacity utilization 85% 84% 97% 87% Number of sawmills Number employed ('000)
76
77 Tennessee Mill Former name Capacity / Production (1,000 m³) I.D. Name or DBA Location Specialty or Unknown 4 Conasauga Riv Lum Co Conasauga East Brainerd Lum Co Chattanooga Lynn Sawmill Tellico Plains Replogle Enterprises Henry Rose & Son Crossville Shoun Lum LLC Butler Softwood lumber (1,000 m³) Estimated capacity Production (U.S. Census) Implied capacity utilization 112% 117% 97% 104% Number of sawmills Number employed ('000)
78
79 Texas Mill Former name Capacity / Production (1,000 m³) I.D. Name or DBA Location Closed Mills Dean Lum Co Gilmer 57 Walker Bros Lum Co Huntsville 83 A. H. Forry Prod Willis Wiergate Lum Co Wiergate Louisiana-Pacific Corp Bon Wier Louisiana-Pacific Corp Jasper Mountain Man Willis Timber Mills 20 Southern For Prod Hughes Sawmill Bon Wier Stud Mills 23 Georgia-Pacific Corp Louisiana-Pacific Corp Cleveland Temple-Inland Pineland Dimension Mills 2 Anthony For Prod Atlanta Atchley Lum & Sup Co Trinity Cal-Tex Lum Co Nacogdoches Clemsa Lum Co Hampton Affiliates Pollok CLW Cleveland CLW Livingston CLW Duke City Lum Co. Splendora International Pap Corp Champion Camden International Pap Corp Henderson International Pap Corp New Boston Steely Lum Co Huntsville Temple-Inland Buna Temple-Inland Diboll Temple-Inland Pineland Board Mills 5 Arkansas For Prod Tenaha Hart Lum Co Jasper Nix For Ind Timpson Snider Ind Marshall Specialty or Unknown 19 Eas-Tex Lum Co Livingston G. D. Edgar Lum Co Hemphill Ross Lum Co Timpson Softwood lumber (1,000 m³) Estimated capacity Production (U.S. Census) Implied capacity utilization 98% 89% 94% 94% Number of sawmills Number employed ('000)

80
81 New Hampshire/Vermont Mill Former name Capacity / Production (1,000 m³) Mill Former name Capacity / Production (1,000 m³) I.D. Name or DBA Location I.D. Name or DBA Location Closed Mills 21 Cherokee Lum Co Newport,NH TreeSource Burke Lum Co West Burke,VT Colby Lum Co Boscawen,NH Feuer Lum Co Atkinson,NH 9 22 Cote & Reney Lum Co Grantham,NH Pelletier Lum Corp Hardwick,VT Crestwoods Inc Beaman Lum Co Winchester,NH Three Branches Plaistow,NH Cyr Lum Milton, VT Stinson Rumney, NH Durgin-Crowell Lum Co New London,NH M.S.K. Lum Co East Kingston,NH Fernald Lum Co Nottingham,NH Goose Bay Sawmill Chichester,NH Granite State For Prod Henniker,NH Onnela Lum Co Lempester,NH Greenwood Mill Calendar Brook Lum Lyndonville, VT Bingham Lum Brookline,NH Heath Lum North Hyde Park, V Timco Inc Desoto Treated MCenter Barnstead,N H.G. Wood Prod Bath,NH Tembec Scierie Davidson Woodsville,NH King For Ind Wentworth,NH Timber Mills 4 Lamell Lum Corp Essex Junction,VT Perras Lum Co Groveton,NH Lussier's Sawmill Enosburg Falls, VT Dimension Mills 2 M Piette & Sons Irasburg, VT Vallee Lum Co Milan,NH Madison Lum Mill International Pap CorpWest Ossipee,NH White Pine Mills 19 Middleton Bldg Sup Middleton,NH Barton Lum Co Barnstead,NH Mill River Lum N. Clarendon,VT Bellingham Lum CoChocorua Valley LSouth Tamworth,NH Patenaude Lum Co Henniker,NH Britton Lum Co Fairlee,VT Precision Lum Wentworth,NH Cersosimo Lum Co Brattleboro,VT P&R Lum Wolcott, VT Cersosimo Lum Co W Lebanon, NH Seacoast Mills Brentwood,NH Vermont Log Buildings Hartland, VT Softwood lumber (1,000 m³) Estimated capacity Number of sawmills Production (U.S. Census) Number employed ('000) Implied capacity utilization 90% 75% 79% 70%

82
83 Virginia Mill Former name Capacity / Production (1,000 m³) Mill Former name Capacity / Production (1,000 m³) I.D. Name or DBA Location I.D. Name or DBA Location Closed Mills 9 Carlton & Edwards Saluda Smurfitt Stone St. Laurent PapbdWest Point Kirk Lum Co Suffolk Coastal Lum Co Suffolk Morgan Lum Co Red Oak Tradewinds of Virginia Bumpass M. Kendall Lum Co Blairs Evans Lum Co Waverly Potomac Sup Corp Kinsale Dalton Lum Corp Altavista R. A. Yancey Lum Corp Crozet Northern Neck Lum Co Warsaw Saunders Lum Co Chatham Dixon Lum Co Galax West Pt Logging Corp West Point Georgia-Pacific Corp Wakefield Specialty or Unknown Rappahannock Lum Co Saluda Adams Lum Co Brookneal Timber Mills 17 Anderson Bros Lum Co Amelia ArborTech Blackstone Ball Lum Co Millers Tavern Chips Troy Cloverdale Lum Co Sutherlin Gibson Lum Co Gretna Dominion For Prod Martinsville J. Franklin Jones Lum Co Accomac Earl Withers Callao Robertson Lum Hurt Gladys Tim Prod The Burruss CoGladys Dimension Mills 24 J. D. Martin Lum Co Spout Spring Amelia Lum Co Amelia J. H. Knighton Lum Co Ruther Glen Flippo Lum Corp Doswell Kempsville Bldg Mat Virginia Beach International Pap Corp Union Camp CorpFranklin Spaulding Lum Co Chase City Nottoway Lum Co Blackstone Taylor Ramsey Corp Blackstone Pine Prod Inc Martinsville Tucker Sawmill Co Brookneal Tidewater Lum Corp Tappahannock Walton Lum Co Mineral Board Mills 25 Williams Lum Sup Co Brookneal Barnes Manufacturing Co Kenbridge Softwood lumber (1,000 m³) Estimated capacity Number of sawmills Production (U.S. Census) Number employed ('000) Implied capacity utilization 110% 105% 98% 109%

84
85 Washington Mill Former name Capacity / Production (1,000 m³) Mill Former name Capacity / Production (1,000 m³) I.D. Name or DBA Location I.D. Name or DBA Location Closed Mills 1 Portac Beaver Quality Veneer & LumMayr Bros Hoquiam Portac Tacoma Enterprise Lbr Arlington RSG For Prod Kalama Welco Lum Co Arlington Seattle-Snohomish Snohomish Simpson Tim Co Commencement BayTacoma Sierra Pacific Ind Aberdeen TreeSource Morton For Prod Morton Simpson Tim Co Dayton TreeSource Sedro Woolley Sedro Woolley Simpson Tim Co Shelton TreeSource Spanaway Spanaway Simpson Tim Co Commencement BTacoma Vaagen Bros Republic TreeSource Tumwater Lum cotumwater Pacific Crest Lum Co Winlock Vaagen Bros Colville Weyerhaeuser Co Enumclaw/Snoq Weyerhaeuser Co Aberdeen Frontier Boise Cascade Yakima Weyerhaeuser Co Longview/Gr.Mtn Timber Mills 15 Weyerhaeuser Co Raymond Buse Tbr. Sales Everett Wilkins Kaiser Olsen Carson Canyon Lum Co Everett Yakama For Prod White Swan Hambleton Bros Washougal Zosel Lum Co Oroville Springdale Lum Co Springdale Cedar Mills Stud Mills 19 Caffal Bros Longview Allen Logging Co Forks Crane Cr. Cedar Amanda Pk Centralia Sawmill Co Centralia 1 20 RSG For Prod Gram Lum Co Kalama Hampton Affiliates Pac Lum&Ship Morton Tubafor Mill Morton Hampton Affiliates Pac Lum&Ship Randle Welco-Skookum Delson Lum SalesShelton Inter For Prod Crown Pacific Marysville Welco Lum Co Marysville Inter For Prod Crown Pacific Port Angeles Board Mills 18 Lewis County For Prod Winlock Boise Cascade Kettle Falls Mary's River Lum Co Montesano Colville Precision Pn Omak Mason County For P Olympic Wood Prod Shelton Stimson Lum Co Plum Creek Mfg Colville/Arden Pony Lum LLC Louisiana-Pacific CoTacoma Specialty or Unknown 28 SDS Lum Bingen Columbia Vista Champion Int Camas Sierra Pacific Ind Aberdeen Dahlstrom Hoquiam Dimension Mills 35 Fritsch Mill Snohomish Bennett Lum Co Clarkston Great Western Everson Hampton Affiliates Summit Tim Co Darrington Layman Lum Co Naches Longview Fibre Leavenworth SSF Bldg Mat Northport Manke Lum Tacoma Softwood lumber (1,000 m³) Estimated capacity Number of sawmills Reported output (WWPA) Number employed ('000) Implied capacity utilization 97% 94% 94% 91%

86
Softwood Lumber Prices for Evaluation of Small-Diameter Timber Stands in the Intermountain West
 United States Department of Agriculture Forest Service Forest Products Laboratory Research Note FPL RN 0270 Softwood Lumber Prices for Evaluation of Small-Diameter Timber Stands in the Intermountain West
Criterion 6, Indicator 30: Value and Volume in Round Wood Equivalents of Exports and Imports of Wood Products
 United States Department of Agriculture Forest Service Forest s Laboratory Research Note FPL RN 0319 Criterion 6, Indicator 30: Value and in Round Wood Equivalents of Exports and Imports of Wood s James
Consumption Outpaces Har vest, Prices Rise Slowly
 Harvest, Inventory, and Stumpage Prices Consumption Outpaces Har vest, Prices Rise Slowly Darius M. Adams ABSTRACT America s appetite for timber will continue to grow, and consumption will exceed domestic
Product Recovery From Hemlock Pulpwood From Alaska
 United States Department of Agriculture Forest Service Pacific Northwest Forest and Range Experiment Station Research Paper PNW-303 January 1983 Product Recovery From Hemlock Pulpwood From Alaska Thomas
Harvest, Employment, Exports, and Prices in Pacific Northwest Forests,
 Pacific Northwest Research Station Harvest, Employment, Exports, and Prices in Pacific Northwest Forests, 1965 2000 General Technical Report PNW-GTR-547 July 2002 Debra D. Warren United States Department
The hardwood chip market is an important element of
 The hardwood chip market is an important element of wood fiber raw material supply for the pulp and paper industry and other pulp-based products such as fiberboard. Hardwood chips enter the chip market
North American Timber Outlook
 North American Timber Outlook Conditions Required for a Widespread Revival North American Conference October 2017 Peter Barynin Principal Economist, Timber Copyright 2017 RISI, Inc. Proprietary Information
Lumber Recovery. Kenneth A. Kilborn. United States Department of Agriculture
 Lumber Recovery Forest Service Pacific Northwest Studies of Alaska Research Station General Technical Report Sawmills, 1997 to 1999 United States Department of Agriculture PNW-GTR-544 April 2002 Kenneth
Agricultural Extension Service The University of Tennessee PB Understanding Log Scales and Log Rules
 Agricultural Extension Service The University of Tennessee PB 1650 Understanding Log Scales and Log Rules 1 Understanding Log Scales and Log Rules Brian Bond, Former Assistant Professor, Forestry, Wildlife
Hancock Timberland Investor
 Hancock Timberland Investor Fourth Quarter 2006 2006 Timberland Investment Performance Despite the downturn in demand for housing and associated manufactured wood products, U.S. timberland properties in
3 Forestry in Finland
 3 Forestry in Finland 3.1 Utilisation of Wood Resources Finland s abundant forest resources are sufficient to meet the Finnish forest industry s demand for roundwood, with the exception of birch. The industry
Taper rule for butt log of lodgepole pine
 Taper rule for butt log of lodgepole pine 17 - LOG MEASUREMENTS 17.4 Taper in Long Logs 17.43 - Taper in Butt Logs The taper in long logs which have the butt cut at one end of the log will be determined
Production, Prices, Employment, and Trade in Northwest Forest Industries, All Quarters 2010
 OF AGRICU LT URE United States Department of Agriculture Forest Service Pacific Northwest Research Station Resource Bulletin PNW-RB-260 July 2011 Production, Prices, Employment, and Trade in Northwest
Production, Prices, Employment, and Trade in Northwest Forest Industries, All Quarters 2009
 OF AGRICU LT URE United States Department of Agriculture Forest Service Pacific Northwest Research Station Resource Bulletin PNW-RB-259 September 2010 Production, Prices, Employment, and Trade in Northwest
2011 Economic State of the B.C. Forest Sector
 2011 Economic State of the B.C. Forest Sector June 2012 Prepared by Jie Shu, Economic Analyst Competitiveness and Innovation Branch 1 Questions Addressed How well is B.C. s forest sector doing? How competitive
Criterion 6, Indicator 25: Value and Volume of Wood and Wood Products Production, Including Primary and Secondary Processing
 United States Department of Agriculture Forest Service Forest Products Laboratory Research Note FPL RN 0316 Criterion 6, Indicator 25: Value and Volume of Wood and Wood Products Production, Including Primary
More than half of the timber
 Solid Wood Products Rising Consumption and Impor ts, Modest Price Growth Darius M. Adams ABSTRACT Based on findings of the current Resources Planning Act (RPA) Timber Assessment, residential construction
Comparing the Flatwise Modulus of Elasticity (E flat ) of Green Lodgepole Pine Lumber & Grey-Stage Dry MPB Lumber
 of Green Lodgepole Pine Lumber & Grey-Stage Dry MPB Lumber") Comparing the Flatwise Modulus of Elasticity (E flat ) of Green Lodgepole Pine Lumber & Grey-Stage Dry MPB Lumber Prepared for Forestry Innovation Investment Ltd. by Dan Alexander Project No. MPB 2007-002
Comparing the Flatwise Modulus of Elasticity (E flat ) of Green Lodgepole Pine Lumber & Grey-Stage Dry MPB Lumber Prepared for Forestry Innovation Investment Ltd. by Dan Alexander Project No. MPB 2007-002
PNW Wood Markets: A Closer Look at our Domestic and Export Timber Economies
 PNW Wood Markets: A Closer Look at our Domestic and Export Timber Economies Timber Measurements Society Central Meeting April 7, 2016 Coeur d Alene, Idaho 2015 Forest2Market, Inc. 2 Today s Topics US housing
Georgia, Forest Inventory & Analysis Factsheet. Richard A. Harper. Timberland Area and Live-Tree Volume by Survey
 Georgia, 211 Richard A. Harper Forest Inventory & Analysis Factsheet F I A Forest cover along the Ocmulgee River south of Macon, GA. (photo courtesy of the Georgia Forestry Commission) 3 25 2 15 1 5 Area
Yield of 2 by 4 red oak stress-graded dimension lumber from factory-grade logs
 Yield of 2 by 4 red oak stress-graded dimension lumber from factory-grade logs Kent A. McDonald James W. Whipple Abstract Efficient conversion of red oak logs to structural dimension lumber depends on
Evaluating Shrinkage of Wood Propellers in a High-Temperature Environment
 United States Department of Agriculture Forest Service Forest Products Laboratory Research Note FPL RN 0309 Evaluating Shrinkage of Wood Propellers in a High-Temperature Environment Richard Bergman Robert
IMPROVING SAWING ACCURACY DOES HELP
 IMPROVING SAWING ACCURACY DOES HELP RESEARCH PAPER FPL 320 U.S. DEPARTMENT OF AGRICULTURE FOREST SERVICE FOREST PRODUCTS LABORATORY MADISON, WIS. 1979 Abstract The relation of sawing accuracy to lumber
An MFC Global Investment Management Company Timberland Investor Second Quarter Are Timberland Properties Less Liquid than Commercial Buildings?
 Hancock An MFC Global Investment Management Company Timberland Investor Second Quarter 24 Are Timberland Properties Less Liquid than Commercial Buildings? Real estate investment analysts sometimes assert
Assessment of the Treatability of Small-Diameter Grand Fir Posts
 2 United States Department of Agriculture Forest Service Forest Products Laboratory Research Note FPL RN 0285 Assessment of the Treatability of Small-Diameter Grand Fir Posts Stan Lebow Susan L. LeVan
Rural Manufacturing at a Glance, 2017 Edition
 United States Department of Agriculture Economic Research Service, Economic Information Bulletin 177, August 17 Rural Manufacturing at a Glance, 17 Edition Overview Despite declining rural manufacturing
Factors Affecting Oxidative Stain in Soft Maple (Acer rubrum L.)
") United States Department of Agriculture Forest Service Forest Products Laboratory Research Note FPL RN 0311 Factors Affecting Oxidative Stain in Soft Maple (Acer rubrum L.) Michael C. Wiemann Mark Knaebe
United States Department of Agriculture Forest Service Forest Products Laboratory Research Note FPL RN 0311 Factors Affecting Oxidative Stain in Soft Maple (Acer rubrum L.) Michael C. Wiemann Mark Knaebe
New Hampshire Native Lumber Law RSA 434-: Self Study Booklet
 New Hampshire Native Lumber Law RSA 434-:59-61 Self Study Booklet Issued by: UNH Cooperative Extension 210 Nesmith Hall, 131 Main St. Durham, NH 03857 Contact: Forestry Information Center 1-800-444-8978
The United States has a long history
 The Fifth Resources Planning Act Timber Assessment A Critical Tool for Sound Stewardship Richard W. Haynes and Kenneth E. Skog ABSTRACT For the past century, national assessments of supply-and-demand trends
Opportunity for Price Rises Still Awaited in the Paper Industry. Upturn in Sawnwood Prices Tailing Off
 Summary Strong GDP growth in Europe during 2007 has boosted housing construction and thus the demand for sawnwood, and has also increased the consumption of certain paper grades. The unusually large increase
Hancock Timberland Investor
 Hancock Timberland Investor Third Quarter 2006 Housing Starts, Lumber Prices, and Timberland Investment Performance What does the prospect of a slowdown in U.S. housing construction and an associated drop
A New Timber Economy in the US Pacific Northwest?
 Hancock Hancock Timber Resource Group Timberland Investor Third Quarter 22 A New Timber Economy in the US? Much has changed in the s timber economy. For most of the post-world War II era, public lands
ANALYSIS OF MILK MOVEMENTS FROM DAIRY FARMS TO MILK PROCESSING PLANTS: MAY 2016 PACIFIC NORTHWEST ORDER. Staff Paper John Mykrantz.
 UNITED STATES DEPARTMENT OF AGRICULTURE Agricultural Marketing Service 1930-220 th Street SE, Ste. 102 Dairy Programs Bothell, WA 98021 Phone: (425) 487-6009 FEDERAL MILK ORDERS 124 & 131 Fax: (425) 487-2775
An Examination of Red Alder and Western Red Cedar as Alternative Plantation Choices to Douglas-fir
 An Examination of Red Alder and Western Red Cedar as Alternative Plantation Choices to Douglas-fir Washington Farm Forestry Association April 4, 2003 The Pacific Northwest has always been the Douglas fir
CHANGE OF GRADE AND VOLUME OF DOUGLAS-FIR SHOP AND BETTER LUMBER DURING KILN DRYING. W. Y. Pong and Harvey H. Smith, Forest Products Technologists
 CHANGE OF GRADE AND VOLUME OF DOUGLAS-FIR SHOP AND BETTER LUMBER DURING KILN DRYING By W. Y. Pong and Harvey H. Smith, Forest Products Technologists Contents Page Procedure 1 Data Processing 4 Results
Texas, Forest Inventory & Analysis Factsheet. James W. Bentley. Forested Area. Introduction. Inventory Volume
 Texas, 21 James W. Bentley Forest Inventory & Analysis Factsheet F I A The Nation s Forest Census Introduction Guadalupe River State Park, Comel County, TX. (photo by This science update summarizes the
The Forest Industry: Harvest, Housing and Foreign Trade
 The Forest Industry: Harvest, Housing and Foreign Trade Timber Measurements Society, Central Meeting April 10, 2013 Silver Reef Resort Ferndale, Washington 2013 Forest2Market, Inc. 2 Forest2Market Data
Plywood Manu facturing Cost Trends, Excluding Wood, in Western U.S. Mills:
 United States Department of Agriculture Forest Service Products Laboratory General Technical Report FPL-GTR-64 Plywood Manu facturing Cost Trends, Excluding Wood, in Western U.S. Mills: 1975-1988 Henry
An MFC Global Investment Management Company Timberland Investor Second Quarter 2005
 Hancock An MFC Global Investment Management Company Timberland Investor Second Quarter 2 Global and Domestic Response to Record Lumber Demand in the United States U.S. lumber consumption set a record in
Pecky Rot in Incense-Cedar: Evaluation of Five Scaling Methods
 United States Department of Agriculture Forest Service Pacific Northwest Research Station Research Note PNW-RN-457 January 1987 Pecky Rot in Incense-Cedar: Evaluation of Five Scaling Methods James M. Cahill,
Update: The Global Demand for Wood Fibre
 Update: The Global Demand for Wood Fibre Timber Invest Europe Conference, London Bob Flynn Director, International Timber October 25, 21 End-use Market Sectors for Timberland Investments Pulp and Paper
TIR OUTLOOK FOR U.S. TIMBERLAND IN A CHANGING GLOBAL MARKETPLACE. Chung-Hong Fu, Ph.D., Managing Director
 TIR OUTLOOK FOR U.S. TIMBERLAND IN A CHANGING GLOBAL MARKETPLACE Chung-Hong Fu, Ph.D., Managing Director Economic Research and Analysis February 2006 Introduction Two particular issues of global trade
Introduction
 LOUISIANA TIMBER MARKET ANALYSIS 214 Dr. Shaun M. Tanger Department of Agricultural Economics and Agribusiness Louisiana State University Staff Report No. 214-7, May 214. Introduction Timber and timber
Benchmarking Sawmill Recovery: Trends in Sawmill Efficiency over the Years and by Region
 Benchmarking Sawmill Recovery: Trends in Sawmill Efficiency over the Years and by Region Timber Measurements Society Portland, OR Roy Anderson, PhD April 2017 Agenda What is recovery? Why recovery? Measuring
Forest Products Conversion Factors
 Forest Products Conversion Factors Matt Fonseca UNECE/FAO Timber Section Background The Project was initiated at the 2008 Working Party Meeting It took the correspondents much longer than anticipated to
Soybean Objective Yield Survey Data,
 Washington, D.C. Soybean Objective Yield Survey Data, 1992-2006 Released July 27, 2007, by the National Agricultural Statistics Service (NASS),, U.S. Department of Agriculture. For information on call
Hancock Timberland Investor
 Hancock Timberland Investor Second Quarter 2006 Log Price Volatility as a Measure of Timberland Investment Risk Fluctuations in log prices are a key feature of any timberland investment, for log price
Financial Analysis of Fuel Treatments on National Forests in the Western United States
 United States Department of Agriculture Forest Service Pacific Northwest Research Station Research Note PNW-RN-555 Financial Analysis of Fuel Treatments on National Forests in the Western United States
PREFACE ABSTRACT AUTHOR
 United States Department of Agriculture Forest Service Pacific Northwest Research Station Resource Bulletin PNW-RB-190 February 1992 Production, Prices, Employment, and Trade in Northwest Forest Industries,
Recovery of Construction and Standard Lumber in Second Growth Logs with Large Knot Collars. Pacific Rim Log Scaling Bureau 2013
 Recovery of Construction and Standard Lumber in Second Growth Logs with Large Knot Collars Pacific Rim Log Scaling Bureau 2013 Background The Scaling Practice Committee of the Northwest Log Rules Advisory
Hancock Timberland Investor
 Hancock Timberland Investor Second Quarter 23 Risk from Natural Hazards for Timberland Investments Timberland investors are often concerned about financial loss from natural hazards such as fires, storms
Detection and analysis of the stress relaxation properties of thin wood composites using cantileverbeam
 Detection and analysis of the stress relaxation properties of thin wood composites using cantileverbeam bending Houjiang Zhang John F. Hunt Yan Huang Abstract Introduction 309 SUMMARY ON STRESS RELAXATION
2016 Strategic Issues for US Pacific Northwest Timberlands
 Date 2016 Strategic Issues for US Pacific Northwest Timberlands Nick Blacklock Director, Global Resource Planning www.hancocktimber.com Hancock Natural Resource Group Company Overview Manulife Financial
Sparta Vegetation Management Project
 Sparta Vegetation Management Project Social and Economics Report Prepared by: John Jesenko Presale/Forest Measurements Specialist /s/ John Jesenko for: Whitman Ranger District Wallowa-Whitman National
Increased STUD Grade Yield of Plantation Southern Pine by Saw-Dry-Rip
 United States Department of Agriculture Forest Service Forest Products Laboratory Research Paper FPL-RP-479 Increased STUD Grade Yield of Plantation Southern Pine by Saw-Dry-Rip Robert R. Maeglin R. Sidney
Lumber Recovery. Kenneth A. Kilborn. United States Department of Agriculture
 Lumber Recovery Forest Service Pacific Northwest Studies of Alaska Research Station General Technical Report Sawmills, 1997 to 1999 United States Department of Agriculture PNW-GTR-544 April 2002 Kenneth
Is there a better measure for roundwood than the Board Foot?
 Is there a better measure for roundwood than the Board Foot? Neal Hart, Jendro & Hart, LLC Timber Measurement Society, Central Meeting - Portland, Oregon April 8, 2010 Three common, but false,, presumptions
Wheat Objective Yield Survey Data,
 Washington, D.C. Wheat Objective Yield Survey Data, 1993-2007 Released May 30, 2008, by the National Agricultural Statistics Service (NASS),, U.S. Department of Agriculture. For information on call Todd
Hancock Timberland Investor
 Hancock Timberland Investor Fourth Quarter 23 23 Timberland Investment Performance The investment performance of timberland properties in the United States rebounded last year as the NCREIF Timberland
THE ROLE OF BIOCONTROL OF EMERALD ASH BORER
 FHAAST-2017-02 November 2017 THE ROLE OF BIOCONTROL OF EMERALD ASH BORER IN PROTECTING ASH REGENERATION AFTER INVASION Jian J. Duan1 Roy G. Van Driesche2 Leah S. Bauer3 Richard Reardon4 Juli Gould5 Joseph
Bulletin of Hardwood Market Statistics: 2005
 United States Department of Agriculture Forest Service Northeastern Research Station Bulletin of Hardwood Market Statistics: 2005 Research Note NE-387 Melody Akers Abstract Provides current and historical
Corn Objective Yield Survey Data,
 Washington, D.C. Corn Objective Yield Survey Data, 1992-2006 Released May 18, 2007, by the National Agricultural Statistics Service (NASS),, U.S. Department of Agriculture. For information on call Ty Kalaus
Forest Resources of the Black Hills National Forest
 United States Department of Agriculture Forest Service Rocky Mountain Research Station August 22 Forest Resources of the Black Hills National Forest Larry T. DeBlander About the author Larry T. DeBlander
But they ve come a long way
 The Modern Sawmill B.C. s Gorman Bros. Lumber is among a sophisticated new generation of mills characterized by increased energy efficiency, waste minimization and sustainable forestry 36 wood design &
The Forest Products Laboratory Wood Products Production Index
 United States Department of Agriculture Forest Service Forest Products Laboratory Research Paper FPL 473 The Forest Products Laboratory Wood Products Production Index James L. Howard Robert N. Stone Kenneth
Capacity and Capability of Mills in the Clearwater and Nez Perce National Forests Timber Processing Area
 Capacity and Capability of Mills in the Clearwater and Nez Perce National Forests Timber Processing Area Submitted to: Krista Gebert, USDA Forest Service, Region One Purchase Order No. AG-03R6-P-12-0157
Estimating Value and Volume of Ponderosa Pine Trees by Equations
 United States Department of Agriculture Forest Service Pacific Northwest Forest and Range Experiment Station Research Paper PNW-283 May 1981 Estimating Value and Volume of Ponderosa Pine Trees by Equations
North Carolina, 2010
 North Carolina, Introduction Mark J. Brown and Barry D. New North Carolina s first annualized forest survey was completed in and results were published in e-science Update SRS 029. There were 5,800 ground
Table 1: Population Growth, Area Percent Change ( ) Modoc 9,678 9,449 9, Alturas 3,190 2,890 2,
 Modoc 9,678 9,449 9, Alturas 3,190 2,890 2,") Economic Analysis Effects of Proposed Action Compared to No Action Alternative Information Sources Merchantable timber volumes for the economic appraisal were derived from inventory plot data that was
Economic Analysis Effects of Proposed Action Compared to No Action Alternative Information Sources Merchantable timber volumes for the economic appraisal were derived from inventory plot data that was
Washington s Forest Products Industry: Current Conditions and Forecast 2002
 MISC0484E Washington s Forest Products Industry: Current Conditions and Forecast 2002 Produced by The Inland Northwest Forest Products Research Consortium, a research cooperative centered at the Forest
Financial criteria may play a significant role in the decision to
 FIELD NOTE Stumpage Prices in Southern New England (1978 2011): How Do Red Oak, White Pine, and Hemlock Prices Vary over Time? Jas S. Smith, Marla Markowski-Lindsay, John E. Wagner, and David B. Kittredge
Tree Survival 15 Years after the Ice Storm of January 1998
 United States Department of Agriculture Tree Survival 15 Years after the Ice Storm of January 1998 Walter C. Shortle Kevin T. Smith Kenneth R. Dudzik Forest Service Northern Research Paper Research Station
DRAFT Investor Presentation May 2016
 DRAFT Investor Presentation May 2016 Forward Looking Statements and Non-GAAP Financial Measures All financial references are expressed in C$ unless otherwise noted. This presentation contains forward looking
Softwood Lumber (& Panel) Markets: North America & Global Trends
 Markets: North America & Global Trends") Softwood Lumber (& Panel) Markets: North America & Global Trends PricewaterhouseCoopers 21 st Forest Industry Conference Vancouver, BC May 8, 28 By: Russell Taylor Presentation Outline 1. North America
Softwood Lumber (& Panel) Markets: North America & Global Trends PricewaterhouseCoopers 21 st Forest Industry Conference Vancouver, BC May 8, 28 By: Russell Taylor Presentation Outline 1. North America
Woodland Planning for Success
 Woodland Planning for Success Why Do I Need a Forest Management Plan? 20 th Annual Tri-State Forest Stewardship Conference 2014 Wade Conn Natural Resources Conservation Service State Forester Champaign,
Investor Tour October, Armour, North Carolina
 Investor Tour October, 2013 Armour, North Carolina Forward-Looking Statements This presentation includes forward-looking statements, which are statements that are not historical facts, and as a result
Summary Update. Contents
 Contents Summary Update Timber Prices Product Prices Timberland Markets Economic News The FIA Quarterly Dashboard Summary Update Timber and Product Prices Southeastern pine stumpage markets experienced
Capacity and Capability of Mills in the Kootenai National Forest Impact Zone
 Capacity and Capability of Mills in the Kootenai National Forest Impact Zone Submitted to: Krista Gebert, USDA Forest Service, Region One Purchase Order No. AG-03R6-P-12-0157 Prepared by: Colin B. Sorenson
Bulletin. Mideast Market Administrator s
 Mideast Market Administrator s Bulletin Federal Order No. 33 Sharon R. Uther, Market Administrator Phone: (330) 225-4758 Toll Free: (888) 751-3220 Email: clevelandma1@sprynet.com WebPage: www.fmmaclev.com
An MFC Global Investment Management Company Timberland Investor First Quarter Softwood Sawlog Prices in Brazil The Move to Equilibrium
 Hancock An MFC Global Investment Management Company Timberland Investor First Quarter 2 Softwood Sawlog Prices in Brazil The Move to Equilibrium Over the past three years, prices for pine timber in Brazil,
Forest Industry Outlook and Facts on the Ground. Brooks Mendell Amanda Lang Shawn Baker
 Forest Industry Outlook and Facts on the Ground Brooks Mendell Amanda Lang Shawn Baker Brooks Mendell bmendell@forisk.com 770.725.8447 MACRO DRIVERS AND FOREST INDUSTRY CAPITAL INVESTMENTS Timber market
An Assessment of Training Needs for the Lumber Manufacturing Industry in the Eastern. United States
 United States Department of Agriculture Forest Service Forest Products Laboratory Research Paper FPL RP 646 An Assessment of Training Needs for the Lumber Manufacturing Industry in the Eastern United States
Finnish Forest Sector Economic Outlook
 Natural resources and bioeconomy studies 50/2018 Finnish Forest Sector Economic Outlook 2018 2019 Executive Summary Jari Viitanen and Antti Mutanen (eds.) Finnish Forest Sector Economic Outlook 2018 2019
TIMBERLAND IN THE EYE OF THE FINANCIAL STORM: THE SHORT AND LONG-TERM OUTLOOK FOR TIMBERLAND IN TODAY S ECONOMIC ENVIRONMENT
 TIMBERLAND IN THE EYE OF THE FINANCIAL STORM: THE SHORT AND LONG-TERM OUTLOOK FOR TIMBERLAND IN TODAY S ECONOMIC ENVIRONMENT Chung-Hong Fu, Ph.D., Managing Director Economic Research and Analysis February
Timber Basket of the Interior West:
 Timber Basket of the Interior West: A Forest Products Industry Perspective in Idaho Eric Simmons Forest Industry Research Program, Bureau of Business and Economic Research (BBER) University of Montana
Economic Impact of the Texas Forest Sector, 2007
 Economic Impact of the Texas Forest Sector, 2007 Yanshu Li and Burl Carraway Sustainable Department Texas Forest Service October 2009 HIGHLIGHTS 2007 The Texas forest sector directly contributed $19.4
Louisiana's Forests and Forest Products Industries
 Louisiana's Forests and Forest Products Industries Working Paper # 11 Louisiana Forest Products Laboratory Louisiana State University Agricultural Center Baton Rouge, LA Mr. N. Paul Chance Research Associate
2/24/2009. The factors that determine what type of forest will grow in a region are temperature precipitation growing season soil land forms
 FOREST FACTS Forestry 37% of Canada's land area covered by forests. Stretches in a continuous band from BC to NL. Commercial forests are forests that could be easily be harvested for timber. Non-commercial
Hancock Timberland Investor
 Hancock Timberland Investor First Quarter 24 New Zealand Timber Is Sold into a Diverse Array of Pacific Rim Markets Ownership of New Zealand timberland exposes investors to a broad mix of Pacific Rim timber
In 1997, the United States had 747
 Private Timberlands Growing Demands, Shrinking Land Base Ralph Alig, John Mills, and Brett Butler ABSTRACT By 2050, US timberland area is projected to be about 3 percent smaller than today due to increasing
Unit C: Forest Management. Lesson 3: Measuring Timber Stands
 Unit C: Forest Management Lesson 3: Measuring Timber Stands 1 Terms Basal area Board foot dbh Diameter at breast height Log rules Lumber overrun Taper Wedge prism 2 How do I calculate board feet? A board
The State of B.C. s Wood Products Industry: 2015 Update
 The State of B.C. s Wood Products Industry: 2015 Update Association of Professional Economists of BC Vancouver, BC May 20 2015 By: Russell Taylor 2a Introduction to: International WOOD MARKETS Group We
ABSTRACT PREFACE AUTHOR
 United States Department of Agriculture Forest Service Pacific Northwest Research Station Resource Bulletin PNW-RB-199 January 1994 Production, Prices, Employment, and Trade in Northwest Forest Industries,
A QUANTITATIVE INVESTIGATION OF TRIM LOSS CAUSED BY KILN DRYING
 A QUANTITATIVE INVESTIGATION OF TRIM LOSS CAUSED BY KILN DRYING Sita Warren H.A. Simons Ltd. Vancouver, BC INTRODUCTION This paper will present data collected from a study conducted at an interior mill
Chapter 3: Timber Demand and Supply Relationships: Base Projection
 The 2 RPA Timber Assessment Update Chapter 3: Timber Demand and Supply Relationships: Base Projection Introduction The 2 update base projection was developed assuming a continuation of current public policies
Southern Timber Market Trends
 Southern Timber Market Trends 2017 Tom Harris Southern Timber Market Trends Objectives and Issues The World, United States, and US South Pulp and Paper Products Solid Wood Products US South Stumpage Markets
1998 LUMBER FORECAST
 1998 LUMBER FORECAST Jim Mathews Western Wood Products Association Portland, Oregon Good morning, I appreciate the opportunity to join you for the 50th anniversary of the Western Dry Kiln Association.
If the U.S. Had Canada s Stumpage System...
 If the U.S. Had Canada s Stumpage System... Henry Spelter, Economist 124 U.S. Forest Service Forest Products Laboratory Madison, WI 53705. E-mail:hspelter@fs.fed.us Abstract: North American log markets
Procedures Used to Estimate Hardwood Lumber Consumption from 1963 to 2002
 United States Department of Agriculture Forest Service Northern Research Station General Technical Report NRS-26 Procedures Used to Estimate Hardwood Lumber Consumption from 1963 to 2002 William Luppold
Duration of Load on Bolted Joints
 United States Department of Agriculture Forest Service Forest Products Laboratory Research Paper FPL-RP-488 Duration of Load on Bolted Joints A Pilot Study Thomas Lee Wilkinson Abstract Design values for