Illinois Forests 2010
|
|
|
- Caren Wilson
- 5 years ago
- Views:
Transcription


1 Illinois Forests 2010 Resource Bulletin NRS-86 United States Department of Agriculture Forest Service
2 Abstract The second full annual inventory of Illinois forests, completed in 2010, reports more than 4.8 million acres of forest land and 97 tree species. Forest land is dominated by oak/hickory and elm/ash/cottonwood forest-type groups, which occupy 93 percent of total forest land area. The volume of growing stock on timberland totals 7.2 billion cubic feet. The average annual net growth of growing stock from to averages million cubic feet per year. This report includes additional information on forest attributes, land-use change, carbon, timber products, and forest health. The included DVD contains 1) descriptive information on methods, statistics, and quality assurance of data collection, 2) a glossary of terms, 3) tables that summarize quality assurance, 4) a core set of tabular estimates for a variety of forest resources, and 5) a Microsoft Access database that represents an archive of data used in this report, with tools that allow users to produce customized estimates. Acknowledgments The authors would like to thank the many individuals who contributed to both the inventory and analysis of Illinois forest resources. Primary field crew and QA staff over the inventory cycle included Todd Bixby, Tyler Camfield, Joshua Carron, Tom Forbes, Thomas Goff, Glenda Hefty, Brent Hummel, Dominic Lewer, Adam Magnuson, Benjamin Nurre, Greg Pugh, Paul Richards, Willard Smith, Richard Starr, Jason Stephens, Joel Topham and Brian Wall. Data management personnel included Carol Alerich, Charles Barnett, James Blehm, Gary Brand, Dale Gormanson, Mark Hatfield, Bob Ilgenfritz, Greg Liknes, Richard McCullough, Kevin Nimerfro, Barbara O Connell, Cassandra Olson, Jay Solomakos, and Jeffrey Wazenegger. Manuscript reviewers included Brian Walters, U.S. Forest Service, and Paul Deizman, Illinois Department of Natural Resources. Garden of the Gods Wilderness Area, Shawnee National Forest. Photo by Susan Crocker, U.S. Forest Service Manuscript received for publication June 2014 Published by: For additional copies: U.S. FOREST SERVICE U.S. Forest Service 11 CAMPUS BLVD SUITE 200 Publications Distribution NEWTOWN SQUARE PA Main Road Delaware, OH February 2014 Visit our homepage at: Printed on recycled paper
3 Illinois Forests 2010 Susan J. Crocker, Mark D. Nelson, Charles J. Barnett, Brett J. Butler, Grant M. Domke, Mark H. Hansen, Mark A. Hatfield, Tonya W. Lister, Dacia M. Meneguzzo, Ronald J. Piva, Barry T. Wilson, and Christopher W. Woodall Contact Author: Susan J. Crocker, About the Authors Susan J. Crocker, Mark D. Nelson, Grant M. Domke, Dacia M. Meneguzzo, Barry T. Wilson, and Christopher W. Woodall are research foresters with the Forest Inventory and Analysis Program, Northern Research Station, St. Paul, MN. Charles J. Barnett is a biological scientist with the Forest Inventory and Analysis Program, Northern Research Station, Newtown Square, PA. Brett J. Butler is a research forester with the Forest Inventory and Analysis Program, Northern Research Station, Amherst, MA. Mark H. Hansen is a research associate with the University of Minnesota, St. Paul, MN. Mark A. Hatfield and Ronald J. Piva are foresters with the Forest Inventory and Analysis Program, Northern Research Station, St. Paul, MN. Tonya W. Lister is a research forester with the Forest Inventory and Analysis Program, Northern Research Station, Newtown Square, PA.
4 Page intentionally left blank
5 Contents Highlights...1 Background....3 Forest Features....9 Forest Indicators...25 Forest Economics...39 Data Sources Literature Cited Statistics, Methods, and Quality Assurance... DVD
6
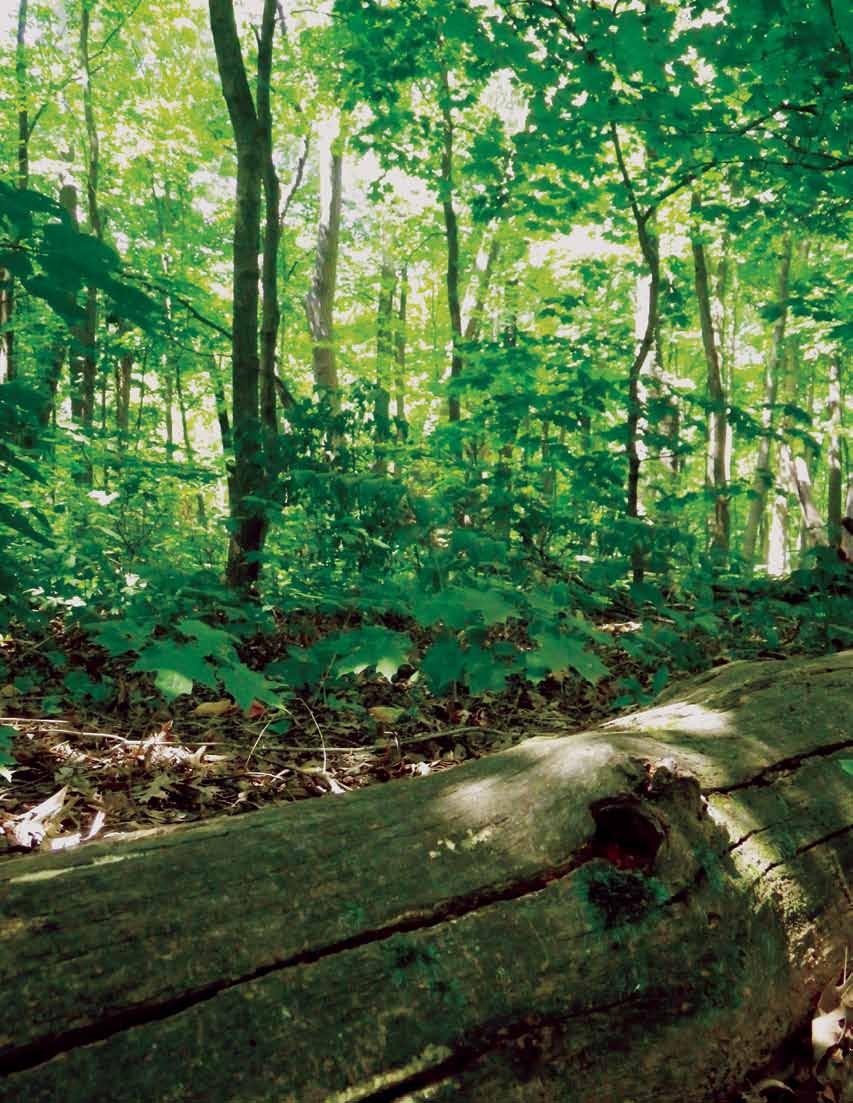
7 Highlights On the Plus Side Statewide forest land area continues to steadily increase. Illinois timberland contains a tremendous amount of aboveground biomass nearly a quarter of a billion tons. State legislation and participation in programs designed to promote sustainability and regeneration have contributed to the rise in both forest area and biomass. Illinois forests support a wide diversity of tree and vascular plant species. Carbon stocks in Illinois have substantially increased in recent decades. Because the majority of carbon is maintained in young stands with long-lived species, forest carbon is likely to continue to increase. Most of Illinois forest land remained forested. When changes in forest land status occurred, gains in forest have outpaced losses. Forest growth continues to increase and exceeds volume losses due to harvest, land-use change, and mortality. Tree mortality continues to rise, but the rate of increase may be slowing over the last decade. Areas of Concern Illinois oak resource is characterized by an abundance of large, mature trees and a comparatively small seedling/sapling component. The declining number of oaks (particularly black oak) and high representation of elms, ashes, and maples among seedlings could give way to a successional change in species composition that leans towards maple dominance. Mortality is on the rise, particularly within largediameter stands and among oaks and ashes. While oak mortality is an indication of senescence, ash mortality has quadrupled since 1985 and largely reflects the activity of the emerald ash borer. Forest fragmentation is high in the central and northern tiers of the State, while continuous forest land is located in southern Illinois. Though they represent a minority of species composition, invasive plants, including black locust, multiflora rose, and Japanese honeysuckle are widely distributed across Illinois. Illinois has experienced a 17 percent decrease in industrial roundwood harvested since Statewide, removals appear to be in balance with forest growth and mortality, such that total volumes continue to increase. Wildlife habitat provided by standing dead trees is relatively high; most of these snags are American elm. Downed log in a mixed hardwood stand. Photo by Emily Crumley, used with permission. 1
8 Issues to Watch Increasing demands for bioenergy and carbon will make monitoring forest biomass more critical. As the bulk of Illinois biomass is found in tree boles, forest management is closely tied to carbon storage dynamics and future availability of wood. The management of forests to maximize carbon sequestration in concert with other land management objectives will require creative silviculture and careful planning. Family forest owners hold the majority of forest land; timber production is not the primary management objective for most of them. Illinois is one of the top producers of U.S. ethanol, therefore, increased interest in domestic fuel sources may be accompanied by increased demand for suitable cropland. Though growing-stock volume continues to rise, the rate of increase may be slowing. Oaks maintain significant volume in growing stock, but volume increases have slowed in comparison to species such as American elm and the soft maples. Sawtimber volumes have more than tripled since Most forest stands are maturing and will eventually experience density and age-related issues. 2

9 Background Shawnee National Forest. Photo by Cassandra Olson, U.S. Forest Service. 3
10 background An Overview of Forest Inventory What is a tree? The Forest Inventory and Analysis (FIA) program, U.S. Department of Agriculture, Forest Service, defines a tree as any perennial woody plant species that can attain a height of 15 feet at maturity. A complete list of the tree species measured in this inventory can be found in the Appendix in Illinois Forests 2010: Statistics, Methods, and Quality Assurance, on the DVD in the inside back cover pocket of this bulletin. What is a forest? FIA defines forest land as land at least 10 percent stocked by trees of any size or formerly having had such tree cover and not currently developed for nonforest uses. The area with trees must be at least 1 acre in size, and roadside, streamside, and shelterbelt strips of trees must be at least 120 feet wide to qualify as forest land. Trees in narrow windbreaks, urban boulevards, orchards, and other nonforest situations are very valuable too, but are not described in this report. What is the difference between timberland, reserved forest land, and other forest land? From an FIA perspective, there are three types of forest land: timberland, reserved forest land, and other forest land. In Illinois, about 98 percent of forest land is timberland, 1 percent is reserved forest land, and less than 1 percent is other forest land. Timberland is unreserved forest land that meets the minimum productivity requirement of 20 cubic feet per acre per year at its peak. Reserved forest land is land withdrawn from timber utilization through legislation or administrative regulation. Other forest land is commonly found on low-lying sites with poor soils where the forest is incapable of producing 20 cubic feet per acre per year at its peak. In Illinois periodic inventories (1998 and prior), only trees occurring on timberland plots were measured. Therefore, while we can report volume on timberland for those inventories, we cannot report volume on forest land. The new annual inventory system facilitates the estimation and reporting of volume on all forest land, not just timberland. Because these annual plots have been remeasured upon completion of the second annual inventory in 2010, we are now able to report growth, removals, and mortality on all forest land. Trend reporting in this publication is necessarily limited to timberland except for the area of forest land on which individual tree measurements are not required. Where are Illinois forests and how many trees are in Illinois? Forest distribution, composition, and structure are affected by ecological factors, including geology, soil type, and climate. The concept of an ecoregion (e.g., Bailey 1995) integrates these factors in order to group areas that are likely to have similar natural communities. The ecoregion classification system is made up of several levels. At the broadest level, ecodomains use climate to identify ecologically uniform areas. Additional levels (e.g., ecodivisions, ecoprovinces, ecoregions, and ecosections) represent successively smaller geographic areas based on similarities in factors mentioned previously. Ecoprovinces, or ecological provinces, are an appropriate level to broadly describe the ecology of Illinois. The State is home to three ecological provinces: the Eastern Broadleaf Forest, the Prairie Parkland Province, and the Lower Mississippi Riverine Forest (Fig. 1). Forest land area is concentrated along rivers and streams in the northern two-thirds of the State and is found throughout the southern third of Illinois (Fig. 2). Illinois forest land contains approximately 2.1 billion trees that are at least 1 inch in diameter at breast height 4
11 background Ecological Provinces Eastern Broadleaf Forest Lower Mississippi Riverine Forest Prairie Parkland can produce individual tree volume estimates based on species, diameter, and tree site index. This method was also used to calculate sawtimber volumes. FIA reports sawtimber volumes in International ¼-inch board foot scale as well as Doyle rule. To convert to the Scribner board foot scale see Smith (1991). Figure 1. Ecological provinces of Illinois (Bailey 1995). (d.b.h., 4.5 feet above the ground). We do not know the exact number of trees because the estimate is based on a sample of the total population. Trees were measured on 1,028 forest plots throughout the State (Fig. 2). For information on sampling errors, see Illinois Forests 2010: Statistics, Methods, and Quality Assurance on the DVD at the back of this bulletin. How do we estimate a tree s volume? Forest inventories typically express volume in cubic feet, but the reader may be more familiar with cords (a stack of wood 8 feet long, 4 feet wide and 4 feet high). A cord of wood contains approximately 79 cubic feet of solid wood and 49 cubic feet of bark and air. Volume can be precisely determined by immersing a tree in a pool of water and measuring the amount of water displaced. Less precise, but much cheaper and easier to do with living trees, is a method adopted by the Northern Research Station (NRS). In this method, several hundred trees were cut and detailed diameter measurements were taken along their lengths to accurately determine their volumes (Hahn 1984). Statistical tools were used to model this data by species group. Using these models, we How much does a tree weigh? Building on previous work, the U.S. Forest Service s Forest Products Laboratory developed estimates of specific gravity for a number of tree species (U.S. For. Serv. 1999). These specific gravities were applied to estimates of tree volume to determine merchantable tree biomass (the weight of the bole). To estimate live biomass, we have to add in the stump (Raile 1982), limbs, and bark (Hahn 1984). We do not currently report the live biomass of roots or foliage. Forest inventories report biomass as green or oven-dry weight. Green weight is the weight of a freshly cut tree; oven-dry weight is the weight of a tree with 0 percent moisture content. On average, 1 ton of oven-dry biomass is equal to 1.9 tons of green biomass. How do we estimate all the forest carbon pools? FIA does not directly measure the carbon in standing trees; it estimates forest carbon pools by assuming that half the biomass in standing live/dead trees consists of carbon. Additional carbon pools (e.g., soil, understory vegetation, belowground biomass) are modeled based on stand/site characteristics (e.g., stand age and forest type). How do we compare data from different inventories? Data from new inventories are often compared with data from earlier inventories to determine trends in forest resources. For comparisons to be valid, the procedures used in the two inventories must be similar. As a result of ongoing efforts to improve the efficiency and 5
12 6 background White/red/jack pine Other softwoods Oak/pine Oak/hickory Oak/gum/cypress Elm/ash/cottonwood Maple/beech/birch Nonforest Plot location Forest-type Group Figure 2. Distribution of FIA plot locations and forest land by forest-type group, Illinois, (Plot locations are approximate.) Plot locations are approximate. Processing note: This map was produced by linking plot data to MODIS satellite pixels (250 m) using gradient nearest neighbor techniques.
13 background reliability of the inventory, several changes in procedures and definitions occurred following the 1998 inventory of Illinois. While these changes have little effect on statewide estimates of forest area, timber volume, and tree biomass, they may have significant effects on plot classification variables such as forest type and stand-size class. Some of these changes make it inappropriate to directly compare annual inventory (2005 and 2010) data tables with those published for the 1998 and earlier inventories. Note that references to the 1948, 1962, 1985, and 1998 periodic inventories each refer to that single year of inventory, but references to the 2010 annual inventory refer to the 5-year period, 2006 to A word of caution on suitability and availability FIA does not attempt to identify which lands are suitable or available for timber harvesting, particularly since such suitability and availability is subject to changing laws, economic/market constraints, physical conditions, adjacency to human populations, and ownership objectives. The classification of land as timberland does not necessarily mean it is suitable or available for timber production. Forest inventory data alone are inadequate for determining the area of forest land available for timber production. Additional factors, like those provided above, need to be considered when estimating the timber base, and these factors may change with time. How do we produce maps? A geographic information system (GIS) and various geospatial datasets were used to produce the maps in this report. Unless otherwise indicated, forest resource data are from FIA and base map layers, e.g., state and county boundaries were obtained from the National Atlas of the United States (USDI 2011). Depicted FIA plot locations are approximate. Additional FIA data are available at Sources of other geospatial datasets are cited within individual figures. All Illinois maps are portrayed in the Universal Transverse Mercator Coordinate System, Zone 16N, North American Datum of
14 8

15 Forest Features Mixed hardwood stand. Photo by Emily Crumley, used with permission. 9
16 Forest FEATURES Forest Area Background Trends in forest area are often a predictor of future forest resource needs. Fluctuations in area may indicate changing land use and/or forest health conditions. Monitoring these changes provides information essential for management and decisionmaking. land is made up of poletimber stands, 8 percent contain sapling-seedling stands, and 1 percent is nonstocked. Additionally, the age of forest stands is increasing, averaging between 21 and 60 years in 1998 to 41 and 80 years in 2010 (Fig. 6). Area of Forest Land (% of county land area) What we found In the early 1800s, prior to European settlement, tallgrass prairie and eastern deciduous forests were the dominant features on the Illinois landscape (Illinois State Nat. Surv. Div. 1960). Forests at this time covered an estimated 13.8 million acres, approximately 40 percent of the total land area. For nearly 120 years, forest area declined and in 1924 reached a low of 3 million acres (Telford 1926). Since that time, forest land has gradually increased, totaling 4.8 million acres in 2010 (Fig. 3). While forest land occurs throughout most of Illinois, it is heavily concentrated in the western half and southern third of the State, particularly within the Shawnee National Forest (Fig 4). An examination of change in forest area by county indicates that more than twothirds of counties have experienced gains in forest area since 1998; however, there is no apparent spatial pattern in gains or losses (Fig. 5). Forest land consists mainly of sawtimber stands (74 percent); 17 percent of forest 5-14 <5 Nonforest Figure 4. Area of forest land as a percentage of county land area, Illinois, Change in Forest Area 1998 to 2010 >5% loss 0-5% loss 0-5% gain >5% gain Forest Land Area (thousand acres) 5,500 5,000 4,500 4,000 3, Year Figure 3. Area of forest land by inventory year, Illinois (error bars represent a 68-percent confidence interval). Figure 5. Change in the area of forest land by county, Illinois,
17 Forest FEATURES Forest Land Area (%) not measured Figure 6. Area of forest land (percent) by stand age and inventory year, Illinois. What this means Stand Age (years) Illinois forest land has continued to grow since Over time, major drivers of increasing forest land included a declining farm economy in the 1960s and 1970s which led to a reduced need for agricultural land and resulted in a reversion of pastures and marginal agricultural lands to forest, and successful state and national programs, e.g., the Illinois Forestry Development Act of 1983, that were designed to promote well-managed forests and forest regeneration. on private timberland is about five times greater than biomass on public timberland; however, public timberland contains more biomass per acre (54 tons per acre on public timberland versus 49 tons per acre on private timberland). While the distribution of biomass is similar to that of forest area, the greatest amounts of forest biomass are in the southern tier of the State, primarily in the Shawnee National Forest (Fig. 8). Statewide, 59 percent of total biomass is contained in the boles of growing-stock trees; 18 percent is in nongrowingstock trees; 17 percent is in growing-stock stumps, tops and limbs; and 6 percent is in saplings (Fig. 9) Biomass (million oven-dry tons) Year Figure 7. Live-tree and sapling biomass on timberland by inventory year, Illinois. Forest Biomass Background Measures of total biomass and its allocation among stand components (e.g., small diameter trees, live canopy crowns and down woody debris) provide an indication of forest health trends and the sustainability of forest management practices. These estimates also offer important information for analyzing carbon sequestration and for determining the amount of wood or fiber available for fuel. What we found The amount of live-tree and sapling biomass on Illinois timberland has steadily increased since 1985, reaching a total of million dry tons (Fig. 7). Biomass 17% 4% 6% 14% Saplings Growing-stock boles 59% Growing-stock stumps, tops, and limbs Nongrowing-stock boles Nongrowing-stock stumps, tops, and limbs Figure 9. Forest biomass on timberland by tree component, Illinois, What this means Statewide efforts to maintain forest area, including the Illinois Forestry Development Act and participation in the Conservation Reserve Program, and reversion of agricultural lands to forest have contributed to the increase of forest biomass across Illinois. As holders of the 11
18 Forest FEATURES Live Biomass on Timberland (oven-dry tons/acre) > <10 Nonforest Processing note: This map was produced by linking plot data to MODIS satellite pixels (250 m) using gradient nearest neighbor techniques. Figure 8. Distribution of live-tree and sapling biomass on timberland, Illinois,
19 Forest FEATURES majority of Illinois biomass, private forest landowners play an important role in sustaining this resource. Additionally, because most of forest biomass is found in the boles of growing-stock trees, the management of forests is closely tied to the dynamics of carbon storage and future wood availability. Given the increasing demand to manage biomass components for bioenergy and carbon, monitoring forest biomass will become more critical and 2010 (Fig. 11). White oak remains the most voluminous species on forest land, followed by silver maple, black oak, and northern red oak. In general, oaks are dominant throughout the State. Nineteen species of oak were recorded on forest land, accounting for 33 percent of total live-tree volume. Since 1998, there has been a notable increase in the volume of silver maple. Black oak represents the only top species decline. Species Composition Species Black oak Flowering dogwood Silver maple Shagbark hickory Slippery elm Background Forest composition is constantly changing. Influenced by the presence or absence of disturbances such as timber management, recreation, wildfire, prescribed burning, extreme weather, and invasive species, the current state of species composition is a reflection of historical and environmental trends within a forest. As a result, the composition of species in a forest is an indicator of forest health, growth, succession, and the need for stand improvement, i.e., management. Knowledge of the distribution of species within a stand allows for the measurement and prediction of change. What we found Illinois forest land contains just over 2 billion trees (greater than 1 inch in d.b.h.) representing 97 different tree species (common and scientific names of trees found in Illinois forests are detailed on the accompanying DVD on the inside back cover of this bulletin). Since 1998, the total number of trees has decreased by 18 percent, or nearly half a billion trees. American elm, hackberry, sugar maple, and black cherry have remained the most abundant species by number (Fig. 10). Other notable changes since 1998 include a decrease in the number of black oak trees and an increase in silver maple and green ash. In contrast to number of trees, the volume of live trees increased by 24 percent between Eastern hophornbeam Sassafras Green ash Black cherry Sugar maple Hackberry American elm Number of Trees (millions) Figure 10. Top 12 species on forest land by number of live trees and inventory year, Illinois. Species Bur oak 1998 Hackberry Sugar maple Sycamore Black walnut Green ash Shagbark hickory Eastern cottonwood Northern red oak Black oak Silver maple White oak ,000 Live Volume (million ft 3 ) Figure 11. Top 12 species on forest land by volume of live trees and inventory year, Illinois. 13
20 Forest FEATURES What this means The composition of Illinois forests and the dominance of individual tree species continues to evolve. While oaks are dominant in terms of volume, American elm, sugar maple, and a host of predominantly understory species are the most abundant species by number. Oak dominance in volume reflects large numbers of mature, overstory trees and little oak regeneration in the understory. Disturbance, particularly from harvesting and fire management, promotes oak regeneration. The absence of disturbance has allowed shade-tolerant species to out-compete understory oaks. As oaks continue to senesce, mortality will create canopy gaps that will most likely be filled by maples and elms that now occupy the understory in large numbers. Forest Density Background The density of a forest indicates the current phase of stand development and has implications for diameter growth, tree mortality, and yield. Density is typically measured in terms of number of trees or basal area per unit area. Stocking, a relative measure of density, represents the degree of tree occupancy required to fully utilize the growth potential of the land. What we found While the density of Illinois forests experienced a period of increase following the 1985 inventory, the number of live trees per acre of timberland has steadily decreased since 1998 (Fig. 12). In contrast, the average volume of live trees per acre continues to increase; currently, total live tree volume is an estimated 1,799 cubic feet per acre (Fig. 13). Most of Illinois timberland is fully (42 percent) or moderately (41 percent) stocked (Fig. 14). Overstocked stands, which represent 5 percent of timberland, contain too many trees to support adequate tree growth and development. Poorly stocked stands that do not contain enough trees to fully utilize a site represent 10 percent of timberland. Density (trees per acre) Year Figure 12. Density of live trees on timberland by inventory year, Illinois. Live Tree Volume (ft 3 /acre) 2,000 1,800 1,600 1,400 1,200 1, Nonstocked Poorly stocked Year Figure 13. Live tree volume per acre on timberland by inventory year, Illinois. Timberland Area (%) Medium stocked Stocking Class Fully stocked Overstocked Figure 14. Area of timberland by stocking class and inventory year, Illinois. What this means Decreasing numbers of trees and increasing volume are indicative of a maturing forest resource. In the absence of natural or human disturbance, this trend can be expected to 14
21 Forest FEATURES continue until stands reach a state of senescence. Current stocking levels indicate adequate growing conditions, but also show a preponderance of fully stocked stands. As trees grow and put on additional volume, these stands will be expected to face an increased amount of stand stagnation issues, including density-induced mortality. Area of Forest Land (%) Diminishing Oaks, Maple Replacement Background As the most dominant forest type in the State, oaks play an important role in the ecology of Illinois forests. The broad range of tree species and the structural variation within these forests contributes to their importance as a reservoir for biological diversity. Many wildlife species are dependent on oak/hickory forests for the food and habitat they provide. What we found The oak/hickory forest-type group occupies 68 percent of forest land statewide. While the overall area of oak/ hickory is on the rise, increasing from 2.1 million in 1985 to 3.3 million in 2010, the age distribution of these stands has become increasingly uneven (Fig. 15). This uneven distribution also shows a continued decrease in the area of stands less than 20 years of age, indicating poor regeneration. Elms, ashes, and maples make up a large percentage of seedlings in the oak/hickory forest-type group (16 percent, 15 percent, and 9 percent, respectively). In comparison, oaks represent a much smaller component (8 percent). Of all oak seedlings, white oak, black oak, and shingle oak are the most abundant. Within the oak/ hickory forest-type group, ash, elm, and maple have substantially more seedlings per acre than oaks (Fig. 16). Similarly, oak saplings are far less abundant than other hardwoods, notably eclipsed by American elm and sugar maple (Fig. 17) Stand-age Class (years) Figure 15. Stand-age class distribution of the oak/hickory forest-type group by inventory year, Illinois. Species Black oak 2005 Shagbark hickory 2010 White oak Sugar maple White ash Black cherry American elm Sassafras Slippery elm Green ash Seedlings per Acre Figure 16. Seedlings per acre of forest land in the oak/hickory forest-type group by inventory year, Illinois. Species Silver maple 2005 Red maple 2010 Black oak White oak Shingle oak Shagbark hickory Slippery elm Black cherry Hackberry Eastern hophornbeam Sugar maple American elm Saplings per Acre Figure 17. Saplings per acre of forest land in the oak/hickory forest-type group by inventory year, Illinois. 15
22 Forest FEATURES Since 2005, soft maples have increased in the sapling to mid-diameter classes; this is due to growth of red maple saplings and silver maple pole- and sawtimber (Fig. 18). Conversely, white and red oaks have had minimal increases among all diameter classes. In addition to American elm, medium-diameter classes are presently dominated by other red oaks (including black oak and shingle oak), hard maples (primarily sugar maple), and select white oaks (white oak and bur oak), while the larger diameter classes consist mainly of oaks; 46 percent of trees greater than 11 inches d.b.h. are oak species (Fig. 19). Diameter Class (inches) Soft maple Hard maple Select white oaks Other white oaks Select red oaks Other red oaks Other eastern soft hardwoods What this means The growing extent of Illinois oak/hickory forests has been accompanied by an emerging disparity among age classes. Decreases in the frequency of beneficial disturbances, including timber management and prescribed fire, have contributed to suppression of oak seedlings and an increase in the abundance of non-oak seedlings and saplings. With an understory dominated by non-oak species such as American elm and sugar maple and relatively few oak saplings available to move into the medium-diameter classes, it is likely that there will be a successional change in species dominance. Oak stands may eventually be dominated by more shadetolerant species such as maples. Maintaining a healthy oak resource will be dependent on successful seedling regeneration and sapling development. Carbon Stocks Percent Change Figure 18. Change in the number of trees on forest land in the oak/hickory forest-type group by diameter class for selected species groups, Illinois, 2005 to Number of Trees (millions) 18 Select white oaks 16 Select red oaks 14 Other white oaks 12 Other red oaks Hard maple 10 Soft maple Diameter Class (inches) Figure 19. Number of trees on forest land in the oak/hickory forest-type group by diameter class for selected species groups, Illinois, Background Collectively, forest ecosystems represent the largest terrestrial carbon sink on earth. The accumulation of carbon in forests through sequestration helps to mitigate emissions of carbon dioxide to the atmosphere from sources such as forest fires and burning of fossil fuels. FIA does not directly measure forest carbon stocks. Instead, a combination of empirically derived carbon estimates (e.g., standing live trees) and models (e.g., carbon in soil organic matter based on stand age and forest type) are used to estimate Illinois forest carbon stocks. Estimation procedures are detailed by Smith et al. (2006). What we found Illinois forests currently contain more than million tons of carbon. At more than million tons, live trees and saplings represent the largest forest ecosystem carbon stock in the State, followed by soil organic matter (SOM) at million tons (Fig. 20). Within the live 16
23 Forest FEATURES tree and sapling pool, merchantable boles contain the bulk of carbon (~ 88 million tons) followed by coarse roots (~ 23 million tons) and tops and limbs (~ 20 million tons). Most of Illinois s forest carbon stocks are found in relatively young stands aged 41 to 80 years (Fig. 21). Early in stand development, most forest ecosystem carbon is in the SOM and belowground tree components. As forest stands mature, the ratio of aboveground to belowground carbon shifts and by age 41 to 60 years the aboveground components represent the majority of ecosystem carbon. This trend continues well into stand development as carbon accumulates in live and dead aboveground components. A look at carbon by foresttype group on a per-unit-area basis found that 7 of the 11 groups have between 60 to 80 tons of carbon per acre (Fig. 22). Despite the similarity in per-acre estimates, the distribution of forest carbon stocks by forest type is quite variable. In the loblolly/shortleaf pine group, for example, 64 percent (~ 45 tons) of forest carbon is in live biomass, whereas in the other exotic softwoods group, only 19 percent is in live biomass. 1% 3%5% 6% 2% 6% Carbon Stocks (million short tons) % 73% 47% 53% 51% 49% 56% 44% Aboveground Belowground Acres 59% 41% 62% 38% Stand-age Class (years) 2,000 1,800 1,600 1,400 1,200 1,000 Figure 21. Estimated aboveground and belowground carbon stocks on forest land by stand-age class, Illinois, Group Other hardwoods Exotic softwoods Nonstocked Oak/pine Oak/hickory White/red/jack pine Oak/gum/cypress Aspen/birch Loblolloy/shortleaf pine Elm/ash/cottonwood Maple/beech/birch Forest land Area (acres) C in live biomass C in dead wood C in litter C in soil Carbon Stocks (short tons per acre) 40% 28% 2% 7% Figure 22. Estimated carbon stocks per acre on forest land by forest-type group and carbon pool, Illinois, Live trees and saplings Saplings Soil organic matter Tops/branches Total understory Merchantable boles Standing dead Stumps Down dead Roots Litter Figure 20. Estimated carbon stocks on forest land by forest ecosystem component, Illinois, What this means Carbon stocks in Illinois forests have increased substantially over the last several decades. Most of the forest carbon in the State is found in relatively young stands dominated by moderately long-lived species. This suggests that Illinois forest carbon will continue to increase as stands mature and accumulate carbon in aboveground and belowground components. Given the age class structure and species composition of forests in Illinois, there are many opportunities to increase forest carbon stocks. Managing for carbon in combination with other land management objectives will require careful planning and creative silviculture beyond simply managing to maximize growth and yield. 17
24 Forest FEATURES Forest Ownership Background Forest ownership varies across Illinois, from the Shawnee National Forest to a family with several forested acres. Patterns of ownership are important because owners decide if and how forest resources are managed. By understanding forest owners, the forest conservation community can better help them meet their needs, and in so doing, help protect the State s forests for future generations. FIA conducts the National Woodland Owner Survey (NWOS) to better understand who owns the forest, why they own it, and how they use it (Butler 2008). Because NWOS is a separate and supplementary survey from traditional FIA plot measurement, estimates derived from the two surveys may not be exactly the same. An estimated 177,000 family forest owners retain 3.5 million forested acres across Illinois. Ownership is such that fewer individuals own greater parcels of forest land. Fifty-seven percent of family forest owners have between 1 and 9 acres of forest land. However, 56 percent of the land owned by family forest owners is in holdings of 50 acres or more; the average holding size is 20 acres (Fig. 24). The primary reasons for owning forest land are related to aesthetics, privacy, and land being associated with their home or cabin (Fig. 25). Although timber production is not a primary ownership objective of most family forest owners, 46 percent of land is owned by people who have commercially harvested trees. Eleven percent of family forest land is owned by people who have a written management plan and 23 percent is owned by people who have received management advice. What we found Area Owners Four out of every five acres of forest land in Illinois are privately owned. Of these private forest acres, most 93 percent are owned by families, individuals, and other unincorporated groups, collectively referred to as family forest owners (Fig. 23). Other types of private owners include corporations, Native American tribes, nongovernmental organizations, clubs, and partnerships. Publicly owned forest lands are administered by federal, state, county, and municipal agencies that manage the lands for multiple reasons, including water protection, timber production, and recreation. Percentage ,000+ Size of Family Forest Holdings (acres) Figure 24. Size of family forest holdings, Illinois, Owner Objective Aesthetics 6% 8% 4% 5% 77% Family Other Private Federal State Privacy Part of home or cabin Nature protection Family legacy Part of farm Owners Area Local Percentage Figure 25. Primary ownership objectives of family forest owners, Illinois, Figure 23. Distribution of forest land by public and private ownership, Illinois,
25 Forest FEATURES What this means Private forest owners, and in particular family forest owners, are the dominant type of forest ownership in Illinois, as they are in much of the eastern United States. Although individual decisions of the thousands of Illinois family forest owners will have a marginal impact on forest resources, their collective decisions will determine both the current and future state of Illinois forests. Policies and programs could be designed to meet the diverse situations and needs of these forest owners. Land-use Change Background The rising demand for residential development places increased pressure on forest ecosystems, which provide habitat for forest-dwelling species, protect drinking water, serve as buffers for estuarine species against sedimentation and nutrient enrichment, and offer economic and other benefits for humans (Claggett et al. 2004, Sprague et al. 2006). Urban development is occurring at a rapid pace and is predicted to nearly triple from 2000 to 2050 (Nowak et al. 2005). Although the statewide rates of development and population growth are below the national average, urban growth and sprawl continue to be a major threat to the Illinois forest land. FIA characterizes land using several broad land-use categories, including forest, agriculture, and developed land. The conversion of forest land to other uses is referred to as gross forest loss, and the conversion of nonforest land to forest is known as gross forest gain. The magnitude of the difference between gross loss and gain is defined as net forest change. By comparing land use on current inventory plots with land use recorded for the same plots during the previous inventory, we can characterize forest land-use change dynamics. Understanding land-use change dynamics helps land managers make informed policy decisions. What we found Land in Illinois is dominated by pasture and cropland. These agricultural land uses, along with urban and other nonforest land use cover 86 percent of the State s land area (Fig. 26). Commercial and residential development is concentrated around larger cities, including Chicago (northeast), Alton (southeast), and Springfield, Decatur, and Peoria (central). Most plots in Illinois either remained forested or stayed nonforest (12 percent and 86 percent respectively), and only the remaining 2 percent of plots experienced either a forest loss or gain from 2005 to 2010 (Fig. 26). In terms of area, Illinois lost 177,000 acres of forest land from 2005 to 2010, which was offset by a gain of over 393,000 during the same period (Fig. 27). This resulted in a net forest gain of 216,000 acres, or a 5 percent increase in the total area of forest land. Sixty-five percent of the gross increase in forest land in Illinois is agricultural land converting to forest. In some areas of the State, especially in land adjacent to streams, trees have been planted to protect water resources. In other areas, pasture and cropland have been left idle and are regenerating naturally. Forty-six percent of the forest land lost was converted to agriculture, which was slightly more than that which was converted to developed uses (39 percent). Unlike forest changes into and out of agricultural land, forest conversion to development is likely a permanent loss. 12% 1% 1% 86% Figure 26. Land-use change, Illinois, 2005 to Nonforest in 2005 and 2010 Forest in 2005 and 2010 Forest gain Forest loss 19
26 20 Forest FEATURES FIA data can be used to characterize forest land that has been lost to other land uses to determine if it differs from the characteristics of forest land in all of Illinois. The forests of Illinois are dominated by stands in the large diameter size class; this class is also the most prevalent among forested plots that converted to nonforest land. Forest land that was gained, however, had a greater proportion of small diameter stands (34 percent) than the overall population (8 percent). A large portion of this newly acquired forest land may be the result of reforestation efforts or forest succession in formerly agricultural areas. There is no strong pattern in the spatial distribution of forest losses (Fig. 28). Gains in forest land generally correspond with the established distribution of forest land or are around streams and rivers. One of the greatest concentrations of forest gain occurs in the southern portion of Illinois, where there are a number of State and Federal landholdings. Forest cover is highest in this area and forest gain appears to coincide with areas designated as high priority according to the Illinois statewide forest resource assessment (IL DNR 2010). What it means As agriculture is the dominant land use in Illinois, gains and losses in pasture and cropland appear to drive landuse change dynamics in the State. Gains in forest land likely come from reverting agricultural land, especially land in close proximity to streams. Agroforestry efforts promote the maintenance of tree cover in the form of windbreaks and forest buffers that help sustain a high agricultural output while conserving and protecting Illinois soil and water resources. There has been a concerted effort in the State s public and private sectors to prioritize the reforestation of riparian areas, which often connect to form wildlife corridors and allow for greater species movement. Loss of forest land was generally due to conversion to agricultural uses and may be a result of increased demand for agricultural-based biofuels such as ethanol, of which Illinois is a primary producer (Schnepf 2010). With increased interest in domestic fuel sources, there may be increased demand for suitable cropland. Overall, gains in forest land have outpaced forest losses and Illinois appears to be moving toward greater conservation and valuation of the State s forest resources. ( ( ( ( ( ( ( ( ( ( ( ( ( ( ( ( ( ( ( ( ( ( ( ( ( ( ( ( ( ( ( ( ( ( ( ( ( ( ( ( ( ( ( ( ( ( ( ( ( ( ( ( ( ( ( ( ( ( ( ( ( ( ( ( ( ( ( ( ( ( ( ( ( ( ( ( ( ( ( ( ( ( ( ( ( ( ( ( ( ( ( ( ( ( ( ( ( ( ( ( ( ( ( ( ( ( ( ( ( ( ( ( ( ( ( ( ( ( ( ( ( ( ( ( ( ( ( ( ( ( ( ( ( ( ( ( ( ( ( ( ( ( ( ( ( ( ( ( ( ( ( ( ( ( ( ( ( ( ( ( ( ( ( ( ( ( ( ( ( ( ( ( ( ( ( ( ( ( ( ( ( ( ( ( ( ( ( ( ( ( ( ( ( ( ( ( ( ( ( ( ( ( ( ( ( ( ( ( ( ( ( ( ( ( ( ( ( ( ( ( ( ( ( ( ( ( ( ( ( ( ( ( ( ( ( ( ( ( ( ( ( ( ( ( ( ( ( ( ( ( ( ( ( ( ( ( ( ( ( ( ( ( ( ( ( ( ( ( ( ( ( ( ( ( ( ( ( ( ( ( ( ( ( ( ( ( ( ( ( ( ( ( ( ( ( ( ( ( ( ( ( ( ( ( ( ( ( ( ( ( ( ( ( ( ( ( ( ( ( ( ( ( ( ( ( ( ( ( ( ( ( ( ( ( ( ( ( ( ( ( ( ( ( ( ( ( ( ( ( ( ( ( ( ( ( ( ( ( ( ( ( ( ( ( ( ( ( ( ( ( ( ( ( ( ( ( ( ( ( ( ( ( ( ( ( ( ( ( ( ( ( ( ( ( ( ( ( ( ( ( ( ( ( ( ( ( ( ( ( ( ( ( ( ( ( ( ( ( ( ( ( ( ( ( ( ( ( ( ( ( ( ( ( ( ( ( ( ( ( ( ( ( ( ( ( ( ( ( ( ( ( ( ( ( ( ( ( ( ( ( ( ( ( ( ( ( ( ( ( ( ( ( ( ( ( ( ( ( ( ( ( ( ( ( ( ( ( ( ( ( ( ( ( ( ( ( ( ( ( ( ( ( ( ( ( ( ( ( ( ( ( ( ( ( ( ( ( ( ( ( ( ( ( ( ( ( ( ( ( ( ( ( ( ( ( ( ( ( ( ( ( ( ( ( ( ( ( ( ( ( ( ( ( ( ( ( ( ( ( ( ( ( ( ( ( ( ( ( ( ( ( ( ( ( ( ( ( ( ( ( ( ( ( ( ( ( ( ( ( ( ( ( ( ( ( ( ( ( ( ( ( ( ( ( ( ( ( ( ( ( ( ( ( ( ( ( ( ( ( ( ( ( ( ( ( ( ( ( ( ( ( ( ( ( ( ( ( ( ( ( ( ( ( ( ( ( ( ( ( ( ( ( ( ( ( ( ( ( ( ( ( ( ( ( ( ( ( ( ( ( ( ( ( ( ( ( ( ( ( ( ( ( ( ( ( ( ( ( ( ( ( ( ( ( ( ( ( ( ( ( ( ( Figure 28. Distribution of forest gain and loss by plot location, Illinois 2005 to 2010 (plot locations are approximate). Forest gain Forest loss Remained forest Remained nonforest Remeasured FIA Plots Figure 27. Forest gain and forest loss by land-use category, Illinois, 2005 to Agriculture Developed Other nonforest Forest loss Forest gain Forest Land Area (thousand acres) Type of Change
27 Forest FEATURES Forest Growth Background A forest stand s capacity for growth, i.e., for trees to increase in volume, is an indication of the overall condition of the stand and more specifically of tree vigor, forest health, and successional stage. Forest growth is measured as average annual net growth, where net growth is equivalent to gross growth minus mortality. Average annual net growth represents an average for the annual change in volume between previous and current inventories for individual tally trees before accounting for the impact of removals. Species Group 1985 Ash 1998 Black walnut Cottonwood and aspen Hickory Other red oaks Other eastern soft hwds Select white oaks Soft maple Average Annual Growth (million ft 3 /year) Figure 30. Average annual net growth of growing stock on timberland for the top eight species groups by inventory year, Illinois. What we found While there was a sharp rise and fall between 1998 and 2010, the overall rate of growing-stock growth on Illinois timberland has steadily increasing since 1962 (Fig. 29). Ninety-eight percent of net growth resulted from growth in hardwoods. The highest growth rates occurred in the soft maple (primarily due to silver maple), select white oaks, other eastern soft hardwoods, and other red oaks species groups (Fig. 30). Collectively, Illinois major oak species (white, northern red, bur, and black) account for 18 percent of total growth; this represents a decrease from 1998 and 2005 when oaks represented 23 percent of total growth. The bulk of growth occurred in largediameter stands (57 percent); 98 percent of net growth in white, northern red, bur, and black oaks was in largediameter stands. Growth-to-volume ratios greatly increased in 2005, particularly for eastern cottonwood, bur oak, northern red oak, and silver maple, which had ratios greater than 6 percent (Fig. 31). By 2010, growth-to-volume ratios for individual species had fallen below 6 percent, averaging 3 percent statewide. While 2010 estimates of growth-to-volume ratio were less than 4 percent for most species, the ratios for shingle oak, black walnut, and eastern cottonwood totaled 5 percent (Fig. 31). Species Northern red oak Black oak White oak Bur oak American sycamore Average Annual Growth (million ft 3 /yr) Year Figure 29. Average annual net growth of growing stock on timberland by inventory year, Illinois. Green ash Silver maple Estn cottonwood Black walnut Shingle oak Ratio of Growth to Volume (%) Figure 31. Average annual net volume growth expressed as a percent of total growing-stock volume on timberland for selected species by inventory year, Illinois. 21
28 Forest FEATURES What this means Illinois trend of increasing tree growth is an indication of a sustainable forest resource. The rise in the 2005 estimate of net growth is due in part to a lag in the detection of lands that reverted from nonforest to forest during the late 1990s and early 2000s; this lag largely resulted from NRS-FIA s use of enhanced imagery and geographic information systems technology that began in 2005, which allowed for better detection of potentially forested plots in the office and thus, more plots were sent out to the field for measurement. As a result, additional forested plots were identified and higher estimates of growth were recorded. While the rate of growth on Illinois forests is generally increasing, the preponderance of growth is occurring within large-diameter stands, which is an indication that mature trees are continuing to add volume. While sustained growth of large-diameter oaks increases its availability for commercial wood products, growth of other species in a variety of size classes suggests that the oak resource may not continue its current dominance. Tree Mortality Background Forest health, vigor, and the rate of accretion and depletion are all influenced by tree mortality. Mortality can be caused by insects, disease, adverse weather, succession, competition, fire, old age, or human or animal activity; however, it is often the result of a combination of these factors. Tree volume lost as a result of land clearing or harvesting is not included in mortality estimates. Growing-stock mortality estimates represent the average cubic-foot volume of sound wood in growing-stock trees that died each year as an average for the years between inventories. What we found The rate of growing-stock mortality has continued to grow since the 1960s, reaching an estimated 91.8 million cubic feet per year, or 1.3 percent of total growingstock volume in 2010 (Fig. 32). Seventy-seven percent of mortality occurred within large-diameter stands; 20 percent of large-diameter mortality is due to mortality of white, northern red, bur, and black oak. The other eastern soft hardwoods group (American and slippery elm) had the highest rate of mortality, followed by the other red oaks (black oak) and soft maple (red and silver maple) (Fig. 33). Notable trends include the sustained increase in ash and other red oak mortality following 1985 and a large increase in mortality of select red oaks (northern red oak) since Another metric indicative of mortality is total growing-stock volume mortality on timberland as a percent of total statewide growingstock volume on timberland. Sixty-nine percent of Illinois trees had mortality to volume ratios less than 1 percent. Slippery elm and American elm had the highest mortality-to-volume ratios, eclipsing all other species by a large margin (Fig. 34). The ratio of slippery elm mortality to volume increased twofold between 2005 and In contrast, red maple mortality decreased by 72 percent since Ratio of Mortality to Volume (%) Year Figure 32. Average annual mortality of growing stock as a percentage of total growing-stock volume on timberland by inventory year, Illinois. 22
29 Forest FEATURES Species Group Other eastern hard hardwoods Hickory Select white oaks Ash Select red oaks Soft maple Other red oaks Other eastern soft hardwoods Average Annual Mortality (million ft 3 /year) Figure 33. Average annual mortality of growing stock on timberland for the top eight species groups by inventory year, Illinois. What this means While tree mortality across Illinois continues to rise, the rate of increase may be slowing over the last decade. High mortality within large-diameter stands and particularly among oaks is an indication of senescence. Increasing rates of mortality among ash species is likely reflective of emerald ash borer activity. Mortality rates for most species were low, however, the high mortality rates of slippery and American elm indicate a yearly loss greater than 5 percent of statewide volume. Tree mortality is a crucial component of overall forest health and should continue to be monitored in the future. Species Slippery elm American elm Boxelder Red maple White ash Northern red oak Green ash 1985 Black oak 1998 Pin oak Silver maple Ratio of Mortality to Volume (%) Figure 34. Average annual mortality of growing stock as a percentage of total growing-stock volume on timberland by inventory year for selected species, Illinois. Tree Removals Background One tool that can be used to analyze forest sustainability is to assess change in tree volume as a result of removals. Removals include harvested trees and trees lost due to a change in the definition of land use, i.e., timberland reverting to a nonforest use or timberland reverting to reserved land. Changes in the quantity of growing stock removed helps to identify trends in land-use change and forest management. Because removals are usually recorded on a limited number of plots, the estimates for removals show greater variance than those for growth, mortality, or area. Like forest growth and mortality, the rate at which trees are removed represents the annual average of removals that occurred between the previous and current inventories. What we found Growing-stock removal rates began a rapid climb during the 1960s, reaching a peak in the early 1980s (Fig. 35). Since 1985, the rate at which growing stock has been removed from timberland has decreased. Growing stock 23
30 Forest FEATURES was removed at an average of 66.1 million cubic feet per year in 2010; of this, 29 percent of removals occurred as a result of a change in land use. Hardwoods account for the majority of removals; softwood removals total 2.8 million cubic feet and represent only 4 percent of total removals. The largest percent of removals occurred in the select white oaks species group, followed by the other red oaks and other eastern soft hardwoods (Fig. 36). As a percentage of total volume, the statewide removals rate is 0.9 percent (Fig. 35). By species, bur oak had the highest removal rate relative to volume (5.2 percent), followed by eastern white pine at 2.3 percent (Fig. 37). Species Green ash Silver maple Northern red oak White ash Black walnut Black cherry Eastern cottonwood White oak Yellow-poplar Black oak Eastern white pine Bur oak Ratio of Removals to Volume (%) Year Figure 35. Average annual removals of growing stock as a percentage of total growing-stock volume on timberland by inventory year, Illinois. Species Group Hickory Select red oaks 2010 Cottonwood and aspen Soft maple Other eastern hard hardwoods Other eastern soft hardwoods What this means Ratio of Removals to Volume (%) Figure 37. Average annual removals of growing stock as a percentage of total growing-stock volume on timberland by inventory year for selected species, Illinois. Removal rates are indicative of both harvest and landuse change. The average annual rate of removals (0.9 percent) is less than that of mortality (1.3 percent). Net growth averages 3.0 percent, which far exceeds that of removals and mortality. From a statewide perspective, it appears as though removals are in balance with forest growth and mortality, such that total volumes continue to increase. However, this may not be the case at smaller scales (e.g., county) or for specific species. In these cases, removal rates should be monitored and evaluated on a case by case basis. Other red oaks Select white oaks Average Annual Removals (million ft 3 /yr) Figure 36. Average annual removals of growing stock on timberland for the top eight species groups by inventory year, Illinois. 24

31 Forest Indicators Illinois landscape. Photo by Emily Crumley, used with permission. 25
32 Forest INDICATORS Down Woody Materials Background A 19% 4% 2% 75% B 24% 2% 7% 22% Down woody materials, including fallen trees and branches, fill a critical ecological niche in Illinois forests. They provide valuable wildlife habitat in the form of coarse woody debris, contribute to forest fire hazards via surface woody fuels, and store carbon in the form of slowly decaying large logs. Diameter Class (inches) Decay Class % What we found The fuel loadings and subsequent fire hazards of dead and down woody material in Illinois forests are relatively low, especially when compared with the nearby states of Indiana and Missouri (Fig. 38). The size distribution of coarse woody debris (diameter larger than 3 inches) is dominated (75 percent) by pieces less than 8 inches in diameter (Fig. 39A). Moderately decayed coarse woody pieces (decay classes 2, 3, and 4) constituted 91 percent of the decay class distribution (Fig. 39B). The largest carbon stocks of coarse woody debris ( 3 tons per acre) appear to be in understocked stands (live tree basal area 30 to 60 square feet per acre), albeit with tremendous variability (Fig. 40). Figure 39. Mean distribution of coarse woody debris (pieces per acre) by (A) size class (inches); and (B) decay class (1 = least decayed, 5 = most decayed) on forest land, Illinois, Coarse Woody Debris Carbon (tons/acre) Basal Area (ft 2 /acre) Mean Fuel Loadings (tons/acre) 5.0 Indiana 4.5 Illinois 4.0 Missouri hr 10-hr 100-hr 1,000+-hr Fuel-hour Classes Figure 38. Mean fuel loadings on forest land by fuel-hour class, Indiana, Illinois, and Missouri, 2008 (error bars represent a 68-percent confidence interval). Figure 40. Mean carbon stock of coarse woody debris on forest land by stand live-tree basal area, Illinois, 2008 (error bars represent a 68-percent confidence interval). What this means The fuel loadings of downed woody material can be considered a forest health hazard only in times of drought or in isolated stands with excessive tree mortality. The ecosystem services (e.g., habitat for fauna or shade for tree regeneration) provided by down woody materials exceeds any negative forest health aspects. The population of coarse woody debris across Illinois consists mostly of small pieces that are moderately decayed. As a result, coarse woody debris constitutes a small, albeit important carbon stock and source of wildlife habitat across Illinois forests. Given that the largest coarse 26
33 Forest INDICATORS woody debris carbon stocks were found in understocked forest stands, perhaps disturbances play a role in dead wood accumulation. The distribution of down dead fuel loadings in Illinois forests appears consistent with nearby states. Forest Patterns Background The fragmentation of forest land continues to be a major ecological issue worldwide. Fragmentation is the process by which large, contiguous tracts of forest land are broken down into smaller, more isolated forest patches surrounded by nonforest land uses, such as agriculture or urban development. As a result, there is a loss of interior forest conditions and an increase in edge habitat. This has many negative effects on remaining vegetation and interior-dwelling wildlife species, e.g., loss of native species and increased populations of invasive species. Generally speaking, large patches of forest are more desirable because they contain continuous habitat, while patches that are too small consist entirely of edge habitat. classified as being within 90 meters (approximately 300 feet) of a developed edge or greater than 90 meters (approximately 300 feet) from a developed edge. Forest land represents about 16 percent of the total land in Illinois. Sixty-nine percent of forest land is subject to edge effects and lacks interior forest conditions. FIA inventory unit 1 is 35 percent forested and nearly half of this forest land (46 percent) is classified as interior, which is critical for maintaining biodiversity and healthy populations of native plants and wildlife (Fig. 42). Unfortunately, this is the smallest unit in the State, comprising only 11 percent of total land area. FIA inventory units 2 and 3, on the other hand, include 89 percent of the total land area and most of the State s forest land (76 percent). However, the majority of this forest land is classified as edge, 72 and 75 percent in Units 2 and 3, respectively. Land Cover Developed Natural barren Forest Natural nonforest vegetation Agriculture Water What we found The National Land Cover Database (NLCD) 2006 (Xian et al. 2009) raster dataset was reclassified to create a six-class land-cover map of Illinois (Fig. 41). Forest pixels were then characterized based on their proximity to developed edges, i.e., edges due to urban development and agricultural land uses. Environmental differences at forest edges due to urban development, agriculture, or barren land uses, also referred to as edge effects, can penetrate a forest patch for tens of meters (Collinge 1996). A commonly used threshold for edge effects is 30 to 90 meters or approximately 100 to 300 feet, after which interior forest conditions begin (Riemann et al. 2009). Using an aggressive definition, forest pixels were Fig. 41. Land cover classification (derived from NLCD), Illinois,
 by FIA inventory unit, Illinois, 2006.")
34 Forest INDICATORS Forest Edge Status Forest < 90 m from a developed edge Forest > 90 m from a developed edge Fig. 42. Forest edge classification (derived from NLCD) by FIA inventory unit, Illinois, What this means While forest land in Illinois is a relatively small portion of the land base, how this forest land is arranged across the landscape affects ecological processes. The higher proportion of edge than interior forest indicates that forest land in Illinois is heavily fragmented. Interior forest is largely found along stream and river corridors; however, the overall forest pattern is not consistent across the State. Larger tracts of contiguous forest land are concentrated in the southern part of the State, while smaller patches of forest land are found in the central to eastern portions. The high degree of fragmentation found in the central and northern tiers of the State has serious ecological implications for forest patches, such as higher susceptibility to invasion by invasive species and other negative edge effects. Emerald Ash Borer Background The emerald ash borer (Agrilus planipennis; EAB) is a wood-boring beetle native to Asia. In North America, EAB has only been identified as a pest of ash and all native ash species appear to be susceptible (Poland and McCullough 2006). Trees and branches as small as 1 inch in diameter have been attacked, and while stressed trees may be initially preferred, healthy trees are also susceptible (Cappaert et al. 2005). In areas with a high density of EAB, tree mortality generally occurs 1 to 2 years after infestation for small trees and after 3 to 4 years for large trees (Poland and McCullough 2006). Spread of EAB has been facilitated by human transportation of infested ash material. EAB is believed to have been present for 3 to 5 years prior to its discovery in northeastern Illinois in EAB was initially limited to two northeastern counties, however, it was confirmed throughout the northeastern quarter of the State by the end of What we found Illinois forest land contains an estimated million ash trees (greater than 1-inch diameter) that account for million cubic feet of volume. Ash is distributed across much of the State with dense pockets of ash in the southern tier (Fig. 43). Ash is present on 2.1 million acres, or 44 percent of Illinois forest land, but it is rarely the most abundant species in a stand (Fig. 44). Instead, ash generally makes up less than 25 percent of total live tree basal area. Statewide estimates of ash mortality more than tripled between 1985 and 1998, and more than quadrupled by 2010 (Fig. 45). Similarly, the ratio of ash mortality to volume increased from 0.58 percent in 1985 to 1.77 percent in Ash mortality was recorded across most of Illinois, however, higher concentrations occurred in the central and southern tiers (Fig. 46). 28
35 Forest INDICATORS Ash Basal Area (ft 2 /acre) > <3 Nonforest Ash Mortality (million ft 3 ) Year Figure 45. Mortality of ash growing stock on timberland by inventory year, Illinois. Processing note: This map was produced by linking plot data to MODIS satellite pixels (250 m) using gradient nearest neighbor techniques. Figure 43. Ash density on forest land, Illinois, Percent Ash Mortality (as a % of total mortality) <10 Total Forest Land (%) No mortality Ash BA per Acre/Total Live BA per Acre (%) Figure 44. Presence of ash on forest land, as a percentage of total live treebasal area (BA) by inventory year, Illinois. Figure 46. Ash mortality expressed as a percent of total tree mortality on forest land by county, Illinois, What this means Ash is an abundant species in Illinois woodland and riparian forests, as well as an important component of urban and suburban forests. While ash decline and dieback are present in Illinois, EAB is likely to be a significant contributor to ash mortality, particularly in the northeast. High ash mortality in southern Illinois 29
36 Forest INDICATORS could indicate further spread of EAB beyond its currently identified distribution. Ash mortality and the continued identification of new EAB infestations will have a large impact on the future makeup of Illinois forests. Continued monitoring of this resource will help identify the long-term impacts of EAB. Additionally, efforts to slow the spread of EAB will be improved by discontinuing the transportation of firewood. Vegetative Diversity Species Hackberry Slippery elm Summer grape Multiflora rose Pignut hickory Black oak White oak Sassafras Black cherry Green ash Eastern poison ivy Virginia creeper Occurrence (% of plots) Figure 47. Presence of the 12 most common vascular plant species, Illinois, Background Vascular plant diversity and abundance are important indicators of the health of forest ecosystems. The overall species composition and structure of forest stands often reflects current environmental conditions, both favorable and unfavorable. Studying the status and trends in plant species richness and abundance provides information on the availability of wildlife habitat, carbon sequestration, fuel loadings, and chronic stresses such as site degradation, climate change, and pollution. Such disturbances may lead to an increase in opportunistic species, including nonnative invasive plants and even native species that can become aggressive invaders. What we found During the 2010 inventory, 734 different species of vascular plants were recorded in Illinois; there was an average of 54 species per plot. The most common species were Virginia creeper (Parthenocissus quinquefolia), eastern poison ivy (Toxicodendron radicans), and green ash (Fraxinus pennsylvanica), each occurring on more than 80 percent of plots (Fig. 47). Ninety percent of species were native to Illinois, 6 percent were introduced, and 4 percent were unknown due to limited identification beyond the genus level (Fig. 48). Forb/ herb was the most common growth form, followed by tree and graminoid (Fig. 49). 11% 6% 4% 90% 9% 6% 5% 34% 35% Native Unknown Introduced Figure 48. Distribution of vascular plant species by origin, Illinois, Forb/herb Tree Graminoid Vine Shrub Subshrub Figure 49. Distribution of vascular plant species by growth habit, Illinois,
37 31 Forest INDICATORS What this means Illinois forests support a multitude of vascular plant species. The considerable number of identified species and the high species per plot average indicate a strong level of diversity across the State. Species with the highest occurrence, e.g., Virginia creeper, poison ivy, and green ash, are associated with the oak/hickory forest-type group, which is the predominant forest-type group in Illinois. The sustained prevalence of Virginia creeper may allude to a potential forest health concern. While it provides food and cover for wildlife and has erosion control benefits, the rapid growth of this vine and its ability to crowd other plants can also cause it to be deemed a weed. Though most identified species are native to Illinois, invasive plant species were also a factor (invasive species will be discussed in more detail in the following section). Continued plant diversity inventories may reveal more about the status of forest vegetation and the impacts of fragmentation and invasive species. Invasive Plants Background Invasive plants are becoming more prevalent in forest ecosystems. Their abundance in introduced environments is attributed to high adaptability, the availability of disturbed habitats, and a lack of natural enemies, which allows them to out-compete and displace native species (Pimentel et al. 2000). Invasive plants are a concern because they alter natural plant communities and processes, threaten biodiversity, and contribute to a decrease in sustainability, productivity, and wildlife habitat. FIA assesses invasive plants in three ways. First, data on all vascular plants, including invasives, is collected on Phase 3 (P3) vegetative diversity plots. Secondly, 20 percent of Phase 2 (P2) plots are deemed invasive plots on which the presence/absence of 43 common invasive plant species is recorded. Lastly, information on invasive trees is collected on all P2 plots. What we found Twenty-six species of invasive plants were found in Illinois (Fig. 50, Table 1). Some plots had as many as 11 different invasive species, but 60 percent of plots had only one or two different species (Fig. 51). Black locust, multiflora rose, and Japanese honeysuckle were the most commonly occurring invasive species (Fig. 52). While black locust had a higher frequency of occurrence per plot, multiflora rose was more widely distributed across Illinois (Fig. 53). Japanese honeysuckle was only found in the southern half of the State. Figure 50. Approximate location of plots with invasive plant species on forest land, Illinois, Distribution of Invasive Species Plots P2 plot P3 plot
38 Forest INDICATORS Table 1. List of invasive plants surveyed on forest land, in order of occurrence, Illinois, Common Name Genus species Multiflora rose Rosa multiflora Japanese honeysuckle Lonicera japonica Amur honeysuckle Lonicera maackii Autumn olive Elaeagnus umbellata Nepalese browntop Microstegium vimineum Garlic mustard Alliaria petiolata Reed canarygrass Phalaris arundinacea Black locust Robinia pseudoacacia Common buckthorn Rhamnus cathartica Honeysuckle Lonicera spp. Tatarian honeysuckle Lonicera tatarica Morrow s honeysuckle Lonicera morrowii Japanese barberry Berberis thunbergii Glossy buckthorn Frangula alnus Bull thistle Cirsium vulgare Canada thistle Cirsium arvense Creeping jenny Lysimachia nummularia Oriental bittersweet Celastrus orbiculatus Siberian elm Ulmus pumila Ailanthus Ailanthus altissima Dame s rocket Hesperis matronalis European cranberrybush Viburnum opulus European privet Ligustrum vulgare Norway maple Acer platanoides Russian olive Elaeagnus angustifolia Showy fly honeysuckle Lonicera x.bella Number of Plots Number of Species per Plot Figure 51. Distribution of invasive plants observed on P2 and P3 plots (n=196), Illinois, Invasive Species Black locust Multiflora rose Species Reed canarygrass Garlic mustard Nepalese browntop Autumn olive Amur honeysuckle Japanese honeysuckle Multiflora rose Black locust Occurrence (%) Figure 52. Occurrence of the eight most common invasive plants on P2 and P3 plots, Illinois, Japanese honeysuckle Figure 53. Distribution of the three most common invasive plants on P2 and P3 plots, Illinois, 2010 (plot locations are approximate). What this means Although invasive plants represent a minority of species in Illinois forests, they are widely distributed across the State. The extent to which these species cause harm has not yet been determined. As spread of these species continues, the number and abundance of native plants species will decline, resulting in a loss of overall species diversity and a reduction in the value and health Illinois forests. 32
39 Forest INDICATORS Forest Age and Size Background Forests provide habitat for numerous species of mammals, birds, reptiles, and amphibians, as well as for fish, invertebrates, and plants. Forest composition and structure affect the suitability of habitat for each species. Illinois Wildlife Action Plan (WAP) identifies those species in greatest need of conservation (SGNC) and threats to their habitats (IL DNR 2005). Many SGNC are associated with forest habitats, including the silvery salamander (Ambystoma platineum), which occupies ephemeral pools within forests, and the Indiana bat (Myotis sodalis), which relies on forested riparian areas. Some SGNC, such as the American woodcock (Scolopax minor) and Bewick s wren (Thryomanes bewickii), depend upon early successional forests. Yet others, including the cerulean warbler (Dendroica cerulea), require old growth forests or interior forests. Many species inhabit the ecotone (edge) between different forest stages, and many require multiple structural stages of forests to meet different phases of their life history needs. Abundance and trends in these structural and successional stages serve as indicators of population carrying capacity for wildlife species (Hunter et al. 2001). Timberland Area (%) Large diameter Small diameter Medium diameter Nonstocked Year Figure 54. Area of timberland by stand size and inventory year, Illinois. Timberland Area (%) years years years years years years 120+ years Year Figure 55. Area of timberland by stand age and inventory year, Illinois. What we found While the extent of the large diameter stand-size class has increased steadily since 1948, the medium diameter class has remained fairly stable (Fig. 54). The small diameter class decreased in area from 1948 through the late 1990s, after which a modest increase occurred. Since 1962, timberland area under 40 years of age has decreased steadily, while area in the 41 to 80 year class has increased (Fig. 55). Compared with the mid 1980s and late 1990s, only about half as much timberland in 2010 is older than 100 years. In Illinois, all three stand-size classes contain forests of multiple ages. The medium diameter class is predominated by forests of 21 to 60 years of age, with lower abundance of both young and old forest. As expected, small diameter forests are comprised largely of young forests (0 to 20 years) with sharply decreasing abundance as stand age increases (Fig. 56). The opposite trend is not seen for large diameter stand-size classes, where forests of 41 to 60 and 61 to 80 years of age predominate over both younger and older forests. 33
40 Forest INDICATORS Foret Land Area (thousand acres) 1,400 1,200 1, Small diameter Medium diameter Large diameter What this means Stand Age (years) Figure 56. Area of forest land by stand age and stand size, Illinois, Although the area of the large diameter stand-size class increased markedly over the past six decades, timberland over 100 years of age has not. Eighty percent of the large diameter class is less than 80 years of age; only 7 percent is older than 100 years. The small diameter class increased in extent since the late 1990s, but is still lower than indicated by historical estimates. Stand size and stand age are indicators of forest structural/ successional stage. It is interesting to see the presence of some small diameter forest in older stand ages and the occurrence of some large diameter forest in younger stand ages. The latter combination can occur when a few huge trees and numerous smaller trees occur in the same vicinity, although rare coding anomalies also may result in unexpected combinations. Such a mixture of different aged or sized trees provides a vertical diversity of vegetation structure that can enhance habitat conditions for some species. Though seemingly contradictory, there is a need to maintain forest conditions in both smaller and larger structural stages to maintain both early and late successional habitats for all forest-associated species. Managing forest composition and structure in a variety of conditions should conserve habitat and viable populations of many forest-associated wildlife species. Standing Dead Trees Background Specific habitat features such as nesting cavities and standing dead trees (at least 5 inches d.b.h.) provide critical habitat components for many forest-associated wildlife species. Standing dead trees contain significantly more cavities than live trees (Fan et al. 2003); those that are large enough to meet habitat requirements for wildlife are referred to as snags. The state and federally endangered Indiana bat, which has been recorded in 28 Illinois counties, roosts primarily in the cavities and under exfoliating bark of snags in oak and hickory species groups. Standing dead trees serve as important indicators not only of wildlife habitat, but also for past mortality events and carbon storage. In addition, they can be sources of down woody material, which also provide habitat features for wildlife. The number and density of standing dead trees, together with decay classes, species, and sizes, define an important wildlife habitat feature across Illinois forests. What we found FIA collects data on standing dead trees of numerous species and sizes in varying stages of decay. Currently, more than 56.5 million standing dead trees are present on Illinois forest land. This equates to an overall density of 11.6 standing dead trees per acre of forest land, with slightly higher densities on private (11.8) than on public (10.7) forest land. Eleven species groups each contributed more than 1 million standing dead trees, with the top group, the other eastern soft hardwoods, exceeding 22 million, nearly half of which were American elm (Fig. 57). Relative to the total number of live trees in each species group, seven species groups exceeded 10 standing dead trees per 100 live trees (of at least 5 inch d.b.h.), with the eastern white and red pine species group topping the list at over 22 standing dead trees per 100 live trees (Fig. 58). Seventy-seven percent of standing dead trees were smaller than 11 inches d.b.h., with 39 percent between 5 and 6.9 inches d.b.h. (Fig. 59). More than 62 percent of all standing dead trees were 34
41 Forest INDICATORS in the two classes of least decay; the class of most decay ( no evidence of branches remain ) contained the fewest standing dead trees (5 percent). The other eastern soft hardwoods species group contained the largest number of standing dead trees, predominately elms, but eastern white and red pine species had the highest density of standing dead trees per 100 live trees. Species Group Other white oaks Cottonwood and aspen Select red oaks Hickory Eastern white and red pine Soft maple Select white oaks Eastern noncommercial hardwoods Other red oaks Ash Other eastern hard hardwoods Other eastern soft hardwoods Species Group Basswood Soft maple Select white oaks Select red oaks Other red oaks Other white oaks Eastern noncommercial hardwoods Ash Other eastern soft hardwoods Cottonwood and aspen Other eastern hard hardwoods Eastern white and red pine Standing Dead Trees (millions) Figure 57. Number of standing dead trees on forest land by species group, Illinois, Number of Standing Dead Trees per 100 Live Trees Figure 58. Number of standing dead trees per 100 live trees on forest land by species group, Illinois, Diameter Class (inches) No evidence of branches Few or no limb stubs Only limb stubs Few limbs and no fine branches All limbs and branches Standing Dead Trees (millions) Figure 59. Distribution of standing dead trees on forest land by diameter and decay class, Illinois, What this means Snags and standing dead trees result from a variety of potential causes, including diseases, insects, weather damage, fire, flooding, drought, and competition. Compared to live trees, the number of standing dead trees is small, but they contain significantly more cavities per tree than occur in live trees (Fan et al. 2003). They provide areas for foraging, nesting, roosting, hunting perches, and cavity excavation for wildlife, from primary colonizers such as insects, bacteria, and fungi to birds, mammals, and reptiles. Most cavity nesting birds are insectivores, which help to control insect populations. The availability of very large snags may be a limiting meso-scale habitat feature for some species of wildlife. Providing a variety of forest structural stages and retaining specific features such as snags on both private and public lands are ways that forest managers maintain the abundance and quality of habitat for forest-associated wildlife species in Illinois. 35
42 Forest INDICATORS Ozone Background Ozone is a naturally occurring component of the atmosphere (Smith et al. 2008). Beneficial in the stratosphere, ozone becomes an air pollutant when it is found high concentrations in the lower atmosphere. Elevated concentrations of ground-level ozone can adversely affect forested landscapes, causing direct foliar injury and reduced photosynthetic activity (Coulston et al. 2004). Prolonged exposure to high levels of ozone reduces tree growth, weakens tree defenses (increasing vulnerability to insects and disease), and may lead to changes in forest composition, regeneration, and productivity. Susceptibility to ozone varies by host species (Smith et al. 2008). Therefore, the effects of ozone are monitored using bioindicator plants, i.e., ozone-sensitive species that exhibit visible foliar symptoms or reduced growth in response to ambient levels of pollution (Coulston et al. 2003, Smith et al. 2008). The use of bioindicator plants provides an indirect measure of air quality, identifying conditions that are favorable for the occurrence of ozone injury. In 1994, as part of a national ozone biomonitoring program, FIA and the Forest Service s Forest Health Monitoring (FHM) program initiated bioindicator surveys. Ozone bioindicator data was first collected in Illinois in The national ozone grid that instituted permanent biosite plots was established in Results provided represent 5-year rolling averages, where reported years denote the final year of inventory. What we found The number of Illinois biosites containing ozone injury increased from 44 percent in 2005 to 74 percent in Over the same period, the incidence of evaluated bioindicator plants with ozone damage increased from 2 percent to 4 percent. The severity and amount of ozone damage at each biosite was used to calculate a biosite index, a relative value describing the gradation of plant response that quantifies the degree of ozone injury on a plot; biosite index is not intended as a measurement of harm (Woodall et al. 2010). Index values are grouped into four categories that describe plant response and identify the degree of risk due to ambient ozone exposure (Table 2) (Smith et al. 2008). The trend in mean biosite index values shows a sharp decrease from low risk to no risk between 2001 and 2005; this was followed by relative stability through 2010 (Fig. 60). In 2010, 96 percent of biosites fell into the no risk category and 4 percent showed low risk; no biosites had moderate or high risk. For most species, there was an increasing trend in mean injury amount and mean injury severity per bioindicator plant between 2005 and 2010 (Figs 61 and 62). Milkweed (common and tall) and yellow-poplar had the greatest amounts of recorded injury (Fig. 61). The most severely damaged species were blackberry and milkweed (Fig. 62). Table 2. Classification scheme for the FIA biosite index (Smith et al. 2008). Biosite Index a Bioindicator response Assumption of risk Possible impact Relative air quality b 0 to < 5 Little or no foliar injury None Visible injury to highly sensitive Good species, e.g. black cherry 5 to < 15 Light foliar injury Low Visible injury to moderately sensitive Moderate species, e.g. yellow poplar 15 to < 25 Moderate foliar injury Moderate Visible and invisible injury. Unhealthy for Tree-level response c sensitive species 25 Severe foliar injury High Visible and invisible injury. Unhealthy Ecosystem-level response c a The categorizations of the biosite index are subjective and based solely on expert opinion. b Relative ozone air quality from a plant s perspective. See EPA-456/F July 1999; c According to the EPA s Proposed Guidelines for Ecological Risk Assessment (Federal Register 61(175): ). 36
43 Forest INDICATORS Mean Biosite Index (5-year running average) Year Figure 60. Mean biosite index (unitless ratio of number of bioindicator plants with ozone damage by total number of sampled plots) by inventory year, Illinois. What this means While exposure to ozone has increased statewide and the incidence of injury has risen, Illinois forests have a low risk of foliar injury. However, the potential for reduced growth and decreased forest health increases with continued exposure, particularly to high ozone levels. Ozone-induced stress will have the greatest impact on ozone-sensitive species (e.g., blackberry, sweetgum, and yellow-poplar) particularly those downwind of major urban areas. Adverse effects on more dominant species such as oaks and maples will be less severe as a result of increased tolerance to ozone. Bioindicator Species Green ash Sassafras Black cherry Spreading dogbane White ash Blackberry Sweetgum Yellow-poplar Common and tall milkweed Mean Injury Amount Figure 61. Mean injury amount (unitless ratio of amount of injury for a given species at a biosite by total number of injured plants) by inventory year, Illinois. Bioindicator Species Green ash Sassafras White ash Spreading dogbane Black cherry Yellow-poplar Sweetgum Common and tall milkweed Blackberry Mean Injury Severity Figure 62. Mean injury severity (unitless ratio of injury severity amounts for a given species at a biosite by total number of injured plants) by inventory year, Illinois. 37
44 38

45 Forest Economics Emiquon National Wildlife Refuge, Fulton County, Illinois. Photo by U.S. Fish and Wildlife Service. 39
46 forest economics Growing-stock Volume Background Growing-stock volume is the amount of sound wood in live, commercial tree species; trees must be at least 5 inches in d.b.h. or greater and free of defect. This measure has traditionally been used to ascertain wood volume available for commercial use. Estimates of the volume of growing stock are important considerations in economic planning and when evaluating forest sustainability. Note: due to changes in field procedures during the 2005 and 2010 inventories, trend information will be shown only for net volume of live trees (equal to or greater than 5.0 inches d.b.h.) on timberland and growing-stock values will be reported only for the 2010 inventory. Growing-stock Volume (million ft 3 ) 8,000 7,000 6,000 5,000 4,000 3,000 2,000 1, Year Figure 63. Growing-stock volume on timberland by inventory year, Illinois. Species Group Cottonwood and aspen Ash Select red oaks Soft maple What we found Growing-stock volume on timberland has risen steadily since 1948, reaching an estimated total of 7.2 billion cubic feet in 2010 (Fig. 63). The other eastern soft hardwoods and select white oak species groups, which account for 30 percent of total growing-stock volume, are the most voluminous species groups on Illinois timberland (Fig. 64). Since 1985, there have been notable volume increases in the soft maple, other eastern soft hardwoods (largely due to American elm) and hickory species groups. Together, oaks still make up a large portion of growing-stock volume (34 percent). Volume continues to increase in the middle diameter classes (Fig. 65). Correspondingly, median tree diameter grows larger with successive inventories. Hickory Other red oaks Select white oaks Other eastern soft hardwoods ,000 1,500 Growing-stock Volume (million ft 3 ) Figure 64. Growing-stock volume on timberland for the top eight species groups by inventory year, Illinois. Growing-stock Volume (million ft 3 ) 1, Diameter Class (inches) Figure 65. Growing-stock volume on timberland by diameter class and inventory year, Illinois. 40
47 forest economics What this means While growing-stock volume continues to rise, the rate of increase may be slowing. Although oak species still maintain significant growing-stock volumes, they show smaller volume increases than species such as American elm and soft maples (e.g., silver maple). Statewide, the increase in growing-stock volume can be attributed to tree growth, increasing timberland area, limited mortality of voluminous species and an aging forest. Illinois growing-stock volume appears to be stable, however, as stands mature, sustainability issues (e.g., oak mortality and oak regeneration) should continue to be monitored. Sawtimber Volume and Quality Background Sawtimber trees are live trees of commercial species that contain either one 12-foot or two noncontiguous 8-foot logs that are free of defect. To qualify as sawtimber, hardwoods must be at least 11 inches d.b.h. and softwoods must be 9 inches d.b.h. Sawtimber volume is defined as the net volume of the saw log portion of live sawtimber, measured in board feet, from a 1-foot stump to minimum top diameter (9 inches for hardwoods and 7 inches for softwoods). Estimates of sawtimber volume are used to determine the monetary value of wood volume and to identify the quantity of merchantable wood availability. The quality of live sawtimber volume is rated using tree grades 1 to 4 (depending on species), where grade 1 is the highest quality and grade 4 the lowest. Tree grades are based on diameter and the presence or absence of defects such as knots, decay, and curvature of the bole. Hardwood sawtimber is valued for wood products like flooring and furniture, while softwood sawtimber is valued primarily for lumber. What we found Since 1962, the volume of sawtimber on Illinois timberland has more than tripled, reaching an estimated 26.9 billion board feet in 2010 (Fig. 66). Nearly half of the volume of sawtimber is in seven hardwood species; white oak, silver maple, black oak, northern red oak, eastern cottonwood, American sycamore, and shagbark hickory. Collectively, almost 40 percent of sawtimber volume is made up of mature oaks. Most species groups have had gains in sawtimber volume since 2005; however, increases were not uniform across all species groups (Fig. 67). Oaks continued to show the least growth in sawtimber, decreasing in volume for all oak groups except the other red oaks (includes black oak). Black oak reversed its decreasing trend from 1998 to 2005 with an increase of 9 percent. Over the past 25 years, the quality of Illinois sawtimber has remained fairly consistent, particularly with regard to grades 1 and 2 (Fig. 68). However, the percentage of sawtimber in grade 4 more than doubled between 2005 and Sawtimber Volume (billion board ft) Year Figure 66. Sawtimber volume on timberland by inventory year, Illinois. Species Group Soft maple Ash Hickory Other red oaks Cottonwood and aspen Other eastern soft hwds Select red oaks Select white oaks Change in Sawtimber Volume from 2005 to 2010 (%) Figure 67. Percent change in sawtimber volume on timberland for selected species groups, Illinois 2005 to
48 forest economics Sawtimber Volume (%) What this means Grade 1 Grade 2 Grade 3 Grade Year Figure 68. Sawtimber volume on timberland by tree grade and inventory year, Illinois. Most of Illinois forests are maturing. Mature stands are more likely to succumb to windthrow, insects, and disease pathogens. The abundance of these stands may be related to how timber is harvested in much of the State. Often, mature timber is removed as single, scattered trees or in small groups. The lack of significant disturbance may not open hardwood stands to progressive seedling development because smaller trees in the understory are generally outcompeted by larger, canopy-dominant trees. Exceptions include species such as sugar maple, which are tolerant of understory conditions and can take advantage of small gaps in the canopy. The current trend in changing sawtimber volume indicates that oaks have lower growth rates than species like maple, walnut, and sycamore. Relatively large increases in these nonoak species reflect the likely species mixture for the next generation of overstory trees. Timber Products Background Harvesting and processing of timber products produces a stream of income shared by timber owners, managers, marketers, loggers, truckers, and processors. In 2007, the wood products and paper manufacturing industries in Illinois employed 28,800 people, with an average annual payroll of $1,169.7 million and total value of shipments of $7.5 billion (U.S. Census Bur. 2010). To better manage the State s forests, it is important to know the species, amounts, and locations of timber being harvested. What we found Surveys of Illinois s wood-processing mills are conducted periodically to estimate the amount of wood volume that is processed into products. This information is supplemented with the most recent survey data from surrounding states that processed wood harvested from Illinois. In 2010, 102 active primary wood-processing mills were surveyed to determine the species that were processed and where the wood material came from. These mills processed 19.8 million cubic feet of saw logs, veneer logs, handle bolts, mine timbers, and other wood products. In 2010, 28.1 million cubic feet of industrial roundwood was harvested from Illinois s forest land; a 17 percent decrease since Primary wood processing mills in Illinois processed 55 percent of the industrial roundwood that was harvested in Illinois. Saw logs accounted for 87 percent of the total industrial roundwood harvested in 2010 (Fig. 69). Other products harvested included pulpwood, veneer logs, cooperage, handle bolts, and mine timbers. Oaks accounted for half of the industrial roundwood harvest in 2010 (Fig. 70). Other important species groups harvested included maple, cottonwood, hickory, black walnut, and ash. 42
49 forest economics 2% 1% 1% 7% 87% Saw logs 2% Veneer logs Pulpwood Cooperage Handles Mine timbers Figure 69. Industrial roundwood harvested by product, Illinois, Harvest Removals (thousand ft 3 ) Softwoods used for product Hardwoods used for product Softwood harvest residue Hardwood harvest residue 0 Growing stock Nongrowing stock Species Group Softwoods Ash Hard maple Black walnut Hickory Cottonwood Soft maple Other hardwoods White oak group Red oak group Industrial Roundwood Harvest (thousand ft 3 ) Figure 70. Industrial roundwood harvested by species group, Illinois, In the process of harvesting industrial roundwood, 21.0 million cubic feet of harvest residues were left on the ground (Fig. 71). Nearly two-thirds of the harvest residues came from nongrowing-stock sources such as crooked or rotten trees, tops and limbs, dead trees, and non-forest trees. The processing of industrial roundwood in the State s primary wood-using mills generated 310,500 green tons of wood and bark residues. A little over half of the mill residues generated were used for mulch, livestock bedding, and other miscellaneous uses (Fig. 72). Industrial fuelwood, residential fuelwood, and wood pellets consumed another 23 percent of the mill residues, and 22 percent were used by the pulp and particleboard industry. Only 4 percent of the mill residues were not used for other products. Figure 71. Total harvest removals from industrial roundwood harvest by growing stock and nongrowing stock, and used for product or harvest residue, Illinois, Mill Residues (thousand green tons) Fiber products Industrial fuel Residential fuelwood and pellets Mulch Other uses Not used Bark residues Coarse residues Fine residues Figure 72. Disposition of mill residues generated by primary wood-using mills, Illinois,
50 forest economics What this means The declining economy has led to the idling and closure of an increased number of primary wood-processing facilities. An important consideration for the future of the primary wood-products industry is its ability to retain industrial roundwood processing facilities. The loss of processing facilities is not only important for the number of jobs that are lost, but it also makes it harder for landowners to find markets for the timber harvested from management activities on their forest land. Onethird of the harvest residue generated during the harvest is from growing-stock sources (wood material that could be used to produce products). Much of this useable material is from the tops of the saw log trees that are harvested. Industrial fuelwood or wood pellets could be possible markets for this unused material, and thus, could lead to better utilization of the forest resource. 44

51 Data Sources Baldcypress knees in cypress swamp, Cypress Creek National Wildlife Refuge. Photo by U.S. Fish and Wildlife Service. 45
52 data sources Forest Inventory Information on the condition and status of forests in Illinois was obtained from the NRS-FIA program. Previous inventories of Illinois forest resources were completed in 1948 (Minckler et al. 1949), 1962 (Essex and Gansner 1965), 1985 (Raile and Leatherberry 1988), 1998 (Schmidt et al. 2000) and 2005 (Crocker et al. 2009). Data from Illinois forest inventories can be accessed electronically on the DVD included with this report, or at For detailed information on inventory methods, see section Statistics, Methods, and Quality Assurance on the DVD. National Woodland Owner Survey Information about family forest owners is collected through the U.S. Forest Service s (USFS) National Woodland Owner Survey (NWOS). The NWOS is designed to increase our understanding of owners attitudes, behaviors, and related characteristics (Butler et al. 2005). Individuals and private groups identified as forest owners by FIA are invited to participate in the NWOS. Data presented here are based on survey responses collected between 2002 and 2006 from 321 randomly selected families and individuals who own forest land in Illinois. For additional information about the NWOS, visit Timber Products Output Inventory This study was a cooperative effort of the Illinois Department of Natural Resources, Southern Illinois University (SIU), and NRS-FIA. Using a questionnaire designed to determine the size and composition of Illinois forest products industry, its use of roundwood (round sections cut from trees), and its generation and disposition of wood residues, SIU personnel contacted via mail and telephone all primary wood-using mills in the State. Completed questionnaires were sent to NRS-FIA for processing. As part of data processing, all industrial roundwood volumes reported were converted to standard units of measure using regional conversion factors. National Land Cover Data Imagery Derived from Landsat Thematic Mapper satellite data (30-m pixel), the National Land Cover Dataset (NLCD) is a land cover classification scheme (21 classes) applied across the United States by the U.S. Geological Survey (USGS) and the U.S. Environmental Protection Agency (EPA). The NLCD was developed from data acquired by the MRLC Consortium, a partnership of Federal agencies that produce or use land-cover data. Partners include the USGS, EPA, U.S. Forest Service, and National Oceanic and Atmospheric Administration. Mapping Procedures Maps in this report were constructed using (1) categorical coloring of Illinois counties according to forest attributes (such as forest land area); (2) a variation of the k-nearest-neighbor (KNN) technique to apply information from forest inventory plots to remotely sensed MODIS imagery (250 m pixel size) based on the spectral characterization of pixels and additional geospatial information (see Wilson et al for more information on this technique); or (3) colored dots to represent plot attributes at approximate plot location. 46
53 Literature Cited Bechtold, W.A.; Patterson, P.L., eds The enhanced Forest Inventory and Analysis program national sampling design and estimation procedures. Gen. Tech. Rep. SRS-80. Asheville, NC: U.S. Department of Agriculture, Forest Service, Southern Research Station. 85 p. Brand, G.J.; Nelson, M.D.; Wendt, D.G.; Nimerfro, K.K The hexagon/panel system for selecting FIA plots under an annual inventory. In: McRoberts, R.E.; Reams, G.A.; Van Deusen, P.C., eds. Proceedings of the first annual Forest Inventory and Analysis symposium. Gen. Tech. Rep. NC-213. St. Paul, MN: U.S. Department of Agriculture, Forest Service, North Central Research Station: Bailey, R.G Description of the ecoregions of the United States. Fort Collins, CO: U.S. Department of Agriculture, Forest Service. [Available online at Butler, B.J Family forest owners of the United States, Gen. Tech. Rep. NRS-27. Newtown Square, PA: U.S. Department of Agriculture, Forest Service, Northern Research Station. 73 p. Butler, B.J.; Leatherberry, E.C.; Williams, M.S Design, implementation, and analysis methods for the National Woodland Owner Survey. Gen. Tech. Rep. NE-336. Newtown Square, PA: U.S. Department of Agriculture, Forest Service, Northeastern Research Station. 43 p. Cappaert, D.; McCullough, D.G.; Poland, T.M.; Siegert, N.W Emerald ash borer in North America: a research and regulatory challenge. American Entomologist. 51(3): Claggett, P.R.; Jantz C.A.; Goetz S.J.; Bisland, C Assessing development pressure in the Chesapeake Bay watershed: an evaluation of two land-use change models. Environmental Monitoring and Assessment. 94: Collinge, S.K Ecological consequences of habitat fragmentation: implications for landscape architecture and planning. Landscape and Urban Planning. 36: Coulston, J.W.; Riitters, K.H.; Smith, G.C A preliminary assessment of the Montréal process indicators of air pollution for the United States. Environmental Monitoring and Assessment. 95: Coulston, J.W.; Smith, G.C.; Smith, W.D Regional assessment of ozone sensitive tree species using bioindicator plants. Environmental Monitoring and Assessment. 83: Crocker, S.J.; Brand, G.J.; Butler, B.J Illinois Forests Resour. Bull. NRS-29. Newtown Square, PA: U.S. Department of Agriculture, Forest Service, Northern Research Station. 114 p. Essex, B.L; Gansner, D.A Illinois timber resources. Resour. Bull. LS-3. St. Paul, MN: U.S. Department of Agriculture, Forest Service, Lakes States Forest Experiment Station. 56 p. Fan, Z.; Shifley, S.R.; Spetich, M.A.; Thompson, F.R., III.; Larsen, D.R Distribution of cavity trees in midwestern old-growth and secondgrowth forests. Canadian Journal of Forest Research. 33: Hahn, J.T Tree volume and biomass equations for the Lake States. Res. Pap. NC-250. St. Paul, MN: U.S. Department of Agriculture, Forest Service, North Central Forest Experiment Station. 10 p. Hunter, W.C.; Buehler, D.A.; Canterbury, R.A.; Confer, J.L.; Hamel, P.B Conservation of disturbancedependent birds in eastern North America. Wildlife Society Bulletin. 29(2):
54 Huang, C.; Yang, L.; Wylie, B.; Homer, C A strategy for estimating tree canopy density using Landsat & ETM+ and high resolution images over large areas. In: The proceedings of the third international conference on geospatial information in agriculture and forestry; 2001 November 5-7; Denver, CO. Ann Arbor, MI: ERIM International. [CD]. Illinois Department of Natural Resources [IL DNR] Illinois wildlife action plan. Springfield, IL: Illinois Department of Natural Resources. Available at default.aspx. (Accessed October 31, 2012). Illinois Department of Natural Resources [IL DNR] Illinois statewide forest resource assessments and strategies. Springfield, IL: Illinois Department of Natural Resources. Available at stateforesters.org/files/il-assess-strategy pdf. (Accessed October 31, 2012). Illinois State Natural Survey Division Forest, wildlife and recreational resources. Springfield, IL: Illinois Department of Registration and Education, Division of Industrial Planning and Development. 47 p. McRoberts, R.E Overview of the enhanced forest inventory and analysis program. In: Bechtold, W.A.; Patterson, P. L., eds. The enhanced forest inventory and analysis program national sampling design and estimation procedures. Gen. Tech. Rep. SRS-80. Asheville, NC: U.S. Department of Agriculture, Forest Service, Southern Research Station: McRoberts, R.E Joint annual forest inventory and monitoring system, the North Central perspective. Journal of Forestry. 97(12): Minckler, L.S.; Fassnacht, D.L.; Train, R.K Forest resources of Illinois. For. Surv. Release 7. Columbus, OH: U.S. Department of Agriculture, Forest Service, Central States Forest Experiment Station. 53 p. Montreal Process Criteria and indicators for the conservation and sustainable management of temperate and boreal forests: the Montreal process. 2nd ed. Ottawa, Canada: Natural Resources Canada, Canadian Forest Service. 19 p. Nowak, D.J.; Walton, J Projected urban growth ( ) and its estimated impact on the US forest resource. Journal of Forestry. 103(8): Pimentel, D.; Lach, L.; Zuniga, R.; Morrison, D Environmental and economic costs of nonindigenous species in the United States. BioScience. 50(1): Poland, T.M.; McCullough, D.G Emerald ash borer: invasion of the urban forest and the threat to North America s ash resource. Journal of Forestry. 104(3): Raile, G.K; Leatherberry, E.C Illinois forest resources. Resour. Bull. NC-105. St. Paul, MN: U.S. Department of Agriculture, Forest Service, North Central Forest Experiment Station. 113 p. Raile, G.K Estimating stump volume. Res. Pap. NC-224. St. Paul, MN: U.S. Department of Agriculture, Forest Service, North Central Forest Experiment Station. 4 p. Riemann, R.; Lister, T.W.; Lister, A.J.; Meneguzzo, D.M.; Parks, S Development of issuerelevant state level analyses of fragmentation and urbanization. In: McWilliams, W.H.; Moisen, G.C.; Czaplewski, R., comps. Forest Inventory and Analysis (FIA) symposium; 2008 October 21-23; Park City, UT. Proc. RMRS-P-56CD. Fort Collins, CO: U.S. Department of Agriculture, Forest Service, Rocky Mountain Research Station. [CD]. Schmidt, T.L; Hansen, M.H.; Solomakos, J.A Illinois forests in Resour. Bull. NC-198. St. Paul, MN: U.S. Department of Agriculture, Forest Service, North Central Research Station. 133 p. 48
55 Schnepf, R Agriculture-based biofuels: Overview and emerging issues. Congressional Research Service Report for Congress p. Available at pdf. (Accessed December 19, 2010). Smith, G.C.; Coulston, J.W.; O Connell, B.M Ozone bioindicators and forest health: a guide to the evaluation, analysis, and interpretation of the ozone injury data in the Forest Inventory and Analysis Program. Gen. Tech. Rep. NRS- 34. Newtown Square, PA: U.S. Department of Agriculture, Forest Service, Northern Research Station. 100 p Smith, J.E.; Heath, L.S.; Skog, K.E.; Birdsey, R.A Methods for calculating forest ecosystem and harvested carbon with standard estimates for forest types of the United States. Gen. Tech. Rep. NE-343. Newtown Square, PA: U.S. Department of Agriculture, Forest Service, Northeastern Research Station. 216 p. Smith, W.B Assessing removals for North Central forest inventories. Res. Pap. NC-299. St. Paul, MN: U.S. Department of Agriculture, Forest Service, North Central Forest Experiment Station. 48 p. Sprague, E.; Burke, D.; Claggett, S.; Todd, A The state of Chesapeake forests. Arlington, VA: The Conservation Fund; and Annapolis, MD: U.S. Department of Agriculture, Forest Service. 114 p. Telford, C.J Third report on a forest survey of Illinois. Illinois Natural History Survey Bulletin. 1 (1): U.S. Forest Service Forest inventory and analysis field methods for phase 3 measurements, Ver Washington, DC: U.S. Department of Agriculture, Forest Service. Available at fs.fed.us/library/field-guides-methods-proc/docs/. (Accessed October 28, 2011). U.S. Census Bureau Economic census. Sector 31: EC0731A1: Manufacturing: Geographic Area Series: Industry Statistics for the States, Metropolitan and Micropolitan Statistical Areas, Counties, and Places: Available at factfinder.census.gov/servlet/ibqtable?_bm=y&-geo_ id=04000us34&-ds_name=ec0731a1&-_lang=en. (Accessed July 8, 2011). U.S. Department of Interior The national atlas of the United States. Washington, DC: U.S. Department of Interior. Available at www. nationalatlas.gov. (Accessed June 24, 2011). U.S. Forest Service Wood handbook wood as an engineering material. Gen. Tech. Rep. FPL-113. Madison, WI: U.S. Department of Agriculture, Forest Service, Forest Products Laboratory. 463 p. Wilson, B.T.; Lister, A.J.; Riemann, R.I A nearest-neighbor imputation approach to mapping tree species over large areas using forest inventory plots and moderate resolution raster data. Forest Ecology and Management. 271: Woodall, C.W.; Conkling, B.L.; Amacher, M.C.; Coulston, J.W.; Jovan, S; Perry, C.H.; Schulz, B.; Smith, G.C.; Will-Wolf, S The Forest Inventory and Analysis database version 4.0: Database description and users manual for phase 3. Gen. Tech. Rep. NRS-61. Newtown Square, PA: U.S. Department of Agriculture, Forest Service, Northern Research Station. 180 p. Xian, G; Homer, C; Fry, J Updating the 2001 National Land Cover Database land cover classification to 2006 by using Landsat imagery change detection methods. Remote Sensing of Environment. 113(6):

56
57 Crocker, Susan J.; Nelson, Mark D.; Barnett, Charles J.; Butler, Brett J.; Domke, Grant M.; Hansen, Mark H.; Hatfield, Mark A.; Lister, Tonya W.; Meneguzzo, Dacia M.; Piva, Ronald J.; Wilson, Barry T.; Woodall, Christopher W Illinois Forests Resour. Bull. NRS-86. Newtown Square, PA: U.S. Department of Agriculture, Forest Service, Northern Research Station. 52p. The second full annual inventory of Illinois forests, completed in 2010, reports more than 4.8 million acres of forest land and 97 tree species. Forest land is dominated by oak/ hickory and elm/ash/cottonwood forest-type groups, which occupy 93 percent of total forest land area. The volume of growing stock on timberland totals 7.2 billion cubic feet. The average annual net growth of growing stock from to averages million cubic feet per year. This report includes additional information on forest attributes, land-use change, carbon, timber products, and forest health. The included DVD contains 1) descriptive information on methods, statistics, and quality assurance of data collection, 2) a glossary of terms, 3) tables that summarize quality assurance, 4) a core set of tabular estimates for a variety of forest resources, and 5) a Microsoft Access database that represents an archive of data used in this report, with tools that allow users to produce customized estimates. KEY WORDS: inventory, forest statistics, forest land, volume, biomass, carbon, growth, removals, mortality, forest health, Illinois, emerald ash borer The U.S. Department of Agriculture (USDA) prohibits discrimination in all its programs and activities on the basis of race, color, national origin, gender, religion, age, disability, political beliefs, sexual orientation, and marital or family status. (Not all prohibited bases apply to all programs.) Persons with disabilities who require alternative means for communication of program information (Braille, large print, audiotape, etc.) should contact USDA s TARGET Center at (202) (voice and TDD). To file a complaint of discrimination, write USDA, Director, Office of Civil Rights, Room 326-W, Whitten Building, 14th and Independence Avenue, SW, Washington, DC , or call (202) (voice or TDD). USDA is an equal opportunity provider and employer. Buck Creek in Johnson County, Illinois. Photo by Chris Evans, Illinois Wildlife Action Plan, Bugwood.org. 51
58 DVD Contents Illinois Forests 2010 (PDF) Illinois Forests: Statistics, Methods, and Quality Assurance (PDF) Illinois Forests 2005 (PDF) Illinois Inventory Database (CSV file) Illinois Inventory Database (Access file) Field guides that describe inventory procedures (PDF) Database User Guides (PDF) 52


59 Illinois Forests 2010 Statistics, Methods, and Quality Assurance United States Department of Agriculture Resource Bulletin NRS-86 Forest Service


60
Overview. United States Department of Agriculture. Sampling error (percent) Sampling error (percent)
 Sampling error (percent)") United States Department of Agriculture This resource update provides an overview of forest resources in Nebraska based on inventories conducted by the USDA Forest Service, Forest Inventory and Analysis
United States Department of Agriculture This resource update provides an overview of forest resources in Nebraska based on inventories conducted by the USDA Forest Service, Forest Inventory and Analysis
Overview. United States Department of Agriculture
 This resource update provides an overview of forest resources in Kansas based on inventories conducted by the U.S. Forest Service, Forest Inventory and Analysis (FIA) program of the Northern Research Station.
East Texas Forestlands, 2011
 East Texas Forestlands, 2011 Texas A&M Forest Service Forest Inventory and Analysis Texas A&M Forest Service works in partnership with the U.S. Forest Service to inventory forestlands in East Texas. This
E a s t T e x a s F o r e s t l a n d s,
 E a s t T e x a s F o r e s t l a n d s, 2 1 5 T e x a s A & M F o r e s t S e r v i c e F o r e s t I n v e n t o r y a n d A n a l y s i s Texas A&M Forest Service works in partnership with the U.S.
East Texas Forestlands, 2010
 East Texas Forestlands, 2010 Texas Forest Service Forest Inventory and Analysis Texas Forest Service works in partnership with the U.S. Forest Service to inventory forestlands in the 43 counties of East
Forests of Kansas, 2014
 This resource update provides an overview of forest resource attributes for Kansas based on annual inventories conducted by the Forest Inventory and Analysis (FIA) program of the Northern Research Station
Nebraska s Forests 2010
 Nebraska s Forests 2010 Resource Bulletin NRS-68 United States Department of Agriculture Forest Service Abstract The second full annual inventory of Nebraska s forests reports more than 1.5 million acres
Forest Resources of the Black Hills National Forest
 United States Department of Agriculture Forest Service Rocky Mountain Research Station August 22 Forest Resources of the Black Hills National Forest Larry T. DeBlander About the author Larry T. DeBlander
Missouri Forests 2013
 United States Department of Agriculture Missouri Forests 2013 Forest Service Northern Research Station Resource Bulletin NRS-108 Publication Date December 2016 Abstract The third full cycle of annual inventories
The Hardwood Forests in Changing Times - Adapting to New Realities. Charlie Becker Utilization and Marketing Manager
 The Hardwood Forests in Changing Times - Adapting to New Realities Charlie Becker Utilization and Marketing Manager Topic Areas The Hardwood Resource Market and Economic Conditions Thoughts on the Future
TRENDS IN DELAWARE S FORESTS
 United States Department of Agriculture TRENDS IN DELAWARE S FORESTS Forest Service Northeastern Research Station NE-INF-150-02 Delaware Department of Agriculture Forest Service DELAWARE FORESTS Forests
Wisconsin s Forests 2009
 Wisconsin s Forests 2009 Resource Bulletin NRS-67 United States Department of Agriculture Forest Service Northern Research Station Abstract The second full annual inventory of Wisconsin s forests reports
8) Which of the following species is best adapted to poorly drained sites? a) Bur oak b) Eastern red cedar c) Black ash d) Yellow birch
 Which of the following species is best adapted to poorly drained sites? a) Bur oak b) Eastern red cedar c) Black ash d) Yellow birch") School Score Wisconsin Envirothon 2004 Forestry Exam Answer the following questions based on the species description and graphic to the right. 1) This tree is the state tree of Wisconsin and is prized
School Score Wisconsin Envirothon 2004 Forestry Exam Answer the following questions based on the species description and graphic to the right. 1) This tree is the state tree of Wisconsin and is prized
ASSESSING THE DIRECTION OF THE FOREST RESOURCE
 ASSESSING THE DIRECTION OF THE FOREST RESOURCE C U R T W I L S O N - R E G I O N A L F O R E S T R Y L E A D E R N O R T H E A S T R E G I O N - G R E E N B A Y, W D N R J U N E 2 0 1 2 QUESTIONS FOR TODAY
2015 Wisconsin Envirothon KEY Forestry Exam
 2015 Wisconsin Envirothon KEY Forestry Exam Answers that are correct but differ strongly from answer key must be initialized by Station Captain as an approved answer prior to delivery to score stewards.
North Carolina, 2010
 North Carolina, Introduction Mark J. Brown and Barry D. New North Carolina s first annualized forest survey was completed in and results were published in e-science Update SRS 029. There were 5,800 ground
National forest inventory and
 National forest inventory and monitoring in the USA Thomas J. Brandeis, PhD. USDA Forest Service, Forest Inventory and Analysis With material contributed by William Burkman (SRS FIA), Brad Smith (FIA WO),
(Draft) Addendum to 5-year Management Plan Mohican-Memorial State Forest
 Addendum to 5-year Management Plan Mohican-Memorial State Forest") (Draft) Addendum to 5-year Management Plan Mohican-Memorial State Forest Forest Description Mohican- Memorial State Forest (Mohican SF) is located in southern Ashland County, midway between Columbus and
(Draft) Addendum to 5-year Management Plan Mohican-Memorial State Forest Forest Description Mohican- Memorial State Forest (Mohican SF) is located in southern Ashland County, midway between Columbus and
Forest Resources of the Medicine Bow National Forest
 United States Department of Agriculture Forest Service Rocky Mountain Research Station September 2008 Forest Resources of the Medicine Bow National Forest Jim Steed Wyoming Medicine Bow National Forest
Nova Scotia Forest Inventory
 Nova Scotia Forest Inventory Based on Forest Inventory Permanent Sample Plots Measured between 1994 and 1998 Report FOR 2000-1 TABLE OF CONTENTS 1.0 INTRODUCTION 1 1.1 Background 1 2.0 METHODS 2 3.0 RESULTS
Georgia, Forest Inventory & Analysis Factsheet. Richard A. Harper. Timberland Area and Live-Tree Volume by Survey
 Georgia, 211 Richard A. Harper Forest Inventory & Analysis Factsheet F I A Forest cover along the Ocmulgee River south of Macon, GA. (photo courtesy of the Georgia Forestry Commission) 3 25 2 15 1 5 Area
Forest Resources of the Nez Perce National Forest
 United States Department of Agriculture Forest Service Rocky Mountain Research Station July 2010 Forest Resources of the Nez Perce National Forest Michele Disney About the author Michele Disney is a Forestry
In 1997, the United States had 747
 Private Timberlands Growing Demands, Shrinking Land Base Ralph Alig, John Mills, and Brett Butler ABSTRACT By 2050, US timberland area is projected to be about 3 percent smaller than today due to increasing
Christopher M. Oswalt Forest Inventory & Analysis Factsheet
 United States Department of Agriculture Christopher M. Oswalt Forest Inventory & Analysis Factsheet Cumberland Falls. (photo by Chris Kuehl, Wikimedia.org) This science update provides an overview of forest
C e n t r a l & W e s t T e x a s F o r e s t l a n d s,
 C e n t r a l & W e s t T e x a s F o r e s t l a n d s, 2 1 3 T e x a s A & M F o r e s t S e r v i c e F o r e s t I n v e n t o r y a n d A n a l y s i s Texas A&M Forest Service works in partnership
C e n t r a l & W e s t T e x a s F o r e s t l a n d s,
 C e n t r a l & W e s t T e x a s F o r e s t l a n d s, 2 1 2 T e x a s A & M F o r e s t S e r v i c e F o r e s t I n v e n t o r y a n d A n a l y s i s Texas A&M Forest Service works in partnership
Forest Resources of the Shoshone National Forest
 United States Department of Agriculture Forest Service Rocky Mountain Research Station May 2008 Forest Resources of the Shoshone National Forest Jim Menlove About the author Jim Menlove is an Ecologist
FOREST MANAGEMENT PLAN For the GLADDEN MEMORIAL WOODLAND
 FOREST MANAGEMENT PLAN For the GLADDEN MEMORIAL WOODLAND Prepared by Don Carlson-Purdue University Forester DECEMBER 2003 1. Legal Description and Location The Purdue University Claude M. Gladden Memorial
Forest Resources of the Beaverhead- Deerlodge National Forest
 United States Department of Agriculture Forest Service Rocky Mountain Research Station August 21 Forest Resources of the Beaverhead- Deerlodge National Forest Larry T. DeBlander Beaverhead-Deerlodge National
LAND AND USE. Figure 2. Land cover in Rhode Island, Forest land. Nonforest land and smaller forest patches predominate in the area surrounding
 Mountain laurel Kalmia latifolia Figure 2. Land cover in Rhode Island, 1992. Forest land Developed land Agricultural land Other land Water Source: U.S. Geologic Survey, National Land Cover Data LAND AND
Forest Resources of the Apache- Sitgreaves National Forest
 United States Department of Agriculture Forest Service Rocky Mountain Research Station September 2003 Forest Resources of the Apache- Sitgreaves National Forest Paul Rogers About the author Paul Rogers
2013 Carbon Sequestration of Georgia Timberland
 2013 Carbon Sequestration of Georgia Timberland According to the most recent Forest Inventory & Analysis data, provided by the U.S. Forest Service, almost 1.6 billion metric tons of CO 2 was sequestered
C e n t r a l & W e s t T e x a s F o r e s t l a n d s,
 C e n t r a l & W e s t T e x a s F o r e s t l a n d s, 2 1 1 T e x a s A & M F o r e s t S e r v i c e F o r e s t I n v e n t o r y a n d A n a l y s i s Texas A&M Forest Service works in partnership
Forest Resources of the Lolo National Forest
 United States Department of Agriculture Forest Service Rocky Mountain Research Station June 2000 Forest Resources of the Lolo National Forest Larry T. DeBlander About the author Larry T. DeBlander is a
Silviculture Art & science of establishing & tending trees & forests
 Silviculture Art & science of establishing & tending trees & forests Karen Bennett, karen.bennett@unh.edu Extension Forestry Professor & Specialist Presented to NH Coverts, May 2015 Silviculture Actions
Central & West Texas Forestlands: 2007
 Forestlands 2007 Report Published August 2009 Forestlands: 2007 Texas Forest Service Forest Inventory and Analysis Program In 2004, Texas Forest Service, in cooperation with the Southern Research Station
SILVICULTURE SILVICULTURE 10/8/2018. Ecological forestry (Ecosystem management)
") SILVICULTURE SILVICULTURE Dave Peterson University of Washington School of Environmental and Forest Sciences Thanks to Kristi McClelland, Boyd Evison, and Greg Ettl Silviculture The science and art of
SILVICULTURE SILVICULTURE Dave Peterson University of Washington School of Environmental and Forest Sciences Thanks to Kristi McClelland, Boyd Evison, and Greg Ettl Silviculture The science and art of
Chapter 1: Preparing a Woodland Stewardship Plan
 1 Chapter 1: Preparing a Woodland Stewardship Plan John G. DuPlissis, Forestry Outreach Specialist, University of Wisconsin Stevens Point Melvin J. Baughman, Extension Forester, University of Minnesota
Forest Resources within the Lake States Ceded Territories
 United States Department of Agriculture Forest Resources within the Lake States Ceded Territories 1980-2013 Forest Service Northern Resource Bulletin Research Station NRS-96 September 2015 Abstract The
East Texas Forestlands
 East Texas Forestlands Curtis L. VanderSchaaf Forest Resource Analyst cvanderschaaf@tfs.tamu.edu March 2010 A copy of the East Texas Forestlands factsheet can be downloaded from: http://txforestservice.tamu.edu/econdev/pubs
United States Department of Agriculture. Maine Forests Forest Service. Northern Research Station. Resource Bulletin NRS-103
 United States Department of Agriculture Maine Forests 2013 Forest Service Northern Research Station Resource Bulletin NRS-103 Publication Date July 2016 Abstract The third 5-year annualized inventory of
Forest Resources of the Ashley National Forest
 United States Department of Agriculture Forest Service Intermountain Research Station December 1997 Forest Resources of the Ashley National Forest Renee A. O Brien Ronald P. Tymcio This summary of the
Simulating Regeneration Dynamics in Upland Oak Stands
 Simulating Regeneration Dynamics in Upland Oak Stands Powered By Powered by: USDA Forest Service Southern Research Station Dr. David Loftis Powered By Powered by: Regen for Excel is a simulation model
Chapter 1: Preparing a Woodland Stewardship Plan. What will you do with your woodland? Some landowners choose to let nature take its course.
 1 Chapter 1: Preparing a Woodland Stewardship Plan John G. DuPlissis, Forestry Outreach Specialist, University of Wisconsin Stevens Point Melvin J. Baughman, Extension Forester, University of Minnesota
2.4 MANAGING FOR HIGH-VALUE TREES
 2.4 MANAGING FOR HIGH-VALUE TREES BACKGROUND Quality timber trees are important to the region s wood products industry. Quality is determined by tree size and the amount of clear, knot-free lumber the
Pennsylvania s Forests 2009
 Pennsylvania s Forests 2009 Resource Bulletin NRS-82 United States Department of Agriculture Forest Service Abstract The second full annual inventory of Pennsylvania s forests reports a stable base of
Forest Resources of the Fishlake National Forest
 United States Department of Agriculture Forest Service Rocky Mountain Research Station May 1998 Forest Resources of the Fishlake National Forest Renee A. O Brien Shirley H. Waters An extensive, comprehensive
Forest Resources of the Coconino National Forest
 United States Department of Agriculture Forest Service Rocky Mountain Research Station May 2003 Forest Resources of the Coconino National Forest Larry T. DeBlander Mark Fleck About the author Larry T.
Forensic Forestry Reading the Land
 Principles of Forest Ecology and Management or Forensic Forestry Reading the Land Jonathan Kays University of Maryland Extension Where Do We Start? Think Like A Plant Act Like A Plant Thinking and Acting
South Dakota s Forest Resources in 2005
 United States Department of Agriculture Forest Service Northern Research Station Resource Bulletin NRS-5 South Dakota s Forest Resources in 2005 Ronald J. Piva, Douglas Haugan, Gregory J. Josten, and Gary
Nebraska s Forests: Resource Bulletin NRS-27
 University of Nebraska - Lincoln DigitalCommons@University of Nebraska - Lincoln Publications, etc. -- Nebraska Forest Service Nebraska Forest Service 2005 Nebraska s Forests: Resource Bulletin NRS-27
The Status of Timber Resources in the North Central United States
 The Status of Timber Resources in the North Central United States A summary of forest conditions, growth, removals, consumption, and opportunities in the 7-State North Central Region Executive Summary
Appendix A: Vegetation Treatments
 Appendix A: Vegetation Treatments In general, the proposed actions for the Light Restoration project focuses on establishing the composition, structure, pattern, and ecological processes necessary to make
Stand Dynamics and Health. Helping Your Woods Grow. For most of us this is our goal. Traditional Land Knowledge. Forest Function and Wildlife Habitat
 Helping Your Woods Grow the art and science of silviculture Stand Dynamics and Health Kristi McClelland, King County DNRP Forester http://cru.cahe.wsu.edu/cepublications/eb2000/eb2000.pdf Photo by John
Where are the black walnut trees in Missouri?
 Vasievich, J. Michael; Kingsley, Neal P. 1995. Where are the walnut trees in Missouri?. Walnut Council Bulletin. 22(4): 4-6. Where are the black walnut trees in Missouri? J. Michael Vasievich and Neal
Anne Hairston-Strang MD DNR Forest Service September 7, 2017
 Anne Hairston-Strang MD DNR Forest Service September 7, 2017 Improving Forest-related BMPs Riparian Forest Buffers Consider drainage flow context and Farm Plan Address concentrated flows with companion
PRINCIPLES OF SILVICULTURE FWF 312 SOME SELECTED SILVICULTURAL DEFINITIONS
 PRINCIPLES OF SILVICULTURE FWF 312 SOME SELECTED SILVICULTURAL DEFINITIONS Age Class (Cohort) A distinct aggregation of trees originating from a single natural event or regeneration activity, or a grouping
3.15 SNAG AND SNAG ASSOCIATED SPECIES
 3.15 SNAG AND SNAG ASSOCIATED SPECIES 3.15.1 Scope of the Analysis Snags play an important role in creating biodiversity on the landscape. They provide holes that are homes for birds and small mammals,
Inventory and Assessment of Shelburne Farms Woodlots
 Inventory and Assessment of Shelburne Farms Woodlots FOR 195 Natural Resource Ecology and Assessment II Rubenstein School of Environment and Natural Resources University of Vermont April 27, 2016 INTRODUCTION
ANALYZING REGIONAL FIA DATA IN THE ARCVIEW GEOGRAPHIC INFORMATION SYSTEM 1
 ANALYZING REGIONAL FIA DATA IN THE ARCVIEW GEOGRAPHIC INFORMATION SYSTEM 1 David Reed, Scott Pugh, Pat Miles, and Kurt Pregitzer 2 Abstract The ArcView Geographic Information System (GIS) is probably the
January Symptoms and Reporting Suspects
 January 2008 The emerald ash borer (EAB), Agrilus planipennis, is an exotic insect that was first identified in southeast Michigan in 2002. EAB is very aggressive at attacking and killing all true ash
FOREST MANAGEMENT PLAN For the PINNEY-PURDUE AG. CENTER WOODLAND
 FOREST MANAGEMENT PLAN For the PINNEY-PURDUE AG. CENTER WOODLAND Prepared by Don Carlson-Purdue University Forester September 2002 1. Location and General Description The Pinney-Purdue Ag Center (Pinney-PAC)
Proposed treatments of planted white pine in the Waynesville Watershed
 Proposed treatments of planted white pine in the Waynesville Watershed Peter Bates and Rob Lamb in collaboration with The Waynesville Watershed Advisory Committee September 14, 2010 Presentation overview
Proposed Wildlife Habitat Restoration Project At Walking Iron Wildlife Area August 6, 2015
 Proposed Wildlife Habitat Restoration Project At Walking Iron Wildlife Area August 6, 2015 Walking Iron County Wildlife Area is 898 acres situated in the Town of Mazomanie between Walking Iron County Park
Crop Tree Management. How to help your forest grow high quality timber by giving your trees ample room to grow. Paul Bane IDNR Forester
 Crop Tree Management How to help your forest grow high quality timber by giving your trees ample room to grow. Paul Bane IDNR Forester Crop Tree Management Crop tree management (CTM) is a widely applicable
Annual Inventory Report for Pennsylvania s Forests: Results from the First Three Years
 United States Department of Agriculture Forest Service Northeastern Research Station Resource Bulletin NE-159 Annual Inventory Report for Pennsylvania s Forests: Results from the First Three Years William
Upper Mississippi River. Systemic Forest Stewardship Plan. Executive Summary
 Upper Mississippi River Systemic Forest Stewardship Plan Executive Summary St. Paul District Rock Island District St. Louis District August 2012 Introduction The Mississippi River is the largest riverine
Forest Health Highlights 2015
 Forest Health Highlights 2015 Windbreaks, shelterbelts and narrow wooded riparian strips account for an additional 423,000 acres of tree-covered land. Community forests add 470,000 acres to the state s
Annual Status of Reforestation in Alberta Report 2016
 2016 November 6,2017 Agriculture and Forestry 2015-2016 Table of Contents What is this report about? 3 What is reforestation? 4 Why reforest? 5 What does the law require? 5 How is the status of reforestation
File Code: 1950 Date: December 7, Dear Friend of the Forest:
 United States Department of Agriculture Forest Service Chattahoochee-Oconee National Forests Oconee Ranger District 1199 Madison Road Eatonton, GA 31024 (706) 485-3180 File Code: 1950 Date: December 7,
Forest Resources of the Uinta National Forest
 United States Department of Agriculture Forest Service Intermountain Research Station August 1997 Forest Resources of the Uinta National Forest Renee A. O Brien Dennis Collins This summary of the forest
Texas, Forest Inventory & Analysis Factsheet. James W. Bentley. Forested Area. Introduction. Inventory Volume
 Texas, 21 James W. Bentley Forest Inventory & Analysis Factsheet F I A The Nation s Forest Census Introduction Guadalupe River State Park, Comel County, TX. (photo by This science update summarizes the
A brief introduction to general terms and concepts related to the forestry learning objectives
 A brief introduction to general terms and concepts related to the forestry learning objectives The profession embracing the science, art, and practice of creating, managing, using, and conserving forests
Consumption Outpaces Har vest, Prices Rise Slowly
 Harvest, Inventory, and Stumpage Prices Consumption Outpaces Har vest, Prices Rise Slowly Darius M. Adams ABSTRACT America s appetite for timber will continue to grow, and consumption will exceed domestic
Michigan s Forests 2009
 Michigan s Forests 2009 Resource Bulletin NRS-66 United States Department of Agriculture Forest Service Northern Research Station Abstract The seventh inventory of Michigan s forests, completed in 2009,
2017 Regional Envirothon
 2017 Regional Envirothon Forestry Test (25 Points Total) MATCHING: Match the term to the description that best fits (1 Point Each) A. Selective Harvest B. Baltimore Stick C. Clinometer D. Prism E. High
Forest Resources of the Tonto National Forest
 United States Department of Agriculture Forest Service Rocky Mountain Research Station August 2004 Forest Resources of the Tonto National Forest John D. Shaw About the author John D. Shaw is a Forester
Forest Resources of the Wasatch-Cache National Forest
 United States Department of Agriculture Forest Service Intermountain Research Station July 1997 Forest Resources of the Wasatch-Cache National Forest Renee A. O Brien Reese Pope This summary of the forest
Minnesota Forests 2013
 United States Department of Agriculture Minnesota Forests 2013 Forest Service Northern Research Station Resource Bulletin NRS-104 Publication Date August 2016 Abstract The third full annual inventory of
Appendix 5A Priority Landscapes GIS Analysis Methodology
 Appendix 5A Priority Landscapes GIS Analysis Methodology Overview This appendix describes the methodology used for Pennsylvania s Priority Landscapes GIS Analysis. The figure below is a conceptual diagram
Recommendations for Enhancing the Role of Forests In Climate Change Mitigation and Ecosystem Adaption to Climate Change
 NASF-2015-03 September 15, 2015 www.stateforesters.org Recommendations for Enhancing the Role of Forests In Climate Change Mitigation and Ecosystem Adaption to Climate Change A Policy Statement approved
Forecasting Timber, Biomass, and Tree Carbon Pools with the Output of State and Transition Models
 Proceedings of the First Landscape State-and-Transition Simulation Modeling Conference, June 14 16, 2011 Forecasting Timber, Biomass, and Tree Carbon Pools with the Output of State and Transition Models
United States Department of Agriculture. Indiana Forests Forest Service. Northern Research Station. Resource Bulletin NRS-107
 United States Department of Agriculture Indiana Forests 2013 Forest Service Northern Research Station Resource Bulletin NRS-107 Publication Date December 2016 Abstract This report summarizes the third
Principles of Forest Ecology and Management. Forensic Forestry Reading the Land. Jonathan Kays University of Maryland Extension
 Principles of Forest Ecology and Management or Forensic Forestry Reading the Land Jonathan Kays University of Maryland Extension jkays@umd.edu Where Do We Start? Think Like A Plant Act Like A Plant Thinking
Linda Joyce. USFS Rocky Mountain Research Station, October 13, 2015
 Linda Joyce USFS Rocky Mountain Research Station, October 13, 2015 Context, Opportunities, Challenges Forests where are they, how productive, what are they valued for, and what are the threats currently
Forest carbon 101. Climate change adaptation and mitigation considerations. Overview Module Silviculture Institute 5/24/2017
 Climate change adaptation and mitigation considerations Outline Forest carbon 101 Influence of silvicultural treatments on carbon dynamics Adaptation considerations in light of global change Tradeoffs
Tree Survival 15 Years after the Ice Storm of January 1998
 United States Department of Agriculture Tree Survival 15 Years after the Ice Storm of January 1998 Walter C. Shortle Kevin T. Smith Kenneth R. Dudzik Forest Service Northern Research Paper Research Station
Kentucky Woodland Owners:
 Kentucky Woodland Owners: Who They Are and the Challenges They Face by Billy Thomas Kentucky has some of the most diverse woodlands in the United States with over one hundred tree species naturally occurring
A Characterization of Timber Salvage Operations on Public Forests in Minnesota and Wisconsin
 A Characterization of Timber Salvage Operations on Public Forests in Minnesota and Wisconsin Matthew Russell1, Michael Kilgore2, Charles Blinn3 Abstract Despite the common management practice and benefits
South Dakota's Forest Resources in 2002
 United States Department of Agriculture Forest Service North Central Research Station South Dakota's Forest Resources in 2002 Ronald J. Piva, Douglas Haugan, Gregory J. Josten, and Gary J. Brand Resource
Forest Stewardship Plan
 Forest Stewardship Plan Effective plan date: June 1, 2002 Forestry is the art and science of managing forest lands and their related resources, including trees and other plants, animals, soil, water, and
Production of High-Quality Timber Products Through Forest Management. Wayne K. Clatterbuck Forest Management & Silviculture UT Extension, Knoxville
 Production of High-Quality Timber Products Through Forest Management Wayne K. Clatterbuck Forest Management & Silviculture UT Extension, Knoxville Forest Management Cycle Forest Establishment Intermediate
Invitation For Bids Timber Sale
 Sustainable Forest Management www.longforestry.com Invitation For Bids Timber Sale Long Forestry Consultation 94 Curtis St. Jerseyville, IL 62052 (618) 639-TREE One property, totaling 120 woodland acres,
THE PATH FORWARD I. VISION
 THE PATH FORWARD I. VISION Our vision within the Four Forests Restoration Initiative essentially mirrors that outlined in the Statewide Strategy for Restoring Arizona s Forests. We expect that landscape-scale
Division of Forestry
 Guidelines for Managing Sites with Ash To Address the Threat of Emerald Ash Borer On Forestry-Administered Lands BACKGROUND The ash genus (Fraxinus) in Minnesota comprises nearly one billion trees and
U.S. Forest Facts and Historical Trends
 Errata In the printed version of this brochure the graphics on page 13 should be in Billion cubic feet. The following pdf version of the brochure has been corrected. U.S. Forest Facts and Historical Trends
Forest Statistics for Tennessee s Plateau Counties, 1999
 United States Department of Agriculture Forest Service Forest Statistics for Tennessee s Plateau Counties, 1999 Southern Research Station Callie Jo Schweitzer Resource Bulletin SRS-49 The Author: Callie
American Tree Farm System Management Plan Template
 American Tree Farm System Management Plan Template State Tree Farm # Tree Farm Property Location Tree Farm Name: Ownership 1 : County: Tax Map ID: Location 2 : State: GPS Coordinates: Tree Farmer Contact
Matanuska-Susitna Borough Timber Inventory 2006
 Matanuska-Susitna Borough Timber Inventory 2006 1989 MSB Forest Management Plan 17 Forest Management Units (FMU) 138,000 acres classified forest land Approximately 84,700 acres Commercial Timber Land
Red Pine Management Guide A handbook to red pine management in the North Central Region
 Red Pine Management Guide A handbook to red pine management in the North Central Region This guide is also available online at: http://ncrs.fs.fed.us/fmg/nfgm/rp A cooperative project of: North Central