WESTERN EXTERIOR OCCUPANCY SURVEY FOR EXTERIOR ADAPTIVE LIGHTING APPLICATIONS (PHASE 2)
|
|
|
- Florence Marsh
- 6 years ago
- Views:
Transcription


1 WESTERN EXTERIOR OCCUPANCY SURVEY FOR EXTERIOR ADAPTIVE LIGHTING APPLICATIONS (PHASE 2) ET Project Numbers: BPA: ET12BPA-TIP140 PG&E: ET12PGE1271 SCE: ET08SCE1051 Project Sponsors: Bonneville Power Administration Pacific Gas and Electric Company Southern California Edison Prepared By: California Lighting Technology Center 633 Pena Drive Davis, CA Issued: August 6, 2014 i
2 ACKNOWLEDGEMENTS Bonneville Power Administration, Pacific Gas and Electric Company and Southern California Edison Emerging Technologies Programs are responsible for this project. It was developed as part of Pacific Gas and Electric Company s and Southern California Edison s Emerging Technology Technical Assessment program under internal project numbers ET12PGE1271 and ET08SCE1051. California Lighting Technology Center conducted this technology evaluation with overall guidance and management from Levin Nock at BPA, Chris Corcoran at PG&E, and David Rivers at SCE. For more information on this project, contact David Rivers at david.g.rivers@sce.com, Nicole Graeber at negraeber@ucdavis.edu, or Levin Nock at lfnock@bpa.gov. LEGAL NOTICE This report was prepared for Bonneville Power Administration, Pacific Gas and Electric Company and Southern California Edison for use by its employees and agents. Neither Bonneville Power Administration, Pacific Gas and Electric Company or Southern California Edison nor any of its employees and agents: (1) makes any written or oral warranty, expressed or implied, including, but not limited to those concerning merchantability or fitness for a particular purpose; (2) assumes any legal liability or responsibility for the accuracy, completeness, or usefulness of any information, apparatus, product, process, method, or policy contained herein; or (3) represents that its use would not infringe any privately owned rights, including, but not limited to, patents, trademarks, or copyrights. ii
3 FIGURES Figure 1. U.S. lighting lamp inventory, electricity consumption and lumen production... 7 Figure 2. U.S. lighting electricity consumption by sector and lamp type... 7 Figure 3. DAQ equipment: (left) data logger; (center) receiver; (right) PIR sensor Figure 4. Interaction of the components of the DAQ Figure 5. Data from a single data logger Figure 6. Matlab graph of data stream from Big Box Store receiver No. 34, for 30 second binning period, 9/9/2013 1/30/ Figure 7. Figure 8. Figure 9. Graphs of data streams from receivers R07 and R08 at Office Campus site, full view (top) and zoomed in on R08 (bottom). Receivers R07 and R08 were monitoring areas close to one another. Interference, causing exceptionally high values to be logged, was caused by tree branches handing in front of a sensor connected to R Graph of data stream from receiver R06 at Outdoor Shopping Center site, full view (top) and zoomed in (bottom). This graph depicts a situation when data logging was lost due to loss of power. When uninstalling the equipment at this site, the receiver s power supply was found to have come unplugged Graph of data stream from receiver R10 at Outdoor Shopping Center site. This graph depicts a situation when no data was logged from the receiver Figure 10. Example of data stream review of documentation from Office Campus site. The receivers highlighted in yellow represent receivers with data streams that should be included in data analysis for the site, while the receivers highlighted in red represent data streams that should be omitted in the analysis of the site Figure 11. Overview of host sites Figure 12. Large Office Building, A host site Figure 13. Occupancy analysis for the Large Office Building, A was conducted considering eight receivers which represent occupant detections from 14 PIR sensors. Data was collected in 5 minute intervals Figure 14. Nighttime occupancy rate results for receivers at Large Office Building, A host site Figure 15. The Building Supply Franchise host site is located in a suburban area surrounded by residential and small commercial structures Figure 16. Sensor layout at Building Supply Franchise host site iii
4 Figure 17. Nighttime occupancy rate results for receivers at Building Supply Franchise host site Figure 18. This host site, outlined in red, is located in southeast Washington and is surrounded by residential and retail spaces Figure 19. Sensor layout at fast food restaurant host site in Southeast Washington. The number labels R01 R03 represent the locations of the three receivers used at this site. The red triangles extending from the receiver locations represent individual sensors and their orientation Figure 20. Nighttime occupancy rate results for receivers at fast food restaurant host site Figure 21. The K-12 School host site in Southeast Washington, surrounded by residential neighborhoods and agricultural fields Figure 22. Sensor layout at the K-12 School host site in Southeast Washington. The number labels 1 6 in this figure correspond to the receiver labels R01 R06 used elsewhere in this report Figure 23. Nighttime occupancy rate results for receivers at K-12 School host site.35 Figure 24. Aerial image of the host site Office Campus, which is predominantly surrounded by commercial and some residential spaces Figure 25. Sensor layouts for host site Office Campus: area 1 (top) and area 2 (bottom) Figure 26. Nighttime occupancy rate results for receivers at The Office Campus host site with 30 second bin periods (top) and 5 minute bin periods (bottom) Figure 27. Aerial image of the Big Box Store host site, which is predominantly surrounded by retail and some residential spaces Figure 28. Sensor layout at Big Box Store host site in Northern California. The number labels R01 R34 represent the locations of the sensors and receivers used at this site. The red triangles extending from the receiver locations represent individual sensors and their orientation Figure 29. Nighttime occupancy rate results for receivers at Big Box Store host site with 30 second bin periods (top) and 5 minute bin periods (bottom) Figure 30. Aerial view of Office Building, B building in Southern California Figure 31. Sensor layout for southern half of Office Building, B site, northern half (top) and southern half (bottom) Figure 32. Nighttime occupancy rate results for receivers at Office Building, B host site with 30 second bin periods (top) and 5 minute bin periods (bottom) Figure 33. Sensor layout at the Outdoor Shopping Center. Sensors were placed throughout the parking structure, along the walkway between storefronts and along the roadway. The number labels R01 R24 represent the iv
5 location of the receivers, while the individual sensors and their orientation are represented by red triangles Figure 34. Nighttime occupancy rate results for receivers at Outdoor Shopping Center host site with 30 second bin periods (top) and 5 minute bin periods (bottom) Figure 35. The occupancy rates for all sites for nighttime (top) and daytime (bottom) hours Figure 36. Potential Energy Savings, Baseline Upgraded to Occupancy-Based Adaptive LED (%).67 Figure 37. Potential Energy Savings, Baseline Upgraded to Occupancy-Based Adaptive LED Controls Only (%).68 Figure 38. Potential Energy Savings, Static LED Upgraded to Occupancy-Based Adaptive LED (%).69 Figure 39. Potential Energy Savings for 50% Power Low Mode with Varied Simulations (kwh) 70 Figure 40. Potential Energy Use Reduction for Fixtures and Controls per Site (kwh). 72 TABLES Table 1: Parking areas installations and energy consumption... 8 Table 2: Market size for select market segments... 9 Table 3: Average daily lighting operating hours per lamp by subsector Table 4: Weekly hours of operation by commercial market sector Table 5: Potential demand and energy savings Table 6: Summary of occupancy rate calculations for the Large Office Building, A host site Table 7: Summary of occupancy rate results for Building Supply Franchise host site Table 8: Summary of occupancy analysis results for fast food restaurant host site Table 9: Summary of occupancy analysis results for K-12 School host site Table 10: Summary of occupancy rate analysis for Office Campus host site Table 11: Summary of occupancy rate analysis for the Big Box Store host site Table 12: Summary of occupancy rate analysis for Office Building, B Table 13: Summary of occupancy rate analysis for Outdoor Shopping Center host site Table 14: Site characteristics Table 15: Occupancy rates per binning resolution and calculation method employed Table 16: Host Site Baseline Assumptions for Simulated Energy Savings Table 17: Potential Energy Savings, Absolute Occupancy with 50% Power Low Mode Table 18: Potential Energy Savings, Average Occupancy with 50% Power Low Mode Table 19: Potential Energy Savings, Absolute Occupancy Calculation 20% Power Low Mode Table 20: Potential Energy Savings, Average Occupancy Calculation 20% Power Low Mode v
6 CONTENTS EXECUTIVE SUMMARY 1 INTRODUCTION 4 BACKGROUND: PHASE 1 SUMMARY 6 Market Sector Prioritization Methodology... 6 Market Sector Size Assessment... 6 Hours of Business Operation... 9 Vehicle and Pedestrian Occupancy Market Sub-Sector Prioritization Methodology EMERGING TECHNOLOGY 13 ASSESSMENT OBJECTIVES 14 TECHNOLOGY EVALUATION 14 TECHNICAL APPROACH 15 Implementation of Methodology Site Selection & Site Plan Development Equipment Installation Data Collection Equipment Removal Data Processing Data Reduction Data Plotting Data Stream Analysis Data Analysis RESULTS 22 Large Office Building, A Site Description Sensor Layout Data Analysis Building Supply Franchise Site Description Sensor Layout Data Analysis Fast Food Restaurant Site Description Sensor Layout vi
7 Data Analysis K-12 School Site Description Sensor Layout Data Analysis Office Campus Site Description Sensor Layout Data Analysis Big Box Store Site Description Sensor Layout Data Analysis Office Building, B Site Description Sensor Layout Data Analysis Outdoor Shopping Center Site Description and Sensor Layout Data Analysis Aggregate Results EVALUATIONS 54 RECOMMENDATIONS 66 APPENDIX 1 68 Large Office Building, A Building Supply Franchise Fast Food Restaurant K-12 School Office Campus Big Box Store Office Building, B Outdoor Shopping Center vii
8 EXECUTIVE SUMMARY Occupancy-based adaptive lighting is an evolving strategy that improves energy efficiency in both indoor and outdoor applications. This strategy is implemented through bi-level lighting control using dimmable or dual light sources and motion sensing technologies that reduce light levels during vacancy periods and provide full light output only during occupancy periods, substantially reducing energy consumption. For outdoor lighting this energy-savings strategy is most effective in spaces with intermittent occupancy patterns during evening and nighttime, and minimum light requirements for safety or other reasons, such as parking lots and garages, building perimeter and local auxiliary areas such as courtyards, and pedestrian pathways. As occupancy-based adaptive outdoor lighting is demonstrating promise for significant energy savings, utility companies are interested in supporting extensive implementation through rebate and incentive programs. As rebates and incentives are based on potential energy savings, utility partners initiated a research project focusing on quantifying occupancy patterns in different space types and locations to better understand energy savings potential. The project includes three phases: Phase 1: Develop initial methodological approach for determining outdoor occupancy profiles Completed in December 2011 Phase 2: Phase 3: Evaluate and finalize methodological approach through implementation in a small number of selected spaces In final stages; this document is the final report. Implement final methodological approach in a large number of outdoor spaces to generate required information for utility incentive and rebate programs To be discussed after completion of Phase 2. This document is the final report of Phase 2, focusing on implementation of the methodological approach in a small number of selected outdoor spaces, to determine its effectiveness and promise for successful continuation into Phase 3. The key objectives of Phase 2 were: Selection of appropriate cross section of space types and locations Installation of motion sensing and data collection technologies Data collection, processing, and analysis Development of occupancy profiles 1
9 Site selection involved all collaborating utilities and resulted in the selection of the following eight sites: Bonneville Power Administration Large Office Building, A Building Supply Franchise Fast Food Restaurant K-12 School Pacific Gas and Electric Office Campus Big Box Store Southern California Edison Office Building, B Outdoor Shopping Center Motion detection and data acquisition technologies were installed in selected areas with pedestrian and vehicular traffic at each site. Data processing involved the development of strategies for identification of abnormal data streams from hardware malfunctions and environmental interference. Data reduction and analyses were used to produce occupancy profiles. The occupancy profiles represent individual site occupancy patterns and can be used to estimate potential energy savings achievable through bi-level lighting controls. The data analyses show that energy savings depend significantly on implementation of control technologies, especially the nonmotion time period (a.k.a. time delay) used to determine vacancy. While the collected data can be used to simulate different time delays, it is limited in providing accurate energy savings predictions due to the small host site sample set. It is recommended that Phase 3 extend the method to validate the accuracy for potential energy savings predictions, requiring the installation of occupancy-based adaptive lighting systems side-by-side with the data acquisition system outlined in this report. This will support the evaluation of monitored energy use of the occupancy-based adaptive lighting system as compared to the estimated energy savings calculated using the occupancy profiles. Based on the implementation of the Phase 1 methodology and the data processing performed on the collected occupancy logs, it is recommended that Phase 3 of this study focus on validation of the method as an accurate manner to predict energy savings. It is recommended that occupancy profiles collected based on the technical approach described in Phase 2 be compared to energy logs of occupancy-based adaptive lighting systems installed and logged at similar sites for the same time frame. The occupancy-based adaptive lighting systems should be deployed at multiple test sites within each identified market sub-sector, sufficient to constitute a statistically relevant sample set. These installations can take place at any site meeting the definition of a market sector that is of interest to evaluate the use of occupancy-based adaptive exterior lighting systems based on Phase 1 work. Sites 2
10 that have historic occupancy profiles, such as the host sites used in Phase 2, should be prioritized to allow for the comparison of seasonal data at these locations to determine if 90 days is sufficient time to produce an accurate representation of the site s annual occupancy profile. It is recommended that installations of the occupancy-based adaptive lighting systems use varying motion sensing technologies, dimmable lighting sources and communication network architectures. Installations of occupancy-based adaptive lighting systems equipped with varying sensing technologies will allow for the study of the effect of using various different sensor technologies appropriate for outdoor applications. It is recommended that installations of the occupancy-based adaptive lighting systems incorporate the use of varying control strategies. Control strategies, such as fixture-level and zonal control, are key areas where research is needed to conclusively determine if they have a pronounced effect on energy savings. 3
11 INTRODUCTION Occupancy-based adaptive lighting refers to lighting systems that adjust their light output based on changes in the spaces they serve, such as occupancy, daylight, etc. While it is a relatively new strategy, it shows significant promise for increased energy savings in indoor and outdoor applications. Many occupancy-based adaptive lighting products are being developed and have been introduced into the marketplace, allowing dynamic lighting operation that offers substantial energy savings over nonadaptive systems. Occupancy-based adaptive lighting shows promise for significant savings in outdoor applications and utilities are considering implementation technologies for inclusion in their rebate and incentive programs. As the energy savings potential depends on occupancy profiles, utilities need to develop a better understanding of occupancy profiles for different outdoor space types and locations. Occupancy-based adaptive lighting is an evolving strategy that improves energy efficiency in both indoor and outdoor applications. This strategy is implemented through occupancy-based adaptive lighting systems using dimmable or dual light sources and motion sensing technologies that reduce light levels during vacancy periods and provide full light output only during occupancy periods, substantially reducing energy consumption. For outdoor lighting this energy-savings strategy is most effective in spaces with intermittent occupancy patterns during evening and nighttime, and minimum light requirements for safety or other reasons, such as parking lots and garages, building perimeter and local auxiliary areas such as courtyards, and pedestrian pathways. As occupancy-based adaptive outdoor lighting is demonstrating promise for significant energy savings, utility companies are interested in supporting extensive implementation through rebate and incentive programs. As rebates and incentives are based on potential energy savings, Pacific Gas and Electric (PG&E) and Southern California Edison (SCE) initiated a research project focusing on quantifying occupancy patterns in different space types and locations to better understand energy savings potential. The project includes three phases: Phase 1: Develop initial methodological approach for determining outdoor occupancy profiles - - Completed in December 2011 Phase 2: Phase 3: Evaluate and finalize methodological approach through implementation in a small number of selected spaces - In final stages; this document is the final report. Implement final methodological approach in a large number of outdoor spaces to generate required information for utility incentive and rebate programs - To be discussed after completion of Phase 2. 4
12 This document is the final report of Phase 2, focusing on implementation of the methodological approach in a small number of selected outdoor spaces, to determine its effectiveness and promise for successful continuation into Phase 3. The key objectives of Phase 2 were: Selection of appropriate cross section of space types and locations Installation of motion sensing and data collection technologies Data collection, management, reduction and analysis Development of occupancy profiles suitable for utility programs 5
13 BACKGROUND: PHASE 1 SUMMARY The simplified method to measure exterior site occupancy rates established in this study is a new concept developed to help utilities calculate expected energy savings from occupancy-based adaptive exterior lighting projects. The concept was derived from an initial market assessment performed by the California Lighting Technology Center (CLTC) in Phase 1 of this project. This market assessment was performed on behalf of Bonneville Power Administration, Pacific Gas and Electric Company and Southern California Edison. It focused on identifying savings opportunities in lighting applications that were identified following the market sector prioritization methodology. MARKET SECTOR PRIORITIZATION METHODOLOGY To determine where occupancy-based adaptive control strategies have the greatest potential impact on energy savings in the exterior environment, the three factors considered were: 1. Market sector size 2. Hours of business operation 3. Vehicle or pedestrian traffic Applications with the greatest potential to realize energy savings are characterized by a large market sector size, limited evening hours of operation, and low vehicle or pedestrian traffic during nighttime hours. Installing occupancy-based adaptive lighting systems in applications with low occupancy rates results in greater energy savings than in environments with higher occupancy rates. MARKET SECTOR SIZE ASSESSMENT The market sectors considered in the assessment are the residential, commercial and industrial building sectors, and the outdoor sector. According to the Department of Energy s 2010 U.S. Lighting Market Characterization report, the commercial sector makes up half of national lighting energy use in the United States. The industrial and outdoor sectors each constitute approximately two percent of the total national installed stock of lamps, but the industrial sector accounts for eight percent of total lighting energy use and the outdoor sector constitutes 17 percent of U.S. lighting energy use (see figure 1). This is due to the common use of high-intensity discharge (HID) lamps and the longer operating hours typical of the industrial and outdoor market sectors. Figure 1 displays the breakdown of the lamp inventory estimates, total lighting electricity consumption, and the lumens produced by sector. Note that the listed values for the commercial and industrial sectors in this dataset include only interior lighting; outdoor lighting is represented as a separate market sector. 6


14 FIGURE 1: U.S. LIGHTING LAMP INVENTORY, ELECTRICITY CONSUMPTION AND LUMEN PRODUCTION 1 FIGURE 2: U.S. LIGHTING ELECTRICITY CONSUMPTION BY SECTOR AND LAMP TYPE 2 1 Figure 5-2. Building Technologies Program U.S. Lighting Market Characterization. U.S. Department of Energy, January PDF file. 2 Figure 5-3. Building Technologies Program U.S. Lighting Market Characterization. U.S. Department of Energy, January PDF file. 7
15 PARKING AREAS A large sector of exterior commercial lighting illuminates parking lots and above-ground parking garages. There is currently no national or statewide inventory of all parking facility lighting, as confirmed by the International Parking Institute. 3 Nor is there a commonly accepted number of total U.S. parking spaces; estimates can range from 100 million to 2 billion. Still, data from Department of Energy (DOE) sources and information provided by the Commercial Building Energy Alliance (CBEA) and a University of California study indicate an estimated total of 420 million parking spaces are in U.S. commercial parking lots and garages. 4 A 2011 DOE report estimated there were 395 million parking lot spaces in the U.S. This includes noncommercial spaces. Estimates received from the Commercial Building Energy Alliance indicate that 20% of the 395 million spaces can be assumed to be non-commercial parking spaces. Parking garage spaces are not included in the DOE report. The total number of parking garage spaces in the U.S. was estimated based on the CBEA and the University of California studies. Table 1 summarizes the estimated number of parking spaces in U.S. commercial parking lots and parking garages, as well as the number of installed lamps (based on the estimated number of parking spaces) and calculated annual energy consumption, in terawatt hours (TWh) for these applications. TABLE 1: PARKING AREAS INSTALLATIONS AND ENERGY CONSUMPTION PARKING AREA TYPE ESTIMATED NUMBER QUANTITY OF ANNUAL ENERGY OF PARKING SPACES LAMPS CONSUMPTION Commercial Parking Lots 316,000,000 15,800, TWh Parking Garages 104,000,000 34,700, TWh The total number of lighting installations in parking garages and lots across the U.S. can be estimated based on the estimated total number of parking spaces. Typical design guidelines specify one lamp per every three garage spaces and one per every twenty parking lot spaces. Applying these guidelines, commercial parking areas are estimated to contain approximately 51 million luminaires, a majority of which use HID sources. Nationally, outdoor lighting represents 17% (about 118 TWh of electricity) of all energy used by lighting tasks. 5 According to the CBEA, parking area lighting consumes approximately 68 TWh annually, or approximately 58% of all energy consumed for outdoor lighting. Parking garage lighting is not included in this value, as parking garages are considered unconditioned, interior spaces. When parking garage lighting is included, total annual lighting consumption for parking lighting is estimated at 96 TWh. 3 Page 18. Building Technologies Program U.S. Lighting Market Characterization. U.S. Department of Energy, January PDF file. 4 Page 18. Building Technologies Program U.S. Lighting Market Characterization. U.S. Department of Energy, January PDF file. 5 Table ES.1. Building Technologies Program U.S. Lighting Market Characterization. U.S. Department of Energy, January PDF file. 8
16 Commercial retail establishments outnumber commercial non-retail establishments by more than two to one. Public schools and healthcare facilities are even smaller in number. The market size metrics outlined in table 2 are critical when considering the potential impact of market-specific energy savings. These metrics do not address the number of parking lots associated with each type of space, nor do they account for shared parking lots or public street parking. Yet, based on the number of establishments alone, the potential impact of a whole-market move to occupancy-based adaptive exterior lighting appears to be significantly larger for retail and office spaces than for other market segments considered below. TABLE 2: MARKET SIZE FOR SELECT MARKET SEGMENTS ESTABLISHMENT TYPE NUMBER OF ESTABLISHMENTS CA retail establishments 6 : 607,893 CA non-retail commercial establishments 7 : 284,104 CA public schools (K 12) 8 : 10,296 CA health care facilities 9 : 5,685 HOURS OF BUSINESS OPERATION The hours of business operation affect pedestrian and vehicle traffic volumes at a facility. Longer hours of operation generally entail higher volumes of evening traffic. This decreases energy savings, as occupancy-based adaptive luminaires operate in high mode for longer periods of time in areas with higher occupancy rates spread over longer hours of operation. That said, facilities with longer hours of overall lighting operation also have more opportunity to realize energy savings with occupancy-based adaptive lighting controls. Error! Reference source not found. lists typical operating hours per day for each lamp type in the building exterior and parking sub-sectors of commercial and industrial spaces. This data represents average daily operating hours throughout the year and accounts for differences between high-use and low-use days. The data is based on geographically and seasonally adjusted metering statistics collected in Southern California. 6 EC0744SLLS1, Retail Trade: Subject Series Product Lines: Product Lines Statistics by Kind of Business for the United States and States: American FactFinder. U.S. Census Bureau, 2007 Economic Census County Business Patterns (NAICS). United States Census Bureau. U.S. Department of Commerce, n.d.. Web. 27 March Fingertip Facts on Education in California. CalEdFacts. California Department of Education, May Web. 25 March Facility Listings. Healthcare Information Division. State of California Office of Statewide Health Planning & Development, January Web. 27 March
17 TABLE 3: AVERAGE DAILY LIGHTING OPERATING HOURS PER LAMP BY SUBSECTOR 10 INCAN- HALOGEN CFL LINEAR MV MH HPS LPS LED OTHER AVERAGE DESCENT FLUORESCENT Building Exterior Parking N/A N/A Average As table 3 indicates, exterior luminaires for buildings and parking areas operate, on average, about 12.2 hours per day, or about 85 hours per week. This value encompasses data on both commercial and industrial spaces. Comparing this value of 85 hours to averages based on commercial building type (listed in table 4), we can establish which building types typically have below-average levels of occupancy. Educational buildings (K 12 schools), offices, warehouses (industrial) and mercantile (retail) spaces all have below-average levels of effective lighting hours per week. TABLE 4: WEEKLY HOURS OF OPERATION BY COMMERCIAL MARKET SECTOR 11 BUILDING TYPE OPERATING EFFECTIVE % OF WEEK HOURS PER WEEK LIGHTING HOURS ( AVERAGE) PER WEEK Education % Office % Warehouse % Mercantile % Other % Food Service % Food Sales % Public Order & Safety % Health Care % Lodging % 10 Table Building Technologies Program U.S. Lighting Market Characterization. U.S. Department of Energy, January PDF file Figure 3. Lighting in Commercial Buildings. Energy Information Administration, Office of Energy Markets and End Use. U.S. Department of Energy, March PDF file. 10
18 VEHICLE AND PEDESTRIAN OCCUPANCY Market sectors with lower occupancy rates during nighttime hours stand to save the most energy by implementing occupancy-sensitive controls in their exterior lighting systems. Reliable data on the effects of pedestrian traffic in parking spaces is limited for most exterior space types. The results of this study will increase the available data on pedestrian traffic patterns in commercial spaces. MARKET SUB-SECTOR PRIORITIZATION METHODOLOGY Market information was collected to determine the number of commercial establishments in California, 12 the number of schools in California, 13 their energy usage by Functional Use Area (FUA), 14 the energy demand by FUA, 15 and the average lighting power density (LPD) by building type and FUA. 16 The square footage of the functional use areas for the various building types came from estimations using Google Maps. Power (kw) was then calculated using estimated square footage and lighting power density (LPD). The hourly demand profile 17 provided the percent of peak demand for each FUA. The demand per hour was calculated for FUA assuming that the percent of peak demand is the same for each FUA. Energy use was calculated for each FUA using the assumed demand per hour data and compared with actual energy use data in order to determine the validity of this approach and create correction factors for each FUA. Then an estimate was made for the occupancy for each hour, for each building type. This was multiplied by the demand per hour for each building type. Using this data, it was possible to calculate the estimated demand baseline, the estimated demand based on occupancy, and the potential demand savings for each building type and FUA per hour. It was also possible to calculate the estimated energy baseline, the estimated energy based on occupancy, and the potential energy savings for each building type and FUA per hour. The final calculations included the correction factors. It was assumed that when a space was not occupied, the lighting power level dropped to 50% County Business Patterns (NAICS). United States Census Bureau. U.S. Department of Commerce, n.d.. Web. 25 March Digest of Education Statistics. National Center for Education Statistics. Institute of Education Studies U.S. Department of Education, n.d.. Web. 25 March Table 4. Outdoor Lighting Baseline Assessment. Integrated Energy Systems Productivity and Building Science. California Energy Commission Public Interest Research Program, November PDF file Figure 3. Outdoor Lighting Baseline Assessment. Integrated Energy Systems Productivity and Building Science. California Energy Commission Public Interest Research Program, November PDF file Table 13. Outdoor Lighting Baseline Assessment. Integrated Energy Systems Productivity and Building Science. California Energy Commission Public Interest Research Program, November PDF file Figure 3. Outdoor Lighting Baseline Assessment. Integrated Energy Systems Productivity and Building Science. California Energy Commission Public Interest Research Program, November PDF file. 11
19 Note that the data for the percent of time that the exterior space for each building type is occupied is not available. The purpose of this study is to learn more about these occupancy patterns. The data used for this analysis is just an estimate. TABLE 5: POTENTIAL DEMAND AND ENERGY SAVINGS MARKET SEGMENT BUILDING TYPE NUMBER OF CA DEMAND ANNUAL ENERGY PERCENTAGE OF 2010 Commercial Non-retail Retail Academic institution (K 12) ESTABLISHMENTS SAVINGS SAVINGS COMMERCIAL EXTERIOR (2010) POTENTIAL POTENTIAL LIGHTING (MW) (GW H) (5,849 GWH) Small office 140, % Large office 162, % Full-service 75, % restaurant Grocery 17, % Small retail 43, % Large retail 39, % Small schools 8, % Large schools 2, % Academic Institutions K 12 schools are excellent candidates for outdoor occupancy-based adaptive lighting, as they exhibit very low levels of nighttime occupancy, but they have less potential for statewide impact than other spaces simply because they are fewer in number than other spaces (retail, for example). California has 10,296 public K 12 schools, 18 which typically operate about 61 hours per week. 19 Commercial Spaces Non-retail Non-retail commercial spaces make up a significant portion of California s commercial building space. Office spaces are an especially attractive sub-section of this market segment because of their low hours of operation (69 hours per week) Fingertip Facts on Education in California. CalEdFacts. California Department of Education, May Web. 25 March Figure 3. Lighting in Commercial Buildings. Energy Information Administration, Office of Energy Markets and End Use. U.S. Department of Energy, March PDF file Figure 3. Lighting in Commercial Buildings. Energy Information Administration, Office of Energy Markets and End Use. U.S. Department of Energy, March PDF file. 12
20 Industrial Spaces Like non-retail commercial spaces, industrial warehouses, especially those used for manufacturing and storage, have below-average hours of operation and tend to require large parking areas for employees. 21 Retail Spaces Retail spaces have somewhat variable hours of operation and often do not have a private parking area, but retail establishments are significantly greater in number compared to the other market sectors examined. 22 EMERGING TECHNOLOGY Occupancy-based adaptive exterior lighting systems have demonstrated their potential to achieve substantial energy savings and are being implemented on a growing scale. The energy savings of occupancy-based adaptive lighting strategies are clearly tied to occupancy patterns. Because of this, utilities and similar stakeholders are developing a method to quantify the expected energy savings associated with this emerging technology in a repeatable and reliable manner. During the first phase of the Exterior Occupancy Survey, completed in 2011, a methodology was developed to quantify pedestrian and automobile occupancy rates for non-residential exterior spaces. For exterior spaces and applications to be included in the site surveys, the methodology included recommended survey metrics, data collection and analysis procedures, appropriate data collection equipment, equipment placement, and other necessary monitoring requirements. The implementation and evaluation of the methodology developed in Phase 1 is the product under evaluation in this technology assessment. Without reliable occupancy pattern information, utilities are unable to create a deemed incentive for occupancy-based adaptive exterior lighting systems. 21 Figure 3. Lighting in Commercial Buildings. Energy Information Administration, Office of Energy Markets and End Use. U.S. Department of Energy, March PDF file California Commercial End Use Survey. Itron, Inc. California Energy Commission, March PDF file. 13
21 ASSESSMENT OBJECTIVES This study serves to evaluate the proposed methodology in identified applications, outlined in the Background section, with the greatest potential for energy savings based on logged occupancy triggers and calculated occupancy rates. The methodology requires a system of equipment to be used that can detect and log occupancy triggers. Data reduction and analysis is required to process the occupancy trigger logs. The type of sensor technology used such as passive infrared, ultrasonic, dual technology, or microwave, as well as the strategy selected for data analysis will both influence occupancy profile results. Commercially available sensors used to log occupancy triggers and various approaches to computational analysis will be evaluated to conclusively determine the best implementation of this methodology. TECHNOLOGY EVALUATION In response to increased use of occupancy-based adaptive exterior lighting products and their potential for substantial energy savings, utility companies are interested in creating incentive programs focused on occupancy-based adaptive exterior lighting technology. To achieve this goal, a simplified method is necessary for utilities to easily calculate expected energy savings and associated incentives. The method developed in Phase 1 outlines a recommended set of design steps, equipment specification and data analysis needed to characterize occupancy patterns that will, in turn, allow for the estimation of energy savings in outdoor applications. The methodology employs the use of occupancy sensing technologies, data acquisition equipment and computational analysis to reduce and analyze data collected over time into a representative occupancy profile. Field deployments have been conducted at host sites selected according to the market assessment requirements identified in the Background section of this report. 14
22 TECHNICAL APPROACH The technical approach to evaluate the proposed methodology of Phase 1 was conducted in two parts: the implementation of the methodology and the data processing. The methodology included the site selection, site plan development, equipment specification and installation, data collection and equipment removal. Data processing included the data reduction, data plotting and data stream analysis. Data analysis included the use of collected occupancy profiles to calculate occupancy rates. IMPLEMENTATION OF METHODOLOGY The steps taken to implement the Phase 1 methodology are provided below. SITE SELECTION & SITE PLAN DEVELOPMENT Host sites were selected based on their adherence to the criteria summarized in the Background section of this report. Site plan development includes the compilation of the following installation details: the coverage patterns of each sensor, the pole or other structure serving as the mounting location for each sensor, and the approximate location where the receivers need to be mounted. EQUIPMENT INSTALLATION A site visit was made by CLTC to perform verification testing to finalize the proposed mounting locations based on site conditions and signal strength. The site plan was modified according to the in-situ findings. Third party contractors and/or utility personnel installed the occupancy data acquisition hardware at each site. An initial review of real-time preliminary data gathered after the installation of equipment was performed and the site plan was revised as appropriate. The data acquisition system (DAQ) utilizes a network of battery-powered, outdoor-rated passive infrared (PIR) motion sensors with integrated wireless transmitters (Model: Optex TD-20U). The sensor field of view can be configured for a long-range beam pattern or a short-range fan pattern. The sensor signals were monitored remotely with indoor-rated receivers (Model: Optex RC-20U) that require a 120 Volt alternating current source. Each receiver can be paired with up to nine sensors. Data was recorded from the receivers with battery-powered data loggers (Model: HOBO - UX M or HOBO U30). The DAQ equipment is depicted in figure 3. All sensors were divided into groups, typically consisting of 1 3 sensors. Each sensor group used a common receiver. The receivers emit a voltage pulse whenever any sensor in the group detects motion. The triggering events are logged by the data logger. Figure 4 shows the configuration and interaction of the various DAQ system components. 15
 RECEIVER;")

23 FIGURE 3: DAQ EQUIPMENT: (LEFT) DATA LOGGER; (CENTER) RECEIVER; (RIGHT) PIR SENSOR. FIGURE 4: INTERACTION OF THE DAQ SYSTEM COMPONENTS 16
24 The PIR sensors communicate with the paired receiver when motion is detected. The receiver emits a pulse to the connected data logger. The data logger registers the receiver pulse and increases the count by one for that bin period. The data logger records the date and time for the start of the bin period, and the number of counts detected during that bin period. A 30-second bin period was used for four sites and a 5-minute bin period was used for four sites. The four channel data loggers each generate an output file tracking the date and time of occupancy triggers. DATA COLLECTION Data was collected at each host site for a 90-day period. Data was downloaded intermittently to verify operation of equipment. The raw data file from a single data logger is shown in figure 5. FIGURE 5: DATA FROM A SINGLE DATA LOGGER EQUIPMENT REMOVAL Third party contractors were hired to remove the occupancy data acquisition hardware at each site. Equipment was shipped back to project engineers for final data download. DATA PROCESSING All data collected at the eight host sites went through a data processing procedure. This procedure included data reduction, plotting and analysis. 17

25 DATA REDUCTION The first data reduction step was the consolidation of the raw data streams generated from the multiple data loggers into one master Excel file. The number of raw data streams varied from site to site, based on the size of the monitored area. At each site, the consolidated data streams were then analyzed for inconsistent start and stop times. Engineers trimmed the raw data streams to ensure data analysis was conducted for the time frame when all data receivers were actively collecting data from their respective sensors. This was accomplished by referencing the time stamp for each data stream. Once the time of operation was determined for each of the receivers, the master Excel file was trimmed down to only include data from dates when all receivers were operational. DATA PLOTTING Graphs were created for each of the raw data streams to create a visual representation of activity within the monitoring area associated with each receiver over the deployed time period. These graphs were created with the use of a software tool, either Matlab or Excel for this analysis. The selection of the software tool was dependent on the file size of each host site. FIGURE 6: MATLAB GRAPH OF DATA STREAM FROM BIG BOX STORE HOST SITE RECEIVER NO. 34, FOR 30-SECOND BINNING PERIOD, 9/9/2013 1/30/2014 DATA STREAM ANALYSIS After completing the data reduction, consolidated data streams were analyzed. This process consisted of reviewing the data streams, graphs and site conditions for each receiver. The analysis prioritized the identification of abnormalities or errors within the data streams. These abnormalities were compared to installation maps and logs to aid in identifying the source of the abnormality. Data streams with abnormalities are indicative of receivers that logged data uncorrelated to expected activity trends within the receiver s operating area, or extremely uncorrelated to observed trends from data logged by other receivers in its spatial proximity. Sources of observed abnormalities or errors were identified as a weak signal between sensor and receiver, loss of power to data acquisition hardware components, and sensor interference. Types of sensor interference included a range of issues, from tree branches triggering sensors and causing abnormally large spikes in occupancy data to construction limiting occupants access to the detection area covered by a sensor. These instances of data interference were determined through a 18
 AND ZOOMED IN ON R08 (BOTTOM). RECEIVERS R07 AND R08 WERE MONITORING AREAS CLOSE TO ONE ANOTHER.")
26 combination of observations made during the installation, during the removal of the monitoring equipment, and in reviewing the data. FIGURE 7: GRAPHS OF DATA STREAMS FROM RECEIVERS R07 AND R08 AT OFFICE CAMPUS SITE, FULL VIEW (TOP) AND ZOOMED IN ON R08 (BOTTOM). RECEIVERS R07 AND R08 WERE MONITORING AREAS CLOSE TO ONE ANOTHER. INTERFERENCE, CAUSING EXCEPTIONALLY HIGH VALUES TO BE LOGGED, WAS CAUSED BY TREE BRANCHES HANDING IN FRONT OF A SENSOR CONNECTED TO R08. Data acquisition equipment issues also contributed to data streams being omitted from the analysis of the sites. These equipment issues consisted of unplugged receivers, general loss of signal or signal weakness. 19

27 FIGURE 8: GRAPH OF DATA STREAM FROM RECEIVER R06 AT OUTDOOR SHOPPING CENTER SITE, FULL VIEW (TOP) AND ZOOMED IN (BOTTOM). THIS GRAPH DEPICTS A SITUATION WHEN DATA LOGGING WAS LOST DUE TO LOSS OF POWER. WHEN UNINSTALLING THE EQUIPMENT AT THIS SITE, THE RECEIVER S POWER SUPPLY WAS FOUND TO HAVE COME UNPLUGGED. FIGURE 9: GRAPH OF DATA STREAM FROM RECEIVER R10 AT OUTDOOR SHOPPING CENTER SITE. THIS GRAPH DEPICTS A SITUATION WHEN NO DATA WAS LOGGED FROM THE RECEIVER. The results of the review is tracked within an Excel file for each of the receiver data streams for reference. FIGURE 10: EXAMPLE OF DATA STREAM REVIEW OF DOCUMENTATION FROM OFFICE CAMPUS SITE. THE RECEIVERS HIGHLIGHTED IN YELLOW REPRESENT RECEIVERS WITH DATA STREAMS THAT SHOULD BE INCLUDED IN DATA ANALYSIS FOR THE SITE, WHILE THE RECEIVERS HIGHLIGHTED IN RED REPRESENT DATA STREAMS THAT SHOULD BE OMITTED IN THE ANALYSIS OF THE SITE. The data stream review document for each receiver includes: Number of sensors connected to the receiver, start date and end date of data collection, installation notes, general observations and trends 20
28 within the data, outstanding issues, graph scale size, and final determination on the inclusion of the data in the final analysis. DATA ANALYSIS To determine the occupancy profiles of each site, new metrics were defined to allow for the most accurate characterization of the occupancy-based adaptive exterior lighting applications identified in Phase 1 of this effort. These metrics are constricted by the binning resolution of raw data collected at the site and the time-of-day definitions. Binning resolution of occupancy trigger data is limited by the deployment settings of the data acquisition hardware. For the data collected in this study, four sites were deployed using the 30-second binning setting and four sites were deployed using the 5-minute setting. Analysis can be performed to create any binning period greater than the resolution of the raw data. For sites with 30-second binning resolution data, analysis is performed for 30-second and 5-minute resolutions, closely simulating timeout periods of exterior occupancy sensors available today. For sites with 5-minute resolution data, analysis was performed for 5-minute resolution only. Occupancy rates were calculated based on the definition of the period of interest. For occupancy-based adaptive exterior lighting systems, this is assumed to be nighttime. Data was collected continuously at each site, allowing for both day and night occupancy calculations. Day and night time periods are defined by sunrise and sunset specific to each day and site. Data can be analyzed on an hourly basis if determined necessary. Data streams can also be binned into applicable day-of-use categories, such as weekends and weekdays. For this analysis occupancy rates were calculated without discriminating between weekday and weekends. Both absolute occupancy rates and average occupancy rates were calculated for the eight participating host sites. Absolute occupancy rates provide estimates of occupancy for the whole site based on data which indicates occupancy anywhere within the monitored area. With absolute occupancy, the entire site is considered occupied if any sensor detects motion. Average occupancy rates reflect an average of data collected at the receiver level for the whole site. With the average occupancy calculation method, the occupancy rate is equal to the number of bin periods with occupancy detected by any receiver within the timeframe under consideration, divided by the total number of bin periods in that timeframe. Average site occupancy reflects data collected by individual receivers. A receiver s occupancy rate is determined by taking the number of nighttime bin periods where motion was detected by any sensor connected to that receiver, and dividing it by the total number of nighttime bin periods. 21

29 RESULTS Within this section of the report, each of the eight participating host sites is addressed individually. For each site, a summary of site parameters, occupancy data acquisition equipment used, installation details, and a summary of the calculated site occupancy results are included. Figure 11 provides a map of the sites, offering an overview of their locations. FIGURE 11: OVERVIEW OF HOST SITES 22

30 LARGE OFFICE BUILDING, A SITE DESCRIPTION FIGURE 12: LARGE OFFICE BUILDING, A HOST SITE Large Office Building, A, is a municipal facility in the Pacific Northwest which occupies approximately 15 acres, include one larger main complex, a second smaller building and two large parking areas. Sensors were placed to monitor traffic in the larger north parking lot. Monitoring was conducted from July 31, 2013 to September 27, This site was selected to represent commercial spaces operating less than 24 hours a day. The sensor layout is shown in figure

31 SENSOR LAYOUT FIGURE 13: OCCUPANCY ANALYSIS FOR THE LARGE OFFICE BUILDING A WAS CONDUCTED CONSIDERING EIGHT RECEIVERS, WHICH REPRESENT OCCUPANT DETECTIONS FROM 14 PIR SENSORS. DATA WAS COLLECTED IN FIVE-MINUTE INTERVALS. Traffic at the Large Office Building, A falls into two categories: office employees, who access the space on a Monday through Friday, 8 a.m. to 5 p.m. schedule, and public visitors. Two parking lots directly behind the building provide parking for employees, the public and service vehicles. Receivers R07 and R08 monitored entrances and exits and correspondingly recorded occupancy rates higher than the average of all receivers. The highest nighttime occupancy rate was observed by R05, which was located in the interior of the parking lot, closest to the building facilities. The lowest rates were observed farthest from the building facilities by receivers R01 and R02, which are located at the north end of the parking lot. 24
32 Occupancy Rate (%) Emerging Technologies Program DATA ANALYSIS 14% Large Office Building, A: Nighttime Occupancy 5-minute bins, 6/21/2013 9/24/ % 10% 8% 6% 4% 2% 0% 1.50% Absolute Site Occ. = [VALUE] Average of Receiver Occ. = [VALUE] 0.90% 3.33% 1.67% 8.48% 2.66% 3.64% R01 R02 R03 R04 R05 R06 R07 R08 Receivers 4.43% FIGURE 14: NIGHTTIME OCCUPANCY RATE RESULTS FOR RECEIVERS AT LARGE OFFICE BUILDING A HOST SITE. TABLE 6: SUMMARY OF OCCUPANCY RATE CALCULATIONS FOR THE LARGE OFFICE BUILDING, A HOST SITE RECEIVERS OCCUPANCY BIN PERIOD TIME OCCUPANCY RATE All Absolute 1 30 sec Night n/a 3 All Average 2 30 sec Night n/a All Absolute 30 sec Day n/a All Average 30 sec Day n/a All Absolute 5 min Night 12.63% All Average 5 min Night 3.33% All Absolute 5 min Day 75.27% All Average 5 min Day 41.02% 1 Absolute occupancy: To compute this value, the entire site is assumed to be occupied if any sensor detects motion. The percentage listed is equal to the number of nighttime bin periods where any receiver detected motion, divided by the total number of nighttime bin periods. 2 Average occupancy: The percentage listed is the average of the individual receiver occupancy rates. These individual receiver occupancy rates are determined by taking the number of nighttime bin periods where motion was detected by any sensor connected to that receiver, divided by the total number of nighttime bin periods. 3 Data for 30-second bins is not available for Washington sites. 25

33 BUILDING SUPPLY FRANCHISE SITE DESCRIPTION Host Site FIGURE 15: THE BUILDING SUPPLY FRANCHISE HOST SITE IS LOCATED IN A SUBURBAN AREA SURROUNDED BY RESIDENTIAL AND SMALL COMMERCIAL STRUCTURES. This site is a typical retail location of a building supply franchise in an eastern Washington suburb near a city of 30,000 people. The site is immediately surrounded by residential and small commercial structures. 26

34 SENSOR LAYOUT FIGURE 16: SENSOR LAYOUT AT BUILDING SUPPLY FRANCHISE HOST SITE. The premises, which occupy approximately nine acres, include one large building housing the retail operations, one large parking lot, one loading dock, one limited parking area, and roadways around the building perimeter. Sensors were installed to monitor activity in the larger north parking lot. Monitoring was conducted from August 28, 2013 to December 1, As a big-box retailer, this site was selected to represent commercial retail with less than 24-hour operation. 27
35 Occupancy Rate (%) Emerging Technologies Program DATA ANALYSIS Building Supply Franchise Nighttime Occupancy 5-minute bins, 8/28/ /5/ % 60% Absolute Site Occ. = [VALUE] 50% 40% 30% Average of Receiver Occ. = [VALUE] 27.22% 31.78% 30.53% 33.13% 20% 10% 17.64% 21.34% 9.47% 10.56% 12.54% 18.93% 11.79% 14.30% 0% R01 R02 R03 R04 R05 R06 R07 R08 R09 R10 R11 R12 Receiver FIGURE 17: NIGHTTIME OCCUPANCY RATE RESULTS FOR RECEIVERS AT BUILDING SUPPLY FRANCHISE HOST SITE. The highest nighttime occupancy rates were reported by sensors R05, R07, R08, and R12, which monitor the most utilized store entrances. The lowest nighttime occupancy rates were recorded by R03, R06, R09, and R11. These receivers monitor typical and fringe parking spaces. TABLE 7: SUMMARY OF OCCUPANCY RATE RESULTS FOR BUILDING SUPPLY FRANCHISE HOST SITE. RECEIVERS OCCUPANCY BIN TIME OCCUPANCY RATE PERIOD All Absolute 30 sec Night n/a All Average 30 sec Night n/a All Absolute 30 sec Day n/a All Average 30 sec Day n/a All Absolute 5 min Night 60.82% All Average 5 min Night All Absolute 5 min Day 98.86% All Average 5 min Day 61.64% 28

36 FAST FOOD RESTAURANT SITE DESCRIPTION FIGURE 18: THIS FAST-FOOD SITE, OUTLINED IN RED, IS LOCATED IN SOUTHEAST WA AND IS SURROUNDED BY RESIDENTIAL AND RETAIL SPACES. This site is a fast-food restaurant located in southeast Washington. The premises occupy approximately one acre. The facilities at this site include a single fast-food restaurant structure with a drive-through and a small parking lot. This site was selected to represent commercial retail with 24-hour operation. 29

37 SENSOR LAYOUT FIGURE 19: SENSOR LAYOUT AT FAST FOOD RESTAURANT HOST SITE IN SOUTHEAST WASHINGTON. R01 R03 REPRESENT THE LOCATIONS OF THE THREE RECEIVERS USED AT THIS SITE. THE RED TRIANGLES EXTENDING FROM THE RECEIVER LOCATIONS REPRESENT INDIVIDUAL SENSORS AND THEIR ORIENTATION. Sensors were placed throughout the parking lot on the south and west sides of the restaurant. Receivers R01 and R03 monitored vehicular traffic entering or exiting the site, with a secondary function of monitoring the limited amount of parking within their view area. Receiver R03 operated with a dual primary function of monitoring vehicles moving through and parking within the lot. Monitoring at this site was conducted from June 3, 2013 to September 17,
38 Occupancy Rate (%) Emerging Technologies Program DATA ANALYSIS 100% Fast Food Restaurant Nighttime Occupancy 5 minute bins, 6/3/2013 9/17/ % 80% 70% 60% 50% 40% 30% 20% 10% 0% Absolute Site Occ. = [VALUE] Average of Receiver Occ. = [VALUE] R01 R02 R03 Receiver FIGURE 20: NIGHTTIME OCCUPANCY RATE RESULTS FOR RECEIVERS AT FAST FOOD RESTAURANT HOST SITE The highest occupancy rates were detected by R01 and R03, which primarily monitor vehicles entering and exiting the parking lot. These higher occupancy rates are related to the location of the receivers, which each monitor one of the two possible entrances or exits to the site. Due to the nature of the restaurant business, this site is expected to experience a higher rate of occupancy at standard meal times such as breakfast, lunch and dinner. Since the time frames of these meal-time increases in occupancy stay fairly constant throughout the year, it should be expected that the occupancy rates in a night and day comparison will shift depending on the time of year being viewed. During the time of year of this site study, sunrise ranges from about 5:00 a.m. to 6:30 a.m. and sunset ranges from 7:00 p.m. to 8:40 p.m. 31
39 TABLE 8: SUMMARY OF OCCUPANCY ANALYSIS RESULTS FOR FAST FOOD RESTAURANT HOST SITE. RECEIVERS OCCUPANCY BIN PERIOD TIME OCCUPANCY RATE All Absolute 2 30 sec Night n/a 1 All Average 3 30 sec Night n/a All Absolute 30 sec Day n/a All Average 30 sec Day n/a All Absolute 5 min Night 68.45% All Average 5 min Night 57.27% All Absolute 5 min Day 80.64% All Average 5 min Day 78.86% 1 Data for 30 second bins is not available. 2 Absolute occupancy: The entire site is assumed to be occupied for the duration of a given bin period if any sensor detects motion during that bin. The percentage given is equal to the number of nighttime bin periods where any receiver detected motion, divided by the total number of nighttime bin periods. 3 Average occupancy: The percentage listed is the average of the individual receiver occupancy rates. These individual receiver occupancies rates are determined by taking the number of nighttime bin periods where motion was detected by any sensor connected to that receiver, divided by the total number of nighttime bin periods. 32

40 K-12 SCHOOL SITE DESCRIPTION Sensors Here FIGURE 21: THE K-12 SCHOOL HOST SITE IN SOUTHEAST WASHINGTON, SURROUNDED BY RESIDENTIAL NEIGHBORHOODS AND AGRICULTURAL FIELDS. This site is a K-12 School representing academic K-12 sites. The site occupies approximately forty acres, including several building structures and recreational sports fields. For this study, sensors were installed in the southeast parking lot. The site is located in a suburban community in Southeast Washington and is surrounded by residential neighborhoods and agricultural land. Monitoring was conducted from May 31, 2013 to September 24, Within this monitoring period, school was in session from August 27 to June 7. 33

41 SENSOR LAYOUT FIGURE 22: SENSOR LAYOUT AT THE K-12 SCHOOL HOST SITE IN SOUTHEAST WASHINGTON. NUMBER LABELS 1 6 CORRESPOND TO RECEIVERS R01 R06 IDENTIFIED ELSEWHERE IN THIS REPORT. The sensors installed at the K-12 School host site monitored vehicular traffic entering or exiting the parking lot. They are connected to receivers R01, R02 and R06. Vehicles entering or exiting parking spaces were detected by sensors connected to the R03, R04 and R05 receivers. 34
42 Occupancy Rate (%) Emerging Technologies Program DATA ANALYSIS K-12 School Nighttime Occupancy 5-minute bins, 5/31/2013 9/24/ % 16% 14% 12% 10% 8% 6% 4% 2% 0% 7.13% Absolute Site Occ. = [VALUE] Average of Receiver Occ. = [VALUE] 9.54% 8.89% 2.61% 4.47% 0.98% R01 R02 R03 R04 R05 R06 Receivers FIGURE 23: NIGHTTIME OCCUPANCY RATE RESULTS FOR RECEIVERS AT K-12 SCHOOL HOST SITE. The highest occupancy rates were detected by receivers R01 and R02, which monitor vehicular traffic entering or exiting the lot as well as pedestrian traffic, and by receiver R03, which monitors the parking spaces on the north end of the parking lot. The individual and average receiver occupancy rates are all well below the absolute nighttime site occupancy rate of 16.12%. TABLE 9: SUMMARY OF OCCUPANCY ANALYSIS RESULTS FOR K-12 SCHOOL HOST SITE. RECEIVERS OCCUPANCY BIN PERIOD TIME OCCUPANCY RATE All Absolute 2 30 sec Night n/a 1 All Average 3 30 sec Night n/a All Absolute 30 sec Day n/a All Average 30 sec Day n/a All Absolute 5 min Night 16.12% All Average 5 min Night 5.60% All Absolute 5 min Day 50.85% All Average 5 min Day 19.65% 1 Data for 30-second bins is not available. 2 Absolute occupancy: The entire site is assumed to be occupied for the duration of a given bin period if any sensor detects motion during that bin. The percentage given is equal to the number of nighttime bin periods where any receiver detected motion, divided by the total number of nighttime bin periods. 3 Average occupancy: The percentage listed is the average of the individual receiver occupancy rates. These individual receiver occupancies rates are determined by taking the number of nighttime bin periods where motion was detected by any sensor connected to that receiver, divided by the total number of nighttime bin periods. 35

43 OFFICE CAMPUS SITE DESCRIPTION Area 2 Area 1 FIGURE 24: AERIAL IMAGE OF THE OFFICE CAMPUS HOST SITE, PREDOMINANTLY SURROUNDED BY COMMERCIAL AND SOME RESIDENTIAL SPACES. The Office Campus host site is located in northern California and occupies approximately 60 acres. 36

 AND AREA 2 (BOTTOM).")
44 SENSOR LAYOUT FIGURE 25: SENSOR LAYOUTS FOR OFFICE CAMPUS HOST SITE: AREA 1 (TOP) AND AREA 2 (BOTTOM). 37
45 R01 R03 R04 R05 R06 R09 R10 R11 R12 R14 R15 R16 R17 R19 R21 R22 R23 R24 R26 R27 R28 R29 R30 R31 R32 R33 R34 R35 R36 R37 R38 Occupancy Rate (%) Emerging Technologies Program Sensors were installed around the facility s office buildings, situated to the southwest of the campus. The sensors cover a wide range of spaces along major occupant use routes. This site was selected, in part, because its occupancy reflects that of sites in the industrial or commercial market sectors that operate for fewer than 24 hours per day. DATA ANALYSIS Office Campus Nighttime Occupancy 30-second bins, 6/21/2013 9/24/ % 18% 16% 14% 12% 10% 8% 6% 4% 2% 0% Absolute Site Occ. = [VALUE] Average of Receiver Occ. = [VALUE] 2.12% 4.62% 0.86% 1.59% 0.96% 2.01% Receiver 38
46 R01 R03 R04 R05 R06 R09 R10 R11 R12 R14 R15 R16 R17 R19 R21 R22 R23 R24 R26 R27 R28 R29 R30 R31 R32 R33 R34 R35 R36 R37 R38 Occupancy Rate (%) Emerging Technologies Program Office Campus Nighttime Occupancy 5-minute bins, 6/21/2013 9/24/ % 50% 40% 30% Absolute Site Occ. = [VALUE] Average of Receiver Occ. = [VALUE] 20% 10% 6.53% 9.25% 7.62% 12.71% 6.60% 14.16% 0% Receiver FIGURE 26: NIGHTTIME OCCUPANCY RATE RESULTS FOR RECEIVERS AT OFFICE CAMPUS HOST SITE WITH 30-SECOND BIN PERIODS (TOP) AND 5-MINUTE BIN PERIODS (BOTTOM). This site houses facilities for a variety of operations which run on multiple schedules. The sensors were installed specifically to monitor traffic connected to the office space facilities. A subset of the host site area had to be selected in order to keep the installation and monitoring logistics within project resource constraints, but this specific subset was selected in order to maximize the similarities between this host site and the market vertical it is representing. The site was expected to operate on a typical office schedule, Monday to Friday, 8:00 a.m. to 5:00 p.m., with peak activity occurring during the day and very little activity occurring at night. This is reflected in the collected data. TABLE 10: SUMMARY OF OCCUPANCY RATE ANALYSIS FOR OFFICE CAMPUS HOST SITE. RECEIVERS OCCUPANCY BIN PERIOD TIME PERIOD OCCUPANCY RATE All Absolute 1 30 sec Night 17.82% All Average 2 30 sec Night 0.71% All Absolute 30 sec Day 54.54% All Average 30 sec Day 3.34% All Absolute 5 min Night 55.99% All Average 5 min Night 4.20% All Absolute 5 min Day 91.90% All Average 5 min Day 17.42% 1 Absolute occupancy: To compute this value, the entire site is assumed to be occupied if any sensor detects motion. The percentage listed is equal to the number of nighttime bin periods where any receiver detected motion, divided by the total number of nighttime bin periods. 2 Average occupancy: The percentage listed is the average of the individual receiver occupancy rates. These individual receiver occupancies rates are determined by taking the number of nighttime bin periods where motion was detected by any sensor connected to that receiver, divided by the total number of nighttime bin periods. 39

47 BIG BOX STORE SITE DESCRIPTION FIGURE 27: AERIAL IMAGE OF THE HOST SITE BIG BOX STORE, WHICH IS PREDOMINANTLY SURROUNDED BY RETAIL AND SOME RESIDENTIAL SPACES. The Big Box Store host site occupies a 20-acre premises include a single building housing all retail operations, a large north parking lot, small auxiliary parking lots, a loading dock, roadways around the building perimeter and pedestrian pathways which traverse the large north parking lot. 40

48 SENSOR LAYOUT FIGURE 28: SENSOR LAYOUT AT THE BIG BOX STORE HOST SITE IN NORTHERN CALIFORNIA. R01 R34 REPRESENT THE LOCATIONS OF SENSORS AND RECEIVERS USED AT THIS SITE. THE RED TRIANGLES EXTENDING FROM THE RECEIVER LOCATIONS REPRESENT INDIVIDUAL SENSORS AND THEIR ORIENTATIONS. Sensors were installed to monitor traffic in the large north parking lot, in pedestrian use areas in the north parking lot and along the building perimeter, near major entrances, and in the auxiliary parking lot and loading dock on the east side. Monitoring was conducted from September 9, 2013 to January This site was selected to represent commercial retail sites that are open for business 24 hours every day. 41
49 R01 R02 R03 R04 R05 R06 R07 R08 R09 R10 R11 R12 R13 R14 R15 R16 R17 R18 R19 R20 R21 R22 R23 R24 R25 R26 R27 R28 R29 R30 R31 R32 R33 R34 Occupancy Rate (%) R01 R02 R03 R04 R05 R06 R07 R08 R09 R10 R11 R12 R13 R14 R15 R16 R17 R18 R19 R20 R21 R22 R23 R24 R25 R26 R27 R28 R29 R30 R31 R32 R33 R34 Occupancy Rate (%) Emerging Technologies Program DATA ANALYSIS Big Box Store Nighttime Occupancy 30-second bins, 9/9/2013 1/30/ % 90% 80% 70% 60% 50% 40% 30% 20% 10% 0% Absolute Site Occ. = [VALUE] Average of Receiver Occ. = [VALUE] Receiver Big Box Store Nighttime Occupancy 5-minute bins, 9/9/2013 1/30/ % 80% 60% 40% 20% 0% Abs. Site Occ. = [VALUE] Average of Receiver Occ. = [VALUE] Receiver FIGURE 29: NIGHTTIME OCCUPANCY RATE RESULTS FOR RECEIVERS AT THE BIG BOX STORE HOST SITE WITH 30-SECOND BIN PERIODS (TOP) AND 5-MINUTE BIN PERIODS (BOTTOM). 42
50 TABLE 11: SUMMARY OF OCCUPANCY RATE ANALYSIS FOR THE BIG BOX STORE HOST SITE RECEIVERS OCCUPANCY BIN PERIOD TIME OCCUPANCY RATE All Absolute 30 sec Night 78.49% All Average 30 sec Night 10.75% All Absolute 30 sec Day 97.51% All Average 30 sec Day 21.85% All Absolute 5 min Night 97.98% All Average 5 min Night 30.88% All Absolute 5 min Day 99.14% All Average 5 min Day 53.51% 1 Absolute occupancy: To compute this value, the entire site is assumed to be occupied if any sensor detects motion. The percentage listed is equal to the number of nighttime bin periods where any receiver detected motion, divided by the total number of nighttime bin periods. 2 Average occupancy: The percentage listed is the average of the individual receiver occupancy rates. These individual receiver occupancies rates are determined by taking the number of nighttime bin periods where motion was detected by any sensor connected to that receiver, divided by the total number of nighttime bin periods. 43

51 OFFICE BUILDING, B SITE DESCRIPTION FIGURE 30: AERIAL VIEW OF OFFICE BUILDING, B SOUTHERN CALIFORNIA The Office Building, B is located on a six-acre lot in Long Beach, CA. The site consists of an office building and adjacent parking lots. This host site is a commercial complex that operates fewer than 24 hours a day. Data was logged at this site from April 26, 2013 to August 25,

 AND SOUTHERN HALF")
52 SENSOR LAYOUT FIGURE 31: SENSOR LAYOUT FOR SOUTHERN HALF OF OFFICE BUILDING, B SITE, NORTHERN HALF (TOP) AND SOUTHERN HALF (BOTTOM). 45
53 R01 R02 R03 R04 R06 R07 R08 R10 R11 R12 R13 R14 R15 R16 R18 R20 R21 R22 R23 R24 R26 R28 Absolute Occupancy Rate (%) R01 R02 R03 R04 R06 R07 R08 R10 R11 R12 R13 R14 R15 R16 R18 R20 R21 R22 R23 R24 R26 R28 Occupancy Rate (%) Emerging Technologies Program Figure 31 depicts the sensor layout at the Office Building, B site. The R01 R28 labels represent the locations of the receivers on the site, while the triangles represent individual sensors, their relative orientation, and their coverage areas. The sensors are configured to cover areas that include both parking lots north and south of the building, walkways entering into the building, and roadways passing near the office building. 30% DATA ANALYSIS Office Building, B Nighttime Occupancy 30-second bins, 4/26/2013 8/25/ % 20% 15% 10% 5% Absolute Site Occ. = [VALUE] Average of Receiver Occ. = [VALUE] 0% Receiver Office Building, B Nighttime Occupancy 5-minute bins, 4/26/2013 8/25/ % 50% 40% 30% 20% Absolute Site Occ. = [VALUE] Average of Receiver Occ. = [VALUE] 10% 0% Receiver FIGURE 24: NIGHTTIME OCCUPANCY RATE RESULTS FOR RECEIVERS AT OFFICE BUILDING, B HOST SITE WITH 30-SECOND BIN PERIODS (TOP) AND 5-MINUTE BIN PERIODS (BOTTOM). 46
54 TABLE 12: SUMMARY OF OCCUPANCY RATE ANALYSIS FOR OFFICE BUILDING, B. RECEIVERS OCCUPANCY BIN PERIOD TIME OCCUPANCY RATE All Absolute 1 30 sec Night 16.51% All Average 2 30 sec Night 0.93% All Absolute 30 sec Day 79.90% All Average 30 sec Day 11.81% All Absolute 5 min Night 56.07% All Average 5 min Night 5.42% All Absolute 5 min Day 99.24% All Average 5 min Day 32.78% 1 Absolute occupancy: To compute this value, the entire site is assumed to be occupied if any sensor detects motion. The percentage listed is equal to the number of nighttime bin periods where any receiver detected motion, divided by the total number of nighttime bin periods. 2 Average occupancy: The percentage listed is the average of the individual receiver occupancy rates. These individual receiver occupancies rates are determined by taking the number of nighttime bin periods where motion was detected by any sensor connected to that receiver, divided by the total number of nighttime bin periods. 47

55 OUTDOOR SHOPPING CENTER SITE DESCRIPTION AND SENSOR LAYOUT FIGURE 33: SENSOR LAYOUT AT THE OUTDOOR SHOPPING CENTER. SENSORS WERE PLACED THROUGHOUT THE PARKING STRUCTURE, ALONG THE WALKWAY BETWEEN STOREFRONTS AND ALONG THE ROADWAY. R01 R24 INDICATE THE LOCATIONS OF THE RECEIVERS WHILE THE INDIVIDUAL SENSORS AND THEIR ORIENTATION ARE REPRESENTED BY RED TRIANGLES. The Outdoor Shopping Center consists of 164 stores and service providers. Sensor coverage areas include the parking garage, the roadway between the parking garage and retail stores, and the central pedestrian walkway between the storefronts. This host site was selected to serve as an example of a retail location that operates for fewer than 24 hours a day. Data was logged at this site from October 10, 2013 to February 5,
56 Absolute Occupancy Rate (%) Occupancy Rate (%) Emerging Technologies Program DATA ANALYSIS 100% Outdoor Shopping Center, Nighttime Occupancy 30-second bins, 10/10/2013 2/5/ % 80% 70% 60% 50% 40% 30% 20% 10% 0% Absolute Site Occ. = [VALUE] Average of Receiver Occ. = [VALUE] R01 R02 R03 R04 R05 R07 R08 R11 R13 R14 R15 R16 R19 R20 R22 R23 R24 Receiver 100% 90% 80% 70% 60% 50% 40% 30% 20% 10% 0% Outdoor Shopping Center, Nighttime Occupancy Absolute Site Occ. = [VALUE] 5-minute bins, 10/10/2013 2/5/2014 Average of Receiver Occ. = [VALUE] R01 R02 R03 R04 R05 R07 R08 R11 R13 R14 R15 R16 R19 R20 R22 R23 R24 Receiver FIGURE 25: NIGHTTIME OCCUPANCY RATE RESULTS FOR RECEIVERS AT OUTDOOR SHOPPING CENTER HOST SITE WITH 30- SECOND BIN PERIODS (TOP) AND 5-MINUTE BIN PERIODS (BOTTOM). 49
57 TABLE 13: SUMMARY OF OCCUPANCY RATE ANALYSIS FOR OUTDOOR SHOPPING CENTER HOST SITE. RECEIVERS OCCUPANCY BIN PERIOD TIME OCCUPANCY RATE All Absolute 1 30 sec Night 67.71% All Average 2 30 sec Night 20.64% All Absolute 30 sec Day 91.71% All Average 30 sec Day 24.14% All Absolute 5 min Night 90.72% All Average 5 min Night 41.96% All Absolute 5 min Day 99.36% All Average 5 min Day 42.82% 1 Absolute occupancy: To compute this value, the entire site is assumed to be occupied if any sensor detects motion. The percentage listed is equal to the number of nighttime bin periods where any receiver detected motion, divided by the total number of nighttime bin periods. 2 Average occupancy: The percentage listed is the average of the individual receiver occupancy rates. These individual receiver occupancies rates are determined by taking the number of nighttime bin periods where motion was detected by any sensor connected to that receiver, divided by the total number of nighttime bin periods. 50
58 AGGREGATE RESULTS TABLE 14: SITE CHARACTERISTICS SITE LARGE BUILDING FAST FOOD K-12 OFFICE BIG BOX OFFICE OUTDOOR OFFICE SUPPLY SCHOOL CAMPUS STORE BUILDING, B SHOPPING BUILDING, FRANCHISE CENTER A Sponsor BPA BPA BPA BPA PGE PGE SCE SCE Site location WA WA WA WA North CA North CA South CA South CA Site type or or 4 Site area 15 acres 9 acres 1 acre 40 acres 60 acres 20 acres 6 acres 75 acre No. of receivers No. of sensors
59 TABLE 15: OCCUPANCY RATES PER BINNING RESOLUTION AND CALCULATION METHOD EMPLOYED TIME OF DAY BINNING RESOLUTION CALCULATION METHOD LARGE OFFICE BUILDING, A BUILDING SUPPLY FRANCHISE FAST FOOD K-12 SCHOOL OCCUPANCY RATES OFFICE CAMPUS BIG BOX STORE OFFICE BUILDING, B OUTDOOR SHOPPING CENTER MAX MEAN MIN Night 30 seconds Absolute n/a n/a n/a n/a 17.82% 78.49% 16.51% 67.71% 78.5% 45.1% 16.5% Night 30 seconds Average n/a n/a n/a n/a 0.71% 10.75% 0.93% 20.64% 20.6% 8.3% 0.7% Night 5 minutes Absolute 12.63% 60.82% % 55.99% 97.98% 56.07% 90.72% 98.0% 57.3% 12.6% % Night 5 minutes Average 3.33% 20.79% % 4.20% 30.88% 5.42% 41.96% 57.3% 21.2% 3.3% % Day 30 seconds Absolute n/a n/a n/a n/a 54.54% 97.51% 79.90% 91.71% 97.5% 80.9% 54.5% Day 30 seconds Average n/a n/a n/a n/a 3.34% 21.85% 11.81% 24.14% 24.1% 15.3% 3.3% Day 5 minutes Absolute 75.27% 98.86% % Day 5 minutes Average 41.02% 61.64% % 50.85% 91.90% 99.14% 99.24% 99.36% 99.4% 86.9% 50.9% 19.65% 17.42% 53.51% 32.78% 42.82% 78.9% 43.5% 17.4% 52
60 Occupancy Rate (%) Occupancy Rate (%) Nighttime Occupancy Rates, All Sites 100% 90% 80% 70% 60% 50% 40% 30% 20% 10% 0% ABS 5 min night ABS 30 sec night REL 5 min night REL 30 sec night Average ABS 5 min night Average ABS 30 sec night Average REL 5 min night Average REL 30 sec night Daytime Occupancy Rates 100% 90% 80% 70% 60% 50% 40% 30% 20% 10% 0% ABS 5 min day ABS 30 sec day REL 5 min day REL 30 sec day Average ABS 5 min day Average ABS 30 sec day Average REL 5 min day Average REL 30 sec day FIGURE 35: OCCUPANCY RATES FOR ALL SITES FOR NIGHTTIME (TOP) AND DAYTIME (BOTTOM) HOURS.
61 EVALUATIONS Implementation of the Phase 1 methodology produced occupancy profiles for each host site, with the aggregate results shown in Figure 15. The steps taken during the data processing portion of the Phase 2 technical approach developed a repeatable process to accurately identify abnormal data streams due to hardware malfunctions and environmental interference and produce an accurate occupancy profile. Analysis strategies described in this report produced occupancy profiles that are representative of actual site conditions; however, more testing is needed to conclusively validate the methodology s ability to predict energy savings achieved by occupancy-based adaptive lighting systems. Simulated Energy Savings To demonstrate how a validated occupancy pattern data stream can be used to determine potential energy savings, additional simulations were performed utilizing the occupancy pattern data collected during Phase 2. The absolute and average occupancy calculation methods described in the data analysis section of this report were maintained throughout the analysis, resulting in two occupancy patterns per site focused on night only. Day and night time periods are defined by sunrise and sunset specific to each day and site for the monitored period. The annual extrapolation of the occupancy pattern used in the simulation of energy savings is based on the 11.7 average hours of derived from the 2010 U.S. Lighting Market Characterization report. Absolute occupancy provides estimates of occupancy for the whole site based on data which indicates occupancy anywhere within the monitored area. With absolute occupancy, the entire site is considered occupied if any sensor detects motion. The absolute occupancy can be used to identify the site vacancy rate by subtracting the absolute occupancy from one hundred percent. Average occupancy reflects an average of data collected at the receiver level for the whole site. With the average occupancy calculation method, the occupancy rate is equal to the number of bin periods with occupancy detected by any receiver within the timeframe under consideration, divided by the total number of bin periods in that timeframe. Software simulations were performed to mimic motion sensor time delays used in occupancy-based adaptive lighting systems. delays of 5, 10 and 15 minutes were selected for this simulation. Simulations were performed assuming the occupancy-based adaptive lighting system operated at 20% and 50% power when the occupancy pattern combined with the specified time delay resulted in a vacancy. To allow for the comparison of potential energy savings simulations achieved through fixture retrofit and the addition of occupancy-based adaptive controls to the incumbent lighting system, the number of fixtures and wattage of incumbent fixtures installed at each host site is required. For some host sites this information was readily available, for other sites the incumbent baseline was estimated based on limited host site information available at the time of this effort. A summary of the site assumptions is included in Table 16.
62 TABLE 16: HOST SITE BASELINE ASSUMPTIONS FOR SIMULATED ENERGY SAVINGS Assumed LED Retrofit Fixture Power (Watt) Night Occupancy Rate - Absolute (%) Night Occupancy Rate - Average (%) Number of Fixtures at Host Site Incumbent Technology Source Baseline Fixture Power (Watt) High Mode Power (W) Low/50% High Mode power (W) Low/20% High Mode power (W) Assumed Annual Hours of Use (hours) Host Site Big Box Store A: 29 B: 9 A: MH B: HPS A: 1080 B: 250 A:300 B: 100 A: 150 B: 50 A: 60 B: % 98.62% 98.68% 37.19% 45.10% 48.02% 4271 Office Campus A: 36 B: 22 A: 30' HID B: 12' HID A: 1080 B: 250 A:300 B: 100 A: 150 B: 50 A: 60 B: % 75.99% 83.94% 3.96% 8.02% 10.61% 4271 Office Building, B Outdoor Shopping Center Building Supply Franchise A: 20 B: 7 C: 8 A: 25' Metal Halide B: 15' Metal Halide C: HPS Bollard A: 400 B: 150 C: 70 A:100 B: 50 C: 10 A: 50 B: 25 C: 5 A: 20 B: 10 C: % 58.62% 64.84% 4.58% 6.81% 8.55% Various 4931* % 95.92% 97.61% 43.18% 50.41% 55.10% K-12 School 12 Metal Halide Metal Halide % 73.10% 77.34% 25.51% 30.28% 33.92% % 28.30% 31.97% 9.32% 12.28% 14.75% 4271 Large Office Building, A 26 Induction % 22.56% 26.21% 5.32% 6.85% 8.20% 4271 Fast Food Restaurant 6 Metal Halide % 97.23% 98.49% 86.62% 91.76% 94.73% 4271 *Power of all lamps connected to all receivers Three energy savings scenarios were considered: an incumbent non-led baseline lighting system upgraded to an adaptive LED system, an incumbent static LED lighting system upgraded to an occupancy-based adaptive LED lighting system, and an incumbent non-led baseline system upgraded to an occupancy-based adaptive LED lighting system highlighting the savings attributed to controls only.
63 Table 17 summarizes the potential energy savings for the eight host sites assuming a low mode of 50% power is used during vacant periods based on the absolute occupancy calculation method. TABLE 17: POTENTIAL ENERGY SAVINGS, ABSOLUTE OCCUPANCY WITH 50% POWER LOW MODE Absolute Occupancy Calculation Method Calculated Baseline Annual Energy Use (kwh) Calculated Static LED Energy Use (kwh) Calculated Occupancy-Based Adaptive LED Energy Use (kwh) Potential Energy Savings: Static Baseline upgraded to Occupancy-Based Adaptive LED (%) Potential Energy Savings: Static LED upgraded to Occupancy-Based Adaptive LED (%) Potential Energy Savings: Static Baseline upgraded to Occupancy-Based Adaptive LED Savings attributed to Controls Only (%) Host Site Big Box Store Office Campus Office Building, B Outdoor Shopping Center Building Supply Franchise K-12 School Large Office Building, A Fast Food Restaurant 143,377 41,002 40,625 40,718 40, % 71.60% 71.59% 0.92% 0.69% 0.66% 0.26% 0.20% 0.19% 189,547 55,523 45,023 48,857 51, % 74.22% 73.06% 18.91% 12.01% 8.03% 5.54% 3.52% 2.35% 41,044 10,379 7,670 8,231 8, % 79.95% 79.16% 26.10% 20.69% 17.58% 6.60% 5.23% 4.45% 358,038 70,454 67,475 69,016 69, % 80.72% 80.56% 4.23% 2.04% 1.20% 0.83% 0.40% 0.24% 16,230 5,680 4,748 4,916 5, % 69.71% 68.97% 16.42% 13.45% 11.33% 5.75% 4.71% 3.97% 20,501 6,150 3,789 3,945 4, % 80.75% 80.20% 38.39% 35.85% 34.01% 11.52% 10.75% 10.20% 22,209 7,773 4,597 4,763 4, % 78.55% 77.91% 40.86% 38.72% 36.90% 14.30% 13.55% 12.91% 10,250 3,075 2,995 3,032 3, % 70.42% 70.23% 2.61% 1.39% 0.75% 0.78% 0.42% 0.23%
64 Table 18 summarizes the potential energy savings for the eight host sites assuming a low mode of 50% power is used during vacant periods based on the average occupancy calculation method. TABLE 18: POTENTIAL ENERGY SAVINGS, AVERAGE OCCUPANCY WITH 50% POWER LOW MODE Average Occupancy Calculation Method Calculated Baseline Annual Energy Use (kwh) Calculated Static LED Energy Use (kwh) Calculated Occupancy- Based Adaptive LED Energy Use (kwh) Potential Energy Savings: Static Baseline upgraded to Occupancy-Based Adaptive LED (%) Potential Energy Savings: Static LED upgraded to Occupancy-Based Adaptive LED (%) Potential Energy Savings: Static Baseline upgraded to Occupancy-Based Adaptive LED Savings attributed to Controls Only (%) Host Site Big Box Store 143,377 41,002 29,497 31,251 32, % 78.20% 77.47% 28.06% 23.78% 21.21% 8.02% 6.80% 6.07% Office Campus 189,547 55,523 28,152 28,988 29, % 84.71% 84.36% 49.30% 47.79% 46.61% 14.44% 14.00% 13.65% Office Building, B 41,044 10,379 5,306 5,390 5, % 86.87% 86.68% 48.88% 48.07% 47.34% 12.36% 12.15% 11.97% Outdoor Shopping Center 358,038 70,454 48,597 51,340 53, % 85.66% 85.15% 31.02% 27.13% 24.53% 6.10% 5.34% 4.83% Building Supply Franchise 16,230 5,680 3,549 3,685 3, % 77.30% 76.65% 37.52% 35.13% 33.29% 13.13% 12.30% 11.65% K-12 School 20,501 6,150 3,362 3,453 3, % 83.16% 82.79% 45.34% 43.86% 42.63% 13.60% 13.16% 12.79% Large Office Building, A 22,209 7,773 4,083 4,139 4, % 81.36% 81.14% 47.47% 46.75% 46.11% 16.62% 16.36% 16.14% Fast Food Restaurant 10,250 3,075 2,869 2,948 2, % 71.24% 70.79% 6.69% 4.12% 2.64% 2.01% 1.24% 0.79%
65 Table 19 summarizes the potential energy savings for the eight host sites assuming a low mode of 20% power is used during vacant periods based on the absolute occupancy calculation method. TABLE 19: POTENTIAL ENERGY SAVINGS, ABSOLUTE OCCUPANCY CALCULATION 20% POWER LOW MODE Absolute Occupancy Calculation Method Calculated Baseline Annual Energy Use (kwh) Calculated Static LED Energy Use (kwh) Calculated Occupancy- Based Adaptive LED Energy Use (kwh) Potential Energy Savings: Static Baseline upgraded to Occupancy-Based Adaptive LED (%) Potential Energy Savings: Static LED upgraded to Occupancy-Based Adaptive LED (%) Potential Energy Savings: Static Baseline upgraded to Occupancy-Based Adaptive LED Savings attributed to Controls Only (%) Host Site Big Box Store Office Campus Office Building, B Outdoor Shopping Center Building Supply Franchise K-12 School Large Office Building, A Fast Food Restaurant 143,377 41,002 40,400 40,547 40, % 71.72% 71.70% 1.47% 1.11% 1.05% 0.42% 0.32% 0.30% 189,547 55,523 38,723 44,857 48, % 76.33% 74.47% 30.26% 19.21% 12.85% 8.86% 5.63% 3.76% 41,044 10,379 6,045 6,943 7, % 83.08% 81.83% 41.75% 33.10% 28.13% 10.56% 8.37% 7.11% 358,038 70,454 65,687 68,153 69, % 80.96% 80.70% 6.77% 3.27% 1.91% 1.33% 0.64% 0.38% 16,230 5,680 4,188 4,458 4, % 72.53% 71.35% 26.28% 21.52% 18.13% 9.20% 7.53% 6.35% 20,501 6,150 2,372 2,622 2, % 87.21% 86.33% 61.43% 57.36% 54.42% 18.43% 17.21% 16.33% 22,209 7,773 2,691 2,957 3, % 86.68% 85.66% 65.38% 61.95% 59.03% 22.88% 21.68% 20.66% 10,250 3,075 2,947 3,007 3, % 70.67% 70.36% 4.17% 2.22% 1.21% 1.25% 0.67% 0.36%
66 Table 20 summarizes the potential energy savings for the eight host sites assuming a low mode of 20% power is used during vacant periods based on the average occupancy calculation method. TABLE 20: POTENTIAL ENERGY SAVINGS, AVERAGE OCCUPANCY CALCULATION 20% POWER LOW MODE Average Occupancy Calculation Method Calculated Baseline Annual Energy Use (kwh) Calculated Static LED Energy Use (kwh) Calculated Occupancy- Based Adaptive LED Energy Use (kwh) Potential Energy Savings: Static Baseline upgraded to Occupancy-Based Adaptive LED (%) Potential Energy Savings: Static LED upgraded to Occupancy-Based Adaptive LED (%) Potential Energy Savings: Baseline upgraded to Occupancy-Based Adaptive LED Savings attributed to Controls Only (%) Host Site Big Box Store Office Campus Office Building, B Outdoor Shopping Center Building Supply Franchise K-12 School Large Office Building, A Fast Food Restaurant 143,377 41,002 22,595 25,401 27, % 82.28% 81.11% 44.89% 38.05% 33.94% 12.84% 10.88% 9.71% 189,547 55,523 12,499 13,835 14, % 92.70% 92.15% 77.49% 75.08% 73.19% 22.70% 21.99% 21.44% 41,044 10,379 2,262 2,396 2, % 94.16% 93.87% 78.20% 76.91% 75.74% 19.77% 19.45% 19.15% 358,038 70,454 35,482 39,872 42, % 88.86% 88.04% 49.64% 43.41% 39.24% 9.77% 8.54% 7.72% 16,230 5,680 2,270 2,488 2, % 84.67% 83.64% 60.04% 56.21% 53.26% 21.01% 19.67% 18.64% 20,501 6,150 1,689 1,834 1, % 91.05% 90.46% 72.54% 70.18% 68.20% 21.76% 21.05% 20.46% 22,209 7,773 1,869 1,959 2, % 91.18% 90.82% 75.96% 74.80% 73.78% 26.58% 26.18% 25.82% 10,250 3,075 2,746 2,872 2, % 71.98% 71.27% 10.71% 6.59% 4.22% 3.21% 1.98% 1.27%
67 Figures 36, 37 and 38 show the potential range of energy savings the sites can achieve by implementing an occupancy-based adaptive lighting system. The energy savings range captures varying control strategies that can be implemented during the commissioning of occupancy-based adaptive lighting systems for both 50% and 20% power low modes, based on absolute and average occupancy patterns. The minimum savings of the energy savings range assumes all lights at the site are operating at full output if there is at least one occupant detected in the monitored area with an occupancy sensor using a 15 minute time delay. The maximum savings of the energy savings range assumes each fixture only operates in high mode when the sensor monitoring the immediate area to the fixture detects occupancy with an occupancy sensor using a 5 minute time delay. Potential energy savings per receiver simulations for the Big Box Store are included in the Appendix. FIGURE 36: POTENTIAL ENERGY SAVINGS, BASELINE UPGRADED TO OCCUPANCY-BASED ADAPTIVE LED (%)
68 FIGURE 37: POTENTIAL ENERGY SAVINGS, BASELINE UPGRADED TO OCCUPANCY-BASED ADAPTIVE LED CONTROLS ONLY (%)
69 FIGURE 38: POTENTIAL ENERGY SAVINGS, STATIC LED UPGRADED TO OCCUPANCY-BASED ADAPTIVE LED (%)
70 Figure 39 shows the range of energy use reduction each site can expect to experience for 50% low mode power levels. Varying levels of expected energy use reduction have been simulated for 5, 10 and 15 minute time delays. FIGURE 39: POTENTIAL ENERGY SAVINGS FOR 50% POWER LOW MODE WITH VARIED TIME DELAY (KWH)
71 Based on the simulations performed in this analysis, Figure 40 focuses on the control strategy scenarios that result in the minimum and maximum potential energy use reduction control strategies for both 50% and 20% low mode power levels at each host site. The minimum of the energy savings range assumes all fixtures at the site are operating at full output if there is at least one occupant detected in the monitored area, utilizing the absolute (abs) occupancy rate with at 15 minute time delay simulation. The maximum of the energy savings range assumes each fixture only operates in high mode when the sensor monitoring the immediate area to the fixture detects occupancy, utilizing the average (avg) occupancy rate with 5 minute time delay simulation. The potential energy use reduction is categorized into savings attributed to the fixture upgrade, and savings due to the addition of occupancy-based adaptive controls.

72 FIGURE 40: POTENTIAL ENERGY USE REDUCTION FOR FIXTURES AND CONTROLS PER SITE (KWH)
73 Further validation of the method requires the installation of occupancy-based adaptive lighting systems at the sites monitored, side-by-side with the data acquisition system outlined in the Phase 2 technical approach. This will allow for the comparison of monitored energy use to the estimated energy savings calculated using the occupancy profiles collected. A secondary finding identifies the need for additional research into sensing technologies appropriate for outdoor applications. The detectable environmental interference from tree branch movement on windy days indicates the need for additional research into exterior occupancy sensor technologies, such as microwave-based technologies, that can be configured through hardware and firmware settings to disregard these typical environmental triggers. RECOMMENDATIONS While the collected data can be used to simulate different time delays, it is limited in providing accurate energy savings predictions due to the limited host site sample set. It is recommended that Phase 3 extend the method to validate the accuracy for potential energy savings predictions. This requires the installation of occupancy-based adaptive lighting systems side-by-side with the data acquisition system outlined in this report. This will support the evaluation of monitored energy use of the occupancy-based adaptive lighting system as compared to the estimated energy savings calculated using the occupancy profiles. Based on the implementation of the Phase 1 methodology and the data processing performed on the collected occupancy logs, it is recommended that Phase 3 of this study focus on validation of the method as an accurate manner to predict energy savings. It is recommended that occupancy profiles collected based on the technical approach described in Phase 2 be compared to energy logs of occupancy-based adaptive lighting systems installed and logged at similar sites for the same time frame. The occupancy-based adaptive lighting systems should be deployed at multiple test sites within each identified market sub-sector, sufficient to constitute a statistically relevant sample set. These installations can take place at any site meeting the definition of a market sector that is of interest to evaluate the use of occupancy-based adaptive exterior lighting systems based on Phase 1 work. Sites that have historic occupancy profiles, such as the host sites used in Phase 2, should be prioritized to allow for the comparison of seasonal data at these locations to determine if 90 days is sufficient time to produce an accurate representation of the site s annual occupancy profile. It is recommended that installations of the occupancy-based adaptive lighting systems use varying motion sensing technologies, dimmable lighting sources and communication network architectures. Installations of occupancy-based adaptive lighting systems equipped with varying sensing technologies will allow for the study of the effect of using various different sensor technologies appropriate for outdoor applications. It is recommended that installations of the occupancy-based adaptive lighting systems incorporated the use of varying control strategies. Control strategies, such as fixture-level and zonal control, are key areas where research is needed to conclusively determine if they have a pronounced effect on energy savings.
74
75 APPENDIX 1 The following section includes line plots of all data collected. No data processing has been performed beyond file format conversion, consolidation and formatting necessary for graphing. The start and end dates in these graphs include any stray signals recorded during equipment installation and removal, and therefore cover a wider date range than was considered for data analysis. The raw data for each site consists of n columns, where n is the number of receivers installed at that site. Each row consists of an integer with units counts per bin period. The bin period was either 30 seconds or 5 minutes.
76 LARGE OFFICE BUILDING, A
77 BUILDING SUPPLY FRANCHISE

78 FAST FOOD RESTAURANT
79 K-12 SCHOOL

80 OFFICE CAMPUS
81
82
83

84 BIG BOX STORE

85
86
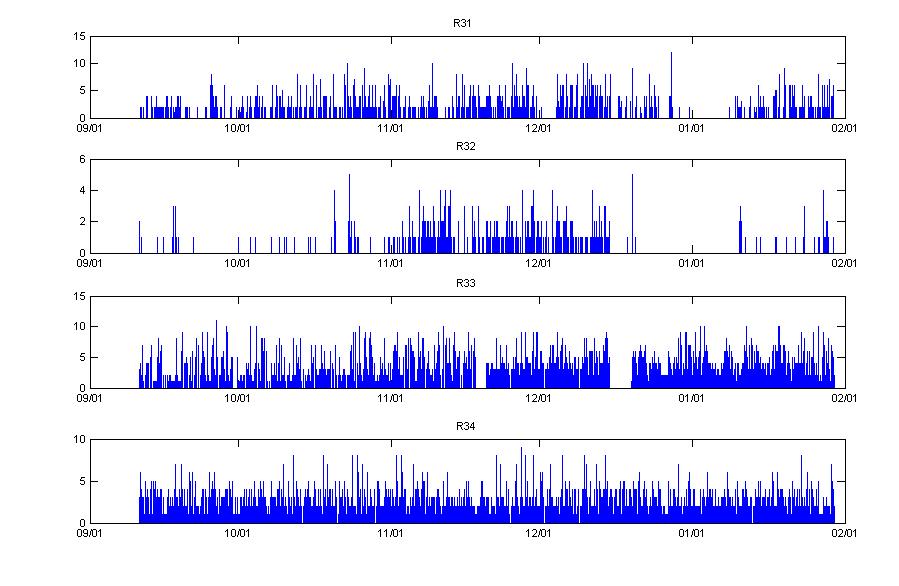

87
88 OFFICE BUILDING, B
89
90

91 OUTDOOR SHOPPING CENTER
Transitioning to Networked Adaptive Exterior Lighting
 Transitioning to Networked Adaptive Exterior Lighting Nicole Graeber Senior Development Engineer California Lighting Technology Center, UC Davis About the California Lighting Technology Center Learning
Office Lighting: Title 24 & Technology Update
 Office Lighting: Title 24 & Technology Update Supporting compliance with California s Title 24 Standards Nicole Graeber Senior Development Engineer Technical Communications Director negraeber@ucdavis.edu
LED LIGHTING TECHNOLOGY TRIAL. Product Performance Result Report March Prepared for: Prepared by: ADM Associates, Inc.
 LED LIGHTING TECHNOLOGY TRIAL Product Performance Result Report March 2012 Prepared for: Prepared by: ADM Associates, Inc. 3239 Ramos Circle Sacramento, CA 95827 916-363-8383 TABLE OF CONTENTS Section
Veterans Administration Medical Center San Diego. Advanced Lighting Control System Assessment Final Report
 Veterans Administration Medical Center San Diego Advanced Lighting Control System Assessment Final Report December 15 th, 2010 PREFACE PROJECT TEAM This project is sponsored by San Diego Gas & Electric
More is Better? Analyzing the Relation between Metering Duration and Accuracy of Results for Residential Lighting Evaluations
 More is Better? Analyzing the Relation between Metering Duration and Accuracy of Results for Residential Lighting Evaluations Joel D. Pertzsch, Michaels Energy Inc., La Crosse, WI Ryan M. Kroll, Michaels
Bi-Level Office Lighting with Occupancy Sensors
 FINAL REPORT E3T Emerging Technology Assessment Bi-Level Office Lighting with Occupancy Sensors January 2011 Prepared for: This publication contains material written and produced for public distribution.
Connected: How Networked Control Systems (and codes and standards!) Will Drive LED Adoption
 Will Drive LED Adoption") Connected: How Networked Control Systems (and codes and standards!) Will Drive LED Adoption Kelly Cunningham, Outreach Director kcunning@ucdavis.edu California Lighting Technology Center University of
Connected: How Networked Control Systems (and codes and standards!) Will Drive LED Adoption Kelly Cunningham, Outreach Director kcunning@ucdavis.edu California Lighting Technology Center University of
Does It Keep The Drinks Cold and Reduce Peak Demand? An Evaluation of a Vending Machine Control Program
 Does It Keep The Drinks Cold and Reduce Peak Demand? An Evaluation of a Vending Machine Control Program Cathy Chappell, Heschong Mahone Group Ed Hamzawi and Wim Bos, Sacramento Municipal Utility District
Innovative Uses for M&V Data; Focusing the Sales Team
 Innovative Uses for M&V Data; Focusing the Sales Team Steven Pak, Con Edison, New York, NY Lucy Neiman and Ryan Bossis, ERS, New York, NY ABSTRACT With its 2016 rate case filing, Consolidated Edison Company
Demand Reduction and Energy Savings Potential of Integrated Dimming Ballast Controls in Mid-Size Retail Facilities: PetSmart Stores
 Design & Engineering Services Demand Reduction and Energy Savings Potential of Integrated Dimming Ballast Controls in Mid-Size Retail Facilities: Customer Report Prepared by: Design & Engineering Services
MEASUREMENT AND VERIFICATION GUIDELINES FOR RETROFIT AND NEW CONSTRUCTION PROJECTS
 EL PASO ELECTRIC COMPANY S LARGE COMMERCIAL AND INDUSTRIAL STANDARD OFFER PROGRAM MEASUREMENT AND VERIFICATION GUIDELINES FOR RETROFIT AND NEW CONSTRUCTION PROJECTS This document includes detailed information
Research Plan: 2015 Upstream and Residential Downstream Lighting Program Impact Evaluation (ED_I_Ltg_4)
") Research Plan: 2015 Upstream and Residential Downstream Lighting Program Impact Evaluation (ED_I_Ltg_4) California Public Utilities Commission Date: July 22, 2016 LEGAL NOTICE This document was prepared
Research Plan: 2015 Upstream and Residential Downstream Lighting Program Impact Evaluation (ED_I_Ltg_4) California Public Utilities Commission Date: July 22, 2016 LEGAL NOTICE This document was prepared
Ex Ante Update for ESPI Uncertain measures
 19 May 2015 The California Lighting and Appliance Saturation Surveys (CLASS 2012) 1 and the Residential Upstream Lighting Program Evaluation (WO28) 2 research indicate significant revisions to CFL gross,
National Grid USA Service Company. Impact Evaluation Of 2006 Design2000plus Custom Comprehensive Projects. Final Report
 National Grid USA Service Company Impact Evaluation Of 2006 Design2000plus Custom Comprehensive Projects Final Report July 11, 2010 Submitted to: National Grid USA Service Corporation Waltham, MA Submitted
ENERGY INITIATIVE ENERGY EFFICIENCY PROGRAM Impact Evaluation of Prescriptive and Custom Lighting Installations. National Grid. Prepared by DNV GL
 ENERGY INITIATIVE ENERGY EFFICIENCY PROGRAM Impact Evaluation of Prescriptive and Custom Lighting Installations National Grid Prepared by DNV GL Date: September 25, 2015 DNV GL www.dnvgl.com September,
2017 Lighting Program Colorado: Commercial and Industrial Electric Customers
 Black Hills Energy offers Colorado Commercial and Industrial electric customers rebates for some of the most commonly installed lighting projects. We offer commercial customers two options to receive rebates.
DEEMED SAVINGS TECHNICAL ASSUMPTIONS
 Product: Description: Prescriptive rebates will be offered for replacement lighting equipment. New Construction rebates will be offered for new facilities or spaces overhauled for a new purpose. Custom
LED POOL LIGHTING CRITERIA
 Design & Engineering Services LED POOL LIGHTING CRITERIA Report Prepared by: Design & Engineering Services Customer Service Business Unit Southern California Edison September 22, 2011 What s Inside Executive
LIGHTING Common terminology 2. Sources & luminaires 3. Controls
 LIGHTING 101 1. Common terminology 2. Sources & luminaires 3. Controls DISCUSSION: COMMON LIGHTING TERMINOLOGY 1. What are the definitions of the following lighting terms? 2. Do you use these terms in
New Construction Lighting Application. Application Process. Details & Instructions
 New Construction Lighting Application Details & Instructions PSO provides technical assistance and rebates to assist businesses in making energy saving upgrades. Review details and requirements* at PowerForwardWithPSO.com.
Occupancy Based Lighting Control Systems
 Parkland College A with Honors Projects Honors Program 2010 Occupancy Based Lighting Control Systems Nathan Cooper Parkland College Recommended Citation Cooper, Nathan, "Occupancy Based Lighting Control
NYSERDA CHP Assessment Report A S S E S S I N G T H E C H P P L A N T A T C O - O P C I T Y - R I V E R B A Y
 NYSERDA CHP Assessment Report A S S E S S I N G T H E C H P P L A N T A T C O - O P C I T Y - R I V E R B A Y October 9, 2013 Co-op City - Riverbay Coop City - Riverbay DISCLAIMER OF WARRANTY Information
WIRELESS CONTROLS WHAT, WHY, WHERE AND WHEN SHOULD THEY BE CONSIDERED?
 WHAT, WHY, WHERE AND WHEN SHOULD THEY BE CONSIDERED? E-LEARNING GUIDE WHAT, WHY, WHERE AND WHEN SHOULD THEY BE CONSIDERED? Exactly what is a wireless control system? It is typically defined as a lighting
Nonresidential Outdoor Lighting Controls Results Report
 Codes and Standards Enhancement (CASE) Initiative 2019 California Building Energy Efficiency Standards Nonresidential Outdoor Lighting Controls Results Report Measure Number: 2019-NR-LIGHT3-F Nonresidential
Donahue Schriber SmartCast Lighting Project
 Donahue Schriber SmartCast Lighting Project ET14SMUD1045 Sacramento Municipal Utility District December 18, 2014 Prepared by: ADM Associates, Inc. 3239 Ramos Circle Sacramento, CA 95827 The information
General Lighting Recommendations
 General Lighting Recommendations DESIGN GUIDELINES FOR ENERGY EFFICIENT LIGHTING SYSTEMS According to the US Department of Energy, 51 percent of the energy used in commercial buildings is consumed by lighting
Time to Move On: An Examination of Metering Periods for Small Business Direct Install Participants
 Time to Move On: An Examination of Metering Periods for Small Business Direct Install Participants Julian Ricardo, NMR Group, Inc. Joseph Dolengo, National Grid David Barclay, NMR Group, Inc Scott Walker,
Introduction ABSTRACT
 Bring Me the Right Data! An In-Depth Look at What Data Is Useful for the Utility of the Future Isaac Wainstein, Ryan Bossis Energy and Resource Solutions (ERS) ABSTRACT It is often recognized that gathering
Increased Energy Savings with Advanced Lighting and Controls RESNET Building Performance Conference February 27 th, 2013
 Increased Energy Savings with Advanced Lighting and Controls 2013 RESNET Building Performance Conference February 27 th, 2013 Lighting Power Densities & Calculate Energy Savings in Multifamily Projects
Energy Efficient Lighting Opportunities. Paul Vrabel, LC, PMP Principal ICF International
 Energy Efficient Lighting Opportunities Paul Vrabel, LC, PMP Principal ICF International Today Potential Technologies Transforming the Market Voluntary Approaches Codes and Standards Best Practices Why
NEPTUN HIGH
 NEPTUN HIGH BAYS INDUCTION & LED TECHNOLOGY Upgrading to modern LED or Induction lighting is one of the best ways to reduce energy costs for applications such as manufacturing plants, warehouses, gymnasiums,
LIGHTING Common terminology 2. Sources & luminaires 3. Controls SECTION 3
 LIGHTING 101 1. Common terminology 2. Sources & luminaires 3. Controls SECTION 3 DISCUSSION: COMMON LIGHTING TERMINOLOGY 1. What are the definitions of the following lighting terms? 2. Do you use these
Coincidence Factor Study Residential and Commercial & Industrial Lighting Measures. Prepared for; New England State Program Working Group (SPWG)
") Coincidence Factor Study Residential and Commercial & Industrial Lighting Measures Prepared for; New England State Program Working Group (SPWG) For use as an Energy Efficiency Measures/Programs Reference
Coincidence Factor Study Residential and Commercial & Industrial Lighting Measures Prepared for; New England State Program Working Group (SPWG) For use as an Energy Efficiency Measures/Programs Reference
NEPTUN HIGH BAYS BDT Product Sales & Support (951)
") NEPTUN HIGH BAYS INDUCTION & LED TECHNOLOGY Upgrading to modern LED or Induction lighting is one of the best ways to reduce energy costs for applications such as manufacturing plants, warehouses, gymnasiums,
NEPTUN HIGH BAYS INDUCTION & LED TECHNOLOGY Upgrading to modern LED or Induction lighting is one of the best ways to reduce energy costs for applications such as manufacturing plants, warehouses, gymnasiums,
A Brighter Idea Than Fluorescent
 A Brighter Idea Than Fluorescent Venture s Uni-Form pulse start metal halide lighting systems are the brighter solution: Greater energy savings! More light: Higher system lumens per watt Lower dirt depreciation
Business Energy Rebates Application
 Business Energy Rebates Application Business Energy Rebates make it easy and affordable for you to select energy efficient products for your business. and mail-in rebates are available for energy efficient
An Oracle White Paper June Microgrids: An Oracle Approach
 An Oracle White Paper June 2010 Microgrids: An Oracle Approach Executive Overview Microgrids are autonomous electricity environments that operate within a larger electric utility grid. While the concept
Lighting Calculator 3.3 Program Offerings
 Lighting Calculator 3.3 Program Offerings Series A: T8 Linear Fluorescent Series A covers both interior and exterior linear fluorescent lighting including 4, 8 T8 and irregular size products. A1-30% Linear
San Diego Zoo Gift Shop LED Lighting ET11SDGE0003
 San Diego Zoo Gift Shop LED Lighting October 28, 2011 Prepared for: Prepared by: Preface PROJECT TEAM This project is sponsored by San Diego Gas & Electric s (SDG&E ) Emerging Technologies Program (ETP),
Customer Energy Efficiency Program Measurement and Evaluation Program
 Customer Energy Efficiency Program Measurement and Evaluation Program EVALUATION OF PACIFIC GAS & ELECTRIC COMPANY'S PRE-1998 COMMERCIAL ENERGY EFFICIENCY INCENTIVES PROGRAM CARRY-OVER: HVAC TECHNOLOGIES
CFL METERING STUDY FINAL REPORT. Prepared for. Pacific Gas & Electric Company San Francisco, California
 CFL METERING STUDY FINAL REPORT Prepared for Pacific Gas & Electric Company San Francisco, California San Diego Gas & Electric Company San Diego, California Southern California Edison Company Rosemead,
Appendix E. Engineering Calculation Worksheet
 Appendix E Engineering Calculation Worksheet Port of Stockton Project : 1. Process / Measure Description 1.1. Existing Process / Equipment Description Fully describe the existing process and equipment
Prescriptive Program. Terms And Conditions General Eligibility. Commercial and Industrial Customers. Rebate Checklist
 Prescriptive Program Industrial Customers Rebate Checklist Get your rebate check faster by checking off these easy steps before mailing your application form. Incomplete applications may be delayed. q
LEDs are Moving on Up: C&I Upstream LED Lighting Program
 LEDs are Moving on Up: C&I Upstream LED Lighting Program Aaron Kwiatkowski, DNV KEMA Energy & Sustainability, Orlando, FL Chad Telarico, DNV KEMA Energy & Sustainability, Geneva, NY William Blake, National
Lutron Energy Savings Claims
 Lutron Energy Savings Claims Commercial Claims page 2 Residential Claims page 11 Commercial Claims Commercial Claims These are claims currently utilized by Lutron for commercial product marketing. The
AMI Billing Regression Study Final Report. February 23, 2016
 AMI Billing Regression Study Final Report February 23, 2016 Table of Contents Executive Summary... i 1 Introduction... 1 2 Random Coefficients Model... 5 2.1 RANDOM COEFFICIENTS MODEL DEVELOPMENT PROCESS...
DEEMED SAVINGS TECHNICAL ASSUMPTIONS
 Product: Prescriptive rebates will be offered for replacement lighting equipment. New Construction rebates will be offered for new facilities or spaces overhauled for a new purpose. Custom rebates are
2019 Lighting Retrofit Rebate Instructions. City of Le Sueur
 Rebate Instructions By participating in the We Save program, you can save energy and earn a rebate when you replace existing lighting with qualifying, energy-efficient lighting. What Rebate Can I Earn?
What products are eligible for the rebate? Fixtures & Lamps: LED Commercial Fixtures LED Lamps
 If you have questions while completing this form, please contact Energy Management Solutions, Inc. weekdays during business hours for assistance. Phone: 952-767-7450 Fax: 952-556-9171 Send your completed
2019 Lighting Retrofit Rebate Instructions. City of Brownton
 Rebate Instructions By participating in the We Save program, you can save energy and earn a rebate when you replace existing lighting with qualifying, energy-efficient lighting. What Rebate Can I Earn?
Project Information. Measure Description
 Project Information Project ID#: CE07M016 Measure: Multiple Electric : 452,593 kwh, 8.84 kw, 39.26 kw Facility Type School Technology: Multiple Measure Description CH-1 - Chiller Plant Optimization and
November 8, RE: Harrah s Station Square Casino Transportation Analysis Detailed Traffic Impact Study Review. Dear Mr. Rowe:
 November 8, 2006 Mr. Glenn Rowe, P.E. Pennsylvania Department of Transportation Bureau of Highway Safety and Traffic Engineering Commonwealth Keystone Building 400 North Street, 6 th Floor Harrisburg,
Performance Analysis of Hotel Lighting Control System
 Performance Analysis of Hotel Lighting Control System Erik Page and Michael Siminovitch, University of California, Davis, California Lighting Technology Center 1 ABSTRACT The Lighting Control System (LCS),
Section 2: Estimating Energy Savings and Incentives
 Section 2: Estimating Energy and Incentives 2.1 Estimating Energy and Incentives... 2 2.2 Customized Measures - Estimation Software... 2 2.2.1 AC&R I - High Efficiency Chiller... 4 2.2.2 AC&R I - Split/Packaged
Implementing Lighting Management Technologies and Practices to Drive Building Efficiency. NEMA Enlighten America 2011
 Implementing Lighting Management Technologies and Practices to Drive Building Efficiency NEMA Enlighten America 2011 Learning Objectives 1. Understand the latest lighting control technologies 2. Learn
Energy Efficiency Impact Study
 Energy Efficiency Impact Study for the Preferred Resources Pilot February, 2016 For further information, contact PreferredResources@sce.com 2 1. Executive Summary Southern California Edison (SCE) is interested
2019 Lighting Retrofit Rebate Instructions. City of Winthrop
 Rebate Instructions By participating in the We Save program, you can save energy and earn a rebate when you replace existing lighting with qualifying, energy-efficient lighting. What Rebate Can I Earn?
2014 Nonresidential Downstream Deemed ESPI Lighting Impact Evaluation Report
 2014 Nonresidential Downstream Deemed ESPI Lighting Impact Evaluation Report Prepared for California Public Utilities Commission Itron, Inc. 1111 Broadway, Suite 1800 Oakland, CA 94607 (510) 844-2800 March
BCEO TRAFFIC IMPACT STUDY GUIDELINES
 BCEO TRAFFIC IMPACT STUDY GUIDELINES February 2006 TABLE OF CONTENTS INTRODUCTION..... i TRAFFIC IMPACT STUDY STRUCTURE... 1 WHEN IS A TRAFFIC IMPACT STUDY NEEDED?..... 1 STUDY AREA, SITE PLAN & HORIZON
NYSERDA CHP Assessment Report A S S E S S I N G T H E C H P P L A N T A T V A S S A R C O L L E G E
 NYSERDA CHP Assessment Report A S S E S S I N G T H E C H P P L A N T A T V A S S A R C O L L E G E October 9, 2013 Vassar College Vassar College DISCLAIMER OF WARRANTY Information contained on this web
2015 Nonresidential Downstream Custom ESPI Lighting Research Plan
 2015 Nonresidential Downstream Custom ESPI Lighting Research Plan Prepared for California Public Utilities Commission Itron, Inc. 12348 High Bluff Drive, Suite 210 San Diego, California 92130 (858) 724-2620
The energy benefits of View Dynamic Glass
 Workplace demonstration Energy monitoring over a period of 12 months resulted in the commercial office room installed with View Dynamic Glass saving 39 percent of the total energy consumed compared to
Commercial Lighting Issues. Commercial Lighting Issues
 Commercial Lighting Issues Conservation Resources Advisory Committee January 28, 2015 Commercial Lighting Issues New Federal GSFL standard: Savings or Not? Interior Proxy measures modeled Equivalent lumens
NYSERDA CHP Assessment Report A S S E S S I N G T H E C H P P L A N T A T C L A R K S O N U N I V E R S I T Y
 NYSERDA CHP Assessment Report A S S E S S I N G T H E C H P P L A N T A T C L A R K S O N U N I V E R S I T Y October 9, 2013 Clarkson University Clarkson University DISCLAIMER OF WARRANTY Information
Boosting Energy Savings through Lighting Occupancy Control Settings in Multifamily Buildings
 Boosting Energy Savings through Lighting Occupancy Control Settings in Multifamily Buildings Overview Very significant energy savings are achieved by converting 24-hour lighting to occupancy controlled
Lighting Pagette Update. By: Noah Horowitz Sr. Scientist Natural Resources Defense Council November 2005
 Lighting Pagette Update By: Noah Horowitz Sr. Scientist Natural Resources Defense Council nhorowitz@nrdc.org November 2005 Overview Why a separate group on lighting? (Bulbette rhymes with PAG-ette and
EVALUATION OF ENVIROGRID TECHNOLOGY PERFORMANCE. Final Report August Prepared for: Sacramento Municipal Utility District
 EVALUATION OF ENVIROGRID TECHNOLOGY PERFORMANCE Final Report August 2012 Prepared for: Sacramento Municipal Utility District Prepared by ADM Associates, Inc. 3239 Ramos Circle Sacramento, CA 95827 916-363-8383
High Ceiling Lighting Options Technology Assessment Final Report
 hhh Hyatt Regency La Jolla High Ceiling Lighting Options Technology Assessment Final Report November 28 th, 2010 PREFACE PROJECT TEAM This project is sponsored by San Diego Gas & Electric s (SDG&E ) Emerging
RTR Appendix. RTR for the Focused Impact Evaluation of the Home Upgrade Program (DNV GL, ED WO #ED_D_Res_5, Calmac ID #CPU0118.
 RTR Appendix Southern California Edison, Pacific Gas and Electric, Southern California Gas, and San Diego Gas and Electric ( Joint Utilities or Joint IOUs ) developed Responses to s (RTR) contained in
NYSERDA CHP Assessment Report A S S E S S I N G T H E C H P P L A N T A T T O R E N C O N D O M I N I U M S
 NYSERDA CHP Assessment Report A S S E S S I N G T H E C H P P L A N T A T T O R E N C O N D O M I N I U M S October 9, 2013 Toren Condominiums Toren Condominiums DISCLAIMER OF WARRANTY Information contained
Smart Lighting An Overview
 Smart Lighting An Overview Lighting load Lighting in general Electric lighting consumes 19% of total electricity production worldwide, 25% of electricity production in the U.S. Lighting in offices In office
Summary of 60-Day Notice: Lighting Efficiency
 Summary of 60-Day Notice: Lighting Efficiency Public Service Company of Colorado ( the Company ) posts this 60-Day Notice to make changes to the 2017 and 2018 Lighting Efficiency and Small Business Lighting
September 21, 2016 LED Update: Benefits, Incentives, Action Plan, Case Studies. Ed Evans LEDVANCE SYLVANIA
 September 21, 2016 LED Update: Benefits, Incentives, Action Plan, Case Studies Ed Evans LEDVANCE SYLVANIA Agenda The Current LED market New LED technology for Commercial facilities New LED RETROFIT program
2010 CA Higher Education Sustainability Conference
 2010 CA Higher Education Sustainability Conference Energy Efficiency Partnership Program Best Practice Awards Application Project Category 11 Rendering Used Courtesy of Cannon Design I. Contact Information
Commercial Facilities Contract Group Direct Impact Evaluation
 2006-2008 Direct Impact Evaluation Study ID: PUC0016.01 Volume 1 of 3 Final Report Prepared by: ADM Associates, Inc. Innovologie LLC Marketing Excellence, Inc. C. J. Brown Energy, P.C. David Claridge,
LOCAL GOVERNMENT PARTNERSHIP CITY OF BEAUMONT
 LOCAL GOVERNMENT PARTNERSHIP CITY OF BEAUMONT 2009-2011 Program Cycle Abstract DATED: MARCH 10, 2008 PART 1. PARTNER INFORMATION a) City of Beaumont b) New Local Government Partner b) Contact: Kelsey DeForge
Impact Evaluation of Upstream HVAC Programs (HVAC1)
") Impact Evaluation of 2013-14 Upstream HVAC Programs (HVAC1) California Public Utilities Commission Date: CALMAC Study ID [Fill In here] LEGAL NOTICE This report was prepared under the auspices of the California
Impact Evaluation of 2013-14 Upstream HVAC Programs (HVAC1) California Public Utilities Commission Date: CALMAC Study ID [Fill In here] LEGAL NOTICE This report was prepared under the auspices of the California
DEEMED SAVINGS TECHNICAL ASSUMPTIONS
 Product: Description: Prescriptive rebates will be offered for replacement lighting equipment. New Construction rebates will be offered for new facilities or spaces overhauled for a new purpose. Custom
Incentives. After work is complete:
 SAVE your WAY Create your own Energy Demand Savings with OUC s Commercial & Industrial Custom Incentive Program Overview OUC is committed to helping your business become more energy efficient. We understand
California Commercial Market Share Tracking Study
 Report California Commercial Market Share Tracking Study Prepared for California Public Utilities Commission Itron, Inc. 11236 El Camino Real San Diego, California 92130 (858) 724-2620 November 13, 2014
Both components are available to non-residential customers in Public Service s electric and natural gas service territory.
 Page 122 of 507 New Construction A. Description The New Construction product influences building owners, architects, and engineers to include energy efficient systems and equipment in their design for
Will California Ever Get the LED Out? Results from a Fall 2011 LED Market Characterization and Shelf Survey Studies
 Will California Ever Get the LED Out? Results from a Fall 2011 LED Market Characterization and Shelf Survey Studies Jennifer E. Canseco, Kathleen Gaffney and Geoff Barker DNV KEMA Energy & Sustainability
The California Energy Commission s Peak Load Reduction Program. Peak Reduction Program Authorization and Funding
 The California Energy Commission s Peak Load Reduction Program Presented By: Monica Rudman California Energy Commission (916) 654-4006 mrudman@energy.state.ca.us Prepared for: ACEEE Conference on Energy
Annual Investor Conference
 Annual Investor Conference Mark Eubanks, President Eaton s Cooper Lighting Division February 27, 2015 Lighting Facts Lighting represents 20% of global electricity consumption DOE projects that by 2030
Tom Ledyard, RLW Analytics, Inc. and Lynn Hoefgen, Nexus Market Research Subject: Extended residential logging results Date: May 2, 2005
 To: Angela Li, National Grid USA From: Tom Ledyard, RLW Analytics, Inc. and Lynn Hoefgen, Nexus Market Research Subject: Extended residential logging results Date: May 2, 2005 We have recently removed
Amy Buege and Luke Scheidler, Itron Kevin Grabner, Navigant
 Row, Row, Row your Commercial Lighting Program Simply Down the (Mid)-Stream? Amy Buege and Luke Scheidler, Itron Kevin Grabner, Navigant ABSTRACT Energy Efficiency Programs that focus on the sales of high
AC2 Evaporative Condenser. Monitoring Report: 1998 Cooling Season
 AC2 Evaporative Condenser Monitoring Report: 1998 Cooling Season Report Issued: December 29, 1998 Presented to: Prepared by: Lance Elberling Pacific Gas and Electric Company Davis Energy Group 123 C Street
Energy Storage Cost Summary for Utility Planning: Executive Summary
 Energy Storage Summary for Utility Planning: Executive Summary 3002008877, November 2016 EPRI Project Managers G. Damato E. Minear DISCLAIMER OF WARRANTIES AND LIMITATION OF LIABILITIES THIS DOCUMENT WAS
DEEMED SAVINGS TECHNICAL ASSUMPTIONS
 Product: Prescriptive rebates will be offered for replacement lighting equipment. New Construction rebates will be offered for new facilities or spaces overhauled for a new purpose. Custom rebates are
Impact Evaluation of the 2009 California Low-Income Energy Efficiency Program
 Impact Evaluation of the 2009 California Low-Income Energy Efficiency Program Study ID: SCE0273.01 FINAL REPORT Volume 1 of 2 Main Report Prepared for: California Public Utilities Commission Energy Division
The American Council for an Energy-Efficient Economy Emerging Technologies Report. Integrated Daylighting Systems (Dimming Ballasts) June, 2006
 June, 2006") The American Council for an Energy-Efficient Economy Emerging Technologies Report Integrated Daylighting Systems (Dimming Ballasts) June, 2006 Summary Definition Basecase New Measure: Digital network of
The American Council for an Energy-Efficient Economy Emerging Technologies Report Integrated Daylighting Systems (Dimming Ballasts) June, 2006 Summary Definition Basecase New Measure: Digital network of
Focus on Energy Calendar Year 2014 Evaluation Report Volume II May 27, 2015
 Focus on Energy Calendar Year 2014 Evaluation Report Volume II May 27, 2015 Public Service Commission of Wisconsin 610 North Whitney Way P.O. Box 7854 Madison, WI 53707-7854 This page left blank. Prepared
Energy-efficient Lighting for Florida Homes
 Energy-efficient Lighting for Florida Homes Authors Parker, Danny Drake, Nick Publication Number FSEC-EN-18-91 Copyright Copyright Florida Solar Energy Center/University of Central Florida 1679 Clearlake
Customer Energy Efficiency Program Measurement and Evaluation Program
 Customer Energy Efficiency Program Measurement and Evaluation Program 1997 INDUSTRIAL ENERGY EFFICIENCY INCENTIVE PROGRAM IMPACT EVALUATION -------------------------------------------------- PG&E Study
SERVICE CLASSIFICATION NO. 6
 P.S.C. NO. 3 ELECTRICITY LEAF: 293 ORANGE AND ROCKLAND UTILITIES, INC. REVISION: 2 INITIAL EFFECTIVE DATE: July 19, 2012 SUPERSEDING REVISION: 1 SERVICE CLASSIFICATION NO. 6 APPLICABLE TO USE OF SERVICE
Food Service Technology Center
 Food Service Technology Center Lainox NAEV072 Electric Combination Oven Test Report FSTC Report # 501318020.00-R0 Application of ASTM Standard Test Method F2861-14 August 2018 Prepared by: Rodney Davis
ENERGY SAVINGS POTENTIAL OF DLC COMMERICAL LIGHTING AND NETWORKED LIGHTING CONTROLS. 1 of 12
 1 of 12 PREPARED FOR: DesignLights Consortium 10 High Street, Suite 10 Medford, MA 02155 AUTHOR: Dan Mellinger, Energy Futures Group 2 of 12 INTRODUCTION Energy saving opportunities for residential utility
APPENDIX B. Public Works and Development Engineering Services Division Guidelines for Traffic Impact Studies
 APPENDIX B Public Works and Development Engineering Services Division Guidelines for Traffic Impact Studies Revised December 7, 2010 via Resolution # 100991 Reformatted March 18, 2011 TABLE OF CONTENTS
Impact Evaluation of 2015 Upstream HVAC Programs (HVAC 1)
") Impact Evaluation of 2015 Upstream HVAC Programs (HVAC 1) California Public Utilities Commission Date: April 4, 2017 CALMAC Study ID CPU0116.03 LEGAL NOTICE This report was prepared as an account of work
Impact Evaluation of 2015 Upstream HVAC Programs (HVAC 1) California Public Utilities Commission Date: April 4, 2017 CALMAC Study ID CPU0116.03 LEGAL NOTICE This report was prepared as an account of work
Advanced Lighting Control System (ALCS) in an Office Building
 in an Office Building") PG&E s Emerging Technologies Program Advanced Lighting Control System (ALCS) in an Office Building ET Project Number: ET12PGE1031 Project Manager: Jeff Beresini Pacific Gas and Electric Company Prepared
PG&E s Emerging Technologies Program Advanced Lighting Control System (ALCS) in an Office Building ET Project Number: ET12PGE1031 Project Manager: Jeff Beresini Pacific Gas and Electric Company Prepared