WATER SUPPLY AND DISTRIBUTION PLAN. City of Medina. Adopted November 17, Project Number:
|
|
|
- Erika Horn
- 6 years ago
- Views:
Transcription


1 WATER SUPPLY AND DISTRIBUTION PLAN City of Medina Adopted November 17, 2009 Project Number:
2
3 CITY OF MEDINA WATER SUPPLY AND DISTRIBUTION PLAN Table of Contents Executive Summary...1 Introduction... 1 Growth and Water Demand... 1 Existing Facilities... 1 Ultimate Design Water System... 2 Phasing of Proposed Improvements... 3 Economic Analysis... 3 Recommendations... 4 Introduction...5 Purpose and Objectives... 5 Background... 5 Population and Water Demands...7 General... 7 Land Use Plan and Population Forecasts... 7 Projected Water Use... 8 Existing Facilities...15 Water Supply Treatment Facilities Storage Facilities Distribution System Hydraulic Analysis Adequacy of Existing Facilities Proposed Facilities...19 Supply-Storage Considerations Hydraulic Analysis Raw Water Supply Wellhead Protection Treatment Storage Distribution System Economic Analysis...29 Cost Estimates Capital Improvement Plan Existing Water System Charges Lateral Benefit/Trunk Oversize City of Medina Project No: Water Supply and Distribution Plan Adopted November 17, 2009
4 TABLES Table 1: Served Population Forecasts... 8 Table 2: Medina Future Demand Rates...12 Table 3: Projected Water Demands for Medina...13 Table 4: Design Fire Flows...14 Table 5: Existing Storage Facilities...17 Table 6: Ultimate System Supply-Storage Requirements...19 Table 7: Existing Water Treatment Facility...24 Table 8: Future West Water Treatment Facility...24 Table 9: Ultimate Storage Facilities...25 Table 10: Supply-Treatment-Storage Phasing...28 Table 11: Ultimate Water System Cost Summary...29 Table 12: Water System Capital Improvement Program...30 Table 13: Current Connection Charges...31 Table 14: Estimated Number of Future Connections...32 FIGURES Figure 1: Daily Demand Variations... 9 APPENDICES Appendix A: Water Emergency & Conservation Plan Appendix B: Model Results Appendix C: Hydrant Flow Tests Appendix D: Cost Estimates Appendix E: Water Quality Requirements Appendix F: Supplemental Maps City of Medina Project No: Water Supply and Distribution Plan Adopted November 17, 2009
5 CITY OF MEDINA WATER SUPPLY AND DISTRIBUTION PLAN Executive Summary INTRODUCTION This report represents a Comprehensive Water Supply and Distribution Plan of a water system which will meet both the near-term and long-range needs of the City of Medina. The Water Distribution Map, located in Appendix F, identifies the anticipated water facilities and infrastructure proposed to serve Medina through the ultimate system. GROWTH AND WATER DEMAND Medina has maintained a steady population over the years to a total 2006 population of 4,811. Water needs will increase slightly with an estimated 2030 served population of 8,993. The ultimate saturation population to be served by Medina water is estimated to be about 11,481. From this point forward, all population estimates stated are for populations served by Medina s water system. Water use has increased steadily as population has grown. Medina currently pumps an average of 400,000 gallons each day. Over the past 10 years, the maximum day occurred in 2006, with 1.3 million gallons being pumped on one day. The projected water demand for 2030 is a daily average of 1.8 MG with an estimated daily maximum of 5.7 MG. The projected ultimate demand is a daily average of 2.7 MG and projected maximum daily demand of 6.2 MG. Projected water demands were based on the land use designations from the 2008 Medina Comprehensive Plan, and include service Independence Beach and to a portion of southwestern Corcoran. EXISTING FACILITIES The existing water supply and distribution system has served Medina's needs well. Previous studies have identified and quantified cost-effective and timely improvements for the system. The existing distribution system is presented on the Water Distribution Map at the back of this report. The City s topography is rolling and the existing system operates all under one pressure zone. The high water level for this pressure zone is The City of Medina contains three (3) separate and isolated water distribution systems. The three systems are: the Hamel Area system in northeast Medina; the Independence Beach system in western Medina; and the Morningside system in southern Medina. The Hamel Area system is by far the largest of the three systems. The Hamel Area system presently obtains its raw water supply from 6 groundwater wells consisting of Wells 2, 3, 4, 5, 6 and 7. Wells 3 and 4 supply raw water to the water treatment plant located along Tower Drive just east of Pinto Drive. Well 2 and Well 5 supply raw water directly to the Hamel Area distribution system. Well 2 is a reserve well. Well 2 supplies a total capacity of 150 gpm directly to the distribution system. Well 3 supplies a total capacity of 150 gpm to the Treatment Facility. Well 4 supplies a total capacity of 800 gpm to the Treatment Facility. Well 5 supplies a total capacity of 300 gpm directly to the distribution system. Well 6 supplies a total capacity of 400 gpm to the Treatment Facility. The total firm capacity (defined as the capacity with the largest pump out of service) with all wells pumping for extended periods is 1,800 gpm or 2.59 MGD City of Medina Project No: Water Supply and Distribution Plan Page 1
6 One 400,000 gallon elevated storage facility stabilizes pressures during peak water demands and also serves as a source of water during fires or power outages. The Water Treatment Facility has an additional 200,000 gallons of clearwell storage. There is a total existing usable storage volume of 400,000 gallons. Water from Wells 3 and 4 is pumped to the Treatment Facility where the radium, iron, and manganese is removed. Chlorine and fluoride are added to disinfect and prevent tooth decay. After treatment, the water is stored in the 200,000 gallon clearwell. The high service pumps supply water from the clearwell to the distribution system as needed, based on signals from the elevated storage tanks. The Independence Beach and Morningside systems are small hydro-pneumatic systems that provide only short term storage and pressure to their respective distribution systems. COMPUTER MODEL A hydraulic analysis of Medina s ultimate water supply and trunk distribution system was conducted using computer modeling software, simulating the system s response to average and peak demands, tank refill, and fire fighting scenarios. Each condition creates different responses in the water system. The modeling and its results help to identify, gauge, and respond to conditions that could result in poor water system performance. ULTIMATE DESIGN WATER SYSTEM The ultimate system, shown on the map at the back of this report, consists of the following improvements: 7 new supply wells, including 1 additional backup well; Expand the existing 2.0 MGD Treatment Plant to 3.0 MGD; Install 3.2 MGD Treatment Plant to serve future high pressure zone and future portions of the existing pressure zone; Install an additional 1.5 million gallons of elevated storage; and Install 20 miles of trunk water distribution mains. The improvement program for Medina's ultimate trunk water supply and distribution system is estimated to cost $29,250,000. This cost is broken down into supply, storage, and distribution as follows: Distribution $7,100,000 Supply $7,000,000 Storage $6,950,000 Treatment $8,200,000 Total $29,250,000 City of Medina Project No: Water Supply and Distribution Plan Page 2
7 PHASING OF PROPOSED IMPROVEMENTS The existing wells, water treatment plant, and elevated storage do not have sufficient capacity to serve all of the proposed additional development. Therefore, additional supply, treatment, and storage are required to serve existing and future service areas. Furthermore, a new high pressure zone (HWL = 1195) will be needed to provide water service to northwest portions of Medina and southwestern portions of Corcoran as development progresses to higher ground elevations. Near term recommended improvements include the following: 1. Drill Well 8 in the existing well field. This phased installation of new wells will provide an adequate supply to the Hamel Area System until The potential for utilizing the existing Independence Beach wells to supply the Hamel system should be investigated. 2. Construct an additional water tower in the existing Hamel service area with a high water level of 1165 (see Ultimate Trunk Water System map in Appendix F). This water tower will provide pressure, storage, and fire flows for portions of northwest Medina and Independence Beach. The tower should be a minimum of 0.75 MG to provide some level of fire protection to the proposed residential and commercial development. This water tower is projected to provide adequate storage and pressure to the Hamel Area System until Long term future recommended improvements include the following: 1. Establish a future Western Well Field and drill Wells 9 and 10 and one backup wells. 2. Provide a 1.0 MGD expansion to the existing Water Treatment Facility that currently has a capacity of 2.0 MGD. 3. Construct the future Western Water Treatment Facility. The most favorable location for the future Western Water Treatment Facility is in the future high pressure zone near the future Western Well Field. 4. Construct an additional water tower in the future western service area with a high water level of This water tower will provide pressure, storage, and fire flows for the western portion of the existing city limits including southwest Corcoran. The tower should be a minimum of 0.75 MG to provide some level of fire protection to the proposed residential and commercial development. Current plans are for both the northwest Medina and southwest Corcoran areas to expand concurrently with service extended to southwest Corcoran. Building additional wells, treatment, and storage in both the high pressure zone and the low pressure zone and southwest service will be necessary as demand increases. Also, phasing of water storage tanks must be done carefully, to avoid freezing problems in the winter due to low use when the tank is first placed into service. ECONOMIC ANALYSIS This report recommends that the City maintain the current system of using connection charges to finance the proposed Capital Improvement Plan. Connection charges per residential equivalent connection are proposed to pay for 100% of distribution, supply and storage costs. City of Medina Project No: Water Supply and Distribution Plan Page 3
8 The City should review the Capital Improvement Program annually and modify the program to better serve community development needs. The entire water supply and distribution plan should be revised every 5 to 7 years. RECOMMENDATIONS Based upon the results and analysis of this study, the following are recommendations for the City of Medina and the Medina City Council. 1. Adopt this study and the Capital Improvement Plan as a guide for the orderly expansion of the City s water system. 2. Adopt the Emergency Preparedness and Conservation Plans included in this report (Appendix A) and submit them to the Department of Natural Resources and the Metropolitan Council for their approval. 3. Annually review the Capital Improvement Program and water system service charges to serve community development. 4. Plan for acquisition of a site for additional elevated tank storage in western Medina, and any easements required to connect these sites to the water system and to prevent conflicts with surrounding development. City of Medina Project No: Water Supply and Distribution Plan Page 4
9 CITY OF MEDINA WATER SUPPLY AND DISTRIBUTION PLAN Introduction PURPOSE AND OBJECTIVES The purpose of this Water Supply and Distribution Plan (hereafter referred to as the Plan) is to provide a comprehensive improvement program to meet the near-term and ultimate water supply needs for the City of Medina. The primary objective of this report is to provide a comprehensive water system plan for the entire City, based on Medina s anticipated land use plan. Specific objectives are as follows: Determine the ultimate water demands expected within the City and the production capacity and storage required to meet these demands. Revise the existing and proposed trunk water main system in accordance with present planning. Determine near-term supply and storage needs in order to allow sufficient lead time for the addition of facilities to the system. Hydraulically analyze the existing and ultimate system to identify weaknesses and propose solutions to ensure adequate operating and residual pressures. Optimize supply, treatment, storage, and distribution combinations to develop an economical and energy-efficient ultimate water system. Develop preliminary cost estimates for supply, storage, and distribution to form a basis for a suitable financing program. BACKGROUND The City of Medina is located in western Hennepin County. Medina has grown steadily over the years to a total 2006 estimated population of 4,811. The 2006 population that is served by Medina s water system is 1,989. Water needs will increase as the served population increases to an estimated 2030 population of 8,993. From this point forward, all population estimates stated in this report are for populations served by Medina s water system. Water usage within the City has increased steadily during the last 10 years with the influx of new residents and employees. The City of Medina currently has three independent water systems consisting of: the Hamel Area System; the Independence Beach System; and the Morningside System. The Hamel Area System is by far the largest of the three water systems and is the primary focus of this report. The City of Medina is currently pumping approximately 147 million gallons of water into the system each year. Peak day water demand in 2006 was 1.3 Million Gallons per Day (MGD). The increasing demands that the growing population will place on the City's water system make the provision of a well-planned water supply and distribution system a necessity. The plan contained herein presents a comprehensive water supply and distribution system plan for the entire City of Medina. This plan will establish continuity in the development of an ultimate system by serving as a guide for future expansions and additions. City of Medina Project No: Water Supply and Distribution Plan Page 5
10 A municipal water system can be divided into three main categories: supply and treatment facilities, storage facilities, and the distribution system. Supply and Treatment Facilities include all equipment necessary to pump, treat, and distribute the amounts of water demanded by the system. Medina is supplied solely by groundwater supply sources. The supply facilities include the wells, pumps, pumphouses, controls, water treatment facilities, raw water transmission mains, and all related facilities. The Storage Facilities are the reservoirs used throughout the system to store water for usage during emergency and peak conditions. Water from storage is fed into the system by gravity or by pumping from a booster station. Two types of reservoirs feed water directly into the system by gravity. These include a ground reservoir with the floor resting on the ground (typically on a hill or other high point) or an elevated reservoir with columns supporting the tank (often referred to as a water tower ). A ground reservoir may also be constructed at an elevation which requires a booster station to pump the water into the system at the proper pressure. The Distribution System consists of trunk water mains (primarily 12 inches or larger in diameter), lateral water mains (6 inches to 10 inches in diameter), the service pipes, valves, hydrants, and all appurtenances necessary to convey water from the supply sources and reservoirs to the points of demand. Since the water laterals are normally routed along residential streets within a development, it is impossible to predict with any degree of accuracy where future laterals will be placed in undeveloped areas. Therefore, future lateral lines are excluded from consideration in analyzing the trunk distribution system hydraulics. The phased construction of the Medina water distribution system has primarily been dependent on development within the City. Where development occurs, water mains are constructed to serve those specific developments. However, development within the City is not always absolutely contiguous and gaps in the distribution system may result. As development continues to move farther away from the supply wells and reservoirs, these gaps can cause problems with insufficient supply and pressures since they prevent the "looping" of the distribution system. Looping of the distribution system provides system reliability in the event of a water main break, but more importantly it provides the large flows required for fighting fires. One of the purposes of this report is to evaluate potential water pressure and supply problems inside the study area and determine the most feasible solutions. City of Medina Project No: Water Supply and Distribution Plan Page 6
11 CITY OF MEDINA WATER SUPPLY AND DISTRIBUTION PLAN Population and Water Demands GENERAL This section of the Plan develops the performance criteria under which the water system is evaluated and designed. This involves an evaluation of land use, population growth and trends, and previous water use patterns. Capacity requirements for the three water system components of supply and treatment, storage, and distribution are dictated by the demands placed upon them for production and distribution. The design of the water supply and distribution system for Medina is based on estimates of the ultimate water demands. Phasing of the system improvements is based on estimates of near-term needs. Water demand (both peak and average) is affected by many factors including population, population distribution, commercial and industrial activity, water quality, water rates, climate, soil conditions, economic level of the community, sewer availability, water pressures and the condition of the water system. The most important factor is land usage, which encompasses residential and non-residential development. Projections of ultimate land usage and population for Medina have been correlated with past and present water demands to develop estimates of future and ultimate water demands in the City. The water use records were used as the basis for the new water demand computations contained in this report. LAND USE PLAN AND POPULATION FORECASTS LAND USE PLAN This Plan is based on the City of Medina s 2008 Comprehensive Plan. Each land use type is described in Chapter 5 of the Comprehensive Plan. The Land Use map which serves as the basis of this report is shown in Appendix F. Proposed land uses in Corcoran, which may be served by Medina water, were identified in Corcoran s 2009 Comprehensive Plan. This Plan evaluates the ability of Medina to provide water service to 792 (gross) acres in southwestern Corcoran. In order to estimate water demands, Medina s Land Use Map along with the phasing specified by the City of Medina was utilized. Net developable acreage was identified by the City in the Comprehensive Plan. This was found by subtracting wetlands, and lakes from gross acreage of each land use type. SERVED POPULATION FORECASTS Ultimate population estimates for the area to be served by the City of Medina were developed from a combination of City Population Projections and the estimated population of Corcoran to be served by Medina. The estimated projections from Corcoran are developed by multiplying the developable acres for each residential land use by the appropriate factors in Table 2. These factors (units per acre and persons per unit) were obtained from Medina s 2008 Comprehensive Plan and Corcoran s 2009 Comprehensive Plan. City of Medina Project No: Water Supply and Distribution Plan Page 7
12 The projected population served by Medina water, shown in Table 1, is calculated by taking Medina s projected served population, plus the portions of Corcoran that will be served by Medina, minus the areas that will (and are currently) be served by other cities. Thus, the facilities described in this report are designed to serve a potential ultimate saturation population of 11,481. Actual growth rates will affect only the timing of construction and not the actual design of the system. TABLE 1: SERVED POPULATION FORECASTS Year City of Medina Served Projections 1 Corcoran (served by Medina) Projections Medina Areas served by Maple Plain 2 Medina Areas served by Orono (Morningside) 3 Total Served by Medina Water System , , , , , , , , ,993 1, ,987 Ultimate 10,746 1, ,481 1 Source: Medina Comprehensive Plan - Includes all projected sewered areas within City Limits. 2 Approximated from 23 Units of LDR 3-21 Existing LDR Units through 2009, Approximated development , Entire Morningside area to be served by Orono in Ultimate System. 4 - City of Medina Served minus areas served by other cities, plus Corcoran PROJECTED WATER USE Projected water use is based on forecast population, land use, and estimates of per capita or per acre consumption. Each of the land use categories was reviewed, and compared to existing water use patterns evaluated in detail in the City s Water Emergency and Conservation Plan (contained in Appendix A). VARIATIONS IN WATER USE The rate of water consumption will vary over a wide range during different periods of the year and during different hours of the day. Several characteristic demand periods are recognized as being critical factors in the design and operation of a water system. The demand rates are expressed in Million Gallons per Day (MGD) which, in the case of a daily demand, indicates the total amount of water pumped in a 24 hour period. Hourly rates are also expressed in million gallons per day. In the case of an hourly rate, the rate in MGD is determined by assuming that the pumpage would continue at the indicated rate for 24 hours. Pumping records which were used in determining water demands and demand variations are outlined in the Water Emergency & Conservation Plan located in Appendix A. The average day demand is equal to the total annual pumpage divided by the number of days in the year. The average day demand is used as an aid in estimating maximum day and maximum hour demands. The average day demand is also utilized in estimating future revenues and operating costs such as power City of Medina Project No: Water Supply and Distribution Plan Page 8
13 and chemical requirements, since these items are determined primarily by the total annual water requirements rather than by daily or hourly rates of usage. The average day demand has ranged from 0.19 MGD to 0.40 MGD during the past five years. The total average day per capita water use (average day water use for the entire City divided by the number of people served) has ranged from 147 gallons per capita per day (gpcd) to 201 gpcd over the past five years. The maximum day demand is the critical figure in the design of certain elements of the waterworks system. The principal items affected by the maximum day demands are: Water supply facilities, Treatment plant capacity, and Treated water storage requirements. The water supply facilities must be adequate to supply water at the maximum day demand rate and the water treatment plant must be capable of processing a majority of the water supplied. Sufficient treated water storage should be provided to meet hourly demands in excess of the water supply capacity. The installed capacities should also include reserves for growth, industrial development, and fire protection. The maximum day demand has ranged from 0.50 MGD to 1.28 MGD during the past five years. The ratio of maximum day demand to average day demand has varied from 2.6 to 3.2 over the past five years. The total maximum day per capita water use (total water use on maximum day divided by the served population) has varied from 392 gpcd to 645 gpcd over the past five years. The maximum demands upon the water system are encountered during short periods of time, usually on days of maximum consumption. These short period demands are referred to as hourly demands, and they seldom extend over a period of more than three or four hours, generally during hot summer mornings and evenings when the sprinkling load is the highest. Figure 1 shows the demand fluctuations over the course of a hot summer day. FIGURE 1: DAILY DEMAND VARIATIONS Diurnal Demand Pattern Max Day Percent of Max Day Time (hr) City of Medina Project No: Water Supply and Distribution Plan Page 9
14 The peak hour consumption rates impose critical demands on the distribution system, and major elements of the waterworks facilities must be designed to meet these demands and provide satisfactory service at all times. As can be seen in Figure 1, the lowest demands (during tank filling periods) are about 25% of the maximum day demand, and the peak hourly demands are 2.0 times the maximum day demand. Peak hour demands in Medina are currently supplied by the Water Treatment Facility and from water drawn from a 400,000 gallon elevated storage tank in the distribution system. Although the rate of consumption is high during periods of maximum hourly demand, the duration of extreme rate is relatively short. Therefore, a moderate quantity of water withdrawn from storage reservoirs strategically located on the system assures satisfactory service, minimizes the total maximum hour pumping and transmission main capacity required, and permits more uniform and economical operation of the treatment plants and pumping facilities, and from sudden and unusual demands brought about by fires or line breaks. Storage on the system is also an important factor in insuring reliability of service during emergencies resulting from power failure, temporary outages of water supply facilities, and from sudden and unusual demands brought about by fires or line breaks. The seasonal variation in winter and summer water production rates can be attributed to the discretionary use of water. This includes such things as lawn and garden irrigation, car washing, and other recreational uses. Understanding discretionary use can be useful when targeting water conservation efforts and estimating capacity to supply non-discretionary demands. In 2006, the maximum day water use in the summer was 7 times the average daily use in the winter. WATER DEMAND BY CUSTOMER CATEGORY Water demands vary with land use. High peak usage rates are experienced in low density residential areas during hot, dry periods due to extensive lawn sprinkling, while usage in high density areas depends on human consumption to a greater extent. Average daily usage for commercial and industrial areas can be high, but is much more stable than residential usage. Therefore, although commercial and industrial areas have high average usage, the peak usage (maximum day and maximum hour demands) is comparable to those in residential areas. Parks experience very low demands for the majority of the year; however the lawn sprinkling demand for athletic fields can be very high. Data from 2006 shows that approximately 70% of the water used in Medina is for residential use, 25% for Commercial/Industrial and respective lawns, and the remaining 5% split among City Usage, and Unaccounted Water. Appendix A provides a more detailed analysis of water demand by customer category. Appendix A also identifies the major water users in the City of Medina. WATER CONSERVATION PLAN The ability to reach all of the goals identified in the city s Water Conservation Plan (Appendix A) is unknown. The water use projections in this Plan are conservatively based on existing water use patterns (as discussed above) and moderate success of the Water Conservation Plan. If the City conservation program is more successful, the water use projections in this report should be revised accordingly. One common indicator of conservation is the per capita water use in the City. In this case, the current total per capita water use in the Hamel System is 203 gpcd (average day) and 645 gpcd (maximum day). The average day residential demand is 0.3 MGD, and other (non-residential) average day demand is 0.1 MGD. City of Medina Project No: Water Supply and Distribution Plan Page 10
15 The Minnesota Department of Natural Resources is now allowing water suppliers to use their approved Water and Emergency and Conservation Plan to request approval for increased appropriation of water that are planned for over the ten year life of the plan. To qualify for the ten year permit approval, the City must meet several water conservation benchmarks, or commit to conservation measures that address the water use related to the benchmark. The following describes the benchmarks, and how Medina compares to each benchmark. Unaccounted for Water Use less than 10%. Medina s unaccounted for water use has been less than 7% in each of the last 10 years except for 2003 which was 15.7%. The unaccounted for water use was 1.1% in Residential Per Capita Water Use less than 75 gpcd. Medina s residential per capita water use has ranged from 78 to 139 gpcd during the past 10 years. Peak Demands Maximum Day to Average Day Ratio less than 2.6. The ratio of maximum day demand to average day demand has varied from 2.6 to 3.2 over the past five years. FUTURE DEMAND RATES Each of the land use categories was examined in light of the water demand criteria described above to determine future demand rates for design. These demand rates are expressed in gallons per minute (gpm) per developable acre. The resulting demand rates are shown on Table 2 below. City of Medina Project No: Water Supply and Distribution Plan Page 11
16 TABLE 2: MEDINA FUTURE DEMAND RATES Land Use Type Units /Acre Persons /Unit Person s/acre Average Water Use (gpcd or gpd/ac.) Demand Rates (gpm/ac.) Averag e Day Maximu m Day Agricultural Rural Residential LDR MDR HDR MU MU-B 1, Developing Post Commercial 1, General Business (GB) 1, Industrial (IB) 1, Closed Sanitary Landfill (SL) Public Semi-Public (PSP) Parks and Recreation Parks and Recreation Regional or State Private Recreation (PREC) Open Space (OS) The demand rates for the portion of Corcoran to be served by Medina, were found by matching Corcoran s proposed land use with a similar land use from Medina, and then applying Medina s demand rates as listed above. PROJECTED WATER DEMANDS Projected average and maximum day water demands for various time horizons are presented in Table 3. These were found by multiplying the demand rates in Table 2, by the number of developable acres. As noted, the maximum day water demand is used for the sizing of water supply and treatment facilities. A record of actual maximum day demands should be charted to aid in sizing and phasing of future facilities. The ultimate maximum day demand is estimated to be 6.2 MGD. A five percent contingency factor is included in the projections in Table 3 to account for uncertainty in redevelopment plans, changes in the ultimate service area, and future water use patterns. City of Medina Project No: Water Supply and Distribution Plan Page 12
17 TABLE 3: PROJECTED WATER DEMANDS FOR MEDINA Year Average Day (MGD) Total Served by Medina Hamel water System 2 Medina Hamel System Served Projections 1 Corcoran (served by Medina) Projectio ns Maximum Day (MGD) Total Served by Medina Hamel water System 2 Medina Areas served by Maple Plain 3 Medina Areas served by Orono (Morningside) Ultimate Hamel Design* Existing water use for 2007 Hamel System only 2 Medina Hamel + Potential Corcoran 3 Estimated 4 Estimated * To account for future changes, and allow flexibility, the Ultimate system is designed for this amount FIRE DEMAND Water requirements for fire demand are also a vital consideration in the design of a water supply and distribution system. Fire demand varies greatly from normal usage in that an extremely large quantity of water is required from a concentrated demand point in a very short time. While the quantity of water used for fires is almost negligible when compared to other usage categories, the extremely high rate of usage during an emergency situation frequently governs design. The Insurance Services Office recommends that a system the size of Medina's be capable of delivering a fire demand of 1,000 GPM to 3,500 GPM for varying durations depending on the rate of demand. Although fire sprinkling systems may lower the required fire flows, a conservative approach is used in this Plan by using the high end of the recommendations. Table 4 shows the fire flows used in the design of the Medina water system. The most recent ISO Report is contained in Appendix F. City of Medina Project No: Water Supply and Distribution Plan Page 13
18 TABLE 4: DESIGN FIRE FLOWS Land Use Required Fire Flow (gpm) Duration (hrs) Commercial\Industrial 3,500 3 Institutional\Public 3,500 3 Two Family Residential 1,500 2 Single Family Residential 1,000 2 City of Medina Project No: Water Supply and Distribution Plan Page 14
19 CITY OF MEDINA WATER SUPPLY AND DISTRIBUTION PLAN Existing Facilities WATER SUPPLY GENERAL The Twin Cities Metropolitan Area is underlain by geological formations that are capable of yielding large volumes of water. These formations were deposited in a trough that resulted in a unique dish-shaped geological structure centered below the Seven County Metropolitan Area. The Twin City Artesian Basin contains a total of six bedrock aquifers. Four of these aquifers, the Franconia- Ironton-Galesville (FIG), the St. Peter, and the Platteville-Decorah, are minor aquifers. The major aquifers are the Prairie du Chien-Jordan and the Mt. Simon-Hinckley. The area also includes numerous smaller glacial drift aquifers. The Prairie du Chien-Jordan is the major aquifer in the Seven County Metropolitan Area, supplying approximately 75 percent of the area's groundwater. The majority of the remaining groundwater is supplied by the Mt. Simon-Hinckley aquifer. In the Medina area, there are three bedrock aquifer units available. They are the Jordan, the FIG, and the Mt. Simon. The Jordan aquifer in the Medina area is only available in scattered locations, and is missing the overlying Prairie du Chien bedrock aquifer. As such, well capacities are somewhat limited in the Jordan aquifer, though gpm wells are still available in select locations. The FIG aquifer is available throughout much of the City, but limited capacity of this aquifer means that wells must be spaced far apart and that each well is only capable of approximately gpm. Finally, the Mt. Simon aquifer is also available throughout the city and is capable of supplying gpm per well. However, the Department of Natural Resources (DNR) has restricted the construction of new large capacity wells in the Mt. Simon aquifer due to concerns the aquifer was being over-utilized in the metro area at a rate that exceeds the natural recharge to the aquifer. While existing Mt. Simon wells are allowed to remain in service, new Mt. Simon wells or new appropriations of Mt. Simon water are severely restricted. The DNR only allows construction of new Mt. Simon wells if a water supplier can demonstrate there are no other viable aquifers available for use for potable water supply. In addition to the bedrock aquifers found in the Medina area, unconsolidated drift deposits (sand and gravel) that are overlying the bedrock aquifer may also be saturated and capable of supplying sufficient water to a municipal water supply well. Medina Well 5 (located in the park on Brockton Lane in Hamel) is an example of a drift aquifer well in the area that produces approximately 400 gpm. Since drift aquifer deposits are highly variable in nature, locating saturated deposits capable of supplying future wells typically requires a program of test drilling and test pumping to find a viable well site. WELLS The Hamel Area System is supplied by Wells 2, 3, 4, 5, 6 and 7. Wells 2 and 3 are developed in the FIG aquifer and are each capable of producing 150 gpm. Well 4 is developed in the Mt. Simon aquifer and is capable of producing 800 gpm. Well 5 is developed in a Drift aquifer and is capable of producing 300 gpm. Well 6 is developed in the Jordan aquifer and is capable of producing 400 gpm. Well 7 is capable of producing 800 gpm. Total theoretical available water from the existing Hamel well field, ignoring well City of Medina Project No: Water Supply and Distribution Plan Page 15
20 interference during prolonged pumping periods is 2,600 gpm or 3.7 MGD. The total firm capacity (defined as the capacity with the largest pump out of service) with all wells pumping for extended periods is 1,800 gpm or 2.59 MGD. The Independence Beach System is supplied by two wells capable of producing 600 gpm and 140 gpm respectively. The smaller of the two wells is the primary well and the larger well is used as a stand-by well. The Morningside System is also supplied by two wells capable of producing 90 gpm and 150 gpm respectively. A small portion of south central Medina is served by Orono and a small portion of south western Medina is served by Maple Plain. These two small service areas are shown on the maps in Appendix F. WELL WATER QUALITY The U.S. Environmental Protection Agency (EPA) has established national drinking water standards. These standards contain federally enforceable Maximum Contaminant Level (MCL) standards for substances known to be hazardous to public health. Water quality parameters are defined and regulated by two sets of standards - Primary and Secondary. Primary Standards are set for those substances known to be a hazard to public health. Secondary Standards are set for those substances that, although not hazardous to public health, frequently cause drinking water to have objectionable aesthetic qualities, such as taste and odor. Test results on Medina's raw water supply are presented in the Emergency and Conservation Plan in Appendix A. The raw well water for Well 5 passes all Primary Standards, but exceeds the Secondary Standards for hardness, iron, and manganese. The raw well water for Wells 2, 3, 4, and 6 pass all Primary Standards except for Radium, and exceed the Secondary Standards for hardness, iron, and manganese. Although the water is considered safe, high iron and manganese levels cause objectionable tastes, red or black water discoloration, and staining of clothes and plumbing fixtures. Hard water requires more soap and detergents for washing, and causes scaling problems with fixtures, water heaters, and boilers. The main Water Treatment Plant was constructed to remove radium, iron, and manganese. Reduction of hardness in the water is done at individual homes and businesses through water softeners. A complete list of the drinking water standards can be found in Appendix E. Appendix E should be updated as new water quality requirements are promulgated. TREATMENT FACILITIES HAMEL AREA The Water Treatment Facility, originally constructed in 2006, has a design capacity of 2.0 MGD and is expandable to 3.0 MGD. The Treatment Facility utilizes a gravity filtration process to remove iron, manganese, and radium. The Water Treatment Facility has three high service pumps, each with a capacity of 1.15 MGD, for a total capacity of 3.45 MGD. The Water Treatment Facility has a clearwell storage volume of 200,000 gallons. City of Medina Project No: Water Supply and Distribution Plan Page 16
21 STORAGE FACILITIES HAMEL AREA Elevated storage tanks are used in Medina's water system for storage. System storage is used to maintain proper system pressures, supply water during treatment facility shut downs, high peak demand periods, and for emergency fire suppression. The existing 0.4 MG elevated storage tank feeds water directly into the system by gravity. In addition, there is a clear well at the Treatment Facility. The primary purpose of the clear well storage reservoirs is to aid in operation of the water treatment facilities to allow more efficient operation of high service pumps, filters, and well sequencing. The existing storage facilities for Medina are described in Table 5. Elevated Storage Tank TABLE 5: EXISTING STORAGE FACILITIES Effective Storage (1) (MG) High Water Level (Elevation) Existing Elevated Storage Tank 0.4 1,165 Total 0.4 (1) Effective storage is considered to be water available for use at an adequate residual pressure (not lower than 40 feet below the system high water level). INDEPENDENCE BEACH AND MORNINGSIDE The Independence Beach and Morningside systems are hydro-pneumatic systems that provide only short term storage and pressure to their respective distribution systems. DISTRIBUTION SYSTEM The distribution system consists of trunk water mains (primarily 10-inch or larger in diameter), and the lateral water mains (6-inch 8-inch in diameter), the service pipes, valve, hydrants and all appurtenances necessary to convey water from the supply sources and reservoirs to the point of demand. A network of large distribution mains extend from these treatment plant sites to the storage reservoirs located throughout the city and form the nucleus of the system. Currently, the distribution system contains approximately 8 miles of water main with diameters ranging from 6-inch to 16-inch. Due to the gently rolling terrain with a relatively small differential in ground surface elevation in Medina, the Hamel Area Water System operates under one pressure zone. The pressure zone operates at a water level elevation of 1,165 and serves the northeastern part of the city. Static pressures in the Hamel Area system range from approximately 45 to 85 psi. The Existing Static Water Pressure Map in the back of this report (Appendix F) shows the static pressure throughout the city. The plumbing code requires that individual private Pressure Reducing Valves (PRV) be installed in homes where more than 80 pounds of pressure may be experienced. City of Medina Project No: Water Supply and Distribution Plan Page 17
22 HYDRAULIC ANALYSIS A hydraulic analysis of Medina's trunk water distribution system was performed using computer modeling software. This model will be discussed in more detail in the next section. The first step in the process was to create a computer model of the existing supply and distribution system. The purpose of this model was to find any problems with the existing system and to serve as basis to build upon to create the entire (existing and future) system model. Therefore it is important for the model of the existing system to accurately portray how the existing system is functioning. This is accomplished through hydrant flow testing of the existing system. Medina's system was flow tested in seven different locations on May 14, 2007 and July 2, The computer model was then run with the same conditions in an attempt to match the results. After several trials in which model characteristics were adjusted, it was possible to match the computer model results with the field test results. ADEQUACY OF EXISTING FACILITIES The existing water supply and distribution system for the Hamel Area System meets the current demands placed on it. Previous improvements in the supply, treatment, storage, and distribution facilities have proven to be cost-effective and timely. The existing water supply wells and treatment plants have adequate treatment and pumping capacity for existing demands. However, there is very limited available capacity in the system to accommodate future growth. Recommended near term improvements include a new 750,000 gallon elevated storage tank. Generally, the existing storage facilities provide satisfactory static and residual pressures to most areas. The existing distribution system consists generally of properly sized mains that are capable of conveying water and fire flows to the needed areas. The hydraulic analysis and discussions with City staff identified necessary capital improvements. Modifications proposed to strengthen and expand the system are discussed in the following chapter. The existing Independence Beach and Morningside Systems utilize small hydro-pneumatic tanks to provide storage and pressure to its users. Both systems are adequate for the current number of users. This is consistent with the Recommended Standards for Water Works by Great Lakes Upper Mississippi River Board for systems with 150 or fewer residential connections. City of Medina Project No: Water Supply and Distribution Plan Page 18
23 CITY OF MEDINA WATER SUPPLY AND DISTRIBUTION PLAN Proposed Facilities SUPPLY-STORAGE CONSIDERATIONS Supply capacity, storage volume, and distribution system capacity are interrelated to a great degree. Reservoirs act as additional supply sources during peak periods when the primary supply source is incapable of meeting the demand. Thus, the storage tends to stabilize the peaks in water demand and allows the system to produce water at a lower, more uniform rate. The distribution system must be capable of carrying the flows from both the supply source and reservoirs without allowing pressures to drop below approximately 35 psi. Static pressure should be within a range of approximately 50 to 80 psi, if possible. The system must also be capable of conveying water from the source of supply to the reservoirs for storage without allowing the development of high pumping heads and high pressures in the system during low usage periods. There are an infinite number of combinations of supply and storage that can be used to meet peak water demands. The ideal combination is found where the sum of the cost of all the facilities in the system reaches a minimum. A close approximation of this point can be obtained by an analysis of supply and storage costs. For the vast majority of metro area communities, the ideal combination of supply and storage is found when the supply equals 100% of the maximum day demand. This is consistent with the recommendations in both Recommended Standards for Water Works by Great Lakes Upper Mississippi River Board, and American Water Works Manual of Practice M32 Distribution Network for Water Utilities. Based on our analysis and discussions with City Staff, we recommend that the City of Medina system have the capacity to produce water at a rate equal to 100% of the maximum day demand. For the ultimate system, this is 6.2 MGD. The above standards and the Minnesota Department of Health recommend that City provide effective storage equal to the average day demand of the City. Effective storage is considered to be water available for use at an adequate residual pressure (not lower than 40 feet below the system high water level). To meet this recommendation, Medina requires 1.75 MG of storage for the Ultimate System. The resulting supply and storage requirements for the ultimate system are shown in Table 6. Pressure Zone TABLE 6: ULTIMATE SYSTEM SUPPLY-STORAGE REQUIREMENTS Max. Day Demand (MGD) Required Storage Effective (MG) Required Supply (GPM) Existing Hamel (Low) ,500 Future Corcoran/Medina (High) ,800 Totals ,300 City of Medina Project No: Water Supply and Distribution Plan Page 19
24 HYDRAULIC ANALYSIS The Medina water system was analyzed in detail using WaterCAD, a hydraulic computer model. The model describes the entire system, including wells, pumps, reservoirs, booster stations, pressure reducing valves, and distribution mains and analyzed the system through a time simulation during the design maximum demand day. Hydraulic analysis was performed by the model using the Hazen-Williams energy loss formula and the Hardy Cross procedure. The Hardy Cross procedure is an iterative process in which both flows and energy losses are balanced throughout the entire system. A time simulation analysis examined the system on an hourly basis over the entire maximum demand day, including peak demand periods, reservoir-filling conditions, and critical pressures. The analysis used the maximum day demand curve presented on Figure 1. A peak hourly demand of approximately 2 times the maximum day demand is incorporated into the curve. Input for the computer model includes pipe sizes and lengths, point supplies and demands, storage reservoir characteristics, pump performance curves, and ground elevations. The model then computes data for various times of the day based on the demand curve. This data includes pipe flows and velocities, energy losses, pressures at each demand point, pumping rates, and storage reservoir levels. Analysis of this data facilitates the design of an economical and adequate water system. Results of this analysis and recommendations for improvements are presented later in the report. RAW WATER SUPPLY WELLS REQUIRED As discussed previously, the most economical way to meet the demand conditions in Medina is to have a total well firm capacity equal to 100% of the maximum day demand of each pressure zone. For Medina at saturation development, the required total firm production capacity is 4,300 gpm (6.2 MGD). Total firm capacity is defined as the capacity available with the largest single well out of service. Peak demands on the system will be supplied by storage. It is recommended that the ultimate production capacity be divided between the existing east well field and the future west well field according to the treatment plant capacity, as follows: East Well Field (Main Treatment Facility) 3.0 MGD (2,082 gpm) West Well Field (Future Treatment Facility) 3.2 MGD (2,218 gpm) As of 2009, there are 6 operating wells located in the City. Future wells will be located in both the existing East and West Well Fields. There is a possibility that available capacity from the existing Independence Beach well field may be used to supplement the future West Well Field. Approximately 12 wells will be required to meet the total production capacity of 6.2 MGD. This includes two standby wells and assumes an average capacity of 500 gpm for all future wells. Future wells will be added as necessary by increased demand. Phasing of anticipated improvements is shown on Table 10. The estimated number of future wells could be reduced or increased if the estimated ultimate population of City of Medina Project No: Water Supply and Distribution Plan Page 20
25 11,481 (10,746 from Medina Hamel Area System, and 1,122 from Corcoran) changes or if aquifer yields (per well) are less than expected. Future water use patterns and conservation measures also will affect the number of wells required. EXISTING EAST WELL FIELD The Existing East Well Field serves the existing Pressure Zone. At ultimate development, the total required firm capacity is 2,082 gpm (3.0 MGD). Required Firm Capacity 2,082 gpm Present Firm Capacity 1,800 gpm * Additional Capacity Required 282 gpm Additional Wells Required 1** * Existing capacity of Wells 2, 3, 4, 5, 6 and 7. ** Assumes future wells are 500 gpm. A total of 7 wells (1 standby) are required to provide a firm capacity of 3.0 MGD to the East Water Treatment Facility. Following the drilling of Well 6 in the Jordan aquifer, Bonestroo conducted an aquifer pumping test. Based on the data collected during the aquifer pumping test, a model was developed to estimate pumping drawdown and interference between the future Jordan aquifer wells. The modeling predicted that three more Jordan aquifer wells are likely able to be accommodated in the east well field, with expected capacities of gpm each. This modeling assumes that aquifer conditions observed at Well 6 are present in other areas of the east well field where potential well sites have been identified. FUTURE WEST WELL FIELD The future West Well Field will serve the future High Pressure Zone and a small portion of the existing Low Pressure Zone. At ultimate development, the total required firm capacity is 2,222 gpm (3.2 MGD). Required Firm Capacity 2,222 gpm Present Firm Capacity 0 gpm Additional Capacity Required 2,222 gpm Additional Wells Required 6 * * Assumes future wells are 500 gpm. A total of 6 wells (1 standby) are required to provide 3.2 MGD to the future Water Treatment Facility. Proposed well sites in the West Well Field are shown on the maps in Appendix F. While it is expected that the FIG aquifer is present at this location and is capable of supplying wells with a range of gpm, a program of test drilling and test pumping will ultimately be needed to verify aquifer performance and yield at the proposed well field site. It may be feasible to utilize the existing Independence Beach wells for some of the West Well Field supply (and pipe them to the future water treatment plant site), however for the purposes of this report it is assumed that new wells would be drilled. City of Medina Project No: Water Supply and Distribution Plan Page 21
26 WELLHEAD PROTECTION Water supply protection is an essential part of the Medina water plan. The City will be required to complete a wellhead protection plan in the near future. Entrance into the wellhead protection program is managed by the Minnesota Department of Health (MDH). Wellhead protection is divided into two phases. The first phase is the construction of the computer model that estimates the capture zones for the City s wells over a given time span (usually 10 years). The second phase is the development of a management plan to protect the aquifer by managing potential sources of contamination that fall within this capture zone. Due to the relatively small size of the currently served population by the City of Medina (under 3,300 people), the MDH will provide Medina with their Phase 1 Wellhead Protection Plan. Currently, the MDH is in the process of developing this plan for Medina. Upon receipt and approval of this plan, the City will then be required to develop their own Phase 2 Wellhead Protection Plan. The schedule for completion of this plan will be determined by the MDH following the completion of the Phase 1 plan. RESOURCE SUSTAINABILITY Sustainability of the ground-water resources is also an integral part of this water supply planning. Sustainability of the ground-water resources was evaluated on the basis of existing data from the City s wells and modeled predictions for select future wells. Sustainability should be viewed from two different perspectives, short term sustainability of peak pumping rates, and long term sustainability of average pumping rates. In order to be considered truly sustainable, pumping of wells should not result in a continual lowering of aquifer levels that exceeds the ability of the aquifer to be recharged through vertical infiltration of precipitation and/or horizontal flow of water already within the aquifer. Additionally, sustainable pumping should not result in excessive well drawdown or interference that compromises the performance of other wells in the vicinity, whether those wells be other City wells or privately-owned wells. The City s existing wells currently in operation (Wells 2, 3, 4, 5, and 6) were designed to pump at a rate where short-term periods of heavy demand did not result in excessive drawdown to the aquifer. Historical pumping data has also demonstrated that current usage of these wells, if routinely monitored, can result in sustainable yields that do not appear to exceed aquifer recharge rates. Following the drilling of Jordan aquifer Well 6, a pumping test was conducted at this well to measure well performance, well drawdown, and well interference. Results of the pumping test were used to properly size the pump to produce a well with a sustainable yield of approximately 400 gpm. At this rate, it is thought that long-term pumping at this site will likely not exceed the aquifer s ability to supply this yield. Additionally, simple numerical modeling of the Jordan aquifer in this vicinity demonstrated that three more wells are thought to be able to produce a sustainable yield of gpm each. This assumes that the aquifer conditions observed at Well 6 are seen at other proposed well sites in the east well field. In order to confirm this, it will be necessary to carry out additional pumping tests on these future wells to select a pump yield that is best suited for each well. Collecting this data from each well site is the only means by which to ensure true sustainability, while optimizing well field performance and efficiency. City of Medina Project No: Water Supply and Distribution Plan Page 22
27 For the proposed west well field, it is thought that the FIG aquifer will offer the most viable source of water supply to future wells. However, in order to get a reliable estimate of aquifer yield and sustainability, a program of test drilling and test pumping at the proposed well sites will be required. A test drilling program can also reveal whether other aquifer units (such as unconsolidated drift deposits) are also present in the area. Other viable aquifers, if present, may be used to supplement FIG aquifer wells, especially if actual yields in the FIG are lower than expected. At present, it is thought that FIG aquifer yields may range between gpm. Test pumping will be required to select an appropriate pumping rate for future wells and will also be vital in designing proper spacing distances between future wells to reduce well interference as much as possible. As each new well is added to the City s water supply system, total predicted yield and sustainability of the well fields should be re-visited and, if necessary, revised to reflect current known conditions. Since aquifer yield typically varies over geographical areas, revisiting this study with the latest pumping data will result in the City having the best tool possible to make future well siting decisions. Another key component of achieving sustainability is the long-term collection of data at the City s wells. Data collected should correlate pumping discharges and groundwater levels over time. By analyzing this data to look for downward trends in water levels, the City can proactively determine if existing pumping rates are exceeding the ability of the aquifer to recharge itself. If this is determined to be the case, having this data will allow the City to identify a potential problem before it reaches a critical level that may call for reductions (or stoppages) of discharges at certain wells. TREATMENT The ultimate water system has been designed with two supply sources: the existing Water Treatment Facility and the future West Water Treatment Facility. The quantity supplied from each plant depends on the following factors: well field capacity, existing treatment capacity at plants, allocation of demands, and strengths of the distribution system. Tables 7 and 8 show the recommended treatment and pumping capacities for both plants. EXISTING WATER TREATMENT FACILITY The Treatment Facility was constructed in The current 2.0 MGD plant removes iron, manganese, radium, and gross alpha. The plant size is based on the maximum day design, assuming that 100% of the water is treated before being pumped into the distribution system. This plant is expandable to 3.0 MGD. This treatment plant is designed to treat 100% of the ultimate capacity of the existing East Well Field. Water from Well 5 can bypass the treatment process and be mixed with the treated water in the clearwell. It is anticipated that this slightly reduced quality water will be sufficiently diluted so as not to cause any problems related to iron and manganese content. The water from this plant is pumped into the distribution system by the high service pumps. The high service pumps are sized to provide 100% of the Maximum Day Demand, with the largest pump out of service. City of Medina Project No: Water Supply and Distribution Plan Page 23
28 The Existing Treatment Plant has the following characteristics: TABLE 7: EXISTING WATER TREATMENT FACILITY Item Ultimate Required Existing Additional Required Treatment Capacity 3.0 MGD 2.0 MGD (1) 1.0 MGD High Service Pump Capacity Intermediate/Low Zone 3.0 MGD (1) 2.0 MGD 1.0 MGD (1) Total Firm Capacity with largest pump out of service. FUTURE WEST WATER TREATMENT FACILITY An additional water treatment facility will be required in the High Pressure Zone to serve future water demands. This future West Treatment Facility will need an ultimate capacity of 3.2 MGD and will supply the entire future High Pressure Zone and a small portion of the existing Low Pressure Zone. TABLE 8: FUTURE WEST WATER TREATMENT FACILITY Item Ultimate Required Existing Additional Required Treatment Capacity 3.2 MGD MGD High Service Pump Capacity Intermediate/Low Zone 3.2 MGD (1) MGD (1) Total Firm Capacity with largest pump out of service. STORAGE GENERAL The existing and proposed storage sites for the Medina water distribution system are shown on the Trunk Water Distribution Map in Appendix G, and described in Table 9 below. Two additional elevated water storage tanks are required for the ultimate system. One elevated storage tank could be constructed in the western portion of the existing Low Pressure Zone. The second elevated storage tank could be constructed in the future High Pressure Zone to provide adequate storage and pressure to northwestern Medina and southwestern Corcoran. City of Medina Project No: Water Supply and Distribution Plan Page 24
29 TABLE 9: ULTIMATE STORAGE FACILITIES Reservoir Reservoir Type Service Area Effective Storage (1) (MG) Existing Storage Existing Elevated Low 0.4 Proposed Storage South Central Elevated Low 0.75 Total Low Zone 1.15 Proposed Storage West Elevated High 0.75 Total High Zone 0.75 Total 1.90 Existing Treatment Facility Serves Low Pressure Zone 0.2 Proposed West Treatment Serves High Pressure Zone 0.2 Facility Total Clearwell 0.4 (1) Effective storage is considered to be water available for use at an adequate residual pressure (not lower than 40 feet below the system high water level). DISTRIBUTION SYSTEM GENERAL The proposed ultimate distribution system for Medina is presented on the Trunk Water Distribution Map in Appendix F. The distribution system incorporates two sources of supply: the Existing and the Future West water treatment plants. A strong network of trunk water mains extend from the water treatment plants to the storage reservoirs and are looped throughout the system in order to provide reliable service. Because the City's topography ranges considerably, the ultimate system includes two pressure zones. These pressure zones generally maintain a static pressure range (when towers are full) of psi (pounds per square inch). The high water level (in elevation above mean sea level) for the two pressure zones are as follows: Low Pressure Zone: 1,165 High Pressure Zone: 1,195 The future Pressure Reducing Valves (PRVs) between the high and low zones will be set to maintain a Hydraulic Grade Line (HGL) of around 1,135 ft. so that they do not open under normal pressure fluctuations. They should only open in an emergency. HYDRAULIC ANALYSIS Hydraulic analysis of the distribution system was performed by a computer program as described previously. The program computed flows and residual pressures which were then analyzed to locate problem areas. Water main sizes, storage tank characteristics, and pump controls were then revised and the program run again until the problem was corrected. The time simulation computer analysis was used to design and analyze the performance of the ultimate water system during the maximum day. The types of alternatives that were tried during the several computer runs can be grouped into three categories: City of Medina Project No: Water Supply and Distribution Plan Page 25
30 1. Changes in size and location of the projected elevated tanks. 2. Changes in diameter of the proposed water mains. 3. Addition of new water mains. In looking at the different alternatives, the selected best possible option was a trade-off among the following parameters: 1. Tank Operation: Including minimum level, ending level and total operation time for each tank. Tank operation for the ultimate system is illustrated in Appendix B. 2. High Pressure Nodes: Identifying high pressure nodes during low demand (tank-filling) periods. 3. Low Pressure Nodes: Identifying low pressure nodes during high demand periods. 4. High Headloss Lines: Finding lines with unusually high head loss per thousand feet that need to be replaced, paralleled, or redesigned. 5. Fire Flows: Making sure that all nodes of the distribution system are able to get sufficient fire flows, while maintaining a minimum 20 psi residual pressure. For the ultimate system, shown in the Trunk Water Distribution Map in Appendix F, the lowest pressures never go below 41 psi (immediately after peak hour demand) and the highest pressures never go above 91 psi during tank-filling conditions. Headlosses never go above 6.88 ft/1000 ft. Tanks have acceptable minimum levels, good ending levels, and proper operating times. Most areas are able to meet or exceed the following ISO fire flow recommendations while maintaining sufficient residual pressures. These results are discussed in more detail in the following sections. Low Pressure Nodes Several areas in the City have low pressures simply because they are at a higher ground elevation. Areas that will have low static pressures (less than 50 psi when towers are full) are outlined below. For a graphical representation of these areas, see the Static Water Pressure map in Appendix B. High Pressure Nodes Several areas in the City have high pressure due to being at a low elevation. Areas with high static pressures (greater than 80 psi) include the following. These areas may require individual home pressure reducing values. Refer to the Static Water Pressure Map for a graphical representation of the area in Appendix G. High Pressure Zone - Ground elevation lower than 1,010 Low Pressure Zone - Ground elevation lower than 980 High Headloss Lines The future 12 inch pipe discharging from the future West Treatment Facility has high (7ft/1000ft) headloss during peak demand periods. However, residual pressures are adequate throughout the maximum day. Therefore, no action is required in this area for normal demands. Fire Flows The Insurance Services Office (ISO) recommended fire flows are shown in Table 4. Most areas are able to meet or exceed the recommended fire flows while maintaining 20 psi residual pressure. Fire flow results for the ultimate system are illustrated in Appendix B. WATER SYSTEM PHASING Medina's ultimate served projected population is 11,481 (which includes 1,122 people in southwestern Corcoran). Based on the projected population growth and water demands as shown in Table 3, additions to the supply and storage facilities were estimated and are presented in Table 10. These additions will keep City of Medina Project No: Water Supply and Distribution Plan Page 26
31 pace with the increasing needs of the service area and at the same time maintain a desirable balance between storage and supply for economy and reliability. If growth rates deviate from the rates outlined in this report or if a major water consumer is added to the system, the phasing schedule should be revised in accordance with the latest available data. Note that due to the long construction period for supply and storage facilities, wells, and reservoir construction must begin one to two years before they are actually required. Acquisition of sites should be done much sooner. The data presented in Table 10 is based on the assumption that new wells will provide an average capacity of 500 gpm and that two complete standby wells will be provided. Trunk water mains should be added as development occurs. Each year the City prepares a Capital Improvement Plan which estimates the amount of trunk water main that will be required each year. As the City of Medina moves toward completion of its trunk water supply and distribution system, it becomes more important to critically evaluate the triggers for additions to the system. The effects of water conservation, reduced or increased development densities, large water using customers, and street reconstruction projects are some examples of factors that may change the timing of the facilities recommended in this report. City of Medina Project No: Water Supply and Distribution Plan Page 27
32 TABLE 10: SUPPLY-TREATMENT-STORAGE PHASING Population Served Maximum Day Demand Supply (MGD) (1) Treatment (MG) Storage (MG) Year Ending Medina (MGD) (gpm) Required (2) Existing Required (3) Existing Required (4) Existing , Well 6 (existing) Improvements (5) (placed in service) , , Well 7 (existing) , , , , MG Elevated Storage , , MGD WTP Expansion , , , , Well 8 * , , MGD West WTP , , Well 9 * , , Well 10 * + Well 11( Backup), 0.75 MG Elev Storage & Booster Station , , Well 12 * , , Well 13 * Ultimate 11, , Well 14 * (1) Existing supply consists of Wells 2, 3, 4, 5, 6 and 7. Firm capacity is 2.5 MGD with Well 7 out of service. (2) Required supply equals 100% of Maximum Day Demand. (3) Required treatment equals 100% of Maximum Day Demand. (4) Required storage equals 30% of Maximum Day Demand. (5) Improvements are for water supply, treatment, and storage and do not include the distribution system. * Assuming all future wells are 500 gpm. City of Medina Project No: Water Supply and Distribution Plan Page 28
33 CITY OF MEDINA WATER SUPPLY AND DISTRIBUTION PLAN Economic Analysis COST ESTIMATES One of the basic objectives of this report was to determine the cost of completing Medina's water supply and distribution system for use in determining trunk water charges and developing a Capital Improvement Plan. The cost estimates presented in this report were based on September 2007 construction costs and can be related to the value of the ENR Index for Construction costs of 8,050 (September 2007). Future changes in this index (found at are expected to fairly accurately describe cost changes in the proposed facilities. During interim periods, between full evaluation of projected costs, capital recovery procedures can be related to this index. A summary of the estimated total costs of future water supply, storage, and trunk distribution facilities is presented in Table 11. Cost estimates for capital improvements include 35% for contingencies and administrative, legal, and engineering costs as shown in Table 11. Appendix D shows a more detailed cost estimate. TABLE 11: ULTIMATE WATER SYSTEM COST SUMMARY Distribution $7,100,000 Supply $7,000,000 Storage $6,950,000 Treatment $8,200,000 Total $29,250,000 CAPITAL IMPROVEMENT PLAN A capital improvement program for the Medina water supply and storage system is presented in Table 12. The table shows the storage or supply facility added, the estimated cost, and the total expenditure for the time period. The capital improvement program has been based on the supply-storage phasing of Table 10, assuming the construction of Jordan wells. Costs for the distribution system improvements have also been included in Table 12. However, trunk and lateral distribution costs are dependent on the development patterns of the City. These costs can be added according to the development plan of the City. A detailed cost estimate is included in Appendix D. City of Medina Project No: Water Supply and Distribution Plan Page 29
34 TABLE 12: WATER SYSTEM CAPITAL IMPROVEMENT PROGRAM Ultimate Year Improvement Estimated Cost Distribution Piping $221,875 Supply $0 Treatment $0 Storage Total $221,875 Distribution Piping $221,875 Supply $0 Treatment $0 Storage $3,100,000 Total $3,321,875 Distribution Piping $1,109,375 Supply (Well 8,9) $2,000,000 Treatment $8,200,000 Storage $0 Total $11,309,375 Distribution Piping $1,109,375 Supply (Wells 10 and 11-Backup) $2,000,000 Treatment $0 Storage $3,100,000 Booster Station $750,000 Total $6,959,375 Distribution Piping $2,218,750 Supply (Well 12, 13) $2,000,000 Treatment $0 Storage $0 Total $4,218,750 Distribution Piping $2,218,750 Supply (Well 14) $1,000,000 Treatment $0 Storage $0 Total $3,218,750 City of Medina Project No: Water Supply and Distribution Plan Page 30
35 EXISTING WATER SYSTEM CHARGES The current policy of the City of Medina is to finance trunk water supply, storage, and distribution costs with connection charges. Medina currently collects a connection charge from the developer at the time the development agreement is implemented and before any infrastructure is constructed. The current charges are shown in Table 13. Residential TABLE 13: CURRENT CONNECTION CHARGES 2007 Hamel System Water Connection $4,690/Unit Independence Beach System Water Connection $3,745/Unit Morningside System Water Connection $3,745/Unit Commercial/Industrial Water Connection $4,690/Unit It is common practice in the Metro Area to establish a policy of paying for the capital improvements with a combination of area charges and connection charges as the City currently does. This method allows the City to assess developable property for a portion of the trunk facilities costs at the time the facilities are constructed. This "area charge" is based on gross benefited area. Connection charges are then assessed at the time of hook-up and are used to finance the remaining capital cost. We recommend that the City revise the existing connection charge according to the cost estimates provided in this report. These charges should be reviewed and adjusted annually, according to the ENR construction cost index. City of Medina Project No: Water Supply and Distribution Plan Page 31
36 CONNECTION CHARGES The Residential Equivalent Unit (REU) is the basis of connection charge with the equivalent unit defined as the demand from one single family residential unit classified as Low Density Residential (LDR). Though very similar to the REUs determined for the sanitary sewer plan, the REUs vary slightly due to various water demand assumptions. The total residential equivalents for Medina are developed from the gross acreage of future development as determined by the Land Use Plan. Table 14 presents the REU calculation for Medina s water system. TABLE 14: ESTIMATED NUMBER OF FUTURE CONNECTIONS Land Use Type Units/Acre Area (Ac.) Total Units Medina Agricultural Rural Residential LDR MDR HDR MU ,034 MU-B Commercial General Business (GB) Industrial (IB) Closed Sanitary Landfill (SL) Public Semi-Public (PSP) Parks and Recreation Parks and Recreation Regional or State Private Recreation (PREC) Open Space (OS) Corcoran MDR Light Industrial Commercial LDR Total Equivalent Units 4,929 * All land uses without a unit/acre value are based on a comparison of flow rates to low density residential; assuming the demands presented in Table 2. City of Medina Project No: Water Supply and Distribution Plan Page 32
37 The connection charge for commercial/industrial properties can be further broken down by water meter size as is the current City practice. However, to fully recover capital costs, the average connection charge should be maintained. The calculation of the average connection charge per Residency Equivalent Unit (REU) is presented below. CONNECTION CHARGE REQUIREMENTS 100% of Distribution, Supply, Treatment, and Storage Cost $29,250,000 Total Connection Charge Costs $29,250,000 Number of REU's 4,929 Connection Charge $5,935 per REU LATERAL BENEFIT/TRUNK OVERSIZE Lateral benefit is the portion of the cost of a trunk water main that would normally be paid for by the developer. It is proposed that any development in Medina should pay for an 8-inch water main to serve low and medium density residential development, and a 12-inch main to serve commercial, industrial, and high density residential development. If any of these mains are designated for oversizing by the Ultimate Trunk Water System Map (see Appendix F), the City would then pay for only the additional cost of the larger pipe. The City s responsibility would then be the project cost minus the collected charges. For the purposes of this report, it is assumed that none of the trunk pipe will be paid for as a lateral benefit. Typical lateral benefit may range from 25% to 30%. City of Medina Project No: Water Supply and Distribution Plan Page 33
38 This Page Left Blank Intentionally
39
40
41 DEPARTMENT OF NATURAL RESOURCES - DIVISION OF WATERS and METROPOLITAN COUNCIL WATER EMERGENCY AND CONSERVATION PLANS These guidelines are divided into four parts. The first three parts, Water Supply System Description and Evaluation, Emergency Response Procedures and Water Conservation Planning apply statewide. Part IV, relates to comprehensive plan requirements that apply only to communities in the Seven-County Twin Cities Metropolitan Area. If you have questions regarding water emergency and conservation plans, please call (651) or (651) or your question to wateruse@dnr.state.mn.us. Metro Communities can also direct questions to the Metropolitan Council at watersupply@metc.state.mn.us or (651) DNR Water Appropriation ; ; Permit Number(s) Name of Water Supplier City of Medina Address Public Works 2052 County Road 24 Hamel, MN Contact Person Steve Scherer Title Public Works Superintendent Phone Number (763) Address Steve.scherer@ci.mn.medina.com PART I. WATER SUPPLY SYSTEM DESCRIPTION AND EVALUATION The first step in any water supply analysis is to assess the current status of demand and supplies. Information in Part I, can be used in the development of Emergency Response Procedures and Conservation Plans. A. ANALYSIS OF WATER DEMAND. Fill in Table 1 for the past 10 years water demand. If your customer categories are different than the ones listed in Table 1, please note the changes below. Medina operates 3 independent municipal water systems: Hamel (northern), Independence Beach (west), and Morningside (south). The rest of the population is served by private wells, Maple Plain or Orono. Table 1 (below) lists the water demand for each water system which is maintained and operated by the City of Medina. 1
42 TABLE 1 (A) Historic Water Demand Hamel Water System Year Total Population Population Served Total Connections Residential Water Sold (MG) C/I/I Water Sold (MG) Other/Irriga tion (MG) * Total Water Sold (MG) Total Water Pumped (MG) Percent Unmetered/ Unaccounted Average Demand (MGD) Maximum Demand (MGD) Residential gallons/ capita/day Total gallons/ capita/day , N/A ,005 1, N/A ,270 NA , , , , , , , MG Million Gallons MGD Million Gallons per Day C/I/I- Commercial, Industrial, Institutional Residential. Water used for normal household purposes, such as drinking, food preparation, bathing, washing clothes and dishes, flushing toilets, and watering lawns and gardens. Institutional. Hospitals, nursing homes, day care centers, and other facilities that use water for essential domestic requirements. This includes public facilities and public metered uses. You may want to maintain separate institutional water use records for emergency planning and allocation purposes. Commercial. Water used by motels, hotels, restaurants, office buildings, commercial facilities, both civilian and military. Industrial. Water used for thermoelectric power (electric utility generation) and other industrial uses such as steel, chemical and allied products, food processing, paper and allied products, mining, and petroleum refining. *Other/Irrigation Commercial Irrigation Meters Wholesale Deliveries. Bulk water sales to other public water suppliers. Unaccounted. Unaccounted for water is the volume of water withdrawn from all sources minus the volume sold. Residential Gallons per Capita per Day = total residential sales in gallons/population served/365 days Total Gallons per Capita per Day = total water withdrawals/population served/365 days NOTE: Non-essential water uses defined by Minnesota Statutes 103G.29, include lawn sprinkling, vehicle washing, golf course and park irrigation and other non-essential uses. Some of the above categories also include non-essential uses of water. 2
43 TABLE 1 (B) Historic Water Demand Independence Beach System * Year Total Population Population Served Total Connections Residential Water Sold (MG) C/I/I Water Sold (MG) Other/Irriga tion (MG) Total Water Sold (MG) Total Water Pumped (MG) Percent Unmetered/ Unaccounted Average Demand (MGD) Maximum Demand (MGD) Residential gallons/ capita/day N/A 0 N/A N/A 13.7 N/A 0.04 NA N/A , N/A 0 N/A N/A 14.6 N/A 0.04 NA N/A N/A 0 N/A N/A 14.9 N/A 0.04 NA N/A N/A 0 N/A N/A 12.0 N/A 0.03 NA N/A N/A 0 N/A N/A 14.6 N/A 0.04 NA N/A N/A 0 N/A N/A 13.4 N/A 0.04 NA N/A MG Million Gallons MGD Million Gallons per Day C/I/I- Commercial, Industrial, Institutional Residential. Water used for normal household purposes, such as drinking, food preparation, bathing, washing clothes and dishes, flushing toilets, and watering lawns and gardens. Total gallons/ capita/day Institutional. Hospitals, nursing homes, day care centers, and other facilities that use water for essential domestic requirements. This includes public facilities and public metered uses. You may want to maintain separate institutional water use records for emergency planning and allocation purposes. Commercial. Water used by motels, hotels, restaurants, office buildings, commercial facilities, both civilian and military. Industrial. Water used for thermoelectric power (electric utility generation) and other industrial uses such as steel, chemical and allied products, food processing, paper and allied products, mining, and petroleum refining. Wholesale Deliveries. Bulk water sales to other public water suppliers. Unaccounted. Unaccounted for water is the volume of water withdrawn from all sources minus the volume sold. Residential Gallons per Capita per Day = total residential sales in gallons/population served/365 days Total Gallons per Capita per Day = total water withdrawals/population served/365 days * Based on available information for the Independence Beach system. NOTE: Non-essential water uses defined by Minnesota Statutes 103G.2, include lawn sprinkling, vehicle washing, golf course and park irrigation and other non-essential uses. Some of the above categories also include non-essential uses of water. 3
44 TABLE 1 (C) Historic Water Demand Morningside System * Year Total Population Population Served Total Connections Residential Water Sold (MG) C/I/I Water Sold (MG) Other/Irriga tion (MG) Total Water Sold (MG) Total Water Pumped (MG) Percent Unmetered/ Unaccounted Average Demand (MGD) Maximum Demand (MGD) Residential gallons/ capita/day Total gallons/ capita/day N/A 0 0 N/A 6.78 N/A 0.02 NA N/A , N/A 0 0 N/A 6.57 N/A 0.02 NA N/A N/A 0 0 N/A 6.63 N/A 0.02 NA N/A N/A 0 0 N/A 6.37 N/A 0.02 NA N/A N/A 0 0 N/A 6.81 N/A 0.02 NA N/A N/A 0 0 N/A 6.12 N/A 0.02 NA N/A * MG Million Gallons MGD Million Gallons per Day C/I/I- Commercial, Industrial, Institutional * 2006 Total Water Sold includes the Keller Addition where the water is provided by the City of Orono water system, but was included in the billing records for Medina. This caused the Total Water Sold value to be higher than the Total Pumped in This was corrected for years after Residential. Water used for normal household purposes, such as drinking, food preparation, bathing, washing clothes and dishes, flushing toilets, and watering lawns and gardens. Institutional. Hospitals, nursing homes, day care centers, and other facilities that use water for essential domestic requirements. This includes public facilities and public metered uses. You may want to maintain separate institutional water use records for emergency planning and allocation purposes. Commercial. Water used by motels, hotels, restaurants, office buildings, commercial facilities, both civilian and military. Industrial. Water used for thermoelectric power (electric utility generation) and other industrial uses such as steel, chemical and allied products, food processing, paper and allied products, mining, and petroleum refining. Wholesale Deliveries. Bulk water sales to other public water suppliers. Unaccounted. Unaccounted for water is the volume of water withdrawn from all sources minus the volume sold. Residential Gallons per Capita per Day = total residential sales in gallons/population served/365 days Total Gallons per Capita per Day = total water withdrawals/population served/365 days * Based on available information for the Morningside system. NOTE: Non-essential water uses defined by Minnesota Statutes 103G.29, include lawn sprinkling, vehicle washing, golf course and park irrigation and other non-essential uses. Some of the above categories also include non-essential uses of water. 4
45 Water Use Trends. Discuss factors that influence trends in water demand (i.e. growth, weather, industry, conservation). If appropriate, include a discussion of other factors that affect daily water use, such as use by non-resident commuter employees or large water consuming industry. The rate of water consumption will vary from year to year, seasonally and during different hours of the day. Several characteristic demand periods are recognized as being critical factors in the design and operation of a water system. The maximum demands upon the water system are encountered during short periods of time. These periods of time are generally hot summer days/evenings when lawn sprinkling is highest. Because the majority of demand on the system is from residential customers, seasonal fluctuations in water demand are influenced primarily by variations in lawn sprinkling due to lack of rainfall. The summer of 2007 was exceptionally dry. This, coupled with new sod irrigation for developments, contributed to the City s highest water use records for all categories (residential, commercial, irrigation). The highest historical maximum day water usage, as well as its highest Total and Residential gpcd also occurred in shows a decrease in the amount of overall water used, closer to 2006 usage. Due to the population increase during this time, the 2008 residential gpcd is actually lower than both 2007 and This trend should continue as the ordinance restricting irrigation connections to the municipal water system is implemented, and conservation is encouraged. TABLE 2 Large Volume Users - List the top 10 largest users. Customer Gallons per year % of total annual use Cudd Sprinkling Meter 1,278, Walter G Anderson 890, QX Inc. 700, Gramercy 600, Cudd Sprinkling Meter 2 600, Medina Recreations 500, Calamus Circle 448, Medina Motor Inn 400, Temroc Metals Inc. 350, Polaris 200, B. TREATMENT AND STORAGE CAPACITY. TABLE 3(A) Water Treatment Water Treatment Plant Capacity 2,000,000 Gallons per day Describe the treatment process used (ie, softening, chlorination, fluoridation, Fe/Mn removal, reverse osmosis, coagulation, sedimentation, filtration, others). Also, describe the annual amount and method of disposal of treatment residuals, if any. The Water Treatment Facility (for the Hamel system) has a design capacity of 2.0 MGD and is expandable to 3.0 MGD. The Treatment Facility utilizes a gravity filtration process to remove iron, manganese, and radium. Chlorine and fluoride are also added. There are three high service pumps, each with a capacity of 1.15 MGD, for a total capacity of 3.45 MGD. The Water Treatment Facility has a clearwell storage volume of 200,000 gallons. 5
46 TABLE 3(B) Storage Capacity - List all storage structures and capacities. Total Storage Capacity Average Day Demand (average of last 5 years) 400,000 Gallons 300,000 Gallons per day Type of Structure Number of Structures Gallons Elevated Storage 1 (Hamel water system) 400,000 Ground Storage 0 0 Other: Treatment Plant Clearwell 1 200,000 WATER SOURCES. List all groundwater, surface water and interconnections that supply water to the system. Add or delete lines to the tables as needed. TABLE 4(A) Total Water Source Capacity for System (excluding emergency connections) Total Capacity of Sources - Hamel 2,600 Gallons per minute Firm Capacity (largest pump out of service) 1,800 Gallons per minute - Hamel Total Capacity of Sources Independence 650 Gallons per minute Beach Firm Capacity (largest pump out of service) 150 Gallons per minute Independence Beach Total Capacity of Sources- Morningside 265 Gallons per minute Firm Capacity (largest pump out of service) Morningside 90 Gallons per minute TABLE 4(B) Groundwater Sources - Copies of water well records and well maintenance information should be included with the public water supplier s copy of the plan in Attachment 1. If there are more wells than space provided or multiple well fields, please use the List of Wells template (see Resources) and include as Attachment. Well # or name Unique Well Number Year Installed Well & Casing Depth (ft) Well Diameter (in) 6 Capacity (GPM) Geologic Unit Status FIG Active FIG Active Mt Simon Active Drift Active Jordan Constructed - Appropriation permit pending Jordan Constructed - Appropriation permit pending IB Sand & Gravel Active IB Sand & Gravel Active MS Sand & Gravel Active MS Sand & Gravel Active Status: Active use, Emergency, Standby, Seasonal, Peak use, etc. GPM Gallons per Minute
47 Geologic Unit: Name of formation(s), which supplies water to the well TABLE 4(C) Surface Water Sources Intake ID Resource name Capacity (GPM/MGD) N/A N/A N/A GPM Gallons per Minute MGD Million Gallons per Day TABLE 4(D) Wholesale or Retail Interconnections - List interconnections with neighboring suppliers that are used to supply water on a regular basis either wholesale or retail. Water Supply System Capacity (GPM/MGD) Wholesale or retail Maple Plain As needed - to a small portion of SW Retail Medina. Orono As needed - to a small portion of South Medina. Retail GPM Gallons per Minute MGD Million Gallons per Day TABLE 4(E) Emergency Interconnections - List interconnections with neighboring suppliers or private sources that can be used to supply water on an emergency or occasional basis. Suppliers that serve less than 3,300 people can leave this section blank, but must provide this information in Section II C. Water Supply System Capacity (GPM/MGD) Note any limitations on use None GPM Gallons per Minute MGD Million Gallons per Day C. DEMAND PROJECTIONS. TABLE 5 (A) Ten Year Demand Projections Hamel System Year Population Served Average Day Demand (MGD) Maximum Day Demand (MGD) 7 Projected Demand (MGY) , , , , , , , , , , MGD Million Gallons per Day MGY Million Gallons per Year
48 TABLE 5 (B) Ten Year Demand Projections Independence Beach System Year Population Served Average Day Demand (MGD) Maximum Day Demand (MGD) Projected Demand (MGY) MGD Million Gallons per Day MGY Million Gallons per Year TABLE 5 (C) - Ten Year Demand Projections Morningside System Year Population Served Average Day Demand (MGD) Maximum Day Demand (MGD) 8 Projected Demand (MGY) MGD Million Gallons per Day MGY Million Gallons per Year Projection Method. Describe how projections were made, (assumptions for per capita, per household, per acre or other methods used). The projected water demands for the Hamel system are based on land use, assumptions of population density for each land use type, and per capita or per acre water demands. Low Density, Medium Density, and Rural Residential land use types are projected to use 100 gallons per capita on an average day. High Density and Mixed Use are projected to use 90 gallons per capita on an average day. Non-residential land uses are projected to use 1,500 gallons per acre on an average day, except for Public Semi-Public, Parks and Recreation, and Private Recreational, which are projected to use 500, 100 and 100 gallons per acre, respectively. Land use was derived from the City of Medina s Comprehensive Plan. Since served population for the Morningside and the Independence Beach systems are projected to remain the same through 2018, there is no increase in projected water use for these areas.
49 E. RESOURCE SUSTAINABILITY Sustainable water use: use of water to provide for the needs of society, now and in the future, without unacceptable social, economic, or environmental consequences. Monitoring. Records of water levels should be maintained for all production wells and source water reservoirs/basins. Water level readings should be taken monthly for a production well or observation well that is representative of the wells completed in each water source formation. If water levels are not currently measured each year, a monitoring plan that includes a schedule for water level readings must be submitted as Attachment. TABLE 6 Monitoring Wells - List all wells being measured. Unique well number Type of well (production, Frequency of Measurement observation) (daily, monthly etc.) Hamel Well 3 Production Continuously SCADA Hamel Well 4 Production Continuously SCADA Hamel Well 5 Production Continuously SCADA Hamel Well 6 Production Continuously SCADA Hamel Well 7 Production Continuously SCADA IB Well 1 Production Quarterly Sounder IB Well 2 Production Quarterly Sounder MS Well 1 Production Quarterly Sounder MS Well 2 Production Quarterly Sounder 9 Method of Measurement (steel tape, SCADA etc.) Water Level Data. Summarize water level data including seasonal and long-term trends for each ground and/or surface water source. If water levels are not measured and recorded on a routine basis then provide the static water level (SWL) when the well was constructed and a current water level measurement for each production well. Also include all water level data taken during well and pump maintenance. Hamel: Well 2: 100 ft (SWL at startup) Well 3: 158 ft (SWL at startup) Well 4: 322 ft (SWL at startup) Well 5: 106 ft (SWL at startup) Well 6: 109 ft (SWL at startup) Well 7: 119 ft (SWL at startup) Independence Beach 1: 76 ft (SWL at startup) Independence Beach 2: 74 ft (SWL at startup) Morningside1: 145 ft (SWL at startup) Morningside 2: 135 ft (SWL at startup) Attachment 2: Provide monitoring data (graph or table) for as many years as possible.
50 Ground Water Level Monitoring DNR Waters in conjunction with federal and local units of government maintain and measure approximately 750 observation wells around the state. Ground water level data are available online Information is also available by contacting the Ground Water Level Monitoring Manager, DNR Waters, 500 Lafayette Road, St. Paul, MN or call (651) Natural Resource Impacts. Indicate any natural resource features such as calcareous fens, wetlands, trout streams, rivers or surface water basins that are or could be influenced by water withdrawals from municipal production wells. Also indicate if resource protection thresholds have been established and if mitigation measures or management plans have been developed. The aquifers that Medina utilizes appear to not be in direct hydraulic connection with surface water features, such as streams or wetlands. As such, it does not appear that Medina s current or proposed well field(s) with significantly impact sensitive natural resources. As each well is sited and drilled, however, the City will go through the appropriate steps with the DNR to ensure appropriations do not impact any sensitive natural resources. Sustainability. Evaluate the adequacy of the resource to sustain current and projected demands. Describe any modeling conducted to determine impacts of projected demands on the resource. Sustainability of the ground-water resources were evaluated on the basis of existing data from the City s wells and modeled predictions for select future wells. The City s existing wells currently in operation (Well Nos. 2, 3, 4, 5, 6 and 7) were designed to pump at a rate where short-term periods of heavy demand did not result in excessive drawdown to the aquifer. Historical pumping data has also demonstrated that current usage of these wells, if routinely monitored, can result in sustainable yields that do not appear to exceed aquifer recharge rates. Following the drilling of Jordan aquifer Well No. 6, a pumping test was conducted at this well to measure well performance, well drawdown, and well interference. Results of the pumping test were used to properly size the pump to produce a well with a sustainable yield of approximately 400 gpm. At this rate, it is thought that long-term pumping at this site will likely not exceed the aquifer s ability to supply this yield. Additionally, simple numerical modeling of the Jordan aquifer in this vicinity demonstrated that three more wells are thought to be able to produce a sustainable yield of gpm each. This assumes that the aquifer conditions observed at Well No. 6 are seen at other proposed well site in the east well field. In order to confirm this, it will be necessary to carry out additional pumping tests on these future wells to select a pump yield that is best suited for each well. Collecting this data from each well site is the only means by which to ensure true sustainability, while optimizing well field performance and efficiency. For the proposed west well field, it is thought that the FIG aquifer will offer the most viable source of water supply to future wells. However, in order to get a reliable estimate of aquifer yield and sustainability, a program of test drilling and test pumping at the proposed well sites will be required. A test drilling program can also reveal whether other aquifer units (such as unconsolidated drift deposits) are also present in the area. Other viable aquifers, if present, may be used to supplement FIG aquifer wells, especially if actual yields in the FIG are lower than expected. At present, it is thought that FIG aquifer yields may range between gpm. Test pumping will be required to select an appropriate pumping rate for future wells and will also be vital in designing proper spacing distances between future wells to reduce well interference as much as possible. 10
51 Another potential option for future water supply is to utilize the existing wells that supply the Independence Beach area. The two existing wells are currently rated for 600 gpm and 140 gpm respectively and are in the sand and gravel Drift formation. City personnel have indicated that this well formation shows the potential for adequate yield and sustainability based on test pumping. Source Water Protection Plans. The emergency procedures in this plan are intended to comply with the contingency plan provisions required in the Minnesota Department of Health s (MDH) Wellhead Protection (WHP) Plan and Surface Water Protection (SWP) Plan. Date WHP Plan See below Adopted: Date for Next WHP Update: At present Medina is #604 on the Minnesota Department of Health (MDH) Wellhead Protection phasing list. As such, it is likely that the City won t be required to complete their Wellhead Protection Plan within the next five years. If age dating testing of the water from the City s newest wells indicates that the wells are receiving more recently-infiltrated water, however, the MDH might move Medina to a higher vulnerability ranking which would require entry into the wellhead protection program at a sooner date. SWP Plan: In Process Completed Not Applicable 11
52 F. CAPITAL IMPROVEMENT PLAN (CIP) Adequacy of Water Supply System. Are water supply installations, treatment facilities and distribution systems adequate to sustain current and projected demands? Yes No If no, describe any potential capital improvements over the next ten years and state the reasons for the proposed changes (CIP Attachment 3). Distribution - The Hamel distribution system will be expanded as necessary to reach new developments over the next 10 years. Storage - It is expected that Medina (Hamel System) will require a new 0.75 MG elevated storage reservoir within the next 10 years to accommodate new developments and provide adequate fire flows. Treatment Medina (Hamel system) will require a 1 MGD expansion of the current water treatment facility, and a new 3.2 MGD treatment facility to accommodate expected growth. Supply 2 additional wells of about 500 gpm each are proposed during the next 10 years to meet the expected demand on the system. Proposed Water Sources. Does your current CIP include the addition of new wells or intakes? Yes No If yes, list the number of new installations and projected water demands from each for the next ten years. Plans for new production wells must include the geologic source formation, well location, and proposed pumping capacity. Within the next 10 years, 2 additional wells will need to be constructed to support growth. There is currently one existing well field in Medina located east of the treatment plant along Brockton Lane. Future wells in this well field are expected to draw from the Jordan aquifer. There is also a proposed well field in the northwestern portion of Medina near Loretto. Future wells on this site are expected to draw from the FIG aquifer. The exact location of each well is not known at this time, but is expected to remain in one of the aforementioned well fields. Water Source Alternatives. If new water sources are being proposed, describe alternative sources that were considered and any possibilities of joint efforts with neighboring communities for development of supplies. Groundwater sources were the only sources considered for future water supply. There are no surface water sources nearby, and surface water tends to be significantly more expensive to treat. The City is investigating developing sources from surrounding communities such as Corcoran, Loretto and Maple Plain. 12
53 Preventative Maintenance. Long-term preventative programs and measures will help reduce the risk of emergency situations. Identify sections of the system that are prone to failure due to age, materials or other problems. This information should be used to prioritize capital improvements, preventative maintenance, and to determine the types of materials (pipes, valves, couplings, etc.) to have in stock to reduce repair time. Most of the Medina public water system is relatively new. Very little of the existing infrastructure is prone to failure due to age, and other problems are not anticipated. The City replaces and/or upsizes aging water mains periodically as needed. The City experiences 1 or 2 main breaks per year and has the necessary tools for most repairs of water lines and pumphouse equipment. The City also has access to pipe, valves and tools from a local supplier at all hours. Currently, only a small quantity of pipe is in stock. However, as the system ages and repairs become necessary, the City will need to increase the supply of piping as well as valves, couplings, etc. to reduce repair time. 13
54 PART II. EMERGENCY RESPONSE PROCEDURES Water emergencies can occur as a result of vandalism, sabotage, accidental contamination, mechanical problems, power failures, drought, flooding, and other natural disasters. The purpose of emergency planning is to develop emergency response procedures and to identify actions needed to improve emergency preparedness. In the case of a municipality, these procedures should be in support of, and part of, an all-hazard emergency operations plan. If your community already has written procedures dealing with water emergencies we recommend that you use these guidelines to review and update existing procedures and water supply protection measures. Federal Emergency Response Plan Section 1433(b) of the Safe Drinking Water Act as amended by the Public Health Security and Bioterrorism Preparedness and Response Act of 2002 (Public Law , Title IV Drinking Water Security and Safety) requires community water suppliers serving over 3,300 people to prepare an Emergency Response Plan. Community water suppliers that have completed the Federal Emergency Response Plan and submitted the required certification to the U.S. Environmental Protection Agency have satisfied Part II, Sections A, B, and C of these guidelines and need only provide the information below regarding the emergency response plan and source water protection plan and complete Sections D (Allocation and Demand Reduction Procedures), and E (Enforcement). Provide the following information regarding your completed Federal Emergency Response Plan: Emergency Response Plan Contact Person Contact Number Emergency Response Lead N/A Alternate Emergency Response Lead N/A Emergency Response Plan Certification Date N/A Operational Contingency Plan. An operational contingency plan that describes measures to be taken for water supply mainline breaks and other common system failures as well as routine maintenance is recommended for all utilities. Check here if the utility has an operational contingency plan. At a minimum a contact list for contractors and supplies should be included in a water emergency telephone list. Communities that have completed Federal Emergency Response Plans should skip to Section D. The Emergency Telephone list (Attachment 4) has not been included in agency copies for privacy purposes. 14
55 EMERGENCY RESPONSE PROCEDURES A. Emergency Telephone List. A telephone list of emergency contacts must be included as Attachment 4 to the plan (complete template or use your own list). The list should include key utility and community personnel, contacts in adjacent communities, and appropriate local, state and federal emergency contacts. Please be sure to verify and update the contacts on the emergency telephone list on a regular basis (once each year recommended). In the case of a municipality, this information should be contained in a notification and warning standard operating procedure maintained by the warning point for that community. Responsibilities and services for each contact should be defined. B. Current Water Sources and Service Area. Quick access to concise and detailed information on water sources, water treatment, and the distribution system may be needed in an emergency. System operation, water well and maintenance records should be maintained in a central secured location so that the records are accessible for emergency purposes and preventative maintenance. A detailed map of the system showing the treatment plants, water sources, storage facilities, supply lines, interconnections, and other information that would be useful in an emergency should also be readily available. Check here if these records and maps exist and staff can access the documents in the event of an emergency. C. Procedure for Augmenting Water Supplies. List all available sources of water that can be used to augment or replace existing sources in an emergency. In the case of a municipality, this information should be contained in a notification and warning standard operating procedure maintained by the warning point for that community. Copies of cooperative agreements should be maintained with your copy of the plan and included in Attachment. Be sure to include information on any physical or chemical problems that may limit interconnections to other sources of water. Approvals from the MN Department of Health are required for interconnections and reuse of water. TABLE 7 (A) Public Water Supply Systems List interconnections with other public water supply systems that can supply water in an emergency. Water Supply System Capacity (GPM/MGD) Note any limitations on use N/A N/A N/A GPM Gallons per Minute MGD Million Gallons per Day TABLE 7 (B) - Private Water Sources List other sources of water available in an emergency. Name Capacity (GPM/MGD) Note any limitations on use N/A N/A N/A GPM Gallons per Minute MGD Million Gallons per Day 15
56 D. Allocation and Demand Reduction Procedures. The plan must include procedures to address gradual decreases in water supply as well as emergencies and the sudden loss of water due to line breaks, power failures, sabotage, etc. During periods of limited water supplies public water suppliers are required to allocate water based on the priorities established in Minnesota Statutes 103G.261. Water Use Priorities (Minnesota Statutes 103G.261) First Priority. Domestic water supply, excluding industrial and commercial uses of municipal water supply, and use for power production that meets contingency requirements. NOTE: Domestic use is defined (MN Rules , Subp. 9), as use for general household purposes for human needs such as cooking, cleaning, drinking, washing, and waste disposal, and uses for on-farm livestock watering excluding commercial livestock operations which use more than 10,000 gallons per day or one million gallons per year. Second Priority. Water uses involving consumption of less than 10,000 gallons per day. Third Priority. Agricultural irrigation and processing of agricultural products. Fourth Priority. Power production in excess of the use provided for in the contingency plan under first priority. Fifth Priority. Uses, other than agricultural irrigation, processing of agricultural products, and power production. Sixth Priority. Non-essential uses. These uses are defined by Minnesota Statutes 103G.291 as lawn sprinkling, vehicle washing, golf course and park irrigation, and other non-essential uses. List the statutory water use priorities along with any local priorities (hospitals, nursing homes, etc.) in Table 8. Water used for human needs at hospitals, nursing homes and similar types of facilities should be designated as a high priority to be maintained in an emergency. Local allocation priorities will need to address water used for human needs at other types of facilities such as hotels, office buildings, and manufacturing plants. The volume of water and other types of water uses at these facilities must be carefully considered. After reviewing the data, common sense should dictate local allocation priorities to protect domestic requirements over certain types of economic needs. In Table 8, list the priority ranking, average day demand and demand reduction potential for each customer category (modify customer categories if necessary). Table 8 Water Use Priorities Customer Category Allocation Priority Average Day Demand (GPD) Demand Reduction Potential (GPD) Residential 1 278, ,000 C/I/I 2 79, ,000 Irrigation/Other 3 24,700 24,700 Wholesale Non-essential TOTALS 382,600 1,057,700 GPD Gallons per Day Demand Reduction Potential. The demand reduction potential for residential use will typically be the base demand during the winter months when water use for non-essential uses such as lawn watering do not occur. The difference between summer and winter demands typically defines the demand reduction that can be achieved by eliminating non- 16
57 essential uses. In extreme emergency situations lower priority water uses must be restricted or eliminated to protect first priority domestic water requirements. Short-term demand reduction potential should be based on average day demands for customer categories within each priority class. Triggers for Allocation and Demand Reduction Actions. Triggering levels must be defined for implementing emergency responses, including supply augmentation, demand reduction, and water allocation. Examples of triggers include: water demand >100% of storage, water level in well(s) below a certain elevation, treatment capacity reduced 10% etc. Each trigger should have a quantifiable indicator and actions can have multiple stages such as mild, moderate and severe responses. Check each trigger below that is used for implementing emergency responses and for each trigger indicate the actions to be taken at various levels or stages of severity in Table 9. Water Demand Water Main Break Treatment Capacity Loss of Production Storage Capacity Security Breach Groundwater Levels Contamination Surface Water Flows or Levels Other (list in Table 9) Pump, Booster Station or Well Out of Service Governor s Executive Order Critical Water Deficiency (required by statute) Table 9 Demand Reduction Procedures Condition Trigger(s) Actions Stage 1 (Mild) Stage 2 (Moderate) Stage 3 (Severe) Critical Water Deficiency (M.S. 103G.291) Demand > 80% of Treatment Capacity for more than 5 consecutive days Demand > 90% of Treatment Capacity for more than 3 consecutive days OR- loss of Well #4 (800 gpm). Demand > 95 % of Treatment Capacity for more than 2 days, AND failure of one well pump OR Demand > 80 % of well firm capacity for more than 10 consecutive days Executive Order by Governor & as provided in above triggers Notify customers and encourage additional voluntary reductions in non-essential uses. Enact emergency Odd/Even Sprinkling Ban and Time of Day restrictions as noted in City Code. Critical Water Deficiency (see restrictions below) Stage 1: Restrict lawn watering, vehicle washing, golf course and park irrigation and other nonessential uses Stage 2: Suspend lawn watering, vehicle washing, golf course and park irrigation and other nonessential uses Note: The potential for water availability problems during the onset of a drought are almost impossible to predict. Significant increases in demand should be balanced with preventative measures to conserve supplies in the event of prolonged drought conditions. 17
58 Notification Procedures. List methods that will be used to inform customers regarding conservation requests, water use restrictions, and suspensions. Customers should be aware of emergency procedures and responses that they may need to implement. City will notify residents in high water demand areas in person door to door. The local media will also be notified and will announce emergency water restrictions. E. Enforcement. Minnesota Statutes require public water supply authorities to adopt and enforce water conservation restrictions during periods of critical water shortages. Public Water Supply Appropriation During Deficiency. Minnesota Statutes 103G.291, Subdivision 1. Declaration and conservation. (a) If the governor determines and declares by executive order that there is a critical water deficiency, public water supply authorities appropriating water must adopt and enforce water conservation restrictions within their jurisdiction that are consistent with rules adopted by the commissioner. (b) The restrictions must limit lawn sprinkling, vehicle washing, golf course and park irrigation, and other nonessential uses, and have appropriate penalties for failure to comply with the restrictions. An ordinance that has been adopted or a draft ordinance that can be quickly adopted to comply with the critical water deficiency declaration must be included in the plan (include with other ordinances in Attachment 5 for Part III, Item 4). Enforcement responsibilities and penalties for non-compliance should be addressed in the critical water deficiency ordinance. Sample regulations are available at Authority to Implement Water Emergency Responses. Emergency responses could be delayed if city council or utility board actions are required. Standing authority for utility or city managers to implement water restrictions can improve response times for dealing with emergencies. Who has authority to implement water use restrictions in an emergency? Utility Manager City Manager City Council or Utility Board Other (describe): Emergency Preparedness. If city or utility managers do not have standing authority to implement water emergency responses, please indicate any intentions to delegate that authority. Also indicate any other measures that are being considered to reduce delays for implementing emergency responses. 18
59 PART III. WATER CONSERVATION PLAN Water conservation programs are intended to reduce demand for water, improve the efficiency in use and reduce losses and waste of water. Long-term conservation measures that improve overall water use efficiencies can help reduce the need for short-term conservation measures. Water conservation is an important part of water resource management and can also help utility managers satisfy the ever-increasing demands being placed on water resources. Minnesota Statutes 103G.291, requires public water suppliers to implement demand reduction measures before seeking approvals to construct new wells or increases in authorized volumes of water. Minnesota Rules , require water users to employ the best available means and practices to promote the efficient use of water. Conservation programs can be cost effective when compared to the generally higher costs of developing new sources of supply or expanding water and/or wastewater treatment plant capacities. A. Conservation Goals. The following section establishes goals for various measures of water demand. The programs necessary to achieve the goals will be described in the following section. Unaccounted Water (calculate five year averages with data from Table 1) Hamel - Average annual volume unaccounted water for the last 7,450,000 gallons 5 years Hamel - Average percent unaccounted water for the last 5 years 5.6 percent MS - Average annual volume unaccounted water for the last 4 400,000 years MS - Average percent unaccounted water for the last 4 years 4.0 percent IB - Average annual volume unaccounted water for the last 4 3,100,000 years IB - Average percent unaccounted water for the last 4 years 20.5 percent AWWA recommends that unaccounted water not exceed 10%. Describe goals to reduce unaccounted water if the average of the last 5 years exceeds 10%. The meter at the Independence Beach pumphouse was replaced in Preference will be given to Independence Beach consumers in Medina s meter replacement schedule to help reduce unaccounted water in this area. Residential Gallons Per Capita Demand (GPCD) Hamel - Average residential GPCD use for the last 5 years (use data from 127 GPCD Table 1) MS - Average residential GPCD use for the last 4 years (use data from Table 1) 66 GPCD IB - Average residential GPCD use for the last 4 years (use data from Table 1) 63 GPCD In 2002, average residential GPCD use in the Twin Cities Metropolitan Area was 75 GPCD. Describe goals to reduce residential demand if the average for the last 5 years exceeds 75 GPCD. An ordinance was passed in April 2006 (began implementation in 2008) that bans new lawn sprinkling connections drawn from the City water system for newly constructed residential units. Also, irrigation systems that are planning to expand are required to be disconnected from the City water system, when possible (see Attachment 5). This new ordinance will decrease the residential gpcd, which a large part is currently due to lawn irrigation. In addition, to reduce the demand on 19
60 the City water system for irrigation water, Rain Barrels are being sold at City Hall and residents are encouraged to use these for lawn watering (see Attachment 5). Total Per Capita Demand: From Table 1, is the trend in overall per capita demand over the past 10 years increasing or decreasing? If total GPCD is increasing, describe the goals to lower overall per capita demand or explain the reasons for the increase. An increase in Commercial, and other non-residential land uses, as well as irrigation due to new construction, has influenced the overall per capita demand trend over the past years. Over time, the effects of the City water system irrigation connection ban and other education efforts should cause the total per capita demand to level out, and potentially decrease. Peak Demands (calculate average ratio for last five years using data from Table 1) Hamel - Average maximum day to average day ratio 3.14 MS - Average maximum day to average day ratio 2.9 IB - Average maximum day to average day ratio 2.9 If peak demands exceed a ratio of 2.6, describe the goals for lowering peak demands. See proposed measures above to reduce Residential Gallons Per Capita. B. Water Conservation Programs. Describe all short-term conservation measures that are available for use in an emergency and long-term measures to improve water use efficiencies for each of the six conservation program elements listed below. Short-term demand reduction measures must be included in the emergency response procedures and must be in support of, and part of, a community all-hazard emergency operation plan. 1. Metering. The American Water Works Association (AWWA) recommends that every water utility meter all water taken into its system and all water distributed from its system at its customer s point of service. An effective metering program relies upon periodic performance testing, repair, repair and maintenance of all meters. AWWA also recommends that utilities conduct regular water audits to ensure accountability. Complete Table 10 (A) regarding the number and maintenance of customer meters. TABLE 10 (A) Customer Meters (Hamel Water System) Number of Connections Number of Metered Connections Meter testing schedule (years) Average age/meter replacement schedule (years) Residential < 5 yrs / * C/I/I < 5 yrs / * Other/ < 5 yrs / * Sprinkling TOTALS
61 TABLE 10 (B) Customer Meters (Independence Beach Water System) Number of Connections Number of Metered Meter testing schedule (years) Average age/meter replacement schedule (years) Connections Residential < 5 yrs / * TOTALS TABLE 10 (C) Customer Meters (Morningside Water System) Number of Connections Number of Metered Meter testing schedule Average age/meter replacement schedule (years) Connections (years) Residential < 5 yrs / * TOTALS *All meters in Medina were new in the mid 1980 s, and have been installed as developments were built and connected to the system. Medina has begun a meter replacement program in which they plan on replacing meters per year. Unmetered Systems. Provide an estimate of the cost to install meters and the projected water savings from metering water use. Also indicate any plans to install meters. TABLE 10 (D) Water Source Meters Number of Meters Meter testing schedule (years) Average age/meter replacement schedule (years) Water Source yrs / As needed (wells/intakes) Treatment Plant 1 2 yrs / As needed 2. Unaccounted Water. Water audits are intended to identify, quantify, and verify water and revenue losses. The volume of unaccounted-for water should be evaluated each billing cycle. The AWWA recommends a goal of ten percent or less for unaccounted-for water. Water audit procedures are available from the AWWA and MN Rural Water Association. Frequency of water audits: each billing cycle yearly other: Leak detection and survey: every year every years periodic as needed Year last leak detection survey completed: N/A 21
62 Reducing Unaccounted Water. List potential sources and efforts being taken to reduce unaccounted water. If unaccounted water exceeds 10% of total withdrawals, include the timeframe for completing work to reduce unaccounted water to 10% or less. N/A 3. Conservation Water Rates. Plans must include the current rate structure for all customers and provide information on any proposed rate changes. Discuss the basis for current price levels and rates, including cost of service data, and the impact current rates have on conservation. Billing Frequency: Monthly Bimonthly Quarterly Other (describe): Volume included in base rate or service charge: Conservation Rate Structures Increasing block rate: rate per unit increases as water use increases Seasonal rate: higher rates in summer to reduce peak demands Service charge or base fee that does not include a water volume Conservation Neutral Rate Structure Uniform rate: rate per unit is the same regardless of volume Non-conserving Rate Structures Service charge or base fee that includes a large volume of water Declining block rate: rate per unit decreases as water use increases Flat rate: one fee regardless of how much water is used (unmetered) Other (describe): Water Rates Evaluated: every year every years no schedule Date of last rate change: January Declining block (the more water used, the cheaper the rate) and flat (one fee for an unlimited volume of water) rates should be phased out and replaced with conservation rates. Incorporating a seasonal rate structure and the benefits of a monthly billing cycle should also be considered along with the development of an emergency rate structure that could be quickly implemented to encourage conservation in an emergency. 22
63 Current Water Rates. Include a copy of the actual rate structure in Attachment or list current water rates including base/service fees and volume charges below. MM = Medina Morningside, IB = Independence Beach. All rates are monthly. MM & IB Water (residential) (minimum charge) $11.55 per month MM & IB Water (residential) 0-10,000 gallons $2.89 per 1,000 gallons MM & IB Water (residential) 11,000-23,000 gallons $3.21 per 1,000 gallons MM & IB Water (residential) 24,000 and up gallons $3.42 per 1,000 gallons MM & IB Water (commercial) (minimum charge) $11.55 per month MM & IB Water (commercial) Water Usage under 10,000 gallons per month $2.89 per 1,000 gallons MM & IB Water (commercial) water usage over 10,000 gallons per month $3.42 per 1,000 gallons Hamel Water (residential) (minimum charge) $14.99 per month Hamel Water (residential) 0-10,000 gallons $3.75 per 1,000 gallons Hamel Water (residential) 11,000-23,000 gallons $4.36 per 1,000 gallons Hamel Water (residential) 24,000 and up gallons $4.65 per 1,000 gallons Hamel Water (commercial) (minimum charge) $14.99 per month Hamel Water (commercial) Water Usage under 10,000 gallons $3.75 per 1,000 gallons Hamel Water (commercial) water usage over 10,000 gallons per month $4.65 per 1,000 gallons Non-conserving Rate Structures. Provide justification for the rate structure and its impact on reducing demands or indicate intentions including the timeframe for adopting a conservation rate structure. 4. Regulation. Plans should include regulations for short-term reductions in demand and long-term improvements in water efficiencies. Sample regulations are available from DNR Waters. Copies of adopted regulations or proposed restrictions should be included in Attachment 5 of the plan. Indicate any of the items below that are required by local regulations and also indicate if the requirement is applied each year or just in emergencies. Time of Day: as deemed by City Official (reduces evaporation) year around seasonal emergency only Odd/Even: (helps reduce peak demand) year around seasonal emergency only Water waste prohibited (no runoff from irrigation systems) Describe ordinance: Limitations on turf areas for landscaping (reduces high water use turf areas) Describe ordinance: 23
64 Soil preparation (such as 4-6 of organic soil on new turf areas with sandy soil) Describe ordinance: Minimum of 4 inches of black top soil, and 2 inches of humus or compost material in any Lawn and Landscape Irrigation System area see Attachment 5. Tree ratios (plant one tree for every square feet to reduce turf evapotranspiration) Describe ordinance: Prohibit irrigation of medians or areas less than 8 feet wide Describe ordinance: Permit required to fill swimming pool every year emergency only Other (describe): Any property presently served by City water that is requesting to expand its irrigation system shall be required to convert and connect to a storm water pond, if available. Properties, falling under certain guidelines, are prohibited from connecting their irrigation system to the City Water Supply System. See Attachment 5 for a detailed description. Also, effective January 1, 2009, Sewer fees will be based on actual water usage (as compared to winter water usage previously). This measure will encourage consumers to 1). Conserve water to reduce their sewer bill, or 2). Purchase a separate irrigation meter (irrigation will then be subtracted from the sewer bill), which the City can monitor and educate residents on the amount of water used for irrigation (see Attachment 6). State and Federal Regulations (mandated) Rainfall sensors on landscape irrigation systems. Minnesota Statute 103G.298 requires All automatically operated landscape irrigation systems shall have furnished and installed technology that inhibits or interrupts operation of the landscape irrigation system during periods of sufficient moisture. The technology must be adjustable either by the end user or the professional practitioner of landscape irrigation services. Water Efficient Plumbing Fixtures. The 1992 Federal Energy Policy Act established manufacturing standards for water efficient plumbing fixtures, including toilets, urinals, faucets, and aerators. Enforcement. Are ordinances enforced? Yes No If yes, indicate how ordinances are enforced along with any penalties for non-compliance. Violation of ordinance is a misdemeanor as specified by Minnesota Statutes, Section
65 5. Education and Information Programs. Customers should be provided information on how to improve water use efficiencies a minimum of two times per year. Information should be provided at appropriate times to address peak demands. Emergency notices and educational materials on how to reduce water use should be available for quick distribution during an emergency. If any of the methods listed in the table below are used to provide water conservation tips, indicate the number of times that information is provided each year and attach a list of education efforts used for the last three years. Current Education Programs Times/Year Billing inserts or tips printed on the actual bill Consumer Confidence Reports 1 Local news papers Community news letters 6 Direct mailings (water audit/retrofit kits, showerheads, brochures) Information at utility and public buildings Ongoing Public Service Announcements Cable TV Programs Demonstration projects (landscaping or plumbing) K-12 Education programs (Project Wet, Drinking Water Institute) School presentations Events (children s water festivals, environmental fairs) : Medina Celebration Celebration Days Handouts and Brochures are used. Days Community education Water Week promotions Information provided to groups that tour the water treatment Open House plant Website (include address: ) Ongoing Targeted efforts (large volume users, users with large increases) Notices of ordinances (include tips with notices) Emergency conservation notices (recommended) Other: Educational efforts for the last 3 years are listed in the table above, and select examples are provided in Attachment 6 of this plan. Be sure to indicate whether educational efforts are on-going and which efforts were initiated as an emergency or drought management effort. Proposed Education Programs. Describe any additional efforts planned to provide conservation information to customers a minimum of twice per year (required if there are no current efforts). Medina proposes to seasonally (3-4 times per year) include water conservation information with consumer water bills. This is expected to begin in A packet of conservation tips and information can be obtained by contacting DNR Waters or the Minnesota Rural Water Association (MRWA). The American Water Works Association (AWWA) 25
66 or also has excellent materials on water conservation that are available in a number of formats. You can contact the MRWA 800/ , the AWWA bookstore 800/ or DNR Waters 651/ for information regarding educational materials and formats that are available. 6. Retrofitting Programs. Education and incentive programs aimed at replacing inefficient plumbing fixtures and appliances can help reduce per capita water use as well as energy costs. It is recommended that communities develop a long-term plan to retrofit public buildings with water efficient plumbing fixtures and that the benefits of retrofitting be included in public education programs. You may also want to contact local electric or gas suppliers to see if they are interested in developing a showerhead distribution program for customers in your service area. A study by the AWWA Research Foundation (Residential End Uses of Water, 1999) found that the average indoor water use for a non-conserving home is 69.3 gallons per capita per day (gpcd). The average indoor water use in a conserving home is 45.2 gpcd and most of the decrease in water use is related to water efficient plumbing fixtures and appliances that can reduce water, sewer and energy costs. In Minnesota, certain electric and gas providers are required (Minnesota Statute 216B.241) to fund programs that will conserve energy resources and some utilities have distributed water efficient showerheads to customers to help reduce energy demands required to supply hot water. Retrofitting Programs. Describe any education or incentive programs to encourage the retrofitting of inefficient plumbing fixtures (toilets, showerheads, faucets, and aerators) or appliances (washing machines). City Code states that existing irrigation systems are required to retrofit to install a rain sensor device at such time as improvement or extension of the system occurs. See Attachment 5. Plan Approval. Water Emergency and Conservation Plans must be approved by the Department of Natural Resources (DNR) every ten years. Please submit plans for approval to the following address: DNR Waters or Submit electronically to Water Permit Programs Supervisor wateruse@dnr.state.mn.us. 500 Lafayette Road St. Paul, MN Adoption of Plan. All DNR plan approvals are contingent on the formal adoption of the plan by the city council or utility board. Please submit a certificate of adoption (example available) or other action adopting the plan. Metropolitan Area communities are also required to submit these plans to the Metropolitan Council. Please see PART IV. ITEMS FOR METROPOLITAN AREA PUBLIC SUPPLIERS. 26
67 METROPOLITAN COUNCIL PART IV. ITEMS FOR METROPOLITAN AREA PUBLIC SUPPLIERS Minnesota Statute requires water supply plans to be completed for all local units of government in the seven-county Metropolitan Area as part of the local comprehensive planning process. Much of the required information is contained in Parts I-III of these guidelines. However, the following additional information is necessary to make the water supply plans consistent with the Metropolitan Land Use Planning Act upon which local comprehensive plans are based. Communities should use the information collected in the development of their plans to evaluate whether or not their water supplies are being developed consistent with the Council's Water Resources Management Policy Plan. Policies. Provide a statement(s) on the principles that will dictate operation of the water supply utility: for example, "It is the policy of the city to provide good quality water at an affordable rate, while assuring this use does not have a long-term negative resource impact." The policy of the Medina water supply system is to provide safe and high quality drinking water. The system will provide this vital service while assuring the long-term protection of our supply from contamination and excessive depletion. Impact on the Local Comprehensive Plan. Identify the impact that the adoption of this water supply plan has on the rest of the local comprehensive plan, including implications for future growth of the community, economic impact on the community and changes to the comprehensive plan that might result. This Plan was prepared based on the Land Use Plan for the City contained in the Comprehensive Plan. The household and population forecasts are also based on the Land Use Plan. The staging of the Capital Improvement Plan (CIP) is in accordance with the Comprehensive Plan. Future growth of the community will be dependent on the successful progress of the water system improvements included in the CIP. Demand Projections Year Total Community Population Population Served Average Day Demand (MGD) Maximum Day Demand (MGD) Projected Demand (MGY) ,100 2, ,200 7, ,200 9, Ultimate -- 11, Population projections should be consistent with those in the Metropolitan Council s 2030 Regional Development Framework or the Communities 2008 Comprehensive Plan update. If population served differs from total population, explain in detail why the difference (ie, service to other communities, not complete service within community etc.). Population projections are based on the Metropolitan Council projections in the adopted Regional Development Framework. 27
68 Population Served differs from Total Population due to incomplete service within the community, and potential future service to parts of surrounding communities. Many residents maintain private wells, and portions of the City are served by Maple Plain, and separate water systems. PLAN SUBMITTAL AND REVIEW OF THE PLAN The plan will be reviewed by the Council according to the sequence outlined in Minnesota Statutes Prior to submittal to the Council, the plan must be submitted to adjacent governmental units for a 60-day review period. Following submittal, the Council determines if the plan is complete for review within 15 days. If incomplete, the Council will notify the community and request the necessary information. When complete the Council will complete its review within 60 days or a mutually agreed upon extension. The community officially adopts the plan after the Council provides its comments. Plans can be submitted electronically to the Council; however, the review process will not begin until the Council receives a paper copy of the materials. Electronic submissions can be via a CD, 3 ½ floppy disk or to the address below. Metropolitan communities should submit their plans to: Reviews Coordinator Metropolitan Council 390 N. Robert St. St. Paul, MN electronically to: watersupply@metc.state.mn.us 28
69 Attachment 1
70
71 Unique No. County Name Hennepin MINNESOTA DEPARTMENT OF HEALTH WELL AND BORING RECORD Minnesota Statutes Chapter 1031 Update Date 2005/06/22 Entry Date 1991/08/24 Township Name Township Range Dir Section Subsection W 12 BDACAB Well Depth Depth Completed Date Well Completed 601 ft. 601 ft. 1978/06/06 Well Name MEDINA HAMEL 2 Drilling Method Non-specified Rotary Well Owner's Name HAMEL 2 MEDINA MN Contact's Name CITY OF MEDINA CR MEDINA MN GEOLOGICAL MATERIAL COLOR HARDNESS FROM TO SAND YELLO 0 24 Drilling Fluid Use Casing Community Supply (municipal) Casing Diameter Drive Shoe? Well Hydrofractured? From Yes Weight(lbs/ft) 8 in. to 353 ft N ft. to Yes Hole Diameter in. to in. to No ft. ft ft SAND BLUE SWAMP SAND BLUE CLAY-EVEN BLUE CLAY-STONEY-LOOSE BROW Screen N Open Hole From 353 ft. to 601 ft. CLAY BROW Make Type GRAVEL-TIGHT-CLAY DARK SANDY CLAY BROW SOFT SAND-COARSE Static Water Level 100 ft. from Land surface Date 1978/06/06 CLAY CLAY & LOOSE GRAVEL RED BROW PUMPING LEVEL (below land surface) ft. after 54 hrs. pumping 210 g.p.m. CLAY-TIGHT GRAY CLAY & BROWN SAN CLEAN SAND LT. GR BROW Well Head Completion Pitless adapter mfr Model Casing Protection 12 in. above grade At-grade(Environmental Wells and Borings ONLY) MIXED RED CLAY & SAND-LOOSE BROWN CLAY & SAND-TIGH Grouting Information Well grouted? Yes Material From To (ft.) Amount(yds/bags) G No CLAY WHITE SOFT TIGHT CLAY WHITE LOOSE CLAY LOOSE CLAY VERY TIGHT CLAY TIGHT CLAY CLAY WHITE W/ST. PETER? WHITE YELLO PINK ORAN TAN Nearest Known Source of Contamination ft. direction. type Well disinfected upon completion? Yes No Pump Not Installed Date Installed N Mfr name Model HP Volts JORDAN & LOOSE SHALE SHALE-SOME JORDAN WHT/Y SHALE YELLO LOOSE FINE JORDAN-MUSH FINE JORDAN W/HARD LED COARSE JORDAN W/V. HAR WHITE VERY HARD LEDGES
72 CLEAN JORDAN MUDDY JORDAN MUDDY JORDAN W/HARD S MUDDY JORDAN W/HARD S VERY FINE JORDAN GREEN SHALE & COARSE J WHITE WHITE WHITE M.HARD SOFT SOFT SOFT FINEGRAIND SHARP SANDS PNK/Y ST. LAWRENCE FRANCONIA IRONTON-GALESVILLE EAU CLAIRE V.HARD REMARKS, ELEVATION, SOURCE OF DATA, etc. M.G.S. NO Drop Pipe Length Type ft. Capacity g.p.m Any not in use and not sealed well(s) on property? Yes No USGS Quad: Hamel Elevation: 987 Aquifer: CFIG Alt Id: Report Copy Was a variance granted from the MDH for this Well? Yes No Well CONTRACTOR CERTIFICATION Lic. Or Reg. No License Business Name Name of Driller SALONEK, K. HE (Rev. 9/96)
73 Unique No. County Name Hennepin MINNESOTA DEPARTMENT OF HEALTH WELL AND BORING RECORD Minnesota Statutes Chapter 1031 Update Date 2005/06/22 Entry Date 1991/08/24 Township Name Township Range Dir Section Subsection W 12 BCCCBA Well Depth Depth Completed Date Well Completed 825 ft. 590 ft. 1983/06/02 Well Name MEDINA HAMEL 3 Drilling Method Non-specified Rotary Contact's Name CR MEDINA MN Well Owner's Name PINTO RD MEDINA MN CITY OF MEDINA HAMEL 3 Drilling Fluid Well Hydrofractured? Yes From ft. to Use Community Supply (municipal) Casing Drive Shoe? Yes N Hole Diameter No ft. GEOLOGICAL MATERIAL COLOR HARDNESS FROM TO SAND BROW 0 10 Casing Diameter Weight(lbs/ft) 10 in. to 420 ft CLAY TAN/B CLAY GRAY CLAY GRAY GRAVEL & SOME CLAY VARIE Screen N Open Hole From 420 ft. to 825 ft. CLAY GRAY Make Type CLAY BROW CLAY & GRAVEL BROW BOULDER WHITE Static Water Level 158 ft. from Land surface Date 1983/06/15 GRAVEL & SOME CLAY GRAVEL DARK DARK PUMPING LEVEL (below land surface) 208 ft. after 80 hrs. pumping 120 g.p.m. CLAY & GRAVEL CLAY CLAY GRAY GREEN TAN/Y Well Head Completion Pitless adapter mfr Casing Protection At-grade(Environmental Wells and Borings ONLY) Model 12 in. above grade CLAY SHALE & ST. PETER SANDSTONE DOLOMITIC BROW GRN/Y YEL/BL Grouting Information Material Well grouted? Yes From To (ft.) Amount(yds/bags) G Y No SHALE GREEN SANDSTONE DOLOMITC TAN/BL SHALE SANDSTONE DOLOMITIC ST. PETER SANDSTONE ST. PETER SANDSTONE ST. PETER SANDSTONE JORDAN SANDSTONE WHT/G TAN/BL TAN GRN/R GRN/R YEL/TA SOFT SOFT SOFT Nearest Known Source of Contamination ft. direction. type Well disinfected upon completion? Yes No Pump Mfr name Model Not Installed HP Date Installed N Volts JORDAN SANDSTONE GREEN JORDAN SANDSTONE GREEN ST. LAWRENCE SANDSTON RED/G FRANCONIA SANDSTONE FRANCONIA SANDSTONE FRANCONIA SANDSTONE FRANCONIA SANDSTONE GREEN GREEN RED/G PUR/G
74 FRANCONIA SANDSTONE IRONTON-GALEVILLE IRONTON-GALEVILLE IRONTON-GALEVILLE IRONTON-GALEVILLE EAU CLAIRE EAU CLAIRE GREEN TAN R EAU CLAIRE GREEN TAN R MT. SIMON MT. SIMON MT. SIMON MT. SIMON MT. SIMON FOND DU LAC SHALE FOND DU LAC SHALE TAN/G RED/T GRAY GRAY GRN/T PUR/R VARIE VARIE RED/P GRN/T GRAY GRAY RED RED REMARKS, ELEVATION, SOURCE OF DATA, etc. M.G.S. NO.2061 GAMMA LOGGED Drop Pipe Length Type ft. Capacity g.p.m Any not in use and not sealed well(s) on property? Yes No USGS Quad: Hamel Elevation: 1010 Aquifer: CFIG Alt Id: Report Copy Was a variance granted from the MDH for this Well? Yes No Well CONTRACTOR CERTIFICATION Lic. Or Reg. No License Business Name Name of Driller RENNER, R. HE (Rev. 9/96)
75 Unique No. County Name Hennepin MINNESOTA DEPARTMENT OF HEALTH WELL AND BORING RECORD Minnesota Statutes Chapter 1031 Update Date 2005/06/22 Entry Date 1994/02/09 Township Name Township Range Dir Section Subsection W 12 BCCCBC Well Depth Depth Completed Date Well Completed 770 ft. 770 ft. 1993/11/10 Well Name MEDINA HAMEL 4 Drilling Method Cable Tool Well Owner's Name 3600 PINTO DR MEDINA MN Contact's Name CR MEDINA MN MEDINA 4 CITY OF MEDINA Drilling Fluid Water Use Casing Community Supply (municipal) Drive Shoe? Well Hydrofractured? From Yes N ft. to Yes Hole Diameter 0 in. to 282 No ft. ft GEOLOGICAL MATERIAL COLOR HARDNESS FROM TO Casing Diameter Weight(lbs/ft) 0 in. to 363 ft SAND BROW SOFT in. to 228 ft in. to 770 ft CLAY CLAY & STONES PACK SAND/GRAVEL GRAY GRAY BROW SOFT SOFT MEDIUM in. to 284 ft in. to 373 ft in. to 683 ft 62.6 SAND/GRAVEL BROW MEDIUM Screen N Open Hole From 683 ft. to 770 ft. CLAY/STONES GRAY MEDIUM Make Type SHALE GREEN HARD SHALE/SANDSTONE BROW HARD SANDSTONE BLU/G MEDIUM Static Water Level 322 ft. from Land surface Date 1993/11/09 SANDSTONE TAN/B MEDIUM PUMPING LEVEL (below land surface) SANDSTONE TAN/B MEDIUM ft. after 9 hrs. pumping 1080 g.p.m. SANDSTONE SANDSTONE TAN TAN V.HARD SFT-MED Well Head Completion Pitless adapter mfr BAKER Casing Protection Model 12 in. above grade SANDSTONE TAN/BL SOFT At-grade(Environmental Wells and Borings ONLY) SHALE/SANDSTONE BLUE Grouting Information Well grouted? Yes No ST. LAWRENCE PINK HARD Material From To (ft.) Amount(yds/bags) G Y ST. LAWRENCE PINK HARD G Y FRANCONIA SANDSTONE B VARIE MED-HRD G Y FRANCONIA SANDSTONE B VARIE MED-HRD STICKY SHALE GREEN HARD Nearest Known Source of Contamination STICKY SHALE EAU CLAIRE GREEN HARD BRN/P HARD ft. direction. type Well disinfected upon completion? Yes No MT. SIMON SANDSTONE MT. SIMON SANDSTONE MT. SIMON SANDSTONE TAN/R TAN/R TAN HARD HARD MEDIUM Pump Mfr name Model Not Installed Date Installed AMERICAN 12L55-7 HP 125 Y Volts 460 MT. SIMON SHALE MT. SIMON SANDSTONE MT. SIMON SANDSTONE BLUE TAN TAN MEDIUM SOFT V.SOFT REMARKS, ELEVATION, SOURCE OF DATA, etc. Drop Pipe Length 400 ft. Capacity 600 g.p.m GAMMA LOGGED M.G.S. NO Type S Any not in use and not sealed well(s) on property? Yes No
76 USGS Quad: Hamel Elevation: 1010 Aquifer: CMTS Alt Id: Report Copy Was a variance granted from the MDH for this Well? Yes No Well CONTRACTOR CERTIFICATION Lic. Or Reg. No License Business Name Name of Driller SIGAFOOS, R. HE (Rev. 9/96)
77 Unique No. County Name Hennepin MINNESOTA DEPARTMENT OF HEALTH WELL AND BORING RECORD Minnesota Statutes Chapter 1031 Update Date 2005/02/22 Entry Date / / 0 Township Name Township Range Dir Section Subsection W 12 DDDDCA Well Depth Depth Completed Date Well Completed 242 ft. 240 ft. 2004/08/12 Well Name MEDINA 5 Drilling Method Non-specified Rotary Well Owner's Name 3300 BROCKTON LA MEDINA MN Contact's Name CR MEDINA MN MEDINA 5 CITY OF MEDIN Drilling Fluid Well Hydrofractured? Yes No Bentonite From ft. to ft. Use Community Supply (municipal) Casing Drive Shoe? Yes N Hole Diameter in. to 242 ft GEOLOGICAL MATERIAL COLOR HARDNESS FROM TO TOP SOIL BLACK 0 2 Casing Diameter Weight(lbs/ft) 12 in. to 195 ft SANDY CLAY BROW 2 14 SANDY CLAY GRAY SANDY CLAY GRAY HARD SAND GRAY Screen Y Open Hole From ft. to ft. SANDY CLAY GRAY HARD Make JOHNSON Type L SAND VARIE Diameter Slot Length Set Fitting SANDY CLAY GRAY ft. to 240 ft SAND & GRAVEL W/CLAY GRAY Static Water Level 106 ft. from Land surface Date 2004/08/12 ROCK WHITE PUMPING LEVEL (below land surface) GRAVEL & CLAY GRAY ft. after hrs. pumping g.p.m. SAND & GRAVEL BROW Well Head Completion SAND SAND W/CLAY BROW BROW Pitless adapter mfr Model Casing Protection Y 12 in. above grade At-grade(Environmental Wells and Borings ONLY) SANDY CLAY GRAY Grouting Information Well grouted? Yes No Material From To (ft.) Amount(yds/bags) G Y Nearest Known Source of Contamination 0 ft. direction. type Well disinfected upon completion? Yes No Pump Not Installed Date Installed N Mfr name Model HP Volts Drop Pipe Length ft. Capacity g.p.m Type Any not in use and not sealed well(s) on property? Yes No USGS Quad: Hamel Elevation: 1011 Aquifer: QBUA Alt Id: Report Copy Was a variance granted from the MDH for this Well? Yes No Well CONTRACTOR CERTIFICATION Lic. Or Reg. No License Business Name Name of Driller RANUM, C. HE (Rev. 9/96)
78 Unique No. County Name Hennepin MINNESOTA DEPARTMENT OF HEALTH WELL AND BORING RECORD Minnesota Statutes Chapter 1031 Update Date 2007/07/31 Entry Date 2007/01/05 Township Name Township Range Dir Section Subsection W 12 DDDCCA Well Depth Depth Completed Date Well Completed 385 ft. 378 ft. 2007/05/01 Well Name MEDINA 6 Drilling Method Non-specified Rotary Well Owner's Name MEDINA 6 Drilling Fluid Well Hydrofractured? Yes No 3200 BROCKTON LA MEDINA MN Bentonite From ft. to ft. Contact's Name CR CITY OF MEDINA Use Community Supply (municipal) Casing Drive Shoe? Yes N Hole Diameter MEDINA MN in. to 19 ft GEOLOGICAL MATERIAL COLOR HARDNESS FROM TO Casing Diameter Weight(lbs/ft) in. to 312 ft TOP SOIL BLACK SOFT in. to 19 ft in. to 385 ft CLAY BRN/G SOFT in. to 311 ft SILTY CLAY AND GRAVELS BROW MEDIUM SILTY SANDY CLAY & GRAV RED MEDIUM SANDSTONE & SHALE (WHI MEDIUM Screen Y Open Hole From ft. to ft. SANDSTONE & SHALE (WHI MEDIUM Make JOHNSON Type L SANDSTONE & SHALE (WHI MEDIUM Diameter Slot Length Set Fitting SANDSTONE TAN MEDIUM ft. to 378 ft SANDSTONE & SHALE (AQ MEDIUM Static Water Level 109 ft. from Land surface Date 2007/03/20 PUMPING LEVEL (below land surface) 158 ft. after 4 hrs. pumping 400 g.p.m. Well Head Completion Pitless adapter mfr Model Casing Protection 12 in. above grade At-grade(Environmental Wells and Borings ONLY) Grouting Information Material Well grouted? Yes From To (ft.) Amount(yds/bags) G Y No Nearest Known Source of Contamination 60 ft. direction. S type Well disinfected upon completion? Yes No BOW Pump Not Installed Date Installed N Mfr name Model HP Volts REMARKS, ELEVATION, SOURCE OF DATA, etc. Drop Pipe Length ft. Capacity g.p.m GAMMA LOGGED M.G.S. NO LOGGED BY JIM TRAEN. Type Any not in use and not sealed well(s) on property? Yes No USGS Quad: Hamel Elevation: 1009 Aquifer: CJDN Alt Id: 4648 Report Copy Was a variance granted from the MDH for this Well? Yes No Well CONTRACTOR CERTIFICATION Lic. Or Reg. No License Business Name Name of Driller HOLMEN, G. HE (Rev. 9/96)
79 Unique No. County Name Hennepin MINNESOTA DEPARTMENT OF HEALTH WELL AND BORING RECORD Minnesota Statutes Chapter 1031 Update Date 2008/10/29 Entry Date 2008/03/10 Township Name Township Range Dir Section Subsection W 12 DDBBCA Well Depth Depth Completed Date Well Completed 410 ft. 405 ft. 2008/06/09 Well Name MEDINA 7 Drilling Method Non-specified Rotary Well Owner's Name MEDINA MILL ST MEDINA MN Contact's Name CITY OF MEDINA CR MEDINA MN GEOLOGICAL MATERIAL COLOR HARDNESS FROM TO CLAY/SILT BLACK SOFT 0 10 Drilling Fluid Bentonite Use Casing Community Supply (municipal) Casing Diameter Drive Shoe? Well Hydrofractured? From Yes Weight(lbs/ft) 14 in. to 312 ft N ft. to Yes Hole Diameter in. to in. to No ft. ft ft CLAY GRAY SOFT CLAY/GRAVEL GRAY MEDIUM CLAY GRAY MEDIUM CLAY-ROCKS RED MEDIUM Screen Y Open Hole From ft. to ft. SILTY-ROCKS SANDY CLAY RED RED SOFT MEDIUM Make JOHNSON Type Diameter Slot Length Set Fitting L SANDY CLAY RED MEDIUM ft. to 405 ft SHALE RED MEDIUM Static Water Level 119 ft. from Land surface Date 2008/06/09 SHALE & SANDSTONE SHALE & SANDSTONE WHITE WHITE MEDIUM MEDIUM PUMPING LEVEL (below land surface) 187 ft. after 24 hrs. pumping 800 g.p.m. SANDSTONE SHALEY SANDSTONE SANDSTONE WHITE RED/W WHITE HARD HARD MEDIUM Well Head Completion Pitless adapter mfr Casing Protection Y Model At-grade(Environmental Wells and Borings ONLY) 12 in. above grade SHALE LIMESTONE AQUA HARD Grouting Information Well grouted? Yes Material From To (ft.) Amount(yds/bags) G Y No Nearest Known Source of Contamination 125 ft. direction NW type Well disinfected upon completion? Yes No BOW REMARKS, ELEVATION, SOURCE OF DATA, etc. GAMMA LOGGED M.G.S. NO LOGGED BY JIM TRAEN. 155 BAGS OF EA CLAIR # 40 USED TO GRAVEL PACK 8" SCREEN. USGS Quad: Hamel Elevation 1016 Aquifer: CJDN Alt Id: 4795 Report Copy Pump Not Installed Date Installed N Mfr name Model HP Volts Drop Pipe Length ft. Capacity Type Any not in use and not sealed well(s) on property? Yes Was a variance granted from the MDH for this Well? Yes g.p.m No No Well CONTRACTOR CERTIFICATION Lic. Or Reg. No License Business Name Name of Driller HOLMEN, G. HE (Rev. 9/96)
80 Unique No. County Name Hennepin MINNESOTA DEPARTMENT OF HEALTH WELL AND BORING RECORD Minnesota Statutes Chapter 1031 Update Date 2005/06/22 Entry Date 1991/08/24 Township Name Township Range Dir Section Subsection W 18 BABCCA Well Depth Depth Completed Date Well Completed 240 ft. 240 ft. 1975/08/27 Well Name MEDINA INDEPENDENCE 1 Drilling Method Non-specified Rotary Contact's Name CITY OF MEDINA Drilling Fluid Well Hydrofractured? Yes No CR MEDINA MN From ft. to ft. Well Owner's Name INDEPENDENCE 1 Use Community Supply (municipal) Casing Drive Shoe? Yes N Hole Diameter MEDINA MN GEOLOGICAL MATERIAL COLOR HARDNESS FROM TO SANDY CLAY YELLO 0 14 Casing Diameter Weight(lbs/ft) 12 in. to 200 ft SANDY CLAY BLUE SAND WITH LITTLE CLAY BROW SAND AND GRAVEL BROW CLAY-SANDY RED Screen Y Open Hole From ft. to ft. SAND GRAY Make JOHNSON Type L CLAY-VERY SANDY GRAY Diameter Slot Length Set Fitting SAND-FINE ft. to 240 ft COARSE SAND AND GRAVE Static Water Level 76 ft. from Land surface Date 1988/04/03 PUMPING LEVEL (below land surface) 73.2 ft. after 8 hrs. pumping 650 g.p.m. Well Head Completion Pitless adapter mfr Model Casing Protection 12 in. above grade At-grade(Environmental Wells and Borings ONLY) Grouting Information Material Well grouted? Yes From To (ft.) Amount(yds/bags) G Y No Nearest Known Source of Contamination ft. direction. type Well disinfected upon completion? Yes No Pump Not Installed Date Installed Y Mfr name TAIT AC Model 10ECL HP 40 Volts 460 Drop Pipe Length 120 ft. Capacity 625 g.p.m Type T Any not in use and not sealed well(s) on property? Yes No USGS Quad: Rockford Elevation: 1001 Aquifer: QBAA Alt Id: Report Copy Was a variance granted from the MDH for this Well? Yes No Well CONTRACTOR CERTIFICATION Lic. Or Reg. No License Business Name Name of Driller NASS. R. HE (Rev. 9/96)
81 Unique No. County Name Hennepin MINNESOTA DEPARTMENT OF HEALTH WELL AND BORING RECORD Minnesota Statutes Chapter 1031 Update Date 2005/06/22 Entry Date 1992/06/29 Township Name Township Range Dir Section Subsection W 18 BABCCB Well Depth Depth Completed Date Well Completed 250 ft. 241 ft. 1988/08/25 Well Name MEDINA INDEPENDENCE 2 Drilling Method Non-specified Rotary Contact's Name CITY OF MEDINA Drilling Fluid Well Hydrofractured? Yes No CR MEDINA MN Bentonite From ft. to ft. Well Owner's Name MEDINA 2 Use Community Supply (municipal) Casing Drive Shoe? Yes N Hole Diameter MEDINA MN in. to 203 ft GEOLOGICAL MATERIAL COLOR HARDNESS FROM TO Casing Diameter Weight(lbs/ft) 0 in. to 243 ft CLAY YELLO in. to 201 ft CLAY BLUE BOULDER WHT/B CLAY BLUE CLAY-SAND BLU/B Screen Y Open Hole From ft. to ft. SHALE-GRAVEL RED/B Make JOHNSON Type L SAND-GRAVEL BROW Diameter Slot Length Set Fitting FINE SAND BROW ft. to 241 ft SHALE-GRAVEL RED/B Static Water Level 74 ft. from Land surface Date 1988/08/25 GRAVEL-SAND RED/B PUMPING LEVEL (below land surface) FINE SAND BROW ft. after hrs. pumping 600 g.p.m. GRAVEL-SAND VERY COAR RED/B Well Head Completion Pitless adapter mfr Model Casing Protection 12 in. above grade At-grade(Environmental Wells and Borings ONLY) Grouting Information Material Well grouted? Yes From To (ft.) Amount(yds/bags) G Y No Nearest Known Source of Contamination ft. direction. type Well disinfected upon completion? Yes No Pump Not Installed Date Installed Y Mfr name GRUNDFOS Model 135S100-6 HP 10 Volts 460 REMARKS, ELEVATION, SOURCE OF DATA, etc. LOCATED BY MDH FOR THE TRITIUM STUDY. LOST CIRCULATION AT 145 FT. MEDINA NO.2. Drop Pipe Length 126 ft. Capacity 100 Type S Any not in use and not sealed well(s) on property? Yes Was a variance granted from the MDH for this Well? Yes g.p.m No No USGS Quad: Rockford Elevation: 1001 Aquifer: QBAA Alt Id: Report Copy Well CONTRACTOR CERTIFICATION Lic. Or Reg. No. License Business Name Name of Driller RIVERS, M
82 Unique No. County Name Hennepin MINNESOTA DEPARTMENT OF HEALTH WELL AND BORING RECORD Minnesota Statutes Chapter 1031 Update Date 2005/06/22 Entry Date 1991/08/24 Township Name Township Range Dir Section Subsection W 28 ADBBBC Well Depth Depth Completed Date Well Completed 205 ft. 205 ft. 1961/06/21 Well Name MEDINA MORNINGSIDE 1 Drilling Method Well Owner's Name MORNINGSIDE 1 Drilling Fluid Well Hydrofractured? Yes No MEDINA MN From ft. to ft. Contact's Name CR CITY OF MEDINA Use Community Supply (municipal) Casing Drive Shoe? Yes N Hole Diameter MEDINA MN GEOLOGICAL MATERIAL COLOR HARDNESS FROM TO Casing Diameter Weight(lbs/ft) CLAY AND GRAVEL GRAY in. to 187 ft MUDDY SAND AND GRAVEL WATER SAND & GRAVEL CLAY Screen Y Open Hole From ft. to ft. Make Type R Diameter Slot Length Set Fitting ft. to 205 ft Static Water Level 145 ft. from Land surface Date 1961/06/21 PUMPING LEVEL (below land surface) ft. after hrs. pumping 350 g.p.m. Well Head Completion Pitless adapter mfr Model Casing Protection 12 in. above grade At-grade(Environmental Wells and Borings ONLY) Grouting Information Well grouted? Yes No Nearest Known Source of Contamination ft. direction. type Well disinfected upon completion? Yes No Pump Mfr name Not Installed Date Installed Model HP Volts Drop Pipe Length ft. Capacity g.p.m Type Any not in use and not sealed well(s) on property? Yes No USGS Quad: Hamel Elevation: 1053 Aquifer: QBAA Alt Id: OLD Report Copy Was a variance granted from the MDH for this Well? Yes No Well CONTRACTOR CERTIFICATION Lic. Or Reg. No. MDH License Business Name Name of Driller HE (Rev. 9/96)
83 Unique No. County Name Hennepin MINNESOTA DEPARTMENT OF HEALTH WELL AND BORING RECORD Minnesota Statutes Chapter 1031 Update Date 2005/06/22 Entry Date 1991/08/24 Township Name Township Range Dir Section Subsection W 28 ADBBBC Well Depth Depth Completed Date Well Completed 204 ft. 203 ft. 1960/09/12 Well Name MEDINA MORNINGSIDE 2 Drilling Method Cable Tool Contact's Name CITY OF MEDINA Drilling Fluid Well Hydrofractured? Yes No CR MEDINA MN Well Owner's Name MORINGSIDE 2 From Use Community Supply (municipal) Casing Drive Shoe? Yes N ft. to Hole Diameter ft. MEDINA MN GEOLOGICAL MATERIAL COLOR HARDNESS FROM TO Casing Diameter Weight(lbs/ft) CLAY & GRAVEL GRAY in. to 185 ft MUDDY SAND & GRAVEL WATER SAND & GRAVEL CLAY Screen Y Open Hole From ft. to ft. Make JOHNSON Type R Diameter Slot Length Set Fitting ft. to ft. to ft. to 203 ft ft ft Static Water Level 135 ft. from Land surface Date 1960/09/09 PUMPING LEVEL (below land surface) 151 ft. after hrs. pumping 415 g.p.m. Well Head Completion Pitless adapter mfr Model Casing Protection 12 in. above grade At-grade(Environmental Wells and Borings ONLY) Grouting Information Well grouted? Yes No Nearest Known Source of Contamination ft. direction. type Well disinfected upon completion? Yes No Pump Not Installed Date Installed N Mfr name Model HP Volts Drop Pipe Length ft. Capacity g.p.m Type Any not in use and not sealed well(s) on property? Yes No USGS Quad: Hamel Elevation: 1053 Aquifer: QBAA Alt Id: Report Copy Was a variance granted from the MDH for this Well? Yes No Well CONTRACTOR CERTIFICATION Lic. Or Reg. No License Business Name
84
85
86
87
88
89
90
91
92
93
94
95
96
97
98
99
100
101
102
103
104
105
106
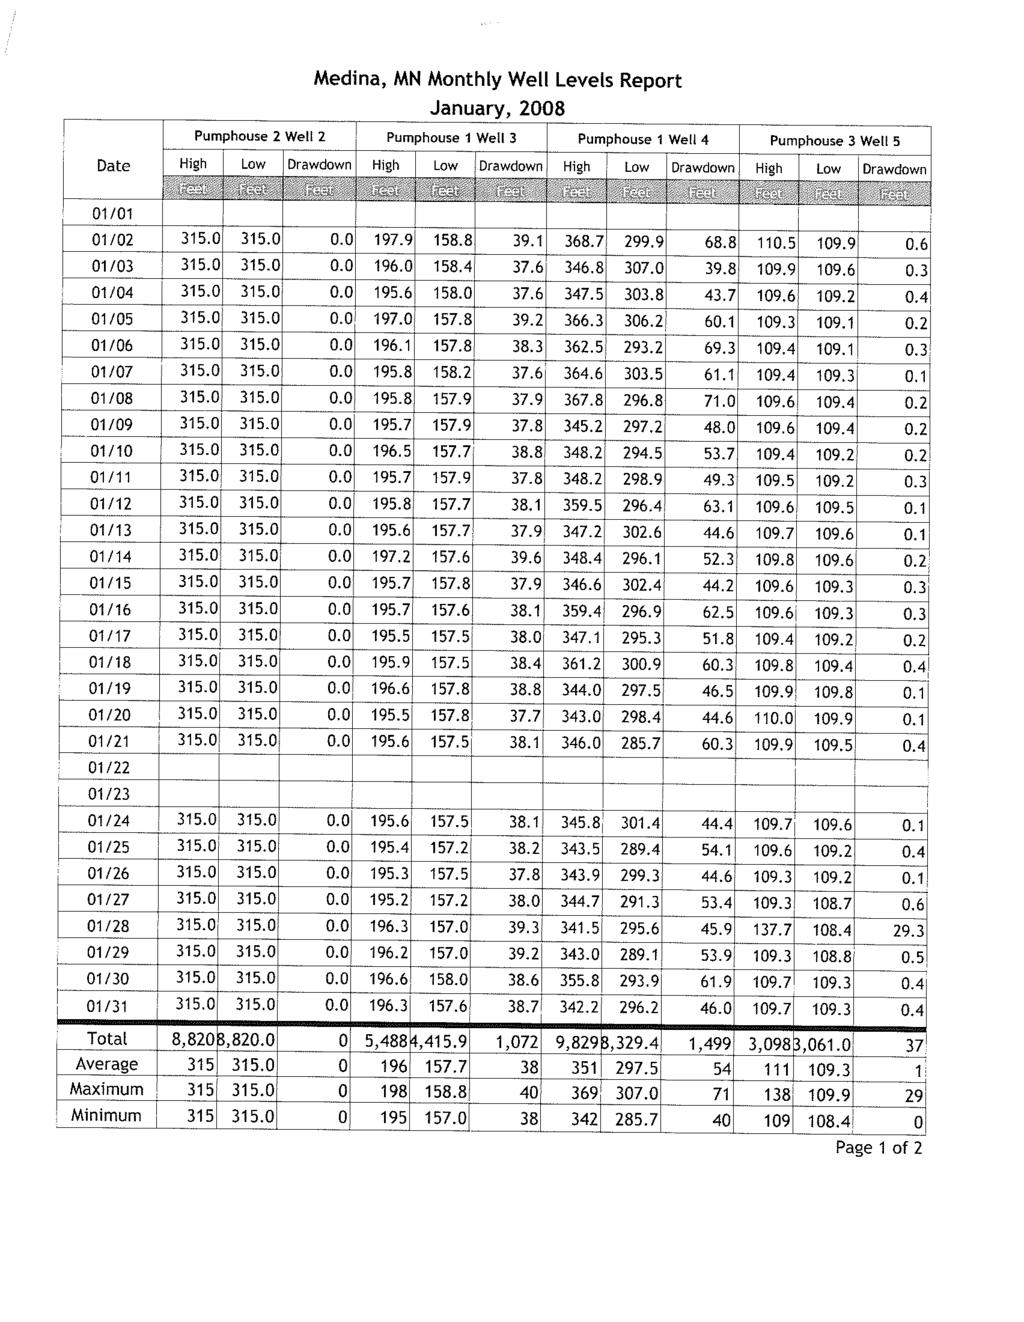
107
108

109
110
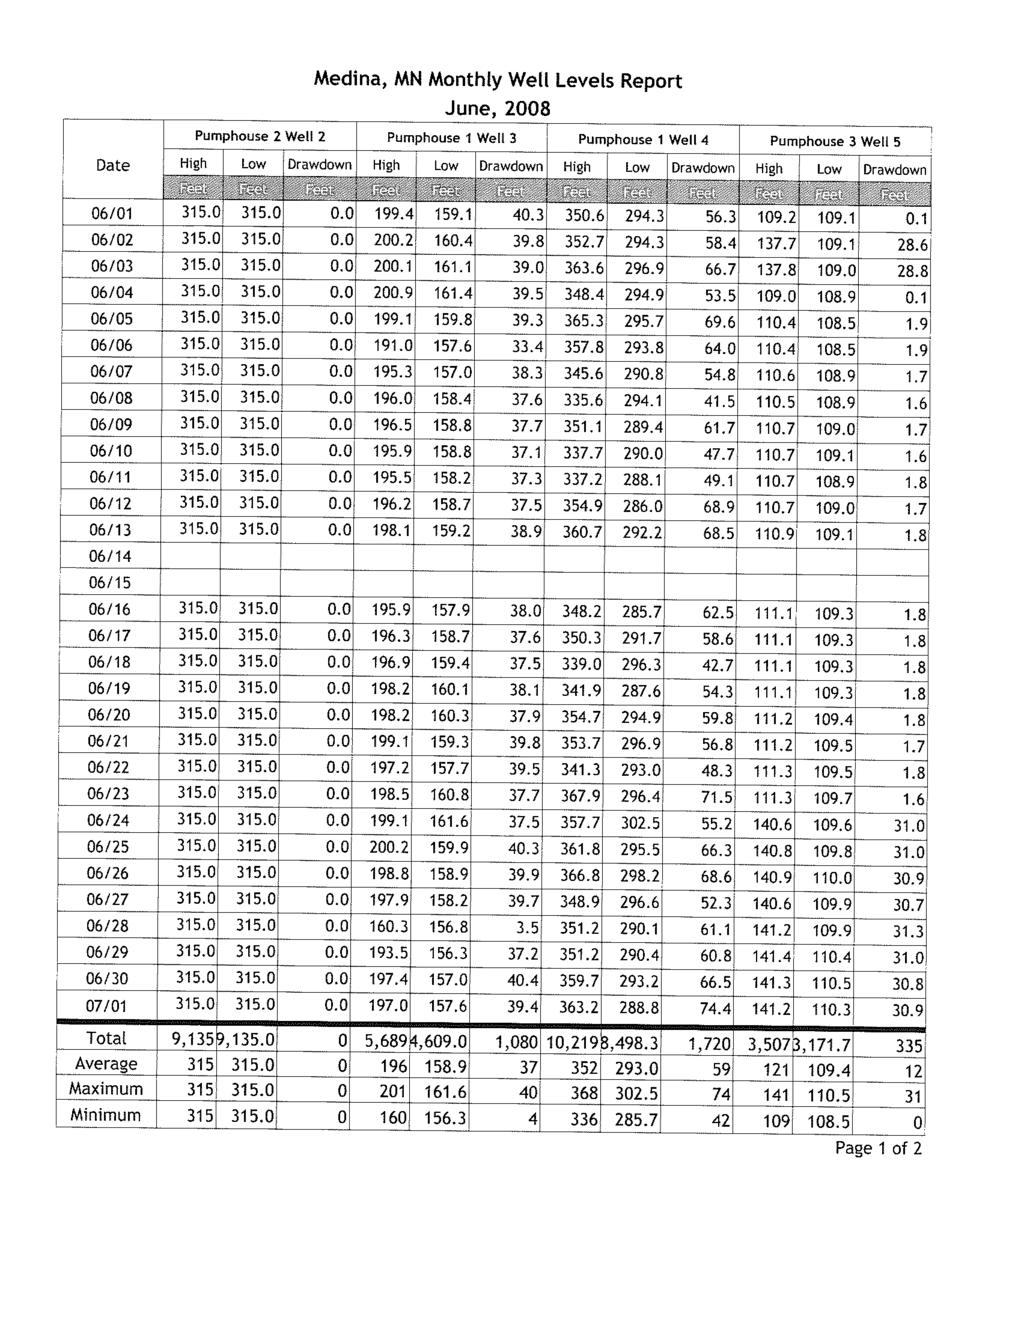
111
112

113
114

115
116

117
118

119
120
121
122
123
124
125
126
127
128
129
130
131
132
133
134
135
136
137
138
139
140
141
142
143
144
145
146
147
148
149 Medina City Code 710. Water Supply System that water shall not be turned off from any service pipe between the hours of 9 o'clock a.m. on Saturday and 9 o'clock a.m. on the following Monday: Subd. 1. The owner or occupant of the premises served, or any person working on any pipes or equipment thereon which are connected with the City water supply system has intentionally violated any of the requirements of the Ordinances of the City relative to the water supply system or connections therewith. Subd. 2. The owner or occupant of the premises served threatens to violate, or cause to be violated, any of the provisions of this Code. Subd. 3. Any charge for water, service, meter, meter parts or any other financial obligations imposed on the present or former owner or occupant of the premises served, by the provisions of this Code, is unpaid. Subd. 4. Fraud or misrepresentation by the owner or occupant in connection with an application for service. Section Deficiency of Water and Shutting Off Water. The City shall not be liable for any deficiency or failure in the supply of water to consumers, whether occasioned by shutting the water off for the purpose of making repairs or connections, or from any other cause whatever. In case of fire, or alarm of fire, the City may shut off water to insure a supply for fire fighting; or in making repairs or constructing new works, the City may shut off the water at any time and keep it shut off so long as it shall deem necessary. Section Water Use Restriction. In the event of a water supply shortage, use of City water for lawn and garden sprinkling, irrigation, car washing or other non-potable uses shall be limited to an odd-even date schedule corresponding to property address, effective upon the public works superintendent or city administrator s designee determination that the shortage of water supply threatens the City Water Supply System. The public works superintendent or city administrator s designee may further limit the days and hours of the City Water Supply System usage at any time as deemed necessary. Special permit allowance will be considered for those property owners with new seed, sod, or other needs if the public works superintendent determines sufficient water for such permits is available. Section Declared Water Shortage. If the City Council determines that an emergency is present, the council may declare a water shortage and determine that the users of the public water mains shall be prohibited from using the water from the City Water Supply System for certain functions on their property. All persons within the City of Medina shall comply with regulations imposed as a result of a water shortage. Violation of this section shall be a misdemeanor. Section Access to Buildings. Authorized employee of the City shall have free access at reasonable hours of the day to all parts of every building and premises connected with the City water supply system for reading of meters and inspections. Section Adjustments in Water Charges. The City Council shall be authorized to make 710. Water Supply System Page 7 of 11
150 Medina City Code 710. Water Supply System adjustments in water charges where in its opinion the amount billed was erroneous due to meter deficiency or other mistake Lawn and Landscape Irrigation Systems. Subd. 1. Purpose. The purpose of this ordinance is to promote efficient use of water for lawn and landscape irrigation without placing an undue burden on the city s public water supply. Subd. 2. Definitions. For the purpose of this ordinance, the following terms shall have the meanings given to them. (a) Backflow Preventer means any mechanical or air gap system designed and installed in order to prevent the accidental backflow of water from one source to another. (b) Irrigation Well means any well that is installed to provide water to supplement the water level of a Storm Water Pond. (c) Lawn and Landscape Irrigation System means all pumps, lines or sprinkler heads which are located on private property or within the adjacent public right-of-way that have a sole purpose of irrigating landscape plants and/or grass. (d) City Water Supply System means any well, water tower, reservoir, treatment plant, water main, service line or any private water line connected to any of the above, that the city owns, operates, maintains or supplies. (e) Seed Bed Preparation means the preparation of top soil for any seeding, sodding or planting. A seed bed shall consist of a minimum of four inches of black top soil and two inches of humus or compost material. (f) Storm Water Pond means any basin that is designed and constructed to treat storm water runoff from a particular area. Subd. 3. Connection of Lawn and Landscape Irrigation Systems to the City Water Supply System. (a) Customers installing an automatic or underground irrigation system are required to install a rain sensor device. Existing irrigation systems are required to retrofit to install a rain sensor device at such time as improvement or extension of the system occurs. (b) If located within the City Water Supply System service area, the following are prohibited from connecting a Lawn and Landscape Irrigation System to the City Water Supply System: i) A property located within a subdivision that consists of five or more lots and is zoned residential; 710. Water Supply System Page 8 of 11
151 Medina City Code 710. Water Supply System ii) A multiple dwelling unit structure of any size, except for properties in locations that are served by the city s storm sewer system; and iii) A property that is over two acres in size and is zoned commercial, industrial business park, mixed-use, or public/semi-public. (c) This ordinance shall be applicable only to the above-described properties that install Lawn and Landscape Irrigation Systems after the enactment of this ordinance. No property shall be allowed to expand its Lawn and Landscape Irrigation System from the City Water Supply System if a Storm Water Pond is available or established to accommodate lawn and landscape irrigation service. Any property presently served by the City Water Supply System that is requesting to expand its Lawn and Landscaping Irrigation System shall be required to convert and connect its Lawn and Landscaping Irrigation System to a Storm Water Pond if such Storm Water Pond is available or must be established to accommodate lawn and irrigation service. Subd. 4. Connection to Storm Water Ponds. Lawn and landscape irrigation water may be obtained for any property from a Storm Water Pond under the following conditions: (a) All pumps associated with the Lawn and Landscape Irrigation System shall be free standing or located in a structure that is not connected to the City Water Supply System; and (b) No water pumped for the Lawn and Landscape Irrigation System shall enter and no pump or irrigation system shall in any way be connected to any structure that is connected to the City Water Supply System. Subd. 5. Connection of Irrigation Wells to Storm Water Ponds. (a) An Irrigation Well may be installed on any property in order to provide additional water to a Storm Water Pond under the following conditions: i) Any Irrigation Well shall be constructed according to Minnesota Statutes Chapter 103I and Minnesota Rules Chapter 4725 ( Minnesota Well Code ); ii) A Water Use (Appropriation) Permit must be obtained from the Minnesota Department of Natural Resources; iii) Each Irrigation Well shall be equipped with either a water flow meter or a time meter; iv) The property owner shall provide the city with a well log and yearly pumping records on the last day of each calendar year for each Irrigation Well located on the property; v) The Irrigation Well shall be protected from accidental back flow of water with 710. Water Supply System Page 9 of 11
152 Medina City Code 710. Water Supply System a Backflow Preventor that shall be approved in advance by the city; and vi) Irrigation Well water shall not be used to provide flow to any water feature where the water then flows to waste. (b) Irrigation Well water shall be used only for irrigation of landscaping. It shall not be used for any other use, including uses that provide flow to water features where the water then flows to waste. Subd. 6. Construction of a Lawn and Landscape Irrigation System. The location of lines and sprinkler heads for a Lawn and Landscape Irrigation System may be located within the city right-of-way or easement subject to the following conditions and prior approval of the city: (a) The owner of the Lawn and Landscape Irrigation System is responsible for any maintenance or repair of the Lawn and Landscape Irrigation System; (b) The owner of the Lawn and Landscape Irrigation System signs a written agreement with the city in which the owner agrees to assume all liability and responsibility for damages to the Lawn and Landscape Irrigation System that is caused by city activities, including, but not limited to, snow removal; (c) All Lawn and Landscape Irrigation System lines located with city right-of-way or easement shall have a location wire installed in accordance with the city s specifications; (d) All Lawn and Landscape Irrigation System lines that cross city streets or shall be encased in an oversized carrier pipe; and (e) The owner of the Lawn and Landscape Irrigation System shall provide the city with an as-built plan of the irrigation system. Subd. 7. Operation of Lawn and Landscape Irrigation Systems. The operation of a Lawn and Landscape Irrigation Systems shall be subject to the following restrictions: (a) Turf and Landscape Irrigation Best Management Practices as set forth by the Irrigation Association for landscape irrigation systems shall be followed by the owner at all times; (b) Prior to any seed, sod or landscaping being placed within the Lawn and Landscape Irrigation System area, there shall be proper Seed Bed Preparation by the owner; and (c) Under weather conditions where the city places an irrigation ban or other restrictions on the use of any lawn or landscape irrigation that is connected to the City Water Supply System, the city may also prohibit or place limitations on the pumping 710. Water Supply System Page 10 of 11
153 Medina City Code 710. Water Supply System from any Irrigation Well that is being utilized by a Lawn or Landscape Irrigation System. Subd. 8. Penalties. Any person convicted of violating this ordinance shall be guilty of a misdemeanor and shall be subject to a maximum fine or maximum period of imprisonment, or both, as specified by Minnesota Statutes, Section Amendment History of this Section April 4, 2006 (Ord. 402). Added Subsection regarding Lawn and Landscape Irrigation Systems. July 17, 2007 (Ord. 426). Added Subsection regarding water use restrictions and amending regarding Lawn and Landscape Irrigation Systems. Changing text to reflect consistent language for the Water Supply System Water Supply System Page 11 of 11
154
155 Education Efforts for last three years: Attachment 6: Webpage contains links to Irrigation Meter Program see following pages. Webpages also contains link to information on Rain Barrels available for sale from City see following pages. Information at Utility and Public Buildings Ongoing Community Newsletters Ongoing Consumer Confidence Reports 2008 Example is included in following pages
156
.")

157 Watering Tips to Save Time AND Money Automatic Sprinklers should have a timer and a moisture sensor. Have your sprinkler heads adjusted so they don t water the sidewalks, driveway, or house. Water ONLY when the grass shows signs of stress (grass that is under stress doesn t spring back after you step on it). Watering a little heavier and less frequently will allow roots to grow deeper, and they will be more resilient and less susceptible to dryer conditions. If you do not have an automatic sprinkler, you can purchase a hose timer for very little money. $AVE MONEY Irrigation Meter Program PLEASE don t sprinkle in the rain. If you can, always water early in the morning; there is less wind, less evaporation, and better soaking down to grow deeper roots. Delay starting to water in the spring to allow the roots to grow deeper. Keep the grass longer; it will hold water better and dry out slower County Road #24 Medina, MN Phone: Fax: Linda.lane@ci.medina.mn.us See inside for details


158 Effective January 1 st 2009, City sanitary sewer fees will be based on actual water usage. Why the change? The City previously charged sanitary sewer for the entire year based on the water usage in the winter. This potentially undercharges many properties (homes that are vacant in the winter, new homes that are not occupied until the summer), putting the additional burden of system costs on the remaining residents. How much could my sewer bill be affected? Each household has control of its water use; therefore, you also have control of your water/sewer bill. If you use a lot of city water for lawn irrigation, the result may be a much higher sewer bill than during the winter, unless you purchase an irrigation meter as described by this brochure. How can I avoid higher bills? 1) Reduce the amount of water used for irrigation. 2) Purchase a dedicated irrigation meter to separately measure the water used for outdoor watering and irrigation. (Sanitary sewer will not be charged for this water, and will only be charged for the water you use in your home.) Irrigation Meter Process (and costs): 1. Resident hires a licensed plumber to install the irrigation meter (Approximately $500.00) NOTE: Plumber costs will vary depending on what changes will be needed to add the irrigation meter. 2. Plumber pulls a permit ($50.50) at City Hall and purchases the irrigation meter, radio transmitter and attachments ($420.00) NOTE: You may pay for the meter over a 12-month period with your utility bill, interest free. Print the form on the City website or get a copy from City Hall to send with your plumber when they come in to pick up the permit. 3. Plumber installs the irrigation meter. 4. Plumber or Resident schedules an appointment for the City to enter the residence to inspect the water meter and to install the meter transmitter (48 hour notice is required). Automatic Pay Plan $20.00 Promotion The City is offering a $20 one-time discount on your next utility bill if you sign up for the City s Automation Pay Plan. This one-time discount will also be retroactive to those customers already signed up. Medina utility customers are provided with this opportunity to have utility payments directly deducted from your checking or savings accounts. Anyone interested in the Automatic Pay option must sign up by completing and returning to the City an authorization form (found on the City s website at and submit a voided check for checking accounts or a deposit ticket for savings accounts. Once signed up, bill payments will be taken from the designated bank account and automatically sent to the City. The payment will be deducted from the bank account on the date that the payment is due. Because bills vary, the City will send automatic payment statements to the utility customer showing the exact amount due to be deducted from the designated bank account. The utility customer bank statements will also show the amount of deduction. Benefits of the $20 one-time discount program to the City include time and labor savings in distributing and processing the bills manually.


159 Reserve Your Rain Barrel Today $75 per Barrel for Residents $85 per Barrel for Non-Residents (limited quantity available) A rain barrel is a great way to conserve water and reduce your summer water bill. Rain barrels should be placed under your gutter and are used to collect rain water. This rain water can then be re-used to water your lawn and garden. To reserve your rain barrel fill out the information below and return to City Hall at 2052 County Road 24, Medina, MN 55340; or you can simply call or the information to Jodi Gallup at or jodi.gallup@ci.medina.mn.us Name Address City, State, Zip Phone Number *Number of Rain Barrels Desired Preferred Color (Green, Brown, or Gray) Payment will be due when the rain barrels arrive, sometime in late April. An will be sent notifying everyone that rain barrels are available for pick up at City Hall. *The city only purchased 40 rain barrels to sell at a discounted rate to residents. The number of rain barrels available to each resident will be determined by the level of interest prior to April 25, If there are still rain barrels available after that date, rain barrels will be sold on a first come first serve basis Rain Barrel Specifications from Manufacturer Use the The Great American Rain Barrel to collect and store precious rain water. This barrel is the largest capacity rain barrel available today! It is also the best built and most durable, with a wall thickness of 3/16" resulting in a rigid, heavy duty rain barrel that will last virtually forever. Each polyethylene rain barrel is manufactured in the USA from a recycled shipping barrel that stands 39" tall by 24" wide and weighs 20 lbs. empty. The barrel comes complete with overflow fitting, drain plug, screw on cover, a threaded spigot positioned 14" from ground level, and a mosquito skirt to filter out debris. Spigot can also be placed at base of barrel. Attach your garden hose to the spigot and water your garden or lawn, even wash your car. Our rain barrel arrives with simple instructions for fast and easy installation. For additional water storage simply link two or three barrels together with a short piece of 3/4" garden hose. The Great American Rain Barrel is also an effective way to divert water away from the home to stop flooding basements.
160
161 CONSUMER CONFIDENCE REPORT City of Medina 2008 Drinking Water Report PWSID: The City of Medina is issuing the results of monitoring done on its drinking water for the period from January 1 to December 31, The purpose of this report is to advance consumers understanding of drinking water and heighten awareness of the need to protect precious water resources. Source of Water The City of Medina provides drinking water to its residents from a groundwater source: ten wells ranging from 204 to 770 feet deep that draw water from the Franconia-Ironton-Galesville, Mt. Simon, Jordon, Quaternary Buried Unconfined and Quaternary Buried Artesian aquifers. The water provided to customers may meet drinking water standards, but the Minnesota Department of Health has also made a determination as to how vulnerable the source of water may be to future contamination incidents. If you wish to obtain the entire source water assessment regarding your drinking water, please call or (and press 5) during normal business hours. Also, you can view it on line at Call Steve Scherer if you have questions about the City of Medina drinking water or would like information about opportunities for public participation in decisions that may affect the quality of the water. Results of Monitoring No contaminants were detected at levels that violated federal drinking water standards. However, some contaminants were detected in trace amounts that were below legal limits. The table that follows shows the contaminants that were detected in trace amounts last year. (Some contaminants are sampled less frequently than once a year; as a result, not all contaminants were sampled for in If any of these contaminants were detected the last time they were sampled for, they are included in the table along with the date that the detection occurred.) Key to abbreviations: MCLG Maximum Contaminant Level Goal: The level of a contaminant in drinking water below of which there is no known or expected risk to health. MCLGs allow for a margin of safety. MCL Maximum Contaminant Level: The highest level of a contaminant that is allowed in drinking water. MCLs are set as close to the MCLGs as feasible using the best available treatment technology. MRDL Maximum Residual Disinfectant Level. MRDLG Maximum Residual Disinfectant Level Goal. 1
162 CONSUMER CONFIDENCE REPORT PWSID: AL Action Level: The concentration of a contaminant which, if exceeded, triggers treatment or other requirement which a water system must follow. 90th Percentile Level This is the value obtained after disregarding 10 percent of the samples taken that had the highest levels. (For example, in a situation in which 10 samples were taken, the 90th percentile level is determined by disregarding the highest result, which represents 10 percent of the samples.) Note: In situations in which only 5 samples are taken, the average of the two with the highest levels is taken to determine the 90th percentile level. pci/l PicoCuries per liter (a measure of radioactivity). ppb Parts per billion, which can also be expressed as micrograms per liter (μg/l). ppm Parts per million, which can also be expressed as milligrams per liter (mg/l). nd No Detection. N/A Not Applicable (does not apply). Contaminant (units) Alpha Emitters MCLG MCL Range (2008) Level Found Average /Result* Typical Source of Contaminant N/A 4.4 Erosion of natural deposits. (pci/l) Arsenic (ppb) Barium (ppm) Erosion of natural deposits; Runoff from orchards; Runoff from glass and electronics production wastes..15 Discharge of drilling wastes; Discharge from metal refineries; Erosion of natural deposits. Combined N/A 1.6 Erosion of natural deposits. Radium (pci/l) Fluoride (ppm) State of Minnesota requires all municipal water systems to add fluoride to the drinking water to promote strong teeth; Erosion of natural deposits; Discharge from fertilizer and aluminum factories. Haloacetic Acids (HAA5) (ppb) (09/19/2006) 0 60 N/A 1.9 By-product of drinking water disinfection. 2
163 CONSUMER CONFIDENCE REPORT Contaminant (units) Nitrate (as Nitrogen) (ppm) TTHM (Total trihalomethanes) (ppb) (09/19/2006) MCLG MCL Range (2008) Level Found Average /Result* PWSID: Typical Source of Contaminant nd Runoff from fertilizer use; Leaching from septic tanks, sewage; Erosion of natural deposits N/A 1.2 By-product of drinking water disinfection. Contaminant (units) Range (2008) Level Found Average/ Result* Typical Source of Contaminant Radon (pci/l) (10/17/2006) N/A 494 Erosion of natural deposits. *This is the value used to determine compliance with federal standards. It sometimes is the highest value detected and sometimes is an average of all the detected values. If it is an average, it may contain sampling results from the previous year. Radon is a radioactive gas which is naturally occurring in some groundwater. It poses a lung cancer risk when gas is released from water into air (as occurs during showering, bathing, or washing dishes or clothes) and a stomach cancer risk when it is ingested. Because radon in indoor air poses a much greater health risk than radon in drinking water, an Alternative Maximum Contaminant Level (AMCL) of 4,000 picocuries per liter may apply in states that have adopted an Indoor Air Program, which compels citizens, homeowners, schools, and communities to reduce the radon threat from indoor air. For states without such a program, the Maximum Contaminant Level (MCL) of 300 pci/l may apply. Minnesota plans to adopt an Indoor Air Program once the Radon Rule is finalized. Contaminant (units) MRDLG MRDL **** ***** Typical Source of Contaminant Chlorine (ppm) Water additive used to control microbes. ****Highest and Lowest Monthly Average. *****Highest Quarterly Average. Contaminant (units) MCLG AL 90% Level # sites over AL Typical Source of Contaminant Copper (ppm) N/A out of 10 Corrosion of household plumbing systems; Erosion of natural deposits. Lead (ppb) N/A 15 nd 0 out of 10 Corrosion of household plumbing systems; Erosion of natural deposits. 3
164 CONSUMER CONFIDENCE REPORT PWSID: If present, infants and children who drink water containing lead in excess of the action level could experience delays in their physical or mental development. Children could show slight deficits in attention span and learning abilities. Adults who drink this water over many years could develop kidney problems or high blood pressure. Lead in drinking water is primarily from materials and components associated with service lines and home plumbing. City of Medina is responsible for providing high quality drinking water, but cannot control the variety of materials used in plumbing components. When your water has been sitting for several hours, you can minimize the potential for lead exposure by flushing your tap for 30 seconds to 2 minutes before using water for drinking or cooking. If you are concerned about lead in your water, you may wish to have your water tested. Information on lead in drinking water, testing methods, and steps you can take to minimize exposure is available from the Safe Drinking Water Hotline or at Some contaminants do not have Maximum Contaminant Levels established for them. These unregulated contaminants are assessed using state standards known as health risk limits to determine if they pose a threat to human health. If unacceptable levels of an unregulated contaminant are found, the response is the same as if an MCL has been exceeded; the water system must inform its customers and take other corrective actions. In the table that follows are the unregulated contaminants that were detected: Contaminant (units) Range (2008) Level Found Average/ Result Typical Source of Contaminant Sodium (ppm) Erosion of natural deposits. Sulfate (ppm) Erosion of natural deposits. Compliance with National Primary Drinking Water Regulations The sources of drinking water (both tap water and bottled water) include rivers, lakes, streams, ponds, reservoirs, springs, and wells. As water travels over the surface of the land or through the ground, it dissolves naturally-occurring minerals and, in some cases, radioactive material, and can pick up substances resulting from the presence of animals or from human activity. Contaminants that may be present in source water include: Microbial contaminants, such as viruses and bacteria, which may come from sewage treatment plants, septic systems, agricultural livestock operations, and wildlife. Inorganic contaminants, such as salts and metals, which can be naturally-occurring or result from urban stormwater runoff, industrial or domestic wastewater discharges, oil and gas production, mining, or farming. Pesticides and herbicides, which may come from a variety of sources such as agriculture, urban stormwater runoff, and residential uses. Organic chemical contaminants, including synthetic and volatile organic chemicals, which are by-products of industrial processes and petroleum production, and can also come from gas stations, urban stormwater runoff, and septic systems. 4
165 CONSUMER CONFIDENCE REPORT PWSID: Radioactive contaminants, which can be naturally-occurring or be the result of oil and gas production and mining activities. In order to ensure that tap water is safe to drink, the U. S. Environmental Protection Agency (EPA) prescribes regulations which limit the amount of certain contaminants in water provided by public water systems. Food and Drug Administration regulations establish limits for contaminants in bottled water which must provide the same protection for public health. Drinking water, including bottled water, may reasonably be expected to contain at least small amounts of some contaminants. The presence of contaminants does not necessarily indicate that water poses a health risk. More information about contaminants and potential health effects can be obtained by calling the Environmental Protection Agency s Safe Drinking Water Hotline at Some people may be more vulnerable to contaminants in drinking water than the general population. Immuno-compromised persons such as persons with cancer undergoing chemotherapy, persons who have undergone organ transplants, people with HIV/AIDS or other immune system disorders, some elderly, and infants can be particularly at risk from infections. These people should seek advice about drinking water from their health care providers. EPA/CDC guidelines on appropriate means to lessen the risk of infection by Cryptosporidium are available from the Safe Drinking Water Hotline at
166
167 Appendix B: Model Results
168
169
170
171
172
173
174
175 Appendix C: Hydrant Flow Tests C = 130 Hydrant Testing Performed on July 2, 2007 Controlling Water Level Field Model-05 Level Residua Differenc Static l Static Residual e Static Difference Static, ABS value Difference Residual, ABS value Difference Sum Residual Sum 122
176
177 Appendix D: Cost Estimates File Medina Water Supply and Distribution Plan 4-Jan-08 Distribution 8 inch 21,500 LF $55 $1,182, inch 83,844 LF $70 $5,869, inch PRV 1 EA $50,000 $50,000 Total 105,344 LF $7,100,000 Supply 500 gpm Wells 7 EA $1,000,000 $7,000,000 Total $7,000,000 Storage 0.75 MG Elevated Reservoir 2 EA $3,100,000 $6,200,000 Booster Station 1 EA $750,000 $750,000 Total $6,950,000 Treatment 1 MGD East WTP Expansion 1 EA $1,400,000 $1,400, MGD West WTP 1 EA $6,800,000 $6,800,000 Total $8,200,000 Summary Distribution $7,100,000 Supply $7,000,000 Storage $6,950,000 Treatment $8,200,000 Total $29,250,000
178
179 Appendix E: Water Quality Requirements
180
181 National Primary Drinking Water Regulations Contaminant MCL or Potential health effects from Common sources of contaminant Public Health TT 1 (mg/l) 2 long-term 3 exposure above the MCL in drinking water Goal (mg/l) 2 OC Acrylamide TT 4 Nervous system or blood problems; increased risk of cancer Added to water during sewage/ wastewater treatment OC Alachlor Eye, liver, kidney or spleen problems; Runoff from herbicide zero anemia; increased risk of cancer used on row crops R Alpha/photon emitters 15 picocuries Increased risk of cancer Erosion of natural deposits of certain zero per Liter minerals that are radioactive and (pci/l) may emit a form of radiation known as alpha radiation IOC Antimony Increase in blood cholesterol; decrease Discharge from petroleum refineries; in blood sugar fire retardants; ceramics; electronics; solder IOC Arsenic Skin damage or problems with circulatory systems, and may have increased risk of getting cancer zero Erosion of natural deposits; runoff 0 from orchards; runoff from glass & electronics production wastes IOC Asbestos (fibers >10 7 million Increased risk of developing benign Decay of asbestos cement in water 7 MFL micrometers) fibers per intestinal polyps mains; erosion of natural deposits Liter (MFL) OC Atrazine Cardiovascular system or reproductive problems Runoff from herbicide used on row crops IOC Barium 2 Increase in blood pressure Discharge of drilling wastes; discharge 2 from metal refineries; erosion of natural deposits OC Benzene Anemia; decrease in blood platelets; increased risk of cancer Discharge from factories; leaching from gas storage tanks and landfills OC Benzo(a)pyrene Reproductive difficulties; increased risk Leaching from linings of water storage zero (PAHs) of cancer tanks and distribution lines IOC Beryllium Intestinal lesions Discharge from metal refineries and coal-burning factories; discharge from electrical, aerospace, and defense industries R Beta photon emitters 4 millirems Increased risk of cancer Decay of natural and man-made zero per year deposits of certain minerals that are radioactive and may emit forms of radiation known as photons and beta radiation DBP Bromate Increased risk of cancer Byproduct of drinking water disinfection zero IOC Cadmium Kidney damage Corrosion of galvanized pipes; erosion of natural deposits; discharge from metal refineries; runoff from waste batteries and paints OC Carbofuran 0.04 Problems with blood, nervous system, or reproductive system zero Leaching of soil fumigant used on rice 0.04 and alfalfa OC Carbon tetrachloride Liver problems; increased risk of cancer Discharge from chemical plants and zero other industrial activities D Chloramines (as Cl ) MRDL=4.0 1 Eye/nose irritation; stomach discomfort; Water additive used to control MRDLG=4 1 2 anemia microbes OC Chlordane Liver or nervous system problems; Residue of banned termiticide zero increased risk of cancer D Chlorine (as Cl ) 2 MRDL=4.0 1 Eye/nose irritation; stomach discomfort Water additive used to control MRDLG=4 1 microbes D Chlorine dioxide MRDL=0.8 1 Anemia; infants, young children, and fetuses of Water additive used to control MRDLG=0.8 1 (as ClO ) 2 pregnant women: nervous system effects microbes DBP Chlorite 1.0 Anemia; infants, young children, and fetuses of Byproduct of drinking water 0.8 pregnant women: nervous system effects disinfection OC Chlorobenzene 0.1 Liver or kidney problems Discharge from chemical and agricultural 0.1 chemical factories IOC Chromium (total) 0.1 Allergic dermatitis Discharge from steel and pulp mills; 0.1 erosion of natural deposits IOC Copper TT 5 ; Short-term exposure: Gastrointestinal Corrosion of household plumbing 1.3 Action distress. Long-term exposure: Liver or systems; erosion of natural deposits Level = kidney damage. People with Wilson s 1.3 Disease should consult their personal doctor if the amount of copper in their water exceeds the action level M Cryptosporidium TT 7 Short-term exposure: Gastrointestinal illness Human and animal fecal waste zero (e.g., diarrhea, vomiting, cramps) LEGEND D Disinfectant IOC Inorganic Chemical OC Organic Chemical DBP Disinfection Byproduct M Microorganism R Radionuclides
182 Contaminant IOC OC OC OC Cyanide (as free cyanide) 2,4-D Dalapon 1,2-Dibromo-3- chloropropane (DBCP) MCL or TT 1 (mg/l) Potential health effects from long-term 3 exposure above the MCL Nerve damage or thyroid problems Kidney, liver, or adrenal gland problems Minor kidney changes Reproductive difficulties; increased risk of cancer OC o-dichlorobenzene 0.6 Liver, kidney, or circulatory system problems OC p-dichlorobenzene Anemia; liver, kidney or spleen damage; changes in blood Common sources of contaminant in drinking water Discharge from steel/metal factories; discharge from plastic and fertilizer factories Runoff from herbicide used on row crops Runoff from herbicide used on rights of way Runoff/leaching from soil fumigant used on soybeans, cotton, pineapples, and orchards Discharge from industrial chemical factories Discharge from industrial chemical factories OC 1,2-Dichloroethane Increased risk of cancer Discharge from industrial chemical factories OC OC OC 1,1-Dichloroethylene cis-1,2-dichloroethylene trans-1,2 Dichloroethylene Liver problems Liver problems Liver problems Discharge from industrial chemical factories Discharge from industrial chemical factories Discharge from industrial chemical factories OC Dichloromethane Liver problems; increased risk of cancer Discharge from drug and chemical factories OC OC OC OC OC OC 1,2-Dichloropropane Di(2-ethylhexyl) adipate Di(2-ethylhexyl) phthalate Dinoseb Dioxin (2,3,7,8-TCDD) Diquat Increased risk of cancer Weight loss, liver problems, or possible reproductive difficulties Reproductive difficulties; liver problems; increased risk of cancer Reproductive difficulties Reproductive difficulties; increased risk of cancer Cataracts Discharge from industrial chemical factories Discharge from chemical factories Discharge from rubber and chemical factories Runoff from herbicide used on soybeans and vegetables Emissions from waste incineration and other combustion; discharge from chemical factories Runoff from herbicide use Public Health Goal (mg/l) 2 OC Endothall 0.1 Stomach and intestinal problems Runoff from herbicide use 0.1 OC Endrin Liver problems Residue of banned insecticide zero zero zero zero 0.4 zero zero 0.02 OC Epichlorohydrin TT 4 Increased cancer risk; stomach problems Discharge from industrial chemical factories; an impurity of some water treatment chemicals zero OC Ethylbenzene 0.7 Liver or kidney problems Discharge from petroleum refineries 0.7 OC M IOC M OC DBP OC OC M Ethylene dibromide Fecal coliform and E. coli Fluoride Giardia lamblia Glyphosate Haloacetic acids (HAA5) Heptachlor Heptachlor epoxide Heterotrophic plate count (HPC) MCL TT TT 7 Problems with liver, stomach, reproductive system, or kidneys; increased risk of cancer Discharge from petroleum refineries Fecal coliforms and E. coli are bacteria whose Human and animal fecal waste presence indicates that the water may be contaminated with human or animal wastes. Microbes in these wastes may cause short term effects, such as diarrhea, cramps, nausea, headaches, or other symptoms. They may pose a special health risk for infants, young children, and people with severely compromised immune systems. Bone disease (pain and tenderness of the bones); children may get mottled teeth Short-term exposure: Gastrointestinal illness (e.g., diarrhea, vomiting, cramps) Kidney problems; reproductive difficulties Increased risk of cancer Liver damage; increased risk of cancer Liver damage; increased risk of cancer HPC has no health effects; it is an analytic method used to measure the variety of bacteria that are common in water. The lower the concentration of bacteria in drinking water, the better maintained the water system is. Water additive which promotes strong teeth; erosion of natural deposits; discharge from fertilizer and aluminum factories Human and animal fecal waste Runoff from herbicide use Byproduct of drinking water disinfection Residue of banned termiticide Breakdown of heptachlor HPC measures a range of bacteria that are naturally present in the environment zero zero zero 0.7 n/a 9 zero zero n/a LEGEND D Disinfectant IOC Inorganic Chemical OC Organic Chemical DBP Disinfection Byproduct M Microorganism R Radionuclides
183 Contaminant MCL or Potential health effects from Common sources of contaminant Public Health TT 1 (mg/l) 2 long-term 3 exposure above the MCL in drinking water Goal (mg/l) 2 OC Hexachlorobenzene Liver or kidney problems; reproductive Discharge from metal refineries and zero difficulties; increased risk of cancer agricultural chemical factories OC Hexachlorocyclopentadiene 0.05 Kidney or stomach problems Discharge from chemical factories 0.05 IOC Lead TT5; Infants and children: Delays in physical or Corrosion of household plumbing Action or mental development; children could systems; erosion of natural deposits Level=0.015 show slight deficits in attention span and learning abilities; Adults: Kidney problems; high blood pressure M Legionella TT7 Legionnaire s Disease, a type of Found naturally in water; multiplies in zero pneumonia heating systems OC Lindane Liver or kidney problems Runoff/leaching from insecticide used on cattle, lumber, gardens IOC Mercury (inorganic) Kidney damage Erosion of natural deposits; discharge from refineries and factories; runoff from landfills and croplands OC Methoxychlor 0.04 Reproductive difficulties Runoff/leaching from insecticide used 0.04 on fruits, vegetables, alfalfa, livestock IOC Nitrate (measured as 10 Infants below the age of six months who Runoff from fertilizer use; leaching 10 Nitrogen) drink water containing nitrate in excess from septic tanks, sewage; erosion of of the MCL could become seriously ill natural deposits and, if untreated, may die. Symptoms include shortness of breath and blue-baby syndrome. IOC Nitrite (measured as 1 Infants below the age of six months who Runoff from fertilizer use; leaching 1 Nitrogen) drink water containing nitrite in excess from septic tanks, sewage; erosion of of the MCL could become seriously ill natural deposits and, if untreated, may die. Symptoms include shortness of breath and blue-baby syndrome. OC Oxamyl (Vydate) 0.2 Slight nervous system effects Runoff/leaching from insecticide used 0.2 on apples, potatoes, and tomatoes OC Pentachlorophenol Liver or kidney problems; increased cancer risk Discharge from wood-preserving factories OC Picloram 0.5 Liver problems Herbicide runoff 0.5 OC Polychlorinated biphenyls Skin changes; thymus gland problems; Runoff from landfills; discharge of zero (PCBs) immune deficiencies; reproductive or waste chemicals nervous system difficulties; increased risk of cancer R Radium 226 and 5 pci/l Increased risk of cancer Erosion of natural deposits zero Radium 228 (combined) IOC Selenium 0.05 Hair or fingernail loss; numbness in fingers Discharge from petroleum and metal refineries; 0.05 or toes; circulatory problems erosion of natural deposits; discharge from mines OC Simazine Problems with blood Herbicide runoff OC Styrene 0.1 Liver, kidney, or circulatory system problems Discharge from rubber and plastic 0.1 factories; leaching from landfills OC Tetrachloroethylene Liver problems; increased risk of cancer Discharge from factories and dry cleaners zero IOC Thallium Hair loss; changes in blood; kidney, intestine, Leaching from ore-processing sites; or liver problems discharge from electronics, glass, and drug factories OC Toluene 1 Nervous system, kidney, or liver problems Discharge from petroleum factories 1 M Total Coliforms 5.0 Coliforms are bacteria that indicate that other, Naturally present in the environment zero percent 8 potentially harmful bacteria may be present. See fecal coliforms and E. coli DBP Total Trihalomethanes Liver, kidney or central nervous system problems; Byproduct of drinking water disinfection n/a 9 (TTHMs) increased risk of cancer OC Toxaphene Kidney, liver, or thyroid problems; Runoff/leaching from insecticide used zero increased risk of cancer on cotton and cattle OC 2,4,5-TP (Silvex) 0.05 Liver problems Residue of banned herbicide 0.05 OC 1,2,4-Trichlorobenzene 0.07 Changes in adrenal glands Discharge from textile finishing 0.07 factories OC 1,1,1-Trichloroethane 0.2 Liver, nervous system, or circulatory Discharge from metal degreasing 0.2 problems sites and other factories OC 1,1,2-Trichloroethane Liver, kidney, or immune system Discharge from industrial chemical problems factories OC Trichloroethylene Liver problems; increased risk of cancer Discharge from metal degreasing zero sites and other factories zero zero LEGEND D Disinfectant IOC Inorganic Chemical OC Organic Chemical DBP Disinfection Byproduct M Microorganism R Radionuclides
184 Contaminant MCL or TT 1 (mg/l) 2 Potential health effects from long-term 3 exposure above the MCL Common sources of contaminant in drinking water Public Health Goal (mg/l) 2 M Turbidity TT 7 Turbidity is a measure of the cloudiness of water. Soil runoff n/a It is used to indicate water quality and filtration effectiveness (e.g., whether disease-causing organisms are present). Higher turbidity levels are often associated with higher levels of disease-causing microorganisms such as viruses, parasites and some bacteria. These organisms can cause short term symptoms such as nausea, cramps, diarrhea, and associated headaches. R Uranium 30µg/L Increased risk of cancer, kidney toxicity Erosion of natural deposits zero OC Vinyl chloride Increased risk of cancer Leaching from PVC pipes; discharge zero from plastic factories M Viruses (enteric) TT 7 Short-term exposure: Gastrointestinal illness Human and animal fecal waste zero (e.g., diarrhea, vomiting, cramps) OC Xylenes (total) 10 Nervous system damage Discharge from petroleum factories; 10 discharge from chemical factories LEGEND D Disinfectant IOC Inorganic Chemical OC Organic Chemical DBP Disinfection Byproduct M Microorganism R Radionuclides
185 NOTES 1 Definitions Maximum Contaminant Level Goal (MCLG) The level of a contaminant in drinking water below Viruses: percent removal/inactivation which there is no known or expected risk to health. MCLGs allow for a margin of safety and are Legionella: No limit, but EPA believes that if Giardia and viruses are removed/inactivated according non-enforceable public health goals. to the treatment techniques in the surface water treatment rule, Legionella will also be controlled. Maximum Contaminant Level (MCL) The highest level of a contaminant that is allowed in Turbidity: For systems that use conventional or direct filtration, at no time can turbidity (cloudiness of drinking water. MCLs are set as close to MCLGs as feasible using the best available treatment water) go higher than 1 nephelolometric turbidity unit (NTU), and samples for turbidity must be technology and taking cost into consideration. MCLs are enforceable standards. less than or equal to 0.3 NTU in at least 95 percent of the samples in any month. Systems that use Maximum Residual Disinfectant Level Goal (MRDLG) The level of a drinking water disinfectant filtration other than conventional or direct filtration must follow state limits, which must include turbidity below which there is no known or expected risk to health. MRDLGs do not reflect the benefits of at no time exceeding 5 NTU. the use of disinfectants to control microbial contaminants. HPC: No more than 500 bacterial colonies per milliliter Maximum Residual Disinfectant Level (MRDL) The highest level of a disinfectant allowed in Long Term 1 Enhanced Surface Water Treatment; Surface water systems or ground water systems drinking water. There is convincing evidence that addition of a disinfectant is necessary for under the direct influence of surface water serving fewer than 10,000 people must comply with the control of microbial contaminants. applicable Long Term 1 Enhanced Surface Water Treatment Rule provisions (e.g. turbidity standards, Treatment Technique (TT) A required process intended to reduce the level of a contaminant in individual filter monitoring, Cryptosporidium removal requirements, updated watershed control drinking water. requirements for unfiltered systems). 2 Units are in milligrams per liter (mg/l) unless otherwise noted. Milligrams per liter are equivalent Long Term 2 Enhanced Surface Water Treatment; This rule applies to all surface water systems to parts per million (ppm). or ground water systems under the direct influence of surface water. The rule targets additional 3 Health effects are from long-term exposure unless specified as short-term exposure. Cryptosporidium treatment requirements for higher risk systems and includes provisions to reduce 4 Each water system must certify annually, in writing, to the state (using third-party or manufacturers risks from uncovered finished water storages facilities and to ensure that the systems maintain microbial certification) that when it uses acrylamide and/or epichlorohydrin to treat water, the combination (or protection as they take steps to reduce the formation of disinfection byproducts. (Monitoring product) of dose and monomer level does not exceed the levels specified, as follows: Acrylamide start dates are staggered by system size. The largest systems (serving at least 100,000 = 0.05 percent dosed at 1 mg/l (or equivalent); Epichlorohydrin = 0.01 percent dosed at 20 mg/l people) will begin monitoring in October 2006 and the smallest systems (serving fewer than (or equivalent). 10,000 people) will not begin monitoring until October After completing monitoring and 5 Lead and copper are regulated by a Treatment Technique that requires systems to control the determining their treatment bin, systems generally have three years to comply with any additional corrosiveness of their water. If more than 10 percent of tap water samples exceed the action level, treatment requirements.) water systems must take additional steps. For copper, the action level is 1.3 mg/l, and for lead is Filter Backwash Recycling: The Filter Backwash Recycling Rule requires systems that recycle to mg/l. return specific recycle flows through all processes of the system s existing conventional or direct 6 A routine sample that is fecal coliform-positive or E. coli-positive triggers repeat samples--if any filtration system or at an alternate location approved by the state. repeat sample is total coliform-positive, the system has an acute MCL violation. A routine sample 8 No more than 5.0 percent samples total coliform-positive in a month. (For water systems that collect that is total coliform-positive and fecal coliform-negative or E. coli-negative triggers repeat samples--if fewer than 40 routine samples per month, no more than one sample can be total coliform-positive any repeat sample is fecal coliform-positive or E. coli-positive, the system has an acute MCL violation. per month.) Every sample that has total coliform must be analyzed for either fecal coliforms or See also Total Coliforms. E. coli. If two consecutive TC-positive samples, and one is also positive for E. coli or fecal coliforms, 7 EPA s surface water treatment rules require systems using surface water or ground water under system has an acute MCL violation. the direct influence of surface water to (1) disinfect their water, and (2) filter their water or meet 9 Although there is no collective MCLG for this contaminant group, there are individual MCLGs for criteria for avoiding filtration so that the following contaminants are controlled at the following levels: some of the individual contaminants: Cryptosporidium: 99 percent removal for systems that filter. Unfiltered systems are required to Haloacetic acids: dichloroacetic acid (zero); trichloroacetic acid (0.3 mg/l) include Cryptosporidium in their existing watershed control provisions. Trihalomethanes: bromodichloromethane (zero); bromoform (zero); dibromochloromethane (0.06 mg/l) Giardia lamblia: 99.9 percent removal/inactivation
186 National Secondary Drinking Water Regulation National Secondary Drinking Water Regulations are non-enforceable guidelines regarding contaminants that may cause cosmetic effects (such as skin or tooth discoloration) or aesthetic effects (such as taste, odor, or color) in drinking water. EPA recommends secondary standards to water systems but does not require systems to comply. However, some states may choose to adopt them as enforceable standards. Contaminant Secondary Maximum Contaminant Level Aluminum 0.05 to 0.2 mg/l Chloride 250 mg/l Color 15 (color units) Copper 1.0 mg/l Corrosivity noncorrosive Fluoride 2.0 mg/l Foaming Agents 0.5 mg/l Iron 0.3 mg/l Manganese 0.05 mg/l Odor 3 threshold odor number ph Silver 0.10 mg/l Sulfate 250 mg/l Total Dissolved Solids 500 mg/l Zinc 5 mg/l For More Information EPA s Safe Drinking Water Web site: EPA s Safe Drinking Water Hotline: (800) To order additional posters or other ground water and drinking water publications, please contact the National Service Center for Environmental Publications at : (800) , or nscep@bps-lmit.com. EPA 816-F May 2009
187 Appendix F: Supplemental Maps

188 CORCORAN Land Use Map City Boundary 2030 Land Use PR Study Area RRS Parcels LDR MDR HDR CC GB IB MU MXD - BP AG Medina OS P-R - State or Regional PREC PSP 0 U/A Parks and Recreation SL ROW-E ± 3,000 0 Feet April 2009 i:\190\ \cad\gis\projects\landuse.mxd 3,000

189 County Hwy 19 Belle St Snyder Rd Trail La County Rd 116 Pinto Dr Souix Dr 12'' Willow Dr 16'' 12'' Iroquois Dr Valley View Rd Buckskin Dr Hunter Dr Xanthus La 12'' 12'' 12'' 12'' Potential Future 0.75 MG Elev Tank Site HWL: 1195 City of Loretto Water System Lindgren La Town Hall Dr Budd St Budd Ave Bryant St Sunset La Fern Dr County Hwy 11 Lakeshore Dr Industrial St Served by Maple Plain Poplar Ave Country Cir Howard Ave Ihduhapi Tr Townline Rd Drake St E Main St US Hwy 12 Sycamore Tr 12'' Potential Future WTP Maple St Walnut St Pine St County Hwy 19 12'' 12'' Albert St 12'' Lakeshore Ave Loretto St Elsen Dr 12'' County Hwy 19 12'' Future Served by Maple Plain Wayzata Blvd 12'' State Hwy 55 Potential Future Well Field Medina Independence Beach Water System County Hwy 24 CORCORAN Wagon Wheel La 12'' Hamel Rd Chippewa Rd Starkey Rd 12'' 12'' Homestead Tr Pioneer Tr Rolling Hills Rd 12'' Tomahawk Tr Existing 0.4 MG Elev Tank HWL: 1165 Parkview Dr 12'' Served by Medina Morning Side Water System Witchita Tr Horseshoe Tr 12'' 12'' Potential Future 0.75 MG Elev Tank Site HWL: 1165 Apache Dr 12'' 12'' 12'' 12'' 12'' 12'' 16'' 16'' 16'' Deer Hill Rd Morningside Rd 6th Ave N 16'' Bobolink Rd Willow Dr Willow Dr 12'' 16'' Chestnut Rd Cottonwood Tr Mohawk Dr Chippewa Rd 12'' 0'' Mohawk Dr Served by City of Orono 16'' Morgan Rd 0'' Arrowhead Dr 12'' 12'' Old Settlers Rd 12'' 12'' Existing WTP Blackfoot Tr Oakview Rd Butterworth La 16'' 12'' 12'' 12'' Dusty Dr Tamarack Dr Trail La 12'' 16'' 12'' 12'' 16'' Elm St 12'' Navajo Rd Hackamore Rd Tower Dr Carriage Dr Potential Future Wells in Existing Well Field Melody La Highcrest Dr Cherokee Rd 6'' 12'' 6'' Meander Rd 6'' 6'' Pinto Dr 12'' 12'' 12'' 12'' Clydesdale Tr 10'' 10'' Park Trail Dr Elm Creek Dr 6th Ave N Hunter Rd 63rd Ave N Shawnee Woods Rd 6'' 6'' 6'' 6'' 6'' Red Fox Tr Hunter Dr Cheyenne Tr Vixen Rd Holy Name Dr Gleason Rd Evergreen Rd Cherry Hill Tr Hunter Rd Lakeview Rd 12'' 12'' Brockton La County Hwy 101 Alvarado La Brockton La Alvarado La 39th Ave Zircon La Xanthus La County Rd 47 Medina Rd 37th Ave Yellowstone La 26th Ave 24th Ave Xanthus La Walnut Grove La Urbandale Ct 34th Ave 29th Ave 26th Ave 20th Ave Troy La N 31st Ave 27th Ave Urbandale La 25th Ave Troy La Rainer La 48th Ave 46th Ave 33rd Ave 39th Ave Urbandale La N Urbandale La Ranier La 30th Pl Shadyview La 19th Ave Ultimate Trunk Water System Map Existing Wells Existing System Ultimate System Potential Elevated Storage Tank Site Potential Water Treatment Facility Site Potential Well Field Site Study Area Areas Served by Others City Boundary Future Pressure Zone Boundary Parcels Lakes ± 3, ,000 February 2008 Feet i:\190\ \cad\gis\projects\water_system.mxd
Water Supply and Distribution Plan
 CROW MISSISSIPPI 4 Water Supply and Distribution Plan Dayton, Minnesota February 2007 Bonestroo Rosene Anderlik & Associates Engineers & Architects February 1, 2007 Honorable Mayor and City Council City
Table of Contents. 3.1 Source Capacity Analysis
 Table of Contents 3.1 Source Capacity Analysis... 3-1 3.1.1. Design Criteria... 3-1 3.1.2. Source Capacity Evaluation... 3-1 3.1.2.1 Plateau Zone... 3-1 3.1.2.2 Cascade View Zone... 3-4 3.2 Storage Capacity
APPENDIX 5: SAMPLE MODEL RESULTS
 APPENDIX 5: SAMPLE MODEL RESULTS A. Evaluation of Groundwater Sustainability in the Ramsey Area B. Evaluation of Groundwater Sustainability in the Woodbury Area C. Evaluation of Future Drawdown Conditions
Water Storage Feasibility Study
 Water Storage Feasibility Study Charter Township of Commerce Prepared By: Giffels-Webster Engineers, Inc. 2871 Bond Street Rochester Hills, MI 48309 Table of Contents Introduction..... Page 1 Scope of
West Bountiful City. Water System Capital Facilities Plan
 Water System Capital Facilities Plan August 2008 TABLE OF CONTENTS 1.0 Executive Summary... 1 2.0 Definition of Terms and Abbreviations... 2 3.0 Introduction... 3 3.1 Background...3 3.2 Scope of Investigation...3
Introduction. Purpose
 Introduction This Master Plan update includes updating the text of the Utilities Section of the current Master Plan and adding a report concerning telecommunications. Each element examines the existing
APPENDIX B. WSSC Design Criteria for Water Distribution Systems
 a. System Requirements ) Pressure Requirements APPENDIX B WSSC Design Criteria for Water Distribution Systems a) The water distribution system shall have adequate capacity to supply domestic demand to
Section 7 Hydraulic Model Development and Evaluation Criteria
 Section 7 Hydraulic Model Development and Evaluation Criteria The hydraulic evaluation conducted to develop this master plan was performed using a computer model of the reclaimed water distribution system.
Description of Water Systems
 Description of Water Systems 1 WATER SYSTEM OWNERSHIP AND MANAGEMENT The City is a Washington State municipal corporation that owns and operates a Group A community water system within the boundaries of
PUBLIC UTILITIES. This portion of the Comprehensive Plan includes a planning-level review of the:
 PUBLIC UTILITIES I. INTRODUCTION This portion of the Comprehensive Plan includes a planning-level review of the: Municipal Wastewater Treatment/Sanitary Sewer System Municipal Water System Municipal Storm
CHAPTER 4 SYSTEM DESIGN CRITERIA
 INTRODUCTION CHAPTER 4 SYSTEM DESIGN CRITERIA Adequate design of the District s wastewater conveyance facilities requires the determination of the quantity of wastewater from contributing sources. The
GUIDANCE DOCUMENT WATER SUPPLY CAPACITY MANAGEMENT PLANS MARYLAND DEPARTMENT OF THE ENVIRONMENT
 GUIDANCE DOCUMENT WATER SUPPLY CAPACITY MANAGEMENT PLANS MARYLAND DEPARTMENT OF THE ENVIRONMENT 2006 ROBERT L. EHRLICH, JR. GOVERNOR MICHAEL S. STEELE LIEUTENANT GOVERNOR KENDL P. PHILBRICK SECRETARY JONAS
Cost of Importing Deep Sandstone Water to Eliminate Groundwater Deficits in Northeastern Illinois
 ISWS-74-CIR120 Circular 120 STATE OF ILLINOIS DEPARTMENT OF REGISTRATION AND EDUCATION Cost of Importing Deep Sandstone Water to Eliminate Groundwater Deficits in Northeastern Illinois by D. W. BEAVER
Report. Lake Water Supply Hydraulic Modeling. Village of. Lindenhurst, IL. April 2012
 Lake Water Supply Hydraulic Modeling Report Village of Lindenhurst, IL April 2012 R:\MAD\Documents\Reports\Archive\2012\Lindenhurst, IL\Lake Water Supply.HM.1290.039.mjf.jan\Report\!Front Cover (Blue=Water)
Saint Louis Water Supply Replacement Gratiot Area Water Authority
 Saint Louis Water Supply Replacement Gratiot Area Water Authority Public Forum October 23, 2013 Introduction Welcome and Introductions Format of Meeting Slide Show Presentation Question and Answer Period
FINAL ENGINEERING REPORT
 FINAL ENGINEERING REPORT FORT PECK ASSINIBOINE AND SIOUX WATER SUPPLY SYSTEM DRY PRAIRIE RURAL WATER SYSTEM JANUARY 2002 VOLUME I FINAL ENGINEERING REPORT FORT PECK ASSINIBOINE AND SIOUX WATER SUPPLY SYSTEM
ODUCTION ANITARY SEWER
 INTRODUCTION SANITARY SEWER Why Plan? 10 A Plan for the Community of Hastings 10 Metropolitan Council Oversight 11 Plan Organization 12 Previous Visioning and Planning 14 2040 Engagement Topics & Consensus
TOWN OF MOUNT PLEASANT WESTCHESTER COUNTY, NEW YORK
 TOWN OF MOUNT PLEASANT WESTCHESTER COUNTY, NEW YORK COST EVALUATION FOR ROLLING HILLS AREA WATER MAIN EXTENSION PROFESSIONAL CONSULTING, LLC. Octagon 10, Office Center 1719 Route 10, Suite 225 Parsippany,
Water Quality Treatment Policies January 28, 2015
 Water Quality Treatment Policies January 28, 2015 Madison experiences water quality challenges related to aquifer geochemistry as well as historic soil and groundwater contamination. Mineral-rich groundwater
Section 5 - Planning Criteria. Section 5
 Section 5 - Planning Criteria Section 5 SECTION 5 PLANNING CRITERIA This section presents the design criteria and methodologies for analysis used to evaluate the existing distribution system and its facilities
UNIFORM DESIGN AND CONSTRUCTION STANDARDS FOR EXTENDING WATER DISTRIBUTION SYSTEMS SECTION 2 DESIGN STANDARDS
 UNIFORM DESIGN AND CONSTRUCTION STANDARDS FOR EXTENDING WATER DISTRIBUTION SYSTEMS SECTION 2 DESIGN STANDARDS DESIGN STANDARDS SECTION 2 INDEX ITEM DESCRIPTION 2.00 GENERAL STATEMENT 2.01 WATER DISTRIBUTION
Water System Study. Report. Village of. Brooklyn, WI. August 2011
 Water System Study Report Village of Brooklyn, WI August 2011 TABLE OF CONTENTS Page No. or Following EXECUTIVE SUMMARY SECTION 1 INTRODUCTION 1.01 Purpose... 1-1 1.02 Scope... 1-1 1.03 Definitions...
CHAPTER 4 HYDRAULIC ANALYSIS
 CHAPTER 4 HYDRAULIC ANALYSIS This chapter presents information on the computer hydraulic model of the City s water system and the results of hydraulic analyses. The purpose of the hydraulic analysis is
Master Plan Update Executive Summary
 Master Plan Update Executive Summary City of Yuba City Water System Yuba City Final 5/18/04 Prepared under the responsible charge of Ligaya Kohagura 56463 2365 Iron Point Road, Suite 300 Folsom, CA 95630
CHAPTER SEVEN: UTILITIES
 CHAPTER SEVEN: UTILITIES 7.1 Introduction The Water Works Board of the City of Auburn (AWWB) is the primary potable water service provider for the City of Auburn (City) and Auburn University. There are
Utility Partner Data Report
 Utility Partner Data Report Project Title: Studying Distribution System Hydraulics and Flow Dynamics to Improve Water Utility Operational Decision Making Water Distribution System: Paris, Kentucky Project
SECTION 3.0 SPECIFICATIONS FOR DRINKING WATER DISTRIBUTION SYSTEMS DESIGN
 3.1 GENERAL SECTION 3.0 SPECIFICATIONS FOR DRINKING WATER DISTRIBUTION SYSTEMS DESIGN 3.1.1 The following specifications cover the general design, review of plans and specifications, and acceptance of
WATER SUPPLY & DEMAND ASSESSMENT IN RELATION TO EXELON POWER WEST MEDWAY II PROJECT FOR TOWN OF MEDWAY, MA OCTOBER 2015 REVISION DATE:
 WATER SUPPLY & DEMAND ASSESSMENT IN RELATION TO EXELON POWER WEST MEDWAY II PROJECT FOR TOWN OF MEDWAY, MA OCTOBER 2015 REVISION DATE: October 5, 2015 Copyright 2015 Kleinfelder All Rights Reserved TABLE
SECTION 4 - DESIGN STANDARDS FOR WATER DISTRIBUTION FACILITIES
 SECTION 4 - DESIGN STANDARDS FOR WATER DISTRIBUTION FACILITIES 4.1 GENERAL REQUIREMENTS 4.1.1 Water and fire protection distribution facilities are to be provided solely for the purpose of supplying potable
EXECUTIVE SUMMARY. The capital improvements costs through Year 2025 have been summarized as follows: RECOMMENDED IMPROVEMENTS (Ref.
 EXECUTIVE SUMMARY This report evaluates the ability of the Dothan Water System to adequately meet the City s short range and future water supply, infrastructure and maintenance needs. The report evaluated
UNIT WELL 15 VOLATILE ORGANIC COMPOUND (VOC) MITIGATION
 MITIGATION") BUILDING A WORLD OF DIFFERENCE UNIT WELL 15 VOLATILE ORGANIC COMPOUND (VOC) MITIGATION Madison Water Utility Madison, Wisconsin Black & Veatch Corporation B&V Project 169092.0800 B&V File 41.0800 Black
BUILDING A WORLD OF DIFFERENCE UNIT WELL 15 VOLATILE ORGANIC COMPOUND (VOC) MITIGATION Madison Water Utility Madison, Wisconsin Black & Veatch Corporation B&V Project 169092.0800 B&V File 41.0800 Black
VILLAGE OF BEAR LAKE. Water Reliability Study & General Plan Update
 VILLAGE OF BEAR LAKE MANISTEE COUNTY, MICHIGAN Water Reliability Study & General Plan Update November 2013 Project No. 811320 TABLE OF CONTENTS PAGES I. EXECUTIVE SUMMARY..........................................
CHAPTER SEVEN: UTILITIES
 CHAPTER SEVEN: UTILITIES 7.0 Introduction T he Water Works Board of the City of Auburn (AWWB) is the primary potable water service provider for the City of Auburn (City) and Auburn University. There are
Water Distribution System Facility Plan
 Water Distribution System Facility Plan July 2007 CVO\070040005 Contents Section Page Executive Summary...ES-1 1 Introduction...1-1 Financial Plan...1-1 Acknowledgements...1-1 MWC Staff...1-1 MWC Commissioners...1-1
Table of Contents Part Title Page
 Table of Contents Part Title Page 1 System Information 1 2 Rate Structure 1 3 Conservation Goals 2 4 Implementation and Tracking 3 5 Conservation Measures 4 Appendix A Appendix B Appendix C Utility Profile
WATER SYSTEM MASTER PLAN 11. STORAGE CAPACITY EVALUATION
 WATER SYSTEM MASTER PLAN 11. STORAGE CAPACITY EVALUATION The District uses water supplied from both storage and wells to help meet peak demands. In this section District operational, emergency, and fire
Utility Partner Data Report
 Utility Partner Data Report Project Title: Studying Distribution System Hydraulics and Flow Dynamics to Improve Water Utility Operational Decision Making Water Distribution System: Nicholasville, Kentucky
CITY OF MILTON PIERCE/KING COUNTY, WASHINGTON WATER SYSTEM PLAN
 CITY OF MILTON PIERCE/KING COUNTY, WASHINGTON WATER SYSTEM PLAN G&O #08474 July 2010 EXECUTIVE SUMMARY TABLE OF CONTENTS CHAPTER 1 DESCRIPTION OF THE WATER SYSTEM INTRODUCTION... 1-1 SYSTEM OWNERSHIP
WATER SUPPLY NOW AND FOR THE FUTURE Steps toward sustainable water supplies
 WATER SUPPLY NOW AND FOR THE FUTURE Steps toward sustainable water supplies 2017 REPORT OF THE METROPOLITAN AREA WATER SUPPLY ADVISORY COMMITTEE TO THE MINNESOTA LEGISLATURE WE LIVE IN THE LAND OF 10,000
Water and Wastewater Impact Fee Analysis Capital Improvement Plan City of Lockhart February 2017
 TABLE OF CONTENTS 1.0 INTRODUCTION... 1 2.0 ANALYSIS OF WATER & WASTEWATER SYSTEMS... 1 2.1 Present Water Demands... 1 2.2 Water Supply... 3 2.3 Water Treatment Plant... 4 2.4 Storage, High-Service Pumps,
Approved Capacity. March 2010
 March 2010 Approved Capacity Planning and Design Criteria for Establishing Approved Capacity for: 1) Surface Water And Ground Water Supply Sources, 2) Drinking Water Treatment Plants (WTPs), and 3) Source/WTP
CHAPTER 6: UTILITIES. 6.1 Purpose
 CHAPTER 6: UTILITIES 6.1 Purpose The purpose of this chapter is to plan and review the City s utility network to accommodate current and future needs. The chapter includes three sections: 6.2 Water Supply
City of Richland Comprehensive Water System Plan
 City of Richland June 2010 RH2 Engineering, Inc 114 Columbia Point Drive, Suite C Richland, WA 99352 Contact: Paul R. Cross, P.E. (509) 946-5181 Prepared by: June 2010 Signed: 6/28/2010 Signed: 6/28/2010
J. PAUL GUYER, P.E., R.A.
 J. PAUL GUYER, P.E., R.A. Paul Guyer is a registered civil engineer, mechanical engineer, fire protection engineer and architect with over 35 years experience designing all types of buildings and related
Montara Water and Sanitary District 2011 New Customer CIP and Water Capacity Charge. Presentation to Board April 21, 2011
 Montara Water and Sanitary District 2011 New Customer CIP and Water Capacity Charge Presentation to Board April 21, 2011 PRESENTATION OUTLINE Master Plan Overview Purpose and Approach Supply and Demand
NELSONVILLE WATER TREATMENT PLANT IMPROVEMENTS
 Location City of Nelsonville, Ohio Environmental Engineering, Design and Bidding, Construction Administration and Observation, Start-up Services Cost $4.25 million Size 1,000 gallon per minute Professional
El Margarita Development Analysis
 303 Second Street, Suite 300 South San Francisco, California 94107 415-243-2150 FAX: 415-896-0999 El Margarita Development Analysis 28 January 2015 Prepared for City of Yuba City 1201 Civic Center Boulevard
FREELAND WATER & SEWER DISTRICT BERCOT ROAD INTERTIE STUDY
 FREELAND WATER & SEWER DISTRICT ISLAND COUNTY WASHINGTON BERCOT ROAD INTERTIE STUDY G&O #13507 NOVEMBER 2013 FREELAND WATER & SEWER DISTRICT ISLAND COUNTY WASHINGTON BERCOT ROAD INTERTIE STUDY G&O #13507
WATER SYSTEM PRESENTATION. Presenter: Mike Oemcke Company: OCWA Central New York s Water Authority Department: Water System Engineering
 WATER SYSTEM PRESENTATION 2017 Presenter: Mike Oemcke Company: OCWA Central New York s Water Authority Department: Water System Engineering OUTLINE SYSTEM OVERVIEW SOURCES OF SUPPLY MAJOR FACILITIES PRESSURE
Outfall at Lagoon between Lake of the Isles and Lake Calhoun
 Outfall at Lagoon between Lake of the Isles and Lake Calhoun Prepared for City of Minneapolis April 17, 2013 4700 West 77 th Street Minneapolis, MN 55435-4803 Phone: (952) 832-2600 Fax: (952) 832-2601
Water Treatment Plant and Water Supply Study CITY OF SNOHOMISH, WASHINGTON
 Water Treatment Plant and Water Supply Study CITY OF SNOHOMISH, WASHINGTON May 2009 TABLE OF CONTENTS EXECUTIVE SUMMARY Page Purpose and Background... ES-1 Existing Water System... ES-1 Water Demands...
WATER TREATMENT PLANT NO. 5 PRELIMINARY DESIGN REPORT FOR
 Professional Certification WATER TREATMENT PLANT NO. 5 PRELIMINARY DESIGN REPORT FOR PROFESSIONAL CERTIFICATION SEPTEMBER 2017 I hereby certify that this report was prepared by me or under my direct supervision
Sub-Regional Water Supply and Treatment Analysis Defines Sustainable Water Supply Plan For Three Lower Fox River Watershed Communities
 Sub-Regional Water Supply and Treatment Analysis Defines Sustainable Water Supply Plan For Three Lower Fox River Watershed Communities Presented By: Jeffrey W. Freeman, P.E., CFM, LEED AP Engineering Enterprises,
ENGINEERING AND DESIGN WATER SUPPLY, WATER STORAGE MOBILIZATION CONSTRUCTION. r:'z"r.''
 ENGINEER MANUAL EM 111 0-3-1 63 April 1984 ENGINEERING AND DESIGN WATER SUPPLY, WATER STORAGE MOBILIZATION CONSTRUCTION r:'z"r.'' ~ DEPARTMENT OF THE ARMY CORPS OF ENGINEERS OFFICE OF THE CHIEF OF ENGINEERS
Water Management and Conservation Plan
 Water Management and Conservation Plan March 2009 Water Management and Conservation Plan March 2009 CVO\082060036 Contents Section Page 1 Introduction...1-1 Overview...1-1 Plan Organization...1-3 Affected
City of Yuba City. Yuba City Update to Water Demand and Infrastructure System Evaluation. Technical Memorandum
 City of Yuba City Yuba City Update to Water Demand and Infrastructure System Evaluation Technical Memorandum July 2006 Table of Contents Introduction... 1 Background...1 Purpose and Objectives...1 Water
MASTER WATER PLAN UPDATE 1. INTRODUCTION. 1.1 Objective and Scope
 MASTER WATER PLAN UPDATE 1. INTRODUCTION 1.1 Objective and Scope This study is an update to the City of Victoria s Master Water Plan, which was last updated in 2009 by Urban Engineering. The objective
WATER SUPPLY AND DEMAND ASSESSMENT IN RELATION TO EXELON POWER WEST MEDWAY II PROJECT FOR TOWN OF MILLIS, MA REVISION 2: MARCH 11, 2016
 WATER SUPPLY AND DEMAND ASSESSMENT IN RELATION TO EXELON POWER WEST MEDWAY II PROJECT FOR TOWN OF MILLIS, MA REVISION 2: MARCH 11, 2016 Copyright 2016 Kleinfelder All Rights Reserved THIS PAGE INTENTIONALLY
Section 9 Distribution System Analysis
 Section 9 Distribution System Analysis This section presents the analysis of the City of Sunnyside s (City) distribution system. Hydraulic modeling was performed to evaluate the adequacy of existing facilities
DIVERSIFIED RURAL COMMUNITY ROLE COUNCIL ROLE DIVERSIFIED RURAL ALL COMMUNITIES
 Orderly and Efficient Land Use Align land use, development patterns, and infrastructure to make the best use of public and private investment. Plan for growth not to exceed forecasts and in patterns that
Water Conservation Plan
 Water Conservation Plan Page 1 of 11 1 Water Conservation Plan for the City of Lawrence TABLE OF CONTENTS INTRODUCTION 3 WATER CONSERVATION PLAN. 4 LONG TERM WATER USE EFFICIENCY 4 Water Use Conservation
VILLAGE OF ALGONQUIN 2014 WASTEWATER FACILITY PLAN UPDATE EXECUTIVE SUMMARY
 EXECUTIVE SUMMARY EXECUTIVE SUMMARY INTRODUCTION AND BACKGROUND The Village of Algonquin, located along the Fox River in McHenry County, provides wastewater collection and treatment services to the entire
APPENDIX K. Water Supply Report
 APPENDIX K Water Supply Report WATER SUPPLY REPORT FOR THE CHESTER DEVELOPMENT PROJECT Chester Development Town of Chester Section 2, Block 1, Lot 39 Village of Chester Section 107, Block 3, Lot 4 Section
INFRASTRUCTURE ELEMENT Goal, Objectives and Policies
 INFRASTRUCTURE ELEMENT Goal, Objectives and Policies City of Bartow Comprehensive Plan Adopted August 5, 1991 Amended August 2, 1993, Amended 1996 & 1999 Adopted Changes January 16, 2001, Amended April
Municipal Service Review
 Willow Creek Community Services District Municipal Service Review May 2008 Prepared by: For the District Sphere of Influence Report TABLE OF CONTENTS Page Local Agency Formation Commission Authority...
Horizon 2020 Steering Committee Water and Wastewater Master Plan Overview
 Horizon 2020 Steering Committee Water and Wastewater Master Plan Overview August 11, 2014 Let s Look at the Numbers Water System 2 - Raw Water Sources Clinton Reservoir Kansas River 2 - Water Treatment
Springfield Utility Board, Oregon Rainbow Water District, Oregon
 WATER MANAGEMENT AND CONSERVATION PLAN Springfield Utility Board, Oregon Rainbow Water District, Oregon August 2012 WATER MANAGEMENT AND CONSERVATION PLAN FOR SPRINGFIELD UTILITY BOARD AND RAINBOW WATER
APPENDIX B THE MUNICIPAL AUTHORITY OF THE TOWNSHIP OF ROBINSON DESCRIPTION OF THE AUTHORITY ' S WATER AND SEWER SYSTEM AND FINANCIAL INFORMATION
 APPENDIX B DESCRIPTION OF THE AUTHORITY ' S WATER AND SEWER SYSTEM AND FINANCIAL INFORMATION FOR FISCAL YEAR 2017 DESCRIPTION OF THE AUTHORITY S WATER AND SEWER SYSTEM The existing water distribution system
CITY AND VILLAGE OF PEWAUKEE WATER UTILITY CONSOLIDATION STUDY
 CITY AND VILLAGE OF PEWAUKEE WATER UTILITY CONSOLIDATION STUDY CITY/VILLAGE OF PEWAUKEE WAUKESHA COUNTY, WISCONSIN AUGUST/2009 RUEKERT/MIELKE W233 N2080 Ridgeview Parkway 2009 Copyright Ruekert & Mielke,
ADVANCED WATER DISTRIBUTION MODELING AND MANAGEMENT
 H A E S T A D M E T H O D S ADVANCED WATER DISTRIBUTION MODELING AND MANAGEMENT F i r s t E d i t i o n Table of Contents Preface Continuing Education Units About the Software xv xix xxi Chapter 1 Introduction
Environmental Engineering-I
 Environmental Engineering-I Prof. Dr. Muhammad Zulfiqar Ali Khan Engr. Muhammad Aboubakar Farooq Water Distribution Systems & Analysis 1 Water Distribution Systems & Analysis References Water Supply &
(b) Water Engineering Basics
 Water Engineering Basics") NRRI Training for the Oklahoma Corporation Commission March 14-16, 2017 Topic 3 (b) Water Engineering Basics Kathryn J. Kline Research Associate National Regulatory Research Institute kkline@nrri.org Industry
NRRI Training for the Oklahoma Corporation Commission March 14-16, 2017 Topic 3 (b) Water Engineering Basics Kathryn J. Kline Research Associate National Regulatory Research Institute kkline@nrri.org Industry
Minnetonka Beach Local Water Supply Plan. Formerly called Water Emergency & Water Conservation Plan
 Minnetonka Beach Local Water Supply Plan Formerly called Water Emergency & Water Conservation Plan October 2017 1 Table of contents PART 1. WATER SUPPLY SYSTEM DESCRIPTION AND EVALUATION... 5 A. Analysis
INFRASTRUCTURE ELEMENT
 Goals, Objectives and Policies INFRASTRUCTURE ELEMENT SANITARY SEWER GOAL 4.A.1.: PROVIDE ADEQUATE CENTRAL SANITARY SEWAGE FACILITIES FOR RESIDENTIAL AND NON-RESIDENTIAL DEVELOPMENT AND REDEVELOPMENT IN
Volume 1 Executive Summary
 2013 Cheyenne Water and Wastewater Master Plans Final November 27, 2013 Prepared for: City of Cheyenne Board of Public Utilities 2416 Snyder Ave. Cheyenne, WY 82001 Prepared by: HDR Engineering AMEC Earth
AUGUST 30, 2016 DRAFT WATER SYSTEM PLAN TEXT AND TABLES BYWATER BAY WATER SYSTEM WITH SHINE PLAT
 AUGUST 30, 2016 DRAFT WATER SYSTEM PLAN TEXT AND TABLES BYWATER BAY WATER SYSTEM WITH SHINE PLAT 1. SYSTEM OVERVIEW The Bywater Bay Water System (DOH Water System ID number 02043P) is located in eastern
The Undiluted Cost of Energy and Water: From Rainfall to Outfall. Greg Harrington Professor and Associate Chair
 The Undiluted Cost of Energy and Water: From Rainfall to Outfall Greg Harrington Professor and Associate Chair Acknowledgments Graduate students Todd Elliott Irene Xagoraraki Ben Zeier Joshua Bohnert Mike
Livingston County Department of Public Health Environmental Health Division. Hydrogeologic Investigation Requirements for Land Division Developments
 Livingston County Department of Public Health Environmental Health Division Hydrogeologic Investigation Requirements for Land Division Developments Reviewed March 1, 2013 Table of Contents Scope/Authority..1
RURAL RESIDENTIAL COMMUNITY ROLE COUNCIL ROLE RURAL RESIDENTIAL ALL COMMUNITIES
 Orderly and Efficient Land Use Align land use, development patterns, and infrastructure to make the best use of public and private investment. Discourage future development of rural residential patterns
CITY OF LAGRANGE, GEORGIA UTILITY DEPARTMENT WATER CONSERVATION AND DROUGHT CONTINGENCY PLANS
 CITY OF LAGRANGE, GEORGIA UTILITY DEPARTMENT WATER CONSERVATION AND DROUGHT CONTINGENCY PLANS Modified: May 2012 WATER CONSERVATION PLAN SYSTEM MANAGEMENT AND SALES Permit Information. The City of LaGrange
About Me. Overview. Seattle Regional Water System. Seattle Regional Water System. Water System Analysis and Design at Seattle Public Utilities
 About Me Water System Analysis and Design at Seattle Public Utilities Jon C. Ford, P.E. CEE 481 October 1, 8 Senior Civil Engineer, Seattle Public Utilities BSCE, Seattle University MSCE, University of
Storage and pumping capacity analysis using hydraulic modeling
 Storage and pumping capacity analysis using hydraulic modeling G. MacPherson City of Chilliwack, B.C., Canada W. de Schaetzen & S. Cripps GeoAdvice Inc., Vancouver, B.C., Canada ABSTRACT: This paper summarizes
Groundwater Occurrence & Movement: An Introductory Discussion with Application to Northeastern Illinois
 Groundwater Occurrence & Movement: An Introductory Discussion with Application to Northeastern Illinois H. Allen Wehrmann, P.E., Director Center for Groundwater Science Illinois State Water Survey April
Potable Water and Wastewater Data and Analysis Report
 Potable Water and Wastewater Data and Analysis Report Public and Private Potable Water Facilities Service Area The City of Gainesville, through Gainesville Regional Utilities (GRU), is the supplier of
Table A Summary Water System Data Data
 PS OMAS TECHNICAL MEMORANDUM NO. 2 To: From: Trish Rhay, Mark Cuneo Mike Swan, PE, Harvey Gobas, PE and Neha Gajjar, PE Date: Subject: EXECUTIVE SUMMARY The of Beverly Hills (CBH) has ten (10) active reservoirs
2040 COMPREHENSIVE PLAN
 2040 COMPREHENSIVE PLAN MEDINA COMPREHENSIVE SANITARY SEWER PLAN HENNEPIN COUNTY MEDINA, MINNESOTA Adopted October 2, 2018 Prepared for: City of Medina 2052 County Road 24 Medina, MN 55340 WSB PROJECT
City of Grenora, ND Municipal Infrastructure Needs Assessment August 2012
 City of Grenora, ND Municipal Infrastructure Needs Assessment August 2012 Project made possible by US Dept. of HUD Regional Substantiality Planning Grant and ND Energy Development Infrastructure and Impact
Utilities are constantly striving to
 Comprehensive Approach to Increase Effectiveness & Efficiency of Flushing Programs Using Latest Hydraulic & Water Quality Monitoring Tools Kelcia D. Mazana, Edward H. Talton Jr., and C. Robert Reiss Utilities
CONSERVATION PLAN April 2009
 CONSERVATION PLAN April 2009 1. INTRODUCTION AND OBJECTIVES Water supply has always been a key issue in the development of Texas. In recent years, the growing population and economic development of North
FINAL DRAFT WATER MANAGEMENT AND CONSERVATION PLAN. Canby Utility. June DRAFT
 FINAL DRAFT WATER MANAGEMENT AND CONSERVATION PLAN Canby Utility June 2010 - DRAFT WATER MANAGEMENT AND CONSERVATION PLAN FOR CANBY UTILITY JUNE 2010 FINAL DRAFT Prepared by: 09-1067.408 MURRAY, SMITH
Aquifer Storage and Recovery (ASR) Implementation and Operations in a Water System. Tiffanie Hawley, CFPUA Randy Plummer, HDR
 Implementation and Operations in a Water System. Tiffanie Hawley, CFPUA Randy Plummer, HDR") Aquifer Storage and Recovery (ASR) Implementation and Operations in a Water System Tiffanie Hawley, CFPUA Randy Plummer, HDR NC AWWA Spring Conference 2014 Background Data CFPUA Water System Fear Public
Aquifer Storage and Recovery (ASR) Implementation and Operations in a Water System Tiffanie Hawley, CFPUA Randy Plummer, HDR NC AWWA Spring Conference 2014 Background Data CFPUA Water System Fear Public
GOALS, OBJECTIVES AND POLICIES
 GOALS, OBJECTIVES AND POLICIES GOAL 1: Public Facilities. Needed public facilities shall be provided in a manner which protects investments in existing facilities and promotes orderly compact urban growth.
AUGUST 30, 2016 DRAFT WATER SYSTEM PLAN TEXT AND TABLES BYWATER BAY WATER SYSTEM WITHOUT SHINE PLAT
 AUGUST 30, 2016 DRAFT WATER SYSTEM PLAN TEXT AND TABLES BYWATER BAY WATER SYSTEM WITHOUT SHINE PLAT 1. SYSTEM OVERVIEW The Bywater Bay Water System (DOH Water System ID number 02043P) is located in eastern
SECTION 5 MINIMUM DESIGN CRITERIA
 5.1 INTRODUCTION Minimum design criteria for Water District 19 s water system is in accordance with the standards and requirements put forth by the U.S. Department of Environmental Protection Agency (EPA),
groundwater/surface-water interactions Evan Christianson, PG Barr Engineering Company
 groundwater/surface-water interactions Evan Christianson, PG Barr Engineering Company Discussion of. Groundwater/Surface-Water Interactions Groundwater Recharge Impacts from Pumping Potential effect on
West Hernando County Sewer Master Plan SECTION 7.0 RECLAIMED WATER
 SECTION 7.0 RECLAIMED WATER 7.1 Introduction The use of highly treated wastewater effluent, or reclaimed water, has expanded greatly in Florida over the past several decades. In particular, the use of
WELLHEAD PROTECTION DELINEATION REPORT FOR THE VILLAGE OF BEAR LAKE DECEMBER 2002
 WELLHEAD PROTECTION DELINEATION REPORT FOR THE VILLAGE OF BEAR LAKE DECEMBER 2002 Prepared by: Gosling Czubak Engineering Sciences, Inc. 1280 Business Park Drive Traverse City, Michigan 48686 Telephone:
FLORIDA STATE UNIVERSITY MASTER PLAN 9 General Infrastructure
 GENERAL INFRASTRUCTURE ELEMENT NOTE: Unless otherwise noted, the goals, objectives and policies contained in this element shall guide development of the Main Campus and Southwest Campus in Tallahassee
Appendix 2: Water Demand Projections
 Appendix 2: Water Demand Projections Appendix 2 Master Water Supply Plan 1 P a g e DATE: February 13, 215 TO: FROM: SUBJECT: Twin Cities Metropolitan Area Water Suppliers Metropolitan Council Water Supply
Flow-Through Lake/Wetland: Generalized Monitoring Strategy
 General Hydrologic Characteristics of Flow-Through Lakes & Wetlands Flow-through lakes are surface expressions of the water table and are in direct hydraulic connection with the water-table aquifer. They