MONITORED NATURAL ATTENUATION (MNA) FOR SITE CLEANUP: APPROPRIATE TOOL OR EASY WAY OUT?
|
|
|
- Eustace Stafford
- 6 years ago
- Views:
Transcription


1 MONITORED NATURAL ATTENUATION (MNA) FOR SITE CLEANUP: APPROPRIATE TOOL OR EASY WAY OUT? Charles Newell, Ph.D., P.E. GSI Environmental Inc. Houston, Texas, USA David Adamson, Ph.D., P.E. GSI Environmental Inc. Houston, Texas, USA
2 ROAD MAP Intro: Changing Paradigms and MNA Principles Key Attenuation Processes Biodegradation Abiotic Processes LNAPL source zone degradation processes Other processes (immobilization, storage, dilution) Field Techniques and Technologies Groundwater sampling and analytical methods Compound Specific Isotopes Analysis (CSIA) Molecular Biological Tools (MBTs) Natural Source Zone Depletion (NSZD) Should MNA be Used? Data Analysis and Monitoring Tools Data requirements, LTM, and statistics to understand MNA rates Common Graphics and Calculations Remediation Timeframe Calculations Computer Models Implementation Topics


3 3


4 SOURCE PARADIGM 1970s early 1990s 4
5 SOURCE PARADIGM 1970s early 1990s 5


6 PUMP AND TREAT THE PLUME Recovery Well Installation Well Screen Centralizer Wire-Wrap Well Screen Sand- Gravel Filter Pack Driller s knee Driller s helper 6
7

8

9

10

11
12 What Happened? NRC, 2012
13 What Happened? The Good The Bad The Ugly NRC, 2012


14 1989


15 DNAPL PARADIGM 15


16 Era of In-Situ Innovation 16
17 PERFORMANCE: Geomean Concentration by Site Site Concentration After Treatment (mg/l) 1000 Remediation Performance: Parent CVOC Bioremediation (n=117) 100 Chemical Oxidation (n=70) Thermal Treatment (n=23) Chemical Reduction (n=21) 10 Surfactant (n=4) MCL Site Concentration Before Treatment (mg/l) 17
 10000 1000 100 Remediation Performance: Parent CVOC Bioremediation (n=117) Chemical")

18 Max Concentration After Treatment (mg/l) PERFORMANCE: Rule of Thumb Max. Concs. (Regulatory Drivers) Remediation Performance: Parent CVOC Bioremediation (n=117) Chemical Oxidation (n=70) Thermal Treatment (n=23) Chemical Reduction (n=21) Surfactant (n=4) 10 Middle 50% of Sites Achieved ~ 0.4 to 2 OoM Reduction MCL Max Concentration Before Treatment (mg/l) 18
19 A CARTOON HISTORY OF MICROBIOLOGY, COYNE
20 A CARTOON HISTORY OF MICROBIOLOGY, COYNE
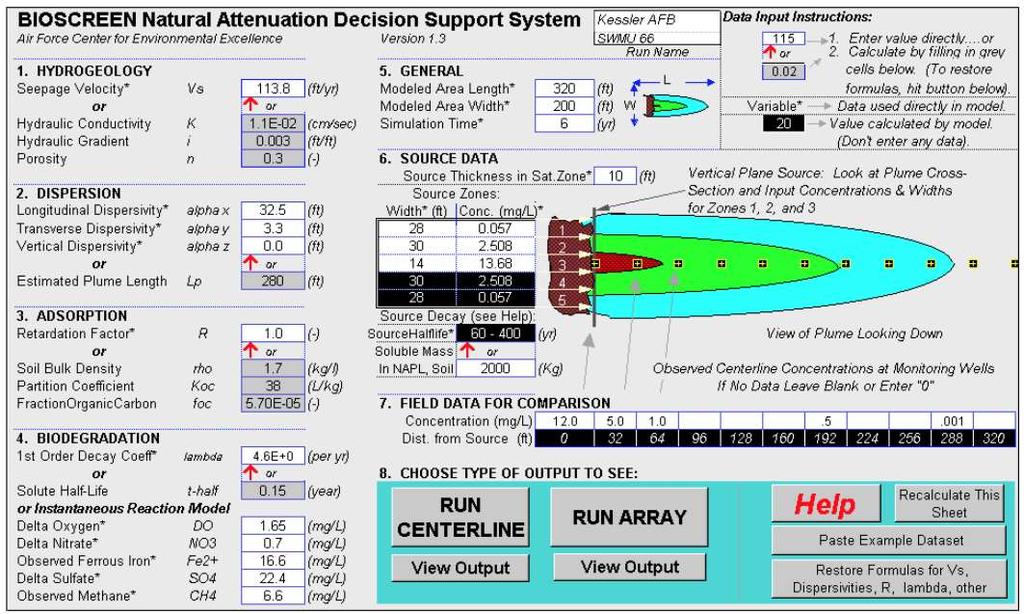
21 KESSLER AIR FORCE BASE Back Bay of Biloxi N SWMU 66 I-110 U.S. 90 Gulf of Mexico 21
22 DISSOLVED OXYGEN IN GROUNDWATER Supports Natural Attenuation: Benzene Plume Yes No Inconclusive T-1 MW T MW T T-11 T T T-7 T MW Dissolved Oxygen (mg/l) MW T MW9-4 LOW HIGH
23 FERROUS IRON IN GROUNDWATER Supports Natural Attenuation: Yes No Inconclusive MW Benzene Plume MW MW T T T T T T Ferrous Iron (mg/l) T MW T MW LOW HIGH 23
24 SULFATE IN GROUNDWATER Supports Natural Attenuation: Yes No Inconclusive MW Benzene Plume MW T MW T T T T T Sulfate (mg/l) T MW T-3 11 MW LOW HIGH 24
25 METHANE IN GROUNDWATER Supports Natural Attenuation: Benzene Plume Yes No Inconclusive MW MW9-1 ND MW T T T T T T Methane (mg/l) T MW T-3 2 MW9-4 ND LOW HIGH 25
26 EVALUTING MNA IN PLUMES: Electron Acceptor Limited Degradation Biodegradation Capacity ( 17 mg/l) Source Zone Concentration (25 mg/l) Reaction time: Days-weeks Residence time: Months/years Reactions behave Instantaneous ZAP! Observed Source Zone Concentration (8 mg/l) Groundwater Flow 11
27 MNA Protocol for Dissolved Contaminant from Fuels Draft: 1994 Final:

28 Jan
29 Percent of Plumes in Length Category 40 % 35 % 37 % Length of Dissolved BTEX Plumes Most Petroleum Hydrocarbon Plumes Are Under 200 ft Long 30 % 20 % 14% 4.9% 0.5% 0.3% 1.9% 10 % 0 % 200 ft 400 ft 600 ft 800 ft 2.1% 1.3% 0.5% Plume Length (ft) 1000 ft
30 PLUME LENGTH Percent of Plumes in California That Are: Expanding (I) Stable (II) Shrinking (III) Exhausted (IV) I II III IV 8 % 42 % 33 % 17 % 30
31 SCHEMATIC OF PLUME LIFECYCLE I. EXPANDING II. STABLE III. SHRINKING IV. EXHAUSTED TIME 11
32 CHLORINATED SOLVENT REDUCTIVE DECHLORINATION Carbon Source Fermentation Dissolved Hydrogen Is Key Electron Donor For Reductive Dechlorination of Chlorinated Solvents By-Products H 2 CO 2 PCE Ethene CH 4 H 2 O 32

33 33
34 WHAT ARE NATURAL ATTENUATION PROCESSES? US Environmental Protection Agency MNA Directive (1999) A variety of physical, chemical, or biological processes that, under favorable conditions, act without human intervention to reduce the mass, toxicity, mobility, or concentration of contaminants in soil and groundwater. MASS TOXICITY MOBILITY CONC. 11
35 WHAT ARE NATURAL ATTENUATION PROCESSES? Reduction in contaminant mass or concentration in groundwater over time or distance due to natural processes: Natural Shrinking of GW Plume Over Time NON-DESTRUCTIVE PROCESSES Dispersion Sorption k d = (K oc )*(foc) Dilution Volatilization DESTRUCTIVE PROCESSES Biodegradation O 2 Fe +2 NO 3 CH 4 SO 4 Hydrocarbon CO 2 Abiotic Reactions (hydrolysis) 11


36 WHAT IS THE PHILOSOPHY BEHIND MNA? Nature can help! It is harder and more expensive to clean these sites up than first thought. Nature is amazing and seems to be degrading or sequestering some of these chemicals. Let s let nature do the job. But you have to do three things: Protect Understand Watch 36
37 WHAT EVIDENCE IS NEEDED FOR MNA? New Trends in LOEs LOE 2: Hydrogeologic or geochemical data LOE 1: Historical contaminant mass reduction LOE: Lines of Evidence LOE 3: Microcosm or Field data 37
38 WHAT EVIDENCE IS NEEDED FOR MNA? New Trends in LOEs LOE 2: Hydrogeologic or geochemical data LOE 1: Historical contaminant mass reduction I Shrink Therefore I Am LOE: Lines of Evidence LOE 3: Microcosm or Field data 38
39 WHAT EVIDENCE IS NEEDED FOR MNA? New Trends in LOEs LOE 2: Hydrogeologic or geochemical data Am I Swampy LOE 1: Historical contaminant mass reduction I Shrink Therefore I Am LOE: Lines of Evidence LOE 3: Microcosm or Field data 39


40 WHAT EVIDENCE IS NEEDED FOR MNA? New Trends in LOEs LOE 2: Hydrogeologic or geochemical data Am I Swampy LOE 1: Historical contaminant mass reduction I Shrink Therefore I Am LOE: Lines of Evidence LOE 3: Microcosm or Field data Put on the Lab Coat 40
41 WHAT ARE THE MOST IMPORTANT NEW MNA DEVELOPMENTS? Year New Contaminant MTBE-TBA Two types of rates Source attenuation of hydrocarbon sites Metals-Rads New Measurement Compound- Specific Isotopes Molecular Biological Tools New Process Biogeochemical/ abiotic trans. of chlor. solvents Matrix diffusion Oxidation of chlor. solvents at low DO New Tools BIOChlor MAROS NAS SourceDK REMChlor Mass flux toolkit BIOBALANCE Scenarios for chlor. solvents MNA Sustainability Probably the most important recent development? 41
42 WHAT ARE THE MOST IMPORTANT NEW MNA DEVELOPMENTS? Year New Contaminant New Measurement New Process New Tools present Emerging Contaminants Matrix Diffusion Toolkit USER S MANUAL Version 1.0 September 2012 CO 2 traps for NSZD Natural source zone depletion (NSZD) Source attenuation of chlorinated solvent sites Attenuation in low-k zones PREMChlor Matrix Diffusion Toolkit Scenarios for metals/rads Source History Tool See Also: ESTCP ER Development and Validation of a Quantitative Framework and Management Expectation Tool for the Selection of Bioremediation Approaches (MNA, Biostimulation and/or Bioaugmentation) at Chlorinated Solvent Sites 42


43 SOME KEY REFERENCES Google: ESTCP MNA FAQ
44 44
45 ROAD MAP Intro: Changing Paradigms and MNA Principles Key Attenuation Processes Biodegradation Abiotic Processes LNAPL source zone degradation processes Other processes (immobilization, storage, dilution) Field Techniques and Technologies Groundwater sampling and analytical methods Compound Specific Isotopes Analysis (CSIA) Molecular Biological Tools (MBTs) Natural Source Zone Depletion (NSZD) Should MNA be Used? Data Analysis and Monitoring Tools Data requirements, LTM, and statistics to understand MNA rates Common Graphics and Calculations Remediation Timeframe Calculations Computer Models Implementation Topics


46 BIODEGRADATION PROCESSES It s all about the electrons PETROLEUM HYDROCARBONS: typically serve as electron donors, so you may need more electron acceptor (but not always) CHLORINATED SOLVENTS: typically serve as electron acceptors, so you may need electron donor Important Concepts: biodegradation capacity and mass balances
47 BIODEGRADATION OF PETROLEUM HYDROCARBONS C 6 H 6 Benzene (oxidized) O 2 Oxygen (reduced) Electrons Work Carbon dioxide CO 2 Heat Water H 2 O
48 AEROBIC HYDROCARBON BIODEGRADATION Highly thermodynamically feasible (it s a fuel ) Hydroxylation (i.e., addition of OH) is often the first step Increases solubility (more susceptible to metabolism) Needs oxygenases (i.e., enzymes that activate O 2 and add it to the hydrocarbon molecule.) Needs O 2 whose diffusion may be rate-limiting Aromatic ring must be di-hydroxylated before fission
49 ANAEROBIC HYDROCARBON BIODEGRADATION Important natural attenuation mechanism, but tends to occur at slower rates (weaker electron acceptors, NO 3-, Fe +3, SO 4-2, and CO 2 ) Benzene, the most toxic of the BTEX, is relatively recalcitrant under anaerobic conditions (degrades very slowly after TEX, or not at all) Benzoyl-CoA is a common intermediate, and it is reduced prior to ring fission by hydrolysis (CO 2 is still the endproduct). Toluene Benzoyl-CoA
50 HYDROCARBON BIODEGRADATION: Thermodynamic perspective Electron Acceptor Type of Reaction Metabolic By-Product Redox Potential (ph =7 in volts) Reaction Preference Oxygen Aerobic CO Most Preferred Nitrate Anaerobic N 2, CO Ferric Iron (solid) Anaerobic Ferrous Iron (dissolved) - 50 Sulfate Anaerobic H 2 S Carbon Dioxide Anaerobic Methane Least Preferred
51 HYDROCARBON BIODEGRADATION: Use stoichiometry to estimate biodegradation capacity Electron Acceptor or By-Product Utilization Factor * ( Mass E. Acceptor / By-Prod. Consumed per Mass Dissolved Hydrocarbon Degraded ) Oxygen Nitrate Ferrous Iron Sulfate Methane 3.14 gm/gm 4.9 gm/gm 21.8 gm/gm 4.6 gm/gm 0.78 gm/gm * Based on BTEX
52 HYDROCARBON BIODEGRADATION: Use stoichiometry to estimate biodegradation capacity EXAMPLE OF HOW TO CALCULATE UTILIZATION FACTOR: C 6 H O 2 6 CO H 2 O Benzene MW = 78 g/mol Oxygen MW = 32 g/mol Mass Ratio = or Utilization Factor Oxygen Mass Benzene Mass 32 g / mol x 7.5 mol = = g / mol x 1 mol
53 HYDROCARBON BIODEGRADATION: Biodegradation capacity example CONCENTRATIONS (mg/l) D.O. NO 3 Iron SO 4 CH 4 Background Source Utilization Factor BIODEG. CAPAC Sum to get Expressed Biodegradation Capacity = 16.7 mg/l BTEX
 Electrons Work Hydrogen Ion (Proton) H + Heat Ethene C 2 H")
54 BIODEGRADATION OF CHLORINATED SOLVENTS (ANAEROBIC REDUCTIVE DECHLORINATION) H 2 Hydrogen (electron donor) C 2 HCl 4 Tetrachloroethene (electron acceptor) Electrons Work Hydrogen Ion (Proton) H + Heat Ethene C 2 H 4
55 CHLORINATED SOLVENT REDUCTIVE DECHLORINATION: Electron Donors Are Key Carbon Source Fermentation Dissolved Hydrogen Is Key Electron Donor By-Products CO 2 H 2 PCE Process requires multiple microbial groups and anaerobic conditions Ethene CH 4 H 2 O 55
56 REDUCTIVE DECHLORINATION: Thermodynamic perspective Competing Electron Acceptors Dissolved Oxygen Nitrate Ferric Iron Chlorinated Solvent Sulfate Methanogens H 2 O N 2 Ferrous Iron Daughter Product H 2 S Methane Thermodynamics means that strongly reducing conditions are required High energy reactions are favored Hydrogen will be used first by aerobes and denitrifying bacteria
57 REDUCTIVE DECHLORINATION: Chlorinated Ethenes Key footprint of PCE, TCE biodegradation: presence of cis 1,2-DCE
58 REDUCTIVE DECHLORINATION: Pathway for Chlorinated Ethenes Key footprint of PCE, TCE, cis- 1,2-DCE, VC biodegradation: presence of ethene (or ethane) (Adapted from RTDF, 1997.)
59 ABIOTIC PROCESSES: How do reactive mineral species contribute to attenuation? Naturally-occurring minerals can degrade contaminants CVOC degradation that is abiotically-mediated by a number of reactive mineral species Iron(II) Sulfide (FeS) Mackinawite (Fe 1+x S ) Pyrite (FeS 2 ) Magnetite (Fe 3 O 4 ) Goethite (α-feo(oh)) Hematite (Fe 2 O 3 ) Lepidocrocite (γ-feo(oh)) Green Rust--(Fe 2+ and Fe 3+ cations, O 2- and OH - anions, with loosely bound [CO 3 ] 2- groups and H 2 O molecules between the layers) Basis for ZVI and other PRB designs, but significant evidence of natural attenuation in anaerobic environments Example of abiotic TCE degradation by magnetite (from ESTCP/AFCEE/NAVFAC, 2007) Note there is biological component to these reactions! 59
60 ABIOTIC PROCESSES: Unique degradation products when reactive minerals are involved TCE Chloroacetylene Acetylene UNIQUE PRODUCTS: If either detected, then this is proof that abiotic attenuation is occurring! EASIER SAID THAN DONE Products are biodegradable (in situ and following sample collection) Highly volatile Concentration may be low and hard to quantify KEY POINT: FALSE NEGATIVES ARE BIG ISSUE Compounds may be almost gone by the time the sample reaches the lab, and lab may not be able to measure what s left
 YES Iron sulfides Magnetite Green rust Petroleum hydrocarbons (BTEX, MTBE) 1,4-dioxane 1,2,3-trichloropropane PFAS (per- and polyfluorinated alkyl substances)")
61 ABIOTIC PROCESSES: Which contaminants and which minerals? Iron sulfides Magnetite Green rust Chlorinated Solvents YES YES YES Pesticides YES Munitions (RDX) YES? YES Metals (U, As) YES Iron sulfides Magnetite Green rust Petroleum hydrocarbons (BTEX, MTBE) 1,4-dioxane 1,2,3-trichloropropane PFAS (per- and polyfluorinated alkyl substances) N-nitrosodimethylamine (NDMA) Minor Maybe? 61
62 ABIOTIC PROCESSES: Hydrolysis 1,1,1-TCA Acetic Acid HYDROLYSIS Product Yield = 80% DEHYDROHALOGENATION 1,1-Dichloroethene Product Yield = 20% TCA half-lives for HYDROLYSIS: ~ 1 10 yr
63 ABIOTIC PROCESSES: Which contaminants undergo hydrolysis? Target compound(s) Undergoes hydrolysis-type reactions? Product(s) 1,1,1-TCA YES Acetic acid, 1,1-DCE 1,1,1,2-TeCA YES TCE 1,2-Dichloropropane YES 1-Chloropropene Chloroethane YES Ethanol, ethene Carbon Tetrachloride YES CO2 1,1-DCA YES Chloroethene 1,2-DCA YES Chloroethene

64 ABIOTIC PROCESSES: How to assess? Methods for assessing abiotic degradation capacity are available and/or being developed E.g., magnetite in sediments via magnetic susceptibility testing Current research suggests slow but sustainable attenuation rates EPA, 2009 detailed descriptions of important methods 64
65 LNAPL SOURCE ZONE DEGRADATION: Methane production results in ebullition Methane bubbles! Day 100 Day 102 Methane channel! Day 106 Day 113 Source: CSU Source: Ye et al., 2009 Water Saturation 65


66 Starting Point: Refinery and Terminal Petroleum Spills Generate Methane from Biodegradation Methane bubbles! Day 100 Day 102 Methane channel! Day 106 Day 113 Source: CSU Source: Ye et al., 2009 Water Saturation 66


67 Groundwater Mass Flux vs. Vapor Phase Mass Flux 1-10% Surprising Result: Vapor transport fluxes much greater than groundwater fluxes! 90-99% ITRC, 2009; Suthersan

68 Carbon Eflux Key Process at LNAPL Sites Bemidji, MN Crude Oil Spill (1979) Key Point 1: Natural Degradation Occurring >30 Years Later Key Point 2: 85-90% of the carbon biodegradation products outgassed! 1000 gallons per acre per year 68

69 Current NSZD Conceptual Model CO 2 flux at Ground Surface CO 2 O 2 Methane Oxidation CO 2 CH 4 Mobile or Residual LNAPL CO 2 CH 4 Groundwater Dissolved Phase Plume Adapted from: CSU,
70 70
71 ROAD MAP Intro: Changing Paradigms and MNA Principles Key Attenuation Processes Biodegradation Abiotic Processes LNAPL source zone degradation processes Other processes (immobilization, storage, dilution) Field Techniques and Technologies Groundwater sampling and analytical methods Compound Specific Isotopes Analysis (CSIA) Molecular Biological Tools (MBTs) Natural Source Zone Depletion (NSZD) Should MNA be Used? Data Analysis and Monitoring Tools Data requirements, LTM, and statistics to understand MNA rates Common Graphics and Calculations Remediation Timeframe Calculations Computer Models Implementation Topics

 Diffusion coefficient (meter 2 /")
72 CONTAMINANT STORAGE: WHAT IS DIFFUSION? Diffusion describes the spread of particles through random motion from regions of higher concentration to regions of lower concentration. Key people: Fourier (1822), Fick (1855), Einstein (1905), Smoluchowski (1906) J = D dc dx Coffee Cup: Laminar Groundwater: convection + diffusion J = D = dc dx Diffusive flux flowing though a particular cross section (mg/ meter 2 / sec) Diffusion coefficient (meter 2 / sec) = Concentration gradient (mg / liter / meter) Molecular diffusion - movement of molecules only 72

73 MATRIX DIFFUSION AS CONTAMINANT STORAGE After NRC


74 KEY POINT: Matrix Diffusion is a Small- Scale Phenomena Contaminant storage and release processes in low permeability zone is important, but it is governed by concentrations gradients that occur at scales of centimeters to millimeters. A B 84 cm D C 107 cm Day 28 74
75 75
76 Connecticut Site Source Zone Groundwater Flow Transect 1 Chapman and Parker WRR 2005 Image Courtesy of B. Parker 500 ft 76
 Aquitard 25")
77 HIGH-RESOLUTION DATA FROM CORE Distance (m from Interface) Chapman and Parker 2005 Image Courtesy of B. Parker Aquifer Interface Aquifer [cm] -2 Aquitard TCE (mg/l) Aquitard 25 77

78 Connecticut Site Source Zone 3000 kg TCE present in low-perm zone! Groundwater Flow Chapman and Parker WRR 2005 Image Courtesy of B. Parker 500 ft 78

79 CONCENTRATION VS. TIME FROM MONITORING WELLS With Tailing If No Tailing Source: Chapman and Parker, 2005 Copyright 2005 American Geophysical Union. Reproduced/modified by permission of AGU. 79
80 LIFE CYCLE OF A CHLORINATED SOLVENT SITE Late Stage Sale et al.,

81 TYPE SETTING After NRC

 Fred Payne, Joseph Quinnan, Scott")
82 HETEROGENEITY RULES, EVEN IN SANDY AQUIFERS Matrix Diffusion Paradigm: Image from Fred Payne /ARCADIS Remediation Hydraulics (CRC Press) Fred Payne, Joseph Quinnan, Scott Potter 82
83 REMCHLOR-MD MATRIX DIFFUSION MODEL: Game Changer? Aquifer/Aquitard System Layered System a) b) transmissive zone low permeability confining layer low permeability layers transmissive zones low permeability confining layer c) Heterogeneous System 3D Fractured Porous Media d) transmissive zone low permeability confining layer For REMChlor: google REMChlor USEPA FOR REMChlor-MD: check Jan
84 DILUTION AS AN ATTENUATION PROCESS Soil-to-GW Pathway ( GW SOIL): Leachate Dilution Factor (LDF) GW Darcy Velocity GW mixing zone thickness I f LDF = 1 + U gw d gw I f W s W s U gw d gw Net infiltration Width of affected soil in direction of GW flow Leachate-GW mixing zone b gw d gw = (2a v W s ) b gw 1-exp -I f W s U gw b gw Must use this equation in Tier 2. (Tier 1 PCLs based on default LDF of 10 or 20.) Vertical groundwater dispersivity Aquifer thickness
85 DILUTION AS AN ATTENUATION PROCESS Groundwater to Surface Water Pathway ( SW GW) Plan View Q sw SW GW = SW RBEL groundwater plume Qigw receiving stream W igw DF Mixing zone where DF = Dilution factor for affected GW entering SW. Cross Section SW GW SW RBEL SW RBEL = Lowest applicable value for COC per (h). GW plume groundwater GW = Groundwater


86 Slides courtesy Fred Payne, Arcadis DILUTION VS. DISPERSION AS AN ATTENUATION PROCESS Emerging Conceptual Model: Dispersion is very weak process Most plumes are long and narrow Matrix Diffusion is much more important than dispersion
87 87 Dilution in Mass Flux Calculations Concentration versus Mass Discharge Site A: Site B: Very wide source Tiny source Very fast groundwater Almost stagnant groundwater But same maximum groundwater Concentration
88 88 Dilution in Mass Flux Calcuations Concentration versus Mass Discharge Concentration-based approach may not account for important site characteristics But same maximum groundwater Concentration Mega Site Piss-Ant Site
 This plume has a mass discharge of 1.5 grams per day.")
89 89 Definitions Mass flux, J (mass per area per time) Integrate Mass discharge, M d (Mass per time) This plume has a mass discharge of 1.5 grams per day. Sir Isaac Newton: Method of Fluxions

90 90 Mass Flux / Mass Discharge Combine flow, size, concentration to get grams per day (mass discharge)


91 91 Using Mass Discharge: Estimating Well Impacts Einarson and Mackay, 2001 Use mass discharge of plume to predict constituent of concern concentration in downgradient water supply well Source zone Clean water Clean water Capture zone M d = 2 grams/day Extraction well C well = M d Q Well Q w = 600 gpm C well = Concentration in extraction well Q well = Pumping rate for extraction well Clean water 2 grams day 1 x day 1 gal 10 x 6 ug x = < 1 ug /L 3.79 L g 600 gpm 1440 min
 EXAMPLES: PCBs into Susquehanna River (Penn.): 0.")
92 MANAGING SURFACE WATER QUALITY WITH MASS DISCHARGE: Total Maximum Daily Loads (TMDL) The maximum amount of a pollutant that a water body or water segment can assimilate without exceeding water quality standards. (1972 CWA) EXAMPLES: PCBs into Susquehanna River (Penn.): 0.64 grams per day (our Mag 4) Copper into Eagle River (Alaska): up to 5450 grams per day (our Mag 8) Proposed Dioxin into Houston Ship Channel 0.04 grams per day (our Mag 3)


93 93


94 94
95 PLUME MAGNITUDE CLASSIFICATION SYSTEM Mass Discharge (grams/day) Plume Category < Mag 1 Plume to 0.01 Mag 2 Plume 0.01 to 0.1 Mag 3 Plume 0.1 to 1 Mag 4 Plume 1 to 10 Mag 5 Plume 10 to 100 Mag 6 Plume 100 to 1,000 Mag 7 Plume 1,000 to 10,000 Mag 8 Plume 10,000 to 100,000 Mag 9 Plume >100,000 Mag 10 Plume Newell et al., 2011
96 96
97 ROAD MAP Intro: Changing Paradigms and MNA Principles Key Attenuation Processes Biodegradation Abiotic Processes LNAPL source zone degradation processes Other processes (immobilization, storage, dilution) Field Techniques and Technologies Groundwater sampling and analytical methods Compound Specific Isotopes Analysis (CSIA) Molecular Biological Tools (MBTs) Natural Source Zone Depletion (NSZD) Should MNA be Used? Data Analysis and Monitoring Tools Data requirements, LTM, and statistics to understand MNA rates Common Graphics and Calculations Remediation Timeframe Calculations Computer Models Implementation Topics

 Characterization/")
98 MNA MONITORING 1 Line of Evidence 1 Line of Evidence 2 Line of Evidence 3 Decreasing historical trends in concentration/mass Favorable geochemical and daughter product data Microcosm or field data showing degradation is occurring (and rate) Characterization/ Remedy Selection
99 CHARACTERIZATION/REMEDY SELECTION: Gathering Better Lines of Evidence MNA MONITORING Increasingly reliant on new techniques: 1 Molecular Biological Tools (MBTs) Compound Specific Isotope Analysis (CSIA) Natural Source Zone Depletion (NSZD) Mass discharge We ll talk more about these in a minute Characterization/ Remedy Selection

100 PERFORMANCE MONITORING: Proving that MNA is working MNA MONITORING 2 1 Performance Monitoring USEPA, 2004 Characterization/ Remedy Selection
101 OBJECTIVES OF LONG-TERM PERFORMANCE MONITORING Objectives Demonstrate that natural attenuation is occurring Detect changes in conditions that reduce attenuation efficiency Identify toxic/mobile by-products Verify that plume is not expanding Verify no impact to downgradient receptors Detect new releases Confirm institutional controls are working Verify attainment of remedial objectives Site-specific REMEDIAL ACTION OBJECTIVES (RAOs) PRELIMINARY REMEDIATION GOALS (PRGs) Primarily based on sampling groundwater from monitoring wells 101
102 Plume transects w/ side gradient wells 4 4 Downgradient transect 5 Upgradient Areas 1 Source Area (and recalcitrant zones) 2 High concentration plume core Low concentration plume fringe 3 4 Plume boundaries Groundwater Flow Direction GOALS: Assess attenuation rates Monitor plume expansion or shrinkage at downgradient locations or transects Confirm no risk to receptor(s) Establish background, monitor for change in conditions or new releases
103 TYPICAL ANALYTES FOR LONG-TERM PERFORMANCE MONITORING Constituents of Concern Transformation products: daughters products, metals (e.g., Cr, As) Geochemical indicators: oxidationreduction potential, ph, temperature, methane, sulfate, iron, nitrate Others: water level, isotopes, biomarkers, minerals

104 ISOTOPE ANALYSIS: Can they prove contaminants are being destroyed? Yes, and more Stable isotope analyses can provide unequivocal documentation that biodegradation or abiotic transformation processes actually destroyed the contaminant. USEPA,
105 WHAT ARE STABLE ISOTOPES? 12 C 13 C LIGHT HEAVY 6 neutrons + 6 protons 7 neutrons + 6 protons Abundance = 98.9% Abundance = 1.1% 14 C is subject to radioactive decay and not considered stable
106 WHAT ARE COMPOUND-SPECIFIC STABLE ISOTOPES? PCE Cl 12 C 12 C Cl Cl 12 C 13 C Cl Cl Cl H Cl Cl Lighter isotopes are degraded preferentially (more rapidly) Degradation causes remaining PCE to become enriched in heavier isotope Process is called FRACTIONATION the isotopic ratio is changing due to degradation
107 HOW DO YOU EXPRESS ISOTOPIC DATA? Ratio = R = ( heavy ) / ( light ) e.g., ( 13 C) measured in TCE e.g., ( 12 C) measured in TCE δ TCE = del = (R TCE - R std )/(R std )*1000 Units are per mil or
108 HOW TO USE CSIA: Evidence for degradation of parent compound Increased Fractionation ( Heavier ) δ 13 C ( ) δ parent Need > 2 for to confirm C fractionation (EPA, 2008) δ 0 Reflects extent of parent degradation -30 δ 0-35 Time (or Distance)
109 HOW TO USE CSIA: Evidence for degradation of daughter compound Increased Fractionation ( Heavier ) δ 13 C ( ) δ parent -20 δ daughter δ 0, parent DEGRADATION OF DAUGHTER PRODUCT: δ daughter exceeds δ 0,parent as C parent approaches 0 Time (or Distance)
110 KEY BENEFITS OF CSIA Demonstrating that parent compound is being degraded Estimating the extent of degradation Differentiating between destructive and non-destructive pathways Differentiating between various destructive pathways Demonstrating that complete degradation has occurred Estimating rate of degradation Source identification and differentiation Can be incorporated into reactive transport modeling carbon ( 13 C/ 12 C) oxygen ( 18 O/ 16 O) nitrogen ( 15 N/ 14 N) chlorine ( 37 Cl/ 35 Cl) hydrogen ( 2 H/ 1 H) Easy protocol: collect groundwater from monitoring wells and send to lab 110
 3.")
111 MOLECULAR BIOLOGICAL TOOLS: Can they prove contaminants are being destroyed? MBTs provide strong, but not definitive evidence of MNA 1. Show that key organisms are present (e.g., Dehalococcoides, Dehalobacter) 2. Show that key enzymes are present (e.g., vcra, oxygenase-encoding genes) 3. Establish relative abundance of key microbial populations Our friend, Dehalococcoides (Apkarian and Taylor) KEY ISSUE: Most tests focus on presence, not activity! 111
112 MOLECULAR BIOLOGICAL TOOLS: How can they help me with MNA? MOST POPULAR? Evaluating chlorinated solvent degradation using PCR-based methods for tracking Dehalococcoides (Dhc) Tools MNA Application MNA Limitations PCR / qpcr Identify if key organisms / enzymes Many techniques cannot differentiate between live and inactive cells Determine if abundance of key biomarkers is increasing Attempts to correlate in situ activity and gene expression still in infancy Target mostly well-known pathways (others in development) Others: Stable Isotope Probing (SIP), microbial fingerprinting, microarrays, enzyme activity probes 112
113 MOLECULAR BIOLOGICAL TOOLS: How to collect and use the data? Groundwater or Soil using established procedures starting at about $200 per sample/target) Quantitative Rules for MNA. Specific recommendations for MNA Lu et al., 2006: generally useful attenuation rates of cis-1,2-dce and VC (> 0.3/yr) were associated with sites where Dhc was detected, while no attenuation was observed at sites where it was absent Dhc at 10 4 to 10 6 gene copies/l can support MNA Dhc at > 10 6 gene copies/l is the target threshold for ensuring ethene production Guidance also included in BioPIC discussed later in this presentation 113

114 STABLE ISOTOPE PROBING: Combo method that s increasingly being used for MNA TYPICAL APPLICATION: Passive microbial sampling devices, e.g., BioTraps, are installed in monitoring well for 30 days or more Graphic courtesy of Microbial Insights:
 2.Characterize flow (q) 3.")
 5.Multiply and sum together: M d = Σ (C n A n q) < 0.5 ug/l CROSS-SECTION W 4 W 3 W 2 W 1 45 ug/l 74 ug/l < 0.")
115 115 Calculating Mass Discharge: Transect Method Simple Example Step-by-step approach assuming uniform groundwater velocity Nichols and Roth, Characterize plume (C) 2.Characterize flow (q) 3.Draw transect: with simple approach, just build crosssectional polygons ( window panes ) for each well across flow 4.Determine area (W b = A) 5.Multiply and sum together: M d = Σ (C n A n q) < 0.5 ug/l CROSS-SECTION W 4 W 3 W 2 W 1 45 ug/l 74 ug/l < 0.5 ug/l M d = Mass discharge C n = concentration in polygon n A n = Area of segment n b Polygon 1 Width Polygon 2 Width

116 116 Tools for Transect Method: Calculator Lead author: Shahla Farhat, Ph.D. free at Microsoft Excel-based

117 117

 K 0 K>>K 0 t 1 t 2 t 3 Source: Hatfield and")
118 118 Method 3 Passive Flux Meter Permeable sorbent Accumulates contaminant based on flow and concentration Soluble tracers Loses tracer based on groundwater velocity and flux convergence calculations 1. Contaminant adsorbed onto passive flux meter over time to get Concentration Photo: Dye intercepted in a meter 2. Tracer desorbs from passive flux meter over time to get Flow (Q) K 0 K>>K 0 t 1 t 2 t 3 Source: Hatfield and Annable Groundwater Flowlines
119 CURRENT NATURAL SOURCE NSZD CONCEPTUAL MODEL CO 2 flux at Ground Surface CO 2 O 2 Heat Methane Oxidation CO 2 CH 4 Heat Mobile or Residual LNAPL CO 2 CH 4 Groundwater Dissolved Phase Plume Adapted from: CSU,
120 CURRENT NATURAL SOURCE NSZD CONCEPTUAL MODEL CO 2 CO 2 flux at Ground Surface O 2 CO 2 Flux Measurement at Surface Methane Oxidation Measure Inward Diffusion of Oxygen CO 2 CH 4 Mobile or Residual LNAPL CO 2 CH 4 Groundwater Dissolved Phase Plume Adapted from: CSU,

121 NSZD STUDIES: Johnson et al, 2006; Lundegard and Johnson, 2006; Sihota et al., 2011; McCoy et al., 2013 Oxygen CO 2 Methane Lundegard and Johnson,

122
 Refinery/Terminal Sites in Los Angeles (LA LNAPL Wkgrp, 2015) Five Fuel/Diesel/Gasoline Sites (Piontek, 2014) Eleven Sites, 550 measurements (Palia, 2016) Site-wide NSZD Rate (gallons/ acre")
123 WHAT NSZD RATES ARE BEING OBSERVED? NSZD Study Six refinery terminal sites (McCoy et al., 2012) 1979 Crude Oil Spill (Sihota et al., 2011) Refinery/Terminal Sites in Los Angeles (LA LNAPL Wkgrp, 2015) Five Fuel/Diesel/Gasoline Sites (Piontek, 2014) Eleven Sites, 550 measurements (Palia, 2016) Site-wide NSZD Rate (gallons/ acre /year) 2,100 7,700 1,600 1,100 1, , ,600 (median: 700) Locations across U.S. where carbon traps have been used to measure NSZD rates (E-Flux, 2015). KEY POINT: Measured NSZD rates in the 100s to 1000s of gallons per acre per year. 123
124 CURRENT NATURAL SOURCE NSZD CONCEPTUAL MODEL CO 2 CO 2 flux at Ground Surface O 2 Heat CO 2 Flux Measurement at Surface Methane Oxidation CO 2 CH 4 Mobile or Residual LNAPL Heat Measure Inward Diffusion of Oxygen CO 2 CH 4 Subsurface Temperature Measurement Groundwater Dissolved Phase Plume Adapted from: CSU,
125 HEAT RELEASED FROM BIODEGRADATION Key Objective: Use heat released from biodegradation to calculate continuous estimates of NSZD rates. 125


126 CONCEPTUAL MODEL Source: CSU 126

127 FIELD INSTALLATION: Thermal Monitoring System Source: CSU 127

128 FIELD INSTALLATION: Thermal Monitoring System Thermocouple on temperature monitoring stick Source: CSU Installation of stick using direct push rig. Solar power supply and weatherproof box with data logger and wireless communications system. 128
 in vadose zone, not by the methane generation")
129 Background on Corrected Temperature (Stockwell, 2015 Colorado State) Most of heat released by methane oxidation (conversion to CO 2 ) in vadose zone, not by the methane generation itself

130 HEAT SIGNAL OVER TIME: Kansas Tank Farm Source: Stockwell, 2015; Colorado State University

131 THERMAL NSZD DASHBOARD 131
132 THERMAL NSZD DASHBOARD: Cumulative Sitewide NSZD Updated Daily 132
133 133
134 ROAD MAP Intro: Changing Paradigms and MNA Principles Key Attenuation Processes Biodegradation Abiotic Processes LNAPL source zone degradation processes Other processes (immobilization, storage, dilution) Field Techniques and Technologies Groundwater sampling and analytical methods Compound Specific Isotopes Analysis (CSIA) Molecular Biological Tools (MBTs) Natural Source Zone Depletion (NSZD) Should MNA be Used? Data Analysis and Monitoring Tools Data requirements, LTM, and statistics to understand MNA rates Common Graphics and Calculations Remediation Timeframe Calculations Computer Models Implementation Topics


135 WHY DO WE NEED TREND ANALYSIS? Answers important questions! Short-term variability can make this challenging, so need statistical methods Linear regression has limitations Source: McHugh et al., 2015
136 Ln (Concentration) LONG-TERM ATTENUATION RATES VS. SHORT- TERM VARIABILITY Long-term attenuation rate MW-1 KEY POINTS: Short-term variability makes it harder to determine trend and increases the amount of monitoring needed to evaluate progress in remediation Long-term trend apparent over longer monitoring period Time Short-term variability 136
137 Ln (Concentration) WHY SHOULD WE USE MANN-KENDALL FOR TREND ANALYSIS? Reporting Limit? Mann-Kendall only cares about relative magnitudes of the concentrations, not the actual concentrations Easier to establish trend even with a modest slope Non-detects are more easily handled Simple method can use existing software tools Time 137
138 HOW DO YOU PERFORM MANN-KENDALL ANALYSIS? S Statistic (S) Confidence Factor (CF) Coefficient of Variation (COV) CALCULATE 3 DIFFERENT METRICS Test statistic; indicates if trend is increasing (positive S) or decreasing (negative S) Reflects degree of confidence in result; equivalent to (1-p) Reflects variability in concentration vs. t data; used to distinguish between stable and no trend For description of how each are calculated, see User s Guide for Mann-Kendall Toolkit (GSI, 2012): Also see MAROS (
139 HOW DO YOU PERFORM MANN-KENDALL ANALYSIS? S Statistic Confidence in Trend S > 0 CF > 95% S > 0 95% CF 90% S > 0 CF < 90% S 0 CF < 90% and COV 1 S 0 CF < 90% and COV < 1 S < 0 95% CF 90% S < 0 CF > 95% 2 other options: ND = locations w/ all non-detect values N/A = locations w/ < 4 datapoints Trend Increasing Probably Increasing No Trend No Trend Stable Probably Decreasing Decreasing
140 Ln(Concentration) HOW DOES MONITORING FREQUENCY AFFECT CONFIDENCE AND ACCURACY OF THE RATE? Eight Semiannual Monitoring Events MW-1 Increasing the time between monitoring events will increase the CONFIDENCE and ACCURACY of your long-term attenuation rate But by how much? Clean-up Goal Time (Years) 140
141 HOW MUCH DATA IS NEEDED TO DEFINE TREND WITH CONFIDENCE AND ACCURACY? Accuracy/Confidence Cost Medium Confidence: Statistically-significant; decreasing concentration trend (p <.1) for 80% of monitoring wells Medium Accuracy: Determine the long-term attenuation rate with an accuracy (i.e., 95% confidence interval) of +/- 50% or +/- 0.1 yr -1 (whichever is larger) for 80% of monitoring wells 20 sites were examined to see how much data was needed to meet these thresholds
142 HOW MUCH DATA IS NEEDED TO DEFINE TREND WITH CONFIDENCE AND ACCURACY? Accuracy/Confidence Cost Medium Confidence: Statistically-significant; decreasing concentration trend (p <.1) for 80% of monitoring wells Best Site 2.8 years Median Site 7.3 years Worst Site 30 years Medium Accuracy: Determine the long-term attenuation rate with an accuracy (i.e., 95% confidence interval) of +/- 50% or +/- 0.1 yr -1 (whichever is larger) for 80% of monitoring wells 4.0 years 7.4 years 14.5 years
143 HOW MUCH DATA IS NEEDED TO DEFINE TREND WITH CONFIDENCE AND ACCURACY? 1) It commonly takes seven years or more of quarterly monitoring data to characterize the attenuation rate with even a medium level of accuracy (i.e., +/- 50%). 2) Making decisions (e.g., remedy effectiveness; remediation timeframe) based on insufficient data can result in incorrect decisions.
144 WHAT IS THE TRADE-OFF BETWEEN MONITORING FREQUENCY AND DURATION? Trade Off Between Time and Money The answer is the same 4 yrs quarterly monitoring 5 yrs semiannual monitoring 7 yrs annual monitoring
145 WHAT IS THE TRADE-OFF BETWEEN MONITORING FREQUENCY AND DURATION? START Free Help in Answering Questions: Monitoring Optimization and Trend Analysis Toolkit

146 EXAMPLE Monitoring Optimization Question #2: What are the trade-offs between monitoring frequency and time required for trend identification
147 MONITORING REQUIREMENTS: KEY POINTS Short-term variability makes it harder to determine trend and increases the amount of monitoring needed to evaluate progress in remediation It commonly takes seven years or more of quarterly monitoring data to characterize the attenuation rate with even a medium level of accuracy Less frequent monitoring over longer periods of time may be more cost appropriate for determining trends during MNA
148 PRIMARY LINES OF EVIDENCE: Mass Loss and Plume Stability WHAT? Define groundwater plume status as stable, shrinking, or expanding.? HOW? Evaluate historical concentration measurements in groundwater. C Time WHEN? Always apply based on sufficient historical data. Good Data
149 PRIMARY LINES OF EVIDENCE: Mass Loss and Plume Stability WHAT? Define groundwater plume status as stable, shrinking, or expanding.? HOW? Evaluate historical concentration measurements in groundwater. C Time WHEN? Good Data
150 PRIMARY LINES OF EVIDENCE: Mass Loss and Plume Stability WHAT? Define groundwater plume status as stable, shrinking, or expanding.? HOW? Evaluate historical concentration measurements in groundwater. C Time WHEN? Always apply based on sufficient historical data. Good Data
151 LINE OF EVIDENCE 1: Demonstrate Mass Loss, Plume Stability With Two Common Graphs TCE Concentration (mg/l) Plume Outer Contour vs. Time Concentration vs. Distance at Different Times MW-2 MW-9 MW-1 MW-5 30 MW MW-2 MW-1 MW-5 20 MW MW Downgradient Distance from Source (ft)
152 DEMONSTRATE MASS LOSS AND PLUME STABILITY: 2 Graphical Methods METHOD 1 Well Concentration vs. Distance? METHOD 2 Well Concentration vs. Time C Time


153 LINE OF EVIDENCE 2: Rate Calculations

154 Ln TCE ug/l Texas Risk Reduction Program TRRP-33: MNA Remedy Implementation CONTROL REMEDY: Deriving Attenuation Action Levels (AALs) Option 1: Graphical Method 1 Plot C vs. D whisker plot showing range of historical COC concentrations. 2 Draw AAL line connecting max conc. at point near source to PCL conc. at POE. AAL = Attenuation Action Level AMP = Attenuation Monitoring Point POE = Point of Exposure 3 Determine AAL for each AMP as the intersect of well distance with AAL line.
155 LINE OF EVIDENCE 2: Appropriate Geochemical Conditions Dissolved Oxygen Example Supports Natural Attenuation: Benzene Plume Yes No Inconclusive T-1 MW T MW9-6 T T-11 T T T-7 T MW Dissolved Oxygen (mg/l) MW T MW9-4 LOW HIGH
156 BTEX Concentration (mg/l) LINE OF EVIDENCE 2: Appropriate Geochemical Conditions Dissolved Oxygen Example Dissolved Oxygen Conc. (mg/l) Key Patterns for MNA Dissolved oxygen hole in BTEX plume location. Same for NO 3, SO 4. Mountain of Fe(II) and methane Distance from Source (ft) LOW HIGH Sulfate BTEX


157 HOW FAR? HOW LONG? How Far Will Plume Migrate?? How Long Will Source Be There??
158 HOW FAR WILL PLUME GO? Groundwater Transport Modeling Advective-dispersive-degradation equation: rate of change in conc. at any point = net rate of advective transport to that point + net rate of dispersive transport to that point - net rate of degradation at that point Transport at time t advection only Transport at time t with dispersion Transport at time t with dispersion & degradation
159 1-DIMENSIONAL ADVECTION DISPERSION EQUATION Concentration at Downgradient Location X Conc (x) = Co exp [ ( Source Concentration Longitudinal Dispersivity {x 2 a 1-4 a 1 + x x Vs/R Hydraulic Conductivity 2]} 1/ ) erf First-Order Decay Constant Retardation Coefficient [ 4 a y x] Error Function Hydraulic Gradient S w Groundwater Source Width and Depth erf [ S d Transverse Dispersivity 4 a z x ] Vertical Dispersivity Groundwater Seepage Velocity Vs = K i n e Effective Soil Porosity
160 HOW FAR? Using a Model to Evaluate if MNA Can/Will Stabilize a Plume KEY POINT: Calibrate, then Predict? Step 1 Calibrate model to existing monitoring data. Step 2 Increase time to some time in the future. Step 3 See if plume gets larger or smaller or becomes stable

161 HOW LONG? HOW LONG WILL SOURCE BE THERE? Source Term Mass Balance C o?? t?
162 APPROACH: Assume Source Zone is a Box Q = FLOW RATE THROUGH SOURCE ZONE M o = Total Mass of BTEX in Source Zone C o = Concentration in Source Zone at Time = 0 IF CONSTANT SOURCE CONCENTRATION: C o t = Q M o C o t
163 BETTER SOURCE DECAY MODEL: Concentration Declines with Tailing Effect C t = C o x exp (-k s t) Conc. in Source Zone Conc. in Source Zone time time
164 HOW LONG? Example assuming first-order decay of source Q = Flow Rate Through Source (Assume 500 L/Day) M o = Total Mass in Source (Assume 10 kg) C o = Concentration in Source Zone at Time = 0 (Assume 2 mg/l)
165 HOW LONG? Example assuming first-order decay of source Q = Flow Rate Through Source (Assume 500 L/Day) M o = Total Mass in Source (Assume 10 kg) IF DECLINING SOURCE CONCENTRATION: C o = Concentration in Source Zone at Time = 0 (Assume 2 mg/l) C o k s = t
166 HOW LONG? Example assuming first-order decay of source Q = Flow Rate Through Source (Assume 500 L/Day) M o = Total Mass in Source (Assume 10 kg) IF DECLINING SOURCE CONCENTRATION: C o = Concentration in Source Zone at Time = 0 (Assume 2 mg/l) C o k s = Q C o (500) (2) = M o 10,000,000 = day -1 t C t = C o x e t
167

168
169 WHY USE MODELS? Method for Predicting Something Precisely? No System to Organize Site Data Tool to Help Understand Site Processes. Additional Line of Evidence Screen for Applicability of MNA Yes Yes Yes Yes
170 COMMONLY Contaminant? USED ANALYTICAL Matrix Analyze MNA MODELS Diffusion? Remediation? Platform BIOSCREEN Hydrocarbons No No Excel BIOCHLOR Chlorinateds No No Excel REMChlor Chlorinateds Source yes Plume no Yes Stand alone REMFuel Hydrocarbons, MTBE Source yes Plume no Yes Stand alone Matrix Diffusion Toolkit Any Yes Yes* Excel
171 COMMONLY Contaminant? USED ANALYTICAL Matrix Analyze MNA MODELS Diffusion? Remediation? Platform BIOSCREEN Hydrocarbons No No Excel BIOCHLOR Chlorinateds No No Excel REMChlor Chlorinateds Source yes Plume no Yes Stand alone REMFuel Hydrocarbons, MTBE Source yes Plume no Yes Stand alone Matrix Diffusion Toolkit Any Yes Yes* Excel

172 Google: USEPA Remchlor Developed by Dr. Ron Falta, Clemson University

173 REMCHLOR MODEL: Source and Plume Terms Source Analytical model for source behavior Flow Plume Analytical model for plume response Mass balance model on source zone predicts discharge including effects of remediation Couple Models At the Edge of the Source Zone to Provide Contaminant Discharge to Plume Model Plume model simulates mass balance based on advection, dispersion, retardation, and degradation reactions + plume remediation (but all with simple flow field)
174 HOW GAMMA (Γ) MIGHT FIT THESE DATA Normalized Concentration Γ < 1 Γ > 1 Γ = Time Since Time Since Beginning Beginning of of Temporal Record (years)
175 Concentration RESULTS OF SEQUENTIAL REACTIONS TCE 0.6 DCE VC Distance from Source
176 Time PLUME REMEDIATION MODEL Divide space and time into reaction zones, solve the coupled parent-daughter reactions for chlorinated solvent degradation in each zone Example: Natural attenuation Natural attenuation Natural attenuation Each of these space-time zones can have a different decay rate for each chemical species Enhanced reductive dechlorination Aerobic degradation Natural attenuation Natural attenuation Natural attenuation Natural attenuation Distance from source, m

177 REMCHLOR INPUT
178 178
179 ROAD MAP Intro: Changing Paradigms and MNA Principles Key Attenuation Processes Biodegradation Abiotic Processes LNAPL source zone degradation processes Other processes (immobilization, storage, dilution) Field Techniques and Technologies Groundwater sampling and analytical methods Compound Specific Isotopes Analysis (CSIA) Molecular Biological Tools (MBTs) Natural Source Zone Depletion (NSZD) Should MNA be Used? Data Analysis and Monitoring Tools Data requirements, LTM, and statistics to understand MNA rates Common Graphics and Calculations Remediation Timeframe Calculations Computer Models Implementation Topics
180 MOTIVATION FOR BIOPIC: Obtaining better rate data for MNA To select MNA, you need lines of evidence (often within several tiers) to demonstrate it will be effective 1. Historical groundwater data that demonstrate a clear and meaningful trend of decreasing contaminant concentration over time at appropriate monitoring locations 2. Hydrogeologic and geochemical data that can be used to demonstrate indirectly the types of natural attenuation processes and the rate at which such processes will reduce to required levels
181 WHAT IS BIOPIC? QUANTITATIVE FRAMEWORK: A systematic approach to evaluate whether MNA is an appropriate remedy based on site-specific conditions BioPIC: Pathway Identification Criteria A Decision Guide to Achieve Efficient Remediation of Chlorinated Ethenes Start Overview MNA Notes: Click the "Start" button above to begin the process. Answer the pop-out questions. If the "Yes" or "No" buttons are selected, the next question will appear on the screen. "Decision Criterion" and "Help" buttons provide explanations of the various Decision Criteria and guidance for answering a given question. An overview of the processes automated by BioPIC is displayed in the form of a flowchart under the tab "Overview." The Report SELECTION OF BIOREMEDIATION APPROACHES, Development and Validation of a Quantitative Framework and Management Expectation Tool for the Selection of Bioremediation Approaches (Monitored Natural Attenuation [MNA], Biostimulation and/or Bioaugmentation) at Chlorinated Ethene Sites provides further support and Another way to think about it: basis for choosing between 3 options for chlorinated ethene sites 1. Biostimulation 2. Bioaugmentation 3. MNA Search ESTCP ER for tool download and guidance
182 Conc. in Source Zone HOW BIOPIC WORKS Framework is designed to help answer question of: Will a plume impact a receptor?? Acceptable conc. to protect downgradient receptor Distance downgradient from source FIRST: Use GW Fate and Transport model to extract rate constants from field data to determine the necessary rate of degradation to achieve goal
183 Conc. in Source Zone HOW BIOPIC WORKS Framework is designed to help answer question of: Will a plume impact a receptor?? Acceptable conc. to protect downgradient receptor Distance downgradient from source SECOND: Use BioPIC to confirm if that rate is consistent with rates that have been observed in other studies for any potentiallyapplicable pathways (2 nd Line of Evidence)
184 HOW BIOPIC WORKS Attenuation Pathways that are included Complete Anaerobic Reductive Dechlorination Partial Anaerobic Reductive Dechlorination Aerobic Biological Oxidation Abiotic Degradation EPA Directive (1999) only included reductive dechlorination Parameters found to have direct correlation on attenuation rate Dehalococcoides density (for TCE, cdce, and VC) Magnetic susceptibility Iron sulfide (FeS) Methane (CH 4 ) Ferrous iron (Fe(II)) Lots of other parameters were evaluated but no correlation could be established

185 HOW BIOPIC WORKS: Example using abiotic degradation pathway Compare your data to data from other sites Magnetic susceptibility = 2.6 x 10⁻⁷ m 3 /kg Rate coefficient estimated from field data = 0.25/yr RESULT: Your data fall within blue shaded area of high confidence Abiotic degradation explains observed rate SERVES AS LINE OF EVIDENCE FOR MNA

186 CAN I APPLY MNA TO CONTAMIANTS BESIDES CHLORINATED SOLVENTS AND BTEX? YES - CONSIDER MTBE AS AN EXAMPLE Not promising in early protocols MTBE had been found to migrate large distances and threaten downgradient water supplies at the same sites where the BTEX component of a plume has either stabilized or diminished due to natural attenuation and included MTBE among compounds that tend not to degrade readily in the subsurface. Lots of research and field work in the following 5-10 years, and we ended up with a completely different story! 186


187 CAN I APPLY MNA TO METALS, INORGANICS, AND RADIONUCLIDES? YES, says USEPA Tiered Lines-of-Evidence Approach (similar to protocols for organics) 1. Plume is not expanding and sorption is occurring 2. ID the attenuation mechanism and estimate rate 3. Determine capacity and sustainability 4. Develop monitoring and contingency measures

188 CAN I APPLY MNA TO METALS, INORGANICS, AND RADIONUCLIDES? Primary attenuation pathway for many inorganics is transformation to less mobile forms through coprecipitation or sorption Reactions are generally more complex and highly influenced by geochemical conditions USEPA s 2015 policy document
189 Contaminant Biological Reaction Anaerobic Aerobic Abiotic Reaction Sequestration Nitrate Yes, degradation No Yes (reactive iron) No Perchlorate Yes, degradation No Conflicting Data No Chromium (Cr), Selenium (Se), Copper (Cu), Cadmium (Ca), Lead (Pb), Nickel (Ni), Zinc (Zn), Beryllium (Be), Arsenic (As) (metalloid) Valence change, generally favorable Valence change, generally unfavorable Valence change, generally favorable Yes (sorption, coprecipitation) Uranium, Technetium, Strontium, Cesium, Radium, Iodine Valence change, generally favorable Valence change, generally unfavorable Valence change, generally favorable Yes (sorption, coprecipitation)


190 CAN I APPLY MNA TO METALS, INORGANICS, AND RADIONUCLIDES? ADDITIONAL GUIDANCE: SCENARIOS FOR METALS, RADS (Truex et al., 2011) A B


191 WHICH EMERGING CONTAMINANTS ARE CANDIDATES FOR MNA? 1,4-Dioxane, 1,2,3-TCP, NDMA, Phthalates, and Maybe Others? DoD general goal for emerging contaminants: Identify chemicals or materials that either lack human health standards or have an evolving science and regulatory status. Other problems Prevalence at individual sites is largely unknown Absence of well-established treatment technologies Absence of tools for establishing MNA (e.g., CSIA, MBTs) 1,2,3- Trichloropropane 1,4-Dioxane
192 Emerging Contaminant Biological Degradation Anaerobic Aerobic Abiotic Degradation Sequestration 1,4-Dioxane Limited YES (mostly lab studies; can be cometabolic or used as a carbon source) Not documented No (poor sorption) Per- and polyfluoroalkyl substances (PFAS) Very limited (incomplete pathway) Very limited (incomplete pathway) Limited (a reliable light+fe(iii) reaction has been established) Moderate (primarily electrostatic sorption to ferric iron minerals; limited organic carbon sorption) N- Nitrosodimethylamine (NDMA) YES YES (cometabolic) No (several ex situ methods, including UV photolysis) No (poor sorption) 1,2,3- Trichloropropane YES (slow, often incomplete pathway) YES (slow, incomplete pathway) Very limited (reactive iron, base hydrolysis) Limited (moderate sorption)
193 MNA FOR OTHER CONTAMINANTS: KEY POINTS USEPA has detailed guidance for MNA of inorganics metals and rads Example of how scientific knowledge advances: MNA of MTBE and other oxygenates Lots of research on MNA for emerging contaminants: some contaminants look promising, others not so much


194 MNA AT DRY CLEANER SITES: Regulatory Perspective Most states have guidance on MNA, but don t differentiate between dry cleaners and other sites in their guidance Many states have dry cleaner cleanup programs, and some specifically discuss MNA State Coalition for Remediation of Drycleaners has case studies for 36 sites where MNA has been implemented
 Average half lives for PCE = 1 to 3 yr Dry cleaner plumes (median = 100 m) were shorter than plumes from industrial sites (median = 300 to 500 m)")
195 MNA AT DRY CLEANER SITES: Performance Published study of 137 dry cleaner sites in Texas (Suarez et al., 2004) Average half lives for PCE = 1 to 3 yr Dry cleaner plumes (median = 100 m) were shorter than plumes from industrial sites (median = 300 to 500 m) Industrial sites ~ 300 to 500 m Dry cleaning sites ~ 100 m

196 MNA AT DRY CLEANER SITES: Performance Remediation performance survey for ESTCP ER-1120 (2016): Similar performance for sites with PCE compared to sites with TCE or other chlorinated solvents MNA performance for PCE was slightly lower than other technologies
197 USING MATRIX DIFFUSION TO EVALUATE SOURCE HISTORY: Comparing a PCE Site vs. a TCE Site Process: Soil profile reflects style of source loading over time Transmissive Zone GW flow CONSTANT SOURCE SOURCE REMOVAL Diffusion into/out of low k zone based on concentration gradient Low k Zone Mass transport dominated by diffusion t = 20 yr t = 25 yr 197


198 Depth Below Aquitard Interface (m) TECHNICAL APPROACH: Overview Possible Solution? At sites with low-k intervals, high-resolution data from soil cores provides a way to do this Sampling devices Soil cores CVOC Soil Concentration (mg/kg) Soil data from single timepoint Field methanol preservation C Match w/ source history t SOURCE HISTORY 198

: PCE and TCE released to shallow aquifer Former paint stripping/solvent")
199 TWO FIELD LINE DEMONSTRATION: TITLE HERE 32 PT. CALIBRI CAN GO HERE; 2 Different TRY NOT Source TO HAVE Areas 3 LINE at NAS TITLES Jacksonville Source Area #1: OU3 Building 106 Source Area #2: OU3 Building 780 OU3-11 OU3-12 OU3-1 OU3-2 OU3-5 OU3-6 OU3-10 OU3-3 OU3-4 OU3-9 GW Flow Direction Former dry cleaner ( ): PCE and TCE released to shallow aquifer Former paint stripping/solvent recycling facility (1970s 1980s): PCE, TCE, and 1,1,1-TCA released to shallow aquifer 199
 Low k clay TCE Only CORE DATA SOURCE HISTORY Concentration at Transmissive Zone/Low-k Zone Interface (mg/l) Log0.0 1.0 2.0 3.0 4.0 5.0 35.0 30.0 25.")
200 MODEL TESTING: Source Area #2 Building 780 EXAMPLE: Soil core VOC profile from OU3-9 shows reasonable match with declining source Depth into Low-k Zone (ft) Low k clay TCE Only CORE DATA SOURCE HISTORY Concentration at Transmissive Zone/Low-k Zone Interface (mg/l) Log Linear Median RPD = 20% RMS Error = 1.2 mg/l Year Concentration (mg/l) OTHER MODEL RUNS COMPLETED (not shown): 1,1,1-TCA, 1,2-DCA
201 MODEL TESTING: Source Area #1 Building 106 EXAMPLE: Soil core VOC profile from OU3-3 shows good match with constant source Depth into Low-k Zone (ft) PCE Only CORE DATA SOURCE HISTORY Concentration at Transmissive Zone/Low-k Zone Interface (mg/l) Log Linear Year Median RPD = 12% RMS Error = 2.9 mg/l 2006 Low k clay Concentration (mg/l) NOTE: GW conc. used to calibrate transmissive zone due to loss of soil mass in sands
202 SITES THAT ARE WELL-SUITED FOR MNA No receptors impacted Decreasing concentration trends w/ reasonable remediation timeframe Shrinking or stable plume Slow groundwater velocity (or long travel time) Attenuation mechanisms have been established Geochemical conditions favor continued attenuation Weak source
203 SITES THAT ARE NOT WELL-SUITED FOR MNA Receptors impacted Increasing concentration trends w/ long timeframe Expanding plume (or imminent threat) Attenuation mechanisms poorly understood Geochemical conditions won t sustain attenuation Strong or uncontrolled source (some states won t allow free or residual product to remain) Monitoring limitations (can t ensure it s protective)


204 We are all Keynesians now We are all MNA implementers now
205 SCHEMATIC OF PLUME LIFECYCLE I. EXPANDING II. STABLE III. SHRINKING IV. EXHAUSTED TIME 11
206 LOW RISK SITES AND MATRIX DIFFUSION If site is Late Stage Different source process Mass discharge % from NAPL is low Matrix Diffusion % is high Not Principal Threat Waste Conceptual Model No potential source migration Further source remediation difficult Late Stage Site (Sale, 2008) Not practicable to remove mass in low-permeability zones 11

207 WHAT IS A LOW RISK SITE? Low-Risk means MNA the rest of the way Recognition that complete closure is difficult/unattainable Concentrations low Example NOT low risk: mobile NAPL Example YES low risk: matrix diffusion Air Force LoRSC Guidance 11

208 no

209 no 4
210 LOW THREAT SITES CALIFORNIA S CRITERIA FOR UNDERGROUND STORAGE TANK LOW-THREAT CLOSURE 1. Site must be in service area of public water system 2. Release must consist of petroleum 3. Release has been stopped 4. Free product removed to the extent practicable 5. Conceptual Site Model prepared and validated 6. Secondary Source removal has been addressed 7. MTBE testing requirement

211 California Low-Threat Petroleum UST Closure Policy Scenario 1

212 California Low-Threat Petroleum UST Closure Policy Scenario 3
213 California California Low-Threat Low-Threat Petroleum Petroleum UST Closure UST Policy Closure Scenario 4 Policy Scenario 3
214 CLOSURE FOR LOW RISK SITES: Key Points MNA is likely to be a component of almost all remedies at some time during the site life cycle Examples: California Chlorinated Low Threat Closure, Air Force Low Risk Guidance, National Research Council Transition Assessment Not a matter of if, but when MNA is applied
215 LOW THREAT SITES SAN FRANCISCO RWQCB S LOW-THREAT SITE CLOSURE PROGRAM Regional Water Quality Control Board 9-Point Process Must demonstrate residual pollution will not adversely affect: Groundwater plumes Cleanup Standards Risk Management Measures
216 MNA TRANSITION 1999 EPA Directive: MNA should not be considered a default or presumptive remedy, and that it should be applied very cautiously as the sole remedy and that source control will be fundamental components of any MNA remedy. MNA being used extensively Sole remedy Sole groundwater remedy States have specific criteria

217 ITRC ENHANCED MNA GUIDANCE Are the risks acceptable? Is the plume stable or shrinking? Are conditions sustainable? Is the remediation timeframe acceptable? Are the cost-benefits acceptable? NO? Enhanced Attenuation (instead of MNA)

218 TRANSITION ASSESSMENTS NATIONAL RESEARCH COUNCIL, 2012 If the effectiveness of site remediation reaches a point of diminishing returns prior to reaching cleanup goals and optimization has been exhausted, the transition to monitored natural attenuation or some other active or passive management should be considered 11
Two Emerging Concepts About Groundwater Plumes: Matrix Diffusion and Mass Discharge
 Two Emerging Concepts About Groundwater Plumes: Matrix Diffusion and Mass Discharge Charles Newell, Ph.D., P.E. GSI Environmental Inc. 1 Groundwater Plume Contaminant Transport Test Tank with Dye 2 Groundwater
Sections 5 & 6. Site Characterization and Lines of Evidence. Steve Posten
 Sections 5 & 6 Site Characterization and Lines of Evidence Steve Posten Overview Section 5 Site Characterization Conceptual site model Aquifer characteristics Hydraulic conductivity/gradient Porosity Organic
John Wilson, Principal Scientist, Scissortail Environmental Solutions, LLC, Ada, OK
 Data Needs for Effective Application of MNA and In-Situ Bioremediation Featuring Framework to Apply vel Molecular and Other Screening Tools for MNA Evaluations John Wilson, Principal Scientist, Scissortail
In Situ Remediation (ISR MT3DMS TM ) Features: Reactions
 Features: Reactions") In Situ Remediation (ISR MT3DMS TM ) Features: Reactions October 5, 2015 ISR MT3DMS TM Reactions 1 Introduction The core reaction framework in ISR MT3DMS TM was developed using the public domain reaction
In Situ Remediation (ISR MT3DMS TM ) Features: Reactions October 5, 2015 ISR MT3DMS TM Reactions 1 Introduction The core reaction framework in ISR MT3DMS TM was developed using the public domain reaction
DRAFT. Frequently Asked Questions about Monitored Natural Attenuation in Groundwater. FEBRUARY 2014 David Adamson and Charles Newell
 DRAFT Frequently Asked Questions about Monitored Natural Attenuation in Groundwater FEBRUARY 2014 David Adamson and Charles Newell This document is a product of the Department of Defense Environmental
Herb Levine EPA Region IX
 Opportunities to Integrate New Tools such as MBT and CSIA into Existing Policy and Guidance for Selection, Design and Performance Monitoring of Remedies at Chlorinated Solvent Sites Herb Levine EPA Region
Bio-traps and Site Assessment Strategies for Groundwater Impacted by Chlorinated Hydrocarbons
 Bio-traps and Site Assessment Strategies for Groundwater Impacted by Chlorinated Hydrocarbons Kerry Sublette University of Tulsa Dora Taggart, Brett Baldwin, Anita Biernacki, Kate Clark Microbial Insights,
MISSOURI DEPARTMENT OF NATURAL RESOURCES. Monitored Natural Attenuation of Groundwater Contamination at Voluntary Cleanup Program Sites
 MISSOURI DEPARTMENT OF NATURAL RESOURCES Monitored Natural Attenuation of Groundwater Contamination at Voluntary Cleanup Program Sites Technical Bulletin 1/2002 Hazardous Waste Program The chemical, physical
Impacts of a Zero Valent Iron PRB on Downgradient Biodegradation Processes. John E. Vidumsky DuPont Corporate Remediation Group
 Impacts of a Zero Valent Iron PRB on Downgradient Biodegradation Processes John E. Vidumsky DuPont Corporate Remediation Group Why is Downgradient Biodegradation Important? Significant contaminant mass
Integrated DNAPL Site Strategy (IDSS)
") Integrated DNAPL Site Strategy (IDSS) Sydney, Australia September 2014 Melbourne, Australia October 2014 Naji Akladiss, P.E., Maine DEP Charles (Chuck) Newell, Ph.D., P.E., GSI Environmental Inc. Tamzen
Integrated DNAPL Site Strategy (IDSS) Sydney, Australia September 2014 Melbourne, Australia October 2014 Naji Akladiss, P.E., Maine DEP Charles (Chuck) Newell, Ph.D., P.E., GSI Environmental Inc. Tamzen
Plume Cut-Off Treatment Example
 Page 1 of 5 H R C T E C H N I C A L B U L L E T I N # 2. 5. 2 Plume Cut-Off Treatment Example A biologically active barrier treatment zone can be constructed by applying HRC in rows of injection points.
Plume Area Treatment Example
 Page 1 of 5 H R C T E C H N I C A L B U L L E T I N # 2. 5. 1 Plume Area Treatment Example HRC injection grids are commonly employed at project sites where a localized plume of chlorinated solvent contamination
Anaerobic Benzene Biodegradation - Insights from Treatability Studies and Molecular Tools. Sandra Dworatzek
 Anaerobic Benzene Biodegradation - Insights from Treatability Studies and Molecular Tools Sandra Dworatzek Outline Introduction BTEX degradation and bioremediation Aerobic vs anaerobic Benzene degrading
State of the Art in Developing Conceptual Site Models for DNAPL Groundwater Plumes
 State of the Art in Developing Conceptual Site Models for DNAPL Groundwater Plumes Tamzen W. Macbeth CDM Smith Collaborators Dominic Giaudrone, Dee Cartwright, Dave Marabello, Ricky Chenenko, John Dougherty
Lecture 6: In Situ Bioremediation and Natural Attenuation
 ENGI 7718 Environmental Geotechniques ENGI 9621 Soil Remediation Engineering Lecture 6: In Situ Bioremediation and Natural Attenuation Spring 2011 Faculty of Engineering & Applied Science 1 6.1 Introduction
Guidance on Developing a Monitored Natural Attenuation Remedial Proposal for Chlorinated Organics in Ground Water
 Guidance on Developing a Monitored Natural Attenuation Remedial Proposal for Chlorinated Organics in Ground Water North Carolina Division of Waste Management Hazardous Waste Section Final Draft October
Designing Monitoring Programs to Effectively Evaluate the Performance of Natural Attenuation
 9 Designing Monitoring Programs to Effectively Evaluate the Performance of Natural Attenuation Todd H. Wiedemeier, Michael J. Barden, Patrick E. Haas, and W. Zachary Dickson CONTENTS Introduction......
6. Organic Compounds: Hydrocarbons. General Comments Borden, Canada, tracer test Laurens, SC, gasoline spill Bemidji, MN, crude oil spill
 6. Organic Compounds: Hydrocarbons General Comments Borden, Canada, tracer test Laurens, SC, gasoline spill Bemidji, MN, crude oil spill In the subsurface, biogeochemical processes that control contaminant
TREATMENT OF PERCHLORATE AND 1,1,1-TRICHLOROETHANE IN GROUNDWATER USING EDIBLE OIL SUBSTRATE (EOS )
") Paper 4B-1, in: A.R. Gavaskar and A.S.C. Chen (Eds.), Remediation of Chlorinated and Recalcitrant Compounds 24. Proceedings of the Fourth International Conference on Remediation of Chlorinated and Recalcitrant
Paper 4B-1, in: A.R. Gavaskar and A.S.C. Chen (Eds.), Remediation of Chlorinated and Recalcitrant Compounds 24. Proceedings of the Fourth International Conference on Remediation of Chlorinated and Recalcitrant
Cleanup of Small Dry Cleaner Using Multiple Technologies: : Sages Dry Cleaner Site
 Cleanup of Small Dry Cleaner Using Multiple Technologies: : Sages Dry Cleaner Site NATO/CCMS Pilot Study Meeting, June 2006 Guy W. Sewell, Ph.D. Professor of Environmental Health Sciences Robert S. Kerr
How Treatability and Molecular Testing Saves Time, Money and Heartburn
 How Treatability and Molecular Testing Saves Time, Money and Heartburn Phil Dennis Remediation Seminars Short Courses May 8-10 2018 Hartford, CT/Boston, MA Two Key Questions What is the best remediation
Comprehensive Tools for Remediation Support - Can You Measure Progress?
 Comprehensive Tools for Remediation Support - Can You Measure Progress? Chlorinated Hydrocarbon Remediation Short Course 2018 Comprehensive Tools for Remediation Support Introduction Monitored Natural
Advanced Tools for Subsurface Sampling and Analysis
 Advanced Tools for Subsurface Sampling and Analysis 220 William Pitt Way Pittsburgh, PA 15238 412-286-5245 www.pacelabs.com Advanced Tools TABLE OF CONTENTS: 1. Table of Contents 2. Introduction 3. PAES
900 staff operating from over 65 offices globally
 16 Combining Advanced Site Diagnostics with In Situ Microcosm Studies to Optimize Bioremediation Remedy Selection In the US, we have a network of 16 offices from coast to coast Sustainability Pride & Passion
In Situ Chemical Oxidation of VOCs and BTEX Plume in Low-Permeability Soils. Amit Haryani, PE, LSRP
 In Situ Chemical Oxidation of VOCs and BTEX Plume in Low-Permeability Soils Amit Haryani, PE, LSRP Process Map Maintenance Yard Diesel, gasoline, solvents Client Goals Attain NJ GWQS - Rapidly Challenges
Enhanced In Situ Biodegradation of PCE Following Electrical Resistance Heating at a DNAPL Source Area
 Enhanced In Situ Biodegradation of PCE Following Electrical Resistance Heating at a DNAPL Source Area Casey Hudson, P.E (casey.hudson@ch2m.com) (CH2M HILL, Atlanta, GA), Dean Williamson, P.E. (CH2M HILL,
Preliminary Results of Reductive Dechlorination Conducted at the X-749/X-120 Area of the DOE Portsmouth Gaseous Diffusion Plant, Piketon, Ohio
 Preliminary Results of Reductive Dechlorination Conducted at the X-749/X-120 Area of the DOE Portsmouth Gaseous Diffusion Plant, Piketon, Ohio D. E. Rieske, D. R. Baird, N. E. Lawson CDM Federal Programs
In Situ Treatment of Contaminated Soil and Groundwater: Lessons Learned from the Field
 In Situ Treatment of Contaminated Soil and Groundwater: Lessons Learned from the Field Presented by Alan Weston, Ph.D. Conestoga-Rovers & Associates Niagara Falls, NY, USA Agenda 1. Introduction to In
CAP 18 Anaerobic Bioremediation Product CASE STUDY
 CAP 18 Anaerobic INTRODUCTION TO ENHANCED ANAEROBIC BIOREMEDIATION (EAB) Enhanced anaerobic reductive dechlorination with non-emulsified and emulsified vegetable oils has been implemented at thousands
A Robust Model for Biotic and Abiotic Degradation of Chlorinated Aliphatic Hydrocarbons in an In Situ Bioreactor
 A Robust Model for Biotic and Abiotic Degradation of Chlorinated Aliphatic Hydrocarbons in an In Situ Bioreactor Robert Edwards- Noblis Gabriel Moreno-Ferguson Camp Stanley Storage Activity Chris Beal
6.1.2 Contaminant Trends
 margin analysis and the application of mass flux and mass discharge techniques (Appendix C). All of these methods are designed to assess changes in source loading and/or aquifer assimilative capacity over
NAVFAC RPM Tech Update: Design Considerations for Enhanced Reductive Dechlorination (ERD)
") NAVFAC RPM Tech Update: Design Considerations for Enhanced Reductive Dechlorination (ERD) Distribution Statement A: Approved for Public Release; Distribution is unlimited. Presentation Overview Purpose
NAVFAC RPM Tech Update: Design Considerations for Enhanced Reductive Dechlorination (ERD) Distribution Statement A: Approved for Public Release; Distribution is unlimited. Presentation Overview Purpose
FACT SHEET. SERDP Project ER New Developments in 1,4-Dioxane Site Management NOVEMBER David Adamson, Ph.D., P.E. GSI Environmental Inc.
 FACT SHEET New Developments in 1,4-Dioxane Site Management SERDP Project ER-2307 David Adamson, Ph.D., P.E. GSI Environmental Inc. NOVEMBER 2016 Distribution Statement A Page Intentionally Left Blank This
Biological Reductive Dechlorination of Chlorinated Compounds. Barry Molnaa WSW Remediation Practice Manager ARCADIS
 Biological Reductive Dechlorination of Chlorinated Compounds Barry Molnaa WSW Remediation Practice Manager ARCADIS 1 Presentation Outline What are we trying to do? How is it supposed to work? What are
EXECUTIVE SUMMARY. 2. The effect of remediation on the distribution and mobility of both the LNAPL and water within the zone of interest.
 EXECUTIVE SUMMARY For many decades, the oil production industry has recognized that significant limitations exist to complete extraction of oil from geologic formations. Attempts to recover fuels and crude
Appendix E Compound-Specific Isotope Analysis
 Appendix E Compound-Specific Isotope Analysis E1.0 Background Compound-specific isotope analysis (CSIA) was performed on groundwater samples collected from 18 wells at the Hoffmann-La Roche Inc. (Roche)
Monitored natural attenuation (MNA) as a long-term management technique for contaminated sites
 as a long-term management technique for contaminated sites") Monitored natural attenuation (MNA) as a long-term management technique for contaminated sites Application and experience Prof. Phil Morgan The Sirius Group phil.morgan@thesiriusgroup.com http://www.thesiriusgroup.com
Monitored natural attenuation (MNA) as a long-term management technique for contaminated sites Application and experience Prof. Phil Morgan The Sirius Group phil.morgan@thesiriusgroup.com http://www.thesiriusgroup.com
In-situ Remediation Lessons Learned
 Slide 1 In-situ Remediation Lessons Learned John Sankey, P.Eng., True Blue Technologies, Long Beach, CA Vancouver, BC Slide 2 In-situ Remediation Lessons Learned Introduction Case studies LNAPL Remediation
Bioremediation Approaches and Tools for Anaerobic Benzene Remediation. Sandra Dworatzek SiREM. SMART Remediation Toronto, ON January 26, 2017
 Bioremediation Approaches and Tools for Anaerobic Benzene Remediation Sandra Dworatzek SiREM SMART Remediation Toronto, ON January 26, 2017 SMART is Powered by: www.vertexenvironmental.ca Bioremediation
Subsurface Distribution of ZVI/EHC Slurry Validating Radius of Influence. Josephine Molin, PeroxyChem October
 Subsurface Distribution of ZVI/EHC Slurry Validating Radius of Influence Josephine Molin, PeroxyChem October 2 2014 Presentation Objective / Outline To empirically summarize our experience from a range
Section 5 Relative Effects of Manure Spreading and Confined Feeding Operations on Groundwater Quality
 Section 5 Relative Effects of Manure Spreading and Confined Feeding Operations on Groundwater Quality 5.1 Introduction The third objective of the Livestock Manure Impacts on Groundwater Quality in Alberta
Bioremediation Approaches and Tools for Anaerobic Benzene Remediation. SMART Remediation Ottawa, ON February 16, 2017
 Bioremediation Approaches and Tools for Anaerobic Benzene Remediation Phil Dennis SiREM SMART Remediation Ottawa, ON February 16, 2017 SMART is Powered by: www.vertexenvironmental.ca Bioremediation Approaches
Groundwater remediation with the use of PRB Technology. PRB TECHNOLOGY haw does it work and when to use it
 Groundwater remediation with the use of PRB Technology PRB TECHNOLOGY haw does it work and when to use it Contaminated groundwater is a significant problem for the environment. Halogenated hydrocarbons,
Cometabolic Bioremediation using Gas Infusion Technology
 Cometabolic Bioremediation using Gas Infusion Technology Page 2 Cometabolism Fortuitous degradation o Bugs derive no energy o Contaminants are not carbon source Focus o 1,4-Dioxane o NDMA (N-Nitrosodimethylamine)
IN-SITU BIOREMEDIATION EVALUATION USING THE WATERLOO EMITTER
 IN-SITU BIOREMEDIATION EVALUATION USING THE WATERLOO EMITTER Douglas A. Sweeney, M.Sc., P.Eng. and Ian Mitchell, M.Sc., P.Geo. October 2004 PRESENTATION OUTLINE Introduction Case Study Waterloo Emitter
Matrix Diffusion Toolkit
 Matrix Diffusion Toolkit USER S MANUAL Version 1.0 September 2012 S.K. Farhat C.J. Newell M.A. Seyedabbasi J.M. McDade N.T. Mahler GSI ENVIRONMENTAL INC. HOUSTON, TEXAS T.C. Sale D.S. Dandy J.J. Wahlberg
The Horizontal Reactive Media Treatment Well (HRX Well ) Demonstration of a New Technology for Passive In-Situ Remediation
 Demonstration of a New Technology for Passive In-Situ Remediation") The Horizontal Reactive Media Treatment Well (HRX Well ) Demonstration of a New Technology for Passive In-Situ Remediation Craig Divine, Jeff McDonough, Jesse Wright, Jack Wang, Mike Kladias, Hoa Voscott
The Horizontal Reactive Media Treatment Well (HRX Well ) Demonstration of a New Technology for Passive In-Situ Remediation Craig Divine, Jeff McDonough, Jesse Wright, Jack Wang, Mike Kladias, Hoa Voscott
BIOREMEDIATION APPROACHES AND TOOLS FOR BENZENE REMEDIATION UNDER ANAEROBIC CONDITIONS
 BIOREMEDIATION APPROACHES AND TOOLS FOR BENZENE REMEDIATION UNDER ANAEROBIC CONDITIONS Sandra Dworatzek*, Jennifer Webb, Peter Dollar, SiREM, Guelph, ON; Elizabeth Edwards, Nancy Bawa, Shen Guo, Fei Luo,
CSSA B-3 BIOREACTOR OPERATIONS PERFORMANCE STATUS REPORT (QUARTER 14, MONTHS 40 42, AUGUST OCTOBER, 2010)
") Quarter 14 Bioreactor Performance Status Report CSSA B-3 BIOREACTOR OPERATIONS PERFORMANCE STATUS REPORT (QUARTER 14, MONTHS 40 42, AUGUST OCTOBER, 2010) FEBRUARY 9, 2011 This status report summarizes
Quarter 14 Bioreactor Performance Status Report CSSA B-3 BIOREACTOR OPERATIONS PERFORMANCE STATUS REPORT (QUARTER 14, MONTHS 40 42, AUGUST OCTOBER, 2010) FEBRUARY 9, 2011 This status report summarizes
OBSTACLES TO COMPLETE PCE DEGRADATION DURING REDUCTIVE DECHLORINATION
 OBSTACLES TO COMPLETE PCE DEGRADATION DURING REDUCTIVE DECHLORINATION Judie A. Kean, Florida Department of Environmental Protection, Tallahassee, Florida, USA; Duane Graves, Dgraves@GeoSyntec.com, (GeoSyntec
Annemarie L. Douglas, Ph.D. R&D Coordinator HydroQual Laboratories Ltd.
 The Use of DNA Technologies in Determining the Biotreatability of Chlorinated Aliphatic Hydrocarbons Annemarie L. Douglas, Ph.D. R&D Coordinator HydroQual Laboratories Ltd. HydroQual Laboratories Ltd Wholly-owned
Field Implementation of a Novel Liquid Amendment Containing Lecithin and Ferrous Iron for Reductive Treatment of Chlorinated Hydrocarbons
 Field Implementation of a Novel Liquid Amendment Containing Lecithin and Ferrous Iron for Reductive Treatment of Chlorinated Hydrocarbons Fayaz Lakhwala, Ph.D. Ravi Srirangam, Ph.D. Alan Seech, Ph.D.,
Welcome to the CLU-IN Internet Seminar
 Welcome to the CLU-IN Internet Seminar Practical Models to Support Remediation Strategy Decision-Making - Part 4 Sponsored by: U.S. EPA Office of Superfund Remediation and Technology Innovation Delivered:
The Added Value of Stable Isotopes in Environmental Forensic Investigations.
 The Added Value of Stable Isotopes in Environmental Forensic Investigations. R. Paul Philp, Tomasz Kuder and Jon Allen, School of Geology and Geophysics, University of Oklahoma, Norman, OK. 73019. Introduction
Safer, More Effective ISCO Remedial Actions Using Non-Extreme Persulfate Activation to Yield Sustained Secondary Treatment
 Safer, More Effective ISCO Remedial Actions Using Non-Extreme Persulfate Activation to Yield Sustained Secondary Treatment Michael Scalzi, President Innovative Environmental Technologies, Inc. 6071 Easton
IN-SITU BIOLOGICALLY MEDIATED REMEDIATION. Margy Gentile September 30, 2016
 IN-SITU BIOLOGICALLY MEDIATED REMEDIATION Margy Gentile September 30, 2016 Disclaimers and Notices The materials herein are intended to furnish viewers with a summary and overview of general information
Advancing the Science of In Situ Groundwater Remediation Petroleum Hydrocarbon Remediation Technologies
 Advancing the Science of In Situ Groundwater Remediation Petroleum Hydrocarbon Remediation Technologies TASK Tersus Advanced Surface Kinetics NAPL Surfactants Tersus is the worldwide distributor of the
Contaminant Degradation and Forensics Using Compound Specific Isotope Analysis
 Contaminant Degradation and Forensics Using Compound Specific Isotope Analysis Aaron Peacock, Pat McLoughlin and Bob Pirkle 220 William Pitt Way, Pittsburgh, PA 15238 Tel: 412-826-5245 What Is a Stable
Emulsified Zero-Valent Iron (EZVI): A Combination Technology for Source Zone Remediation
: A Combination Technology for Source Zone Remediation") Emulsified Zero-Valent Iron (EZVI): A Combination Technology for Source Zone Remediation Prepared by: Dr. Ing. Lorenzo Sacchetti Carus Remediation Technologies Director, Europe, Middle East and Africa
Emulsified Zero-Valent Iron (EZVI): A Combination Technology for Source Zone Remediation Prepared by: Dr. Ing. Lorenzo Sacchetti Carus Remediation Technologies Director, Europe, Middle East and Africa
In Situ Bioreactors for In-Well Groundwater Remediation. Eric J. Raes, P.E., LSRP Kerry Sublette
 In Situ Bioreactors for In-Well Groundwater Remediation Eric J. Raes, P.E., LSRP Kerry Sublette The Bio-Sep In Situ Bioreactor (ISBR) Enhancement of in situ bioremediation in groundwater with compact bioreactor
MULTI SITE PERFORMANCE REVIEW OF LIQUID ACTIVATED CARBON FOR GROUNDWATER TREATMENT. Carlos Ortiz REGENESIS
 MULTI SITE PERFORMANCE REVIEW OF LIQUID ACTIVATED CARBON FOR GROUNDWATER TREATMENT Carlos Ortiz REGENESIS Carbon Acronyms/Definition CBI Carbon Based Injectates GAC Granular Activated Carbon PAC Powdered
report Report no. 10/18 Survey of natural attenuation of petroleum hydrocarbon plumes in groundwater in Europe
 " Report report Report no. 10/18 no. **/** Survey of natural attenuation of petroleum hydrocarbon plumes in groundwater in Europe Survey of natural attenuation of petroleum hydrocarbon plumes in groundwater
Remediation of 1, 4-Dioxane
 Do it Right, Do it once Remediation of 1, 4-Dioxane Presented by Mike Marley February 12, 2016 Agenda Basic properties of 1,4-dioxane with respect to remediation A discussion of applicable reliable remedial
ENVIRONMENTAL GEOLOGY - GEOL 406/506
 ENVIRONMENTAL GEOLOGY - GEOL 406/506 Glossary of useful Terms: 1. Abiotic: not living. 2. A b s o r p t i o n: the penetration of atoms, ions, or molecules into the bulk mass of substrate. 3. Acclimation:
Advancing the Science of In Situ Groundwater Remediation Petroleum Hydrocarbon Remediation Technologies
 Advancing the Science of In Situ Groundwater Remediation Petroleum Hydrocarbon Remediation Technologies TASK Tersus Advanced Surface Kinetics NAPL Surfactants Tersus is the worldwide distributor of the
Bioremediation of Comingled 1,4-Dioxane and Chlorinated Solvent Plumes
 Bioremediation of Comingled 1,4-Dioxane and Chlorinated Solvent Plumes Bilgen Yuncu, PhD, PE; Jessica L. Keener, PG and Robert C. Borden, PhD, PE Solutions-IES, Inc., Raleigh, NC TCE PCE Stephen D. Richardson,
Bench- and Pilot-Scale Treatability Testing of ISCO and Surfactant Enhanced Biodegradation of Long Chain Petroleum Hydrocarbons
 Bench- and Pilot-Scale Treatability Testing of ISCO and Surfactant Enhanced Biodegradation of Long Chain Petroleum Hydrocarbons Steven R. Hammer, P.E. SLR Consulting October 2014 Our Site Current site
Objective. Technical Approach
 Computational and Experimental Investigation of Contaminant Plume Response to DNAPL Source Zone Architecture and Depletion in Porous and Fractured Media (ER-1610) Objective Dense non-aqueous phase liquid
Feelin the Burn: Thermal Monitoring of Natural Source Zone Depletion (NSZD)
") Feelin the Burn: Thermal Monitoring of Natural Source Zone Depletion (NSZD) Poonam R. Kulkarni, P.E. GSI Environmental Inc. TAEP Meeting September 15, 2016 1 Natural Source Zone Depletion (NSZD): Technology
Feelin the Burn: Thermal Monitoring of Natural Source Zone Depletion (NSZD) Poonam R. Kulkarni, P.E. GSI Environmental Inc. TAEP Meeting September 15, 2016 1 Natural Source Zone Depletion (NSZD): Technology
Zero-Valent Iron for Groundwater Remediation Lessons Learned over 20 years of Technology Use. Andrzej Przepiora and Jeff Roberts
 Zero-Valent Iron for Groundwater Remediation Lessons Learned over 20 years of Technology Use Andrzej Przepiora and Jeff Roberts RemTech 2016 Oct. 12-14, 2016 ZVI-Based Remediation Milestones Extensive
Enhanced Bioremediation Field Experience: Using Observed half Lives in Design and Prediction
 Enhanced Bioremediation Field Experience: Using Observed half Lives in Design and Prediction NDIA Environment, Energy & Sustainability Symposium & Exhibition. May 4-7, 2009, Denver, CO. Authors: Joanna
Designing Monitoring Programs to Effectively Evaluate the Performance of Natural Attenuation
 Designing Monitoring Programs to Effectively Evaluate the Performance of Natural Attenuation Prepared For Air Force Center for Environmental Excellence Technology Transfer Division Brooks Air Force Base
Applications and Benefits of Groundwater Recirculation for Electron Donor Delivery and ph- Adjustment During Enhanced Anaerobic Dechlorination
 Proceedings of the Annual International Conference on Soils, Sediments, Water and Energy Volume 16 Article 8 2011 Applications and Benefits of Groundwater Recirculation for Electron Donor Delivery and
Alternative Cleanup Methods for Chlorinated VOCs
 Slide 1 Alternative Cleanup Methods for Chlorinated VOCs Getting beyond pump and treat Slide 2 Soil Vapor Extraction Vacuum is applied through extraction wells Creates a pressure gradient that induces
OPTIMIZATION OF A CHEMICAL OXIDATION TREATMENT TRAIN PROCESS FOR GROUNDWATER REMEDIATION. Gary Cronk, P.E., CHMM
 OPTIMIZATION OF A CHEMICAL OXIDATION TREATMENT TRAIN PROCESS FOR GROUNDWATER REMEDIATION Gary Cronk, P.E., CHMM Presentation at the Battelle 5 th International Conference on Remediation of Chlorinated
Table of Contents. Overview of the Technical Protocol... Page 5. Overview of Chlorinated Aliphatic Hydrocarbon Biodegradation...
 Draft EPA Region 4 Suggested Practices for Evaluation of a Site For Natural Attenuation (Biological Degradation) of Chlorinated Solvents 1 November, 1999 http://www.epa.gov/region4/ Version 3.1 1 This
Remediation Progress at California LUFT Sites: Insights from the GeoTracker Database
 API Technical Bulletin #25: Remediation Progress at California LUFT Sites: Insights from the GeoTracker Database Thomas E. McHugh, Roopa Kamath, Poonam R. Kulkarni, Charles J. Newell, and John A. Connor,
Weikel 1. Actionable Science on Fate and Transport and Degradation and Remediation of Per- and Polyfluoroalkyl Substances
 Weikel 1 Actionable Science on Fate and Transport and Degradation and Remediation of Per- and Polyfluoroalkyl Substances 11/7/218 Ethan Weikel, PG Deputy Director USGS MD-DE- DC Water Science Center 5522
Using Mass Discharge to Predict Attainable Goals and Timeframes
 Using Mass Discharge to Predict Attainable Goals and Timeframes By Grant R. Carey 1,2 and Dr. Edward A. McBean 2 1 Porewater Solutions (Ottawa, Ontario, Canada) 2 University of Guelph (Guelph, Ontario,
Field Demonstration of a Monitoring Toolbox for In Situ Biogeochemical Transformation. Ryan A. Wymore, P.E. November 13, 2012
 Field Demonstration of a Monitoring Toolbox for In Situ Biogeochemical Transformation Ryan A. Wymore, P.E. November 13, 2012 Coauthors/Acknowledgements Pat Evans, Ph.D., CDM Smith, Bellevue, WA Dung Nguyen,
In Situ Bioremediation Technologies by Tersus Environmental
 In Situ Bioremediation Technologies by Tersus Environmental Page 2 Gas infusion Page 3 Tersus Environmental In Situ bioremediation Gas delivery Edible oil Achieve site closure Low cost solution Soil vapor
CSSA B-3 BIOREACTOR OPERATIONS PERFORMANCE STATUS REPORT (QUARTER 13, MONTHS 37 39, MAY JULY, 2010) SEPTMEBER 23, 2010
 SEPTMEBER 23, 2010") Quarter 13 Bioreactor Performance Status Report CSSA B-3 BIOREACTOR OPERATIONS PERFORMANCE STATUS REPORT (QUARTER 13, MONTHS 37 39, MAY JULY, 2010) SEPTMEBER 23, 2010 This status report summarizes the
Quarter 13 Bioreactor Performance Status Report CSSA B-3 BIOREACTOR OPERATIONS PERFORMANCE STATUS REPORT (QUARTER 13, MONTHS 37 39, MAY JULY, 2010) SEPTMEBER 23, 2010 This status report summarizes the
Evaluating Natural Source Zone Depletion at Petroleum Hydrocarbon Sites New Toolkit of Technologies
 Remediation Technologies Symposium 2017 (RemTech 2017) October 11-13, 2017 - Fairmont Banff Springs Acknowledgments: BC Contaminated Sites Approved Professionals (CSAP) Society Dr. Matthew Lahvis (Shell
Conceptual System Design
 Conceptual System Design Ryan A. Wymore, P.E., CDM NEWMOA Enhanced In Situ Bioremediation Workshop October 5-6, 2010 Acknowledgements ESTCP ITRC Bioremediation of DNAPLs team Tamzen Macbeth (CDM) Kent
Delivery Approaches for Groundwater Amendments
 Delivery Approaches for Groundwater Amendments Tom Krug 1, Michaye McMaster 1, Evan Cox 1, Jamey Rosen 1, Carl Elder 2, Robert Borch 3, and Neal Durant 4 Consultants, Guelph 1 Boston 2, Portland 3, Columbia
NanoFe. Supported Zero-Valent Nanoiron. An Innovative Remediation Technology for Soils and Groundwater. PARS Environmental Inc.
 NanoFe Supported Zero-Valent Nanoiron An Innovative Remediation Technology for Soils and Groundwater PARS Environmental Inc. H.S. Gill Ph.D. Tel: 609-890-7277 Introduction NanoFe will remediate recalcitrant
MTBE Fact Sheet #2 Remediation Of MTBE Contaminated Soil And Groundwater Background
 United States Office Of Solid Waste And EPA 510-F-98-002 Environmental Protection Emergency Response Agency (5401G) www.epa.gov/oust/mtbe/ Office Of Underground Storage Tanks MTBE Fact Sheet #2 Remediation
Chemical Reduction processes for In Situ Soluble Metals Remediation and Immobilization in Groundwater
 Chemical Reduction processes for In Situ Soluble Metals Remediation and Immobilization in Groundwater 2014 RPIC Federal Contaminated Sites National Workshop Ottawa 2014 Prepared by Jean Paré, P. Eng. Chemco
Learning about Secondary Water Quality Impacts from the Bemidji Oil Spill
 Learning about Secondary Water Quality Impacts from the Bemidji Oil Spill Crystal Ng (gcng@umn.edu) Univ of Minnesota, Twin Cities Barbara Bekins Research Coordinator USGS, Menlo Park, CA Jard Trost Site
Advancing the Science of In Situ Groundwater Remediation Petroleum Hydrocarbon Remediation Technologies
 Advancing the Science of In Situ Groundwater Remediation Petroleum Hydrocarbon Remediation Technologies RemBind Vadose Zone Treatment Tersus is the exclusive North American distributor for RemBind (US
CASE STUDY COMPARISON OF MULTIPLE ACTIVATION METHODS FOR SODIUM PERSULFATE ISCO TREATMENT
 CASE STUDY COMPARISON OF MULTIPLE ACTIVATION METHODS FOR SODIUM PERSULFATE ISCO TREATMENT Gary Cronk, P.E. (JAG Consulting Group) Presentation at the Battelle 6 th International Conference on Remediation
PROOF-OF-CONCEPT EVALUATION PASSIVE IN-SITU BIOREMEDIATION OF CHLORINATED-BENZENE GROUNDWATER CONTAMINANTS USING GREEN TECHNOLOGY
 PROOF-OF-CONCEPT EVALUATION PASSIVE IN-SITU BIOREMEDIATION OF CHLORINATED-BENZENE GROUNDWATER CONTAMINANTS USING GREEN TECHNOLOGY Kent C. Armstrong BioStryke Remediation Products, LLC Robert Chimchirian,
APPROACHES FOR EVALUATING NATURAL ATTENUATION OF 1,4-DIOXANE
 APPROACHES FOR EVALUATING NATURAL ATTENUATION OF 1,4-DIOXANE October 13, 2016 RemTech TM Banff, Alberta, Canada Overview 1,4-Dioxane as an Emerging Contaminant Monitored Natural Attenuation of 1,4-Dioxane
Vapor Intrusion - Site Characterization and Screening. NEWMOA Workshop on Vapor Intrusion Chelmsford, MA April 12, 2006
 Vapor Intrusion - Site Characterization and Screening NEWMOA Workshop on Vapor Intrusion Chelmsford, MA April 12, 2006 David J. Folkes P.E. 1 What is Vapor Intrusion?! Compounds of Concern " Volatile Organics
The emamoc (electrolytic methanogenicmethanotrophic FOR BIOREMEDIATION OF CHLORINATED SOLVENTS
 The emamoc (electrolytic methanogenicmethanotrophic coupling) SYSTEM : A TOOL FOR BIOREMEDIATION OF CHLORINATED SOLVENTS Boris Tartakovsky, Ruxandra Cimpoia, Michelle-France Manuel, Marie-Josée Lévesque,
Imagine the result. Ms. Jeannette DeBartolomeo Oil Control Program Maryland Department of Environment 1800 Washington Boulevard Baltimore, MD 21230
 Ms. Jeannette ebartolomeo Oil Control Program Maryland epartment of Environment 00 Washington Boulevard Baltimore, M 0 ARCAIS U.S., Inc. Benfield Boulevard Suite A Millersville Maryland 0 Tel 0..00 Fax
(,,,) = ( )exp ( + C(x,y,z,t) = the concentration of the contaminant at location x, y, z from the source at time t.
 = ( )exp ( + C(x,y,z,t) = the concentration of the contaminant at location x, y, z from the source at time t.") INTRODUCTION Quick Domenico.xls (QD) is a Microsoft Excel spreadsheet application of An Analytical Model For Multidimensional Transport of a Decaying Contaminant Species, by P.A. Domenico, Journal of Hydrology,
INTRODUCTION Quick Domenico.xls (QD) is a Microsoft Excel spreadsheet application of An Analytical Model For Multidimensional Transport of a Decaying Contaminant Species, by P.A. Domenico, Journal of Hydrology,
A TECHNOLOGY PLATFORM TO HARNESS SPEED AND CERTAINTY IN GROUNDWATER REMEDIATION
 A TECHNOLOGY PLATFORM TO HARNESS SPEED AND CERTAINTY IN GROUNDWATER REMEDIATION Barry Poling, CHMM Regional Manager This presentation is the property of REGENESIS Remediation Products and its owner. You
Enhanced Reductive Dechlorination to Treat PCE and TCE in a Deep Gravel Aquifer
 Enhanced Reductive Dechlorination to Treat PCE and TCE in a Deep Gravel Aquifer Presented by Steven R. Hammer, P.E. SLR International Corp 1800 Blankenship Road #440, West Linn, Oregon MM/DD/YYYY October
Bioremediation Product Series
 No. PREX-GEN101007 In-situ Remediation of Contaminated Soil and Groundwater using the Power of Mother Nature Bioremediation Product Series 694-2, Akada, Toyama 939-8064 Japan Phone: +81-76-420-3122 Fax: