2016 ANNUAL MONITORING NETWORK PLAN
|
|
|
- Claud Blake
- 6 years ago
- Views:
Transcription
1 2016 ANNUAL MONITORING NETWORK PLAN SACRAMENTO METROPOLITAN AIR QUALITY MANAGEMENT DISTRICT PROGRAM COORDINATION DIVISION TH STREET, 3 RD FLOOR SACRAMENTO, CA (916) AIRQUALITY.ORG
2 This page is intentionally left blank to facility double sized printing Page ii
3 Table of Content Section 1. Introduction...1 Section 2. Network Operations...2 Section 3. Minimum Monitoring Requirements...8 Section 4. Recent and Proposed Modification to the Network...12 Section 5. PM and Lead Collocation Requirement...14 Section 6. Process to Review Changes to PM 2.5 Monitoring Network...15 Section 7. Data Submission Requirements...16 Section 8. Review of Existing SMAQMD Air Monitoring Sites...17 Section 9. Reference...18 Appendix A Detailed Site and Monitor information...19 A.1 Sacramento-Branch Center # A.2 Sacramento-Bercut Dr...24 A.3 Elk Grove-Bruceville...31 A.4 Sacramento-Del Paso Manor...40 A.5 Folsom-Natoma St...51 A.6 Sacramento-Goldenland Ct A.7 North Highlands-Blackfoot...65 A.8 Rancho Seco...71 A.9 Sloughhouse...73 A.10 Sacramento Health Dept.-Stockton Blvd...79 A.11 Sacramento-1309 T Street...84 Appendix B Minimum Monitoring Requirement Assessment...89 Appendix C Copy of Annual Data Certification Letter Appendix D California Alternative Plan (CAP III) Appendix E Network Modification Plan Page iii
4 List of Tables Table 2-1 Purpose and Overview of Pollutants Monitored...4 Table 2-2 Monitoring Objective...6 Table 2-3 Type of Site and Spatial Scale...7 Table 3-1 Sacramento MSA Design Value and Monitoring Requirement, Part Table 3-2 Sacramento MSA Design Value and Monitoring Requirement, Part Table 3-3 PAMS Minimum Monitoring Requirement...11 Table 3-4 Sampling Schedule...12 Table B-1 Number of SLAMS Monitoring Site within Sacramento MSA...89 Figure B-1 MOU on Shared Monitoring Responsibility with CARB, Page Figure B-2 MOU on Shared Monitoring Responsibility with CARB, Page Figure C-1 A Copy of 2016 Data Certification Letter, Page Figure C-2 A Copy of 2016 Data Certification Letter, Page Figure C-3 Copy of 2016 Data Certification Letter, Page Figure D-1 California Alternative Plan, Page Figure D-2 California Alternative Plan, Page Figure D-3 California Alternative Plan, Page Figure D-4 California Alternative Plan, Page Figure D-5 California Alternative Plan, Page List of Figures Figure 2-1 Counties within Sacramento-Arden Arcade-Roseville, California, MSA...2 Figure 2-2 Sacramento Non-attainment Area...3 Figure 2-3 Air Monitoring Sites in Sacramento County The enclosure to this letter is not reproduced in this annual network plan. Please contact CARB for a copy of this letter in its entirety. Page iv
5 List of Abbreviations and Acronyms AADT AGL AIR ANP ARM AQS BAM BC BL BRU Caltrans CARB CSN CFR CO DPM DV ECW EPA ER ERG FE AADT FEM FID FOL FRM GC GOL HC IM MET MI MS MSA NAAQS Annual average daily traffic Above ground level Sacramento-Airport Road Air Monitoring Site Annual network plan Approved Regional Monitor Air Quality System Beta Attenuation Monitor Sacramento-Branch Center #2 Air Monitoring Site General/Background Elk Grove-Bruceville Air Monitoring Site California Department of Transportation California Air Resources Board Chemical Speciation Network Code of Federal Regulations Carbon Monoxide Sacramento-Del Paso Manor Air Monitoring Site Design Value Sacramento-El Camino/Watt Air Monitoring Site U.S Environmental Protection Agency Emission ratio Eastern Research Group, Inc. Fleet equivalent annual average daily traffic Federal Equivalent Method Flame Ionization Detector Folsom-Natoma Air Monitoring Site Federal Reference Method Gas Chromatography Sacramento-Goldenland Court Air Monitoring Site Highest Concentration Source Impact Meteorological sensor Microscale Middle Scale Metropolitan Statistical Area National Ambient Air Quality Standard Page v
6 NCore NDIR NEI NH NMHC NO2 NOX NOY NPAP NPEP NS O3 PAMS Pb PEP PM PM2.5 PM10 PM-Coarse POC PPB QA QAPP QMP RC RH RS RTI National Core, a multi-pollutant ambient monitoring network Non-dispersive Infrared Spectrometry National Emission Inventory North Highlands-Blackfoot Air Monitoring Site Non-Methane Hydrocarbon Nitrogen Dioxide Oxides of Nitrogen Reactive Oxides of Nitrogen National Performance Audit Program (Criteria pollutant monitors) National Performance Evaluation Program (PM2.5 FRM) Neighborhood Scale Ozone Photochemical Assessment Monitoring Sites Lead Performance Evaluation Program (PM2.5 FRM) Particulate Matter Particulate Matter 2.5 micron Particulate Matter 10 micron Particulate Matter > 2.5 micron and < 10 micron (PM10-2.5) Parameter occurrence code Parts per Billion Quality Assurance Quality Assurance Project Plan Quality Management Plan Representative Concentration Relative Humidity Rancho Seco monitoring site Research Triangle Institute SASS SCC SCK SFNA SIP SJV SLAMS SLU SMAQMD SO2 SO4 SPM SR Page vi PM2.5 Speciation sampler Sacramento City Code Sacramento Health Department-Stockton Blvd. Air Monitoring Site Sacramento Federal Nonattainment Area State Implementation Program San Joaquin Valley State and Local Air Monitoring Sites Sloughhouse Air Monitoring Site Sacramento Metropolitan Air Quality Management District Sulfur Dioxide Sulfate Special Purpose Monitoring State Route
7 SRD SSI STN TAPI TCCR TEI TEOM THC TNMHC TPY TST US UV VCAPCD VOC VSCC WD WF WS Solar Radiation Size Selective Inlet (PM10 FRM sampler) Speciation Trends Network Teledyne Advanced Pollution Instrumentation Transportation Corridor Concept Report Thermo Environmental Instruments Tapered Element Oscillating Microbalance Total Hydrocarbon Total Non-methane hydrocarbon Ton per Year Sacramento-T Street Air Monitoring Site Urban Scale Ultraviolet Ventura County Air Pollution Control District Volatile Organic Compounds Very Sharp Cut Cyclone Wind Direction Welfare Based Wind Speed Page vii
8 This page is intentionally left blank Page viii
9 Section 1. Introduction State and Local agencies that conduct ambient air monitoring for regulatory purposes are required, by Title 40, Code of Federal Regulations, Part 58.10, to submit an Annual Monitoring Network Plan (ANP) to the U.S. Environmental Protection Agency (EPA), no later than July 1st, each year. The report must contain specific monitoring network information and the report must be presented for a 30-day public review period prior to submittal to EPA. The public review period was open from August 15, 2016 thru September 15, No comment was received during this period. This report covers the period: January 1, 2015-December 31, This network plan focuses on the monitors that are operated within Sacramento County, which is a part of Sacramento-Arden Arcade-Roseville Metropolitan Statistical Area (MSA). The primary purpose of this ambient air monitoring network plan is to document the existing Sacramento County air monitoring network and to discuss proposed changes (additions, relocations, and terminations of non-spm monitors) in the ambient air monitoring network that may be proposed to occur within an 18 month period following submittal of this report. The plan includes monitors and instruments information that are a part of State and Local Air Monitoring sites (SLAMS), National Core (NCore) multi-pollutant monitoring stations, Chemical Speciation Network (CSN), Special Purpose Monitoring (SPM), and Photochemical Assessment Monitoring (PAMS) sites, operated by our District and California Air Resources Board (CARB). The plan states whether each monitor in the ambient air monitoring network meets the requirements of 40 CFR 58, including Appendix A, C, D, and E, where applicable. The report will include the Federal Reference Method (FRM), Federal Equivalent Method (FEM), and Approved Regional Method (ARM) monitors. This report is not an in depth analysis of the local air monitoring network design. A network assessment report, required every five years, has the analysis to determine if the air monitoring network meets the monitoring objectives defined in 40 CFR Part 58 Appendix D, whether new sites are needed, whether existing sites are no longer needed, and whether new technologies are appropriate for incorporation in to the ambient air monitoring network. A 2015 network assessment report was completed and made available for public comment on SMAQMD s website 2 on April 13, 2016, and was submitted to EPA Region 9 on April 22, As required by Revisions to Ambient Monitoring Quality Assurance and Other Requirements promulgated on April 27, , a network modification plan is being submitted, as a part of this annual network plan. It addresses recommendations found in the network assessment report and can be found in Appendix E. Any shared monitoring responsibility agreement between SMAQMD and neighboring monitoring organizations are discussed in Section 3, Minimum Monitoring Requirement. For details on monitors in neighboring counties within the MSA, please refer to the latest Annual Monitoring Network Plan published by CARB. 2 Trinity Consultants Air Monitoring Network Assessment (Sacramento Metropolitan Air Quality Management District) [cited 23 Apr 2016] FR Page 1
. Sacramento MSA includes Placer, El Dorado, Sacramento and Yolo County.")
10 Section 2. Network Operations Sacramento County is located in the middle of California s Central Valley and at the southern end of the Sacramento Valley. Sacramento County is the most populous county within Sacramento-Arden Arcade-Roseville, California, MSA (Sacramento MSA). Sacramento MSA includes Placer, El Dorado, Sacramento and Yolo County. The MSA has 2.3 million people, including 1.5 million in Sacramento County, and is the 27 th most populous MSA in the U.S. 4. Figure 2-1 shows a map of Sacramento MSA. Figure 2-1 Counties within Sacramento-Arden Arcade-Roseville, California, MSA 4 U.S. Census Bureau, Population Division, released March 2016 Page 2

11 Portions of the Sacramento MSA is a nonattainment area for the Federal 8-hr O 3 standard and is referred to as the Sacramento Federal Nonattainment Area (SFNA) 5. This area includes all of Sacramento and Yolo counties and portions of Placer, El Dorado, Solano, and Sutter counties. The county has met PM 10 air quality standard since The Sacramento region was designated nonattainment for the hour PM 2.5 standard (figure 2-2). The region met the PM 2.5 standard in 2012 and will continue to reduce PM 2.5 levels through various programs and strategies. Sacramento County is in attainment for the Federal CO, NO 2, and SO 2 health standards. EPA has designated Sacramento County as unclassifiable/attainment for the 2008 Federal Pb standard 7. Figure 2-2 Sacramento Valley Federal O 3 and PM 2.5 Non-attainment Area 5 U.S. EPA, 8-Hour Ozone (2008) Nonattainment Area/State/County Report, FR Page 3
12 SMAQMD operates ten air monitoring sites within Sacramento County with CARB operating the eleventh at Sacramento-T Street. Also, SMAQMD operates a special purpose site in Walnut Grove, which provides vertical ozone and temperature profile data for research. While most sites operate a suite of instruments to monitor multiple pollutants and meteorological condition, only a few sites monitor a specific pollutant. Each site has monitors that belong to one or more national monitoring networks, such as SLAMS, PAMS, or is a SPM. In addition, SMAQMD operates one of the 80 NCore sites and one of the 54 PM 2.5 CSN trend sites nationwide. Table 2-1 lists the type of monitoring networks each site belongs to and the pollutants monitored at each site. Figure 2-3 maps the location. Table 2-1 Purpose and Overview of Pollutants Monitored Purpose Pollutants Meteorology Sacramento-Bercut Dr. (BER) Sacramento-Branch Center Rd #2 (BC) Elk Grove-Bruceville Rd. (BRU) SLAMS PAMS CSN NCore SPM Ozone (O 3) Carbon Monoxide (CO) Nitrogen Dioxide (NO 2) Total Reactive Nitrogen (NO Y) Sulfur Dioxide (SO 2) Non-methane Hydrocarbon (NMH) Speciated VOC Carbonyl PM 10 (Hourly, continuous) PM 10 (24-hr) PM 2.5 (Hourly, continuous) PM 2.5 (24-hr) Speciated PM 2.5 PM (24-hr) Lead (Pb) Black Carbon (BC) Scattering Coefficient Outdoor Temperature Relative Humidity Wind Direction Wind Speed Solar Radiation Ultraviolet Radiation Barometric Pressure Precipitation Upper Level Meteorology Sacramento-Del Paso Manor (DPM) Folsom-Natoma (FOL) Sacramento-Goldenland Ct. (GOL) North Highlands-Blackfoot Way (NH) Rancho Seco (RS) Sloughhouse (SLU) Sacramento-Health Dept. (STK) Sacramento- T St. (TST) Page 4

13 Figure 2-3 Air Monitoring Sites in Sacramento County Page 5
14 The primary focus of the current ambient air monitoring network is the collection of O 3, its photochemical pollutant precursors such as NO X and VOC, and PM 2.5. The data collected from area-wide and near-road stations supports SIP development, attainment/nonattainment decisions, public notification, and data for air quality modeling efforts. The network is designed to meet three basic monitoring objectives: (1) provide air pollution data to the general public in a timely manner; (2) support compliance with ambient quality standards and emissions strategy development; and (3) support air pollution research studies. To support these monitoring objectives there are a variety of types of monitoring sites, including sites located to determine the highest pollutant concentration, the representative concentrations in areas of high population density, the impact of major pollution emissions sources, the general background concentration levels, the extent of pollutant transport, and impacts on visibility, vegetation, and other welfarebased impacts. An overview of monitoring objectives is in Table 2-2. Table 2-2 Monitoring Objective Sacramento-Bercut Dr. (BER) Sacramento-Branch Center Rd #2 (BC) Elk Grove-Bruceville Rd. (BRU) Sacramento-Del Paso Manor (DPM) Folsom-Natoma (FOL) Sacramento-Goldenland Ct. (GOL) North Highlands- Blackfoot Way (NH) Rancho Seco (RS) Sloughhouse (SLU) Sacramento-Health Dept. (STK) O 3 N,P N,P N,P N,P N,R N,P N,P CO N,P N,P N,P N,R NO 2 N,P N,P N,P N,P N,P N,R N,P NO Y P P SO 2 N,P NMH P,R P,R P,R P,R VOC R R R PM 10 (Hourly) P,R P,R PM 10 (24-hr) N,P N,P N,P N,P N,P N,P PM 2.5 (Hourly) P P N,P P,R R P PM 2.5 (24-hr) N,P 8 N,P N,P N,P PM P Pb N,P Sacramento-T St. (TST) N: NAAQS Comparison P: Public Info R: Research 8 PM 2.5 will be installed and operational by winter 2016 Page 6
15 The physical siting of an air monitoring station must achieve a spatial scale of representativeness that is consistent with the monitoring objective of the monitor. The spatial scale results from the physical location of the site with respect to the pollutant sources. It estimates the size of the area surrounding the monitoring site that experiences uniform pollutant concentrations. Table 2-3 summarizes the site type and spatial scale. For in-depth details on individual monitors, including monitoring objective and statement of purpose, see Appendix A, Detailed Site Information. Site type and spatial scale description can be found in Appendix D to 40 CFR 58. Table 2-3 Type of Site and Spatial Scale Site Type Spatial Scale Sacramento-Bercut Dr. (BER) Sacramento- Branch Center Rd #2 Elk (BC) Grove- Bruceville Rd. (BRU) Sacramento-Del Paso Manor (DPM) Folsom-Natoma (FOL) Sacramento- Goldenland Ct. (GOL) North Highlands- Blackfoot Way (NH) Rancho Seco (RS) Sloughhouse (SLU) Sacramento- Health Dept. (STK) Sacramento- T St. (TST) Ozone MO UP PE PE PE PE MO PE Carbon Monoxide SO PE PE PE Nitrogen Dioxide SO UP PE HC PE PE PE Sulfur Dioxide PE PM 10 (Cont. or Manual) HC PE PE PE PE PE PM 2.5 (Cont. or Manual) PE PE PE GB PE GB UP HC HC HC PM PE Lead GB Ozone US NS NS US US NS US Carbon Monoxide MC NS NS NS Nitrogen Dioxide MC NS NS NS NS NS NS Sulfur Dioxide US PM 10 (Cont. or Manual) NS NS NS NS NS NS PM 2.5 (Cont. or Manual) NS NS NS NS NS NS NS PM NS Lead US Site Type: ED - Extreme downwind GB - General/background HC - Highest concentration MO - Maximum O 3 concentration PE - Population exposure QA - Quality assurance MP - Maximum precursor emission OT - Other RT - Regional transport SO - Source oriented UP - Upwind/background WF - Welfare related impacts Spatial Scale: MC - Microscale MD - Middle scale NS - Neighborhood scale US - Urban scale RS - Regional scale NG - National/global scale Page 7
16 Section 3. Minimum Monitoring Requirements Depending on the specific pollutant, the minimum number of monitoring sites required for each pollutant is based on the one or more applicable factors as described in Appendix D to 40 CFR 58: MSA population, pollutant design value, pollutant maximum concentration, attainment status, annual average daily traffic (AADT), state implantation plan (SIP), maintenance plan, population weighted emission index (PWEI), and EPA s national emission inventory (NEI) data. Sacramento MSA meets or exceeds minimum monitoring requirement for all criteria pollutants O 3, PM 2.5 (manual and continuous methods), PM 10, NO 2, SO 2, CO, and Pb. Details of the minimum monitoring requirements of all criteria pollutants are provided in Tables 3-1 and 3-2. Monitors in these tables represent Sacramento MSA (or CBSA, ID#40900). As mentioned in Section 2, Sacramento MSA has 2.3 million residents and is comprises of El Dorado, Placer, Sacramento, and Yolo Counties. SMAQMD has an agreement with CARB to share monitoring responsibility in the MSA. A copy of this agreement is provided in Appendix B. Other monitoring organizations that operate air monitoring stations in the MSA are: Placer County APCD and Yolo-Solano AQMD. Table Sacramento MSA Design Value and Monitoring Site Requirement, Part 1 Type (if applicable) Number of SLAMS sites required Active SLAMS sites in MSA Active SLAMS sites in Sacramento County Additional SLAMS sites needed Pollutant 2015 design value (A) and location O ppm Placerville ( ) PM 2.5 FRM/FEM hr: 35 μg/m 3 Sacramento-Del Paso Manor ( ) Continuous Annual: 10.2 μg/m 3 Sacramento-Del Paso Manor ( ) PM year average expected number of exceedance: 0.0 PM Not applicable (A) Design values from U.S. EPA Air Quality System Design Value Report (AMP 480), accessed on 25-Apr-2016 Page 8
17 Pollutant NO 2 Table Sacramento MSA Design Value and Monitoring Site Requirement, Part 2 Type (if applicable) Number of SLAMS sites required Active SLAMS sites in MSA Active SLAMS sites in Sacramento County Additional SLAMS sites Needed SO CO Pb Notes Highest AADT: 251,000 (SR50 east of 15/16 th Street) (A)(B) NO 2 monitor at Sacramento-Del Paso Manor ( ) serves as both PAMS and area-wide monitor Total SO 2 : 1,085 tons (C) Population Weighted Emission Index: 2,468 million persons-tons per year (D) Monitor at Sacramento-Del Paso Manor satisfy NCore Trace monitor at Sacramento-Del Paso satisfy the NCore requirement, which also satisfy the 1 monitor requirement in the CO Maintenance Plan Monitor at Sacramento-Bercut Dr. satisfy the near-road monitoring requirement Nearroad Areawide NCore 0 (E) Located at Sacramento-Del Paso Manor Nonsource Number of non-airport source > 0.5 tpy: 0 (C), oriented Source Airport source < 1.0 tpy (C) oriented (A) California Department of Transportation, 2014 Traffic Volumes, accessed 26-Apr-2016 (2015 data is not yet available) (B) Sacramento MSA has recently surpassed the 250,000 threshold for a second near-road monitoring site per 40 CFR Part 58 Appendix D, 4.3.2(a). See discussion in Appendix E, page 103. (C) Source: 2011 National Emission Inventory, accessed 26-Apr 2016 (D) Per Appendix D to 40 CFR Part 58, (E) Revisions to Ambient Monitoring Quality Assurance and Other Requirements promulgated on April 27, 2016, revokes the lead monitoring requirement at NCore sites Page 9
18 In addition to the criteria pollutants, Sacramento MSA also meets minimum monitoring requirement for PAMS, which is required due to the severity of ozone nonattainment classification in Sacramento MSA. The PAMS network is operated in accordance with the California Alternative Plan III (CAP III). A copy of CAP III is located in Appendix D. Currently, there is one of each PAMS type I, II, and III sites. There is also a secondary type II site. Table 3-3 lists the instruments operating at each PAMS and current number of monitors required. New PAMS requirements were promulgated with the 2015 revision of the National Ambient Air Quality Standards for Ozone (80 FR 65292) and the network modification plan in Appendix E addresses future year changes and requirements under these new regulations 9. PAMS Parameter # Required Table 3-3 PAMS Minimum Monitoring Requirement # Active Elk Grove- Bruceville Rd. (Type 1) Sacramento- Del Paso Manor (Type II) Sacramento- Goldenland Ct. (Type II, secondary) Folsom- Natoma St. (Type III) O 3 4 (A) 4 CO 1 2 NO X 2 4 NO Y 1 1 (B) Speciated VOC 2 2 Carbonyl Sampling 1 1 Surface Met 4 (A) 4 Upper Air Meteorology 1 1 (A) This requirement is dependent on the number of PAMS site, see Appendix D to 40 CFR 58 (B) Per Appendix D to 40 CFR 58, this monitor does not count toward PAMS requirement but is required for NCore; NO Y for PAMS must be at Type I or III site Furthermore, all instruments operated by SMAQMD meets the operating schedule requirements as specified in 40 CFR Part All continuous monitors, including O 3, CO, NO 2, SO 2, PM 2.5 BAM, and PM 10 TEOM, report hourly data and monitor pollutant year-round, unless otherwise specified in Appendix A, Detailed Site Information. Sampling schedule for non-continuous monitors is summarized in Table 3-4. Design value is included in the table if it is needed to determine an appropriate schedule for non-continuous monitors (in accordance to Appendix D, Network Design, to 40 CFR Part 58). All non-continuous monitors are operated year-round with the following exceptions: 1) speciated VOC and carbonyl samplers at PAMS operate from July thru September, and 2) special purpose PM 2.5 monitor at Rancho Seco operates from November thru February. For further details on sampling season and operating schedule, please refer to Appendix A. 9 Per 40 CFR 58.13, new PAMS requirement must be implemented by June 1, 2019 Page 10
19 Table 3-4 Sampling Schedule and 2015 Design Value for PM, Pb, VOC Monitors in Sacramento County (all units in μg/m 3 ) Site PM10 (A) PM2.5 (B) (C) PM (D) Sacramento-Branch Center #2 Sacramento-Bercut Dr. Elk Grove-Bruceville Sacramento-Del Paso Manor Folsom-Natoma St. Sacramento-Goldenland Ct. North Highlands- Blackfoot Way Sacramento-Health Department Rancho Seco Sloughhouse Sacramento-T St Max. 24-hr concentration: 44 Ratio to standard: 0.29 Max. 24-hr concentration: 40 Ratio to standard: 0.27 Max. 24-hr concentration: 53 Ratio to standard: 0.35 Max. 24-hr concentration: 45 Ratio to standard: 0.30 Max. 24-hr concentration: 44 Ratio to standard: 0.29 Max. 24-hr concentration: 57 Ratio to standard: in 3 days (planned) (Continuous Monitor) 24-hr DV: 35 Annual DV: 10.2 (Continuous Monitor) 24-hr DV: 30 Annual DV: 9.2 (Continuous Monitor) (Continuous Monitor) 24-hr DV: 30 Annual DV: in 3 days Pb Max rolling 3-mo. average: VOC During O 3 episode only 1 in 3 days (Jul-Sep) 1 in 3 days (Jul-Sep) Legend: Blue denotes daily sampling Yellow denotes 1 in 3 day sampling Green denotes 1 in 6 day sampling (A) Per 40 CFR 58.12(e), PM 10 (non-continuous) operates on a minimum of 1in 6 days sampling schedule. More frequent sampling may be required if ratio to the 24-hr PM 10 NAAQS (standard) exceeds 0.8 (B) Per 40 CFR 58.12(d)(1)(iii), required SLAMS stations whose measurements determine the 24-hour design value for their area and whose data are within ±5 percent of the level of the 24-hour PM2.5 NAAQS must have an FRM or FEM operate on a daily schedule if that area's design value for the annual NAAQS is less than the level of the annual PM2.5 standard. (C) Per 40 CFR (d)(1)(i), manual PM2.5 samplers at required SLAMS stations without a collocated continuously operating PM2.5 monitor must operate on at least a 1-in-3 day schedule unless a waiver for an alternative schedule has been approved per paragraph (d)(1)(ii) of this section. (D) Per 40 CFR 58.12(f)(1), manual PM samplers at NCore stations must operate on at least a 1-in-3 day schedule at sites without a collocated continuously operating federal equivalent PM method. Source: Design values from U.S. EPA Air Quality System Design Value Report (AMP 480) and Raw Data Report (AMP350) on Pb (85129), accessed on 25-Apr-2016 Page 11
20 Section 4. Recent and Proposed Modification to the Network This section discusses recent and proposed modification to the monitoring network. As required by 40 CFR Part 58.10, modifications within the next 18 months are included. SMAQMD is not formally requesting approval for modification through this network plan. Prior to a network modification, the District will work with the CARB to submit required documentation for official review and approval of proposed system modifications. CARB is the primary quality assurance organization of the SMAQMD. Sacramento-Bercut Dr. This site became operational on October 13, It currently monitors for CO, NO 2, black carbon, wind direction and speed, and outdoor temperature. As required by Appendix D to 40 CFR Part 58, a PM 2.5 sampler will be installed in winter 2016 and be operational by January 1, It will be a manual filter-based FRM sampler with 1 in 3 day schedule. Sacramento-Branch Center #2 No change anticipated. Elk Grove-Bruceville Rd. The District is considering discontinuing the speciated VOC (episodic) measurement at this site. Speciated VOC measurement at this site is not specifically required by Appendix D to 40 CFR Part 58, but is included as a measurement in Sacramento's portion of the California Alternative Plan (CAP III) 11. Speciated VOC concentrations collected at this site are low, representing background concentration. Sacramento-Del Paso Manor The Nephelometer is terminated as of April 1, It was a special purpose monitor originally installed in 1999 for the California Regional Particulate Air Quality Study (CRPAQS). In Revisions to Ambient Monitoring QA and Other Requirements promulgated on March 28, 2016 (81 FR 17248), EPA removed lead monitoring requirement at urban NCore site provided that the sampler has collected sufficient data to calculate a design value. Since the District meets the condition, termination of this lead monitor is being evaluated. Folsom-Natoma St No change anticipated. 11 Appendix D Page 12
21 Sacramento-Goldenland Ct The District will submit a request to terminate this site. The District will work with the CARB and EPA to request an approval for termination of these monitors. Sacramento-Goldenland Ct. is a redundant secondary type II PAMS, as nearby Sacramento-Del Paso Manor is a primary type II PAMS that measures a full suite of VOC. Furthermore, preliminary analysis shows this site does not measure the highest concentration of criteria pollutants. If this site is terminated, there are still enough monitors within this CBSA to satisfy the monitoring requirement in Appendix D to 40 CFR Part 58. For further discussion, please refer to the 2015 network assessment report 12 and Appendix E of this report. North Highlands-Blackfoot Way The District is in the process of negotiating a lease with the new property manager. If an agreement is not reached, the District will evaluate its options for relocation to an adjacent nearby property or possible termination of the monitoring station. Sloughhouse-Sloughouse Rd No change anticipated. Sacramento Health Dept.-Stockton Blvd. The District will submit a request for termination of the PM 10 TEOM and PM 10 SSI monitors. The District will work with the CARB and EPA to request an approval for termination of these monitors. The TEOM monitor is not required, and its data is not used for forecasting or analysis due to its negative bias during the winter time when there is an abundance of wood combustion. The SSI monitor also is not required because there is a sufficient number of SSI monitors in Sacramento MSA to meet the minimum monitoring requirement. Also, the District is considering moving the PM 2.5 FRM monitor to the new Near Road NO 2 monitoring site. This monitor is redundant as it collects the same PM 2.5 data as the nearby Sacramento-T Street. For further discussion, please refer to Section of the 2015 network assessment report 13 and Appendix E of this report. Rancho Seco This is a special purpose monitoring site that operates seasonally. The District will operate this site in the winter season as staff resources are available. 12 Trinity Consultants Air Monitoring Network Assessment (Sacramento Metropolitan Air Quality Management District) [cited 23 Apr 2016]. 13 Trinity Consultants Air Monitoring Network Assessment (Sacramento Metropolitan Air Quality Management District) [cited 23 Apr 2016]. Page 13
22 Section 5. PM and Lead Collocation Requirement Quality Assurance Requirements for SLAMS found in Appendix A to 40 CFR Part 58 requires collocation for PM 10, PM 2.5 FRM and FEM, PM , and Pb monitors. Section 3 in the appendix states that each method within a primary quality assurance organization (PQAO) must have 15 percent of the monitors collocated. SMAQMD is a part of CARB s PQAO. Therefore, collocated monitors operated by SMAQMD are part of the CARB PQAO. Currently, there are collocated PM 2.5 FRM and PM 10 FRM monitors at Sacramento-Del Paso Manor. There is a collocated PM 2.5 FEM monitor at Folsom- Natoma St. The CARB PQAO requires no source or non-source Pb monitoring. However, the CARB PQAO does have two NCore sites which are located at Fresno-Garland and Sacramento-Del Paso Manor. PQAO with only NCore and no source-oriented Pb monitoring do not have to collocate for Pb 14. The CARB PQAO, including the Del Paso Manor site, does not require any collocation for Pb. Similarly, SMAQMD is not required to collocate its PM monitors because it is determined on a national scale 15. For complete details on PM and Pb collocation, please refer to the latest edition of Annual Monitoring Network Report published by CARB CFR Part 58, Appendix A, CFR Part 58, Appendix A, California Air Resources Board Annual Monitoring Network Report [cited 8 Aug 2016] Page 14
23 Section 6. Process to Review Changes to PM 2.5 Monitoring Network 40 CFR Part 58 requires that this Annual Monitoring Plan document how State and Local Agencies provide for the review of changes to a PM 2.5 monitoring network that impact the location of a violating PM 2.5 monitor or the creation/change to a community monitoring zone, including a description of the proposed use of spatial averaging for purposes of making comparisons to the annual PM 2.5 NAAQS as set forth in Appendix N to Part 58 in 40 CFR 58. The affected State or local agency must document the process for obtaining public comment and include any comments received through the public notification process within their submitted plan. Note that spatial averaging does not apply in California because the state and local air monitoring districts collectively elected not to establish community monitoring zones in the 1990s. An informational comparison, which is not required by air monitoring regulation, on the number of PM 2.5 monitors by area and population has been included. The analysis can be found in Appendix D. The general process for any proposed change to the monitoring network is that the proposed change is discussed in this Annual Monitoring Plan. This report will be posted to our District Website for no less than 30 days for public review and comment. It will then be forwarded to EPA-Region IX for approval. The public review period was open from August 15, 2016 thru September 15, No comment was received during this period. Page 15
24 Section 7. Data Submission Requirements CARB submits precision, accuracy, and raw data for all District operated monitors in CARB is also the lead agency on annual data certification. The following submission dates are provided by CARB. A copy of the annual data certification is provided in Appendix C 2015 Precision/Accuracy reports submitted to AQS: Quarterly 2015 Annual data certification submitted: May 10, 2016 Page 16
25 Section 8. Review of Existing SMAQMD Air Monitoring Sites For each monitor at each monitoring site, the tables in Appendix A to this network plan provides details to determine if each monitor meets 40 CFR 58 requirements, including Appendix A (QA Requirements), C (FRM/FEM/ARM Requirements), D (Network Design Criteria), and E (Probe Sitting Criteria), when applicable. Unless as noted otherwise, each monitor operated in the SMAQMD ambient air monitoring network meets the requirements of 40 CFR 58, including Appendices A, C, D, and E. PM 2.5 monitor at Rancho Seco is a special purpose monitor but is not a FRM, FEM, or ARM monitor; it is not subject to Appendix A requirement Page 17
26 Section 9. Reference Approval and Promulgation of Implementation Plans; Designation of Areas for Air Quality Planning Purposes; State of California; PM10; Redesignation of Sacramento To Attainment; Approval of PM10 Redesignation Request and Maintenance Plan for Sacramento 78 Federal Register 187 (26 September, 2013), pp California Department of Transportation. "2013 Annual Average Daily Truck Traffic on the California State Highway System." Traffic Census. 3 April 2015 U.S. Census. "Metropolitan and Micropolitan Statistical Area Totals Dataset: Population and Estimated Components of Change: April 1, 2010 to July 1, 2014." December < 10 April 2015 U.S. Environmental Protection Agency. "8-Hour Ozone (2008) Nonattainment Area/State/County Report." 5 December Green Book March U.S. Environmental Protection Agency. "The 2011 National Emissions Inventory. Version 2" 4 March, Technology Transfer Network Clearinghouse for Inventories & Emissions Factors. 3 April Page 18
27 Appendix A Detailed Site and Monitor information Detailed site information covered in this appendix reflects air monitoring operation from January 1, 2015-December 31, A.1 Sacramento-Branch Center #2 Sacramento-Branch Center #2 is a PM 10 SSI site. This site was established, in early 2006, to replace the former Sacramento-Branch Center site, which was approximately one-quarter mile to the north. The objective of this site is to measure the representative concentration, as documented in the original site initiation reports filed in the late 1980s. The old site was relocated since nearby trees were a flow obstacle. Site Name Sacramento-Branch Center #2 AQS Site No Geographic Coordinates , (NAD27) Location Rooftop of building in the middle of County Maintenance Yard, located 10 miles east-southeast of downtown Sacramento. Address 3847 Branch Center Road, Sacramento, CA County Sacramento Distance from roadway 62 m Annual Average Daily Traffic (Vehicles/Day) Bradshaw Rd South of Old Placerville Rd.: 37,938 (SACDOT, 3/26/2014) Ground Cover Paved Representative Area (MSA) Sacramento--Arden-Arcade--Roseville, CA Page 19
 N")
 E")
 S")
")
28 W N E Panoramic view toward north from roof (May 2016) N E S Panoramic view toward east from roof (May 2016) E S W Panoramic view toward south from roof (May 2016) S W N Panoramic view toward west from roof (May 2016) Page 20
 that requires drip lines of tree to be at least 10 m away from probes and")
29 B C A D Google Earth image taken 7/13/15 shows some trees around Sacramento-Branch Center #2 air monitoring station. The circle above indicates no tree exist within a 10 m radius, which satisfy a siting criteria (Appendix E to 40 CFR Part 58) that requires drip lines of tree to be at least 10 m away from probes and inlets. Also, heights of the trees were calculated on-site on 5/6/16. Object C and D marks the tallest tree northeast and southeast of the station, respectively. Analyses in the following pages shows the object identified above do not restrict air flow to the roof top inlets and samplers. Therefore, each inlet and sampler has 360 of unrestricted airflow. Page 21
30 Distance between Object and Inlet or Probe (in meters) Gaseous Probe Object A (Tree) Object B (Tree) Object C (Tree) Object D (Tree) Object Protrusion above Inlet or Probe (in meters) Gaseous Probe Object A (Tree) 6.54 Object B (Tree) 2.92 Object C (Tree) 9.59 Object D (Tree) 5.38 Distance vs. Protrusion Ratio (must be 2) 18 Gaseous Probe Object A (Tree) 3.93 Object B (Tree) Object C (Tree) 4.89 Object D (Tree) Per Appendix E to 40 CFR Part 58, the distance from the obstacle to the probe, inlet, or monitoring path must be at least twice the height that the obstacle protrudes above the probe, inlet, or monitoring path. Page 22
31 Site Sacramento-Branch Center Start Date 4/1/2006 Collecting Agency SMAQMD Analytical Lab SMAQMD Reporting Agency CARB Pollutant PM10 Parameter code POC 1 Instrument manufacturer and model Sierra Anderson 1200 Sampling Method Hi Volume Method Code 063 Analysis Method FRM/FEM/ARM/Other Comparable to annual PM2.5 NAAQS? Monitoring objective Gravimetric FRM Not applicable NAAQS comparison, public info Statement of Purpose Measures PM10 concentration Monitor type Affiliation SLAMS None Site type Highest concentration Spatial scale Neighborhood Sampling Frequency 1 in 6 days Sampling season Year Round Distance from supporting structure/roof top 2.0 m obstructions on roof No obstructions obstructions not on roof No obstructions Distance from nearest tree drip line 36.6 m Distance to furnace or incinerator flue No furnace/flue Distance betw een collocated PM monitors Not collocated Distance w ith nearest PM monitor and its type No other PM monitors Unrestricted airflow (deg) 360 Probe height (agl) 6.3 m Probe material Not applicable Residence time Not applicable Changes in next 18 months? Frequency of flow rate verification Last Annual Performance Evaluation No Monthly 4/13/15, 10/7/15 Page 23
32 A.2 Sacramento-Bercut Dr This is an approved near-road monitoring site. Located one mile from Downtown Sacramento, this site is expected to measure the highest NO 2 concentration due to the emission from car and truck on Interstate 5, which is about 20 m from the site. The site started operation on October 13, Site Name Sacramento-Bercut AQS Site No Geographic Coordinates N, W Location On the downwind side of Interstate 5, one mile northnorthwest of downtown Sacramento. Address 100 Bercut Dr, Sacramento, CA County Sacramento Distance from roadway Interstate 5: 20 m Bercut Dr.: 5 m Annual Average Daily Traffic (Vehicles/Day) Interstate 5: 186,000 (Caltrans, 2013) Bercut Dr. south of Richards Blvd.: 2,709 (City of Sacramento, 2012) Ground Cover Pavement, with vegetation Representative Area (MSA) Sacramento--Arden-Arcade--Roseville, CA Page 24

 ENE SSE WSW Panoramic view")
 Page 25")

33 WSW NNW ENE Panoramic view toward north from air monitoring station roof (April 2016) NNW ENE SSE Panoramic view toward east from air monitoring station roof (April 2016) ENE SSE WSW Panoramic view toward south from air monitoring station roof (April 2016) SSE WSW NNW Panoramic view toward west from air monitoring station roof (April 2016) Page 25

34 G H F E D I C B A Above is a Google Earth image from 7/13/15, which is prior to the construction date of this site. The Google Earth image has not been updated since then to be included in this report. During construction, some vegetation was removed, as indicated by red X, to satisfy siting criteria. The circle above indicates no tree exist within a 10 m radius, which satisfy a siting criteria (Appendix E to 40 CFR Part 58) that requires drip lines of tree to be at least 10 m away from probes and inlets. Also, height of the tree and building was calculated on-site on 4/28/16 and is provided in the table on the following page. It shows the object identified in the image above do not restrict air flow to the roof top inlets and samplers. Therefore, with the exception of tree H, each inlet and sampler has 360 of unrestricted airflow. Tree H is an old growth heritage tree, as defined by Chapter of Sacramento City Code (SCC). It is protected by SCC from removal or significant pruning. Since the tree is directly downwind of emission source, it has limited scavenging effect and does not interfere with the emission source being monitored. During preconstruction planning effort, EPA staff found this tree acceptable to the near-road site Per correspondence with Elfego Felix, EPA Region 9, on August 6, 2013 Page 26
35 Distance between Object and Inlet or Probe (in meters) Gaseous Probe PM 2.5 Inlet Object A (Tree) Object B (Tree) Object C (Tree) Object D (Tree) Object E (Tree) Object F (Tree) Object G (Tree) Object H (Tree) Object I (Tree) Object Protrusion above Inlet or Probe (in meters) Gaseous Probe PM 2.5 Inlet Object A (Tree) Object B (Tree) Object C (Tree) Object D (Tree) Object E (Tree) Object F (Tree) Object G (Tree) Object H (Tree) Object I (Tree) Note: negative value indicates inlet or prober is taller Than the object, thus airflow is not obstructed Distance vs. Protrusion Ratio (must be 2) 21 Gaseous Probe PM 2.5 Inlet Object A (Tree) Object B (Tree) Object C (Tree) Object D (Tree) N/A N/A Object E (Tree) N/A Object F (Tree) Object G (Tree) Object H (Tree) 1.0 (A) 1.0 (A) Object I (Tree) (A) See discussion on page 27 Legend: Yellow shade denotes criteria not met Note: N/A value indicates inlet or prober is taller than the object, thus airflow is not obstructed 21 Per Appendix E to 40 CFR Part 58, the distance from the obstacle to the probe, inlet, or monitoring path must be at least twice the height that the obstacle protrudes above the probe, inlet, or monitoring path. Page 27
36 Site Sacramento-Bercut Dr Start Date 10/13/ /13/2015 Collecting Agency SMAQMD SMAQMD Analytical Lab Not applicable Not applicable Reporting Agency CARB CARB Pollutant Nitrogen Dioxide Carbon Monoxide Parameter code POC 1 1 Instrument manufacturer and model TAPI200UP TAPI 300U Sampling Method Instrumental Instrumental Method Code Analysis Method Photolytic- Chemiluminescence Gas Filter Correlation FRM/FEM/ARM/Other FEM FRM Comparable to annual PM2.5 NAAQS? Not applicable Not applicable Monitoring objective Statement of Purpose NAAQS comparison, public info, research Monitors near road emission at region's highest FE-AADT roadw ay NAAQS comparison, public info, research Monitors near road emission at region's highest FE-AADT roadw ay Monitor type SLAMS SLAMS Affiliation Near Road Near Road Site type Source Oriented Source Oriented Spatial scale Microscale Microscale Sampling Frequency Continuous Continuous Sampling season Year Round Year Round Distance from supporting structure/roof top 1.7 m 1.7 m obstructions on roof No obstructions No obstructions obstructions not on roof 24 m 24 m Distance from nearest tree drip line 11 m 11 m Distance to furnace or incinerator flue No furnace/flue No furnace/flue Distance betw een collocated PM monitors Not applicable Not applicable Distance w ith nearest PM monitor and its type 1.1 m (lo vol) 1.1 m (lo vol) Unrestricted airflow (deg) Probe height (agl) 4.4 m 4.4 m Probe material Teflon Teflon Residence time 19 s 18 s Changes in next 18 months? No No Frequency of one-point QC check Every other day Every other day Last Annual Performance Evaluation None (A) None (A) (A) No audit w as conducted yet because the monitor started in October 2016 Page 28
37 Site Sacramento-Bercut Dr Start Date 10/30/2015 1/1/2017 (A) Collecting Agency SMAQMD SMAQMD Analytical Lab N/A CARB Reporting Agency CARB CARB Pollutant Black Carbon PM2.5 Parameter code POC 1 1 Instrument manufacturer and model Magee Scientific M633 R & P 2025 Sampling Method Aethalometer Low volume w ith VSCC Method Code Analysis Method Optical Absorption Gravimetric FRM/FEM/ARM/Other Other FRM Comparable to annual PM2.5 NAAQS? Not applicable Yes Monitoring objective Statement of Purpose Public info, research Determines component of PM emission at region's highest FE- AADT roadw ay NAAQS comparison, public info, research Monitors near road emission at region's highest FE-AADT roadw ay Monitor type SLAMS SLAMS Affiliation Near Road Near Road Site type Source Oriented Source Oriented Spatial scale Neighborhood Neighborhood Sampling Frequency Continuous 1 in 3 days Sampling season Year Round Year Round Distance from supporting structure/roof top 1.8 m Not yet in operation obstructions on roof No obstructions Not yet in operation obstructions not on roof 24 m Not yet in operation Distance from nearest tree drip line 11 m Not yet in operation Distance to furnace or incinerator flue No furnace/flue Not yet in operation Distance betw een collocated PM monitors Not applicable Not yet in operation Distance w ith nearest PM monitor and its type Not applicable Not yet in operation Unrestricted airflow (deg) 336 Not yet in operation Probe height (agl) 4.3 m 5.0 m (estimated) Probe material Aluminum Unknow n Residence time Not applicable Not yet in operation Changes in next 18 months? No Installation of monitor Frequency of flow rate verification Monthly Not yet in operation Last Annual Performance Evaluation None (B) Not yet in operation (A) Anticipated start date (B) No audit w as conducted yet because the monitor started in October 2016 Page 29
38 Site Sacramento-Bercut Dr Start Date 10/30/ /30/ /30/ /30/2015 Collecting Agency SMAQMD SMAQMD SMAQMD SMAQMD Analytical Lab N/A N/A N/A N/A Reporting Agency CARB CARB CARB CARB Pollutant Outdoor Temperature Relative Humidity Wind Direction Wind Speed Parameter code POC Instrument manufacturer and Climatronics Climatronics Climatronics Climatronics model F-460 F-460 Sampling Method Instrumental Instrumental Instrumental Instrumental Method Code Analysis Method Machine Average Hygroscopic Plastic Film Vector Summation Vector Summation FRM/FEM/ARM/Other Other Other Other Other Comparable to annual PM2.5 NAAQS? Not applicable Not applicable Not applicable Not applicable Monitoring objective Public info, research Public info, research Public info, research Public info, research Statement of Purpose Measures representative meteorology Measures representative meteorology Measures representative meteorology Measures representative meteorology Monitor type SLAMS SLAMS SLAMS SLAMS Affiliation Near Road Near Road Near Road Near Road Site type Not applicable Not applicable Not applicable Not applicable Spatial scale Not applicable Not applicable Not applicable Not applicable Sampling Frequency Continuous Continuous Continuous Continuous Sampling season Year Round Year Round Year Round Year Round Distance from supporting structure/roof top No supporting structure No supporting structure No supporting structure No supporting structure obstructions on roof No obstructions No obstructions No obstructions No obstructions obstructions not on roof 36 m 36 m 36 m 36 m Distance from nearest tree drip line Not applicable Not applicable Not applicable Not applicable Distance to furnace or incinerator flue No furnace/flue No furnace/flue No furnace/flue No furnace/flue Distance betw een collocated PM monitors Not applicable Not applicable Not applicable Not applicable Distance w ith nearest PM monitor and its type Not applicable Not applicable Not applicable Not applicable Unrestricted airflow (deg) Probe height (agl) 10 m 10 m 10 m 10 m Probe material Not applicable Not applicable Not applicable Not applicable Residence time Not applicable Not applicable Not applicable Not applicable Changes in next 18 months? No No No No Frequency of one-point QC check Not applicable Not applicable Not applicable Not applicable Last Annual Performance Evaluation None (A) None (A) None (A) None (A) (A) No audit w as conducted yet because the monitor started in October 2016 Page 30
39 A.3 Elk Grove-Bruceville Bruceville air monitoring site is sited in a rural area 4 miles south of Elk Grove, CA, and 20 miles south of Downtown Sacramento. It was initiated in 1992 to replace the former Sacramento- Meadowview Road O 3 monitoring site. This site is the upwind O 3 and ozone precursor monitoring site for our network, also known as a PAMS Type I site. It measures O 3, NO 2, total NMHC, speciated VOC (episodic only), PM 2.5 BAM, WD, WS, TMP, RH, SRD, UV radiation, precipitation, and atmospheric pressure Adjacent to the air monitoring site is the Franklin Field Radar Wind Profiler (RWP) for measurement of upper level winds and temperature. This RWP is operated year-round. Collection of upper air meteorology data is a requirement for the PAMS program. Site Name Elk Grove-Bruceville AQS Site No Geographic Coordinates (WGS84) Location Rural area located 4 miles south of Elk Grove, CA. Address Bruceville Rd, Elk Grove, CA County Sacramento Distance from roadway 76 m Annual Average Daily Traffic (Vehicles/Day) Bruceville Rd south of Lambert Rd.: 1,717 (SACDOT, 7/16/2014) Ground Cover Vegetated Representative Area (MSA) Sacramento--Arden-Arcade--Roseville, CA Page 31

 E S W Panoramic view")
 Page 32")

40 W N E Panoramic view toward north from air monitoring station roof (April 2016) N E S Panoramic view toward east from air monitoring station roof (April 2016) E S W Panoramic view toward south from air monitoring station roof (April 2016) W View toward west from air monitoring station roof (April 2016) Page 32
 that requires")

41 A B D C Google Earth image from 7/13/15 shows only a couple tree in the vicinity of the station. The circle above indicates no tree exist within a 10 m radius, which satisfy a siting criteria (Appendix E to 40 CFR Part 58) that requires drip lines of tree to be at least 10 m away from probes and inlets. Also, height of the trees were calculated on-site on 4/20/16. Analyses in the following pages shows the object identified above do not restrict air flow to the roof top inlets and samplers. Therefore, each inlet and sampler has 360 of unrestricted airflow. Page 33
42 Distance between Object and Inlet or Probe (in meters) Gaseous Probe PM 2.5 Inlet Object A (Tree) Object B (Tree) Object C (Tree) Object D (Building) Object Protrusion above Inlet or Probe (in meters) Gaseous Probe PM 2.5 Inlet Object A (Tree) Object B (Tree) Object C (Tree) Object D (Building) Note: negative value indicates inlet or prober is taller than the object, thus airflow is not obstructed Distance vs. Protrusion Ratio (must be 2) 22 Gaseous Probe PM 2.5 Inlet Object A (Tree) N/A Object B (Tree) Object C (Tree) Object D (Building) N/A N/A Note: N/A indicates inlet or prober is taller than the object, thus airflow is not obstructed 22 Per Appendix E to 40 CFR Part 58, the distance from the obstacle to the probe, inlet, or monitoring path must be at least twice the height that the obstacle protrudes above the probe, inlet, or monitoring path. Page 34
43 Site Elk Grove-Bruceville Start Date 7/1/1992 7/1/1992 7/1/1996 7/1/1996 Collecting Agency SMAQMD SMAQMD SMAQMD SMAQMD Analytical Lab N/A N/A N/A ERG, Inc Reporting Agency CARB CARB CARB CARB Pollutant Ozone Nitrogen Dioxide Total NMHC Speciated VOC Parameter code POC Instrument manufacturer and Xontech TAPI 400E TEI 42I TEI 55C model 910A/912 Sampling Method Instrumental Instrumental Instrumental 6L Pressurized Canister Method Code Analysis Method Ultra Violet Absorption Chemiluminescence Flame ionization detector Dual Fid - Pams FRM/FEM/ARM/Other FEM FRM Other Other Comparable to annual PM2.5 NAAQS? Not applicable Not applicable Not applicable Not applicable Monitoring objective NAAQS comparison, public info NAAQS comparison, public info Public info, research Research Statement of Purpose Measures background O 3 concentration at upw ind site Measures background ozone precursor concentration Measures background ozone precursor concentration Measures background ozone precursor concentration Monitor type SLAMS SLAMS SLAMS SLAMS Affiliation PAMS (Type I) PAMS (Type I) PAMS (Type I) PAMS (Type I) Site type Upw ind/background Upw ind/background Upw ind/background Upw ind/background Spatial scale Urban Neighborhood Neighborhood Neighborhood Sampling Frequency Continuous Continuous Continuous Episodic Sampling Sampling season Year Round Year Round Year Round July thru Sep Distance from supporting structure/roof top 1.7 m from roof top 1.7 m from roof top 1.7 m from roof top 1.7 m from roof top obstructions on roof No obstructions No obstructions No obstructions No obstructions obstructions not on roof No obstructions No obstructions No obstructions No obstructions Distance from nearest tree drip line 26 m 26 m 26 m 26 m Distance to furnace or incinerator flue No furnace/flue No furnace/flue No furnace/flue No furnace/flue Distance betw een collocated PM monitors Not applicable Not applicable Not applicable Not applicable Distance w ith nearest PM monitor and its type 1.1 m (lo vol) 1.1 m (lo vol) 1.1 m (lo vol) 1.1 m (lo vol) Unrestricted airflow (deg) Probe height (agl) 4.9 m 4.9 m 4.9 m 4.9 m Probe material FEP Teflon FEP Teflon FEP Teflon Stainless Steel Residence time 18.0 s 17.8 s 16.9 s 2 s Changes in next 18 months? No No No Yes Frequency of one-point QC check Last Annual Performance Evaluation Every other day Every other day Every other day Pre- and postseasonally check 4/14/15 4/14/15 2/17/16 N/A Page 35
44 Site Elk Grove-Bruceville Start Date 12/1/2000 Collecting Agency SMAQMD Analytical Lab N/A Reporting Agency CARB Pollutant PM2.5 Parameter code POC 3 Instrument manufacturer and model Met One 1020 BAM Sampling Method Very sharp cut cyclone Method Code 731 Analysis Method FRM/FEM/ARM/Other Comparable to annual PM2.5 NAAQS? Monitoring objective Beta Attenuation Other No Public info Statement of Purpose Monitor type Affiliation Measures background concentration and transport of PM2.5 from San Joaquin Valley for PM2.5 forecasting SLAMS None Site type General/Background Spatial scale Neighborhood Sampling Frequency Continuous Sampling season Year Round Distance from supporting structure/roof top 2.1 m from roof top obstructions on roof No obstructions obstructions not on roof No obstructions Distance from nearest tree drip line 25 m Distance to furnace or incinerator flue No furnace/flue Distance betw een collocated PM monitors Not Collocated Distance w ith nearest PM monitor and its type Not applicable Unrestricted airflow (deg) 360 Probe height (agl) 5.4 m Probe material Not applicable Residence time Not applicable Changes in next 18 months? Frequency of flow rate verification Last Annual Performance Evaluation No Bi-monthly 4/14/15, 10/7/15 Page 36
45 Site Elk Grove-Bruceville Start Date 8/1/1996 8/1/1996 7/1/1997 8/1/1997 Collecting Agency SMAQMD SMAQMD SMAQMD SMAQMD Analytical Lab N/A N/A N/A N/A Reporting Agency CARB CARB CARB CARB Pollutant Outdoor Temperature Relative Humidity Barometric Pressure Precipitation Parameter code POC Instrument manufacturer and model Climatronics Climatronics Climatronics Climatronics Sampling Method Instrumental Instrumental Instrumental Bucket Method Code Analysis Method Machine Average Hygroscopic Plastic Continuous Or Aneroid Film Incremental FRM/FEM/ARM/Other Other Other Other Other Comparable to annual PM2.5 NAAQS? Not applicable Not applicable Not applicable Not applicable Monitoring objective Public info Public info Public info Public info Statement of Purpose Measures representative meteorology Measures representative meteorology Measures representative meteorology Measures representative meteorology Monitor type SLAMS SLAMS SLAMS SLAMS Affiliation PAMS (Type I) PAMS (Type I) PAMS (Type I) PAMS (Type I) Site type Not applicable Not applicable Not applicable Not applicable Spatial scale Not applicable Not applicable Not applicable Not applicable Sampling Frequency Continuous Continuous Continuous Continuous Sampling season Year Round Year Round Year Round Year Round Distance from supporting structure/roof top No supporting structure No supporting structure No supporting structure No supporting structure obstructions on roof No obstructions No obstructions No obstructions No obstructions obstructions not on roof No obstructions No obstructions No obstructions No obstructions Distance from nearest tree drip line Not applicable Not applicable Not applicable Not applicable Distance to furnace or incinerator flue No furnace/flue No furnace/flue No furnace/flue No furnace/flue Distance betw een collocated PM monitors Not applicable Not applicable Not applicable Not applicable Distance w ith nearest PM monitor and its type Not applicable Not applicable Not applicable Not applicable Unrestricted airflow (deg) Probe height (agl) 10 m 10 m 4.5 m 1.6 m Probe material Not applicable Not applicable Not applicable Not applicable Residence time Not applicable Not applicable Not applicable Not applicable Changes in next 18 months? No No No No Frequency of one-point QC check Last Annual Performance Evaluation Not applicable Not applicable Not applicable Not applicable 4/14/15 Not audited 4/14/15 Not audited Page 37
46 Site Elk Grove-Bruceville Start Date 8/1/1996 8/1/1997 8/1/1996 8/1/1996 Collecting Agency SMAQMD SMAQMD SMAQMD SMAQMD Analytical Lab N/A N/A N/A N/A Reporting Agency CARB CARB CARB CARB Pollutant Solar Radiation UV Radiation Wind Direction Wind Speed Parameter code POC Instrument manufacturer and Climatronics Climatronics Climatronics Climatronics 100TUVR model F-460 F-460 Sampling Method Instrumental Instrumental Instrumental Instrumental Method Code Analysis Method Pyranometer UV Radiometer (Photometer) Vector Summation Vector Summation FRM/FEM/ARM/Other Other Other Other Other Comparable to annual PM2.5 NAAQS? Not applicable Not applicable Not applicable Not applicable Monitoring objective Public info Public info Public info Public info Statement of Purpose Measures representative meteorology Measures representative meteorology Measures representative meteorology Measures representative meteorology Monitor type SLAMS SLAMS SLAMS SLAMS Affiliation PAMS (Type I) PAMS (Type I) PAMS (Type I) PAMS (Type I) Site type Not applicable Not applicable Not applicable Not applicable Spatial scale Not applicable Not applicable Not applicable Not applicable Sampling Frequency Continuous Continuous Continuous Continuous Sampling season Year Round Year Round Year Round Year Round Distance from supporting structure/roof top No supporting structure No supporting structure No supporting structure No supporting structure obstructions on roof No obstructions No obstructions No obstructions No obstructions obstructions not on roof No obstructions No obstructions No obstructions No obstructions Distance from nearest tree drip line Not applicable Not applicable Not applicable Not applicable Distance to furnace or incinerator flue No furnace/flue No furnace/flue No furnace/flue No furnace/flue Distance betw een collocated PM monitors Not applicable Not applicable Not applicable Not applicable Distance w ith nearest PM monitor and its type Not applicable Not applicable Not applicable Not applicable Unrestricted airflow (deg) Probe height (agl) 10 m 10 m 10 m 10 m Probe material Not applicable Not applicable Not applicable Not applicable Residence time Not applicable Not applicable Not applicable Not applicable Changes in next 18 months? No No No No Frequency of one-point QC check Last Annual Performance Evaluation Not applicable Not applicable Not applicable Not applicable Not audited Not audited 4/14/15 4/14/15 Page 38
47 Site Elk Grove-Bruceville Start Date 6/1/1996 Collecting Agency SMAQMD Analytical Lab N/A Reporting Agency N/A Pollutant Upper Level Wind Direction/Wind Speed and Virtual Temp Parameter code Not applicable POC Not applicable Instrument manufacturer and model Radian LAP-3000 w ith RASS option Sampling Method Method Code Analysis Method FRM/FEM/ARM/Other Comparable to annual PM2.5 NAAQS? Monitoring objective Not applicable Not applicable 915 MHz Radar Wind Profiler, w ith RASS Other Not applicable Public info, research Statement of Purpose Measures representative upper level meteorology Monitor type SLAMS Affiliation PAMS (Type I) Site type Not applicable Spatial scale Not applicable Sampling Frequency Continuous Sampling season Year Round Distance from supporting structure/roof top No supporting structure obstructions on roof No obstructions obstructions not on roof No obstructions Distance from nearest tree drip line > 20 m Distance to furnace or incinerator flue No furnace/flue Distance betw een collocated PM monitors Not applicable Distance w ith nearest PM monitor and its type Not applicable Unrestricted airflow (deg) 360 Probe height (agl) Not applicable Probe material Not applicable Residence time Not applicable Changes in next 18 months? Frequency of one-point QC check Last Annual Performance Evaluation No N/A 6/22/15 Page 39
48 A.4 Sacramento-Del Paso Manor This air monitoring site was initiated in 1979 and eventually became the largest air monitoring site in the Sacramento Valley air basin. This site is also one of the largest in Northern California, in terms of number of parameters measured. In October 2009, EPA-Region IX approved this monitoring site as an NCore site. This is one of six NCore sites operating in California. It measures O 3, CO (trace level), NO 2, NOy, SO 2 (trace level), PM 10 (SSI- main and collocated), PM 10 TEOM, PM 10 coarse, Pb-PM 10, PM 2.5 FRM (main and collocated), PM 2.5 BAM, Speciated PM 2.5 (SASS), Black Carbon (Aethalometer), Scattering Coefficient (Nephelometer), WDresultant, WS-resultant, ambient temperature, relative humidity, and total solar radiation. This site is the current PM 2.5 design value site for this MSA. Located just downwind of Downtown Sacramento, Del Paso Manor has been selected as a PAMS Type II primary site. Besides the required meteorological parameters, this site also monitors for NMHC year-round and speciated VOC (C2-C12) and carbonyl during summertime. Speciation monitors at this site are part of the Chemical Speciation Network (CSN) and Speciated Trends Network. A URG300N sampler was installed in April 2009 joining the Met One Spiral Aerosol Speciation Sampler (SASS) that has been in service for many years. Site Name Sacramento-Del Paso Manor AQS Site No Geographic Coordinates , (WGS84) Location Neighborhood park located 7 miles east-northeast of downtown Sacramento. Address 2701 Avalon Drive, Sacramento, CA County Sacramento Distance from roadway 56 m Annual Average Daily Traffic (Vehicles/Day) Avalon Dr. south of Annette St.: 1,000 (estimated, two-lanes suburban local residential road) Ground Cover Vegetated Representative Area (MSA) Sacramento--Arden-Arcade--Roseville, CA Page 40
 N E S Panoramic")
 E S W Panoramic view toward south from")

49 W N E Panoramic view toward north from air monitoring station roof (May 2016) N E S Panoramic view toward east from air monitoring station roof (May 2016) E S W Panoramic view toward south from air monitoring station roof (May 2016) S W N Panoramic view toward west from air monitoring station roof (May 2016) Page 41
 that requires drip lines of tree to be at least 10 m away from probes and")
50 D E B C F G A H I J K Google Earth image from 7/13/15 shows some trees around Sacramento-Del Paso Manor air monitoring station. The circle above indicates no tree exist within a 10 m radius, which satisfy a siting criteria (Appendix E to 40 CFR Part 58) that requires drip lines of tree to be at least 10 m away from probes and inlets. Also, heights of the trees and building were calculated on-site on 5/3/16. Analyses in the following pages shows the object identified above do not restrict air flow to the roof top inlets and samplers. Therefore, each inlet and sampler has 360 of unrestricted airflow. Page 42
51 Distance between Object and Inlet or Probe (in meters) Gaseous Probe NO y Probe PM 10 Inlet (Primary) PM 10 Inlet (Collocated) Black Carbon Inlet VOC Inlet Object A (Tree) Object B (Tree) Object C (Tree) Object D (Tree) Object E (Tree) Object F (Tree) Object G (Tree) Object H (Building) Object I (Tree) Object J (Tree) Object K (Tree) PM 2.5 Inlet PM 2.5 Inlet PM Inlet PM 2.5 Inlet PM 2.5 Inlet Carbon (Primary) (Collocated) (Primary) (Continuous) (Speciation) Speciation Inlet Object A (Tree) Object B (Tree) Object C (Tree) Object D (Tree) Object E (Tree) Object F (Tree) Object G (Tree) Object H (Building) Object I (Tree) Object J (Tree) Object K (Tree) Object Protrusion above Inlet or Probe (in meters) Gaseous Probe NO y Probe PM 10 Inlet (Primary) PM 10 Inlet (Collocated) Black Carbon Inlet VOC Inlet Object A (Tree) Object B (Tree) Object C (Tree) Object D (Tree) Object E (Tree) Object F (Tree) Object G (Tree) Object H (Building) Object I (Tree) Object J (Tree) Object K (Tree) PM 2.5 Inlet PM 2.5 Inlet PM Inlet PM 2.5 Inlet PM 2.5 Inlet Carbon (Primary) (Collocated) (Primary) (Continuous) (Speciation) Speciation Inlet Object A (Tree) Object B (Tree) Object C (Tree) Object D (Tree) Object E (Tree) Object F (Tree) Object G (Tree) Object H (Building) Object I (Tree) Object J (Tree) Object K (Tree) Note: negative value indicates inlet or prober is taller than the object, thus airflow is not obstructed Page 43
52 Distance vs. Protrusion Ratio (must be 2) 23 Gaseous Probe NO y Probe PM 10 Inlet (Primary) PM 10 Inlet (Collocated) Black Carbon Inlet VOC Inlet Object A (Tree) 7.45 N/A Object B (Tree) 8.67 N/A Object C (Tree) N/A Object D (Tree) N/A Object E (Tree) Object F (Tree) Object G (Tree) N/A Object H (Building) N/A N/A N/A N/A N/A N/A Object I (Tree) Object J (Tree) N/A Object K (Tree) Gaseous Probe NO y Probe PM 10 Inlet (Primary) PM 10 Inlet (Collocated) Black Carbon Inlet VOC Inlet Object A (Tree) Object B (Tree) Object C (Tree) Object D (Tree) Object E (Tree) Object F (Tree) Object G (Tree) Object H (Building) N/A N/A N/A N/A N/A N/A Object I (Tree) Object J (Tree) Object K (Tree) Note: N/A indicates inlet or prober is taller than the object, thus airflow is not obstructed 23 Per Appendix E to 40 CFR Part 58, the distance from the obstacle to the probe, inlet, or monitoring path must be at least twice the height that the obstacle protrudes above the probe, inlet, or monitoring path. Page 44
53 Site Sacramento-Del Paso Manor Start Date 12/1/1979 7/1/2011 5/1/2013 7/1/2011 Collecting Agency SMAQMD SMAQMD SMAQMD SMAQMD Analytical Lab Not applicable Not applicable Not applicable Not applicable Reporting Agency CARB CARB CARB CARB Pollutant Ozone Carbon Monoxide Reactive Nitrogen Nitrogen Dioxide (trace level) Oxide Parameter code POC Instrument manufacturer and model TAPI 400E TAPI 300EU TAPI200UP TEI 42I-Y Sampling Method Instrumental Instrumental Instrumental Instrumental Method Code Analysis Method Ultra Violet Absorption Gas Filter Correlation Photolytic- Chemiluminescence Chemiluminescence FRM/FEM/ARM/Other FEM FRM FEM Other Comparable to annual PM2.5 NAAQS? N/A N/A N/A N/A Monitoring objective NAAQS comparison, public info, research NAAQS comparison, public info, research NAAQS comparison, public info, research Public info, research Statement of Purpose Measures elevated summer O3 levels near the dow nw ind edge of the central business district Measures representative w intertime CO concentration in populated area Measures O3 precursor emission near dow nw ind edge of central business district Measures representative concentration in populated area Monitor type SLAMS SLAMS SLAMS SLAMS NCORE, NCORE, NCORE, Affiliation NCORE PAMS (Type II) PAMS (Type II) PAMS (Type II) Site type Population Exposure Population Exposure Population Exposure Population Exposure Spatial scale Neighborhood Neighborhood Neighborhood Neighborhood Sampling Frequency Continuous Continuous Continuous Continuous Sampling season Year Round Year Round Year Round Year Round Distance from supporting structure/roof top 2.0 m from roof top 2.0 m from roof top 2.0 m from roof top No supporting structure obstructions on roof No obstructions No obstructions No obstructions No obstructions obstructions not on roof No obstructions No obstructions No obstructions No obstructions Distance from nearest tree drip line 23 m 23 m 23 m 23 m Distance to furnace or incinerator flue No furnace/flue No furnace/flue No furnace/flue No furnace/flue Distance betw een collocated PM monitors Not applicable Not applicable Not applicable Not applicable Distance w ith nearest PM monitor and its type 1.1 m (lo vol) 1.1 m (lo vol) 1.1 m (lo vol) Not applicable Unrestricted airflow (deg) Probe height (agl) 5.3 m 5.3 m 5.3 m 10 m Probe material FEP Teflon FEP Teflon FEP Teflon FEP Teflon Residence time 15 seconds 13 seconds 14 seconds 4 seconds Changes in next 18 months? No No No No Frequency of one-point QC check Last Annual Performance Evaluation Every fourth day Every fourth day Every fourth day Every fourth day 10/19/15 4/2/15 10/19/15 NA Page 45
54 Site Sacramento-Del Paso Manor Start Date 7/1/2011 8/1/1994 8/1/1994 8/1/1996 Collecting Agency SMAQMD SMAQMD SMAQMD SMAQMD Analytical Lab N/A N/A ERG, Inc ERG, Inc. Reporting Agency CARB CARB CARB CARB Pollutant Sulfur Dioxide (trace level) Total NMHC Speciated VOC Carbonyl Parameter code Multiple POC Instrument manufacturer and model TAPI 100EU TEI 55C Xontech 910A/912 Xontech 925 Sampling Method Instrumental Instrumental 6L Pressurized Canister DNPH Silica gel Method Code Analysis Method Ultraviolet Flame ionization Fluorescence detector Dual FID (multiple) FRM/FEM/ARM/Other FEM Other Other Other Comparable to annual PM2.5 NAAQS? N/A N/A N/A N/A Monitoring objective NAAQS comparison, public info, research Public info, research Research Research Statement of Purpose Measures representative concentration in populated area Measures O3 precursor emission near dow nw ind edge of central business district Measures O3 precursor emission near dow nw ind edge of central business district Measures O3 precursor emission near dow nw ind edge of central business district Monitor type SLAMS SLAMS SLAMS SLAMS Affiliation NCORE PAMS (Type II) PAMS (Type II) PAMS (Type II) Site type Population Exposure Highest concentration, population exposure Highest concentration, population exposure Highest concentration, population exposure Spatial scale Urban Neighborhood Neighborhood Neighborhood Sampling Frequency Continuous Continuous 1 in 3 days 1 in 3 days Sampling season Year Round Year Round July thru Sep July thru Sep Distance from supporting structure/roof top 2.0 m from roof top 2.0 m from roof top 2.2 m from roof top 2.2 m from roof top obstructions on roof No obstructions No obstructions No obstructions No obstructions obstructions not on roof No obstructions No obstructions No obstructions No obstructions Distance from nearest tree drip line 23 m 23 m 21 m 21 m Distance to furnace or incinerator flue No furnace/flue No furnace/flue No furnace/flue No furnace/flue Distance betw een collocated PM monitors Not applicable Not applicable Not applicable Not applicable Distance w ith nearest PM monitor and its type 1.1 m (lo vol) 1.1 m (lo vol) 1.0 m (lo vol) 1.0 m (lo vol) Unrestricted airflow (deg) Probe height (agl) 5.3 m 5.3 m 5.5 m 5.5 m Probe material FEP Teflon FEP Teflon Stainless Steel Stainless Steel Residence time 14 seconds 17 seconds 3 seconds 3 seconds Changes in next 18 months? No No No No Frequency of one-point QC check Last Annual Performance Evaluation Every fourth day Every fourth day Not applicable Not applicable 4/2/15 12/27/15 Not applicable Not applicable Page 46
55 Site Start Date 12/1/2001 Sacramento-Del Paso Manor 1/1/1986 1/1/1986 Collecting Agency SMAQMD SMAQMD SMAQMD Analytical Lab N/A CARB RTI Reporting Agency CARB CARB CARB Pollutant Black Carbon PM10 PM10 (Primary Monitor) (Audit Monitor) Parameter code POC Instrument manufacturer and model Anderson RTAA 800 Sierra-Anderson 1200 Sierra-Anderson 1200 Sampling Method Aethalometer Hi Volume Hi Volume Method Code Analysis Method Optical Absorption Gravimetric Gravimetric FRM/FEM/ARM/Other Other FRM FRM Comparable to annual PM2.5 NAAQS? N/A N/A N/A Monitoring objective Research NAAQS comparison, public info NAAQS comparison, public info Statement of Purpose Installed for CRPAQS study in 1999 Measures w intertime elevated PM level from motor vehicles and residential w ood combustion Collocated for QA purpose and Provides substitute data if necessary Monitor type SPM SLAMS SLAMS Affiliation None None None Site type Population Exposure Population Exposure Population Exposure Spatial scale Neighborhood Neighborhood Neighborhood Sampling Frequency Continuous 1 in 6 days 1 in 6 days Sampling season Year Round Year Round Year Round Distance from supporting structure/roof top 2.0 m from roof top 2.0 m from roof top 2.0 m from roof top obstructions on roof No obstructions No obstructions No obstructions obstructions not on roof No obstructions No obstructions No obstructions Distance from nearest tree drip line 24 m 22 m 23 m Distance to furnace or incinerator flue No furnace/flue No furnace/flue No furnace/flue Distance betw een collocated PM monitors Not applicable 2.2 m 2.2 m Distance w ith nearest PM monitor and its type 1.8 m (lo vol) 2.1 m (lo vol) 2.2 m (hi vol) Unrestricted airflow (deg) Probe height (agl) 5.2 m 5.1 m 5.1 m Probe material Aluminum Not applicable Not applicable Residence time 1 seconds Not applicable Not applicable Changes in next 18 months? No No No Frequency of flow rate verification Last Annual Performance Evaluation Not applicable Monthly Monthly Not applicable 5/7/15, 10/19/15 5/7/15, 10/19/15 Page 47
56 Site Sacramento-Del Paso Manor Start Date 1/1/1999 2/1/1999 5/1/2000 2/1/2000 Collecting Agency SMAQMD SMAQMD SMAQMD SMAQMD Analytical Lab CARB CARB N/A RTI Reporting Agency CARB CARB CARB RTI Pollutant PM2.5 PM2.5 (Primary Monitor) (Audit Monitor) PM2.5 PM2.5 Mass Speciated Parameter code POC Instrument manufacturer and model R & P 2025 R & P 2025 Met One 1020 BAM Met One SASS Sampling Method Low volume w ith VSCC Low volume w ith VSCC Very sharp cut cyclone Sharp cut cyclone Method Code Analysis Method Gravimetric Gravimetric Beta Attenuation Gravimetric FRM/FEM/ARM/Other FRM FRM Other Other Comparable to annual PM2.5 NAAQS? Yes Yes No No Monitoring objective NAAQS Comparison, research, public info NAAQS Comparison, research Public info, research Research Statement of Purpose Measures w intertime elevated PM level from motor vehicles and residential w ood combustion Collocated for QA purpose and Provides substitute data if necessary Provides real time PM Measurement from motor vehicles and residential w ood combustion Provides speciation data on urban PM emission Monitor type SLAMS SLAMS SLAMS SLAMS Affiliation NCORE None NCORE CSN STN, NCORE Site type Highest concentration, population exposure Highest concentration, population exposure Highest concentration, population exposure Highest concentration, population exposure Spatial scale Neighborhood Neighborhood Neighborhood Neighborhood Sampling Frequency 1 in 3 days 1 in 12 days Continuous 1 in 3 days Sampling season Year Round Year Round Year Round Year Round Distance from supporting structure/roof top 2.1 m from roof top 2.1 m from roof top 2.0 m from roof top 2.0 m from roof top obstructions on roof No obstructions No obstructions No obstructions No obstructions obstructions not on roof No obstructions No obstructions No obstructions No obstructions Distance from nearest tree drip line 23 m 24 m 21 m 22 m Distance to furnace or incinerator flue No furnace/flue No furnace/flue No furnace/flue No furnace/flue Distance betw een collocated PM monitors 1.6 m 1.6 m Not applicable Not applicable Distance w ith nearest PM monitor and its type 1.5 m (lo vol) 1.6 m (lo vol) 1.1 (lo vol) 2.2 m (hi vol) Unrestricted airflow (deg) Probe height (agl) 5.4 m 5.4 m 5.3 m 5.3 m Probe material Not applicable Not applicable Not applicable Not applicable Residence time Not applicable Not applicable Not applicable Not applicable Changes in next 18 months? No No No No Frequency of flow rate verification Last Annual Performance Evaluation Bi-Monthly Bi-Monthly Bi-monthly Monthly 5/7/15, 10/19/15 5/7/15, 10/19/15 5/7/15, 10/19/15 5/28/15, 11/24/15 Page 48
57 Site Start Date 4/1/2009 Sacramento-Del Paso Manor 4/1/2012 4/1/2012 Collecting Agency SMAQMD SMAQMD SMAQMD Analytical Lab RTI CARB RTI Reporting Agency RTI CARB CARB Pollutant Organic and elemental PM10 carbon (PM ) Lead Parameter code (multiple) POC Instrument manufacturer and model URG 3000N R & P 2025 R & P 2025 Sampling Method Quartz filter and cyclone inlet Low volume w ith VSCC Low volume w ith VSCC Method Code 842, Analysis Method (multiple) (A) Gravimetric X-Ray Fluorescence (EDXRF) FRM/FEM/ARM/Other Other FRM FRM Comparable to annual PM2.5 NAAQS? N/A N/A N/A Monitoring objective Research NAAQS comparison, public info, research NAAQS comparison, public info, research Statement of Purpose Provides speciation data on urban PM emission Measures PM mass to provide PM data Measures representative Pb concentration Monitor type SLAMS SLAMS SLAMS Affiliation CSN STN, NCORE NCORE NCORE (Non-source) Site type Highest concentration Population Exposure Population Exposure Spatial scale Neighborhood Neighborhood Urban Sampling Frequency 1 in 3 days 1 in 6 days 1 in 6 days Sampling season Year Round Year Round Year Round Distance from supporting structure/roof top 2.1 m from roof top 2.1 m from roof top 2.1 m from roof top obstructions on roof No obstructions No obstructions No obstructions obstructions not on roof No obstructions No obstructions No obstructions Distance from nearest tree drip line 22 m 23 m 23 m Distance to furnace or incinerator flue No furnace/flue No furnace/flue No furnace/flue Distance betw een collocated PM monitors Not applicable Not applicable Not applicable Distance w ith nearest PM monitor and its type 1.5 m (lo vol) 1.8 m (lo vol) 1.8 m (lo vol) Unrestricted airflow (deg) Probe height (agl) 5.4 m 5.4 m 5.4 m Probe material Not applicable Not applicable Not applicable Residence time Not applicable Not applicable Not applicable Changes in next 18 months? No No Yes Frequency of flow rate verification Monthly Bi-monthly Bi-monthly Last Annual Performance Evaluation 5/28/15, 11/24/15 5/7/15, 10/19/15 5/7/15, 10/19/15 (A) 88355, 88357, 88370, 88374, 88375, 88376, 88377, 88378, 88380, 88383, 88384, 88385, Page 49
58 Site Start Date 8/1/1994 8/1/1994 Sacramento-Del Paso Manor 9/1/1994 8/1/1994 8/1/1994 Collecting Agency SMAQMD SMAQMD SMAQMD SMAQMD SMAQMD Analytical Lab N/A N/A N/A N/A N/A Reporting Agency CARB CARB CARB CARB CARB Pollutant Outdoor Temperature Relative Humidity Solar Radiation Wind Direction Wind Speed Parameter code POC Instrument manufacturer and model Climatronics Climatronics Climatronics Climatronics F-460 Climatronics F-460 Sampling Method Instrumental Instrumental Instrumental Instrumental Instrumental Method Code Analysis Method Machine Average Hygroscopic Plastic Film Pyranometer Vector Summation Vector Summation FRM/FEM/ARM/Other Other Other Other Other Other Comparable to annual PM2.5 NAAQS? N/A N/A N/A N/A N/A Monitoring objective Public info, research Public info, research Public info Public info, research Public info, research Statement of Purpose Measures representative meteorology Measures representative meteorology Measures representative meteorology Measures representative meteorology Measures representative meteorology Monitor type SLAMS SLAMS SLAMS SLAMS SLAMS NCORE, NCORE, NCORE, NCORE, NCORE, Affiliation PAMS (Type II) PAMS (Type II) PAMS (Type II) PAMS (Type II) PAMS (Type II) Site type Not applicable Not applicable Not applicable Not applicable Not applicable Spatial scale Not applicable Not applicable Not applicable Not applicable Not applicable Sampling Frequency Continuous Continuous Continuous Continuous Continuous Sampling season Year Round Year Round Year Round Year Round Year Round Distance from supporting structure/roof top No supporting structure No supporting structure No supporting structure No supporting structure No supporting structure obstructions on roof No obstructions No obstructions No obstructions No obstructions No obstructions obstructions not on roof No obstructions No obstructions No obstructions No obstructions No obstructions Distance from nearest tree drip line Not applicable Not applicable Not applicable Not applicable Not applicable Distance to furnace or incinerator flue No furnace/flue No furnace/flue No furnace/flue No furnace/flue No furnace/flue Distance betw een collocated PM monitors Not applicable Not applicable Not applicable Not applicable Not applicable Distance w ith nearest PM monitor and its type Not applicable Not applicable Not applicable Not applicable Not applicable Unrestricted airflow (deg) Probe height (agl) 10 m 10 m 10 m 10 m 10 m Probe material Not applicable Not applicable Not applicable Not applicable Not applicable Residence time Not applicable Not applicable Not applicable Not applicable Not applicable Changes in next 18 months? No No No No No Frequency of one-point QC check Last Annual Performance Evaluation N/A N/A N/A N/A N/A 10/19/15 N/A N/A 10/19/15 10/19/15 Page 50
59 A.5 Folsom-Natoma St This site is in operation since This site replaced the former Folsom-Liedesdoff Street site. Approximately 20 miles northeast of Downtown Sacramento, Folsom-Natoma site is the maximum summertime O 3 monitoring site within Sacramento County, for days with the prevailing afternoon southwesterly winds. This site measures: O 3, NO 2, PM 2.5 BAM, Total NMHC, Speciated VOC, WD, WS, Temp, RH, and SRD. This site is a PAMS Type III site. This site has measured PM 2.5 since May 2002 with a continuous beta attenuation monitor (BAM). A new generation of BAM, meeting federal equivalent method (FEM) criteria, was installed in April In July 2015, a collocated monitor for the FEM BAM was installed. Site Name Folsom-Natoma Street AQS Site No Geographic Coordinates , (WGS84) Location Folsom City Hall (parking lot), located 20 miles eastnortheast of downtown Sacramento. Address 50 Natoma Street, Folsom, CA County Sacramento Distance from roadway 206 m Annual Average Daily Traffic (Vehicles/Day) Natoma St. southwest of Randall Dr.: 11,059 (City of Folsom, 2010) Ground Cover Vegetated Representative Area (MSA) Sacramento--Arden-Arcade--Roseville, CA Page 51
")


60 Panoramic view toward north from air monitoring station roof (May 2014) Panoramic view toward east from air monitoring station roof (May 2014) Panoramic view toward south from air monitoring station roof (May 2014) Panoramic view toward west from air monitoring station roof (May 2014) Page 52

61 C B D A F E G A virtual 3-D Google Earth image is not available. However, this image from 4/18/14 shows limited obstruction in a 50 m radius, if any. Heights of the trees and buildings were calculated on-site on 5/12/15. The circle above indicates no tree exist within a 10 m radius, which satisfy a siting criteria (Appendix E to 40 CFR Part 58) that requires drip lines of tree to be at least 10 m away from probes and inlets. Also, analyses in the following pages shows the object identified above do not restrict air flow to the roof top inlets and samplers. Therefore, each inlet and sampler has 360 of unrestricted airflow. Page 53
62 Distance between Object and Inlet or Probe (in meters) Gaseous Probe NOy Probe VOC PM2.5 (Primary) PM2.5 (Collocation) Object A (TV Tower) Object B (Building) Object C (Building) Object D (Building) Object E (Building) Object F (Building) Object G (Tree) Object Protrusion above Inlet or Probe (in meters) Gaseous Probe NOy Probe VOC PM2.5 (Primary) PM2.5 (Collocation) Object A (TV Tower) Object B (Building) Object C (Building) Object D (Building) Object E (Building) Object F (Building) Object G (Tree) Note: negative value indicates inlet or prober is taller than the object, thus airflow is not obstructed Distance vs. Protrusion Ratio (must be 2) 24 Gaseous Probe NOy Probe VOC PM2.5 (Primary) PM2.5 (Collocation) Object A (TV Tower) 0.37 (A) 0.36 (A) 0.37 (A) 0.47 (A) 0.33 (A) Object B (Building) N/A N/A N/A N/A N/A Object C (Building) N/A N/A N/A N/A N/A Object D (Building) N/A N/A N/A N/A N/A Object E (Building) N/A N/A N/A N/A N/A Object F (Building) N/A N/A N/A N/A N/A Object G (Tree) N/A (A) Object A is a broadcast tower with open frame structure. Even though it does not meet the ratio require, it does not block air flow to any probe or inlet Note: N/A value indicates inlet or prober is taller than the object, thus airflow is not obstructed 24 Per Appendix E to 40 CFR Part 58, the distance from the obstacle to the probe, inlet, or monitoring path must be at least twice the height that the obstacle protrudes above the probe, inlet, or monitoring path. Page 54
63 Site Start Date 7/1/1996 7/1/1996 Folsom-Natoma St. 7/1/2011 7/1/1996 7/1/1996 Collecting Agency SMAQMD SMAQMD SMAQMD SMAQMD SMAQMD Analytical Lab N/A N/A N/A N/A N/A Reporting Agency CARB CARB CARB CARB CARB Pollutant Ozone Nitrogen Dioxide NOY Total NMHC Speciated VOC Parameter code POC Instrument manufacturer and model TAPI 400E TEI 42C TEI 42I-Y TEI 55C Xontech 910A/912 Sampling Method Instrumental Instrumental Instrumental Instrumental 6L Pressurized Canister Method Code Analysis Method Ultra Violet Absorption Chemiluminescence Chemiluminescence FID Dual FID FRM/FEM/ARM/Other FEM FRM Other Other Other Comparable to annual PM2.5 NAAQS? Not applicable Not applicable Not applicable N/A N/A Monitoring objective NAAQS comparison, public info NAAQS comparison, public info Public info Public info, research Research Statement of Purpose Measure highest summer O3 level dow nw ind of urban area Measures concentration dow nw ind of urban area Measures representative concentration Measures concentration dow nw ind of urban area Measures concentration dow nw ind of urban area Monitor type SLAMS SLAMS SLAMS SLAMS SLAMS Affiliation PAMS (Type III) PAMS (Type III) PAMS (Type III) PAMS (Type III) PAMS (Type III) Site type Max O3 Concentration, Population Exposure Highest concentration Population Exposure Highest concentration Highest concentration Spatial scale Neighborhood Neighborhood Neighborhood Neighborhood Neighborhood Sampling Frequency Continuous Continuous Continuous Continuous 1 in 3 days Sampling season Year Round Year Round Year Round Year Round July thru Sep Distance from supporting structure/roof top 1.9 from roof top 1.9 from roof top 6.4 from roof top 1.9 from roof top 1.9 from roof top obstructions on roof No obstruction No obstruction No obstruction No obstruction No obstruction obstructions not on roof No obstruction No obstruction No obstruction No obstruction No obstruction Distance from nearest tree drip line 13 m 13 m 15 m 13 m 13 m Distance to furnace or incinerator flue No furnace/flue No furnace/flue No furnace/flue No furnace/flue No furnace/flue Distance betw een collocated PM monitors Not applicable Not applicable Not applicable Not applicable Not applicable Distance w ith nearest PM monitor and its type 2.3 m 2.3 m Not applicable 2.3 m 2.3 m Unrestricted airflow (deg) Probe height (agl) 5.5 m 5.5 m 10 m 5.5 m 5.5 m Probe material FEP Teflon FEP Teflon FEP Teflon FEP Teflon Stainless Steel Residence time 12.0 s 12.7 s 9 seconds 13.7 s 3 s Changes in next 18 months? No No No No No Frequency of one-point QC check Last Annual Performance Evaluation Every other day Every other day Every other day Every other day Not applicable 4/23/15 4/23/15 Not available 2/12/15 Not available Page 55
64 Site Folsom-Natoma St. Start Date 4/1/2013 7/1/2015 Collecting Agency SMAQMD SMAQMD Analytical Lab N/A N/A Reporting Agency CARB CARB Pollutant PM2.5 PM2.5 (Primary) (Audit Monitor) Parameter code POC 3 4 Instrument manufacturer and model Met One 1020 BAM Met One 1020 BAM Sampling Method Very sharp cut cyclone Very sharp cut cyclone Method Code Analysis Method Beta Attenuation Beta Attenuation FRM/FEM/ARM/Other FEM FEM Comparable to annual PM2.5 NAAQS? Yes Yes Monitoring objective Public info Public info Statement of Purpose Measures representative concentration Collocated for QA purpose and Provides substitute data if necessary Monitor type SLAMS SLAMS Affiliation None None Site type Population Exposure Population Exposure Spatial scale Neighborhood Neighborhood Sampling Frequency Continuous Continuous Sampling season Year Round Year Round Distance from supporting structure/roof top 2.1. from roof top 2.1. from roof top obstructions on roof No obstruction No obstruction obstructions not on roof No obstruction No obstruction Distance from nearest tree drip line 12 m 11 m Distance to furnace or incinerator flue No furnace/flue No furnace/flue Distance betw een collocated PM monitors 2.0 m 2.0 m Distance w ith nearest PM monitor and its type 2.0 m (lo vol) 2.0 m (lo vol) Unrestricted airflow (deg) Probe height (agl) 5.7 m 5.7 m Probe material Aluminum Aluminum Residence time Not applicable Not applicable Changes in next 18 months? No No Frequency of flow rate verification Last Annual Performance Evaluation Bi-monthly Bi-monthly 4/23/15, 10/7/15 10/7/15 Page 56
65 Site Start Date 7/1/1996 7/1/1996 Folsom-Natoma St. 7/1/1996 7/1/1996 7/1/1996 Collecting Agency SMAQMD SMAQMD SMAQMD SMAQMD SMAQMD Analytical Lab N/A N/A N/A N/A N/A Reporting Agency CARB CARB CARB CARB CARB Pollutant Outdoor Temperature Relative Humidity Solar Radiation Wind Direction Wind Speed Parameter code POC Instrument manufacturer and model Climatronics Climatronics Climatronics Climatronics F-460 Climatronics F-460 Sampling Method Instrumental Instrumental Instrumental Instrumental Instrumental Method Code Analysis Method Machine Average Hygroscopic Plastic Film Pyranometer Vector Summation Vector Summation FRM/FEM/ARM/Other Other Other Other Other Other Comparable to annual PM2.5 NAAQS? N/A N/A N/A N/A N/A Monitoring objective Public info Public info Public info Public info Public info Statement of Purpose Measures representative meteorology Measures representative meteorology Measures representative meteorology Measures representative meteorology Measures representative meteorology Monitor type SLAMS SLAMS SLAMS SLAMS SLAMS Affiliation PAMS (Type III) PAMS (Type III) PAMS (Type III) PAMS (Type III) PAMS (Type III) Site type Not applicable Not applicable Not applicable Not applicable Not applicable Spatial scale Not applicable Not applicable Not applicable Not applicable Not applicable Sampling Frequency Continuous Continuous Continuous Continuous Continuous Sampling season Year Round Year Round Year Round Year Round Year Round Distance from supporting structure/roof top No supporting structure No supporting structure No supporting structure No supporting structure No supporting structure obstructions on roof No obstruction No obstruction No obstruction No obstruction No obstruction obstructions not on roof No obstruction No obstruction No obstruction No obstruction No obstruction Distance from nearest tree drip line Not applicable Not applicable Not applicable Not applicable Not applicable Distance to furnace or incinerator flue No furnace/flue No furnace/flue No furnace/flue No furnace/flue No furnace/flue Distance betw een collocated PM monitors Not applicable Not applicable Not applicable Not applicable Not applicable Distance w ith nearest PM monitor and its type Not applicable Not applicable Not applicable Not applicable Not applicable Unrestricted airflow (deg) Probe height (agl) 10 m 10 m 10 m 10 m 10 m Probe material Not applicable Not applicable Not applicable Not applicable Not applicable Residence time Not applicable Not applicable Not applicable Not applicable Not applicable Changes in next 18 months? No No No No No Frequency of one-point QC check Last Annual Performance Evaluation Not applicable Not applicable Not applicable Not applicable Not applicable 4/23/15 Not available Not available 4/23/15 4/23/15 Page 57
66 A.6 Sacramento-Goldenland Ct. This site was established in late 2008 to replace the former Airport Rd. monitoring site, which was one mile away. This site measures O 3, CO, NO 2, Total NMHC, PM 10, WD, WS, Temp, RH, and SRD. Site Name Goldenland Court AQS Site No Geographic Coordinates , (WGS84) Location Site located 5 miles north of downtown Sacramento, in a residential/commercial area. Address 68 Goldenland Court, Sacramento, CA County Sacramento Distance from roadway 120 m Annual Average Daily Traffic (Vehicles/Day) Goldenland Ct. west of Gateway Park Dr.: 750 (Estimated) Ground Cover Vegetated Representative Area (MSA) Sacramento--Arden-Arcade--Roseville, CA Page 58

 E S W Panoramic view toward south")
 Page 59")
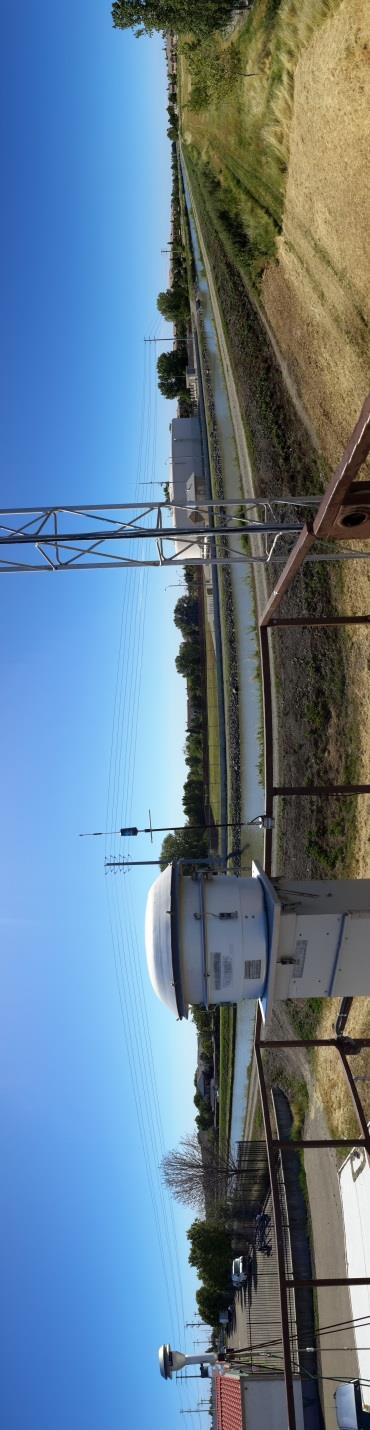
67 W N E S W Panoramic view toward north from air monitoring station roof (April 2016) N E S W Panoramic view toward east from air monitoring station roof (April 2016) E S W Panoramic view toward south from air monitoring station roof (April 2016) /S W N Panoramic view toward west from air monitoring station roof (April 2016) Page 59
 that requires drip lines of tree to be at least 10 m away from probes and")
68 A C B Google Earth image from 7/13/15 shows limited obstruction in a 50 m radius, if any. The circle above indicates no tree exist within a 10 m radius, which satisfy a siting criteria (Appendix E to 40 CFR Part 58) that requires drip lines of tree to be at least 10 m away from probes and inlets. Also, height of the tree and building were calculated on-site on 4/28/16. Analyses in the following pages shows the object identified above do not restrict air flow to the roof top inlets and samplers. Therefore, each inlet and sampler has 360 of unrestricted airflow. Page 60
69 Distance between Object and Inlet or Probe (in meters) Gaseous PM 10 Inlet Probe (Primary) PM 10 Inlet (Continuous) Object A (Tree) Object B (Building) Object C (Tree) Object Protrusion above Inlet or Probe (in meters) Gaseous PM 10 Inlet Probe (Primary) PM 10 Inlet (Continuous) Object A (Tree) Object B (Building) Object C (Tree) Note: negative value indicates inlet or prober is taller than the object, thus airflow is not obstructed Distance vs. Protrusion Ratio (must be 2) 25 Gaseous Probe PM 10 Inlet (Primary) PM 10 Inlet (Continuous) Object A (Tree) Object B (Building) N/A N/A N/A Object C (Tree) Note: N/A value indicates inlet or prober is taller than the object, thus airflow is not obstructed 25 Per Appendix E to 40 CFR Part 58, the distance from the obstacle to the probe, inlet, or monitoring path must be at least twice the height that the obstacle protrudes above the probe, inlet, or monitoring path. Page 61
70 Site Sacramento-Goldenland Ct. Start Date 10/1/ /1/ /1/ /1/2008 Collecting Agency SMAQMD SMAQMD SMAQMD SMAQMD Analytical Lab N/A N/A N/A N/A Reporting Agency CARB CARB CARB CARB Pollutant Ozone Carbon Monoxide Nitrogen Dioxide Total NMHC Parameter code POC Instrument manufacturer and model TAPI 400E TEI 48 TAPI200UP TEI 55C Sampling Method Instrumental Instrumental Instrumental Instrumental Method Code Analysis Method Ultra Violet Absorption Nondispersive Infrared Photolytic- Flame ionization Chemiluminescence detector FRM/FEM/ARM/Other FEM FRM FEM Other Comparable to annual PM2.5 NAAQS? Not applicable Not applicable Not applicable Not applicable Monitoring objective NAAQS comparison, public info NAAQS comparison, public info NAAQS comparison, public info Public info, research Statement of Purpose Measures O3 concentration near dow nw ind edge of Central Business District Measures representation concentrations Measures precursor concentration near dow nw ind edge of Central Business District Measures precursor concentration near dow nw ind edge of Central Business District Monitor type SLAMS SLAMS SLAMS SLAMS Affiliation PAMS (Type II) None PAMS (Type II) PAMS (Type II) Site type Population Exposure Population Exposure Population Exposure Population Exposure Spatial scale Urban Neighborhood Neighborhood Neighborhood Sampling Frequency Continuous Continuous Continuous Continuous Sampling season Year Round Year Round Year Round Year Round Distance from supporting structure/roof top 1.6 m from rooftop 1.6 m from rooftop 1.6 m from rooftop 1.6 m from rooftop obstructions on roof No obstruction No obstruction No obstruction No obstruction obstructions not on roof No obstruction No obstruction No obstruction No obstruction Distance from nearest tree drip line 25 m 25 m 25 m 25 m Distance to furnace or incinerator flue No furnace/flue No furnace/flue No furnace/flue No furnace/flue Distance betw een collocated PM monitors Not applicable Not applicable Not applicable Not applicable Distance w ith nearest PM monitor and its type 2.0 m (hi vol) 2.0 m (hi vol) 2.0 m (hi vol) 2.0 m (hi vol) Unrestricted airflow (deg) Probe height (agl) 5.1 m 5.1 m 5.1 m 5.1 m Probe material FEP Teflon FEP Teflon FEP Teflon FEP Teflon Residence time 7.5 seconds 7.7 seconds 7.9 seconds 9 seconds Changes in next 18 months? Yes Yes Yes Yes Frequency of one-point QC check Last Annual Performance Evaluation Every other day Every other day Every other day Every other day 5/27/15 5/27/15 5/27/15 12/30/15 Page 62
71 Site Sacramento-Goldenland Ct. Start Date 10/1/2008 6/1/2010 Collecting Agency SMAQMD SMAQMD Analytical Lab SMAQMD N/A Reporting Agency CARB CARB Pollutant PM10 (Primary) PM10 Parameter code POC 1 3 Instrument manufacturer and model Sierra Anderson 1200 R & P 1400A Sampling Method Hi Volume Instrumental Method Code Analysis Method Gravimetric TEOM-Gravimetric FRM/FEM/ARM/Other FRM FEM Comparable to annual PM2.5 NAAQS? Not applicable Not applicable Monitoring objective NAAQS comparison, public info NAAQS comparison, public info Statement of Purpose Measures representation concentrations Measures representation concentrations Monitor type SLAMS SLAMS Affiliation None None Site type Population Exposure Population Exposure Spatial scale Neighborhood Neighborhood Sampling Frequency 1 in 6 days Continuous Sampling season Year Round Year Round Distance from supporting structure/roof top 2.0 m from rooftop 2.0 m from rooftop obstructions on roof No obstruction No obstruction obstructions not on roof No obstruction No obstruction Distance from nearest tree drip line 25 m 24 m Distance to furnace or incinerator flue No furnace/flue No furnace/flue Distance betw een collocated PM monitors 2.0 m 2.0 m Distance w ith nearest PM monitor and its type 2.0 m 2.0 m Unrestricted airflow (deg) Probe height (agl) 5.1 m 5.3 m Probe material Not applicable Not applicable Residence time Not applicable Not applicable Changes in next 18 months? Yes Yes Frequency of flow rate verification Last Annual Performance Evaluation Monthly Monthly 5/1/15, 10/5/15 5/1/15, 10/5/15 Page 63
72 Site Sacramento-Goldenland Ct. Start Date 10/1/ /1/ /1/ /1/ /1/2008 Collecting Agency SMAQMD SMAQMD SMAQMD SMAQMD SMAQMD Analytical Lab N/A N/A N/A N/A N/A Reporting Agency CARB CARB CARB CARB CARB Pollutant Outdoor Temperature Relative Humidity Solar Radiation Wind Direction Wind Speed Parameter code POC Instrument manufacturer and model Climatronics Climatronics Climatronics Climatronics F-460 Climatronics F-460 Sampling Method Instrumental Instrumental Instrumental Instrumental Instrumental Method Code Analysis Method Machine Average Hygroscopic Plastic Film Pyranometer Vector Summation Vector Summation FRM/FEM/ARM/Other Other Other Other Other Other Comparable to annual PM2.5 NAAQS? Not applicable Not applicable Not applicable Not applicable Not applicable Monitoring objective Public info Public info Public info Public info Public info Statement of Purpose Measures representative meteorology Measures representative meteorology Measures representative meteorology Measures representative meteorology Measures representative meteorology Monitor type SLAMS SLAMS SLAMS SLAMS SLAMS Affiliation PAMS (Type II) PAMS (Type II) PAMS (Type II) PAMS (Type II) PAMS (Type II) Site type Not applicable Not applicable Not applicable Not applicable Not applicable Spatial scale Not applicable Not applicable Not applicable Not applicable Not applicable Sampling Frequency Continuous Continuous Continuous Continuous Continuous Sampling season Year Round Year Round Year Round Year Round Year Round Distance from supporting structure/roof top No supporting structure No supporting structure No supporting structure No supporting structure No supporting structure obstructions on roof No obstruction No obstruction No obstruction No obstruction No obstruction obstructions not on roof No obstruction No obstruction No obstruction No obstruction No obstruction Distance from nearest tree drip line 24 m 24 m 24 m 24 m 24 m Distance to furnace or incinerator flue No furnace/flue No furnace/flue No furnace/flue No furnace/flue No furnace/flue Distance betw een collocated PM monitors Not applicable Not applicable Not applicable Not applicable Not applicable Distance w ith nearest PM monitor and its type Not applicable Not applicable Not applicable Not applicable Not applicable Unrestricted airflow (deg) Probe height (agl) 10 m 10 m 10 m 10 m 10 m Probe material Not applicable Not applicable Not applicable Not applicable Not applicable Residence time Not applicable Not applicable Not applicable Not applicable Not applicable Changes in next 18 months? Yes Yes Yes Yes Yes Frequency of one-point QC check Last Annual Performance Evaluation Not applicable Not applicable Not applicable Not applicable Not applicable 5/27/15 Not available Not available 5/27/15 5/27/15 Page 64
73 A.7 North Highlands-Blackfoot North Highlands-Blackfoot has been in operation since The original site objective was to collect data in support of a proposed power plant project (Prevention of Significant Deterioration) at McClellan Air Force Base, which was located 3 miles southwest of the site. The purposed power plant project was canceled during the early 1980 s; and the air force base was closed in This entire site was designated as SPM upon its establishment. During an annual review of network design in the mid-1990s, the District needed additional NAMS sites for SO 2 and PM 10 to meet minimum monitoring requirements. Thus, the designation of the SO 2 and PM 10 monitors at North Highlands was changed from SPM to NAMS, which is now categorized as SLAMS. The SO 2 monitor was terminated in late In its comments on the District s 2013 Annual Network Plan, U.S. EPA recommend for the District to evaluate in particular the purpose of continuing to operate SPM parameters for extended periods of time. The District does not have any plan to terminate this site. It will reclassify all monitors currently operating as SPM, O 3, CO, and NO 2, as SLAMS. Site Name North Highlands-Blackfoot AQS Site No Geographic Coordinates , (WGS84) Location Residential area located 11 miles north-northeast of downtown Sacramento. Address 7823 Blackfoot Way, Antelope, CA County Sacramento Distance from roadway 100 m Annual Average Daily Traffic (Vehicles/Day) Navaho Dr. east of Aztec Way: <100 (estimated, twolanes suburban circular local residential road) Ground Cover Paved (to north), vegetated (to south) Representative Area (MSA) Sacramento--Arden-Arcade--Roseville, CA Page 65
")


74 Panoramic view toward north from air monitoring station roof (May 2014) Panoramic view toward east from air monitoring station roof (May 2014) Panoramic view toward south from air monitoring station roof (May 2014) Panoramic view toward west from air monitoring station roof (May 2014) Page 66
 that requires drip lines of tree to be at least 10 m away from probes and")
75 A B E D C Google Earth image from 7/13/15 shows limited obstruction in a 50 m radius, if any. Each of the markers identifies the tallest tree in its local cluster of vegetation. The circle above indicates no tree exist within a 10 m radius, which satisfy a siting criteria (Appendix E to 40 CFR Part 58) that requires drip lines of tree to be at least 10 m away from probes and inlets. Also, height of the tree was calculated on-site with trigonometry on 5/4/16. Analyses in the following pages shows most objects identified above do not restrict air flow to the roof top inlets and samplers. Tree D has grown enough to be a flow obstacle. The District will resolve this during Page 67
76 Distance between Object and Inlet or Probe (in meters) Gaseous Probe PM 10 Inlet Object A (Tree) Object B (Tree) Object C (Tree) Object D (Tree) Object E (Tree) Object Protrusion above Inlet or Probe (in meters) Gaseous Probe PM 10 Inlet Object A (Tree) Object B (Tree) Object C (Tree) Object D (Tree) Object E (Tree) Distance vs. Protrusion Ratio (must be 2) 27 Gaseous Probe PM 10 Inlet Object A (Tree) Object B (Tree) Object C (Tree) Object D (Tree) 1.90 (A) 2.03 Object E (Tree) (A) The District noted this tree has become a flow obstacle and will take necessary action to meet siting criteria Legend: Yellow shade denotes criteria not met 27 Per Appendix E to 40 CFR Part 58, the distance from the obstacle to the probe, inlet, or monitoring path must be at least twice the height that the obstacle protrudes above the probe, inlet, or monitoring path. Page 68
77 Site Start Date 12/1/1979 North Highlands-Blackfoot Way 12/1/ /1/1979 Collecting Agency SMAQMD SMAQMD SMAQMD Analytical Lab N/A N/A N/A Reporting Agency CARB CARB CARB Pollutant Ozone Carbon Monoxide Nitrogen Dioxide Parameter code POC Instrument manufacturer and model TAPI 400E TEI 48C TEI 42I Sampling Method Instrumental Instrumental Instrumental Method Code Analysis Method Ultra Violet Absorption Nondispersive Infrared Chemiluminescence FRM/FEM/ARM/Other FEM FRM FRM Comparable to annual PM2.5 NAAQS? N/A N/A N/A Monitoring objective NAAQS comparison, research NAAQS comparison, research NAAQS comparison, research Statement of Purpose Measures representative concentrations Measures representative concentrations Measures representative concentrations Monitor type SLAMS SLAMS SLAMS Affiliation None None None Site type Population Exposure Population Exposure Population Exposure Spatial scale Urban Neighborhood Neighborhood Sampling Frequency Continuous Continuous Continuous Sampling season Year Round Year Round Year Round Distance from supporting structure/roof top 2.0 m from roof top 2.0 m from roof top 2.0 m from roof top obstructions on roof No obstruction No obstruction No obstruction obstructions not on roof No obstruction No obstruction No obstruction Distance from nearest tree drip line 14 m 14 m 14 m Distance to furnace or incinerator flue No furnace/flue No furnace/flue No furnace/flue Distance betw een collocated PM monitors Not applicable Not applicable Not applicable Distance w ith nearest PM monitor and its type 1.1 (hi vol) 1.1 (hi vol) 1.1 (hi vol) Unrestricted airflow (deg) Probe height (agl) 5.2 m 5.2 m 5.2 m Probe material FEP Teflon FEP Teflon FEP Teflon Residence time 16.4 seconds 15.8 seconds 16.3 seconds Changes in next 18 months? No No No Frequency of one-point QC check Last Annual Performance Evaluation Every Other Day Every Other Day Every Other Day 4/16/15 4/16/15 4/16/15 Page 69
78 Site North Highlands-Blackfoot Way Start Date 1/1/1989 Collecting Agency SMAQMD Analytical Lab SMAQMD Reporting Agency CARB Pollutant PM10 Parameter code POC 1 Instrument manufacturer and model Sierra Anderson 1200 Sampling Method Hi Volume Method Code 063 Analysis Method FRM/FEM/ARM/Other Comparable to annual PM2.5 NAAQS? Monitoring objective Gravimetric FRM N/A NAAQS comparison, public info Statement of Purpose Measures representative concentrations Monitor type Affiliation SLAMS None Site type Population Exposure Spatial scale Neighborhood Sampling Frequency 1 in 6 days Sampling season Year Round Distance from supporting structure/roof top 2.0 m from roof top obstructions on roof No obstruction obstructions not on roof No obstruction Distance from nearest tree drip line 15 m Distance to furnace or incinerator flue No furnace/flue Distance betw een collocated PM monitors Not Collocated Distance w ith nearest PM monitor and its type Not applicable Unrestricted airflow (deg) 360 Probe height (agl) 5.2 m Probe material Not applicable Residence time Not applicable Changes in next 18 months? Frequency of flow rate verification Last Annual Performance Evaluation No Monthly 4/16/15, 10/7/15 Page 70
79 A.8 Rancho Seco This outlying site is the furthest away from the urban area. It was established in 2008 as a seasonal PM 2.5 special purpose monitoring site. The PM 2.5 data collected during the months of November through February is used for the South Sacramento County Winter PM 2.5 Study. This study is extended due to poor data capture rate at the beginning of the study period. This SPM meets siting criteria in Appendix E to 40 CFR Part 58 but does not meet quality assurance criteria in Appendix A; specifically, semi-annual flow rate audit for particulate matter was not conducted. The District is not submitting data collected with the e-bam because it is not an FEM, FRM or ARM monitor, and 40 CFR 58.20(b) only require data submittal of FEM, FRM or ARM monitor. Site Name Rancho Seco AQS Site No. NA Geographic Coordinates , (WGS84) Location Located at former Rancho Seco Nuclear Power Plant in rural area located 27 miles southeast of downtown Sacramento. Address No street address, Herald, CA County Sacramento Distance from roadway 13 m Annual Average Daily Traffic (Vehicles/Day) Rancho Seco Park (access road): <500 (estimated, twolane rural access road to a nearby regional park) Ground Cover Vegetated Representative Area (MSA) Sacramento--Arden-Arcade--Roseville, CA Page 71
80 Site Rancho Seco Start Date 11/1/2008 Collecting Agency SMAQMD Analytical Lab N/A Reporting Agency N/A Pollutant PM2.5 Parameter code POC 3 Instrument manufacturer and model Met One E-BAM Sampling Method Very sharp cut cyclone Method Code 731 Analysis Method FRM/FEM/ARM/Other Comparable to annual PM2.5 NAAQS? Monitoring objective Beta Attenuation Other No Public info, research Statement of Purpose Measures rural, background PM2.5 concentration Monitor type Affiliation SPM (A) None Site type Upw ind/ Background Spatial scale Neighborhood Sampling Frequency Continuous Sampling season November-February Distance from supporting structure/roof top Not applicable obstructions on roof No obstruction obstructions not on roof No obstruction Distance from nearest tree drip line 15.0 m Distance to furnace or incinerator flue No furnace/flue Distance betw een collocated PM monitors Not Collocated Distance w ith nearest PM monitor and its type Not applicable Unrestricted airflow (deg) 360 Probe height (agl) 2 m Probe material Not applicable Residence time Not applicable Changes in next 18 months? No Frequency of flow rate verification Monthly Last Annual Performance Evaluation Not available (A) This SPM does not meet requirement in Appendix A but meet requirement in Appendix E to 40 CFR Part 58 Page 72
81 A.9 Sloughhouse Located in a rural area 16.5 miles southeast of Downtown Sacramento, this site measures O 3, wind direction, wind speed, and PM 2.5. Sloughhouse was established in 1997 as a seasonal (April-October) O 3 special purpose monitoring site to measure elevated afternoon O 3 concentrations, under northwesterly winds, in support of the District's summer Spare the Air (O 3 episodic control measure) program. It was sited to cover data gaps in the O 3 monitoring network, which is used for forecasting summer AQI levels. A tree 10 m southeast of the O 3 inlet was removed in May 2011 in order to comply with Appendix E to 40 CFR 58 (Probe and Monitoring Path Siting Criteria). At that time, the O 3 monitor was then re-classified from SPM to SLAMS and began continuous monitoring year round. From November 2008 thru February 2013, seasonal (November February) PM 2.5 data was collected with a special purpose monitor (Met One Instruments e-bam). In November 2013, a non-fem BAM sampler was relocated here to improve data quality, and sampling season was also increased to year-round. This monitor meets quality assurance criteria and siting criteria in Appendix A and E to 40 CFR Part 58. The District is voluntarily submitting data collected with the non-fem SPM BAM sampler. Site Name Sloughhouse AQS Site No Geographic Coordinates , (WGS84) Location Fire Station in rural area located 16.5 miles eastsoutheast of downtown Sacramento. Address 7520 Sloughhouse Road, Sloughhouse, CA County Sacramento Distance from roadway 27 m Annual Average Daily Traffic (Vehicles/Day) Sloughhouse Rd south of Jackson Rd: 400 (Estimated) Ground Cover Vegetated Representative Area (MSA) Sacramento--Arden-Arcade--Roseville, CA Page 73
")


82 W N E Panoramic view toward north from air monitoring station roof (April 2015) N E S Panoramic view toward east from air monitoring station roof (April 2015) E S W Panoramic view toward south from air monitoring station roof (April 2015) S W N Panoramic view toward west from air monitoring station roof (April 2015) Page 74
 that requires drip lines of tree to be at least 10 m away from probes and")
83 A B C Google Earth image from 4/16/15 shows limited obstruction in a 50 m radius, if any. The circle above indicates no tree exist within a 10 m radius, which satisfy a siting criteria (Appendix E to 40 CFR Part 58) that requires drip lines of tree to be at least 10 m away from probes and inlets. Also, height of the tree and building was calculated on-site on 4/19/16. Analyses in the following pages shows the object identified above do not restrict air flow to the roof top inlets and samplers. Therefore, each inlet and sampler has 360 of unrestricted airflow. Page 75
84 Distance between Object and Inlet or Probe (in meters) Gaseous Probe PM 2.5 Inlet Object A (Tree) Object B (Building) Object C (Tree) Object Protrusion above Inlet or Probe (in meters) Gaseous Probe PM 2.5 Inlet Object A (Tree) Object B (Building) Object C (Tree) Note: negative value indicates inlet or prober is taller than the object, thus cannot be obstructed by the object Distance vs. Protrusion Ratio (must be 2) 29 Gaseous Probe PM 2.5 Inlet Object A (Tree) Object B (Building) N/A N/A Object C (Tree) Note: N/A indicates inlet or prober is taller than the object, thus cannot be obstructed by the object 29 Per Appendix E to 40 CFR Part 58, the distance from the obstacle to the probe, inlet, or monitoring path must be at least twice the height that the obstacle protrudes above the probe, inlet, or monitoring path. Page 76
85 Site Start Date 7/1/1997 Sloughhouse-Sloughhouse Rd. 7/1/1997 7/1/1997 Collecting Agency SMAQMD SMAQMD SMAQMD Analytical Lab N/A N/A N/A Reporting Agency CARB CARB CARB Pollutant Ozone Wind Direction Wind Speed Parameter code POC Instrument manufacturer and Climatronics Climatronics TAPI 400E model F-460 F-460 Sampling Method Instrumental Instrumental Instrumental Method Code Analysis Method Ultra Violet Absorption Vector Summation Vector Summation FRM/FEM/ARM/Other FEM Other Other Comparable to annual PM2.5 NAAQS? N/A N/A N/A Monitoring objective NAAQS comparison, public info Public info Public info Statement of Purpose Measures elevated O3 concentration under northw esterly w ind Measures representative meteorology Measures representative meteorology Monitor type SLAMS SLAMS SLAMS Affiliation None None None Site type Max O3 concentration Not applicable Not applicable Spatial scale Neighborhood Not applicable Not applicable Sampling Frequency Continuous Continuous Continuous Sampling season Year Round Year Round Year Round Distance from supporting structure/roof top 1.7 m from roof top 2.8 m 2.8 m obstructions on roof No obstructions No obstructions No obstructions obstructions not on roof No obstructions No obstructions No obstructions Distance from nearest tree drip line 18 m 18 m 18 m Distance to furnace or incinerator flue No furnace/flue No furnace/flue No furnace/flue Distance betw een collocated PM monitors Not applicable Not applicable Not applicable Distance w ith nearest PM monitor and its type 1.2 m (lo vol) Not applicable Not applicable Unrestricted airflow (deg) Probe height (agl) 4.6 m 5.8 m 5.8 m Probe material FEP Teflon Not applicable Not applicable Residence time 6 seconds Not applicable Not applicable Changes in next 18 months? No No No Frequency of one-point QC check Last Annual Performance Evaluation Daily N/A N/A 4/13/15 4/13/15 4/13/15 Page 77
86 Site Sloughhouse-Sloughhouse Rd. Start Date 11/5/2013 Collecting Agency SMAQMD Analytical Lab N/A Reporting Agency N/A Pollutant PM2.5 Parameter code POC 3 Instrument manufacturer and model Met One 1020 BAM Sampling Method Very sharp cut cyclone Method Code 731 Analysis Method FRM/FEM/ARM/Other Comparable to annual PM2.5 NAAQS? Monitoring objective Beta Attenuation Other No Public info, research Statement of Purpose Measures rural, background PM2.5 concentration Monitor type Affiliation SPM None Site type Upw ind/ Background Spatial scale Neighborhood Sampling Frequency Continuous Sampling season Year Round Distance from supporting structure/roof top 2.3 m from roof top obstructions on roof No obstructions obstructions not on roof No obstructions Distance from nearest tree drip line 18 m Distance to furnace or incinerator flue No furnace/flue Distance betw een collocated PM monitors Not Collocated Distance w ith nearest PM monitor and its type Not applicable Unrestricted airflow (deg) 360 Probe height (agl) 5.0 m Probe material Not applicable Residence time Not applicable Changes in next 18 months? Frequency of flow rate verification Last Annual Performance Evaluation No Bi-monthly 4/13/15 Page 78
87 A.10 Sacramento Health Dept.-Stockton Blvd According to old documentation, this PM monitoring site has been in existence since the late 1950s. This site measures PM 10 SSI, PM 10 TEOM, and PM 2.5 FRM. Since the District will submit a request to terminate this site (see Section 4, Recent and Proposed Modification to the Network), it will postpone trimming a vigorous, old-growth tree that protrudes higher than allowed by siting criteria in Appendix E to 40 CFR Part 58 to prevent unnecessary trimming of the tree if the termination request is approved.. Site Name Sacramento Health Department-Stockton Blvd. AQS Site No Geographic Coordinates , (WGS84) Location Rooftop in urban area located 2 miles east-southeast of downtown Sacramento. Address 2221 Stockton Blvd, Sacramento, CA County Sacramento Distance from roadway 46 m Annual Average Daily Traffic (Vehicles/Day) Stockton Blvd. south of U St.: 24,015 (City of Sacramento, 2012) Ground Cover Rooftop (surrounding area is paved) Representative Area (MSA) Sacramento--Arden-Arcade--Roseville, CA Page 79
")


88 W N E Panoramic view toward north from air monitoring station roof (May 2016) N E S Panoramic view toward north from air monitoring station roof (May 2016) E S W Panoramic view toward north from air monitoring station roof (May 2016) S W N Panoramic view toward north from air monitoring station roof (May 2016) Page 80
 causing siting criteria to not be met per 40CFR Part 58 Appendix E.")
89 C D B A Google Earth from 7/13/15 image shows a number of potential flow obstacles around Sacramento-Health Dept. air monitoring station. The circle above indicates a 10 m radius. Heights of the trees and building were calculated on-site on 5/4/16. Analyses on page 83 shows two trees (Object A & B) causing siting criteria to not be met per 40CFR Part 58 Appendix E. As noted in Section 4, Recent and Proposed Modification to the Network, the District will submit a termination request for this monitoring site. If the termination request is not approved, the District will work to resolve the obstructions. Page 81
90 Distance between Object and Inlet or Probe (in meters) PM10 Inlet (Primary) PM10 Inlet (Continuous) PM2.5 Inlet Object A (Tree) Object B (Tree) Object C (Building) Object D (Tree) Object Protrusion above Inlet or Probe (in meters) PM10 Inlet (Primary) PM10 Inlet (Continuous) PM2.5 Inlet Object A (Tree) Object B (Tree) Object C (Building) Object D (Tree) Note: negative value indicates inlet or prober is taller than the object, thus airflow is not obstructed Distance vs. Protrusion Ratio (must be 2) 31 PM10 Inlet (Primary) PM10 Inlet (Continuous) PM2.5 Inlet Object A (Tree) Object B (Tree) Object C (Building) Object D (Tree) Note: N/A indicates inlet or prober is taller than the object, thus airflow is not obstructed Legend: Yellow shade denotes criteria not met 31 Per Appendix E to 40 CFR Part 58, the distance from the obstacle to the probe, inlet, or monitoring path must be at least twice the height that the obstacle protrudes above the probe, inlet, or monitoring path. Page 82
91 Site Start Date 1/1/1986 Sacramento-Health Dept. 8/1/1994 1/1/1999 Collecting Agency SMAQMD SMAQMD SMAQMD Analytical Lab SMAQMD N/A CARB Reporting Agency CARB CARB CARB Pollutant PM10 (Primary) PM10 PM2.5 Parameter code POC Instrument manufacturer and model Sierra Anderson 1200 R & P 1400A R & P 2025 Sampling Method Hi Volume Instrumental Low volume w ith WINS Method Code Analysis Method Gravimetric Teom-Gravimetric Gravimetric FRM/FEM/ARM/Other FRM FEM FRM Comparable to annual PM2.5 NAAQS? N/A N/A Yes Monitoring objective NAAQS comparison, public info NAAQS comparison, public info NAAQS comparison, public info Statement of Purpose Measures representative concentration in urban area Measures representative concentration in urban area Measures representative concentration in urban area Monitor type SLAMS SLAMS SLAMS Affiliation None None None Site type Population Exposure Population Exposure Population exposure Spatial scale Neighborhood Neighborhood Neighborhood Sampling Frequency 1 in 6 days Continuous 1 in 3 days Sampling season Year Round Year Round Year Round Distance from supporting structure/roof top 2.0 m from rooftop 2.0 m from rooftop 2.0 m from rooftop obstructions on roof No obstructions No obstructions No obstructions obstructions not on roof No obstructions No obstructions No obstructions Distance from nearest tree drip line 12.8 m 10.1 m 12.8 m Distance to furnace or incinerator flue No furnace/flue No furnace/flue No furnace/flue Distance betw een collocated PM monitors 5.1 m 5.1 m Not applicable Distance w ith nearest PM 1.1 m (lo vol) 2.0 m (lo vol) 1.1 m (lo vol) monitor and its type 2.0 m (hi vol) Unrestricted airflow (deg) (B) 360 Probe height (agl) 5.5 m 5.5 m 5.6 m Probe material Not applicable Not applicable Not applicable Residence time Not applicable Not applicable Not applicable Changes in next 18 months? Yes Yes Yes Frequency of flow rate verification Monthly Bi-Monthly Monthly Last Annual Performance Evaluation 5/6/14, 10/3/14 3/8/11, 10/6/11 (A) 5/6/14, 10/3/14 (A) Malfunctioning since 2012 (B) Estimated w ith Google satellite imagery (4/16/2015) and protractor Page 83
92 A.11 Sacramento-1309 T Street The Sacramento-1309 T Street site is operated by the California Air Resources Board/Monitoring and Laboratory Division/Special Purpose Monitoring Section. This site has been in existence since This middle scale SLAMS air monitoring site measures O 3, NO 2, PM 2.5 FRM, Speciated PM 2.5, PM 2.5 BAM, PM 10 SSI, WD, WS, TMP, RH, and Atmospheric Pressure. T Street is part of the CSN and STN. Met One SASS has been in service since January 2002, and the URG3000N sampler has been in operation since April Site Name Sacramento-1309 T Street AQS Site No Geographic Coordinates , (NAD27) Location Residential area located in downtown Sacramento Address 1309 T Street, Sacramento, CA County Sacramento Distance from roadway 30 m Annual Average Daily T St. east of 11 th St.: 3,102 (City of Sacramento, 2009) Traffic (Vehicles/Day) Ground Cover Rooftop site (residential area is paved) Representative Area (MSA) Sacramento--Arden-Arcade--Roseville, CA Page 84
93 Site Sacramento-1309 T St. Start Date 4/1/1989 5/15/2013 Collecting Agency CARB CARB Analytical Lab N/A N/A Reporting Agency CARB CARB Pollutant Ozone Nitrogen Dioxide Parameter code POC 1 3 Instrument manufacturer and model TAPI 400E TAPI 200 EU/501 Sampling Method Instrumental Instrumental Method Code Analysis Method Ultra Violet Absorption Chemiluminescence FRM/FEM/ARM/Other FEM FEM Comparable to annual PM2.5 NAAQS? N/A N/A Monitoring objective NAAQS comparison, public info NAAQS comparison, public info Statement of Purpose Measures representative concentration in urban area Measures representative concentration in urban area Monitor type SLAMS SLAMS Affiliation None None Site type General/Background Population Exposure Spatial scale Urban Neighborhood Sampling Frequency Continuous Continuous Sampling season Year Round Year Round Distance from supporting structure/roof top 3.0 m 3.0 m obstructions on roof N/A N/A obstructions not on roof N/A N/A Distance from nearest tree drip line 50 m 50 m Distance to furnace or incinerator flue No furnace/flue No furnace/flue Distance betw een collocated PM monitors Not applicable Not applicable Distance w ith nearest PM monitor and its type Not available Not available Unrestricted airflow (deg) Probe height (agl) Probe material FEP Teflon FEP Teflon Residence time 5.4 seconds 6 seconds Changes in next 18 months? No No Frequency of one-point QC check Last Annual Performance Evaluation Daily Daily 11/9/15 11/9/15 Page 85
94 Site Start Date 5/1/ /13/1998 Sacramento-1309 T St. 5/1/2004 5/20/2014 (A) 4/1/2007 Collecting Agency CARB CARB CARB CARB CARB Analytical Lab CARB CARB N/A N/A CARB Reporting Agency CARB CARB CARB CARB CARB Pollutant PM10 PM2.5 PM2.5 Mass PM2.5 PM2.5 (Primary) Speciated Parameter code POC Instrument manufacturer and Met One 1020 Met One 1020 Met One 4 Models RP2025 model BAM BAM Met One SASS Sampling Method Instrumental Low volume w ith Very sharp cut Sharp cut cyclone VSCC cyclone Sharp cut cyclone Method Code Analysis Method Beta Attenuation Gravimetric Beta Attenuation Beta Attenuation Gravimetric FRM/FEM/ARM/Other FEM FRM SLAMS FEM Other Comparable to annual PM2.5 NAAQS? N/A Yes No No No NAAQS NAAQS Public info, Monitoring objective comparison, public comparison, public Public info NAAQS Research info info comparison Statement of Purpose Measures representative concentration in urban area Measures representative concentration in urban area Measures representative concentration in urban area Measures representative concentration in urban area Provide speciation data of urban emission Monitor type SLAMS SLAMS SLAMS SPM SLAMS Affiliation None None None None CSN Supplemental Site type Page 86 Population Exposure Highest concentration, population exposure Highest concentration, population exposure Population Exposure Highest concentration, population exposure Spatial scale Neighborhood Neighborhood Neighborhood Neighborhood Neighborhood Sampling Frequency Continuous 1 in 3 days Continuous Continuous 1 in 3 days Sampling season Year Round Year Round Year Round Year Round Year Round Distance from supporting structure/roof top 2.0m 2.0m 2.0 m 2.0 m 2.0m obstructions on roof N/A N/A N/A N/A N/A obstructions not on roof N/A N/A N/A N/A N/A Distance from nearest tree drip line 50 m 50 m 50 m 50 m 50 m Distance to furnace or incinerator flue No furnace/flue No furnace/flue No furnace/flue No furnace/flue No furnace/flue Distance betw een collocated PM monitors Not available Not available Not available Not available Not available Distance w ith nearest PM monitor and its type Not available Not available Not available Not available Not available Unrestricted airflow (deg) Probe height (agl) 10 m 10 m 10 m 10 m 10 m Probe material N/A N/A N/A N/A N/A Residence time N/A N/A N/A N/A N/A Changes in next 18 months? No Yes Yes Yes No Frequency of flow rate verification Bi-Monthly Monthly Bi-monthly Bi-monthly Monthly Last Annual Performance Evaluation 5/11/15, 11/9/15 5/11/15, 11/16/15 11/6/15 5/11/15 N/A (A) This monitor w as removed on 6/1/2015
95 Site Sacramento-1309 T St. Start Date 2/1/1992 2/1/1992 Collecting Agency CARB CARB Analytical Lab N/A N/A Reporting Agency CARB CARB Pollutant Wind Direction Wind Speed Parameter code POC 1 1 Instrument manufacturer and model Rm Young 3D Sonic Rm Young 3D Sonic Sampling Method Instrumental Instrumental Method Code Analysis Method Ultrasonic Anemometer Ultrasonic Anemometer FRM/FEM/ARM/Other Other Other Comparable to annual PM2.5 NAAQS? N/A N/A Monitoring objective Public info Public info Statement of Purpose Measures representative meteorology Measures representative meteorology Monitor type SLAMS SLAMS Affiliation None None Site type N/A N/A Spatial scale N/A N/A Sampling Frequency Continuous Continuous Sampling season Year Round Year Round Distance from supporting structure/roof top 9.0 m 9.0 m obstructions on roof N/A N/A obstructions not on roof N/A N/A Distance from nearest tree drip line 50 m 50 m Distance to furnace or incinerator flue No furnace/flue No furnace/flue Distance betw een collocated PM monitors Not applicable Not applicable Distance w ith nearest PM monitor and its type Not applicable Not applicable Unrestricted airflow (deg) Probe height (agl) 15 m 15 m Probe material N/A N/A Residence time N/A N/A Changes in next 18 months? No No Frequency of one-point QC check Last Annual Performance Evaluation N/A N/A N/A N/A Page 87
96 This page is intentionally left blank Page 88
97 Appendix B Minimum Monitoring Requirement Assessment Table B-1 Number of SLAMS Monitoring Site within Sacramento MSA 32 Pollutant Required Monitors in Sacramento MSA California Air Resources Board (CARB) El Dorado County APCD Placer County AQMD Sacramento Metropolitan AQMD Yolo-Solano AQMD Total Monitors in Sacramento MSA O CO NO 2 Area Wide Near-Road SO Pb NCore Non-Source Oriented Source Oriented PM PM 2.5 FEM/FRM Continuous (A) PM U.S. EPA Air Quality System Monitor Description Report (AMP 390), accessed on 25-Apr-2016 Page 89
98 Figure B-1 MOU on Shared Monitoring Responsibility with CARB, Page 1 Page 90
99 Figure B-2 MOU on Shared Monitoring Responsibility with CARB, Page 2 Page 91
100 This page is intentionally left blank Page 92

101 Appendix C Copy of Annual Data Certification Letter Figure C-1 A Copy of 2016 Data Certification Letter, Page 1 Page 93
2017 ANNUAL MONITORING NETWORK PLAN
 2017 ANNUAL MONITORING NETWORK PLAN SACRAMENTO METROPOLITAN AIR QUALITY MANAGEMENT DISTRICT PROGRAM COORDINATION DIVISION 777 12 TH STREET, 3 RD FLOOR SACRAMENTO, CA 95814 (916) 874-4800 AIRQUALITY.ORG
2013 ANNUAL AIR MONITORING NETWORK PLAN CHECKLIST (Updated 2/27/2013) Year: Agency:
 Year: Agency:") 2013 ANNUAL AIR MONITORING NETWORK PLAN CHECKLIST (Updated 2/27/2013) Year: Agency: 40.10(a)(1) requires that each ANP include regarding the following types of monitors: SLAMS monitoring stations including
2013 ANNUAL AIR MONITORING NETWORK PLAN CHECKLIST (Updated 2/27/2013) Year: Agency: 40.10(a)(1) requires that each ANP include regarding the following types of monitors: SLAMS monitoring stations including
2012 AMBIENT AIR MONITORING NETWORK PLAN
 2012 AMBIENT AIR MONITORING NETWORK PLAN Monitoring and Compliance Division July 9, 2012 SLOAPCD 2012 Network Plan - 1-7/9/2012 Table of Contents 1. Introduction... 1 2. Overview of Network Operation...
Gila River Indian Community 2016 AMBIENT AIR MONITORING NETWORK REVIEW
 Gila River Indian Community 2016 AMBIENT AIR MONITORING NETWORK REVIEW GRIC San Tan Mountains to the north, 2016 Gila River Indian Community Department of Environmental Quality Air Quality Air Monitoring
2018 ANNUAL NETWORK PLAN DIVISION OF NATURAL RESOURCES AND ENVIRONMENTAL MANAGEMENT AMBIENT AIR QUALITY MONITORING PROGRAM CITY OF HUNTSVILLE, ALABAMA
 2018 ANNUAL NETWORK PLAN DIVISION OF NATURAL RESOURCES AND ENVIRONMENTAL MANAGEMENT AMBIENT AIR QUALITY MONITORING PROGRAM CITY OF HUNTSVILLE, ALABAMA NATURAL RESOURCES AND ENVIRONMENTAL MANAGEMENT Post
2017 Annual Network Plan for Ambient Air Monitoring
 2017 Annual Network Plan for Ambient Air Monitoring July 1, 2017 North Coast Unified Air Quality Management District 707 L Street, Eureka, CA 95501 Telephone (707) 443-3093 - FAX (707) 443-3099 http://www.ncuaqmd.org
2018 Annual Network Plan for Ambient Air Monitoring
 2018 Annual Network Plan for Ambient Air Monitoring July 1, 2018 North Coast Unified Air Quality Management District 707 L Street, Eureka, CA 95501 (707) 443-3093 www.ncuaqmd.org Contents Contents... 2
VENTURA COUNTY AIR POLLUTION CONTROL DISTRICT 2009 AMBIENT AIR MONITORING NETWORK PLAN. September County Square Drive Ventura, CA 93003
 VENTURA COUNTY AIR POLLUTION CONTROL DISTRICT 2009 AMBIENT AIR MONITORING NETWORK PLAN September 2009 669 County Square Drive Ventura, CA 93003 Contact: Keith Duval Table of Contents 1. 0 Introduction..................................................................................................................
2017 Ambient Air Monitoring Network Plan
 2017 Ambient Air Monitoring Network Plan Fiscal, Administrative & Technical Services June 2017 Table of Contents List of Abbreviations... 4 Introduction... 5 General Information on Air Monitoring Networks...
San Joaquin Valley Air Pollution Control District. Air Monitoring Network Plan
 San Joaquin Valley Air Pollution Control District Air Monitoring Network Plan June 30, 2010 For Submittal to the U.S. Environmental Protection Agency in July 2010 San Joaquin Valley Unified Air Pollution
Annual Air Monitoring Network Plan Santa Barbara County
 Annual Air Monitoring Network Plan July 1, 2018 Prepared by the Air Pollution Control District Section Annual Air Monitoring Network Plan For Table of Contents Page 1.0 Introduction... 4 1.1 Network Design...
San Joaquin Valley Air Pollution Control District Air Monitoring Network Plan
 San Joaquin Valley Unified Air Pollution Control District June 30, 2011 San Joaquin Valley Air Pollution Control District 2011 Air Monitoring Network Plan June 30, 2011 For Submittal to the U.S. Environmental
2017 Air Monitoring Network Plan
 San Joaquin Valley Air Pollution Control District June 28, 2017 This page is intentionally blank. San Joaquin Valley Unified Air Pollution Control District June 28, 2017 TABLE OF CONTENTS The District
2015 Ambient Air Quality Monitoring 5 Year Network Assessment For Mecklenburg County Air Quality
 M E C K L E N B U R G C O U N T Y A I R Q U A L I T Y A I R Q U A L I T Y M O N I T O R I N G G R O U P 2015 Ambient Air Quality Monitoring 5 Year Network Assessment For Mecklenburg County Air Quality
Appendix B National Core (NCore) Multi-pollutant Monitoring
 Multi-pollutant Monitoring") Appendix B National Core (NCore) Multi-pollutant Monitoring Table of Contents Background...B-1 NCore Monitoring in Minnesota...B-2 Monitoring Objective...B-2 Quality Assurance Status...B-4 Area of Representativeness...B-4
Appendix B National Core (NCore) Multi-pollutant Monitoring Table of Contents Background...B-1 NCore Monitoring in Minnesota...B-2 Monitoring Objective...B-2 Quality Assurance Status...B-4 Area of Representativeness...B-4
Appendix B: Minimum Monitoring Requirements and 2016 Monitor Classifications in AQS
 Appendix B: Minimum ing Requirements and 2016 Classifications in AQS Summary The EPA establishes the minimum number of monitoring sites required to meet national ambient monitoring objectives. The minimum
Standard Operating Procedure (SOP) for. Completing the Annual Network Review. for the. North Carolina Division of Air Quality (DAQ) SECTION 2
 for. Completing the Annual Network Review. for the. North Carolina Division of Air Quality (DAQ) SECTION 2") Page 1 of 36 Standard Operating Procedure (SOP) for Completing the Annual Network Review for the North Carolina Division of Air Quality (DAQ) SECTION 2 Page 3 of 36 Table of Contents 2.43 Standard Operating
Page 1 of 36 Standard Operating Procedure (SOP) for Completing the Annual Network Review for the North Carolina Division of Air Quality (DAQ) SECTION 2 Page 3 of 36 Table of Contents 2.43 Standard Operating
Fiscal, Administrative & Technical Services May 2018 Public Review Draft
 2018 Ambient Air Monitoring Network Plan Fiscal, Administrative & Technical Services May 2018 Public Review Draft Table of Contents List of Abbreviations... 4 Introduction... 5 General Information on Air
APPENDIX C: Bakersfield-Golden AMS Closure and Replacement
 APPENDIX C: Bakersfield-Golden AMS Closure and Replacement Appendix C: Bakersfield-Golden AMS Closure and Replacement This page is intentionally blank. Appendix C: Bakersfield-Golden AMS Closure and Replacement
Annual Monitoring Network Plan for the North Carolina Division of Air Quality
 2017-2018 Annual Monitoring Network Plan for the North Carolina Division of Air Quality Volume 2 Site Descriptions by Division of Air Quality Regional Office and Metropolitan Statistical Area B. The Winston-Salem
Monitoring Network Design and Changes
 Monitoring Network Design and Changes Craig Anderson Air Quality Analysis Section ARB Air Quality Planning & Science Division PQAO Training 2017: January 24-26, 2017 2 Outline California Monitoring Network
Designing a Network Assessment for an Ambient Air Monitoring Program
 This document is intended to help facilitate compiling an assessment of an agency s air quality surveillance system by State and where delegated, local air monitoring programs. The requirement to submit
Ambient Air Quality Monitoring
 Ambient Air Quality Monitoring Ambient Air Quality Division Air Quality and Noise Management Bureau Pollution Control Department 7/31/2012 2:09 PM 1 Carbon Monoxide (CO) Nitrogen Dioxide (NO 2 ) Ozone
Pinal County Air Quality Control District Ambient Monitoring Network Plan And 2009 Data Summary
 Pinal County Air Quality Control District 2010 Ambient Monitoring Network Plan And 2009 Data Summary June 30, 2010 Final Pinal County Air Quality 31 N. Pinal St., Bldg. F P.O. Box 987 Florence AZ, 85132
State of Arizona Air Monitoring Network Plan
 State of Arizona Air Monitoring Network Plan For the Year 2 Arizona Department of Environmental Quality Air Quality Division Air Assessment Section Final Report August 2, 2 Publication Number EQR -2 Table
SACRAMENTO FEDERAL OZONE NONATTAINMENT AREA REDESIGNATION SUBSTITUTION REQUEST FOR THE HOUR OZONE STANDARD
 SACRAMENTO FEDERAL OZONE NONATTAINMENT AREA REDESIGNATION SUBSTITUTION REQUEST FOR THE 1979 1-HOUR OZONE STANDARD AUGUST 24, 2017 Prepared by: Sacramento Metropolitan Air Quality Management District 777
PM 2.5 Continuous Monitoring. Program Objectives, History, Requirements, and Flexibility. National Ambient Air Monitoring Conference Atlanta 2014
 PM 2.5 Continuous Monitoring Program Objectives, History, Requirements, and Flexibility National Ambient Air Monitoring Conference Atlanta 2014 1 Program Objectives, History, Requirements, and Flexibility
CONTRIBUTORS TO SACRAMENTO COUNTY WOOD SMOKE PRIMARY PM 2.5
 CONTRIBUTORS TO SACRAMENTO COUNTY WOOD SMOKE PRIMARY PM 2.5 Final Report STI-90904.06-676-FR2 By: Clinton P. MacDonald Kenneth J. Craig Adam N. Pasch Erin K. Pollard Neil J. M. Wheeler Stephen B. Reid
Example Airshed. Sample 2018 Annual Ambient Air Quality Monitoring Report
 Example Airshed Sample 2018 Annual Ambient Air Quality Monitoring Report 29 March 2019 DISCLAIMER: This sample annual report is provided as guidance only. The structure, look and layout of monthly and
Five-Year Air Monitoring Network Assessment
 Five-Year Air Monitoring Network Assessment Arizona Department of Environmental Quality Air Quality Division Assessment Section Data Management & Quality Assurance Unit August 2, 2011 40 CFR 58.10 (d)
2019 Annual Air Monitoring Network Plan. Appendix B:
 2019 Annual Air ing Network Plan Appendix B: Minimum ing Requirements and 2018 Classifications in AQS Summary The U.S. Environmental Protection Agency (EPA) establishes the minimum number of monitoring
1-HOUR OZONE ATTAINMENT DETERMINATION REQUEST FOR THE SACRAMENTO FEDERAL OZONE NONATTAINMENT AREA
 1-HOUR OZONE ATTAINMENT DETERMINATION REQUEST FOR THE SACRAMENTO FEDERAL OZONE NONATTAINMENT AREA APRIL 26, 2010 Prepared by: Sacramento Metropolitan Air Quality Management District 777 12 th Street, Third
PORT OF LONG BEACH AIR QUALITY MONITORING PROGRAM: SUMMARY REPORT CALENDAR YEAR 2009
 PORT OF LONG BEACH AIR QUALITY MONITORING PROGRAM: SUMMARY REPORT CALENDAR YEAR 2009 Prepared For: Prepared By: June 2010 POLB Air Quality Monitoring Program: CY 2009 Summary Report Table of Contents LIST
Final Ozone NAAQS - PAMS and Enhanced Monitoring Plans- Ambient Air Monitoring in NESCAUM
 Final Ozone NAAQS - PAMS and Enhanced Monitoring Plans- Ambient Air Monitoring in NESCAUM Robert Judge Air Monitoring Coordinator EPA- Region 1 Providence, RI December 7, 2016 1 Overview 2015 Final Ozone
2.0.4 SITING CRITERIA FOR CRITERIA POLLUTANTS
 Page 1 of 24 2.0.4 SITING CRITERIA FOR CRITERIA POLLUTANTS 2.0.4.1 INTRODUCTION This operating procedure contains siting criteria to be applied to ambient air quality analyzers and samplers or monitoring
Data Certification Exercise
 Data Certification Exercise PQAO Training January 25 th, 2017 Objective: The data certification process involves certifying that ambient concentration data and quality assurance data for any given year
Oklahoma Department of Environmental Quality Air Quality Division Monitoring Section Annual Network Review for Ambient Air Monitoring Fiscal Year 2013
 Oklahoma Department of Environmental Quality Air Quality Division Monitoring Section Annual Network Review for Ambient Air Monitoring Fiscal Year 2013 Under 40 CFR, Part 58, Subpart B, states are required
Monitoring Aspects of the Final Ozone Rule. NACAA Monitoring Committee October 29, 2015
 Monitoring Aspects of the Final Ozone Rule NACAA Monitoring Committee October 29, 2015 Monitoring Aspects of the Final Rule Updates to the Photochemical Assessment Monitoring Stations (PAMS) Extension
Spokane Regional Clean Air Agency Air Quality Report - January 2012
 Spokane Regional Clean Air Agency Air Quality Report - January 2012 Air quality in January varied as weather systems moved through the region at regular intervals. Storms on January 5, 10 and 14 helped
Evaluation and Comparison of Methods for Measuring Ozone and Nitrogen Dioxide Concentrations
 Evaluation and Comparison of Methods for Measuring Ozone and Nitrogen Dioxide Concentrations in Ambient Air during DISCOVER-AQ Figure 1. LaPorte Airport site during DISCOVER-AQ Houston 2013. Photo by:
DRAFT 2015 OZONE CONFORMITY ANALYSIS FOR THE 2019 FEDERAL TRANSPORTATION IMPROVEMENT PROGRAM AND THE 2018 REGIONAL TRANSPORTATION PLAN
 DRAFT 2015 OZONE CONFORMITY ANALYSIS FOR THE 2019 FEDERAL TRANSPORTATION IMPROVEMENT PROGRAM AND THE 2018 REGIONAL TRANSPORTATION PLAN JANUARY 9, 2019 KINGS COUNTY ASSOCIATION OF GOVERNMENTS This report
Air Quality Measurement Methods. Tim Morphy Regional Manager Thermo Electron October 20 th, 2006
 Air Quality Measurement Methods Tim Morphy Regional Manager Thermo Electron October 20 th, 2006 Main Criteria Pollutants US EPA Federal Reference Methods US EPA Federal Equivalent Methods http://www.epa.gov/ttn/amtic/criteria.html
Annual Monitoring Network Plan for the North Carolina Division of Air Quality. Volume 1 Addendum 2
 2016-2017 Annual Monitoring Network Plan for the North Carolina Division of Air Quality Volume 1 Addendum 2 December 28, 2016 North Carolina Division of Air Quality A Division of the North Carolina Department
Clean Air Act History
 Clean Air Act Compliance Clean Air Act Compliance Clean Air Act History 1940s serious smog in LA, CA and Donora, PA raised concerns about air quality. 1955, Air Pollution Control Act was the 1st national
Oklahoma Department of Environmental Quality Air Quality Division 2018 Air Monitoring Network Plan
 Oklahoma Department of Environmental Quality Air Quality Division 2018 Air Monitoring Network Plan Oklahoma Department of Environmental Quality 707 N. Robinson P.O. Box 1677 Oklahoma City, OK 73101-1677
Air Quality Monitoring Program at the Port of Los Angeles Year Eleven Data Summary May April 2016
 Air Quality Monitoring Program at the Port of Los Angeles Year Eleven Data Summary May 2015 - April 2016 Prepared For: Port of Los Angeles Environmental Management Division 425 South Palos Verdes Street
AIR POLLUTION. History of Clean Air Act Clean Air Update The Role of APCD
 AIR POLLUTION History of Clean Air Act Clean Air Update The Role of APCD History 1940-1959 1947 California Air Pollution Control Act First state legislation Permitted APCD s 1945 City of Los Angeles Bureau
APPENDIX VIII AIR QUALITY CONFORMITY ANALYSIS
 2018 Kings County Regional Transportation Plan APPENDIX VIII AIR QUALITY CONFORMITY ANALYSIS H:\RTPA\2018 RTP Update\Final RTP\APPENDIX VIII - Air Quality Conformity Title Page.docx Appendix VIII CONFORMITY
Air Monitoring Data Quality Assessment Report Fourth Quarter Prepared by: Donovan Rafferty. Air Quality Program
 Air Monitoring Data Quality Assessment Report Fourth Quarter Prepared by: Donovan Rafferty Air Quality Program TABLE OF CONTENTS Introduction... 1 Data Quality... 2 Automated Data... 3 Data Quality Indicators
State of Hawaii 2009 Air Monitoring Network Plan
 State of Hawaii 2009 Air Monitoring Network Plan Submitted to the U.S. EPA Region 9 July 1, 2009 Prepared by: State of Hawaii Department of Health Environmental Management Division Clean Air Branch and
ANALYSIS OF PAMS DATA IN CALIFORNIA VOLUME III: TRENDS ANALYSES OF CALIFORNIA PAMS AND LONG-TERM TREND AIR QUALITY DATA ( )
") ANALYSIS OF PAMS DATA IN CALIFORNIA VOLUME III: TRENDS ANALYSES OF CALIFORNIA PAMS AND LONG-TERM TREND AIR QUALITY DATA (1987-1997) FINAL REPORT STI-998393-1885-FR By: Beth Wittig Hilary H. Main Paul T.
ANALYSIS OF PAMS DATA IN CALIFORNIA VOLUME III: TRENDS ANALYSES OF CALIFORNIA PAMS AND LONG-TERM TREND AIR QUALITY DATA (1987-1997) FINAL REPORT STI-998393-1885-FR By: Beth Wittig Hilary H. Main Paul T.
Appendix G. Precursor Demonstration
 Appendix G Precursor Demonstration San Joaquin Valley Air Pollution Control District 2018 PM2.5 SIP Page 1 of 23 Appendix: San Joaquin Valley PM2.5 SIP INTRODUCTION Fine particulate matter (PM2.5) is made
OAQPS Update. Outline. Kevin A Cavender EPA/OAQPS/AAMG. MARAMA Monitoring Meeting September 17, 2012
 OAQPS Update Kevin A Cavender EPA/OAQPS/AAMG MARAMA Monitoring Meeting September 17, 2012 1 Outline Selected NAAQS Updates Notable monitoring program issues Quality Assurance Topics 2 1 NAAQS Summary Table
State Implementation Plans for Federal 8-Hour Ozone and PM2.5 Standards San Joaquin Valley Eastern Kern County
 State Implementation Plans for Federal 8-Hour Ozone and PM2.5 Standards San Joaquin Valley Eastern Kern County Public Meeting January 4, 2005 Fresno, Bakersfield, Modesto 1 San Joaquin Valley Air Pollution
2013 Network Summary
 R 2013 Network Summary New Jersey Department of Environmental Protection NETWORK DESCRIPTION In 2013, the New Jersey Department of Environmental Protection (NJDEP) operated 39 ambient air monitoring stations.
Wyoming Ambient Air Monitoring Annual Network Plan 2010
 Wyoming Ambient Air Monitoring Annual Network Plan 2010 TABLE OF CONTENTS 1.0 Introduction... 1 1.1 The AQD Monitoring History... 1 1.2 General Monitoring Goals and Objectives... 2 2.0 Air Monitoring
Spokane Regional Clean Air Agency Air Quality Report - September 2011
 Spokane Regional Clean Air Agency Air Quality Report - September 211 An atmospheric high pressure ridge brought exceptionally warm, sunny and dry weather, light winds and marginal to poor ventilation to
Air Quality Monitoring Program at the Port of Los Angeles Year Twelve Data Summary May April 2017
 Air Quality Monitoring Program at the Port of Los Angeles Year Twelve Data Summary May 2016 - April 2017 Prepared For: Port of Los Angeles Environmental Management Division 425 South Palos Verdes Street
ANNUAL AIR QUALITY MONITORING NETWORK PLAN 2015
 MONITORING AND TECHNICAL SERVICES DIVISION ANNUAL AIR QUALITY MONITORING NETWORK PLAN 2015 JULY, 2016 DAVID N. SHINA BILL BRICK ADAM CANTER Monitoring and Technical Services Division 10124 Old Grove Road,
Ambient Air Monitoring. Wexford. 10 th March st March 2006
 Ambient Air Monitoring In Wexford 10 th March 2005 31 st March 2006 Contents Summary....... 3 Introduction........ 4 Time Period........ 5 Siting......... 5 Monitoring Methods....... 6 Results.........
Northeast Ohio NAAQS Nonattainment Factsheet Covering the counties of Ashtabula, Cuyahoga, Geauga, Lake, Lorain, Medina, Portage and Summit
 215 November 2 1 5 Northeast Ohio NAAQS Nonattainment Factsheet Covering the counties of Ashtabula, Cuyahoga, Geauga, Lake, Lorain, Medina, Portage and Summit 1 Northeast Ohio NAAQS Nonattainment Factsheet
Technical Manual Guideline on Air Quality Impact Modeling Analysis
 New Jersey Department of Environmental Protection Division of Air Quality Bureau of Technical Services Technical Manual 1002 Guideline on Air Quality Impact Modeling Analysis November 2009 Table of Contents
Wyoming Ambient Air Monitoring Annual Network Plan 2013 June 27, 2013
 Wyoming Ambient Air Monitoring Annual Network Plan 2013 June 27, 2013 Photo by Jennifer Frazier TABLE OF CONTENTS 1.0 Introduction... 1 1.1 The AQD Monitoring History... 1 1.2 General Monitoring Goals
Appendix A. Ambient Air Quality Data Ozone Plan
 Appendix A Ambient Air Quality Data This page intentionally blank. A.1 INTRODUCTION This Appendix includes more ambient air quality data and analysis for 8-hour ozone. A.2 AMBIENT AIR QUALITY DATA Table
2018 Ambient Air Monitoring Plan Air Protection Branch Ambient Monitoring Program
 2018 Ambient Air Monitoring Plan Air Protection Branch Ambient Monitoring Program Introduction Table of Contents Table of Contents... i Acronyms and Glossary... ii Agency Contacts... iv 1.0 Executive
ENVIRONMENTAL PROTECTION AGENCY. 40 CFR Part 52. [EPA-R09-OAR ; FRL Region 9]
![ENVIRONMENTAL PROTECTION AGENCY. 40 CFR Part 52. [EPA-R09-OAR ; FRL Region 9]](/thumbs/82/85650663.jpg "ENVIRONMENTAL PROTECTION AGENCY. 40 CFR Part 52. [EPA-R09-OAR ; FRL Region 9]") This document is scheduled to be published in the Federal Register on 07/03/2017 and available online at https://federalregister.gov/d/2017-13860, and on FDsys.gov 6560-50-P ENVIRONMENTAL PROTECTION AGENCY
This document is scheduled to be published in the Federal Register on 07/03/2017 and available online at https://federalregister.gov/d/2017-13860, and on FDsys.gov 6560-50-P ENVIRONMENTAL PROTECTION AGENCY
State of Arizona Air Monitoring Network Plan. For the Year Final Report June 30, 2008
 State of Arizona Air Monitoring Network Plan For the Year 2008 Arizona Department of Environmental Quality Air Quality Division Air Assessment Section Final Report June 30, 2008 Table of Contents 1.0 INTRODUCTION...
CAPCOG Ozone Conceptual Model 2016
 PGA 582-16-60851-01 Task 3, Deliverable 3.2 CAPCOG Ozone Conceptual Model 2016 Prepared by the Capital Area Council of Governments September 23, 2016 PREPARED UNDER A GRANT FROM THE TEXAS COMMISSION ON
IMPROVE STANDARD OPERATING PROCEDURES. SOP 126 Site Selection. Date Last Modified Modified by: 09/12/96 EAR
 IMPROVE STANDARD OPERATING PROCEDURES SOP 126 Site Selection Date Last Modified Modified by: 09/12/96 EAR SOP 126 Site Selection for the IMPROVE Aerosol Sampling Network. TABLE OF CONTENTS 1.0 PURPOSE
Ohio Air Monitoring 222 Network Plan for the Gavin/Kyger Sulfur Dioxide Monitoring Network
 2016-2017 Ohio Air Monitoring 222 Network Plan for the Gavin/Kyger Sulfur Dioxide Monitoring Network Division of Air Pollution Control December 2016 Table of Contents Requirements and Guidance... 1 Gavin/Kyger
Annual Monitoring Network Plan for the North Carolina Division of Air Quality. Volume 1 Addendum
 2016-2017 Annual Monitoring Network Plan for the North Carolina Division of Air Quality Volume 1 Addendum September 1, 2016 North Carolina Division of Air Quality A Division of the North Carolina Department
SAN DIEGO COUNTY AIR POLLUTION CONTROL DISTRICT Ambient Air Monitoring Network Plan Submitted: July 1, 2009
 SAN DIEGO COUNTY AIR POLLUTION CONTROL DISTRICT 2008 Ambient Air Monitoring Network Plan Submitted: July 1, 2009 10124 Old Grove Road San Diego, CA 92131 (858) 586-2600 PREPARED BY Mike Kaszuba with David
State of Arizona Air Monitoring Network Plan
 State of Arizona Air Monitoring Network Plan For the Year 2009 Arizona Department of Environmental Quality Air Quality Division Air Assessment Section Final Report July 1, 2009 Publication Number: EQR
Wildfires: Smoke Impacts and Public Health Protection
 Wildfires: Smoke Impacts and Public Health Protection Julie Hunter, Senior Air Quality Specialist Washoe County Health District, Air Quality Management Division Great Basin Climate Forum December 6, 2018
Prevention of Significant Deterioration (PSD) Permitting. Scoping Meeting
 Permitting. Scoping Meeting") Prevention of Significant Deterioration (PSD) Permitting Scoping Meeting April 6, 2010 Dave Warner Director of Permit Services 1 Overview Prevention of Significant Deterioration (PSD) Permitting Program
Prevention of Significant Deterioration (PSD) Permitting Scoping Meeting April 6, 2010 Dave Warner Director of Permit Services 1 Overview Prevention of Significant Deterioration (PSD) Permitting Program
Surface Mobile Monitoring in the Austin area for 2011
 Surface Mobile Monitoring in the Austin area for 2011 Grant FY 2010/2011 Task Ambient Monitoring Projects Surface Mobile Monitoring Prepared for: CAPCOG Prepared by: Cyril J. Durrenberger Jarett P. Spinhirne
New 2015 Ozone Standard and Implications. July 2016
 New 2015 Ozone Standard and Implications July 2016 What is Ozone? Ground level ozone is formed from the mixture of sunlight, NOx and VOC. 2 Effects of Ground Level Ozone 3 Effects of Ground Level Ozone
REDESIGNATION REQUEST AND MAINTENANCE PLAN FOR THE COLUMBUS, OHIO HOUR OZONE NONATTAINMENT AREA
 REDESIGNATION REQUEST AND MAINTENANCE PLAN FOR THE COLUMBUS, OHIO 2015 8-HOUR OZONE NONATTAINMENT AREA Delaware, Fairfield, Franklin, and Licking Counties, Ohio Prepared by: Ohio Environmental Protection
SJVUAPCD. Chapter 2. Air Quality in the Valley: Challenges and Progress DRAFT 2016 PLAN FOR THE HOUR OZONE STANDARD
 SJVUAPCD Chapter 2 Air Quality in the Valley: Challenges and Progress DRAFT 2016 PLAN FOR THE 2008 8-HOUR OZONE STANDARD This page intentionally blank. Chapter 2: Air Quality in the Valley: Challenges
Transfield Services Limited
 Eastlink Ambient Air Quality Monitoring NATA Accreditation No: 14184 Eastlink Ambient Air Quality Monitoring System Report 1 st June 2010 30 th June 2010 Report issue date: 15 th July 2010 Maintenance
How much does Kansas rangeland burning contribute to ambient O 3 and PM 2.5?
 How much does Kansas rangeland burning contribute to ambient O 3 and PM 2.5? - Analysis of data from 21 to 216 Dr. Zifei Liu zifeiliu@ksu.edu Rangeland burning smoke management and air quality workshop
MECKLENBURG COUNTY Land Use and Environmental Services Agency - A I R Q U A L I T Y - February 17, 2016
 MECKLENBURG COUNTY Land Use and Environmental Services Agency - A I R Q U A L I T Y - February 17, 2016 Beverly Banister, Director Air, Pesticides & Toxics Management Division U.S. EPA, Region 4 Sam Nunn
Air Quality Monitoring Group Annual Monitoring Network Plan - Mecklenburg County Air Quality
 Air Quality Monitoring Group 2017-2018 Annual Monitoring Network Plan - Mecklenburg County Air Quality Mecklenburg County Air Quality A Division of the Mecklenburg County Land Use and Environmental Services
PM2.5 NAAQS Implementation & Permitting in Georgia
 PM2.5 NAAQS Implementation & Permitting in Georgia Georgia Environmental Conference Jekyll Island, Georgia August 25, 2016 Brad James, P.E. Overview Current UFP Regulation (as PM 2.5 ) PM 2.5 NAAQS SIP
Wildfire Mitigation Plan for the Sacramento Federal Nonattainment Area for PM 2.5. (Aerial view of the Tubbs and Pocket fires, 10/12/2017)
") Wildfire Mitigation Plan for the Sacramento Federal Nonattainment Area for PM 2.5 (Aerial view of the Tubbs and Pocket fires, 10/12/2017) August 2018 El Dorado County Air Quality Management District Dave
Wildfire Mitigation Plan for the Sacramento Federal Nonattainment Area for PM 2.5 (Aerial view of the Tubbs and Pocket fires, 10/12/2017) August 2018 El Dorado County Air Quality Management District Dave
2016 PORTSMOUTH LAA MONITORING SITES
 2016 PORTSMOUTH LAA MONITORING SITES Map/AQS # Site Name PM 2.5 PM 10 O 3 SO 2 CO NO 2 TOXICS PM 2.5 CSPE Pb/metals Met 1. 39-001-0001 West Union x x 2. 39-087-0011 Wilgus x 3. 39-087-0012 Ironton ODOT
Air Quality Program Update. SWEP Regulatory Update Meeting Harrisburg, PA November 5, 2015
 Air Quality Program Update SWEP Regulatory Update Meeting Harrisburg, PA November 5, 2015 1 National Ambient Air Quality Standards Under Section 109 of the Clean Air Act (CAA), the U.S. Environmental Protection
REQUEST FOR REDESIGNATION AND MAINTENANCE PLAN FOR OZONE ATTAINMENT IN THE EIGHT-HOUR OZONE BASIC NONATTAINMENT AREA
 REQUEST FOR REDESIGNATION AND MAINTENANCE PLAN FOR OZONE ATTAINMENT IN THE EIGHT-HOUR OZONE BASIC NONATTAINMENT AREA Toledo, OH: Lucas and Wood County Developed By: Ohio Environmental Protection Agency
AMBIENT MONITORING STATION SITE DOCUMENTATION
 WBEA Network and Site Documentation AMBIENT MONITORING STATION SITE DOCUMENTATION 2018 WBEA Network and Site Documentation Table of Contents WBEA Network... 3 Station Details... 6 General Site Information...
Chapter 6 CO, PM 10, and Other Pollutant Air Quality Impacts and Mitigation For Project Operation
 Chapter 6 CO, PM 10, and Other Pollutant Air Quality Impacts and Mitigation For Project Operation 6.1 Introduction This Chapter addresses the recommended techniques for quantifying emissions of carbon
Thirty-First Quarterly Report of Ambient Air Quality Monitoring at Sunshine Canyon Landfill and Van Gogh Elementary School
 Thirty-First Quarterly Report of Ambient Air Quality Monitoring at Sunshine Canyon Landfill and Van Gogh Elementary School June 1, 2015 August 31, 2015 Quarterly Report STI-915022-6365-QR Prepared by Steven
GUIDELINE ON OZONE MONITORING SITE SELECTION
 United States Office of Air Quality EPA-454/R-98-002 Environmental Protection Planning and Standards August 1998 Agency Research Triangle Park, NC 27711 Air GUIDELINE ON OZONE MONITORING SITE SELECTION
Current State of Air Quality in PA. January 16, 2018 Citizens Advisory Council
 Current State of Air Quality in PA January 16, 2018 Citizens Advisory Council Tom Wolf, Governor Patrick McDonnell, Secretary Agenda National Ambient Air Quality Standards DEP s Monitoring Network Air
Chapter 1. Progress and Current Air Quality Ozone Plan
 Chapter 1 Progress and Current Air Quality This page intentionally blank. 1.1 INTRODUCTION This chapter presents an overview of the progress that has been made and the current state of the San Joaquin
PROPOSED ADOPTION OF RULE 3.25, FEDERAL NEW SOURCE REVIEW FOR NEW AND MODIFIED MAJOR PM2.5 SOURCES FINAL STAFF REPORT
 Yolo-Solano Air Quality Management District 1947 Galileo Court, Suite 103 Davis, CA 95618 (530)757-3650 www.ysaqmd.org PROPOSED ADOPTION OF RULE 3.25, FEDERAL NEW SOURCE REVIEW FOR NEW AND MODIFIED MAJOR
Chapter 5 FUTURE OZONE AIR QUALITY
 Chapter 5 FUTURE OZONE AIR QUALITY 5 FUTURE OZONE AIR QUALITY 5.1 INTRODUCTION AND SUMMARY Air quality models are used to predict ozone concentrations in future years. These models simulate the formation,
BACT Determination Information
 UNDER PUBLIC REVIEW SMAQMD BACT CLEARINGHOUSE CATEGORY: MISCELLANEOUS BACT Size: Tortilla Oven 500 F OVEN BACT Determination Number: Permit Number: Equipment Description: Unit Size/Rating/Capacity: Equipment
BACT Determination Information
 ACTIVE SMAQMD BACT CLEARINGHOUSE CATEGORY: MISCELLANEOUS BACT Size: Tortilla Oven 500 F OVEN BACT Determination Number: Permit Number: Equipment Description: Unit Size/Rating/Capacity: Equipment Location:
PAMS and Enhanced Monitoring Plans- Ambient Air Monitoring in Northeast
 PAMS and Enhanced Monitoring Plans- Ambient Air Monitoring in Northeast Robert Judge Air Monitoring Coordinator EPA- Region 1 HAQAST3- Columbia University November 28, 2017 1 Overview 2015 Final Ozone
Table of Contents. (a) APPLICABILITY (b) EXEMPTIONS (c) DEFINITIONS... 2
 APPLICABILITY (b) EXEMPTIONS (c) DEFINITIONS... 2") RULE 20.2 NEW SOURCE REVIEW NON - MAJOR STATIONARY SOURCES (ADOPTED AND EFFECTIVE 5/17/94) (REV. ADOPTED AND EFFECTIVE 12/17/97) (REV. ADOPTED 11/4/98; EFFECTIVE 12/17/98) (REV. ADOPTED (date of adoption);
RULE 20.2 NEW SOURCE REVIEW NON - MAJOR STATIONARY SOURCES (ADOPTED AND EFFECTIVE 5/17/94) (REV. ADOPTED AND EFFECTIVE 12/17/97) (REV. ADOPTED 11/4/98; EFFECTIVE 12/17/98) (REV. ADOPTED (date of adoption);