ANNUAL AIR QUALITY MONITORING NETWORK PLAN 2015
|
|
|
- Isabella Norman
- 6 years ago
- Views:
Transcription

1 MONITORING AND TECHNICAL SERVICES DIVISION ANNUAL AIR QUALITY MONITORING NETWORK PLAN 2015 JULY, 2016 DAVID N. SHINA BILL BRICK ADAM CANTER Monitoring and Technical Services Division Old Grove Road, San Diego, CA 92131
2 1 (left intentionally blank)
3 Table of Contents Page I of XIX Table of Contents CHAPTER TITLE PAGE(S) CHAPTER 1 ANNUAL NETWORK PLAN REQUIREMENTS Section Federal Citation... 1 Section Purpose Scope and Organization of Report... 2 Section Public Comment Information... 2 Section District Contact Information... 2 Section Additional Air Pollution Information Section Description of Monitoring... 3 Section Network Design Theory... 3 Section San Diego Air Basin Description... 4 Section Topography... 4 Section Climate... 4 Section Population... 5 CHAPTER 2 EXECUTIVE SUMMARY OF THE AIR MONITORING NETWORK Section The Air Quality Monitoring Network Section Overview of the Gaseous Pollutants Monitoring Network... 7 Section Overview of the Lead Monitoring Network... 8 Section Overview of the PM 2.5 Monitoring Network... 9 Section Overview of the PM 10 Monitoring Network Section Overview of the PAMS Monitoring Network Section Overview of the Toxics Monitoring Network Section Summary of the Minimum Monitoring Requirements for the SDAB Section Summary of the Minimum Monitoring Requirements for Collocation Section Summary of the Minimum Monitoring Requirements for non-collocated Instruments Section Recent and Unplanned Changes to the Network Section Station Relocations, Additions, and Changes Section Relocations Section Temporary Shutdowns Section Start-ups Section Monitor/Sampler Relocations, Additions, Closures, and Changes Section List of Public Comments and the District Response(s) Section Public Comments Appendix A Formal Request for Relocation of the Floyd Smith Drive Station Appendix B Formal Request for Relocation of the Downtown Station Appendix C Formal Request for Decommissioning Pb-TSP Sampling at NCore CHAPTER 3 OZONE Section Ozone Introduction Section Ozone Minimum Monitoring Requirements Section Ozone Minimum Monitoring Requirements-Design Value Criteria (8-Hr)... 3 Section Ozone Minimum Monitoring Requirements-Ambient Section Ozone Minimum Monitoring Requirements-Maximum Concentration Site Design Value... 4 Section Ozone Minimum Monitoring Requirements-PAMS... 5 Section Ozone Minimum Monitoring Requirements-NCore... 6 Section Ozone Suitability for Comparison to the NAAQS... 7 Section Ozone Concentrations for San Diego Section Ozone Concentrations for San Diego-for the Last 20 Years... 7 Section Ozone Concentrations for San Diego-by Site for the Year... 8 Section Ozone Concentrations for San Diego-by Site for the Design Value... 9
4 Table of Contents Page II of XIX CHAPTER 4 NITROGEN DIOXIDE AND REACTIVE OXIDES OF NITORGEN Section Nitrogen Dioxide and Reactive Oxides of Nitrogen Introduction Section Nitrogen Dioxide Minimum Monitoring Requirements Section Nitrogen Dioxide Minimum Monitoring Requirements Near-road Section Nitrogen Dioxide Minimum Monitoring Requirements-Near-road (1 st Site)... 3 Section Nitrogen Dioxide Minimum Monitoring Requirements-Near-road (2 nd Site) Section Nitrogen Dioxide Minimum Monitoring Requirements-Area-wide... 6 Section Nitrogen Dioxide Minimum Monitoring Requirements-Regional Administrator Section Nitrogen Dioxide Minimum Monitoring Requirements-PAMS... 7 Section Nitrogen Dioxide Minimum Monitoring Requirements-Summary... 8 Section Reactive Oxides of Nitrogen Minimum Monitoring Requirements Section Reactive Oxides of Nitrogen Minimum Monitoring Requirements-PAMS... 9 Section Reactive Oxides of Nitrogen Minimum Monitoring Requirements-NCore Section Reactive Oxides of Nitrogen Minimum Monitoring Requirements-Summary Section Nitrogen Dioxide Suitability for Comparison to the NAAQS Section Nitrogen Dioxide Concentrations for San Diego Section Nitrogen Dioxide Concentrations for San Diego-for the Last 20 Years Section Nitrogen Dioxide Concentrations for San Diego-by Site for the Year Section Nitrogen Dioxide Concentrations for San Diego-by Site for the Design Value CHAPTER 5 CARBON MONOXIDE Section Carbon Monoxide Introduction Section Carbon Monoxide Minimum Monitoring Requirements Section Carbon Monoxide Minimum Monitoring Requirements-Near-road... 3 Section Carbon Monoxide Minimum Monitoring Requirements-NCore... 3 Section Carbon Monoxide Minimum Monitoring Requirements-PAMS... 4 Section Carbon Monoxide Minimum Monitoring Requirements-State... 4 Section Carbon Monoxide Minimum Monitoring Requirements-Summary... 5 Section Carbon Monoxide Suitability for Comparison to the NAAQS... 6 Section Carbon Monoxide Concentrations for San Diego Section Carbon Monoxide Concentrations for San Diego-for the Last 20 Years... 6 Section Carbon Monoxide Concentrations for San Diego-by Site for the Year... 7 CHAPTER 6 SULFUR DIOXIDE Section Sulfur Dioxide Introduction Section Sulfur Dioxide Minimum Monitoring Requirements Section Sulfur Dioxide Minimum Monitoring Requirements-Ambient... 3 Section Sulfur Dioxide Minimum Monitoring Requirements-NCore... 4 Section Sulfur Dioxide Suitability for Comparison to the NAAQS... 5 Section Sulfur Dioxide Concentrations for San Diego... 5 Section Sulfur Dioxide Concentrations for San Diego-for the Last 20 Years... 5 Section Sulfur Dioxide Concentrations for San Diego-by Site for the Design Value... 6 CHAPTER 7 LEAD Section Lead Introduction Section Lead Minimum Monitoring Requirements Section Lead Minimum Monitoring Requirements-Source (non-airport)... 3 Section Lead Minimum Monitoring Requirements-Airport (non-source) Section Lead Minimum Monitoring Requirements-Airport (non-source) Results Section Lead Minimum Monitoring Requirements-NCore... 5 Section Lead Minimum Monitoring Requirements-Summary... 5 Section Lead Suitability for Comparison to the NAAQS... 6
5 Table of Contents Page III of XIX Section Lead Concentrations for San Diego Section Lead Concentrations for San Diego-for the Last 20 Years... 6 Section Lead Concentrations for San Diego-by Site for the Year... 7 CHAPTER 8 PARTICULATE MATTER 2.5 µm Section PM 2.5 Introduction Section PM 2.5 Manual Minimum Monitoring Requirements Section PM 2.5 Manual Minimum Monitoring Requirements-Design Criteria (24-Hr & Annual Average) Section PM 2.5 Manual Minimum Monitoring Requirements-Ambient... 5 Section PM 2.5 Manual Minimum Monitoring Requirements-State Section PM 2.5 Manual Minimum Monitoring Requirements-Collocation... 6 Section PM 2.5 Manual Minimum Monitoring Requirements-Site of Expected Maximum Concentration (24-Hr & Annual Average)... 7 Section PM 2.5 Manual Minimum Monitoring Requirements-Near-road... 8 Section PM 2.5 Manual Minimum Monitoring Requirements-Site of Poor Air Quality... 8 Section PM 2.5 Manual Minimum Monitoring Requirements-NCore... 9 Section PM 2.5 Manual Minimum Monitoring Requirements-Summary... 9 Section PM 2.5 Continuous Minimum Monitoring Requirements Section PM 2.5 Continuous Minimum Monitoring Requirements-Ambient Section PM 2.5 Continuous Minimum Monitoring Requirements-Collocation Section PM 2.5 Continuous Minimum Monitoring Requirements-NCore Section PM 2.5 Continuous Minimum Monitoring Requirements-Summary Section PM 2.5 Speciation Minimum Monitoring Requirements Section PM 2.5 Speciation Minimum Monitoring Requirements-Ambient Section PM 2.5 Speciation Minimum Monitoring Requirements-NCore Section PM 2.5 Speciation Minimum Monitoring Requirements-Summary Section PM 2.5 Suitability for Comparison to the NAAQS Section PM 2.5 Suitability for Comparison to the NAAQS-PM 2.5 Manual Section PM 2.5 Suitability for Comparison to the NAAQS-PM 2.5 Continuous Unsuitability Section PM 2.5 Suitability for Comparison to the NAAQS-PM 2.5 Speciation Unsuitability Section PM 2.5 Manual Operating Schedule Section Section PM 2.5 Manual Operating Schedule-for Manual Samplers not Collocated with Continuous Samplers PM 2.5 Manual Operating Schedule-for Manual Samplers not Collocated with Continuous Samplers Section PM 2.5 Manual Operating Schedule-for 24-Hr Design Value Samplers Section PM 2.5 Manual Operating Schedule-at NCore Section PM 2.5 Speciation Operating Schedule-at NCore Section PM 2.5 Manual Concentrations for San Diego Section PM 2.5 Manual Concentrations for San Diego-for the Last 20 Years Section PM 2.5 Manual Concentrations for San Diego-by Site for the Year Section PM 2.5 Manual Concentrations for San Diego-by Site for the Design Value (24-Hr) Section PM 2.5 Manual Concentrations for San Diego-by Site for the Design Value (Annual Avg).. 19 Section PM 2.5 Continuous Concentrations for San Diego Section Section PM 2.5 Continuous Concentrations for San Diego-by Site for the Year (24-Hr & Annual Average) PM 2.5 Continuous Concentrations for San Diego-by Site for the Design Value (24-Hr & Annual Concentrations... 17
6 Table of Contents Page IV of XIX CHAPTER 9 PARTICULATE MATTER 10 µm Section PM 10 Introduction Section PM 10 Minimum Monitoring Requirements Section PM 10 Minimum Monitoring Requirements-Ambient... 3 Section PM 10 Minimum Monitoring Requirements-NCore... 4 Section PM 10 Minimum Monitoring Requirements -Summary... 4 Section PM 10 Suitability for Comparison to the NAAQS... 5 Section PM 10 Suitability for Comparison to the NAAQS, Equipment & Siting... 5 Section PM 10 Suitability for Comparison to the NAAQS, Sampling Frequency... 5 Section PM 10 Concentrations for San Diego Section PM 10 Concentrations for San Diego-for the Last 20 Years... 6 Section PM 10 Concentrations for San Diego-by Site for the Year at Standard Conditions (STD)... 7 Section PM 10 Concentrations for San Diego-by Site for the Year at Local Conditions (LC)... 8 CHAPTER 10 NCORE Section NCore Introduction... 1 Section NCore Minimum Monitoring Requirements... 2 Section NCore Suitability for Comparison to the NAAQS... 3 Section NCore Concentrations for San Diego... 4 CHAPTER 11 PHOTOCHEMICAL ASSESSMENT MONITORING STATION (PAMS) Section PAMS Introduction Section PAMS Minimum Monitoring Requirements Section PAMS Minimum Monitoring Requirements-Sampling Season (24-Hr & 3-Hr)... 3 Section PAMS Minimum Monitoring Requirements-VOC Section PAMS Minimum Monitoring Requirements-VOC at Type 2 Stations Section PAMS Minimum Monitoring Requirements-VOC at non-type 2 Stations Section PAMS Minimum Monitoring Requirements-VOC Sampling Frequency... 5 Section PAMS Minimum Monitoring Requirements-Carbonyls Section PAMS Minimum Monitoring Requirements-Carbonyls at Type 2 Stations... 5 Section PAMS Minimum Monitoring Requirements-Carbonyls Sampling Frequency... 5 Section PAMS Minimum Monitoring Requirements-Gaseous Instruments Section PAMS Minimum Monitoring Requirements-Gaseous Instruments, NOx (NO 2 )... 6 Section PAMS Minimum Monitoring Requirements-Gaseous Instruments, NOy... 7 Section PAMS Minimum Monitoring Requirements-Gaseous Instruments, CO... 7 Section PAMS Minimum Monitoring Requirements-Gaseous Instruments, O Section PAMS Minimum Monitoring Requirements-Meteorology Instrumentation Section PAMS Minimum Monitoring Requirements-Meteorology Instrumentation, Surface Sensors... 8 Section PAMS Minimum Monitoring Requirements-Meteorology Instrumentation, Upper Atmosphere Sensors... 9 Section PAMS Minimum Monitoring Requirements-Summary... 9 Section PAMS Sampling Frequency and Equipment CHAPTER 12 TOXICS Section Toxics Introduction Section Toxics Minimum Monitoring Requirements... 3 Section Toxics Sampling Frequency and Equipment... 4
7 Table of Contents Page V of XIX LIST OF TABLES TABLE TITLE SECTION/PAGE(S) Table 2.0 List of Network Sites...2/2 Table 2.1 Air Monitoring Sites with Associated Monitors/Samplers...2/4 Table 2.2 Gaseous Pollutant Monitoring Network...2/7 Table 2.3 Lead Pollutant Monitoring Network...2/8 Table 2.4 PM 2.5 Pollutant Monitoring Network...2/9 Table 2.5 PM 10 Pollutant Monitoring Network...2/10 Table 2.6 PAMS Monitoring Network...2/11 Table 2.7 Toxics Pollutant Monitoring Network...2/12 Table 2.8 Summary of Minimum Monitoring Requirements for Collocation...2/13 Table 2.9 Summary of Minimum Monitoring Requirements for non-collocated Samplers...2/14 Table A1 Floyd Smith Drive-Gaseous Pollutants...2/20 Table A2 Floyd Smith Drive-Particulate Pollutants...2/20 Table A3 Floyd Smith Drive-Other Pollutants...2/21 Table A4 Lexington Elementary School-Additional Equipment...2/22 Table A5 Lexington Elementary School-Meteorological Equipment...2/22 Table A6 Floyd Smith Drive-Monitor Relocation Applicability...2/23 Table B1 Downtown-Gaseous Pollutants...2/25 Table B2 Downtown-Particulate Pollutants...2/25 Table B3 Downtown-Other Pollutants...2/26 Table B4 Downtown-Meteorological Equipment...2/26 Table B5 Downtown-Design Values and Averages for Pollutants...2/28 Table B6 Downtown-Eligibility for Relocation...2/28 Table 3.0 Ozone State and Federal Standards for the Year...3/1 Table 3.1 Ozone Sampling Network...3/2 Table 3.2a Ozone 8-Hr Design Value...3/3 Table D-2 SLAMS Minimum O 3 Monitoring Requirements (from the CFR)...3/3 Table 3.2b Ozone Minimum Monitoring Requirements for Ambient...3/4 Table 3.3 Ozone Site of Maximum Concentrations for the Design Value...3/4 Table D-2 SLAMS Minimum O 3 Monitoring Requirements (from the CFR)...3/5 Table 3.4 Ozone PAMS Requirements...3/5 Table 3.5 Ozone NCore Requirements...3/6 Table 3.6 Ozone Summary of Minimum Monitoring Requirements...3/6 Table 3.7 Ozone Sampling Equipment...3/7 Table 3.8 Ozone Concentrations for the Last 20 Years...3/7 Table 3.9a Ozone Concentrations by Site for the Year...3/8 Table 3.9b Ozone Concentrations by Site for the Design Value...3/9 Table 4.0 Nitrogen Dioxide State and Federal Standards for the Year...4/1 Table 4.1 Nitrogen Dioxide and Reactive Oxides of Nitrogen Sampling Network...4/2 Table 4.2 Nitrogen Dioxide Near-road Requirements...4/3 Table 4.3 Nitrogen Dioxide Near-road Requirements (2 nd Site at Boston Ave.)... 4/4-5 Table 4.4 Nitrogen Dioxide Area-wide Requirements...4/6 Table 4.5 Nitrogen Dioxide Regional Administrator Requirements...4/7 Table D-6 SLAMS Minimum NO 2 Monitoring Requirements (from the CFR)...4/7 Table 4.6 Nitrogen Dioxide PAMS Type II Requirements...4/8 Table 4.7 Nitrogen Dioxide Summary of Minimum Monitoring Requirements...4/8 Table D-6 PAMS Minimum NOy Monitoring Requirements (from the CFR)...4/9 Table 4.8 Reactive Oxides of Nitrogen PAMS Requirements...4/9
8 Table of Contents Page VI of XIX Table 4.9 Reactive Oxides of Nitrogen NCore Requirements...4/10 Table 4.10 Reactive Oxides of Nitrogen Summary of Minimum Monitoring Requirements...4/10 Table 4.11 Nitrogen Dioxide & Reactive Oxides of Nitrogen Sampling Equipment...4/11 Table 4.12 Nitrogen Dioxide Concentrations for the Last 20 Years...4/11 Table 4.13a Nitrogen Dioxide Concentrations by Site for the Year...4/12 Table 4.13b Nitrogen Dioxide Concentrations by Site for the Design Value...4/13 Table 5.0 Carbon Monoxide State and Federal Standards for the Year...5/1 Table 5.1 Carbon Monoxide Sampling Network...5/2 Table 5.2 Carbon Monoxide Near-road Requirements...5/3 Table 5.3 Carbon Monoxide NCore Requirements...5/3 Table D-6 PAMS Minimum CO Monitoring Requirements (from the CFR)...5/4 Table 5.4 Carbon Monoxide PAMS Requirements...5/4 Table 5.5 Carbon Monoxide Minimum Monitoring Requirements, State...5/4 Table 5.6 Carbon Monoxide Summary of Minimum Monitoring Requirements...5/5 Table 5.7 Carbon Monoxide Sampling Equipment...5/6 Table 5.8 Carbon Monoxide Concentrations for the Last 20 Years...5/6 Table 5.9 Carbon Monoxide Concentrations by Site for the Year...5/7 Table 6.0 Sulfur Dioxide State and Federal Standards for the Year...6/1 Table 6.1 Sulfur Dioxide Sampling Network...6/2 Table 6.2a Sulfur Dioxide Emissions Inventory for the Year...6/3 Table 6.2b Sulfur Dioxide Ambient (non-ncore) Requirements...6/3 Table 6.3 Sulfur Dioxide NCore Requirements...6/4 Table 6.4 Sulfur Dioxide Summary of Minimum Monitoring Requirements...6/4 Table 6.5 Sulfur Dioxide Sampling Equipment...6/7 Table 6.6 Sulfur Dioxide Summary of Concentrations for the Last 20 Years...6/7 Table 6.7 Sulfur Dioxide Concentrations by Site for the Year...6/6 Table 7.0 Lead State and Federal Standards for the Year...7/1 Table 7.1 Lead Sampling Network...7/2 Table 7.2 Lead Airport (non-source) Minimum Monitoring Requirements...7/3 Table 7.3 Lead Source (non-airport) Minimum Monitoring Requirements...7/4 Table D-3A Airports to be Monitored for Lead (from the CFR)...7/4 Table 7.4 Lead Airport Study Requirements...7/5 Table 7.5 Lead NCore Minimum Monitoring Requirements...7/5 Table 7.6 Lead Summary of Minimum Monitoring Requirements...7/5 Table 7.7 Lead Sampling Equipment...7/6 Table 7.8 Lead Concentrations for the Last 20 Years...7/6 Table 7.9 Lead Concentrations by Site for the Year...7/7 Table 8.0 PM 2.5 State and Federal Standards for the Year...8/1 Table 8.1 PM 2.5 Sampling Network...8/2 Table D-5 PM 2.5 Manual Minimum Monitoring Requirements (from the CFR)...8/4 Table 8.2a PM 2.5 Manual Minimum Monitoring Requirements-Design Criteria (Annual Average)...8/4 Table 8.2b PM 2.5 Manual Minimum Monitoring Requirements-Design Criteria (24-hrs)...8/5 Table 8.2c PM 2.5 Manual Minimum Monitoring Requirements-Ambient...8/5 Table 8.3 PM 2.5 Manual Minimum Monitoring Requirements-State...8/5 Table 8.4 PM 2.5 Manual Minimum Monitoring Requirements-Collocation...8/6 Table 8.5a PM 2.5 Manual Minimum Monitoring Requirements-Site of Expected Maximum Concentration (Annual Average)...8/7
9 Table of Contents Page VII of XIX Table 8.5b PM 2.5 Manual Minimum Monitoring Requirements-Site of Expected Maximum Concentration (24-Hrs)...8/7 Table 8.6 PM 2.5 Manual Minimum Monitoring Requirements-Near road...8/8 Table 8.7 PM 2.5 Manual Minimum Monitoring Requirements-Site of Poor Air Quality...8/8 Table 8.8 PM 2.5 Manual Minimum Monitoring Requirements-NCore...8/9 Table 8.9 PM 2.5 Manual Minimum Monitoring Requirements-Summary...8/9 Table 8.10a PM 2.5 Continuous Minimum Monitoring Requirements-Ambient...8/10 Table 8.10b PM 2.5 Continuous Minimum Monitoring Requirements-Collocation with PM 2.5 Manual Method Sampler...8/10 Table 8.11 PM 2.5 Continuous Minimum Monitoring Requirements-NCore...8/11 Table 8.12 PM 2.5 Continuous Minimum Monitoring Requirements-Summary...8/11 Table 8.13 PM 2.5 Speciation Minimum Monitoring Requirements...8/12 Table 8.14 PM 2.5 Speciation Minimum Monitoring Requirements-NCore...8/12 Table 8.15 PM 2.5 Speciation Minimum Monitoring Requirements-Summary...8/12 Table 8.16a PM 2.5 Suitability for Comparison to the NAAQS-PM 2.5 Manual (Equipment)...8/13 Table 8.16b PM 2.5 Suitability for Comparison to the NAAQS-PM 2.5 Continuous Unsuitability (Equipment)...8/13 Table 8.16c PM 2.5 Suitability for Comparison to the NAAQS-PM 2.5 Speciation Unsuitability (Equipment)...8/13 Table 8.17 PM 2.5 Manual Operating Schedule-for Manual Samplers not Collocated with Continuous...8/14 Table 8.18 PM 2.5 Manual Operating Schedule-for Manual Samplers Collocated with Continuous...8/15 Table 8.19a PM 2.5 Manual Operating Schedule-for 24-Hr Design Value...8/15 Table 8.19b PM 2.5 Manual Operating Schedule-ACTUAL for 24-Hr Design Value...8/16 Table 8.20 PM 2.5 Manual Operating Schedule-NCore...8/16 Table 8.21 PM 2.5 Speciation Operating Schedule-NCore...8/16 Table 8.22 PM 2.5 Manual Concentrations for San Diego-for the Last 20 Years (24-Hr)...8/17 Table 8.23 PM 2.5 Manual Concentrations for San Diego-by Site for the Year (24-Hr & Annual Avg)...8/18 Table 8.24 PM 2.5 Manual Concentrations for San Diego-by Site for the Design Value (24-Hr)...8/19 Table 8.25 PM 2.5 Continuous Concentrations for San Diego-by Site for the Year (24-Hr & Annual Avg)...8/21 Table 8.26 PM 2.5 Continuous Concentrations for San Diego-by Site for the Design Value (24-Hr)...8/22 Table 9.0 PM 10 State and Federal Standards for the Year...9/1 Table 9.1 PM 10 Sampling Network...9/2 Table D-4 PM 10 Minimum Monitoring Requirements (from the CFR)...9/3 Table 9.2a PM 10 Design Value (24-Hrs) for the Year...9/3 Table 9.2b PM 10 Ambient Minimum Monitoring Requirements...9/4 Table 9.3 PM 10 NCore Minimum Monitoring Requirements...9/4 Table 9.4 PM 10 Summary of Minimum Monitoring Requirements...9/4 Table 9.5a PM 10 Suitability for Comparison to the NAAQS, Equipment and Siting...9/5 Table 9.5b PM 10 Suitability for Comparison to the NAAQS, Sampling Frequency...9/5 Table 9.6 PM 10 Concentrations for the Last 20 Year2...9/6 Table 9.7 PM 10 Concentrations by Site at Standard (STD) Conditions for the Year...9/7 Table 9.8 PM 10 Concentrations by Site at Local (LC) Conditions for the Year...9/8 Table 10.1a NCore Minimum Monitoring Requirements...10/2 Table 10.1b NCore Equipment Minimum Monitoring Requirements...10/2 Table 10.2 NCore Suitability for Comparison to the NAAQS, Equipment and Frequency...10/3 Table 10.3a NCore PMcoarse Concentrations...10/4 Table 10.3b NCore CO TLE Concentrations Table 10.3c NCore SO 2 Concentrations...10/4 Table 10.3d1 NCore NOy-NO Concentrations...10/4 Table 10.3d2 NCore SO 2 TLE Concentrations...10/4 Table 10.3e NCore Pb Concentrations...10/4
10 Table of Contents Page VIII of XIX Table 11.0 PAMS Sampling Network...11/2 Table 11.1 PAMS Sampling Season Minimum Monitoring Requirements...11/3 Table 11.2 PAMS VOC Type 2 Stations Minimum Monitoring Requirements Table D-6 PAMS Minimum Monitoring Requirements (from the CFR)...11/4 Table 11.3 PAMS VOC non-type 2 Minimum Monitoring Station Requirements...11/5 Table 11.4 PAMS VOC Sampling Frequency Minimum Monitoring Requirements...11/5 Table 11.5 PAMS Carbonyls Type 2 Stations Minimum Monitoring Requirements...11/5 Table 11.6 PAMS Carbonyls Sampling Frequency Minimum Monitoring Requirement...11/6 Table 11.7 PAMS NOx (NO 2 ) Minimum Monitoring Requirements...11/6 Table 11.8 PAMS NOy Minimum Monitoring Requirements...11/7 Table 11.9 PAMS CO Minimum Monitoring Requirements...11/7 Table PAMS O 3 Minimum Monitoring Requirements...11/8 Table PAMS Meteorology Minimum Monitoring Requirements, Surface...11/8 Table PAMS Meteorology Minimum Monitoring Requirements, Upper Air Sensors...11/9 Table PAMS Summary of Minimum Monitoring Requirements...11/9 Table PAMS Sampling Equipment...11/10 Table PAMS VOC Parameter Codes...11/10 Table PAMS Carbonyls Parameter Codes...11/10 Table 12.1 Toxics Sampling Network...12/2 Table 12.2a Toxics Sampling Equipment...12/3 Table 12.2b Toxics VOCs Parameter Codes...12/3
11 Table of Contents Page IX of XIX LIST OF FIGURES FIGURE TITLE SECTION/PAGE(S) Figure 2.0 San Diego APCD Air Quality Monitoring Network...2/3 Figure A1 Map of Distance between Floyd Smith Drive and Lexington Elementary School...2/21 Figure B1 Map of Distance between Downtown and Lexington Elementary School...2/27 Figure 3.0 Ozone Network Map...3/1 Figure 3.1 Ozone Concentrations for the Last 20 Years Graph...3/7 Figure 3.2a Ozone Concentrations by Site for the Year Graph...3/8 Figure 3.2b Ozone Concentrations by Site for the Design Value Graph...3/9 Figure 4.0 Nitrogen Dioxide Network Map...4/1 Figure 4.1 Nitrogen Dioxide Concentrations for the Last 20 Years Graph...4/11 Figure 4.2a Nitrogen Dioxide Concentrations by Site for the Year Graph...4/12 Figure 4.2b Nitrogen Dioxide Concentrations by Site for the Design Value Graph...4/13 Figure 5.1 Carbon Monoxide Network Map...5/1 Figure 5.2 Carbon Monoxide Concentrations for the Last 20 Years Graph...5/6 Figure 5.3 Carbon Monoxide Concentrations by Site for the Year Graph...5/7 Figure 6.0 Sulfur Dioxide Network Map...6/1 Figure 6.1 Sulfur Dioxide Concentrations for the Last 20 Years Graph...6/5 Figure 6.2 Sulfur Dioxide Concentrations by Site for the Design Value Graph...6/6 Figure 7.0 Lead Network Map...7/1 Figure 7.1 Lead Concentrations for the Last 20 Years Graph...7/6 Figure 7.2 Lead Concentrations by Site for the Year Graph...7/7 Figure 8.0 PM 2.5 (Overall) Network Map...8/1 Figure 8.1 PM 2.5 Manual Concentrations for San Diego-for the Last 20 Years Graph...8/12 Figure 8.2 PM 2.5 Manual Concentrations for San Diego-by Site for the Year (24-Hr & Annual Avg)...8/18 Figure 8.3 PM 2.5 Manual Concentrations for San Diego-by Site for the Design Value (24-Hr)...8/20 Figure 8.4 PM 2.5 Continuous Concentrations for San Diego-by Site for the Year (24-Hr & Annual Avg)...8/21 Figure 8.3 PM 2.5 Continuous Concentrations for San Diego-by Site for the Design Value (24-Hr)...8/22 Figure 9.0 PM 10 (Overall) Network Map...9/1 Figure 9.1 PM 10 Concentrations for the Last 20 Years Graph...9/6 Figure 9.2 PM 10 Concentrations by Site at Standard Conditions (STD) for the Year Graph...9/7 Figure 9.3 PM 10 Concentrations by Site at Local Conditions (LC) for the Year Graph...9/8 Figure 10.0 NCore Network Map...10/1 Figure 11.0 PAMS Network Map...11/1 Figure 13.0 Toxics Network Map...12/1
12 Table of Contents Page X of XIX APPENDICIES SECTION TITLE PAGE(S) Appendix A Introduction... 1 Table A1 Relationship Between the Site Types and Scales or Representativeness... 1 Table A2 Summary of Definitions in the Site Description Template... 2 Table A3 Summary of Probe Monitoring Path Requirements... 3 Figure E1 Particulate Probe Roadway... 4 Appendix 1 Alpine (ALP) Monitoring Station Table 1.1 General Site Information... 1 Figure 1.1 Picture of the Location of the Station... 1 Table 1.2a Gaseous Pollutant Monitor Designations + Other... 2 Table 1.2b Particulate Pollutant Monitor Designations... 3 Table 1.2c Other Pollutant Monitor Designations... 4 Table 1.2d Meteorological Equipment Designations + Other... 5 Figure 1.2 Pictures (Directional) from the Rooftop... 6 Appendix 1(t) Alpine (ALP) Monitoring Station (temporary) Table 1.1 General Site Information... 1 Figure 1.1 Picture of the Location of the Station... 1 Table 1.2a Gaseous Pollutant Monitor Designations + Other... 2 Table 1.2b Particulate Pollutant Monitor Designations... 3 Table 1.2c Other Pollutant Monitor Designations... 4 Table 1.2d Meteorological Equipment Designations + Other... 5 Figure 1.2 Pictures (Directional) from the Rooftop... 6 Appendix 2 Camp Pendleton (CMP) Monitoring Station Table 2.1 General Site Information... 1 Figure 2.1 Picture of the Location of the Station... 1 Table 2.2a Gaseous Pollutant Monitor Designations + Other... 2 Table 2.2b Particulate Pollutant Monitor Designations... 3 Table 2.2c Other Pollutant Monitor Designations... 4 Table 2.2d Meteorological Equipment Designations + Other... 5 Figure 2.2 Pictures (Directional) from the Rooftop... 6 Appendix 3 Chula Vista (CVA) Monitoring Station Table 3.1 General Site Information... 1 Figure 3.1 Picture of the Location of the Station... 1 Table 3.2a Gaseous Pollutant Monitor Designations + Other... 2 Table 3.2b Particulate Pollutant Monitor Designations... 3 Table 3.2c Other Pollutant Monitor Designations... 4 Table 3.2d Meteorological Equipment Designations + Other... 5 Figure 3.2 Pictures (Directional) from the Rooftop... 6 Appendix 4 Del Mar (DMR) Monitoring Station Table 4.1 General Site Information... 1 Figure 4.1 Picture of the Location of the Station... 1 Table 4.2a Gaseous Pollutant Monitor Designations + Other... 2 Table 4.2b Meteorological Equipment Designations + Other... 3 Figure 4.2 Pictures (Directional) from the Rooftop... 4
13 Table of Contents Page XI of XIX Appendix 5 Donovan (DVN) Monitoring Station Table 5.1 General Site Information... 1 Figure 5.1 Picture of the Location of the Station... 1 Table 5.2a Gaseous Pollutant Monitor Designations + Other... 2 Table 5.2b Particulate Pollutant Monitor Designations... 3 Table 5.2c Other Pollutant Monitor Designations... 4 Table 5.2d Meteorological Equipment Designations + Other... 5 Figure 5.2 Pictures (Directional) from the Rooftop... 6 Appendix 6 San Diego/Beardsley St. - Downtown (DTN) Monitoring Station Table 6.1 General Site Information... 1 Figure 6.1 Picture of the Location of the Station... 1 Table 6.2a Gaseous Pollutant Monitor Designations + Other... 2 Table 6.2b Particulate Pollutant Monitor Designations... 3 Table 6.2c Other Pollutant Monitor Designations... 4 Table 6.2d Meteorological Equipment Designations + Other... 5 Figure 6.2 Pictures (Directional) from the Rooftop... 6 Appendix 7 McClellan-Palomar Airport (CRQ) Monitoring Station Table 7.1 General Site Information... 1 Figure 7.1 Picture of the Location of the Station... 1 Table 7.2a Particulate Pollutant Monitor Designations... 2 Figure 7.2 Pictures (Directional) from the Rooftop... 3 Appendix 8 Escondido (ESC) Monitoring Station Table 8.1 General Site Information... 1 Figure 8.1 Picture of the Location of the Station... 1 Table 8.2a Gaseous Pollutant Monitor Designations + Other... 2 Table 8.2b Particulate Pollutant Monitor Designations... 3 Table 8.2c Other Pollutant Monitor Designations... 4 Table 8.2d Meteorological Equipment Designations + Other... 5 Figure 8.2 Pictures (Directional) from the Rooftop... 6 Appendix 9 Kearny Villa Rd. (KVR) Monitoring Station Table 9.1 General Site Information... 1 Figure 9.1 Picture of the Location of the Station... 1 Table 9.2a Gaseous Pollutant Monitor Designations + Other... 2 Table 9.2b Particulate Pollutant Monitor Designations... 3 Table 9.2c Other Pollutant Monitor Designations... 4 Table 9.2d1 Meteorological Equipment Designations + Other... 5 Table 9.2d2 Meteorological Equipment (Additional) Designations... 5 Figure 9.2 Pictures (Directional) from the Rooftop... 7 Appendix 10 San Ysidro (SAY) Monitoring Station Table 10.1 General Site Information... 1 Figure 10.1 Picture of the Location of the Station... 1 Table 10.2a Particulate Pollutant Monitor Designations... 2 Figure 10.2 Pictures (Directional) from the Rooftop... 3
14 Table of Contents Page XII of XIX Appendix 11 Floyd Smith Drive (FSD) Monitoring Station Table 11.1 General Site Information... 1 Figure 11.1 Picture of the Location of the Station... 1 Table 11.2a Gaseous Pollutant Monitor Designations + Other... 2 Table 11.2b Particulate Pollutant Monitor Designations... 3 Table 11.2c Other Pollutant Monitor Designations... 4 Table 11.2d Meteorological Equipment Designations + Other... 5 Appendix 12 Rancho Carmel Drive (RCD) Monitoring Station Table 12.1 General Site Information... 1 Figure 12.1 Picture of the Location of the Station... 1 Table 12.2a Gaseous Pollutant Monitor Designations + Other... 2 Figure 12.2 Pictures (Directional) from the Rooftop... 3
15 Table of Contents Page XIII of XIX ACRONYMS Symbols & Numbers >- Greater than <- Less than - Greater than or equal to - Less than or equal to %- percent µg/m 3 - micrograms per cubic meter 7/24- Monitor that operates 24 hours a day, 7 days a week A AAQS- Ambient Air Quality Standards AADT- Average Actual Daily Traffic Acid Rain- Rain which is especially acidic, which typically is composed of sulfuric and/or nitric acid. Formed by the combination of nitrogen and sulfur oxides with water vapor in the atmosphere. Aerosol- Particles of solid or liquid matter that can remain suspended in air for long periods of time because of extremely small size and/or weight. Area wide- Stationary sources of pollution Attainment Area; a geographic area which is in compliance with the NAAQS Air Explorer- AQS data analysis tool AirNow- AQI real time data ALP- Alpine monitoring location AMP reports- Series of AQS retrieval reports Ambient Air- The air occurring at a particular time and place outside of structures. AMTIC- Ambient Monitoring Technical Information Center APCD- Air Pollution Control District; a county agency with authority to regulate sources of air pollution within the county and governed by the county supervisors. AQI- Air Quality Index AQMD- Air Quality Management District; a group of counties or an individual county with authority to regulate sources of air pollution within the region and governed by a regional air pollution control board. AQS- Air Quality System ARM- Approved Regional Method Automated (aka continuous)- A sampler that operates on a 7/24 schedule B BAM- Beta Attenuation Monitor BURN- Agricultural Burning refers to the intentional use of fire for the burning of vegetation produced wholly from the growing and harvesting of crops in agricultural operations. This includes the burning of grass and weeds in fence rows, ditch banks, and berms in non-tillage orchard operations, fields being prepared for cultivation, agricultural wastes, and the operation or maintenance of a system for the delivery of water for agricultural operations.
16 Table of Contents Page XIV of XIX C CAA- Clean Air Act CARB- California Air Resources Board CASAC- Clean Air Science Advisory Committee CASTNET- Clean Air Status and Trends Network CA TAC- California Air Toxics monitoring CBSA- Core Bases Statistical Area CFR- Code of Federal Regulations CL- Chemiluminescence method is based upon the emission of photons in the reaction between ozone and nitric oxide (NO) to form nitrogen dioxide and oxygen. CMP- Camp Pendleton monitoring location CO- Carbon monoxide CO 2 - Carbon dioxide Collocated- a monitor/sampler that is located within 1-4 meters, depending on the sampling rate of another one of the same sampling method. Continuous (aka automated)- A sampler that operates on a 7/24 schedule Criteria pollutants- An air pollutant for which acceptable levels of exposure can be determined and for which an ambient air quality standard has been set. CRQ- McClellan-Palomar Airport monitoring location CSA- Core based Statistical Area Cr(VI) (aka Cr +6 )- Chromium 6 CSN- Monitors that are part of the Chemical Speciation Network (carbon analyses) CT- Low volume, continuous sampler, size selective inlet method is based upon a regulated low flow (16.7 LPM) instrument that operates 7 / 24. CVA- Chula Vista monitoring location D DVN- Donovan monitoring station DMR- Del Mar monitoring station DNPH- 2,4 dinitrophenyl hydrazine; a derivatizing agent on cartridges used to collect carbonyl samples DTN- San Diego/Beardsley St. monitoring location E EIR- Environmental Impact Report EC- Elemental Carbon ECA- El Cajon monitoring station EPA- Environmental Protection Agency ESC- Escondido monitoring station EXDN- Extreme downwind site type F FDMS- Filter Dynamic Measurement System FE- Fleet equivalency FEM- Federal Equivalent Method FIP- Federal Implementation Plan
17 Table of Contents Page XV of XIX FL- Fluorescence method is based upon the principle that SO 2 molecules absorb ultraviolet (UV) light and become excited at one wavelength, then decay to a lower energy state emitting UV light at a different wavelength. The intensity of fluorescence is proportional to the SO2 concentration. FOIA- Freedom of Information Act FR- Federal Register FRM- Federal Reference Method FSL- Fused silica lined FY- Fiscal Year G G/B- General/Background site type GC/FID- Gas Chromatography with a flam ionization detector GC/MS- Gas Chromatography followed by mass spectroscopy H HAP- Hazardous Air Pollutant; An air pollutant considered by the EPA to be particular hazardous to health. HC- Highest concentration site type HD- High density HPLC- High Performance Liquid Chromatography Hr- Hour Hydrocarbon- Any of a large number of compounds containing various combinations of hydrogen and carbon atoms. I ICP/MS- Inductively Coupled Plasma Mass Spectrometry IMPROVE- Interagency Monitoring of Protected Visual Environments Inversion- A layer of warm air in the atmosphere that lies over a layer of cooler air, trapping pollutants. IO- Inorganic IR- Nondispersive infrared method is based upon the absorption of infrared radiation by CO in a non-dispersive photometer. Infrared energy from a source is passed through a cell containing the gas sample to be analyzed, and the quantitative absorption of energy by CO in the sample cell is measured by a suitable detector. K KMA- San Diego/Overland (aka Kearny Mesa) monitoring location KVR- Kearny Villa Road monitoring location L Lat- Latitude Level I calibrator- A calibrator that is certified according to EPA specifications Level II- calibrator- A calibrator that is not certified Lon- Longitude M Manual (aka sequential)- A sampler that requires a media change and operates on a schedule set by the EPA. MDL- Method Detection Limit
18 Table of Contents Page XVI of XIX Met- Meteorological MI- Microscale is an expanse of uniform pollutant concentrations, ranging from several meters up to 100m. MOA- Memorandum of Agreement Mobile Sources- Sources of air pollution that are not stationary, e.g. automobiles. Monitoring- The periodic or continuous sampling and analysis of air pollutants in ambient air or from individual pollutant sources. MOU- Memorandum of Understanding MS- Middle Scale is an expanse of uniform pollutant concentrations, ranging from about 100 meters to 0.5 kilometers MSA- Metropolitan Statistical Area MXO- Maximum ozone concentration site type MXP- Maximum ozone precursor site type N NAAQS- National Ambient Qir Quality Standard NACAA- National Association of Clean Air Agencies NAFTA- North American Trade Agreement NAMS- National Air Monitoring Station NATA- National Air Toxics Assessment NATTS- National Air Toxics Trends Sites NCore- National Core multipollutant monitoring stations NEI- National Emissions Inventory NEPA- non-epa Federal monitor type NIST- National Institute of Standards and Technology NOAA- National Oceanic and Atmospheric Administration Non-Methane Hydrocarbons- (aka ROGs); a chemical gas composed of hydrocarbons that may contribute to the formation of smog. NOx- Oxides of Nitrogen NO- Nitric oxide NO 2 - Nitrogen dioxide NOy- Reactive oxides of nitrogen NPAP- National Performance Audit Program NPEP- National Performance Evaluation Program NPS- National Parks Service NS- Scale is an expanse with dimensions, ranging in the 0.5 kilometer to 4.0 kilometer range. NSR- New Source Review; a program used in development of permits for modifying industrial facilities which are in a non-attainment area. Non-Attainment Area- A geographic area identified by the EPA as not meeting the NAAQS for a given pollutant. NTIS- National Technical Information Service O OAQPS- Office of Air Quality Planning and Standards OC- Organic Carbon OTAQ- Office of Transportation and Air Quality OTM- Otay Mesa monitoring location
19 Table of Contents Page XVII of XIX O 3 - Ozone Ozone layer- A layer of ozone miles above the earth s surface which helps to filter out harmful UV rays from the sun. Ozone ground level- Exists at the earth s surface and is a harmful component of smog. Ozone precursors- Chemicals, such as hydrocarbons, occurring naturally or anthropogenic, which contribute to the formation of ozone. P P&A- Precision and Accuracy PAH- Polynuclear Aromatic Hydrocarbon PAMS- Photochemical Assessment Monitoring Stations PAMS Type I- Designation for areas which are subjected to overwhelming incoming transport of ozone. Located in the predominant morning upwind direction from the area of maximum precursor emissions (upwind and background). Typically located near the upwind edge of the photochemical grid model domain. PAMS Type II- Designation for areas immediately downwind of the area of maximum precursor Emissions (maximum precursor emissions impact) and are placed near the downwind boundary of the central business district or primary area of precursor emissions mix. PAMS Type III- Maximum ozone concentrations occurring downwind for the area of maximum precursor emissions. Typically these sites are located miles from the fringe of the urban area. Pb- Lead PE- Population exposure site type PEP- Performance Evaluation Program Photochemical reaction- A term referring to chemical reactions brought about by the light energy of the sun. PM- Particulate Matter PMcoarse- (aka PMc or PM ) the resultant particles of the subtraction of PM 2.5 from PM 10. Coarse particulate matter with an aerodynamic diameter less than or equal to 2.5 micrometers PM An air pollutant of particle size of 2.5 micrometers or less, which is inhalable. PM 10 - An air pollutant of particle size of 10 micrometers or less, which is inhalable. POC- Parameter Occurrence Code ppb- Parts per billion ppm- Parts per million ppt- Parts per trillion PQAO- Primary Quality Assurance Organization PWEI- Populated Weighted Emissions Index %RH- Relative humidity Q QA- Quality Assurance and Quality Assurance site type QAC- Quality Assurance Collocated monitor type QAPP- Quality Assurance Project Plan QC- Quality Control QIP- Quality Improvement Plan QMP- Quality Management Plan Qtr- Quarter
20 Table of Contents Page XVIII of XIX R RASS- Radar Acoustic Sounding System ROG- Reactive Organic Gas (aka non-methane hydrocarbons); a chemical gas composed of hydrocarbons that may contribute to the formation of smog. RT- Regional transport site type RTI- Research Triangle Institute RTP- Research Triangle Park S SDAB- San Diego Air Basin SEE- Gillespie Field monitoring location SI- High volume, manual, size selective method is based upon a regulated high flow (>200 LPM) instrument that operates on a set schedule. SIP(M)- State Implementation Plan SLAMS- State/Local Air Monitoring Station S/L/T- State, Local, and Tribal agencies Smog- A combination of smoke, ozone, hydrocarbons, nitrogen oxides, and other chemically reactive compounds, which can result in a murky brown haze, which has adverse health effects. SMP- System Management Plan Speciation- Collection of a PM 2.5 sample that has its composition analyzed SO- Source oriented site type SOP- Standard Operating Procedures SO 2 - Sulfur dioxide SOW- Statement of Work SP- Low volume, speciated method is based upon a regulated low flow (< 200 LPM) instrument that operates on a set schedule. SPM- Special Purpose monitor type SQ- Low volume, sequential, size selective inlet method is based upon a regulated low flow (< 200 LPM) instrument that operates on a set schedule. STN- Monitors that are part of the Speciation Trends Network (ions and wood smoke) STAG- State Air Grand (federal) SU- Supplemental Speciation T TA- Trend Analysis monitoring is useful for comparing and analyzing air pollution concentrations over time. Trend analyses show the progress (or lack of progress) in improving air quality for an area over a period of years. TAC- Toxic Air Contaminant TAD- Technical Assistance Document TLE- Trace Level Toxics (aka Air Toxics)- A generic term referring to a harmful chemical or group of chemicals in the air that are especially harmful to health. Toxic Hot Spot- An area where the concentration of air toxics is at a level where individuals may be exposed to an elevated risk of adverse health effects. TTN- Technology Transfer Network TR- Pollutant Transport is the movement of a pollutant between air basins. Transport
21 Table of Contents Page XIX of XIX monitoring is used to help determine whether observed pollutant concentrations are locally generated or generated outside of the air basin and blown ( transported ) in, thereby raising local ambient air pollutant concentrations. Trends- STN or CSN monitor type TSP- Total Suspended Particulate U UNPAMS- Unofficial PAMS monitor type UPBD- Upwind background US- Urban Scale is Citywide pollutant conditions with dimensions ranging from 4 to 50 kilometers. UV- Ultraviolet Absorption method is based upon the absorption of UV light by the ozone molecule and subsequent use of photometry to measure reduction of light at 254 nm, as expressed by the Beer-Lambert Law. V VOC- Volatile Organic Compounds W WD- Wind Direction WF- Welfare Effects monitoring is used to measure air pollution impacts on visibility, vegetation damage, architectural damage, or other welfare-based impacts. WS- Wind Speed Y Yr- Year Z ZAG- Zero Air Generator
22 1 (left intentionally blank)
23 Chapter 1 Annual Network Plan Requirements Page 1 of 4 Chapter 1 Annual Network Plan Requirements Section Federal Citation In 2007, the U.S. Environmental Protection Agency (EPA) finalized amendments to the ambient air monitoring regulations. These amendments revised the technical requirements for certain types of sites, added provisions for the monitoring of PM 10 and PM 2.5, and reduced certain monitoring requirements for criteria pollutants. Monitoring agencies are required to submit annual monitoring network plans, conduct network assessments every five years, perform quality assurance activities, and, in certain instances, establish new monitoring programs. The regulations from Title 40, Part 58, Section 10(a) of the Code of Federal Regulations (40 CFR 58.10, (a)(1)) state that: Beginning July 1, 2007, the State, or where applicable local, agency shall adopt and submit to the Regional Administrator an annual monitoring network plan which shall provide for the establishment and maintenance of an air quality surveillance system that consists of a network of SLAMS monitoring stations including FRM, FEM, and ARM monitors that are part of SLAMS, NCore stations, STN stations, State speciation stations, SPM stations, and/or, in serious, severe and extreme ozone nonattainment areas, PAMS stations, and SPM monitoring stations. The plan shall include a statement of purposes for each monitor and evidence that siting and operation of each monitor meets the requirements of appendices A, C, D, and E of this part, where applicable. The annual monitoring network plan must be made available for public inspection for at least 30 days prior to submission to EPA. This document is prepared and submitted as partial fulfillment of these requirements. It describes the network of ambient air quality monitors, samplers, and analyzers operated by San Diego Air Pollution Control District (District) staff in fulfillment of EPA regulations governing network compliance that are updated every July 1. This annual comprehensive review serves to evaluate whether the current monitor strategies are meeting the needs of the District, to determine compliance with all current Federal, State, and Local regulations and to aid in the development of future monitoring strategies and decisions. It also serves to identify and report needs for additions, relocations, or terminations of monitoring sites or instrumentation. Section Purpose, Scope, and Organization of Annual Network Plan In San Diego County there are several locations where the ambient air quality is routinely measured for air pollutants. These sites are operated by the District. The measured data provide the public with information on the status of the air quality and the progress being made to improve air quality. The data can be used by health researchers, business interests, environmental groups, and others. This report describes the network of ambient air quality monitors within the SDAB and meets the requirements for an annual network plan as listed in Title 40 of the Code of Federal Regulations (CFR), Part The 40 CFR require that the report be submitted to the EPA by July 1, of each year (Please Note: The Network Plan was available for public review on June 16; submittal to EPA was on July 18). As required by the CFR, this report includes monitors which are federal reference methods (FRM) or federal equivalent methods (FEM). While the CFR also requires reporting of approved regional methods (ARM), no ARMs are in operation in San Diego County at this time. The terms FRM, FEM, and ARM denote monitoring instruments that produce measurements of the ambient pollution levels (or concentrations) that the regulations allow to be compared to the ambient air quality standards for regulatory purposes. This report also includes information regarding PM 2.5 speciation monitoring.
24 Chapter 1 Annual Network Plan Requirements Page 2 of 4 Section Public Comments Information Pursuant to Federal regulations, the draft report was available for a minimum of 30 days for public inspection period, ending June 30 with any comments to be submitted to the EPA (Please Note: Since the public review period did not begin until June 15, there will be a longer public review period; it will end on July 18). Notice of availability of the report was posted on the District s website ( published, and posted in local media, at least 30 days prior to EPA submission. Comments regarding this report before submittal to EPA will be addressed in the Executive Summary chapter (there were no comments. Comments submitted regarding this report after the public inspection period, will be forwarded to EPA Region IX headquarters. Please submit any comments in writing to David Shina, Senior Chemist, Ambient Air Quality Section, david.shina@sdcounty.ca.gov, or mail/deliver to District headquarters at David Shina c/o San Diego Air Pollution Control District, Old Grove Road, San Diego, CA, Section District Contact Information For information regarding this report, air monitoring stations, laboratory operations, or quality oversight of the monitoring program contact: David Shina, Senior Chemist, Ambient Air Quality Section, david.shina@sdcounty.ca.gov, (858) For information about daily field operations, contact: David Craig, Supervisor of Technicians, Technicians section, david.craig@sdcounty.ca.gov, (858) For information about the collection of meteorological data, episode modeling, air quality forecasting and smoke management plans, ambient air quality data contact: Bill Brick, Chief of Monitoring & Technical Services, Bill.Brick@sdcounty.ca.gov, (858) Section Additional Air Pollution Information Additional information regarding San Diego s ambient air quality monitoring network, including pollutant data summaries for the various monitors in the ambient air quality network, are available from a variety of sources. Much of this information is available on the web. This section lists a number of additional sources for related information. Similar information is available on EPA websites, including comprehensive historical information. Sample topics addressed include the following: National Ambient Air Quality Standards, Fine Particle (PM 2.5 ) Designations, The Plain English Guide to the Clean Air Act, About Air Toxics, Health and Ecological Effects, Air Trends, PAMS Information, Global Warming, Acid Rain, and Stratospheric Ozone. A broad, general overview of ambient air quality data in a question and answer format can be found at the following California Air Resources Board (CARB) web page: This web page includes links to various sites, both technical and non-technical. The ARB s Monitoring and Laboratory Division (MLD) maintains web pages with information about all the existing monitoring sites that routinely monitor and submit air quality data in California. These web pages also include detailed local maps showing the location of the sites. This information can be found at A more general MLD web page that provides links to other aspects of ambient monitoring is located at
25 Chapter 1 Annual Network Plan Requirements Page 3 of 4 Volume II of the CARB annual network report contains listings of all the monitoring sites in the State, along with the years for which the data are available for each monitor and regional maps showing the locations of the monitoring sites. To review the data from this report, as well as other data in general, go to Summaries of the official air quality data from sites around the State can be found at: For summaries of data monitored recently, up to the last few months, go to: These last two sources of information are maintained by the PTSD, as is the following, more general web page that lists links to other aspects of the ambient air quality data program: Pollution data is available on the District s website ( Other helpful websites to visit are: and at Section Description of Monitoring This document details the current monitoring network in the San Diego Air Basin (SDAB) for the criteria pollutants: ozone, nitrogen dioxide, carbon monoxide, sulfur dioxide, lead and particulate matter. Also, there are additional monitoring programs the District must detail: National Core (NCore), Speciation Trends Network (STN), Chemical Speciation Network (CSN), Photochemical Assessment Monitoring Stations (PAMS), Toxics, Near-road, and Special Purpose Monitoring (SPM). Specific site information includes location information, site type, objectives, spatial scale, sampling schedule, equipment used, sampling method used, and monitor objective. Section Network Design Theory Ambient air monitoring networks (Network) are designed to fulfill several criteria. A general summary of the criteria are below. Network Design Objectives 1. Provide data to the public in a timely manner. 2. Support compliance with NAAQS and emissions strategy development. 3. Support air pollution research studies. Logistical 1. Minimal interference and perturbation of wind flow by obstacles. 2. Proximity to headquarters/drive time. 3. Availability of power and communications. 4. Cost of site lease, relocation, or new deployment, site improvements, e.g. fence, road, etc. 5. Safety, security, and accessibility. 6. Flat, level footprint for shelter, platforms, and concrete pad. 7. Gravel or paved road access. Other 1. Funding. 2. Staffing. 3. Drive time from location to location. 4. Longevity of the site location. 5. Buildup of the area surrounding the location. 6. Proximity to other monitors. 7. Homogeneity in space and with respect to speciation. 8. Devoid of source influences (point sources, mobile sources, etc.).
26 Chapter 1 Annual Network Plan Requirements Page 4 of 4 Section San Diego Air Basin Description The San Diego Air Basin (SDAB) covers roughly 4,200 square miles, lies in the southwest corner of California, and encompasses all of San Diego County and a portion of the Salton Sea Air Basin. The population and emissions are concentrated mainly in the western portion of the County. Section Topography The topography of San Diego County is highly varied, being comprised of coastal plains and lagoons, flatlands and mesas, broad valleys, canyons, foothills, mountains, and deserts. Generally, building structures are on the flatlands, mesas, and valleys, while the canyons and foothills tend to be sparsely developed. This segmentation is what has carved the region into a conglomeration of separate cities that led to low density housing and an automobile-centric environment. The topography of San Diego County is unique and varied. To the west of San Diego are its beaches and the Pacific Ocean, to the south is Tijuana, Mexico and the Baja California Peninsula, to the near east are the mountains, to the far east is the desert (the Salton Sea Air Basin), and to the north is the South Coast Air Basin (the greater Los Angeles-Riverside-San Bernardino area). The topography also drives the pollutant levels. The SDAB is not classified as a contributor, but it is classified as a transport recipient. The transport pollutants are O 3, NOx and Volatile Organic Compounds (VOCs), that are transported from the South Coast Air Basin to the north and, when the wind shifts direction, Tijuana, Mexico, to the south. Section Climate The climate of San Diego is classified as Mediterranean, but is incredibly diverse because of the topography. The climate is dominated by the Pacific High pressure system that results in mild, dry summers and mild, wet winters. San Diego experiences an average of 201 days above 70 F and 9-13" of rainfall annually (mostly, November - March). El Niño and La Niña patterns have large effects on the annual rainfall received in San Diego. An El Niño is a warming of the surface waters of the eastern Pacific Ocean. It is a climate pattern that occurs across the tropical Pacific Ocean that is associated with drastic weather occurrences, including enhanced rainfall in Southern California. La Niña is a term for cooler than normal sea surface temperatures across the Eastern Pacific Ocean. San Diego receives less than normal rainfall during La Niña years. The Pacific High drives the prevailing winds in the SDAB. The winds tend to blow onshore in the daytime and offshore at night. In the summer, an inversion layer is created over the coastal areas and increases the O 3 levels. In the winter, San Diego often experiences a shallow inversion layer which tends to increase carbon monoxide and PM 2.5 concentration levels due to the increased use of residential wood burning. In the fall months, the SDAB is often impacted by Santa Ana winds. These winds are the result of a high pressure system over the Nevada-Utah region that overcomes the westerly wind pattern and forces hot, dry winds from the east to the Pacific Ocean. These winds are powerful and incessant. They blow the air basin s pollutants out to sea. However, a weak Santa Ana can transport air pollution from the South Coast Air Basin and greatly increase the San Diego O 3 concentrations. A strong Santa Ana also primes the vegetation for firestorm conditions. Section Population The population of San Diego County has been increasing by about 1.5% per year, in general. The 2010 census population was 3.2 million. It is estimated to be 3.3 million for 2015.
27 Chapter 2: Executive Summary of the Air Quality Monitoring Network Page 1 of 29 Chapter 2 Overview of the Air Quality Monitoring Network Section Executive Summary of the Air Quality Monitoring Network The District operated 12 monitoring sites that collected criteria pollutant data (Figure 1.0); one of the sites also has a radar wind profiler. This special meteorological site is used to assist with pollutant forecasting, data analysis and characterization of pollutant transport throughout the air basin. The District s monitoring network has been designed to provide criteria pollutant monitoring coverage to the majority of the inhabited regions of the County (Tables 2.0 & 2.1). Since the San Diego County Air Pollution Control District was established by the County Board of Supervisors in 1955, occasional air monitoring has been performed in remote portions of the County, including the mountain and desert areas. Historical measurements have shown relatively low levels of air pollution in these areas. Population and growth in these areas have remained low enough that routine air sampling has not been deemed necessary. As harmful air contaminants are most likely to be found in those areas where population is dense, traffic patterns are heavy, and industrial sources are concentrated, one would expect such contaminants to be most prevalent in the western portion of San Diego County. Measurements show this to be true. As pollutants are carried inland by prevailing winds, they are frequently trapped against the mountain slopes by a temperature inversion layer, generally occurring between 1500 and 2500 feet above sea level. Therefore, our air monitoring stations are found between the coast and the mountain foothills up to approximately 2000 feet. The monitoring network needs to be large enough to cover the diverse range of topography, meteorology, emissions, and air quality in San Diego, while adequately representing the large population centers. This monitoring network plays a critical role in assessing San Diego County s clean air progress and in determining pollutant exposures throughout the County. Ambient concentration data are collected for a wide variety of pollutants. The most important of these, in the San Diego Air Basin, are: ozone, fine particulate matter 2.5 micrometers and less in diameter, particulate matter 10 micrometers and less in diameter, and a number of toxic compounds. Other pollutants measured include oxides of nitrogen, carbon monoxide, sulfur dioxide, and lead. Monitoring for meteorological parameters are also conducted at most monitoring locations. Data for all of the pollutants are needed to better understand the nature of the ambient air quality in San Diego County, as well as to inform the public regarding the quality of the air they breathe. Not all pollutants are monitored at all sites, but most sites monitor for multiple pollutants. A particular site s location and monitoring purpose determine the actual pollutants measured at that site. A fundamental purpose of air monitoring is to distinguish between areas where pollutant levels exceed the ambient air quality standards and areas where those standards are not exceeded. Health-based ambient air quality standards are set at levels that preclude adverse impacts to human health (allowing for a margin of safety). The District develops strategies and regulations to achieve the emission reductions necessary to meet all health-based standards. Data from the ambient monitoring network are then used to indicate the success of the regulations and control strategies in terms of the rate of progress towards attaining the standards or to demonstrate that standards have been attained and maintained. Thus, there is an established feedback loop between the emission reduction programs and the ambient monitoring programs. Over the years, Federal, State, and District regulatory/strategic measures have proven to be extremely successful at reducing levels of harmful air contaminants. Monitors once placed throughout the County to document the frequent and regular exceedance of ozone, nitrogen dioxide, carbon monoxide, and particulate matter standards now document the continued downward concentration trends of these pollutants.
28 Chapter 2: Executive Summary of the Air Quality Monitoring Network Page 2 of 29 Table 2.0 below is a list of the District s stations and the pertinent information regarding location. Table 2.0 List of Network Sites Station Station Name Abbreviation Address Alpine ALP 2462 W. Victoria Dr. Camp Pendleton CMP W. B St. Chula Vista CVA 80 E. J St. Del Mar DMR 225 9th St. Donovan DVN 480 Alta Rd. Escondido ESC 600 E. Valley Pkwy. San Diego-Beardsley St. DTN 1110A Beardsley St. Kearny Villa Rd. KVR Kearny Villa Rd. *McClellan-Palomar Airport CRQ 2192 Palomar Airport Rd. **El Cajon-Floyd Smith Drive FSD Floyd Smith Dr. Rancho Carmel Dr. RCD Rancho Carmel Drive. Latitude/ Longitude AQS ID San Ysidro SAY 720 E San Ysidro Blvd *The AQS ID number changed from to to reflect the change in sampling location. **El Cajon station was temporarily relocated to Floyd Smith Drive.

29 Figure 2.0 San Diego APCD Air Quality Monitoring Network 2015 Network Plan Chapter 2: Executive Summary of the Air Quality Monitoring Network Page 3 of 29
30 LEAD NCORE AMBIENT 2015 Network Plan Chapter 2: Executive Summary of the Air Quality Monitoring Network Page 4 of 29 Table 2.1 Air Monitoring Sites with Associated Monitors/Samplers 1 METEROLOGICAL PARAMETERS + Others TOXICS SU (APCD) CA-TAC (CARB) UN PAMS CSN SU STN ALP CMP CVA DMR DVN FSD ESC KVR CRQ DTN RCD SAY Alpine Camp Pendleton Chula Vista Del Mar Donovan Floyd Smith Escondido Kearny Villa Rd. Palomar O3 Beardsley St. Rancho Carmel Dr San Ysidro NO2 CO PM10 PM2.5 NOy-TLE CO-TLE SO2-TLE (NCore) (Hi-Vol) (Airports) (Hi-Vol) (NCore) (Lo-Vol) (Ambient) (Hi-Vol) (Continuous) (Manual) Channel 1 (Metals) Channel 2 (Inorganic Ions) Channel 3 (Wood Smoke) (Carbon) Channel 4 (Carbon) (VOCs) 5 (Carbonyls) Channels 2 & 3 (Carbonyls) (VOCs) (Total Metals) (Cr +6 ) (Aldehydes) (VOCs) Channel 1 (Total Metals) Wind Speed./ Wind Dir. External Temperature % Relative Humidity Internal Temperature Barometric Pressure Solar Radiation *Radar Wind Profiler/ Radio Acoustic Sounding
31 Chapter 2: Executive Summary of the Air Quality Monitoring Network Page 5 of 29 Yellowed areas indicate a collocation of samplers to satisfy Federal QA requirements. Collocated PM 2.5 FRM monitors and PM 10 monitors have a sampling frequency of 1:12 and 1:6, respectively. The collocated PM 2.5 FEM and PAMS-VOCs monitors have the same sampling frequency as their respective main monitors. All sample times are set to Pacific Standard Time. The District operates, calibrates, and audits all instruments listed in Table 1.1, except for the CARB s Xontech 924 s at the Chula Vista and El Cajon stations (operation only). Not all collected samples are analyzed by District personnel. Some samples are sent to the EPA or CARB laboratories for subsequent analysis. They are noted in Table 1.1 as EPA or CARB. SU stands for Supplemental Speciation. CA TAC stands for the California Toxics Air Contaminant Monitoring network. 1 Sampling frequencies are designated as follows: 7/24= a sampler that operates continually with no media changes needed (Please note that a filter tape roll is used on the BAM and changed as needed). 1:1= a sampler that requires a sample deposition media (filter, DNPH cartridge, or Summa canister); it runs daily for a duration of 24 hours. The media are manually loaded, collected, and programmed to run on a weekly basis. 1:3= a sampler that requires a sample deposition media (filter, DNPH cartridge, or Summa canister); it runs every three (3) days for a duration of 24 hours. The media are manually loaded, collected, and programmed in between sample days. 1:6= a sampler that requires a sample deposition media (filter, DNPH cartridge, or Summa canister); it runs every six (6) days for a duration of 24 hours. The media are manually loaded, collected, and programmed on a weekly basis 1:12= a sampler that requires a sample deposition media (filter, DNPH cartridge, or Summa canister); it runs every twelve (12) days for a duration of 24 hours. The media are manually loaded, collected, and programmed on a biweekly basis. 2 These samplers collect year round on a 1:6 sampling schedule. During the non-pams season (November to the end of June), the samples have a 24-hour sampling duration. During the PAMS season (July to the end of October), the samplers collect four samples that have a 3-hour sampling duration. The 3-hour samples are collected on a set time, start time (st) and end time (et) schedule and it is as follows: st et; st et; st et; st et *The Radar Wind Profiler is now no longer operational.
32 Chapter 2: Executive Summary or the Air Quality Monitoring Network Page 6 of 29 Tables use the same Glossary (see below) Glossary of Terms Monitor Type Method (Sampling/Analysis) Network Affiliation E= EPA CL= Chemiluminescence BG= Border Grant O= Other CT= Low Volume, size selective inlet, continuous CSN STN= Trends Speciation SLAMS= State & Local monitoring station FL= Fluorescence CSN SU= Supplemental Speciation SPM= Special purpose monitor HV= High volume NATTS= National Air Toxics Trends Stations CATAC= California Toxics Monitoring IR= Nondispersive infrared NCORE= National Core Multi-pollutant Monitoring Stations SI= High volume, size selective inlet NR= Monitors at sites meeting near road designs as per Part 58 SP= Low volume, size selective inlet, speciated PAMS= Photochemical Assessment Monitoring Stations Site Type Q= Low volume, size selective inlet, sequential UNPAMS= Unofficial PAMS site EXDN= Extreme downwind UV= Ultraviolet absorption HC= Highest concentration Canister= Evacuated stainless steel canisters Monitor Designation MXO= Maximum ozone concentration Cartridges= Di-nitrophenylhydrazine cartridges PRI= Primary MXP= Maximum precursor impact FSL= Fused Silica Lined QAC= Collocated PE= Population exposure Filter= Quartz filters O= Other SO= Source oriented UPBD= Upwind background Spatial Scale Objective (Federal) G/B= General/Background MI= Micro NAAQS= Suitable for NAAQS comparison RT= Regional Transport MS= Middle Research= Research support WRI= Welfare related impacts NS= PI= Public Information QA= Quality assurance US= Urban Scale = Not Applicable
33 CO NO2 & NOy 2015 Network Plan Chapter 2: Executive Summary or the Air Quality Monitoring Network Page 7 of 29 Section Overview of the Gaseous Pollutant Monitoring Network Table 2.2 is a summary of the criteria gaseous pollutants and NOy monitoring network. Table 2.2 Gaseous Pollutants Monitoring Network Abbreviation ALP CMP CVA DMR FSD ESC KVR DVN DTN RCD Name Alpine Camp Pendleton Chula Vista Del Mar Floyd Smith Dr. Escondido Kearny Villa Rd Donovan San Diego Beardsley Rancho Carmel Dr. AQS ID O3 Monitor Type SLAMS SLAMS SLAMS SLAMS SLAMS SLAMS SLAMS SLAMS SLAMS Method UV UV UV UV UV UV UV UV UV Affiliation PAMS PAMS Not Applicable Not Applicable PAMS, NCore Not Applicable PAMS Not Applicable Not Applicable Spatial Scale US NS NS NS NS NS Site Type MXO UPDB PE G/B PE PE PE PE G/B Objective (Federal) Equipment PI, NAAQS 49i PI, NAAQS 49i PI, NAAQS 49i PI, NAAQS 49 PI, NAAQS 49i Monitor Type SLAMS SLAMS SLAMS SLAMS SLAMS SLAMS SLAMS SLAMS SLAMS PI, NAAQS 49i NS PI, NAAQS 49i NS PI, NAAQS 49i NS PI, NAAQS 49i Designation PRI PRI PRI PRI PRI PRI PRI PRI PRI Method CL CL CL CL CL CL CL CL CL Affiliation PAMS PAMS Not Applicable PAMS Not Applicable PAMS SLAMS Not Applicable Not Applicable Spatial Scale US NS NS NS NS NS NS NS NS Site Type PE UPBD PE PE PE PE PE PE PE Objective (Federal) Equipment PI, NAAQS 42i PI, NAAQS 42i PI, NAAQS 42i PI, NAAQS 42i Monitor Type SLAMS SLAMS SLAMS SLAMS Method IR IR IR IR Affiliation NCORE, PAMS Not Applicable SIPM Not Applicable PI, NAAQS 42i PI, NAAQS 42i PI, NAAQS 42i PI, NAAQS 42i PI, NAAQS 42i Spatial Scale NS NS NS NS Site Type PE PE PE PE Objective (Federal) Equipment Monitor Type PI, NAAQS 48i-TLE SLAMS PI, NAAQS 48i PI, NAAQS 48i PI, NAAQS 48i Method Affiliation FL NCore SO2 Spatial Scale Site Type Objective (Federal) Equipment NS PE PI, NAAQS 43i-TLE
34 Lead 2015 Network Plan Chapter 2: Executive Summary or the Air Quality Monitoring Network Page 8 of 29 Section Overview of the Pb-TSP Monitoring Network Table 2.3 below is a summary of the lead particulates monitoring network. Table 2.3 Lead Sampling Network Abbreviation ECA/FSD CRQ Name Floyd Smith Dr. Palomar Airport Address Latitude Longitude Floyd Smith Dr Palomar Airport Rd O O AQS ID Monitor Type SLAMS SLAMS SLAMS Designation O O QAC Method HV HV HV Affiliation NCORE Not Applicable Not Applicable Spatial Scale NS MI MI Site Type PE SO QA Objective (Federal) NAAQS NAAQS NAAQS Analysis APCD APCD APCD Frequency 1:6 1:6 1:6 Equipment Tisch TE- 5170BLVFC+ Tisch TE- 5170BLVFC+ Tisch TE- 5170BLVFC+ Yellow denotes collocation of equipment of the same make and model as the primary. area
35 Chapter 2: Executive Summary or the Air Quality Monitoring Network Page 9 of 29 Section Overview of the PM 2.5 Monitoring Network Table 2.4 below is a summary of the PM 2.5 monitoring network. Table 2.4 PM 2.5 Sampling Network Abbreviation ALP CMP CVA FSD ESC KVR DTN DVN SAY Name Address Alpine 2462 W. Victoria Dr. Camp Pendleton W. B St Chula Vista Floyd Smith Dr. Escondido Kearny Villa Rd San Diego Beardsley 80 E. J St Floyd Smith Dr 600 E. Valley Pkwy Kearny Villa Rd 1110A Beardsley St. Donovan 480 Alta Rd. San Ysidro 720 E San Ysidro Blvd Latitude Longitude AQS ID PM2.5 (non-speciated) Monitor Type SPM SPM SLAMS SLAMS SLAMS SLAMS SPM SLAMS SLAMS SLAMS SLAMS SPM Designation O O PRI PRI O PRI O QAC O PRI O O Method CT (non-fem) CT (non-fem) SQ (FRM) SQ (FRM) CT (non-fem) Affiliation NCORE Spatial Scale SQ (FRM) CT (non-fem) SQ (FRM) CT (non-fem) SQ (FRM) CT (non-fem) US NS NS NS NS NS NS NS NS NS NS MI Site Type PE UPBD PE PE PE PE PE QA PE PE PE SO Objective (Federal) PI, Research PI, Research NAAQS NAAQS PI, Research Analysis APCD APCD APCD APCD APCD APCD APCD APCD APCD APCD APCD APCD NAAQS PI, Research NAAQS PI, Research NAAQS PI, Research CT (non-fem) PI, Research Frequency 7/24 7/24 1:3 1:3 7/24 1:3 7/24 1:12 7/24 1:1 7/24 7/24 PM2.5 (speciated) Equipment Monitor Type Met One BAM Met One BAM Met One BAM 2025 Met One BAM 2025 Met One BAM SLAMS SLAMS SLAMS SLAMS Method SP & SQ SP & SQ SP & SQ SP & SQ SP & SQ SP & SQ SP & SQ CSN SU CSN SU CSN SU NCORE, CSN NCORE, CSN Affiliation SDAPCD CSN STN CSN STN SDAPCD SDAPCD STN STN Network Network Network Spatial Scale NS NS NS NS NS NS NS Site Type PE PE PE PE PE PE PE Objective (Federal) Research Research Research Research Research Research Research Analysis EPA EPA APCD EPA CARB APCD APCD 2025 Met One BAM Met One BAM Frequency 1:3 1:3 1:6 1:3 1:6 1:6 1:6 Equipment URG- 3000N Met One SASS Met One SASS Yellow denotes collocation of equipment of the same make and model as the primary *Not Operational at FSD = Not Applicable URG- 3000N Met One SASS Met One SASS Met One SASS
36 Chapter 2: Executive Summary or the Air Quality Monitoring Network Page 10 of 29 Section Overview of the PM 10 Monitoring Network Table 2.5 below is a summary of the PM 10 monitoring network. Table 2.5 PM 10 Sampling Network Abbreviation CVA DVN FSD ESC KVR DTN Name Chula Vista Donovan Floyd Smith Dr. Escondido Kearny Villa Rd Address Latitude Longitude 80 E. J St Alta Rd Floyd Smith Dr E. Valley Pkwy Kearny Villa Rd San Diego Beardsley 1110A Beardsley St AQS ID Monitor Type SLAMS SLAMS SLAMS SLAMS SLAMS SLAMS SLAMS Designation O QAC O O O O O PM10 Method SI SI SI SI SI SI SI Affiliation Not Applicable Not Applicable Not Applicable NCORE Not Applicable Not Applicable Spatial Scale NS NS NS NS NS NS NS Site Type PE PE HC PE PE PE PE Objective (Federal) Not Applicable NAAQS NAAQS NAAQS NAAQS NAAQS NAAQS NAAQS Frequency 1:6 1:6 1:6 1:3 1:6 1:6 1:6 Equipment Graseby Metal Works body w/ Sierra Anderson 1200 Head Graseby Metal Works body w/ Sierra Anderson 1200 Head Graseby Metal Works body w/ Sierra Anderson 1200 Head 2025 w/o Very Sharp Cut Cyclone Graseby Metal Works body w/ Sierra Anderson 1200 Head Yellow denotes collocation of equipment of the same make and model as the primary Graseby Metal Works body w/ Sierra Anderson 1200 Head Graseby Metal Works body w/ Sierra Anderson 1200 Head
37 PAMS 2015 Network Plan Chapter 2: Executive Summary or the Air Quality Monitoring Network Page 11 of 29 Section Overview of the PAMS Monitoring Network Table 2.6 is a summary of the PAMS monitoring network. Table 2.6 PAMS Sampling Network Abbreviation ALP CMP FSD DTN KVR 1 Name Alpine Camp Pendleton Floyd Smith Dr. Address Latitude Longitude 2495A W. Victoria Dr W. B St Floyd Smith Dr San Diego Beardsley 1110A Beardsley St Kearny Villa Rd Kearny Villa Rd AQS ID Monitor Type SLAMS SLAMS SLAMS SLAMS SLAMS UNPAMS SLAMS Method Canister Canister Canister Canister Cartridges Cartridges Cartridges Affiliation PAMS (Type III) PAMS (Type I) PAMS (Type I) PAMS (Type II) PAMS (Type II) UNPAMS PAMS (Type II) Spatial Scale US NS NS NS NS NS NS Site Type MXO UPBD QA MXP MXP MXP MXP Objective (Federal) Research Research Research Research Research Research Research Analysis By APCD APCD APCD APCD APCD APCD APCD Frequency 1:6 1:6 1:6 1:6 1:6 1:6 1:6 Equipment Xontech 910/912 Xontech 910/912 Xontech 910/912 Xontech 910/912 Xontech 925 Xontech 924 Xontech The station is still classified as a PAMS-Carbonyl location, but due to irreparable failure of the carbonyl collection sampler, the APCD was directed by the EPA to put the sampling on hiatus until the EPA can redesign the PAMS network.
38 Toxics 2015 Network Plan Chapter 2: Executive Summary or the Air Quality Monitoring Network Page 12 of 29 Section Overview of the TOXICS Monitoring Network Table 2.7 is a summary of the toxics monitoring network. Table 2.7 Toxics Program Monitoring Network Abbreviation CVA FSD ESC DTN DVN Name Chula Vista Floyd Smith Dr. Escondido San Diego Beardsley Donovan Address Latitude Longitude 80 E. J St Floyd Smith Dr E. Valley Pkwy A Beardsley St Alta Rd AQS ID Pollutant Toxics- VOCs Toxics- Metals Toxics- Cr +6 Toxics- Aldehydes Toxics- VOCs Toxics- Metals Toxics- Cr +6 Toxics- Aldehydes Monitor Type CA TAC CA TAC CA TAC CA TAC CA TAC CA TAC CA TAC CA TAC Toxics- VOCs Not Applicable Toxics- VOCs Not Applicable Toxics- Metals Not Applicable Toxics- VOCs Not Applicable Method Canister Filter Filter Cartridges Canister Filter Filter Cartridges Canister Canister Filter Canister Filter Affiliation Not Applicable Not Applicable Not Applicable Not Applicable Not Applicable Not Applicable Not Applicable Not Applicable Not Applicable Not Applicable Not Applicable Not Applicable Spatial Scale NS NS NS NS NS NS NS NS NS NS NS MI MI Toxics- Metals Not Applicable Not Applicable Site Type PE PE PE PE PE PE PE PE PE PE PE SO SO Objective (Federal) Research Research Research Research Research Research Research Research Research Research Research Research Research Analysis By ARB ARB ARB ARB ARB ARB ARB ARB APCD APCD APCD APCD APCD Frequency 1:12 1:12 1:12 1:12 1:12 1:12 1:12 1:12 1:6 1:6 1:6 1:6 1:6 Equipment Xontech 910/912 Xontech 924 Xontech 924 Xontech 924 Xontech 910/912 Xontech 924 Xontech 924 Xontech 924 Xontech 910A FSL Xontech 910A FSL Xontech 924 Xontech 910A FSL Xontech 924
39 Collocation 2015 Network Plan Chapter 2: Executive Summary of the Air Quality Monitoring Network Page 13 of 29 Section Summary of the Minimum Monitoring Requirements for the SDAB The EPA regulations specify the minimum number of sites at which State and Local air agencies must deploy monitors. The State and Local agencies generally find they need to deploy more monitors than are minimally required to fulfill State and Local purposes for monitoring. For example, often California air quality standards are more stringent than National standards, so many areas need more monitors than required to show compliance with State and National standards. For pollutants monitoring, the minimum requirements for the number of monitors are in the 40 CFR 58, Appendix D Network Design Criteria for Ambient Air Quality Monitoring. Each pollutant has different requirements for determining the minimum number of monitors needed for a Metropolitan Statistical Area (MSA) and the requirements can change yearly. The MSA is based upon the total population within the District. Some Districts are comprised of multiple air basins. The County of San Diego encompasses the San Diego County air basin and part of the Salton Sea air basin, as outlined by the California Air Resources Board. Also, some pollutants have additional monitoring requirements associated with them, e.g. PM 2.5 monitoring has requirements for continuous and sequential monitors. Each section in this report that discusses the criteria pollutants lists the current Network Design Criteria for ambient air quality monitoring. For all pollutants the District is required to ensure that sufficient monitoring exists in the County, according to 40 CFR 58, Appendix D Network Design Criteria for Ambient Air Quality Monitoring. This section summarizes the minimum monitoring requirements from the criteria pollutant chapters in this report. For greater detail, refer to the specific pollutant s chapter. Note: when the number of monitors required is based on the MSA population, it is taken from the latest U.S. Census. In the non-census years, the MSA population is extrapolated by the San Diego Association of Governments (SANDAG) and that number is used by the District. Section Summary of Minimum Monitoring Requirements for Collocation The U.S. EPA regulations specify the minimum number of collocated monitors for a pollutant or program. Table 2.8 summarizes these totals. Table 2.8 Summary of Minimum Monitoring Requirements for Collocation Pollutant or Program Minimum Required Monitors Active Monitors Needed Monitors PM 2.5 FRM w/ PM 2.5 FRM 1 1 None PM 2.5 FRM w/ PM 2.5 Continuous 1 2 None PM 2.5 STN w/ PM 2.5 CSN 2 2 None PM 10 (Hi-Vol) w/ PM 10 (Hi-Vol) 1 1 None Pb-TSP (Hi-Vol) w/ Pb-TSP (Hi-Vol) 1 1 None
40 Met PAMS Gaseous Types Airports Pb Met Pb NCore Gaseous Met Ambient Level Monitors & Samplers Pb CO 2015 Network Plan Chapter 2: Executive Summary of the Air Quality Monitoring Network Page 14 of 29 Section Summary of Minimum Monitoring Requirements (non-collocated) The U.S. EPA regulations specify the minimum number of monitors that State and Local agencies must deploy. Table 2.9 summarizes these totals. Table 2.9 Summary of Minimum Monitoring Requirements Pollutant or Program Minimum Required Monitors Active Monitors Needed Monitors O3 NO2 SO2 O 3-ambient 2 9 None NO 2-ambient None specified 8 None Near road CO-ambient None specified 2 None Near-road 1 1 None SO 2-ambient 0 0 None Pb-ambient 0 0 None PM2.5 PM 2.5 Manual (FRM) 5 5 None PM 2.5 FRM for NO 2 near-road PM 2.5 Continuous 2 6 None PM 2.5 CSN & STN 2 2 None PM10 PM 10-ambient None Wind Speed/Wind Direction External Temperature/Internal Temperature 9 sets 9 sets None PM2.5 O None NOy-TLE 1 0 1* CO-TLE 1 1 None SO 2-TLE 1 1 None PM 2.5 FRM 1 1 None PM 2.5 Continuous 1 0 1* PMcoarse (PM 10 PM 2.5) 1 1 None PM 2.5 STN 2 2 None PM 2.5 CSN 2 2 None Pb-NCore 1 1 None Wind Speed/Wind Direction External Temperature/Internal Temperature 1 set 1 set None Pb-TSP 1 1 None Type II-VOCs 1 1 None Non-Type II-VOCs 1 2 None Type II-Carbonyls 1 1 None O None NOx 3 3 None CO 1 1 None NOy 1 1 None Upper Air Meteorology 1 0 (irreparable) 1 SORAD & Pbar 1 1 None Wind Speed/Wind Direction External Temperature/Internal Temperature Relative Humidity 3 sets 3sets None *EPA approved deficiencies due to temporary relocation of station. Once the station is relocated to a permanent site, these parameters will be reinstated.
41 Chapter 2: Executive Summary of the Air Quality Monitoring Network Page 15 of 29 Section Recent Planned and Unplanned Changes to the Network The EPA Region IX governing authority approves the District s distribution of monitors and the location of the collocated sites for compliance with Federal regulations. Any changes will be undertaken in partnership and direct advisement with the EPA (and CARB, when applicable). Before decommissioning any SLAMS monitor, the District will follow the procedure listed in 40 CFR Part 58.14, System Modifications. Any proposed changes to the air monitoring network will be documented in the Annual Network Plan. If any monitor is violating the NAAQS and the District is forced to relocate the station or the sampler, the District will provide a minimum 30-day period for public review, prior to the relocation, if possible. If a station or analyzer is to relocate, parallel sampling will be undertaken, when possible. Changes to the monitoring network may occur outside the annual monitoring network plan (ANP) and planning process: due to unforeseen circumstances resulting from eviction or other situations that occur after the ANP has been posted for public inspection and approved by the EPA Regional and National Administrators. Any changes to the network due to circumstances beyond the District s control will be communicated in writing to the EPA Regional Authority, the EPA National (and CARB authorities, when applicable), and identified in the subsequent Annual Network Plan. Section Station Relocations, Additions, Closures, and Changes The section discusses all the station changes in the network. Section Relocations RELOCATION - Floyd Smith Drive (FSD) Relocation back to original Location (See Appendix A for the Formal Request) The school grounds on which the station was located was remodeled. On 2/28/2014, the District was forced to temporarily relocate the station to a vacant area on Gillespie Field property at Floyd Smith Drive (named FSD). Additionally, the District was granted a waiver from sampling for NOy. It was determined that PM 2.5 continuous sampling could not be undertaken safely, so this was suspended until relocation back to the original location. FSD sampling start-up was: 7/1/2014 for O 3, NOx, and CO-TLE; 7/17/2014 for SO 2 ; 9/17/2014 for Pb-TSP; and, 9/5/2014 for PM 2.5 manual and speciation. Even though the relocation is within EPA distance limits to keep the same AQS ID #, a new station name and AQS ID number will be given to the new NCore site, Lexington Elementary School (LES) and , respectively. Full transfer of all operations is expected in July. RELOCATION - Downtown (DTN) Station (See Appendix B for the Formal Request) The District is being evicted from the Perkins Elementary School location, due to a remodeling and expansion of the grounds; scheduled for 12/31. The District will permanently relocate to Sherman Elementary School (SES) in Sherman Heights (about 0.7 miles northeast from DTN). RELOCATION - Alpine (ALP) Temporary Station Relocate back to Original Alpine Location In 2011, the Alpine station moved across the street temporarily, while the area in which the station was located underwent renovations by the landowner. The station was relocated back to the original location in April 2015; sampling resumed on 4/29/2015. Section Temporary Shutdowns: SHUTDOWN - Escondido (ESC) Statin Temporary Shutdown The Escondido station was evicted by the City of Escondido to install a bike path. Operations were halted on 8/25/2015-8/28/2015, depending on the pollutant. The grounds immediately adjacent to
42 Chapter 2: Executive Summary of the Air Quality Monitoring Network Page 16 of 29 the station were being demolished to erect a new County facility. The new Escondido station will be part of this new County facility complex (about 20 meters southeast of the original location). The District was given permission by the EPA Regional Authorities to shut down operations temporarily until the new station could be completed. The new station should be completed in mid SHUTDOWN - Chula Vista Station The wood deck will be replaced. The EPA Regional Authorities have given the District permission to temporarily shut down the rooftop sampling, while reconstruction is conducted. The samplers on the deck are as follows: PM 10 (primary and collocated), PM 2.5 Manual and CARB-Toxics. It is anticipated that the temporary shutdown will be in late-2016 to early Section Start-ups: START-UP - Palomar Airport (CRQ) Pb-TSP In 2012 the concentrations measured at Palomar Airport triggered requirements to change the status of the sampler from temporary to continuous. Per EPA approval, the sampling location was changed (11/1/2014) to the most representative location for airborne lead monitoring and protection of the public health (along the perimeter fence in the northeast corner). A new AQS ID number, , was assigned to the new location. After 18 months of continuous operations, the measured concentrations at CRQ are well below the NAAQS for lead (see Lead chapter for details). If after three (3) years of contiguous operations no threshold is triggered requiring continued monitoring, the District will appeal to the EPA Regional Authority to decommission lead sampling at CRQ. START-UP - San Ysidro (SAY) PM 2.5 Station The District was asked by the EPA to locate a PM 2.5 continuous sampler as close to the San Ysidro border crossing as possible (Note: this is a non-regulatory sampler, so the data can only be used for comparison purposes). In the 1 st quarter of 2015, the District deployed a PM 2.5 monitor on the rooftop of a 3-story building (this building was scheduled for demolition in months) overlooking the San Ysidro border crossing into the United States (about 19 meters from the closest lane to the Point-of-Entry (POE) into the United States). The sampler is also about 16 meters above the POE. This sampler was operational on 1/27/2016. The demolition of the building the sampler was located was moved up, so the District had to remove the sampler on 3/20/2016. A new location was found about 180 meters southwest in the Customs parking lot. This new location is at street level by the POE into Mexico. Sampling resumed on 6/8/2016. Section Monitor/Sampler Relocations, Additions, Closures, and Changes The section discusses the monitor/sampler changes in the network with respect to the pollutant or program. PM 2.5 RELOCATION - Kearny Villa Rd. (KVR) PM 2.5 Manual Collocated Sampler Per EPA s recommendation, the District will relocate the PM 2.5 manual collocated sampler from the Kearny Villa Rd. to a location of higher concentrations (possible sites: the new Escondido location, the new Sherman site, or Chula Vista) possibly mid-2017.
43 Chapter 2: Executive Summary of the Air Quality Monitoring Network Page 17 of 29 REASSIGNMENT - Perkins Elementary School (DTN) PM 2.5 Manual Daily Site Relocation to new El Cajon (LES) Station Once the DTN station closes, a new PM 2.5 Manual daily site will be needed. The locations that alternate for maximum PM 2.5 concentrations are El Cajon, Escondido, and Downtown. Only the El Cajon station will be operational for this switch, so the new daily site will be LES. Once the new Escondido and Sherman stations become operational, an investigation will be undertaken to see which of the three locations should be the new PM 2.5 Manual daily site. ADDITION - Donovan Station PM 2.5 The addition of a non-fem continuous PM 2.5 continuous sampler will help trend cross-border pollution, measure influences from Imperial Valley, aid in burn/no burn decisions, track diurnal patterns, and quantify combustion particulates from East County fires. This sampler is now classified as a SLAMS monitor. Sampling commenced on 1/21/2015. PM 10 RELOCATION - Chula Vista (CVA) PM 10 Collocated Sampler Relocation to Donovan (DVN) When the CVA station is temporarily closed for repairs/remodeling, the PM 10 collocated sampler will be permanently relocated to the DVN site (the Design Value location for PM 10 ) in mid PAMS-CARBONYLS Kearny Villa Rd (KVR), Lexington Elementary School (LES), and Sherman Elementary School (SES) New carbonyl samplers have been procured, so replacement sampler(s) will be installed in late 2016 for KVR and LES and 2017 at SES when construction is completed. The EPA Region IX Authority granted the District permission to discontinue 3-Hr samples during ozone season. The District will continue to operate 24-Hr samples year-round. Pb-TSP El Cajon-Lexington Elementary School (LES) Decommissioning, 2016 (See Appendix C for the Formal Request) EPA is allowing the decommissioning of lead monitoring at NCore locations if certain thresholds are met. These criteria are: a minimum of 3-years of sampling and no exceedance of the NAAQS or within 50% of the NAAQS. The measured concentrations at both NCore locations are well below the NAAQS and have been sampled for duration longer than 3 years. The formal request for decommissioning of NCore Pb sampling was also posted separately from this report on the District website for simultaneous public review. Section List of Public Comments to this Report and the District Response(s) The section addresses the comments from the public regarding inquiries to this report. Section Public Comments There were no public comments to address.
44 Chapter 2: Executive Summary of the Air Quality Monitoring Network Page 18 of 29 Appendices
45 Chapter 2: Executive Summary of the Air Quality Monitoring Network Page 19 of 29 APPENDIX A San Diego APCD Formal Request for Relocation of the Floyd Smith Dr. (FSD) Monitoring Station to El Cajon at Lexington Elementary School (LES) Request: The San Diego Air Pollution Control District (District) is requesting the relocation of the samplers, analyzers, and support infrastructure from the El Cajon-Floyd Smith Drive (FSD) site to El Cajon- Lexington Elementary School (LES) site. Reason(s): The District had an air monitoring station at the El Cajon-Lexington Elementary School (abbreviated as ECA); this was an NCore, PAMS Type II, and part of the CARB California-Toxics program (CA- Toxics) site. The school was to undergo a complete demolition and rebuild. The School Authorities gave permission to the District to return to the school grounds (at a different location), once construction was completed. In late 2013, the District was requested by the Lexington Elementary School Authorities to temporarily vacate the grounds. On 2/28/2014, the District shut down operations and temporarily relocated the station (per EPA approval) and all the equipment (except for NOy, PM 2.5 continuous, and meteorological sensors, as well as the CARB samplers for the CA-Toxics program) to the new/temporary site at Floyd Smith Drive. On May 2016 the construction of the new LES monitoring station was completed and the District will return to the school (about 270 meters southwest of the original location on Lexington Elementary School) in July-August Monitor/Station Relocation Requirements Since the station has been operational for less than two years, none of the monitors and samplers qualify for eligibility based 40 CFR (c)(1)-(c)(6). Logistical problems beyond the District s control. The District is seeking a case-by-case approval under 40 CFR 58.14(c). The Floyd Smith Drive location was designed as temporary site until the reconstruction of the school was completed and at such time, the District could relocate back to the Lexington Elementary School property, as agreed to by the District with EPA. Tables 1-5 list all the samplers and monitors at FSD with associated pertinent metadata.
46 Chapter 2: Executive Summary of the Air Quality Monitoring Network Page 20 of 29 Monitor Descriptions: Appendix A Table A1 Floyd Smith Dr. - Gaseous Pollutants Pollutant O 3 NO 2 CO- TLE POC Monitor designation Other Primary Not Applicable SO 2- TLE Not Applicable Parameter code (NO 2) Basic monitoring objective Site type PI, NAAQS Population Exposure PI, NAAQS Population Exposure PI, NAAQS Population Exposure PI, NAAQS Population Exposure Monitor type SLAMS SLAMS SLAMS SLAMS Network affiliation PAMS, NCore PAMS NCore NCore Instrument manufacturer & model 49i 42i 48i-TLE 43i-TLE Method code FRM/FEM/ARM/Other FEM FRM FRM FEM Spatial scale Scale Scale Scale Scale Appendix A Table A2 Floyd Smith Dr. - Particulate Pollutants Pollutant PM 2.5 Manual PM 2.5 STN PM 2.5 CSN PM 2.5 CSN, SU POC PM 10 Manual (Lo-Vol) 2 (LC) 3 (STD) Monitor designation Primary Other Other Other Other Parameter code (LC) See RTI See RTI Basic monitoring objective Site type (LC) (STD) NAAQS Research Research Research NAAQS Population Exposure Population Exposure Population Exposure Population Exposure Population Exposure Monitor type SLAMS SLAMS SLAMS SLAMS Network affiliation Instrument manufacturer & model NCore 2025 NCore, CSN STN Met One SASS NCore, CSN STN URG- 3000N CSN SU Met One SASS Method code 145 See RTI See RTI FRM/FEM/ARM/Other FRM Other Other Other Other NCore 2025 Spatial scale Scale Scale Scale Scale Scale

47 Chapter 2: Executive Summary of the Air Quality Monitoring Network Page 21 of 29 Appendix A Table A3 Floyd Smith Dr. - Other Pollutants Pollutant POC PAMS- VOC 1 for 3-Hr samples 2 for 24-Hr samples PAMS- Carbonyls 1 for 3-Hr samples 2 for 24-Hr samples Monitor designation Other Other Parameter code Basic monitoring objective Site type See PAMS Table 12.2b Research Maximum Precursor Impact See PAMS Table 12.2c Research Maximum Precursor Impact Monitor type SLAMS SLAMS Network affiliation PAMS Type II PAMS Type II Instrument manufacturer & model Xontech 910 & 912 Xontech 925 Method code FRM/FEM/ARM/Other Other Other Spatial scale Scale Scale New Site Location (Lexington Elementary School) Lexington Elementary School (LES), AQS ID# , Google Earth Coordinates of and The approximate distance between FSD to LES is about 3.8 kilometers or 2.4 miles (Figure A1). No parallel sampling will be undertaken. The exact same equipment and monitoring information from Tables A1-A3 will apply to the new location. Furthermore, additional equipment (Tables A4 & A5) will be added that were not be sampled at the temporary location. Appendix A Figure A1 Map of Distance between the two Stations
48 Chapter 2: Executive Summary of the Air Quality Monitoring Network Page 22 of 29 Appendix A Table A4 Lexington Elementary School Additional Equipment Pollutant Toxics- VOC Toxics- Metals Cr(VI) Toxics- Cr(VI) Toxics- Aldehyde PM 2.5 Continuous (non-fem) POC See ARB See ARB See ARB See ARB 1 1 Monitor designation Other Other Parameter code See ARB See ARB See ARB See ARB (LC) Basic monitoring objective Site type Research Research Research Research Population Exposure Population Exposure Population Exposure Population Exposure Provide Info, Research Population Exposure NOy Provide Info, Research Population Exposure Monitor type CA Toxics CA Toxics CA Toxics CA Toxics SLAMS SLAMS Network affiliation CA Toxics CA Toxics CA Toxics CA Toxics NCore NCore, PAMS Instrument manufacturer & model Xontech 910 Xontech 924 Xontech 924 Xontech 924 Met One BAM Method code See ARB See ARB See ARB See ARB FRM/FEM/ARM/Other Other Other Other Other Other Other Spatial scale Scale Scale Scale Scale Scale 42i-NOy Scale Appendix A Table A5 Lexington Elementary School Meteorological Equipment Pollutant PM 2.5 Continuous (non-fem) NOy Meteorological Wind Speed Meteorological Wind Direction Meteorological External Temp Meteorological Relative Humidity POC Monitor designation Other Other Other Other Other Other Parameter code (LC) Basic monitoring objective Site type Provide Info, Research Population Exposure Provide Info, Research Population Exposure Provide Info, Research Population Exposure Provide Info, Research Population Exposure Provide Info, Research Population Exposure Provide Info, Research Population Exposure Monitor type SLAMS SLAMS SLAMS SLAMS SLAMS SLAMS Network affiliation NCore NCore, PAMS NCore, PAMS NCore, PAMS NCore, PAMS NCore, PAMS Instrument manufacturer & model Met One BAM 42i-NOy Qualimterics Qualimterics Rotronics Rotronics Method code FRM/FEM/ARM/Other Other Other Other Other Other Other Spatial scale Scale Scale Scale Scale Scale Scale
49 Chapter 2: Executive Summary of the Air Quality Monitoring Network Page 23 of 29 Floyd Smith Drive-Monitor Relocation Applicability The samplers and monitors at FSD have only been operational since July 2014 (less than two years); therefore, provisions (c)(1) (c)(3) of 40 CFR do not apply for all pollutant samplers and monitors, because a five year history is required. The Design Value calculations for (c)(4) (c)(5) require three (3) years of data, therefore these are not applicable as well. Table A6 illustrates these conditions. Appendix A Table A6 Monitor Relocation Applicability Pollutant (c)(1) (c)(2) (c)(3) (c)(4) (c)(5) (c)(6) Case-by-Case O 3 n/a n/a n/a n/a n/a n/a Yes NO 2 n/a n/a n/a n/a n/a n/a Yes CO- TLE SO 2 - TLE n/a n/a n/a n/a n/a n/a Yes n/a n/a n/a n/a n/a n/a Yes PM 2.5 Manual PM 10 Manual (Lo-Vol) PM 2.5 STN n/a n/a n/a n/a n/a n/a Yes n/a n/a n/a n/a n/a n/a Yes n/a n/a n/a n/a n/a n/a Yes (non-naaqs) PM 2.5 CSN n/a n/a n/a n/a n/a n/a Yes (non-naaqs) PM 2.5 CSN, SU PAMS- VOC PAMS- Carbonyls n/a= not applicable n/a n/a n/a n/a n/a n/a n/a n/a n/a n/a n/a n/a n/a n/a n/a n/a n/a n/a Yes (non-naaqs) Yes (non- NAAQS) Yes (non-naaqs)
50 Chapter 2: Executive Summary of the Air Quality Monitoring Network Page 24 of 29 APPENDIX B San Diego APCD Formal Request for Relocation of the Perkins Elementary School (DTN) Monitoring Station to Sherman Heights at Sherman Elementary School (SES) Request: The San Diego Air Pollution Control District (District) is requesting the relocation of the samplers, analyzers, and support infrastructure from the Perkins Elementary School (DTN) site to Sherman Elementary School (SES) in Sherman Heights. Reason(s): Perkins Elementary School is to expand and completely reorganize and remodel the school grounds. The DTN station is in the middle of the new/planned expansion area. This reconstruction and expansion is expected to take 5-yrs. In late 2015, the School Authorities enacted the eviction clause in the MOU and requested that DTN station be removed by the July 31, The DTN station is in an Environmental Justice (EJ) location, it is the site of the expected maximum concentration for the PM 2.5. Note: this location can alternate between our Escondido, El Cajon, and Downtown monitoring locations. Rather than change the site yearly and since the Downtown station is in an EJ location, the District, in conjunction with the EPA, designated this location as the site of maximum annual concentration for PM 2.5 emissions. The Perkins Elementary School monitoring location is 380 meters upwind of Interstaste-5 (in the daytime). The new location will be 440 meters downwind (in the daytime) of Interstate-5 and 290 meters south of State Route 94 (possible nighttime downwind influence). This new Sherman Elementary School location has the potential to register higher concentrations of particulate matter than the Perkins Elementary School site. All avenues to find an alternative air monitoring location in Barrio Logan area were unproductive. The District determined that Sherman Elementary School in Sherman Heights is an adequate relocation site. Monitor/Station Relocation Requirements Monitors are eligible based 40 CFR (c)(1)-(5). Logistical problems beyond the District s control. The District is seeking a case-by-case approval under 40 CFR 58.14(c). Tables 1-4 list all the samplers and monitors at FSD with associated pertinent metadata.
51 Chapter 2: Executive Summary of the Air Quality Monitoring Network Page 25 of 29 Appendix B Table B1 Downtown-Gaseous Pollutants Pollutant O 3 NO 2 CO POC Monitor designation Other Primary Other Parameter code (NO 2) Basic monitoring objective Site type PI, NAAQS Population Exposure PI, NAAQS Population Exposure PI, NAAQS Population Exposure Monitor type SLAMS SLAMS SLAMS Network affiliation Instrument manufacturer & model 49i 42i 48i Method code FRM/FEM/ARM/Other FEM FRM FRM Spatial scale Scale Scale Scale Monitoring start date 7/2005 7/2005 7/2005 Current sampling frequency Required sampling frequency Continuous Continuous Continuous Continuous Continuous Continuous Sampling season Year-round Year-round Year-round Appendix B Table B2 Downtown-Particulate Pollutants Pollutant PM 2.5 Continuous PM 2.5 Manual PM 2.5 CSN, SU PM 10 Manual POC Monitor designation Other Primary Other Parameter code (LC) (LC) Basic monitoring objective Site type (LC) (STD) PI, Research NAAQS Research NAAQS Population Exposure Population Exposure Monitor type SLAMS SLAMS Network affiliation Instrument manufacturer & model Met One BAM Population Exposure Supplemental Speciation CSN SU SDAPCD Network Met One SASS Population Exposure SLAMS GMW 2000H w/ SA 1200 Head Method code FRM/FEM/ARM/Other Other (non-ffem) FRM Other FRM Spatial scale Scale Scale Scale Scale Monitoring start date 7/2005 7/2005 8/10/2008 7/2005 Current sampling frequency Required sampling frequency Continuous 1:3 1:6 1:6 Continuous 1:3 1:6 1:6 Sampling season Year-round Year-round Year-round Year-round
52 Chapter 2: Executive Summary of the Air Quality Monitoring Network Page 26 of 29 Appendix B Table B3 Downtown-Other Pollutants Pollutant TOXIC- VOC TOXIC- Metals PAMS- Carbonyls (unofficial) POC Monitor designation Other Parameter code Basic monitoring objective Site type Monitor type See Toxics Collected; not analyzed See PAMS Research Research Research Population Exposure Other (SDAPCD Network) Population Exposure Other (SDAPCD Network) Population Exposure Unofficial PAMS Network affiliation Instrument manufacturer & model Xontech 910A (Fused Silica Lined) Method code 210 Xontech 924 Xontech 924 Collected; not analyzed FRM/FEM/ARM/Other Other Other Other Spatial scale Scale Scale 202 Scale Monitoring start date 1/2007 1/2005 7/2012 Current sampling frequency Required sampling frequency 1:6 1:12 1:6 1:6 1:6 1:6 Sampling season Year-round Year-round Year-round Appendix B Table B4 Downtown-Meteorological Equipment Designations Pollutant Other Internal Temp Meteorological Wind Speed Meteorological Wind Direction Meteorological External Temp POC Monitor designation Parameter code Basic monitoring objective Site type Monitor type SLAMS SLAMS SLAMS SLAMS Network affiliation PAMS PAMS PAMS PAMS Instrument manufacturer & model Qualimetrics Qualimetrics Qualimetrics Rotronics Method code FRM/FEM/ARM/Other O O O O Spatial scale Monitoring start date 7/2005 7/2005 7/2005 7/2005 Current sampling frequency Required sampling frequency Continuous Continuous Continuous Continuous Continuous Continuous Continuous Continuous Sampling season Year-round Year-round Year-round Year-round
.")
53 Chapter 2: Executive Summary of the Air Quality Monitoring Network Page 27 of 29 New Site Location (Sherman Elementary School) Sherman Elementary School (SES), AQS ID# , Google Earth coordinates of and The approximate distance is about 1.1 kilometers or 0.7 miles northeast of the Downtown station location (Figure 1). It will be logistically impossible to undertake parallel sampling, because the construction of the new SES station has not yet begun (still in the permitting phase). The exact same monitoring equipment from Tables B1-B4 will apply to the new location. Appendix B Figure B1 Distance between Downtown and Sherman Elementary School
54 Chapter 2: Executive Summary of the Air Quality Monitoring Network Page 28 of 29 Monitor Relocation Applicability An accounting of the last 5 years of data for the monitors and samplers that are regulatory and can be compared to the NAAQS is in Table 7 (PM 2.5 Continuous is in Table B5, solely for comparison purposes, because this analyzer is operated in non-fem mode; therefore, the data from it cannot be used for regulatory uses). Note: The Design Value (DV) Calculations are three years. The posted year in the columns are the last year of the data set, e.g for the DV, and just the posted year for the concentrations that do not require Design Value calculations. Appendix B Table B5 Downtown Design Values and Averages for Pollutants Pollutant NAAQS Units O 3 8-Hr DV ppm Annual Average ppm NO 2 1-Hr DV ppm 1-Hr ppm CO 8-Hr ppm PM 2.5 Manual *PM 2.5 Continuous 24-Hr DV µg/m 3 Annual Average DV µg/m 3 *24-Hr DV n/a n/a n/a n/a n/a µg/m 3 *Annual Average DV n/a n/a n/a n/a n/a µg/m 3 PM 10 Manual 24-Hr µg/m 3 Table 6 list the calculations for the individual monitors and samplers eligible per 40 CFR Appendix B Table B6 Eligibility for Relocation Pollutant NAAQS (c)(1) (c)(2) (c)(3) (c)(4) (c)(5) (c)(6) Case-by-Case O 3 8-Hr DV ppm No Yes Yes Yes Yes Yes Yes Annual Average ppm Yes Yes Yes Yes Yes Yes Yes NO 2 1-Hr DV 0.06 ppm Yes Yes Yes Yes Yes Yes Yes 1-Hr 3 ppm Yes Yes Yes Yes Yes Yes Yes CO 8-Hr 2 ppm Yes Yes Yes Yes Yes Yes Yes PM 2.5 Manual *PM 2.5 Continuous PM 10 Manual Toxics- VOC Toxics- Metals 24-Hr DV 24 µg/m 3 Yes No No No No Yes Yes Annual Average DV 11.3 µg/m 3 No No No No No Yes Yes *24-Hr DV -- n/a n/a n/a n/a n/a n/a *Annual Average DV -- n/a n/a n/a n/a n/a n/a Yes (non-naaqs) Yes (non-naaqs) 24-Hr 66 µg/m 3 Yes Yes Yes Yes Yes Yes Yes n/a -- n/a n/a n/a n/a n/a n/a n/a -- n/a n/a n/a n/a n/a n/a Yes (non-naaqs) Yes (non-naaqs) PM 2.5 Yes n/a -- n/a n/a n/a n/a n/a n/a CSN, SU (non-naaqs) PAMS- Yes Carbonyls n/a -- n/a n/a n/a n/a n/a n/a (non-naaqs) (Unofficial) Yes= Eligible No= Not eligible *Not operated in regulatory mode, therefore cannot be compared to the NAAQS.
55 Chapter 2: Executive Summary of the Air Quality Monitoring Network Page 29 of 29 APPENDIX C San Diego APCD Formal Request to Decommission the San Diego Pb-TSP Sampler
 basis at locations throughout the SDAB (Figure 3.")
.")
56 Chapter 3: Ozone (O 3 ) Page 1 of 9 Chapter 3 Ozone (O 3 ) Section Ozone Introduction Ambient level Ozone was sampled on a continuous (7/24) basis at locations throughout the SDAB (Figure 3.0) and referenced to the ozone standard of the year (Table 3.0). The sampling equipment are listed in Table 3.1. Please note: In 2015, the Escondido station was temporarily shut-down (see the Overview chapter for more information). In 2013, the El Cajon Station was temporarily relocated to the Gillespie Field area off of Floyd Smith Drive (FSD). Figure 3.0 Ozone Network Map Table 3.0 Ozone State and Federal Standards for the Year, 2015
57 2014 Network Plan Chapter 3: Ozone (O 3 ) Page 2 of 9 Table 3.1 Ozone Monitoring Network O3 Abbreviation ALP CMP CVA DMR FSD ESC 1 KVR DVN DTN Alpine Camp Pendleton Chula Vista Del Mar Floyd Smith Dr. Escondido Kearny Villa Rd Donovan San Diego Name Beardsley AQS ID Monitor Type SLAMS SLAMS SLAMS SLAMS SLAMS SLAMS SLAMS SLAMS SLAMS Method UV UV UV UV UV UV UV UV UV Affiliation PAMS PAMS Not Applicable Not Applicable PAMS, NCore Not Applicable PAMS Not Applicable Not Applicable Spatial Scale US NS NS NS NS NS NS NS NS Site Type MXO UPDB PE G/B PE PE PE PE G/B Objective (Federal) Equipment PI, NAAQS 49i 1 ESC was temporarily shut-down PI, NAAQS 49i PI, NAAQS 49i PI, NAAQS 49 PI, NAAQS 49i PI, NAAQS 49i PI, NAAQS 49i PI, NAAQS 49i PI, NAAQS 49i Glossary of Terms Monitor Type Method (Sampling/Analysis) Affiliation E= EPA CL= Chemiluminescence BG= Border Grant O= Other CT= Low Volume, size selective inlet, continuous CSN STN= Trends Speciation SLAMS= State & Local monitoring station FL= Fluorescence CSN SU= Supplemental Speciation SPM= Special purpose monitor HV= High volume NATTS= National Air Toxics Trends Stations CATAC= California Toxics Monitoring IR= Nondispersive infrared NCORE= National Core Multi-pollutant Monitoring Stations SI= High volume, size selective inlet NR= Monitors at sites meeting near road designs as per Part 58 SP= Low volume, size selective inlet, speciated PAMS= Photochemical Assessment Monitoring Stations Site Type Q= Low volume, size selective inlet, sequential UNPAMS= Unofficial PAMS site EXDN= Extreme downwind UV= Ultraviolet absorption HC= Highest concentration Canister= Evacuated stainless steel canisters Monitor Designation MXO= Maximum ozone concentration Cartridges= Di-nitrophenylhydrazine cartridges PRI= Primary MXP= Maximum precursor impact FSL= Fused Silica Lined QAC= Collocated PE= Population exposure Filter= Quartz filters O= Other SO= Source oriented UPBD= Upwind background Spatial Scale Objective (Federal) G/B= General/Background MI= Micro NAAQS= Suitable for NAAQS comparison RT= Regional Transport MS= Middle Research= Research support WRI= Welfare related impacts NS= PI= Public Information QA= Quality assurance US= Urban Scale
58 Chapter 3: Ozone (O 3 ) Page 3 of 9 Section Ozone Minimum Monitoring Requirements The District is federally mandated to monitor O 3 levels in accordance with the CFR. This section will state the different monitoring requirements for each program, e.g. ambient, PAMS, NCore, etc. that the District operates and references therein (Note: only the passages applicable/informative to the District are referenced). These monitors can serve as fulfilling other O 3 network requirements, e.g. ambient O 3 monitor can fulfill a PAMS O 3 monitor requirement. The District meets or exceeds all minimum requirements for O 3 monitoring for all programs. Section Ozone Minimum Monitoring Requirements-Design Value Criteria (8-Hr) The District is required to operate a minimum number of O 3 monitors irrespective of O 3 network affiliations. To ascertain the minimum number of monitors required, the Design Value (DV) must be calculated. The DV is derived by averaging the last three years. Table 3.2a lists these DV requirements. 4.1 Ozone (O3) Design Criteria A (a) State, and where appropriate, local agencies must operate O3sites for various locations depending upon area size (in terms of population and geographic characteristics) and typical peak concentrations (expressed in percentages below, or near the O3NAAQS. Specific SLAMS O3site minimum requirements are included in Table D 2 of this appendix. The NCore sites are expected to complement the O3data collection that takes place at single- pollutant SLAMS sites, and both types of sites can be used to meet the network minimum requirements. The total number of O3sites needed to support the basic monitoring objectives of public data reporting, air quality mapping, compliance, and understanding O3-related atmospheric processes will include more sites than these minimum numbers required in Table D 2 of this appendix. The EPA Regional Administrator and the responsible State or local air monitoring agency must work together to design and/or maintain the most appropriate O3network to service the variety of data needs in an area Table 3.2a Ozone Minimum Monitoring Requirements-Design Value Criteria (8-Hr), What is the Maximum 8-Hr Design Value? Is the Maximum 8-Hr Design Value 85% of the NAAQS? Is the Maximum 8-Hr Design Value < 85% of the NAAQS? Does the Maximum 8-Hr Design Value Meet the NAAQS? (ppm) (yes/no) (yes/no) (yes/no) Yes No No Section Ozone Minimum Monitoring Requirements-Ambient By correlating the data from Table 3.2a with the EPA Table D-2, the minimum number of O 3 monitors, irrespective of program/network affiliation, is derived. Table 3.2b lists these. Table D 2 of Appendix D to Part 58 SLAMS Minimum O 3 Monitoring Requirements MSA population Most recent 3-year design value concentrations 85% of any O 3 NAAQS Most recent 3-year design value concentrations <85% of any O 3 NAAQS 350,000 - < 4 million 2 1 A 40 CFR Part 58, Appendix D, Network Design Criteria for Ambient Air Quality Monitoring, Section 4, Pollutant-Specific Design Criteria for SLAMS Sites, part 4.1 Ozone (O 3) Design Criteria -Summarized in Table D-2 of Appendix D to Part 58 SLAMS Minimum O 3 Monitoring Requirements
59 Chapter 3: Ozone (O 3 ) Page 4 of 9 Table 3.2b Ozone Minimum Monitoring Requirements-Ambient MSA County Population Estimated from 2010 Census Minimum Monitors (Sites) Required Active Monitors (Sites) Monitors (Sites) Needed (name) (name) (#) (#) (#) (#) San Diego San Diego 3.3* million 2 9 None Section Ozone Minimum Monitoring Requirements-Maximum Concentration Site Design Value All Districts are required to categorize at least one monitor/sampling site in the air basin as an area of maximum concentration. A design value (DV) concentration is calculated for this site. The DV is derived by averaging the last three years. Table 3.3 lists these maximum concentrations site requirements. 4.1 Ozone (O3) Design Criteria B (b) Within an O 3 network, at least one O 3 site for each MSA, or CSA if multiple MSAs are involved, must be designed to record the maximum concentration for that particular metropolitan area. More than one maximum concentration site may be necessary in some areas. Table D 2 of this appendix does not account for the full breadth of additional factors that would be considered in designing a complete O 3 monitoring program for an area. Some of these additional factors include geographic size, population density, complexity of terrain and meteorology, adjacent O3 monitoring programs, air pollution transport from neighboring areas, and measured air quality in comparison to all forms of the O3 NAAQS (i.e., 8-hour and 1-hour forms). Networks must be designed to account for all of these area characteristics. Network designs must be re-examined in periodic network assessments. Deviations from the above O3 requirements are allowed if approved by the EPA Regional Administrator. Table 3.3 Ozone Minimum Monitoring Requirements-Maximum Concentration Site Design Value, Maximum 8-Hr Design Value Maximum 8-Hr Design Value Maximum 8-Hr Design Value Site Site AQS ID (name) (#) (ppm) Alpine (ALP) B 40 CFR Part 58, Appendix D, Network Design Criteria for Ambient Air Quality Monitoring, Section 4, Pollutant-Specific Design Criteria for SLAMS Sites, part 4.1 Ozone (O 3) Design Criteria, subsection 4.1(a), list the requirements needed to fulfill the Ozone (O 3) Design Criteria.
60 Chapter 3: Ozone (O 3 ) Page 5 of 9 Section Ozone Minimum Monitoring Requirements-PAMS The District is required to operate Photochemical Assessment Monitoring Stations (PAMS). There are several associated requirements to operate a PAMS site (see the PAMS chapter for more detail). One of the requirements is to operate O 3 monitors. Table 3.4 lists PAMS Ozone (O 3 ) Monitoring requirements for the SDAB. 5.1 PAMS Monitoring Objectives C PAMS design criteria are site specific. Concurrent measurements of O3, oxides of nitrogen, speciated VOC, CO, and meteorology are obtained at PAMS sites The minimum required number and type of monitoring sites and sampling requirements are listed in Table D-6 of this appendix. Table D 6 of Appendix D to Part 58 Minimum Required PAMS Monitoring Locations and Frequencies No Measurement Where required Sampling frequency 1 (all daily except for upper air meteorology) 6 Ozone All sites Hourly during the ozone monitoring season. Table 3.4 Ozone Minimum Monitoring Requirements-PAMS Minimum O 3 Monitors Required for PAMS Sites Total O 3 Monitors Active at PAMS Sites Total O 3 Monitors Needed at PAMS Sites PAMS Sites/Locations PAMS Sites/Locations AQS ID (#) (#) (#) (name) (#) Floyd Smith Dr. (FSD) Alpine (ALP) None Camp Pendleton (CMP) Kearny Villa Rd (KVR) Downtown (unofficial) (DTN) C 40 CFR Part 58, Appendix D, Network Design Criteria for Ambient Air Quality Monitoring, Section 4, Pollutant-Specific Design Criteria for SLAMS Sites, part 5 Network Design for Photochemical Assessment Monitoring Stations (PAMS), -subpart 5.1 PAMS Monitoring Objectives, -subpart 5.3 Minimum Monitoring Requirements, and -summarized in Table D-6 Minimum Required PAMS Monitoring Locations and Frequencies
61 Chapter 3: Ozone (O 3 ) Page 6 of 9 Section Ozone Minimum Monitoring Requirements-NCore The District is required to operate an O 3 monitor as part of the NCore multipollutant monitoring program. This program was designed to measure pollutants at lower levels, low ppb-ppt range. Unlike the other gaseous pollutant requirements for NCore, O 3 is not required to be quantified at the lower levels. Table 3.5 lists the NCore O 3 requirements. 3. Design Criteria for NCore Sites D (b) The NCore sites must measure, at a minimum, PM 2.5 particle mass using continuous and integrated/filter-based samplers, speciated PM 2.5, PM particle mass, speciated PM , O 3, SO 2, CO, NO/NOy, wind speed, wind direction, relative humidity, and ambient temperature. Table 3.5 Ozone Minimum Monitoring Requirements-NCore Minimum O 3 Monitors Required for NCore Sites Total O 3 Monitors Active at NCore Sites Total O 3 Monitors Needed at NCore Sites NCore Sites/Locations NCore Sites/Locations AQS ID (#) (#) (#) (name) (#) 1 1 None Floyd Smith Dr. (FSD) Section Ozone Minimum Monitoring Requirements-Summary Table 3.6 summarizes all the O 3 minimum monitoring requirements from Sections Table 3.6 Ozone Minimum Monitoring Requirements-Summary CFR Programs Requirements for O 3 Monitors Minimum O 3 Monitors Required Active O 3 Monitors Needed O 3 Monitors (name) (#) (#) (#) CFR EPA Table D-2 only= PAMS only= NCore only= None None None D 40 CFR Part 58, Appendix D, Network Design Criteria for Ambient Air Quality Monitoring, Section 4, Pollutant-Specific Design Criteria for SLAMS Sites, part NOy Monitoring and - 40 CFR Part 58, Appendix D, Network Design Criteria for Ambient Air Quality Monitoring, Section 3, Design Criteria for NCore Sites, subsection (b).
62 Concentration (ppm) 2015 Network Plan Chapter 3: Ozone (O 3 ) Page 7 of 9 Section Ozone Suitability for Comparison to the NAAQS The CFR requires that for O 3 data to be used in regulatory determinations of compliance with the O 3 NAAQS, the O 3 monitors must be sited according to Federal Regulations E1 and the sampling frequency must be in accordance with Federal regulations E2. All District O 3 monitors meets or exceeds all minimum monitoring requirements and sampling frequencies, as to be able to be compared to the NAAQS. Table 3.7 summarizes these requirements. Table 3.7 Ozone Suitability for Comparison to the NAAQS-Ozone Sampling Equipment Parameter Code Unit Code Duration Code Equipment Method Code Ozone O ppm Hr 1 Average of the 4 th Highest 8-Hr Design Value (ppm) Maximum 8-Hr Concentration (ppm) Days above the National 8-Hr Standard 49 series Ultraviolet absorption Sampling Frequency Method ID 047 7/24 EQOA Section Ozone Concentrations for San Diego Over the years, ozone concentration levels have been decreasing. This section will illustrate the different metrics for comparison. Section Ozone Concentrations for San Diego-for the Last 20 Years San Diego has realized a significant decrease in the 3-yr average of the exceedance days for ozone and has seen a sharp decrease in its 8-hour Design Value since 1990 (Table 3.8 and Figure 3.2). Note: the Days Above the National 8-Hr Standard. row in Table 3.8 reflect the ozone standard for that year. Table 3.8 Ozone Concentrations for San Diego-for the Last 20 Years, * 13 *Includes data impacted by local fires. These days have been coded as Exceptional Events in the AQS. Figure 3.1 Ozone Concentrations for San Diego-for the Last 20 Years Graph, Years E1 40 CFR Part 58, Appendix E, Probe and Monitoring Path Siting Criteria for Ambient Air Quality Monitoring and Table E-4. E2 40 CFR Part 58.12, Subpart B, Operating Schedules. Ozone Concentrations for the last 20 Years Averge of the 4th Highest 8-Hr Design Value Maximum 8-Hr Concentration
63 Concentration (ppm) 2015 Network Plan Chapter 3: Ozone (O 3 ) Page 8 of 9 Section Ozone Concentrations for San Diego-by Site for the Year Table 3.9a lists the maximum ozone measurements for every ozone monitoring location and Figure 3.2a show the values graphically with respect to the National Standard for the year (Note: these are not Design Value concentrations, so the comparison to the standard is for informational use only). Table 3.9a Ozone Concentrations for San Diego-by Site for the Year, 2015 No. Site Site Abbreviation Maximum Concentration for 8-Hrs Days Above the National Standard Annual Average (#) (name) (name) (ppm) (#) (ppm) 1 Alpine ALP Camp Pendleton CMP Chula Vista CVA Del Mar DMR Floyd Smith Dr. FSD Escondido ESC * Kearny Villa Road KVR Donovan DVN San Diego-Beardsley DTN *Insufficient data; not operational for a sufficient number of months in 2015 for a comparable annual average. Figure 3.2a Ozone Concentrations for San Diego-by Site for the Year Graph, 2015 Ozone Concentrations (8-Hr Max) by Site for the Year ALP CMP CVA DMR FSD *ESC KVR DVN DTN 8-Hr Std** (0.075 ppm) Sites *Insufficient data; not operational for a sufficient number of months in 2015 for a comparable annual average. **Note: the NAAQS is written for Design Value calculations; therefore the concentrations calculated for the year are not comparable to the NAAQS. The listed NAAQS is for informational purposes only.
64 Concentration (ppm) 2015 Network Plan Chapter 3: Ozone (O 3 ) Page 9 of 9 Section Ozone Concentrations for San Diego-by Site for Design Value Table 3.9b lists the maximum ozone measurements for every ozone monitoring location and Figure 3.2b show the values graphically for the Design Value. Table 3.9b Ozone Concentrations for San Diego-by Site for Design Value, No. Site Site Abbreviation Design Value Maximum Concentration for 8-Hrs Is the Maximum 8-Hr Design Value 85% of the NAAQS? Does the Maximum 8-Hr Design Value Meet the NAAQS? (#) (name) (name) (ppm) (yes/no) (yes/no) 1 Alpine ALP Yes No 2 Camp Pendleton CMP Yes Yes 3 Chula Vista CVA No Yes 4 Del Mar DMR Yes Yes 5 Floyd Smith Dr. & El Cajon FSD & ECA Yes Yes 6 *Escondido ESC Yes Yes 7 Kearny Villa Road KVR Yes Yes 8 Donovan & Otay Mesa DVN No Yes 9 San Diego-Beardsley DTN No Yes *Not operational a full year. Figure 3.2b Ozone Concentrations for San Diego-by Site for Design Value Graph, Ozone Concentrations (Design Value) by Site ALP CMP CVA DMR FSD & ECA *ESC KVR DVN & OTM DTN 8-Hr Std (0.075 ppm) Sites *Not operational a full year.
65 Chapter 4: Nitrogen Dioxide (NO 2 ) & Reactive Oxides of Nitrogen (NOy) Page 1 of 13 Chapter 4 Nitrogen Dioxide (NO 2 ) and Reactive Oxides of Nitrogen (NOy) Section Nitrogen Dioxide and Reactive Oxides of Nitrogen Introduction Ambient level nitrogen dioxide was sampled on a continuous basis at locations throughout the SDAB (Figure 4.0) and referenced to the nitrogen dioxide standards of the year (Table 4.0). The sampling equipment are listed in Table 4.1. Please note: In 2015, the Escondido station was temporarily shut-down (see the Overview chapter for more information) In 2013, the El Cajon Station was temporarily relocated to the Gillespie Field area off of Floyd Smith Drive (FSD); NOy sampling was temporarily suspended with EPA approval Figure 4.0 Nitrogen Dioxide & NOy Network Map Table 4.0 Nitrogen Dioxide State and National Standards for the Year The NOy analyzer is non-regulatory; therefore there are no NAAQS to compare, although the NOx and NOy measurements are comparable in the SDAB.
66 NO2 & NOy 2014 Network Plan Chapter 4: Nitrogen Dioxide (NO2) & Reactive Oxides of Nitrogen (NOy) Page 2 of 13 Table 4.1 Nitrogen Dioxide & Reactive Oxides of Nitrogen Sampling Network Abbreviation Name ALP CMP CVA FSD ESC KVR DVN DTN RCD Alpine Camp Pendleton Chula Vista Floyd Smith Dr. Escondido Kearny Villa Rd Donovan San Diego Beardsley Rancho Carmel Dr. AQS ID Monitor Type SLAMS SLAMS SLAMS SLAMS SLAMS SLAMS SLAMS SLAMS SLAMS Designation PRI PRI PRI PRI PRI PRI PRI PRI PRI Method CL CL CL CL CL CL CL CL CL Affiliation PAMS PAMS Not Applicable PAMS Not Applicable PAMS SLAMS Not Applicable Not Applicable Spatial Scale US NS NS NS NS NS NS NS MI Site Type PE UPBD PE PE PE PE PE PE SO Objective (Federal) Equipment PI, NAAQS 42i PI, NAAQS 42i PI, NAAQS 42i PI, NAAQS 42i Glossary of Terms Monitor Type Method (Sampling/Analysis) Affiliation E= EPA CL= Chemiluminescence BG= Border Grant O= Other CT= Low Volume, size selective inlet, continuous CSN STN= Trends Speciation SLAMS= State & Local monitoring station FL= Fluorescence CSN SU= Supplemental Speciation SPM= Special purpose monitor HV= High volume NATTS= National Air Toxics Trends Stations CATAC= California Toxics Monitoring IR= Nondispersive infrared NCORE= National Core Multi-pollutant Monitoring Stations SI= High volume, size selective inlet NR= Monitors at sites meeting near road designs as per Part 58 SP= Low volume, size selective inlet, speciated PAMS= Photochemical Assessment Monitoring Stations Site Type Q= Low volume, size selective inlet, sequential UNPAMS= Unofficial PAMS site EXDN= Extreme downwind UV= Ultraviolet absorption HC= Highest concentration Canister= Evacuated stainless steel canisters Monitor Designation MXO= Maximum ozone concentration Cartridges= Di-nitrophenylhydrazine cartridges PRI= Primary MXP= Maximum precursor impact FSL= Fused Silica Lined QAC= Collocated PE= Population exposure Filter= Quartz filters O= Other SO= Source oriented UPBD= Upwind background Spatial Scale Objective (Federal) G/B= General/Background MI= Micro NAAQS= Suitable for NAAQS comparison RT= Regional Transport MS= Middle Research= Research support PI, NAAQS 42i PI, NAAQS 42i PI, NAAQS 42i WRI= Welfare related impacts NS= PI= Public Information QA= Quality assurance US= Urban Scale PI, NAAQS 42i PI, NAAQS 42i With EPA approval, NOy sampling is temporarily suspended until the District relocates back to the original NCore location.
67 Chapter 4: Nitrogen Dioxide (NO2) & Reactive Oxides of Nitrogen (NOy) Page 3 of 13 Section Nitrogen Dioxide Minimum Monitoring Requirements The District is federally mandated to monitor NO 2 levels in accordance with the CFR. This section will state the different minimum monitoring requirements for each program, e.g. ambient, Near-road, PAMS, etc. that the District operates and the references therein (Note: only the passages applicable/informative to the District are referenced). These monitors can serve as fulfilling other NO 2 network requirements, e.g. ambient NO 2 monitor can fulfill a PAMS NO 2 monitor requirement. The District meets or exceeds all minimum requirements for NO 2 monitoring for all programs except for the following: Establishment of the 2 nd Near-road location (highlighted in red). Section Nitrogen Dioxide Minimum Monitoring Requirements -Near-road In an effort to measure concentrations for some pollutants in communities located by roadways, the EPA instituted the Near-road monitoring program. Table 4.2 lists the Near-road monitors required for the SDAB Requirement for Near-road NO2 Monitors A (a) Within the NO2 network, there must be one microscale near-road NO2monitoring station in each CBSA with a population of 500,000 or more persons to monitor a location of expected maximum hourly concentrations sited near a major road with high AADT counts as specified in paragraph 4.3.2(a)(1) of this appendix. An additional near-road NO2 monitoring station is required for any CBSA with a population of 2,500,000 persons or more, or in any CBSA with a population of 500,000 or more persons that has one or more roadway segments with 250,000 or greater AADT counts to monitor a second location of expected maximum hourly concentrations. CBSA populations shall be based on the latest available census figures. Table 4.2 Nitrogen Dioxide Minimum Monitoring Requirements -Near-road MSA County Population Estimated from 2010 Census Minimum NO 2 Near-road Monitors Required Are Additional NO 2 Near-road Monitors Required Additional NO 2 Near-road Monitors Required Total NO 2 Near-road Monitors Required Active NO 2 Near-road Monitors Needed NO 2 Near-road Monitors (name) (name) (#) (#) (yes/no) (#) (#) (#) (#) San San Yes Diego Diego million Section Nitrogen Dioxide Minimum Monitoring Requirements -Near-road (first site) The first Near-road site must be sited in the area of the highest traffic count, adjusted for High Density (FE=Fleet Equivalency) vehicles. The first NO 2 near-road location is off of Rancho Carmel Drive (RCD) about 3.7 miles north of Poway Rd. (NOx and CO pollutant concentrations are measured there). It has a FE ranking of 4 th in the County (the first three ranked sites were unworkable for various reasons). Section Nitrogen Dioxide Minimum Monitoring Requirements -Near-road (second site) The criteria for the second Near-road location are more flexible than the criteria for the first site. The second site is not necessarily the next location according to FE ranking. The EPA prescribes that the second site be selected so that it is differentiated from the first by one or more factors affecting traffic emissions and/or pollution transport, i.e. fleet mix, terrain, geographic area, different roadway, etc. A 40 CFR Part 58, Appendix D, Network Design Criteria for Ambient Air Quality Monitoring, Section 4, Pollutant-Specific Design Criteria for SLAMS Sites, part 4.3 Nitrogen Dioxide (NO 2) Design Criteria, subpart Requirement for Near-road monitors
68 Chapter 4: Nitrogen Dioxide (NO2) & Reactive Oxides of Nitrogen (NOy) Page 4 of 13 Based on these criteria from the previous paragraph, the District located and tried to site the 2 nd Near-road station, but all attempts were unsuccessful for the following reasons: 1. I-5 at Manchester Ave. - denied/unadvisable due to future highway expansion. 2. I-5 at Sweetwater Rd. - Not enough space and unavailability ready power. 3. I-8 at Camino del Rio South - denied by the City for the site of a possible water treatment facility in I-5 at Sicard St. - denied by the School Authorities due to school closure. 5. I-5 at Newton Ave. - denied by the City for a need for right-of-way on a dead-end street overlooking I-5. The District is pursuing a location in the Barrio Logan/Logan Heights area. This site is in an Environmental Justice (EJ) area. This site the corner of Boston Ave. & S. 29 th St. will be: Downwind of the Bay industrial activities. Close to 28 th St., a feeder route for the Navy base. Close to Harbor Ave. (a downwind North-South feeder road that has a high traffic count). Mix of bedroom community near heavy industry. The District is required to fill out a matrix listing the answers to EPA questions regarding Near-road siting requirements. Table 4.3 is the Near-road matrix for it. Table 4.3 Nitrogen Dioxide Minimum Monitoring Requirements -Near-road (second site) No. Condition Answer 1 Submitted for public comment In this Annual Network Plan 2 Anticipated start-up December 1, AQS # Address and coordinates Boston Ave. & S. 29th Street (abbreviated as BTA) 32 41'39.14"N, 117 7'56.89"W 5 Sampling & analysis method NOx, Chemiluminescence 6 Sampling & analysis method 24/7, Year-long 7 Any plans to remove or move the monitor within No the 18 months? 8 Monitoring objective & spatial scale Data, NAAQS, MicroScale 9 CBSA San Diego County 10 CBSA population & year 3.3 million people estimated from 2010 U.S. Census 11 Maximum AADT counts & year Estimation from 2012 Caltrans report: 158,000 cars (actual) & 7,600 trucks (estimate); FE= 226,400 (estimated) (ranked about 45-50th in the County) 12 Correct number of required NOx (NO 2 ) monitors? Two based on population 13 Are all road segments ranked? Yes By Fleet Equivalency
69 Chapter 4: Nitrogen Dioxide (NO2) & Reactive Oxides of Nitrogen (NOy) Page 5 of How is Fleet Equivalency (FE) calculated? FE AADT= (AADT-HDC) + (HDm x HDc) HDc= High Density county (trucks) HDm= High Density multiplier (10) 15 How is roadway design considered? The location is downwind of the I-15/I-5 interchange; 28th St is a feeder to the Port of San Diego. No downwind bridges or tunnels, or surrounding mass transit points to bias the data. 16 How is congestion considered? At the time of the writing of this report, there are no LOS congestion ratings for I-5 in San Diego. It is estimated to be E/D 17 How is terrain considered? Station will be about 6-9 m higher than the freeway 18 How is meteorology considered? The winds at this location are predominantly from the west and WNW, which would generally occur during the day. Winds are rarely greater than 6 m/s. The second most common wind direction is from the SSW, which would occur most often when a coastal eddy forms or ahead of an approaching storm system. At night, there are commonly weak drainage winds from the NE that develop that range from near calm to less than 2 m/s. So, the flow at this location is primarily onshore except later at night where it can turn weakly offshore. It is typical of a coastal location in Southern California. 19 How is population exposure considered? This location is a mixture of business and residential. It is located in an Environmental Justice (EJ) area. This location is a mixed used area (heavy industrial and bedroom community). This EJ area has one of the higher asthma rates in the County and local representatives are requesting a NO2 Near-road site in this community. Our new Downtown-San Diego (Sherman Elementary School- SES) air pollution monitoring station is located about 1.3 miles northwest/downwind of the proposed NO2 Nearroad site at Boston Ave. 20 1st NO2 Near-road site The first Near-road site is along I-15, along the most trafficked area in the County. 21 the target road? meters, depending on probe placement. 22 Will vertical inlet be between 2-7 meters? Yes 23 Will the probe distance from supporting structures be at least 1 meter away vertically or horizontally? 24 Will the air flow between the probe and the outside nearest edge of the target road segment be unobstructed? Yes Yes
70 Chapter 4: Nitrogen Dioxide (NO2) & Reactive Oxides of Nitrogen (NOy) Page 6 of 13 Section Nitrogen Dioxide Minimum Monitoring Requirements-Area-wide The District is required to label a monitor that routinely measures high concentrations of nitrogen dioxide. Camp Pendleton, Kearny Villa Road, Escondido, and Otay Mesa/Donovan all have high concentrations. The monitor at the Escondido station consistently measures the higher concentrations in the air basin. The measured concentrations at Donovan are higher, but may be influenced by heavy construction immediately adjacent to the station. Once the construction activities have abated, this site will be revisited for possible Area-wide classification instead of Escondido. Table 4.4 lists the Area-wide NO 2 Monitoring requirements for the SDAB Requirement for Area-wide NO2 Monitoring B (a) Within the NO2network, there must be one monitoring station in each CBSA with a population of 1,000,000 or more persons to monitor a location of expected highest NO2concentrations representing the neighborhood or larger spatial scales. PAMS sites collecting NO2 data that are situated in an area of expected high NO2concentrations at the neighborhood or larger spatial scale may be used to satisfy this minimum monitoring requirement when the NO2 monitor is operated year round. Emission inventories and meteorological analysis should be used to identify the appropriate locations within a CBSA for locating required area-wide NO2 monitoring stations. CBSA populations shall be based on the latest available census figures. Table 4.4 Nitrogen Dioxide Minimum Monitoring Requirements-Area-wide MSA County Population Estimated Area-wide Site Area-wide Site Meet NAAQS? from 2010 Census AQS ID (name) (name) (#) (name) (#) (yes/no) San Diego San Diego 3.3 million Escondido (ESC) Yes Section Nitrogen Dioxide Minimum Monitoring Requirements-Regional Administrator The Downtown station is in an Environmental Justice (EJ) area. EJ areas are communities that tend to have: High percentage of pollution sources High rates of health issues Lower median income High minority population High percentage of English as a 2 nd language Lower median income Nitrogen dioxide is a component of diesel emissions, which are deleterious to human health. By designating monitors as Regional Administrator, the EPA has made the retention of nitrogen dioxide monitors in EJ areas mandatory in an effort to track the effectiveness of nitrogen dioxide reduction policies. Table 4.5 lists the Regional Administrator Designated NO 2 Monitoring requirements for the SDAB. B 40 CFR Part 58, Appendix D, Network Design Criteria for Ambient Air Quality Monitoring, Section 4, Pollutant-Specific Design Criteria for SLAMS Sites, part 4.3 Nitrogen Dioxide (NO 2) Design Criteria, subpart Requirement for Area-wide Monitoring
71 Chapter 4: Nitrogen Dioxide (NO2) & Reactive Oxides of Nitrogen (NOy) Page 7 of Regional Administrator Required Monitoring C (a) The Regional Administrators, in collaboration with States, must require a minimum of forty additional NO2 monitoring stations nationwide in any area, inside or outside of CBSAs, above the minimum monitoring requirements, with a primary focus on siting these monitors in locations to protect susceptible and vulnerable populations. The Regional Administrators, working with States, may also consider additional factors described in paragraph (b) below to require monitors beyond the minimum network requirement. Table 4.5 Nitrogen Dioxide Minimum Monitoring Requirements-Regional Administrator MSA County Population Estimated from 2010 Census Regional Administrator Site Regional Administrator Site AQS ID Meet NAAQS? (name) (name) (#) (name) (#) (yes/no) San Diego San Diego 3.3 million San Diego-Beardsley (DTN) Yes Section Nitrogen Dioxide Minimum Monitoring Requirements-PAMS The District is required to operate Photochemical Assessment Monitoring Stations (PAMS). There are several associated requirements to operate a PAMS site (see the PAMS chapter for more detail). One of the requirements is to operate NOx monitors. Table 4.6 lists the PAMS NOx (NO 2 ) Monitoring requirements for the SDAB. 5.1 PAMS Monitoring Objectives D PAMS design criteria are site specific. Concurrent measurements of O3, oxides of nitrogen, speciated VOC, CO, and meteorology are obtained at PAMS sites The minimum required number and type of monitoring sites and sampling requirements are listed in Table D-6 of this appendix. Table D 6 of Appendix D to Part 58 Minimum Required PAMS Monitoring Locations and Frequencies No Measurement Where required Sampling frequency (all daily except for upper air meteorology) 3 NO X All Type II sites Hourly during the ozone monitoring season. C 40 CFR Part 58, Appendix D, Network Design Criteria for Ambient Air Quality Monitoring, Section 4, Pollutant-Specific Design Criteria for SLAMS Sites, part 4.3 Nitrogen Dioxide (NO 2) Design Criteria, subpart Requirement for Regional Administrator Designated Monitoring D 40 CFR Part 58, Appendix D, Network Design Criteria for Ambient Air Quality Monitoring, Section 4, Pollutant-Specific Design Criteria for SLAMS Sites, part 5 Network Design for Photochemical Assessment Monitoring Stations (PAMS), -subpart 5.1 PAMS Monitoring Objectives, -subpart 5.3 Minimum Monitoring Requirements, and -summarized in Table D-6 Minimum Required PAMS Monitoring Locations and Frequencies
72 Chapter 4: Nitrogen Dioxide (NO2) & Reactive Oxides of Nitrogen (NOy) Page 8 of 13 Table 4.6 Nitrogen Dioxide Minimum Monitoring Requirements-PAMS Minimum NO 2 Monitors Required for PAMS Type II Sites Total NO 2 Monitors Active at PAMS Type II Sites Total NO 2 Monitors Needed at PAMS Type II Sites PAMS Type II Sites/Locations PAMS Type II Sites/Locations AQS ID (#) (#) (#) (name) (#) Floyd Smith Dr. (FSD) Camp Pendleton None (CMP) Kearny Villa Rd (KVR) Downtown (unofficial) (DTN) Section Nitrogen Dioxide Minimum Monitoring Requirements-Summary Table 4.7 summarizes all the NO 2 minimum monitoring requirements from Sections Table 4.7 Nitrogen Dioxide Minimum Monitoring Requirements-Summary CFR Programs Requirements for NO 2 Monitors Minimum NO 2 Monitors Required Active NO 2 Monitors Needed NO 2 Monitors (name) (#) (#) (#) None 1 1 None 4 +1* 4+1* None Near-road= Area-Wide Regional Administrator= PAMS only= *1 NOx monitor is substituted for the NOy requirement at a Type III site, Alpine (see Section for more detail).
73 Chapter 4: Nitrogen Dioxide (NO2) & Reactive Oxides of Nitrogen (NOy) Page 9 of 13 Section Reactive Oxides of Nitrogen Minimum Monitoring Requirements The District is federally mandated to monitor NOy levels in accordance with the CFR. This section will state the different minimum monitoring requirements for each program, e.g. NCore, PAMS, etc. that the District operates and the references therein (Note: only the passages applicable/informative to the District are referenced). The District meets or exceeds all minimum requirements for NO y monitoring except for the following: In 2014, the District received a waiver from the EPA granting temporary suspension of NOy monitoring at our temporary NCore location at Floyd Smith Drive (highlighted in red). Note: The District has substituted NOx monitoring for NOy at the PAMS Type III location in Alpine. Section Reactive Oxides of Nitrogen Minimum Monitoring Requirements-PAMS The District is required to operate a NOy monitor as part of the PAMS monitoring program. Table 4.8 lists the PAMS NOy monitoring requirements. 5.1 PAMS Monitoring Objectives E PAMS design criteria are site specific. Concurrent measurements of O3, oxides of nitrogen, speciated VOC, CO, and meteorology are obtained at PAMS sites The minimum required number and type of monitoring sites and sampling requirements are listed in Table D-6 of this appendix. Table D 6 of Appendix D to Part 58 Minimum Required PAMS Monitoring Locations and Frequencies No Measurement Where required Sampling frequency 4 NO y One site per area at the Type III or Type I site (all daily except for upper air meteorology) Hourly during the ozone monitoring season. Table 4.8 Reactive Oxides of Nitrogen Minimum Monitoring Requirements-PAMS Minimum NOy Monitors Active NOy Monitors Needed NOy Monitors NOy Monitor Location NOy Monitor Location AQS ID Required Either at a Type I or Type III Site at a Type I or Type III Site (#) (#) (#) (name) (#) 1 1 (Type II)* None** Floyd Smith Dr* (FSD) * In 2011, the District was granted a waiver by the EPA Region IX Authority, to designate the El Cajon location, instead of the Alpine location, as to satisfying the PAMS NOy requirement. **The El Cajon site has been temporarily relocated at Floyd Smith Dr. (FSD) on Gillespie Field property. The EPA granted the District a temporary waiver for the NOy requirement at FSD. Once the District relocates the station back to the original location, NOy monitoring will resume. E 40 CFR Part 58, Appendix D, Network Design Criteria for Ambient Air Quality Monitoring, Section 4, Pollutant-Specific Design Criteria for SLAMS Sites, part NOy Monitoring and -summarized in Table D-6 Minimum Required PAMS Monitoring Locations and Frequencies
74 Chapter 4: Nitrogen Dioxide (NO2) & Reactive Oxides of Nitrogen (NOy) Page 10 of 13 Section Reactive Oxides of Nitrogen Minimum Monitoring Requirements-NCore The District is required to operate a NOy monitor as part of the NCore multipollutant monitoring program. This program was designed to measure pollutants at lower levels, low ppb-ppt range, also called trace level. Table 4.9 lists the NCore NOy requirements. 3. Design Criteria for NCore Sites F (b) The NCore sites must measure, at a minimum, PM2.5 particle mass using continuous and integrated/filter-based samplers, speciated PM2.5, PM particle mass, speciated PM10-2.5, O3, SO2, CO, NO/NOy, wind speed, wind direction, relative humidity, and ambient temperature. NCore sites in CBSA with a population of 500,000 people (as determined in the latest Census) or greater shall also measure Pb either as Pb-TSP or Pb-PM10. Table 4.9 Reactive Oxides of Nitrogen Minimum Monitoring Requirements-NCore MSA County Minimum NCore NOy Monitors Active NCore NOy Monitors Needed NCore NOy Monitors Required (#) (#) (#) San San 1 0* None* Diego Diego *EPA granted a waiver to suspend NOy monitoring until the District relocates back to our original location Section Reactive Oxides of Nitrogen Minimum Monitoring Requirements-Summary Table 4.10 summarizes all the NOy minimum monitoring requirements from Sections Table 4.10 Reactive Oxides of Nitrogen Minimum Monitoring Requirements-Summary CFR Programs Requirements for NOy Monitors Minimum NOy Monitors Required Active NOy Monitors Needed NOy Monitors (name) (#) (#) (#) NCore= PAMS= 1 1 0* 0* None None *Temporarily suspended until relocation back to the original site (The El Cajon NOy monitor will satisfy both the NCore and PAMS requirement). F 40 CFR Part 58, Appendix D, Network Design Criteria for Ambient Air Quality Monitoring, Section 4, Pollutant-Specific Design Criteria for SLAMS Sites, part NOy Monitoring and - 40 CFR Part 58, Appendix D, Network Design Criteria for Ambient Air Quality Monitoring, Section 3, Design Criteria for NCore Sites, subsection (b).
75 Concentration (ppm) NCore Amb 2015 Network Plan Chapter 4: Nitrogen Dioxide (NO2) & Reactive Oxides of Nitrogen (NOy) Page 11 of 13 Section Nitrogen Dioxide Suitability for Comparison to the NAAQS The CFR requires that for NO 2 data to be used in regulatory determinations of compliance with the NO 2 NAAQS, the NO 2 monitors must be sited according to Federal Regulations G1 and the sampling frequency must be in accordance with Federal regulations G2. All District NO 2 monitors meets or exceeds all minimum monitoring requirements and sampling frequencies, as to be able to be compared to the NAAQS. Table 4.11 summarizes these requirements. There is no NAAQS for NOy. Table 4.11 Nitrogen Dioxide & Reactive Oxides of Nitrogen Sampling Equipment Parameter Code Unit Code Duration Code Equipment Method Code Frequency Method ID Oxides of Nitrogen Nitrogen dioxide Nitric oxide NOx NO 2 NO ppm Hr 1 42 series Chemiluminescence 074 7/24 RFNA Reactive Oxides of Nitrogen Not Applicable Nitric oxide NOy NOy-NO NO ppb Hr 1 42i-NOy Chemiluminescence 574 7/24 Not Applicable Maximum 1-Hr Concentration (ppm) Maximum Annual Average (ppm) Days above the National 1-Hr Standard Section Nitrogen Dioxide Concentrations for San Diego Over the years, nitrogen dioxide concentration levels have been decreasing. This section will illustrate the different metrics for comparison. Section Nitrogen Dioxide Concentrations for San Diego-for the Last 20 Years San Diego has realized a steady decrease in the measured concentrations (Table 4.12). The trend is a result of improved emission control technology on mobile sources and emissions should continue to decrease. Note: the Days Above the National 1-Hr Standard. row reflect the NO 2 standard for that year. Table 4.12 Nitrogen Dioxide Concentrations for San Diego-for the Last 20 Years, Figure 4.1 Nitrogen Dioxide Concentrations for San Diego-for the Last 20 Years Graph, Nitrogen Dioxide Concentrations for the last 20 Years Years Maximum 1-Hr Concentration Maximum Annual Average G1 40 CFR Part 58, Appendix E, Probe and Monitoring Path Siting Criteria for Ambient Air Quality Monitoring and Table E-4. G2 40 CFR Part 58.12, Subpart B, Operating Schedules.
76 Concentration (ppm) 2015 Network Plan Chapter 4: Nitrogen Dioxide (NO2) & Reactive Oxides of Nitrogen (NOy) Page 12 of 13 Section Nitrogen Dioxide Concentrations for San Diego-by Site for the Year Table 4.4a lists the maximum nitrogen dioxide measurements and NOy-NO for each nitrogen dioxide monitoring location and NCore, respectively; figure 4.13a shows the values graphically with respect to the National Standard for the year (Note: these are not Design Value calculations, so the comparison to the standard is for informational use only). Table 4.13a Nitrogen Dioxide Concentrations for San Diego- by Site for the Year, 2015 No. Site Site Abbreviation Maximum Concentration for 1-Hr Days Above the National Standard Annual Average (#) (name) (ppm) (#) (ppm) 1 Alpine ALP Camp Pendleton CMP Chula Vista CVA Floyd Smith Dr. FSD Escondido ESC * Kearny Villa Rd KVR Rancho Carmel Dr. RCD * Donovan DVN San Diego-Beardsley DTN *Insufficient data; not operational for a sufficient number of months in 2015 for a comparable annual average. Figure 4.2a Nitrogen Dioxide Concentrations for San Diego-by Site for the Year Graph, 2015 Nitrogen Dioxide Concentrations (1-Hr Max & Annual Avg) by Site for the Year ALP CMP CVA FSD *ESC KVR *RCD DVN DTN Sites Maximum Concentraion for 1-Hr Annual Average 1-Hr Std** (0.100 ppm) Annual Avg Std (0.053 ppm) *Insufficient data; not operational for a sufficient number of months in 2015 for a comparable annual average. **Note: the 1-Hr NAAQS is calculated using a Design Value, therefore the 1-Hr NAAQS can be used informational purposes only. Only the Annual Average can be directly compared to the NAAQS
77 Concentration (ppm) 2015 Network Plan Chapter 4: Nitrogen Dioxide (NO2) & Reactive Oxides of Nitrogen (NOy) Page 13 of 13 Section Nitrogen Dioxide Concentrations for San Diego-by Site for the Design Value Table 4.13b lists the maximum nitrogen dioxide measurements for each monitor. Table 4.13b Nitrogen Dioxide Concentrations for San Diego-by for the Site Design Value, No. Site Site Abbreviation Design Value Maximum Concentration for 1-Hr Days Above the National Standard (#) (name) (ppm) (#) 1 Alpine ALP Camp Pendleton CMP Chula Vista CVA Floyd Smith Dr. & El Cajon FSD & FSD Escondido ESC * Kearny Villa Rd KVR Rancho Carmel Dr.* RCD * 0 8 Donovan & Otay Mesa DVN & OTM San Diego-Beardsley DTN *Not sampled for 3-yrs, so no Design Value could be calculated. Figure 4.2b Nitrogen Dioxide Concentrations for San Diego-by Site for the Design Value Graph, Nitrogen Dioxide Desgin Value Concentrations by Site ALP CMP CVA FSD & ECA ESC KVR *RCD DVN & OTM Sites Maximum Concentraion for 1-Hr DTN 1-Hr Std (0.100 ppm) *Not sampled for 3-yrs, so no Design Value could be calculated.
 was sampled on continuous basis locations in the SDAB (Figure 5.0 and Table 5.")

78 Chapter 5: Carbon Monoxide (CO) Page 1 of 7 Chapter 5 Carbon Monoxide (CO) Section Carbon Monoxide Introduction Carbon monoxide (CO) was sampled on continuous basis locations in the SDAB (Figure 5.0 and Table 5.1) and referenced to the carbon monoxide standards of the year (Table 5.0). The sampling equipment are listed in Table 5.1. Trace level CO was sampled at the El Cajon-NCore site. For NCore details, see section 10 NCore for a complete list of all the requirements. Please note: In 2015,the Escondido station was temporarily shut-down (see the Overview chapter for more information) In 2013, the El Cajon Station was temporarily relocated to the Gillespie Field area off of Floyd Smith Drive (FSD). Figure 5.0 Carbon Monoxide Network Map Table 5.0 Carbon Monoxide State and National Standards for the Year
79 CO 2015 Network Plan Chapter 5: Carbon Monoxide (CO) Page 2 of 7 Table 5.1 Carbon Monoxide Sampling Network Abbreviation Name FSD ESC DTN RCD Floyd Smith Dr. Escondido San Diego Beardsley Rancho Carmel Dr. AQS ID Monitor Type SLAMS SLAMS SLAMS SLAMS Method IR IR IR IR Affiliation NCORE, PAMS Not Applicable SIP Not Applicable Spatial Scale NS NS NS MI Site Type PE PE PE SO Objective (Federal) Equipment PI, NAAQS 48i-TLE PI, NAAQS 48i PI, NAAQS 48i-TLE PI, NAAQS 48i-TLE Glossary of Terms Monitor Type Method (Sampling/Analysis) Affiliation E= EPA CL= Chemiluminescence BG= Border Grant O= Other CT= Low Volume, size selective inlet, continuous CSN STN= Trends Speciation SLAMS= State & Local monitoring station FL= Fluorescence CSN SU= Supplemental Speciation SPM= Special purpose monitor HV= High volume NATTS= National Air Toxics Trends Stations CATAC= California Toxics Monitoring IR= Nondispersive infrared NCORE= National Core Multi-pollutant SI= High volume, size selective inlet Monitoring Stations SP= Low volume, size selective inlet, speciated NR= Near-road Q= Low volume, size selective inlet, sequential PAMS= Photochemical Assessment Monitoring UV= Ultraviolet absorption Stations Site Type Canister= Evacuated stainless steel canisters UNPAMS= Unofficial PAMS site EXDN= Extreme downwind Cartridges= Di-nitrophenylhydrazine cartridges HC= Highest concentration FSL= Fused Silica Lined Monitor Designation MXO= Maximum ozone concentration Filter= Quartz filters PRI= Primary MXP= Maximum precursor impact QAC= Collocated PE= Population exposure O= Other SO= Source oriented UPBD= Upwind background Spatial Scale Objective (Federal) G/B= General/Background MI= Micro NAAQS= Suitable for NAAQS comparison RT= Regional Transport MS= Middle Research= Research support WRI= Welfare related impacts NS= PI= Public Information QA= Quality assurance US= Urban Scale
80 Chapter 5: Carbon Monoxide (CO) Page 3 of 7 Section Carbon Monoxide Minimum Monitoring Requirements The District is federally mandated to monitor CO levels in accordance with the CFR. This section will state the different monitoring requirements for each program, e.g. ambient, PAMS, NCore, Near-road, etc. that the District operates and references therein (Note: only the passages applicable/informative to the District are referenced). These monitors can serve as fulfilling other CO network requirements, e.g. ambient CO monitor can fulfill a PAMS CO monitor requirement. The District meets or exceeds all minimum requirements for CO monitoring for all programs. Section Carbon Monoxide Minimum Monitoring Requirements-Near-road In an effort to measure concentrations for some pollutants in communities located by highly trafficked roadways, the EPA instituted the Near-road monitoring program. Table 5.2 lists the Near-road requirements General Requirements A (a) Except as provided in subsection (b), one CO monitor is required to operate collocated with one required near-road NO2 monitor, as required in Section of this part, in CBSAs having a population of 1,000,000 or more persons. If a CBSA has more than one required near-road NO2 monitor, only one CO monitor is required to be collocated with a near-road NO2 monitor within that CBSA. Table 5.2 Carbon Monoxide Minimum Monitoring Requirements-Near-road MSA County Population Estimated from 2010 Census Minimum NO 2 Monitors Required Are Collocated CO Monitors Required Collocated CO Monitors Required Active CO Monitors Collocated Needed CO Monitors (name) (name) (#) (#) (yes/no) (#) (#) (#) San San Yes 1 1 None Diego Diego million Section Carbon Monoxide Minimum Monitoring Requirements-NCore The District is required to operate a CO monitor as part of the NCore multipollutant monitoring program. This program was designed to measure pollutants at lower levels, low ppb-ppt range. Table 5.3 lists the NCore CO requirements. 3. Design Criteria for NCore Sites B (b) The NCore sites must measure, at a minimum, PM 2.5 particle mass using continuous and integrated/filter-based samplers, speciated PM 2.5, PM particle mass, speciated PM , O 3, SO 2, CO, NO/NOy, wind speed, wind direction, relative humidity, and ambient temperature. Table 5.3 Carbon Monoxide Minimum Monitoring Requirements-NCore Minimum CO Monitors Total CO Monitors Total CO Monitors NCore Sites/Locations NCore Sites/Locations AQS ID Required for NCore Sites Active at NCore Sites Needed at NCore Sites (#) (#) (#) (name) (#) 1 1 None Floyd Smith Dr. (FSD) A 40 CFR Part 58, Appendix D, Network Design Criteria for Ambient Air Quality Monitoring, Section 4, Pollutant-Specific Design Criteria for SLAMS Sites, part Carbon Monoxide (CO) Design Criteria, subpart (a), General Requirements. B 40 CFR Part 58, Appendix D, Network Design Criteria for Ambient Air Quality Monitoring, Section 3, Design Criteria for NCore Sites, subsection (b).
81 Chapter 5: Carbon Monoxide (CO) Page 4 of 7 Section Carbon Monoxide Minimum Monitoring Requirements-PAMS The District is required to operate Photochemical Assessment Monitoring Stations (PAMS). There are several associated requirements to operate a PAMS site (see the PAMS chapter for more detail). One of the requirements is to operate a CO monitor. Table 5.4 lists PAMS Carbon Monoxide (CO) Monitoring requirements for the SDAB. 5.1 PAMS Monitoring Objectives C PAMS design criteria are site specific. Concurrent measurements of O3, oxides of nitrogen, speciated VOC, CO, and meteorology are obtained at PAMS sites The minimum required number and type of monitoring sites and sampling requirements are listed in Table D-6 of this appendix. Table D 6 of Appendix D to Part 58 Minimum Required PAMS Monitoring Locations and Frequencies No Measurement Where required Sampling frequency 1 (all daily except for upper air meteorology) 5 CO (ppb level) One site per area at a Type 2 site Hourly during the ozone monitoring season. Table 5.4 Carbon Monoxide Minimum Monitoring Requirements-PAMS Minimum Total Total PAMS Sites/Locations PAMS Sites/Locations CO Monitors CO Monitors CO Monitors AQS ID Required Active Needed for PAMS Sites at PAMS Sites at PAMS Sites (#) (#) (#) (name) (#) 1 1 None Floyd Smith Dr. (FSD) Section Carbon Monoxide Minimum Monitoring Requirements-State The District must operate one ambient level or non-source monitor as part of the 2004 Revision to the California State Implementation Plan (SIP) for Carbon Monoxide D. Table 5.5 Summaries these requirements. Table 5.5 Carbon Monoxide Minimum Monitoring Requirements-State Minimum CO Monitors Total CO Monitors Total CO Monitors SIP Sites/Locations SIP Sites/Locations AQS ID Required for the SIP Active for the SIP Needed for the SIP (#) (#) (#) (name) (#) 1 1 None Downtown (DTN) C 40 CFR Part 58, Appendix D, Network Design Criteria for Ambient Air Quality Monitoring, Section 4, Pollutant-Specific Design Criteria for SLAMS Sites, part 5 Network Design for Photochemical Assessment Monitoring Stations (PAMS), -subpart 5.1 PAMS Monitoring Objectives, -subpart 5.3 Minimum Monitoring Requirements, and -summarized in Table D-6 Minimum Required PAMS Monitoring Locations and Frequencies D
82 Chapter 5: Carbon Monoxide (CO) Page 5 of 7 Section Carbon Monoxide Minimum Monitoring Requirements-Summary Table 5.6 summarizes all the CO minimum monitoring requirements from Sections Table 5.6 Carbon Monoxide Minimum Monitoring Requirements-Summary CFR Programs Requirements for CO Monitors Minimum CO Monitors Required Active CO Monitors Needed CO Monitors (name) (#) (#) (#) Near-road PAMS= NCore= SIP= None None None None
83 Concentration (ppm) NCore Ambient 2015 Network Plan Chapter 5: Carbon Monoxide (CO) Page 6 of 7 Section Carbon Monoxide Suitability for Comparison to the NAAQS The CFR requires that for CO data to be used in regulatory determinations of compliance with the CO NAAQS, the CO monitors must be sited according to Federal Regulations E1 and the sampling frequency must be in accordance with Federal regulations E2. All District CO monitors meets or exceeds all minimum monitoring requirements and sampling frequencies, as to be able to be compared to the NAAQS. Table 5.7 summarizes these requirements. Table 5.7 Carbon Monoxide Suitability for Comparison to the NAAQS-Sampling Equipment Parameter Code Unit Code Duration Code Equipment Method Code Frequency Method ID Carbon monoxide CO ppm Hr 1 48 series Nondispersive infrared 054 7/24 RFCA Carbon monoxide Trace Level CO ppb Hr 1 48i-TLE Nondispersive infrared 554 7/24 RFCA Maximum 1-Hr Concentration (ppm) Maximum 8-Hr Concentration (ppm) Days above the National Standard Section Carbon Monoxide Concentrations for San Diego Over the years, carbon monoxide concentration levels have been decreasing. This section will illustrate the different metrics for comparison. Section Carbon Monoxide Concentrations for San Diego-for the Last 20 years San Diego has realized a significant decrease over the years (Table 5.3) and is shown graphically in Figure 5.2 for CO concentrations. The 2003 Wildfires caused the SDAB to exceed the standards for CO, but the exceedances are considered an exceptional event and do not have a lasting impact in the air basin. Even with the last two wildfires in 2003 and 2007, the County still qualifies for attainment status. Note: the Days Above the National Standard row in Table 5.8 reflect the carbon monoxide standards for that year. Table 5.8 Carbon Monoxide Concentrations for San Diego-for the Last 20 Years, Figure 5.2 Carbon Monoxide Concentrations for San Diego-for the Last 20 Years Graph, Years Maximum 1-Hr Concentration Maximum 8-Hr Concentration E1 40 CFR Part 58, Appendix E, Probe and Monitoring Path Siting Criteria for Ambient Air Quality Monitoring and Table E-4. E2 40 CFR Part 58.12, Subpart B, Operating Schedules. Carbon Monoxide Concentrations for the last 20 Years
84 Concentration (µg/m3) 2015 Network Plan Chapter 5: Carbon Monoxide (CO) Page 7 of 7 Section Carbon Monoxide Concentrations for San Diego-by Site for the Year Table 5.4 lists the maximum carbon monoxide measurements for each carbon monoxide monitoring location and NCore; Figure 5.9 shows the values graphically with respect to the National Standard. Table 5.9 Carbon Monoxide Concentrations for San Diego-by Site for the Year, 2015 No. Site Site Abbreviation Maximum Concentration for 8-Hr Maximum Concentration for 1-Hr Days Above the National Standard Annual Average (#) (name) (ppm) (ppm) (#) (ppm) 1b FSD (NCore) FSD Escondido ESC *0.4 3 San Diego-Beardsley DTN Rancho Carmel Dr. RCD *0.6 *Insufficient data; not operational for a sufficient number of months in 2015 for a comparable annual average. Figure 5.2 Carbon Monoxide Concentrations for San Diego-by Site for the Year Graph, Carbon Monoxide Measurements by Site for the Year 1-Hr Std (35 ppm) Hr Std (9 ppm) 0 FSD *ESC DTN *RCD Sites Maximum 8-Hr Maximum 1-Hr Annual Average 1-Hr Std (35 ppm) *Insufficient data; not operational for a sufficient number of months in 2015 for a comparable annual average.


85 Chapter 6: Sulfur Dioxide (SO 2 ) Page 1 of 6 Chapter 6 Sulfur Dioxide (SO 2 ) Section Sulfur Dioxide Introduction Only trace level sulfur dioxide is sampled for at one location (Figure 6.0) in the SDAB and is referenced to the sulfur dioxide standards of the year (Table 6.0). Trace-level SO 2 was sampled at the Floyd Smith Drive-NCore site. Tables 6.1 & 6.2 lists the equipment. See section 11 NCore for detailed requirements. Please note: In 2013, the El Cajon station was temporarily relocated to the Gillespie Field area off of Floyd Smith Drive (FSD). Figure 6.0 Sulfur Dioxide Network Map Table 6.0 Sulfur Dioxide State and National Standards for the Year (Please Note: Only the 1-Hr standard applies for San Diego)
86 Chapter 6: Sulfur Dioxide (SO 2 ) Page 2 of 6 Table 6.1 Sulfur Dioxide Sampling Network Abbreviation FSD 1 Name Floyd Smith Dr. AQS ID Monitor Type Method Affiliation SLAMS FL NCore SO2 Spatial Scale Site Type Objective (Federal) Equipment NS PE PI, NAAQS 43i-TLE 1 ECA station temporarily relocated to the FSD area Glossary of Terms Monitor Type Method (Sampling/Analysis) Affiliation E= EPA CL= Chemiluminescence BG= Border Grant O= Other CT= Low Volume, size selective inlet, continuous CSN STN= Trends Speciation SLAMS= State & Local monitoring station FL= Fluorescence CSN SU= Supplemental Speciation SPM= Special purpose monitor HV= High volume NATTS= National Air Toxics Trends Stations CATAC= California Toxics Monitoring IR= Nondispersive infrared NCORE= National Core Multi-pollutant SI= High volume, size selective inlet Monitoring Stations SP= Low volume, size selective inlet, speciated NR= Near-road Q= Low volume, size selective inlet, sequential PAMS= Photochemical Assessment Monitoring UV= Ultraviolet absorption Stations Site Type Canister= Evacuated stainless steel canisters UNPAMS= Unofficial PAMS site EXDN= Extreme downwind Cartridges= Di-nitrophenylhydrazine cartridges HC= Highest concentration FSL= Fused Silica Lined Monitor Designation MXO= Maximum ozone concentration Filter= Quartz filters PRI= Primary MXP= Maximum precursor impact QAC= Collocated PE= Population exposure O= Other SO= Source oriented UPBD= Upwind background Spatial Scale Objective (Federal) G/B= General/Background MI= Micro NAAQS= Suitable for NAAQS comparison RT= Regional Transport MS= Middle Research= Research support WRI= Welfare related impacts NS= PI= Public Information QA= Quality assurance US= Urban Scale
87 Chapter6: Sulfur Dioxide (SO 2 ) Page 3 of 6 Section Sulfur Dioxide Minimum Monitoring Requirements The District is federally mandated to monitor SO 2 levels in accordance with the CFR. This section will state the different monitoring requirements for each program, ambient, NCore, etc. that the District operates and the references therein (Note: only the passages applicable/informative to the District are referenced). These monitors can serve as fulfilling other SO 2 network requirements, e.g. ambient SO 2 monitor can fulfill a PAMS SO 2 monitor requirement. The Districts meets or exceeds all minimum requirements for SO 2 monitoring for all programs. Section Sulfur Dioxide Minimum Monitoring Requirements-Ambient The procedure to determine the minimum number of ambient (or non-source) level monitors required is different than the other gaseous criteria pollutants. It is based on the total SO 2 emissions in the air basin with respect to the population of the air basin. Tables 6.2a & b lists these requirements Requirement for Monitoring by the Population Weighted Emissions Index A (a) The population weighted emissions index (PWEI) shall be calculated by States for each core based statistical area (CBSA) they contain or share with another State or States for use in the implementation of or adjustment to the SO2 monitoring network. The PWEI shall be calculated by multiplying the population of each CBSA, using the most current census data or estimates, and the total amount of SO2 in tons per year emitted within the CBSA area, using an aggregate of the most recent county level emissions data available in the National Emissions Inventory for each county in each CBSA. The resulting product shall be divided by one million, providing a PWEI value, the units of which are million persons-tons per year... For any CBSA with a calculated PWEI value equal to or greater than 5,000, but less than 100,000, a minimum of one SO2 monitor is required within that CBSA. According to the latest National Emissions Inventory (NEI) EPA Sector Database for 2011 (at the time of the writing of this report, the 2014 NEI database was not published), the SDAB is listed as having SO 2 emissions of 1, Tons/yr (TPY). Using the Population Weighted Emissions Index (PWEI) equation, from EPA section in section 6.5.0: { (3,300,000 million persons) x (1,100 tons/year of SO 2 ) } / (1,000,000) = 3,630MP-TPY Table 6.2a Sulfur Dioxide EPA NEI Emissions Inventory for the Year, 2015 MSA County Population Estimated Total SO 2 Emissions Calculated PWEI from 2010 Census from 2011 NEI (name) (name) (#) (TPY) (MP-TPY) San San 3.3 Diego Diego million 1,100 3,630 Table 6.2b Sulfur Dioxide Minimum Monitoring Requirements-Ambient Calculated PWEI Are the Emissions <5,000 MP-TPY? Required Ambient Monitors Active Ambient Monitors Ambient Monitors Needed (MP-TPY) (yes/no) (#) (#) (#) 3,630 Yes 0 0 None A CFR Part 58, Appendix D, Network Design Criteria for Ambient Air Quality Monitoring, Section 4, Pollutant-Specific Design Criteria for SLAMS Sites, part 4.4 Sulfur Dioxide (SO 2) Design Criteria, subpart 4.4.2(a) Requirement for Monitoring by the Population Weighted Emissions Index
88 Chapter6: Sulfur Dioxide (SO 2 ) Page 4 of 6 Section Sulfur Dioxide Minimum Monitoring Requirements-NCore If the PWEI is below a certain threshold, the EPA allows Districts the minimum required SO 2 monitor to be the NCore SO 2 required monitor. Table 6.3 lists these requirements Requirement for Monitoring by the Population Weighted Emissions Index B (1) The SO2 monitoring site(s) required as a result of the calculated PWEI in each CBSA shall satisfy minimum monitoring requirements if the monitor is sited within the boundaries of the parent CBSA and is one of the following site types (as defined in section of this appendix): population exposure, highest concentration, source impacts, general background, or regional transport. SO2 monitors at NCore stations may satisfy minimum monitoring requirements if that monitor is located within a CBSA with minimally required monitors under this part NCore Monitoring C (a) SO2 measurements are included within the NCore multipollutant site requirements as described in paragraph (3)(b) of this appendix. NCore-based SO2 measurements are primarily used to characterize SO2 trends and assist in understanding SO2 transport across representative areas in urban or rural locations and are also used for comparison with the SO2 NAAQS. SO2 monitors at NCore sites that exist in CBSAs with minimum monitoring requirements per section above shall be allowed to count towards those minimum monitoring requirement. 3. Design Criteria for NCore Sites D (b) The NCore sites must measure, at a minimum, PM 2.5 particle mass using continuous and integrated/filter-based samplers, speciated PM 2.5, PM particle mass, speciated PM , O 3, SO 2, CO, NO/NO y, wind speed, wind direction, relative humidity, and ambient temperature. Table 6.3 Sulfur Dioxide Minimum Monitoring Requirements-NCore MSA County NCore NCore NCore Met NAAQS? SO 2 Monitors Required SO 2 Monitors Active SO 2 Monitors Needed (#) (#) (#) (yes/no) San Diego San Diego 1 1 None Yes Section Sulfur Dioxide Minimum Monitoring Requirements-Summary Table 6.4 summarizes all the SO 2 minimum monitoring requirements from Sections Table 6.4 Sulfur Dioxide Minimum Monitoring Requirements-Summary CFR Programs Requirements for SO 2 Monitors Minimum SO 2 Monitors Active SO 2 Monitors Needed SO 2 Monitors Required (name) (#) (#) (#) PWEI= NCore only= None None B CFR Part 58, Appendix D, Network Design Criteria for Ambient Air Quality Monitoring, Section 4, Pollutant-Specific Design Criteria for SLAMS Sites, part 4.4 Sulfur Dioxide (SO 2) Design Criteria, subpart 4.4.2(1) Requirement for Monitoring by the Population Weighted Emissions Index C CFR Part 58, Appendix D, Network Design Criteria for Ambient Air Quality Monitoring, Section 4, Pollutant-Specific Design Criteria for SLAMS Sites, part 4.4 Sulfur Dioxide (SO 2) Design Criteria, subpart NCore Monitoring D 40 CFR Part 58- Ambient Air Quality Surveillance, Appendix D, Network Design Criteria for Ambient Air Quality Monitoring, Section 3, Design Criteria for NCore Sites, subsection (b).
89 Concentration (ppm) NCore 2015 Network Plan Chapter6: Sulfur Dioxide (SO 2 ) Page 5 of 6 Section Sulfur Dioxide Suitability for Comparison to the NAAQS The CFR requires that for SO 2 data to be used in regulatory determinations of compliance with the SO 2 NAAQS, the SO 2 monitors must be sited according to Federal Regulations E1 and the sampling frequency must be in accordance with Federal regulations E2. All District SO 2 monitors meets or exceeds all minimum monitoring requirements and sampling frequencies, as to be able to be compared to the NAAQS. Table 6.5 summarizes these requirements. Table 6.5 Sulfur Dioxide Suitability for Comparison to the NAAQS-Sampling Equipment Parameter Code Unit Code Duration Code Equipment Method Code Freque ncy Method ID Sulfur dioxide Trace Level SO ppb Hr 1 5-min 43i-TLE Fluorescence 560 7/24 EQSA Maximum 1-Hr Concentration (ppm) Maximum 24-Hrs Concentration (ppm) Maximum Annual Average (ppm) Days above the National Standard Section Sulfur Dioxide Concentrations for San Diego Over the years, sulfur dioxide concentration levels have been decreasing. This section will illustrate the different metrics for comparison. Section Sulfur Dioxide Concentrations for San Diego-for the Last 20 Years Emissions of sulfur dioxide (SO 2 ) have declined tremendously in California over the last 20 years, due to improved source controls and switching from fuel oil to natural gas for electric generation and industrial boilers. Note: the Days Above National Standard row in Table 6.6 reflects the SO 2 standards for that year and are shown graphically in Figure 6.1. Table 6.6 Sulfur Dioxide Concentrations for San Diego-for the Last 20 Years Figure 6.1 Sulfur Dioxide Concentrations for San Diego-for the Last 20 Years Graph, Sulfur Dioxide Concentrations for the last 20 Years Years Maximum 1-Hr Concentration Maximum 24-Hr Concentration Maximum Annual Average E1 40 CFR Part 58, Appendix E, Probe and Monitoring Path Siting Criteria for Ambient Air Quality Monitoring and Table E-4. E2 40 CFR Part 58.12, Subpart B, Operating Schedules.
90 Concentration (ppm) 2015 Network Plan Chapter6: Sulfur Dioxide (SO 2 ) Page 6 of 6 Section Sulfur Dioxide Concentrations for San Diego-by Site for the Design Value Table 6.4a lists the maximum sulfur dioxide measurements for the NCore monitoring location and Figure 6.7 shows the values graphically with respect to the National Standard. Table 6.7 Sulfur Dioxide Concentrations for San Diego-by Site for the Design Value, Site Site Abbreviation Design Value Maximum Concentration 1-Hr Days Above the National Standard (site) (ppm) (#) Floyd Smith Dr. & El Cajon FSD & ECA Figure 6.2 Sulfur Dioxide Concentrations for San Diego-by Site for the Design Value Graph, Sulfur Dioxide Concentrations (1-Hr Max) for the Year FSD Site 1-Hr Std (0.075 ppm) Maximum 1-Hr Concentration
 and referenced to the lead standards of the year (Table 7.0).")
. Figure 7.")
91 Chapter 7: Lead (Pb) Page 1 of 7 Chapter 7 Lead (Pb) Section Lead Introduction Lead (Pb) was sampled for at two locations in the SDAB (Figure 7.0 and Tables 7.1 & 7.2) and referenced to the lead standards of the year (Table 7.0). Ambient level lead was sampled at the El Cajon location as part of the NCore program. Source level lead was sampled at McClellan-Palomar airport. Please note: In 2013,the El Cajon station was temporarily relocated to the Gillespie Field area off of Floyd Smith Drive (FSD). Figure 7.0 Lead Map Network Map Table 7.0 Lead State and National Standards for the Year
92 Lead 2015 Network Plan Chapter 7: Lead (Pb) Page 2 of 7 Table 7.1 Lead Sampling Network Abbreviation ECA/FSD 1 CRQ Name Floyd Smith Dr. Palomar Airport Address Latitude Longitude Floyd Smith Dr Palomar Airport Rd O O AQS ID Monitor Type SLAMS SLAMS SLAMS Designation O O QAC Method HV HV HV Affiliation NCORE Not Applicable Not Applicable Spatial Scale NS MI MI Site Type PE SO QA Objective (Federal) NAAQS NAAQS NAAQS Analysis APCD APCD APCD Frequency 1:6 1:6 1:6 Equipment Tisch TE- 5170BLVFC+ Tisch TE- 5170BLVFC+ Tisch TE- 5170BLVFC+ 1 ECA station temporarily relocated to the FSD area Glossary of Terms Monitor Type Method (Sampling/Analysis) Affiliation E= EPA CL= Chemiluminescence BG= Border Grant O= Other CT= Low Volume, size selective inlet, continuous CSN STN= Trends Speciation SLAMS= State & Local monitoring station FL= Fluorescence CSN SU= Supplemental Speciation SPM= Special purpose monitor HV= High volume NATTS= National Air Toxics Trends Stations CATAC= California Toxics Monitoring IR= Nondispersive infrared NCORE= National Core Multi-pollutant SI= High volume, size selective inlet Monitoring Stations SP= Low volume, size selective inlet, speciated NR= Near-road Q= Low volume, size selective inlet, sequential PAMS= Photochemical Assessment Monitoring UV= Ultraviolet absorption Stations Site Type Canister= Evacuated stainless steel canisters UNPAMS= Unofficial PAMS site EXDN= Extreme downwind Cartridges= Di-nitrophenylhydrazine cartridges HC= Highest concentration FSL= Fused Silica Lined Monitor Designation MXO= Maximum ozone concentration Filter= Quartz filters PRI= Primary MXP= Maximum precursor impact QAC= Collocated PE= Population exposure O= Other SO= Source oriented UPBD= Upwind background Spatial Scale Objective (Federal) G/B= General/Background MI= Micro NAAQS= Suitable for NAAQS comparison RT= Regional Transport MS= Middle Research= Research support WRI= Welfare related impacts NS= PI= Public Information QA= Quality assurance US= Urban Scale
93 Chapter 7: Lead (Pb) Page 3 of 7 Section Lead Minimum Monitoring Requirements The District is federally mandated to monitor Pb levels in accordance with the CFR. This section will state the different minimum monitoring requirements for each program, e.g. ambient, NCore, Airports, etc. that the District operates and the references therein (Note: only the passages applicable/informative to the District are referenced). The District meets or exceeds all minimum requirements for Pb monitoring for all programs. Section Lead Minimum Monitoring Requirements-Source (non-airport) The procedure to determine the minimum number of source (non-airport) level monitors required is based on any non-airport source emitting more than 0.5 tons/year of Pb emissions. The sources and their Pb emissions are from 2011 EPA NEI database (at the time of the writing of this report, the 2014 was not published). Table 7.2 lists these requirements. 4.5 Lead (Pb) Design Criteria A (a) State and, where appropriate, local agencies are required to conduct ambient air Pb monitoring near Pb sources which are expected to or have been shown to contribute to a maximum Pb concentration in ambient air in excess of the NAAQS, taking into account the logistics and potential for population exposure. At a minimum, there must be one source-oriented SLAMS site located to measure the maximum Pb concentration in ambient air resulting from each non-airport Pb source which emits 0.50 or more tons per year and from each airport which emits 1.0 or more tons per year based on either the most recent National Emission Inventory ( Table 7.2 Lead Minimum Monitoring Requirements-Source (non-airport) MSA County Any Non-Airport Pb Sources >0.5 TPY? Non-Airport Sources Pb Monitors Required Active Ambient Pb Monitors Needed Ambient Pb Monitors Meet NAAQS? (name) (name) (yes/no) (#) (#) (#) (yes/no) San Diego San Diego No None None None Not Applicable Section Lead Minimum Monitoring Requirements-Airport (non-source) The procedure to determine the minimum number of Airport monitors required is based on any Airport source emitting more than 1.0 tons/year of Pb emissions. The airport(s) and their Pb emissions are from the 2011 EPA NEI database (the 2014 is not published). Table 7.3 lists these requirements. If an airport emits less than 1.0 TPY of Pb emissions, sampling is not required, as part of this regulation (Note: An airport can emit less than 1.0 TPY and be required to be monitored; see Section 7.2.3). 4.5 Lead (Pb) Design Criteria A (a) State and, where appropriate, local agencies are required to conduct ambient air Pb monitoring near Pb sources which are expected to or have been shown to contribute to a maximum Pb concentration in ambient air in excess of the NAAQS, taking into account the logistics and potential for population exposure. At a minimum, there must be one source-oriented SLAMS site located to measure the maximum Pb concentration in ambient air resulting from each non-airport Pb source which emits 0.50 or more tons per year and from each airport which emits 1.0 or more tons per year based on either the most recent National Emission Inventory ( A 40 CFR Part 58, Appendix D, Network Design Criteria for Ambient Air Quality Monitoring, Section 4, Pollutant-Specific Design Criteria for SLAMS Sites, part 4.5 Lead (Pb) Design Criteria, subsection (a).
94 Chapter 7: Lead (Pb) Page 4 of 7 Table 7.3 Lead Minimum Monitoring Requirements-Airport (non-source) MSA County Any Airport Pb Sources >1.0 TPY? Airport Pb Monitors Required Airport Pb Monitors Active Needed Ambient Pb Monitors Meet NAAQS? (name) (name) (yes/no) (#) (#) (#) (yes/no) San San Not No None 1* None Diego Diego Applicable * The District is required to monitor one airport source, as part of a different Federal regulation (see Section 7.2.3). Section Lead Minimum Monitoring Requirements-Airport (non-source) Results One EPA regulation states that if an airport emits less than 1.0 TPY of Pb emissions, no source sampling is required. In 2011, the EPA added a regulation that listed several airports mandated to undergo temporary Pb sampling as part of a Pb-Airport study, regardless if the NEI listed Pb emissions were less than 1.0 TPY. If the analyzed emissions exceeded the NAAQS by 50%, the sampler was to become permanent, or until the emissions were proven to be less than 80% of the NAAQS (over a minimum 3-yr period). Table 7.4 lists these requirements. 4.5 Lead (Pb) Design Criteria B (iii) State and, where appropriate, local agencies are required to conduct ambient air Pb monitoring near each of the airports listed in Table D-3A for a period of 12 consecutive months commencing no later than December 27, Monitors shall be sited to measure the maximum Pb concentration in ambient air, taking into account logistics and the potential for population exposure, and shall use an approved Pb-TSP Federal Reference Method or Federal Equivalent Method. Any monitor that exceeds 50 percent of the Pb NAAQS on a rolling 3-month average (as determined according to 40 CFR part 50, Appendix R) shall become a required monitor under paragraph 4.5(c) of this Appendix, and shall continue to monitor for Pb unless a waiver is granted allowing it to stop operating as allowed by the provisions in paragraph 4.5(a)(ii) of this appendix. Data collected shall be submitted to the Air Quality System database according to the requirements of 40 CFR part Table D 3A Airports to Be Monitored for Lead Airport County State McClellan-Palomar San Diego CA Gillespie Field San Diego CA The sampling at Gillespie Field & Palomar Airport has officially concluded. McClellan-Palomar Airport did not pass the minimum tolerances established by the EPA. This required the District to sample for lead at Palomar Airport until such time as the measured concentrations are below the Federal standard for a minimum of three years (see 2012 Annual Network Plan for greater discussion). At the conclusion of the sampling period for Gillespie Field, it was determined by the EPA to discontinue all lead sampling at the airport. B 40 CFR Part 58, Appendix D, Network Design Criteria for Ambient Air Quality Monitoring, Section 4, Pollutant-Specific Design Criteria for SLAMS Sites, part 4.5 Lead (Pb) Design Criteria, subsection (iii)
95 Chapter 7: Lead (Pb) Page 5 of 7 Table 7.4 Lead Airport Study Requirements Names of Airport Monitors Required Was Airport Testing Done? Is Airport Testing Concluded? McClellan-Palomar Gillespie Field Does Airport Require Permanent Sampling? Is Permanent Sampling Active? (name) (yes/no) (yes/no) (yes/no) (name) Yes Yes Yes Yes Yes No Yes Not Required Section Lead Minimum Monitoring Requirements-NCore The District is required to operate a Pb sampler as part of the NCore multipollutant monitoring program. This program was designed to measure pollutants at lower levels. Table 7.5 lists the NCore Pb requirements. 4.5 Lead (Pb) Design Criteria C (b) local agencies are required to conduct non-source-oriented Pb monitoring at each NCore site required under paragraph 3 of this appendix in a CBSA with a population of 500,000 or more. 3. Design Criteria for NCore Sites D (b)... NCore sites in CBSA with a population of 500,000 people (as determined in the latest Census) or greater shall also measure Pb either as Pb-TSP or Pb-PM 10. Table 7.5 Lead Minimum Monitoring Requirements-NCore MSA County Population Estimated from 2010 Census Minimum NCore Pb Monitors Required Number of Active NCore Pb Monitors Number of NCore Pb Monitors Needed NCore Site NCore Site AQS ID Number (name) (name) (#) (#) (#) (#) (name) (#) San San 3.3 Floyd Smith Dr. 1 1 None Diego Diego million (FSD) Section Lead Minimum Monitoring Requirements-Summary Table 7.6 summarizes the Pb minimum monitoring requirements. Table 7.6 Lead Minimum Monitoring Requirements-Summary CFR Programs Requirements for Active Pb Samplers Pb Samplers Source (non-airport)= Source Airport= Airport Study= Airport Study Exceedance= NCore= Minimum Pb Samplers Required Needed Pb Samplers (name) (#) (#) (#) 0 0 None 0 0 None 0 0* None 1* 1 None 1 1 None *McClellan-Palomar Airport did not pass the minimum tolerance established by the EPA, which requires the District to sample for lead until such time as the measured concentrations are below the NAAQS (a minimum of 3-yrs). Gillespie Field passed, so no further testing is required. C 40 CFR Part 58, Appendix D, Network Design Criteria for Ambient Air Quality Monitoring, Section 4, Pollutant-Specific Design Criteria for SLAMS Sites, part 4.5 Lead (Pb) Design Criteria, subsection (b) D 40 CFR Part 58, Appendix D, Network Design Criteria for Ambient Air Quality Monitoring, Section 3, Design Criteria for NCore Sites, subsection (b).
96 Concentration (ug/m3) 2015 Network Plan Chapter 7: Lead (Pb) Page 6 of 7 Maximum Calendar Quarter (µg/m 3 ) Maximum Rolling 3-Month Average (µg/m 3 ) Days above the National Standard Section Lead Suitability for Comparison to the NAAQS The CFR requires that for Pb data to be used in regulatory determinations of compliance with the Pb NAAQS, the Pb monitors must be sited according to Federal Regulations E1 and the sampling frequency must be in accordance with Federal regulations E2. All District Pb monitors meets or exceeds all minimum monitoring requirements and sampling frequencies, as to be able to be compared to the NAAQS. Table 7.7 summarizes these requirements. Table 7.7 Lead Suitability for Comparison to the NAAQS-Sampling Equipment Parameter Code Unit Code Duration Code Equipment Method Code Frequency Method ID Lead Pb µg/m 3 LC Hr 7 Tisch TE-5170 BLVFC+ ICP/MS Acid filter extract with hot nitric acid 192 1:6 EQL Section Lead Concentrations for San Diego Over the years, lead concentrations decreased so much that ambient sampling was no longer required. In 2012, the EPA lowered the NAAQS and sampling resumed. This section will illustrate the different metrics for comparison. Section Lead Concentrations for San Diego-for the Last 20 Years The rapid decrease in lead emissions (Table 7.8) over the last 20 plus years can be attributed primarily to phasing out the lead in gasoline. Note: the Days Above National Standard row in Table 7.8 and Figure 7.1 reflect the lead standard for that year. No Testing (NT) was done in the SDAB from 1997 until The measured concentrations for 2012 are from the NCore location, which is categorized as neighborhood scale and representative concentrations. The airport sampler is categorized as source impact and microscale, and are not considered representative concentrations. Table 7.8 Lead Concentrations for San Diego-for the Last 20 Years, NT NT NT NT NT NT NT NT NT NT NT NT NT NT NT NT NT NT NT NT NT NT NT NT NT NT NT NT NT NT NT NT NT NT NT NT NT NT NT NT NT NT Figure 7.1 Lead Concentrations for San Diego-for the Last 20 Years, Lead Concentrations for the last 20 Years Years E1 40 CFR Part 58, Appendix E, Probe and Monitoring Path Siting Criteria for Ambient Air Quality Monitoring and Table E-4. E2 40 CFR Part 58.12, Subpart B, Operating Schedules. Maximum Calendar Quarter Maximum Rolling Three Month Average
97 Concentration (ug/m3) Network Plan Chapter 7: Lead (Pb) Page 7 of 7 Section Lead Concentrations for San Diego-by Site for the Year Table 7.9 lists the maximum lead measurements for each lead monitoring location; Figure 7.2 shows the values graphically with respect to the National Standard. Table 7.9 Lead Concentrations for San Diego-by Site for the Year, 2015 No. Site Site Abbreviation Maximum Rolling 3-Month Average Design Value Maximum Calendar Quarter Days Above the NAAQS (#) (name) (µg/m 3 ) (µg/m 3 ) (#) 1 Floyd Smith Dr. (NCore) FSD (NCore) *Palomar Airport CRQ *Source impact and microscale monitors. Figure 7.2 Lead Concentrations for San Diego-by Site for the Year Graph, 2015 Lead Measurents by Site Maximum Rolling 3-Mo Average Std & Maximum Calendar Qtr (0.15 µg/m 3 ) FSD CRQ Site Maximum Rolling 3-Month Average Maximum Calendar Qtr. The measured concentrations at the NCore location have been consistently well below the NAAQS; therefore, the District will petition the EPA Regional Authorities to decommission Pb-TSP sampling at this location (see the Executive Summary for the request). The measured concentrations at the Palomar Airport location have been consistently well below the NAAQS. If this pattern continues for three (3) contiguous years of operations, the District will petition the EPA to decommission Pb-TSP sampling at this location.
 at several locations in the SDAB (Figure 8.0 and Table 8.1) and were referenced to the PM 2.")
.")
98 Chapter 8: Particulate Matter 2.5 µm (PM 2.5 ) Page 1 of 22 Chapter 8 Particulate Matter 2.5 µm (PM 2.5 ) Section PM 2.5 Introduction PM 2.5 was sampled on both a continuous basis and sequentially (on a schedule set by the EPA) at several locations in the SDAB (Figure 8.0 and Table 8.1) and were referenced to the PM 2.5 standards of the year (Table 8.0), when applicable. The equipment is listed in Tables 8.1 and 8.2. Please note: In 2015, the Escondido station was temporarily shut-down (see the Overview chapter for more information). In 2013, the El Cajon Station was temporarily relocated to the Gillespie Field area off of Floyd Smith Drive (FSD). o PM 2.5 FRM/sequential samplers are at ESC, KVR, FSD, DTN, and CVA. o PM 2.5 non-fem/continuous samplers are at SAY, CMP, ESC, FSD, ALP, DVN and DTN. o PM 2.5 -CSN samplers are at ESC and FSD. o PM 2.5 -STN samplers are at ESC and FSD/ECA. o PM 2.5 -Supplemental Speciation is at ESC, FSD, and DTN. Figure 8.0 PM 2.5 Network Map Table 8.0 PM 2.5 State and National Standards for the Year
99 Chapter 8: Particulate Matter 2.5 µm (PM 2.5 ) Page 2 of 22 Table 8.1 PM 2.5 Sampling Network Abbreviation ALP CMP CVA FSD 1 ESC KVR DTN DVN SAY Name Address Alpine 2495A W. Victoria Dr. Camp Pendleton W. B St Chula Vista 80 E. J St Floyd Smith Dr Floyd Smith Dr Escondido Kearny Villa Rd 600 E. Valley Pkwy Kearny Villa Rd San Diego Beardsley 1110A Beardsley St. Donovan 480 Alta Rd. San Ysidro (1 st location) 720 E San Ysidro Blvd Latitude Longitude AQS ID PM2.5 (non-speciated) Monitor Type SLAMS SLAMS SLAMS SLAMS SLAMS SLAMS SLAMS SLAMS SLAMS SLAMS SLAMS SPM Designation O O PRI PRI O PRI PRI QAC O PRI O O Method CT (non-fem) CT (non-fem) SQ (FRM) SQ (FRM) CT (non-fem) Affiliation NCORE Spatial Scale SQ (FRM) SQ (FRM) SQ (FRM) CT (non-fem) SQ (FRM) CT (non-fem) US NS NS NS NS NS NS NS NS NS NS MI Site Type PE UPBD PE PE PE PE PE QA PE PE PE SO Objective (Federal) PI, Research PI, Research NAAQS NAAQS PI, Research NAAQS NAAQS NAAQS Analysis APCD APCD APCD APCD APCD APCD APCD APCD APCD APCD APCD APCD PI, Research NAAQS PI, Research CT (non-fem) PI, Research Frequency 7/24 7/24 1:3 1:3 7/24 1:3 1:3 1:12 7/24 1:1 7/24 7/24 PM2.5 (speciated) Equipment Monitor Type Met One BAM Met One BAM Met One BAM Met One BAM SLAMS SLAMS SLAMS SLAMS Method SP & SQ SP & SQ SP & SQ SP & SQ SP & SQ SP & SQ SP & SQ NCORE, CSN NCORE, CSN CSN SU CSN SU CSN SU Affiliation STN 2 STN 2 SDAPCD CSN STN CSN STN SDAPCD SDAPCD Network Network Network Spatial Scale NS NS NS NS NS NS NS Site Type PE PE PE PE PE PE PE Objective (Federal) Research Research Research Research Research Research Research Analysis EPA EPA APCD EPA CARB APCD APCD Frequency 1:3 1:3 1:6 1:3 1:6 1:6 1:6 Equipment URG- 3000N Met One SASS Met One SASS URG- 3000N Met One SASS 1 This is a temporary station. The District could not operate a PM 2.5 continuous sampler, due to safety concerns. Met One SASS Met One SASS 2025 Met One BAM Met One BAM
100 Chapter 8: Particulate Matter 2.5 µm (PM 2.5 ) Page 3 of 22 Glossary of Terms Monitor Type Method (Sampling/Analysis) Affiliation E= EPA CL= Chemiluminescence BG= Border Grant O= Other CT= Low Volume, size selective inlet, continuous CSN STN= Trends Speciation SLAMS= State & Local monitoring station FL= Fluorescence CSN SU= Supplemental Speciation SPM= Special purpose monitor HV= High volume NATTS= National Air Toxics Trends Stations CATAC= California Toxics Monitoring IR= Nondispersive infrared NCORE= National Core Multi-pollutant Monitoring Stations SI= High volume, size selective inlet NR= Monitors at sites meeting near road designs as per Part 58 SP= Low volume, size selective inlet, speciated PAMS= Photochemical Assessment Monitoring Stations Site Type Q= Low volume, size selective inlet, sequential UNPAMS= Unofficial PAMS site EXDN= Extreme downwind UV= Ultraviolet absorption HC= Highest concentration Canister= Evacuated stainless steel canisters Monitor Designation MXO= Maximum ozone concentration Cartridges= Di-nitrophenylhydrazine cartridges PRI= Primary MXP= Maximum precursor impact FSL= Fused Silica Lined QAC= Collocated PE= Population exposure Filter= Quartz filters O= Other SO= Source oriented UPBD= Upwind background Spatial Scale Objective (Federal) G/B= General/Background MI= Micro NAAQS= Suitable for NAAQS comparison RT= Regional Transport MS= Middle Research= Research support WRI= Welfare related impacts NS= PI= Public Information QA= Quality assurance US= Urban Scale
101 Chapter 8: Particulate Matter 2.5 µm (PM 2.5 ) Page 4 of 22 Section PM 2.5 Manual Minimum Monitoring Requirements The District is federally mandated to monitor PM 2.5 levels in accordance with the CFR. This section will state the needs for PM 2.5 manual method samplers only. The District uses the PM 2.5 manual sampler to satisfy all minimum monitoring requirements, other than those requirements that specifically state PM 2.5 continuous sampler. This section will also state the different monitoring requirements for each program, e.g. ambient, manual, NCore, speciated, etc. that the District operates and references therein (Note: only the passages applicable/informative to the District are referenced). These monitors can serve as fulfilling other PM 2.5 network requirements, e.g. ambient PM 2.5 sampling can fulfill an NCore PM 2.5 sampling requirement. The District meets or exceeds all minimum requirements for PM 2.5 Manual monitoring for all programs except for the following: Establishment of the 2 nd Near-road location (highlighted in red). The District is part of the Statewide PM 2.5 monitoring program and has additional minimum monitoring requirements for ambient level concentrations only. This section will discuss those requirements as well. Section PM 2.5 Manual Minimum Monitoring Requirements-Design Criteria (24-Hr. & Annual Average) The District is required to operate a minimum number of PM 2.5 samplers irrespective of the PM 2.5 network affiliation. To ascertain the minimum number of samplers required for ambient air sampling, the Highest Concentration value must be calculated. Tables 8.2a - 8.2c summarize these requirements. 4.7 Fine Particulate Matter (PM2.5) Design Criteria General Requirements A (a) State, and where applicable local, agencies must operate the minimum number of required PM2.5 SLAMS sites listed in Table D-5 of this appendix. The NCore sites are expected to complement the PM2.5 data collection that takes place at non-ncore SLAMS sites, and both types of sites can be used to meet the minimum PM2.5 network requirements. Deviations from these PM2.5 monitoring requirements must be approved by the EPA Regional Administrator. Table D 5 of Appendix D to Part 58 PM 2.5 Minimum Monitoring Requirements MSA population Most recent 3-year design value 85% of any PM 2.5 NAAQS Most recent 3-year design value <85% of any PM 2.5 NAAQS >1,000, Table 8.2a PM 2.5 Manual Minimum Monitoring Requirements-Design Criteria (Annual Average), Annual Annual Design Value Design Value Location Annual Design Value Site AQS ID Is the Annual Design Value 85% of the NAAQS? Is the Annual Design Value < 85% of the NAAQS? Does the Annual Design Value Meet the NAAQS? (µg/m 3 ) (name) (#) (yes/no) (yes/no) (yes/no) 9.3 San Diego- Beardsley No Yes Yes A 40 CFR Part 58, Appendix D, Network Design Criteria for Ambient Air Quality Monitoring, Section 4, Pollutant-Specific Design Criteria for SLAMS Sites, part 4.7 Fine Particulate Matter (PM 2.5) Design Criteria, subsection General Requirements (a)
102 Chapter 8: Particulate Matter 2.5 µm (PM 2.5 ) Page 5 of 22 Table 8.2b PM 2.5 Manual Minimum Monitoring Requirements-Design Criteria (24-Hr), Hr Design Value 24-Hr Design Value Location 24-Hr Design Value Site AQS ID Is the 24-Hr Design Value 85% of the NAAQS? Is the 24-Hr Design Value < 85% of the NAAQS? Does the 24-Hr Design Value Meet the NAAQS? (µg/m 3 ) (name) (#) (yes/no) (yes/no) (yes/no) 19.6 San Diego- Beardsley No Yes Yes Section PM 2.5 Manual Minimum Monitoring Requirements-Ambient To calculate the number of samplers needed, Use Table D-5 Table 8.2c PM 2.5 Manual Minimum Monitoring Requirements-Ambient MSA County Population Estimated from 2010 Census Minimum PM 2.5 Manual Samplers Required Active PM 2.5 Manual Samplers PM 2.5 Manual Samplers Needed (name) (name) (#) (#) (#) (#) San Diego San Diego 3.3 million 3 5 None Section PM 2.5 Manual Minimum Monitoring Requirements-State In 1998, the San Diego Air Pollution Control District, in partnership with the California Air Resources Board (ARB), developed a PM-fine monitoring network to implement the new PM 2.5 NAAQS. Several factors were accounted for, such as temperature, humidity, precipitation, wind speed, wind direction, and elevation. The PM-fine network is designed to collect ambient PM-fine data as required by the 40 CFR Part 50 for use in designating areas as attainment/non-attainment, developing control programs, and tracking progress of these control programs. The 1998 (and 2002 update) California Particulate Matter Monitoring Network Description B1 describes the particulate matter monitoring strategy involved in the implementation of the program. The network design was submitted to the U.S. EPA Region IX governing authority and approved accordingly. Table 8.3 summarizes these requirements. Table 8.3 PM 2.5 Manual Minimum Monitoring Requirements-State MSA County Population Estimated from 2010 Census Minimum PM 2.5 Manual Samplers Required Active PM 2.5 Manual Samplers Monitors PM 2.5 Manual Needed (name) (name) (#) (#) (#) (#) San Diego San Diego 3.3 million 5 5 None B1
103 Chapter 8: Particulate Matter 2.5 µm (PM 2.5 ) Page 6 of 22 The EPA Region IX governing authority approved the ARB s statewide distribution plan for the placement of the PM 2.5 monitors within each district and the location of the collocated monitors for each district to satisfy the sampling and quality assurance requirements, respectively, of 40 CFR Part 58. Any changes to the PM 2.5 network in the San Diego Air Basin will be undertaken in partnership and advisement with the ARB. Additionally, if a PM 2.5 monitor is violating the NAAQS and the District is forced to relocate the station or the sampler, the District will provide a minimum 30-day period for public review, prior to the relocation of the monitor or the station. Any official decommissioning of any monitor or monitoring location will be proposed in a letter with accompanying documentation to the EPA and the ARB, when applicable. If a station is to relocate, parallel sampling between the current location and the new location will be undertaken, when possible. Section PM 2.5 Manual Minimum Monitoring Requirements-Collocation In 1998, the District and the ARB gave criteria for choosing a site for collocation. Collocation guidance is from the CFR For each distinct monitoring method designation (FRM or FEM) that a PQAO is using for a primary monitor, the PQAO must have 15 percent of the primary monitors of each method designation collocated (values of 0.5 and greater round up); and have at least one collocated quality control monitor (if the total number of monitors is less than three). The first collocated monitor must be a designated FRM monitor. B2 The District and the ARB sited the PM 2.5 collocation site in partnership. The collocated PM 2.5 site must follow the following criteria, in order of importance (Table 8.4 summarizes these requirements): 1. Sites with high or estimated high PM 2.5 concentrations, based on PM 10 data should be considered a viable collocation site. 2. The collocation monitoring site must have enough platform space to maintain 1-4 meter spacing between the primary and the collocated sampler. Table 8.4 Minimum Samplers Required PM 2.5 Manual Minimum Monitoring Requirements-Collocation Number Location of of Active Collocated Samplers Site(s) Samplers Needed for Collocation = 15% x Required FRM Sequential Samplers Rounded Up Number of Active Samplers Used for Collocation Number of Samplers Needed for Collocation Collocated Site AQS ID (#) (#) (#) (#) (#) (name) (#) x (15%) = 1 1 None Kearny Villa Rd (KVR) B2 40 CFR Part 58, Appendix A, Section , Quality System Requirements, PM2.5,
104 Chapter 8: Particulate Matter 2.5 µm (PM 2.5 ) Page 7 of 22 Section PM 2.5 Manual Minimum Monitoring Requirements-Site of Expected Maximum Concentration (24-Hr & Annual Average) The District is required to designate PM 2.5 sampling locations for specific purposes or needs. One of these designations is called the site of expected maximum concentrations with respect to the 24-Hr and annual average NAAQS. For the District these locations can change yearly. For both the 24-Hr and annual average NAAQS, these locations routinely alternate between Escondido, Floyd Smith Dr. (El Cajon), and Downtown monitoring locations. Downtown is in an Environmental Justice location, so both the District and the EPA Regional IX Authorities have designated the Downtown site as the PM 2.5 location of expected maximum 24-Hr concentration and the Escondido site as the PM 2.5 location of expected maximum annual average concentration. Tables 8.5a 8.5b summarize these requirements. (b) Specific Design Criteria for PM 2.5 C (1) At least one monitoring station is to be sited at neighborhood or larger scale in an area of expected maximum concentration. Table 8.5a PM 2.5 Manual Minimum Monitoring Requirements-Site of Expected Maximum Concentration (Annual Average) Site of Site of Expected Expected Maximum Maximum Concentration Concentration for for Design Value Design Value Annual NAAQS Annual NAAQS AQS ID (name) (#) Escondido Table 8.5b PM 2.5 Manual Minimum Monitoring Requirements-Site of Expected Maximum Concentration (24-Hr) Site of Site of Expected Expected Maximum Maximum Concentration Concentration for for 24-Hr 24-Hr NAAQS NAAQS AQS ID (name) (#) San Diego-Beardsley C 40 CFR Part 58, Appendix D, Network Design Criteria for Ambient Air Quality Monitoring, Section 4, Pollutant-Specific Design Criteria for SLAMS Sites, part 4.7 Fine Particulate Matter (PM 2.5) Design Criteria, subsection General Requirements, (b) Specific Design Criteria for PM2.5, (1)
105 Chapter 8: Particulate Matter 2.5 µm (PM 2.5 ) Page 8 of 22 Section PM 2.5 Manual Minimum Monitoring Requirements-Near-road The District is required to have a PM 2.5 sampler at a near-road location. The District is required to operate two near-road sites. The first near-road station is at Rancho Carmel Drive and the second one is not yet sited. There is no space at the Rancho Carmel Drive station to situate a PM 2.5 sampler for regulatory purposes, so the PM 2.5 Near-road sampler will be placed at the 2 nd Near-road location. Table 8.6 lists these requirements. (b) Specific Design Criteria for PM 2.5 D (2) For CBSAs with a population of 1,000,000 or more persons, at least one PM 2.5 monitor is to be collocated at a near-road NO2 station required in section 4.3.2(a) of this appendix. Table 8.6 PM 2.5 Manual Minimum Monitoring Requirements-Near-road MSA County Population Estimated from 2010 Census Minimum NO 2 Near-road Monitors Required Are Collocated PM 2.5 Samplers Required Minimum PM 2.5 Collocated Samplers Required Total PM 2.5 Samplers Required Total PM 2.5 Samplers Active Total PM 2.5 Samplers Needed (name) (name) (#) (#) (yes/no) (#) (#) (#) (#) San San Yes Diego Diego million Section PM 2.5 Manual Minimum Monitoring Requirements-Site of Poor Air Quality The District is required to designate PM 2.5 sampling locations for specific purposes or needs. One of these designations is called the site of Poor Air Quality with respect to the 24-Hr and annual average NAAQS. For the District these locations can change yearly. For both the 24-Hr and annual average NAAQS, these locations routinely alternate between Escondido, Floyd Smith Dr. (El Cajon), and Downtown. Since Downtown is designated as an Environmental Justice location and Floyd Smith Dr. (El Cajon) is designated as a NCore site, the District has designated the Escondido sampler as the site of Poor Air Quality. Table 8.7 summarize these requirements. (b) Specific Design Criteria for PM 2.5 E For areas with additional required SLAMS, a monitoring station is to be sited in an area of poor air quality. Table 8.7 PM 2.5 Manual Minimum Monitoring Requirements-Site of Poor Air Quality Site of Site of Poor Poor Air Quality Air Quality AQS ID (name) (#) Escondido D 40 CFR Part 58, Appendix D, Network Design Criteria for Ambient Air Quality Monitoring, Section 4, Pollutant-Specific Design Criteria for SLAMS Sites, part 4.7 Fine Particulate Matter (PM 2.5) Design Criteria, subsection (b)(2) E 40 CFR Part 58, Appendix D, Network Design Criteria for Ambient Air Quality Monitoring, Section 4, Pollutant-Specific Design Criteria for SLAMS Sites, part 4.7 Fine Particulate Matter (PM 2.5) Design Criteria, subsection (b)(3)
106 Chapter 8: Particulate Matter 2.5 µm (PM 2.5 ) Page 9 of 22 Section PM 2.5 Manual Minimum Monitoring Requirements-NCore The District is required to operate a PM 2.5 sampler as part of the NCore multipollutant monitoring program. This program was designed to measure pollutants at lower levels, as well as other pollutants. For the NCore program, the District is required to collect PM coarse (PM ) data. PM coarse data is the obtained by operating collocated PM 10 and PM 2.5 samplers of the same make and model and on the same sampling frequency. The PM 2.5 concentrations are then subtracted from the PM 10 concentrations to get the PM coarse fraction. Table 8.8 lists the NCore PM 10 requirements. 4.8 Coarse Particulate Matter (PM10 2.5) Design Criteria. F 4.8.1General Monitoring Requirements. (a) The only required monitors for PM are those required at NCore Stations. Table 8.8 PM 2.5 Manual Minimum Monitoring Requirements-NCore Minimum PM 2.5 Samplers Required for NCore Sites Total PM 2.5 Samplers Active at NCore Sites Total PM 2.5 Samplers Needed at NCore Sites NCore Sites/Locations NCore Sites/Locations AQS ID (#) (#) (#) (name) (#) 1 1 None Floyd Smith Dr. (FSD) Section PM 2.5 Manual Minimum Monitoring Requirements-Summary Table 8.9 summarizes all the PM 2.5 manual minimum monitoring requirements from Sections Table 8.9 PM 2.5 Manual Minimum Monitoring Requirements-Summary CFR Programs Requirements for PM 2.5 Manual Samplers Minimum PM 2.5 Manual Samplers Required Active PM 2.5 Manual Samplers CFR EPA Table D-2 only= California Particulate Matter Network= Expected Maximum Concentration, 24-Hr = Expected Maximum Concentration, Annual Average= Near-road= Poor Air Quality= NCore= Needed PM 2.5 Manual Samplers (name) (#) (#) (#) 3 5 None 5 5 None 1 1 None 1 1 None None 1 1 None F 40 CFR Part 58, Appendix D, Network Design Criteria for Ambient Air Quality Monitoring, Section 4, Pollutant-Specific Design Criteria for SLAMS Sites, part 4.8 Coarse Particulate Matter (PM 2.5) Design Criteria, General Monitoring Requirements, (a) NCore
107 Chapter 8: Particulate Matter 2.5 µm (PM 2.5 ) Page 10 of 22 Section PM 2.5 Continuous Minimum Monitoring Requirements The District is federally mandated to monitor PM 2.5 levels in accordance with the CFR. This section will state the needs for PM 2.5 continuous method samplers only and will state the different monitoring requirements for each program, e.g. ambient, NCore, etc. that the District operates and references therein (Note: only the passages applicable/informative to the District are referenced). The District meets or exceeds all minimum requirements for PM 2.5 continuous monitoring for all programs except for the following: At the NCore location Section PM 2.5 Continuous Minimum Monitoring Requirements-Ambient The District is required to operate a minimum number of PM 2.5 continuous samplers irrespective of the PM 2.5 network affiliation. Table 8.10a summarizes these requirements Requirement for Continuous PM2.5 Monitoring. The State, or where appropriate, local agencies must operate continuous PM2.5 analyzers equal to at least one-half (round up) the minimum required sites listed in Table D-5 of this appendix. G Table 8.10a PM 2.5 Continuous Minimum Monitoring Requirements-Ambient Minimum Active PM 2.5 Manual Samplers PM 2.5 Continuous Samplers Required Minimum PM 2.5 Continuous Samplers= (½ Minimum ) Required PM 2.5 Manual Samplers Rounded Up Needed PM 2.5 Continuous Samplers (#) (#) (#) (#) 3 3 x (½) = 2 6 None Section PM 2.5 Continuous Minimum Monitoring Requirements-Collocation with PM 2.5 Manual Method Samplers The District is required to operate a minimum number of PM 2.5 continuous samplers collocated with PM 2.5 manual samplers. Table 8.10b summarizes these requirements Requirement for Continuous PM2.5 Monitoring... At least one required continuous analyzer in each MSA must be collocated with one of the required FRM/FEM/ARM monitors. G Table 8.10b PM 2.5 Continuous Minimum Monitoring Requirements-Collocation with PM 2.5 Manual Method Samplers Minimum PM 2.5 Continuous Samplers (Sites) Required to be Collocated with PM 2.5 Manual Samplers (Sites) Active Sites PM 2.5 Continuous Samplers (Sites) Collocated with Active PM 2.5 Manual Samplers (Sites) Needed PM 2.5 Continuous Sampler (Sites) Collocated with Active PM 2.5 Manual Samplers (Sites) Location(s) of PM 2.5 Continuous Samplers (Sites) Collocated with Active PM 2.5 Manual Samplers (Sites) AQS ID of PM 2.5 Continuous Samplers (Sites) Collocated with Active PM 2.5 Manual Samplers (Sites) (#) (#) (#) (name) (#) 1 2 None Escondido SD-Beardsley G 40 CFR Part 58, Appendix D, Network Design Criteria for Ambient Air Quality Monitoring, Section 4, Pollutant-Specific Design Criteria for SLAMS Sites, part 4.7 Fine Particulate Matter (PM 2.5) Design Criteria, subsection 4.7.2
108 Chapter 8: Particulate Matter 2.5 µm (PM 2.5 ) Page 11 of 22 Section PM 2.5 Continuous Minimum Monitoring Requirements-NCore The District is required to operate a PM 2.5 continuous sampler as part of the NCore multipollutant monitoring program. Table 8.11 lists the NCore PM 2.5 continuous requirements. 3. Design Criteria for NCore Sites H (b) The NCore sites must measure, at a minimum, PM 2.5 particle mass using continuous and integrated/filter-based samplers, speciated PM 2.5, PM particle mass, speciated PM , O 3, SO 2, CO, NO/NOy, wind speed, wind direction, relative humidity, and ambient temperature. Table 8.11 PM 2.5 Continuous Minimum Monitoring Requirements-NCore Minimum PM 2.5 Continuous Samplers Required for NCore Sites Total PM 2.5 Continuous Samplers Active at NCore Sites Total PM 2.5 Continuous Samplers Needed at NCore Sites NCore Sites/Locations NCore Sites/Locations AQS ID (#) (#) (#) (name) (#) 1 0 *None Floyd Smith Dr. (FSD) *The FSD NCore location is temporary. The District could not install and operate a PM 2.5 continuous sampler safely, so this requirement is not met. Once the NCore station relocates back to the original location, PM 2.5 continuous sampling will resume Section PM 2.5 Continuous Minimum Monitoring Requirements-Summary Table 8.12 summarizes all the PM 2.5 continuous minimum monitoring requirements from Sections Table 8.12 PM 2.5 Continuous Minimum Monitoring Requirements-Summary CFR Programs Requirements for PM 2.5 Continuous Samplers Ambient= PM 2.5 continuous collocated with PM 2.5 manual= NCore= Minimum PM 2.5 Continuous Samplers Required Active PM 2.5 Continuous Samplers Needed PM 2.5 Continuous Samplers (name) (#) (#) (#) 2 6 None 1 2 None 1 0 1* *The FSD NCore location is temporary. The District could not install and operate a PM 2.5 continuous sampler safely, so this requirement is not met. Once the NCore station relocates back to the original location, PM 2.5 continuous sampling will resume H 40 CFR Part 58, Appendix D, Network Design Criteria for Ambient Air Quality Monitoring, Section 3, Design Criteria for NCore Sites, subsection (b).
109 Chapter 8: Particulate Matter 2.5 µm (PM 2.5 ) Page 12 of 22 Section PM 2.5 Speciation Minimum Monitoring Requirements The District is federally mandated to monitor PM 2.5 speciation levels in accordance with the CFR. This section will state the needs for PM 2.5 speciation method samplers only. This section will also state the different monitoring requirements for each program that the District operates and references therein (Note: only the passages applicable/informative to the District are referenced). The District meets or exceeds all minimum requirements for PM 2.5 speciation monitoring for all programs. Section PM 2.5 Speciation Minimum Monitoring Requirements-Ambient One of the requirements is for the STN & CSN network to maintain the current speciation network as designed by the governing authorities. Table 8.13 lists these requirements PM2.5 Chemical Speciation Site Requirements. Each State shall continue to conduct chemical speciation monitoring and analyses at sites designated to be part of the PM2.5 Speciation Trends Network (STN). I Table 8.13 PM 2.5 Speciation Minimum Monitoring Requirements-Ambient STN Samplers (Sites) CSN Samplers (Sites) Location of CSN & STN Monitors (Sites) AQS ID of CSN & STN Monitors (Sites) (#) (#) (name) (#) 2 2 Floyd Smith Dr Escondido Section PM 2.5 Speciation Minimum Monitoring Requirements-NCore The District is required to operate a PM 2.5 speciation samplers as part of the NCore multipollutant monitoring program. Table 8.14 lists these requirements. 3. Design Criteria for NCore Sites J (b) The NCore sites must measure, at a minimum, speciated PM 2.5, Table 8.14 PM 2.5 Speciation Minimum Monitoring Requirements-NCore NCore Site(s) Location of NCore Site(s) AQS ID of Monitors (Sites) (#) (name) (#) 1 El Cajon Section PM 2.5 Speciation Minimum Monitoring Requirements-Summary Table 8.15 summarizes all the PM 2.5 speciation minimum monitoring requirements. Table 8.15 PM 2.5 Speciation Minimum Monitoring Requirements-Summary CFR Programs Requirements for PM 2.5 Manual Samplers Required PM 2.5 Manual Samplers Active PM 2.5 Manual Samplers Needed PM 2.5 Manual Samplers (name) (#) (#) (#) Existing Network= NCore= None None I 40 CFR Part 58, Appendix D, Network Design Criteria for Ambient Air Quality Monitoring, Section 4, Pollutant-Specific Design Criteria for SLAMS Sites, part 4.7 Fine Particulate Matter (PM 2.5) Design Criteria, subsection J 40 CFR Part 58, Appendix D, Network Design Criteria for Ambient Air Quality Monitoring, Section 3, Design Criteria for NCore Sites, subsection (b).
110 Chapter 8: Particulate Matter 2.5 µm (PM 2.5 ) Page 13 of 22 Section PM 2.5 Suitability for Comparison to the NAAQS The CFR requires that certain operating and siting parameters be met for an instrument to be suitable to be compared to the NAAQS. Not all PM 2.5 instrumentation have a NAAQS to compare, PM2.5 speciation samplers and not all PM 2.5 analyzers are operated in regulatory mode, PM 2.5 continuous samplers; therefore, they cannot be compared to the NAAQS. All District PM 2.5 samplers are sited to specified CFR parameters to collect valid data. This section will list those requirements. Section PM 2.5 Suitability for Comparison to the NAAQS-PM 2.5 Manual The CFR requires that for PM 2.5 Manual data to be used in regulatory determinations of compliance with the PM 2.5 NAAQS, the PM 2.5 samplers must be sited according to Federal Regulations K1 and the sampling frequency must be in accordance with Federal regulations K2. All District PM 2.5 Manual samplers meet or exceed all minimum monitoring requirements and sampling frequencies, as to be able to be compared to the NAAQS. Table 8.16a summarizes these requirements. Table 8.16a Suitability for Comparison to the NAAQS-PM 2.5 Manual (Equipment) Particulate Matter 2.5 µm (manual) Parameter Code Unit Code Duration Code Equipment Method Code Frequency Method ID PM µg/m 3 LC STD Hr 7 R & P Model 2025 PM-2.5 Sequential Air Sampler w/vscc Gravimetric 145 1:1 or 1:3 EQPM or RFPS Section PM 2.5 Sampling for Comparison to the NAAQS-PM 2.5 Continuous Unsuitability The CFR requires that for PM 2.5 FEM data to be used in regulatory determinations of compliance with the PM 2.5 NAAQS, the PM 2.5 FEM samplers must operate according to FEM designation requirements. In 2014, the District received approval from the EPA Region IX authorities to operate the PM 2.5 Continuous samplers in non-fem mode. Therefore the PM 2.5 continuous samplers cannot be compared to the NAAQS. Other than operating the PM 2.5 continuous samplers in a non-regulatory manner, all District PM 2.5 FRM samplers meet or exceed all other minimum monitoring requirements and sampling frequencies.. Table 8.16b summarizes the equipment requirements. The PM 2.5 continuous samplers are an important tool to define and develop abatement strategies to curtail PM 2.5 pollution. The PM 2.5 continuous samplers are used for trends analysis and real-time reporting for public information. There are several ways to operate the PM 2.5 continuous sampler in non-fem mode. One of the conditions for FEM operational status of the PM 2.5 continuous sampler is to run it at 35% relative humidity. The District operates all PM 2.5 continuous samplers at 36% relative humidity per the manufacturer s recommendation. Table 8.16b PM 2.5 Sampling for Comparison to the NAAQS-PM 2.5 Continuous Unsuitability (Equipment) Parameter Code Unit Code Duration Code Equipment Method Code Frequency Method ID Particulate Matter 2.5 µm (continuous) PM µg/m 3 LC Hr 1 Met One BAM 1020 w/vscc Beta Attenuation 733 7/24 Not Applicable K1 40 CFR Part 58, Appendix E, Probe and Monitoring Path Siting Criteria for Ambient Air Quality Monitoring and Table E-4. K2 40 CFR Part 58.12, Subpart B, Operating Schedules.
111 Chapter 8: Particulate Matter 2.5 µm (PM 2.5 ) Page 14 of 22 Section PM 2.5 Suitability for Comparison to the NAAQS-PM 2.5 Speciation Unsuitability There are no NAAQS for the PM 2.5 Speciation program. All samplers are sited as to be able to be compared to collect valid data though. Tables 8.16c summarizes the equipment requirements. Table 8.16c PM 2.5 Suitability for Comparison to the NAAQS-PM 2.5 Speciation Unsuitability (Equipment) Particulate Matter 2.5 µm (speciated) Particulate Matter 2.5 µm (speciated) Parameter Code Unit Code Duration Code Equipment Method Code Frequency Method ID PM 2.5 CSN PM 2.5 STN See ARB or EPA See ARB or EPA See ARB or EPA See ARB or EPA See ARB or EPA See ARB or EPA 24-Hr 7 URG-3000N 24-Hr 7 Met One SASS See ARB or EPA See ARB or EPA See ARB or EPA See ARB or EPA 1:3 or 1:6 1:3 or 1:6 Not Applicable Not Applicable Particulate Matter 2.5 µm (speciated) PM 2.5 CSN -SU µg/m 3 Table 8.16b 24-Hr 7 Met One SASS Mass Balance :6 Not Applicable Section PM 2.5 Manual Operating Schedule PM 2.5 Manual samplers must operate on a specified frequency based upon several factors, e.g. maximum concentration, percentage to the NAAQS, etc. This section will list those requirements Section PM 2.5 Manual Operating Schedule-for Manual Samplers not Collocated with Continuous Samplers There is a minimum sampling frequency for the PM 2.5 manual samplers that are not collocated with a PM 2.5 continuous sampler, because the continuous samplers collect more data, a higher sampling frequency is needed for the manual methods. Table 8.17 illustrates these requirements. (d) For manual PM2.5 samplers L1 (1)(i) Manual PM2.5 samplers at required SLAMS stations without a collocated continuously operating PM2.5 monitor must operate on at least a 1- in-3 day schedule. Table 8.17 PM 2.5 Manual Operating Schedule-for Manual Samplers not Collocated with Continuous Samplers PM 2.5 Manual samplers that are NOT Collocated with PM 2.5 Continuous Sites/samplers Sites/samplers AQS ID What is the Minimum EPA Permitted Sampling Frequency? What is the Actual Sampling Frequency? (name) (#) (#) (#) :3 1: :3 1: :3 1:3 Kearny Villa Rd. Chula Vista Floyd Smith Dr. L1 40 CFR Part 58.12, Subpart B, Operating Schedules, (d) For manual PM2.5 samplers (1)(i)
112 Chapter 8: Particulate Matter 2.5 µm (PM 2.5 ) Page 15 of 22 Section PM 2.5 Manual Operating Schedule-for Manual Samplers Collocated with Continuous Samplers There is a minimum sampling frequency for the PM 2.5 manual samplers that are collocated with a PM 2.5 continuous sampler. Table 8.18 illustrates these requirements. (ii) For SLAMS PM2.5 sites with both manual and continuous PM2.5 monitors operating, Required SLAMS stations whose measurements determine the design value for their area and are within plus or minus 10% of the NAAQS; and all required sites where one or more 24-hour values have exceeded the NAAQS each year for a consecutive period of at least 3 years are required to maintain at least a 1-in-3 day sampling frequency. L2 Table 8.18 PM 2.5 Manual Operating Schedule-for Manual Samplers Collocated with Continuous Samplers PM 2.5 Manual Sites/samplers that are Collocated Sites/samplers AQS ID Within 10% of the Annual Within 10% of the 24-Hr Any Exceedance of the 24-Hr NAAQS Minimum EPA Permitted Sampling What is the Actual Sampling Frequency? with PM 2.5 Continuous Sites/samplers NAAQS? NAAQS? each year for the last 3 years Frequency without a Waiver? (name) (#) (yes/no) (yes/no) (yes/no) (#) (#) Downtown Escondido No No No No Yes Yes 1:3 1:3 1:1 1:3 Section PM 2.5 Manual Operating Schedule-for 24-Hr Design Value Samplers There is a minimum sampling frequency for the PM 2.5 manual samplers that are collocated with a PM 2.5 continuous sampler. Because the continuous samplers collect more data, a lower sampling frequency can be requested if the PM 2.5 manual samplers are not within 10% of the NAAQS. Tables 8.19 a & b illustrates these requirements. (iii) Required SLAMS stations whose measurements determine the 24-hour design value for their area and whose data are within plus or minus 5 percent of the level of the 24-hour PM2.5 NAAQS must have an FRM or FEM operate on a daily schedule if that area s design value for the annual NAAQS is less than the level of the annual PM2.5 standard. A continuously operating FEM or ARM PM2.5 monitor satisfies this requirement unless it is identified in the monitoring agency s annual monitoring network plan as not appropriate for comparison to the NAAQS. L3 Table 8.19a PM 2.5 Manual Operating Schedule-for 24-Hr Design Value Samplers, Hr Design Value 24-Hr Design Value Location Is the 24-Hr Design Value within ±5% of the NAAQS? Is a Daily (1:1) Sampling Frequency Required at the Site of Highest Concentration? Is the Site of Highest Concentration operating on a Daily (1:1) Sampling Frequency? (µg/m 3 ) (name) (yes/no) (yes/no) (yes/no) 19.6 San Diego- Beardsley No No Yes L2 40 CFR Part 58.12, Subpart B, Operating Schedules, (d) For manual PM2.5 samplers (ii) L3 40 CFR Part 58.12, Subpart B, Operating Schedules, (d) For manual PM2.5 samplers (iii)
113 Chapter 8: Particulate Matter 2.5 µm (PM 2.5 ) Page 16 of 22 The peak 24-Hr Design Value location routinely alternates between three PM 2.5 Manual sites, Escondido, Floyd Smith Dr. (El Cajon), and Downtown. Downtown is in an Environmental Justice location, so both the District and the EPA Regional IX Authorities have designated the Downtown site as the PM 2.5 Manual daily (1:1) location, rather than change the location almost yearly. Table 8.18b compares the Downtown 24-Hr Design Value data to the actual site of the Design Value location, if there is a change that year. Table 8.19b PM 2.5 Manual Operating Schedule-ACTUAL for 24-Hr Design Value Samplers, Downtown Site 24-Hr Design Value Is the Downtown Site the Actual 24-Hr ACTUAL 24-Hr Design Value Location ACTUAL 24-Hr Design Value Concentration Design Value (µg/m 3 ) (yes/no) (name) (µg/m 3 ) 19.6 Yes Downtown 19.6 Section PM 2.5 Manual Operating Schedule-NCore There is a minimum sampling frequency for the PM 2.5 manual samplers that are part of the NCore network. Table 8.20 lists these requirements. (2) Manual PM2.5 samplers at NCore stations and required regional background and regional transport sites must operate on at least a 1-in-3 day sampling frequency. L4 Table 8.20 PM 2.5 Manual Operating Schedule-NCore PM 2.5 Manual Sampler NCore Site/sampler AQS ID What is the Minimum EPA Permitted What is the Actual Sampling Frequency? Sampling Frequency? (name) (#) (#) (#) Floyd Smith Dr :3 1:3 Section PM 2.5 Speciation Operating Schedule There is a minimum sampling frequency for the PM 2.5 samplers that are part of the speciation Trends Network (STN). Table 8.21 list these requirements. L5 (3) Manual PM2.5 speciation samplers at STN stations must operate on at least a 1-in-3 day sampling frequency. B5 Table 8.21 PM 2.5 Speciation Operating Schedule-NCore PM 2.5 STN Sampler Location Site/sampler AQS ID What is the Minimum EPA Permitted Sampling Frequency? What is the Actual Sampling Frequency? (name) (#) (#) (#) Floyd Smith Dr :3 1:3 L4 40 CFR Part 58.12, Subpart B, Operating Schedules, (d) For manual PM2.5 samplers (2) L5 40 CFR Part 58.12, Subpart B, Operating Schedules, (d) For manual PM2.5 samplers (3)
114 Concentration (ug/m3) 2015 Network Plan Chapter 8: Particulate Matter 2.5 µm (PM 2.5 ) Page 17 of 22 Maximum 24-Hr Concentration (µg/m 3 ) Days above the National Std Section PM 2.5 Manual Concentrations for San Diego As with the State, PM 2.5 concentrations in the San Diego Air Basin have declined over the years. This section will illustrate the different metrics for comparison. Section PM 2.5 Manual Concentrations for San Diego-for the Last 20 Years Annual average PM 2.5 FRM concentrations in the County have declined over the years, see Table The high maximum 24-Hr concentrations measured in 2003 and 2007 were due to severe wildfires that occurred in Southern California. The 98th percentile of 24-Hr PM 2.5 concentrations showed substantial variability within this period, a reflection of changes in meteorology and the influence of the 2003 and 2007 wildfires. Furthermore, the standard was lowered in 2007, which corresponded to an increased incidents of Days above the Standard. Note: the Days Above the Standard row in Table 8.22 reflects the PM 2.5 standard for that year. Figure 8.1 graphs the SDAB PM 2.5 trends over the years. Table 8.22 PM 2.5 Manual Concentrations for San Diego-for the Last 20 Years (24-Hr), * * n/a n/a n/a n/a n/a n/a n/a n/a n/a= not applicable *Wildfires in San Diego County Figure 8.1PM 2.5 Manual Concentrations for San Diego-for the Last 20 Years (24-Hr) Graph, PM Hr Maximum Concentrations for the last 20 Years Years
115 *ESC DTN FSD KVR CVA Concentration (ug/m3) Manual Method 2015 Network Plan Chapter 8: Particulate Matter 2.5 µm (PM 2.5 ) Page 18 of 22 Section PM 2.5 Manual Concentrations for San Diego-by Site for the Year Table 8.23 lists the maximum PM 2.5 Manual measurements for each PM 2.5 Manual method monitoring locations in Table 8.23 and Figure 8.2 shows the values graphically with respect to the National Standard. Note the NAAQS is calculated as a Design Value and these measurements are for the calendar year; therefore, the comparison to the NAAQS is for informational purpose only. Table 8.23 PM 2.5 Manual Concentrations for San Diego-by Site for the Year (24-Hr & Annual Average), 2015 No Site Site Annual Abbreviation Average Maximum Concentration For 24-Hr Days Above the National Standard (#) (name) (µg/m 3 ) (µg/m 3 ) (#) 1 Escondido* ESC San Diego-Beardsley DTN Floyd Smith Dr FSD Kearny Villa Rd KVR Chula Vista CVA *Not sampled for an entire year Figure 8.2 PM 2.5 Manual Concentrations for San Diego-by Site for the Year (24-Hr & Annual Average) Graph, PM 2.5 (FRM/Manual) Concentrations (24-Hr Max & Annual Avg) for the Year Hr Std** (35 µg/m 3 ) Annual Std** (12 µg/m 3 ) Site Maximum 24-Hr Concentration Annual Average *Not sampled for an entire year ** The NAAQS is calculated as a Design Value and these measurements are for the calendar year; therefore, the comparison to the NAAQS is for informational purpose only.
116 Manual Method Manual Method 2015 Network Plan Chapter 8: Particulate Matter 2.5 µm (PM 2.5 ) Page 19 of 22 Section PM 2.5 Manual Concentrations for San Diego-by Site for the Design Value (24-Hr) Table 8.24a lists the maximum PM 2.5 Manual 24-Hr measurements for each PM 2.5 Manual method monitoring location in Table 8.24a and Figure 8.3 shows the values graphically with respect to the National Standard. Table 8.24a PM 2.5 Manual Concentrations for San Diego-by Site for the Design Value (24-Hr), No Site Site Abbrev Design Value Maximum Concentration for 24-Hr Days Above the NAAQS Is the 24-Hr Design Value 85% of the NAAQS? Is the 24-Hr Design Value < 85% of the NAAQS? Does the 24-Hr Design Value Meet the NAAQS? (#) (name) (µg/m 3 ) (#) (yes/no) (yes/no) (yes/no) 1 *Escondido ESC No Yes Yes 2 San Diego- DTN Beardsley No Yes Yes 3 El Cajon & ECA & Floyd Smith Dr FSD No Yes Yes 4 Kearny Villa Rd KVR No Yes Yes 5 Chula Vista CVA No Yes Yes *Not sampled for an entire year, so the Design Values are incomplete Section PM 2.5 Manual Concentrations for San Diego-by Site for the Design Value (Annual Average) Table 8.24b lists the PM 2.5 Manual annual average Design Value measurements for each PM 2.5 Manual method monitoring location in Table 8.24b and Figure 8.3 shows the values graphically with respect to the National Standard. Table 8.24b PM 2.5 Manual Concentrations for San Diego-by Site for the Design Value (Annual Average), No Site Site Abbrev Design Value for the Annual Avg Days Above the NAAQS Is the Annual Avg Design Value 85% of the NAAQS? Is the Annual Avg. Design Value < 85% of the NAAQS? Does the Annual Avg Design Value Meet the NAAQS? (#) (name) (µg/m 3 ) (#) (yes/no) (yes/no) (yes/no) 1 *Escondido ESC No Yes Yes 2 San Diego- DTN Beardsley No Yes Yes 3 El Cajon & ECA & Floyd Smith Dr FSD No Yes Yes 4 Kearny Villa Rd KVR No Yes Yes 5 Chula Vista CVA No Yes Yes *Not sampled for an entire year, so the Design Values are incomplete
117 Concentration (ug/m3) 2015 Network Plan Chapter 8: Particulate Matter 2.5 µm (PM 2.5 ) Page 20 of 22 Figure 8.3 PM 2.5 Manual Concentrations for San Diego-by Site for the Design Value (24-Hr & Annual Average) Graph, PM 2.5 Manual Concentrations 24-Hr Maximum & Annual Average Design Values Hr Std (35 µg/m 3 ) ESC DTN FSD & ECA KVR CVA Annual Avg Std (12 µg/m 3 ) Site Maximum 24-Hr Concentration Annual Average *Not sampled for an entire year, so the Design Values are incomplete
118 *ESC DTN *SAY *DVN CMP ALP Concentration (ug/m3) Continuous Method 2015 Network Plan Chapter 8: Particulate Matter 2.5 µm (PM 2.5 ) Page 21 of 22 Section PM 2.5 Continuous Concentrations for San Diego All District PM 2.5 continuous samplers cannot be compared to the NAAQS, because they are nonregulatory units; therefore, the values cannot be compared to the PM 2.5 standards and can only be used for trends analysis and public informational use. ALL PM 2.5 continuous samplers are operated at 36% relative humidity, which makes them non-regulatory. Section PM 2.5 Continuous Concentrations for San Diego-by Site for the Year (24-Hr & Annual Average) Table 8.25 lists the maximum PM 2.5 continuous 24-Hr measurements and Annual Average for each PM 2.5 continuous monitoring location and Figure 8.4 shows the values graphically. The measurements are not the Design Value (Yearly only). Table 8.25 PM 2.5 Continuous Concentrations for San Diego-by Site for the Year (24-Hr & Annual Average), 2015 No. Site Site Maximum Annual Abbreviation Concentration Average for 24-Hr (#) (name) (µg/m 3 ) (µg/m 3 ) 1 *Escondido ESC SD-Beardsley DTN *San Ysidro SAY *Donovan DVN Camp Pendleton CMP Alpine ALP *Not sampled for an entire year Figure 8.4 PM 2.5 Continuous Yearly 24-Hr & Annual Average Measurements by Site Graph, 2015 PM2.5 Continuous 24-Hr Measurements by Site for the Year **24-Hr Std (35 µg/m 3 ) **Annual Std (12 µg/m 3 ) Site Maximum 24-Hr Concentration Annual Average *Not sampled for an entire year ** The measurements are not the Design Value (Yearly only) and all PM 2.5 continuous samplers are not regulatory; therefore the values cannot be compared to the PM 2.5 standards and can only be used for trends analysis and public informational use.
119 *ESC DTN *SAY *DVN CMP ALP Concentration (ug/m3) Continuous Method 2015 Network Plan Chapter 8: Particulate Matter 2.5 µm (PM 2.5 ) Page 22 of 22 Section PM 2.5 Continuous Concentrations for San Diego-by Site for the Design Value (24-Hr & Annual Average) Table 8.26 lists the maximum PM 2.5 continuous 24-Hr measurements and Annual Average for each PM 2.5 continuous monitoring location and Figure 8.5 shows the values graphically. While the measurements are the Design Value, all PM 2.5 continuous samplers are not regulatory; therefore the values cannot be compared to the PM 2.5 standards and can only be used for trends analysis and public informational use. Table 8.26 PM 2.5 Continuous Concentrations for San Diego-by Site for the Design Value (24-Hr & Annual Average), No. Site Site Abbreviation Design Value Maximum Concentration for 24-Hr Design Value Annual Average (#) (name) (µg/m 3 ) (µg/m 3 ) 1 *Escondido ESC SD-Beardsley DTN *San Ysidro SAY *Donovan DVN Camp Pendleton CMP Alpine ALP *Not sampled for an entire year, so the Design Values are incomplete Figure 8.5 PM 2.5 Continuous Concentrations for San Diego-by Site for the Design Value (24-Hr & Annual Average) Graph, PM2.5 Continuous 24-Hr Measurements by Site for the Year **24-Hr Std (35 µg/m 3 ) **Annual Std (12 µg/m 3 ) Site Maximum 24-Hr Concentration Annual Average *Not sampled for an entire year, so the Design Values are incomplete ** All PM 2.5 continuous samplers are not regulatory; therefore the values cannot be compared to the PM 2.5 standards and can only be used for trends analysis and public informational use.
 and referenced to the PM 10 standards of the year (Table 9.0). The equipment are listed in Table 9.1. There is a PM 10 (Lo-Vol) sampler at the Floyd Smith Dr.")
.")
120 Chapter 9: Particulate Matter 10 µm (PM 10 ) Page 1 of 8 Chapter 9 Particulate Matter 10 µm (PM 10 ) Section PM 10 Introduction PM 10 was sampled for at locations throughout the SDAB (Figure 9.0) and referenced to the PM 10 standards of the year (Table 9.0). The equipment are listed in Table 9.1. There is a PM 10 (Lo-Vol) sampler at the Floyd Smith Dr. (FSD) location that is also part of the paired Lo-Vol samplers needed to calculate PMcoarse. Please Note: In 2015, the Escondido station was temporarily shut-down (see the Overview chapter for more information). In 2013, the El Cajon Station was temporarily relocated to the Gillespie Field area off of Floyd Smith Drive (FSD). Figure 9.0 PM 10 Overall Map Table 9.0 PM 10 State and National Standards for the Year
121 Chapter 9: Particulate Matter 10 µm (PM 10 ) Page 2 of 8 Table 9.1 PM 10 Sampling Network Abbreviation CVA DVN FSD ESC KVR DTN Name Chula Vista Donovan Floyd Smith Dr. Escondido Kearny Villa Rd Address Latitude Longitude 80 E. J St Alta Rd Floyd Smith Dr E. Valley Pkwy Kearny Villa Rd San Diego Beardsley 1110A Beardsley St AQS ID Monitor Type SLAMS SLAMS SLAMS SLAMS SLAMS SLAMS SLAMS Designation O QAC O O O O O PM10 Method SI SI SI SI SI SI SI Affiliation Not Applicable Not Applicable Not Applicable NCORE Not Applicable Not Applicable Spatial Scale NS NS NS NS NS NS NS Site Type PE PE HC PE PE PE PE Objective (Federal) Not Applicable NAAQS NAAQS NAAQS NAAQS NAAQS NAAQS NAAQS Frequency 1:6 1:6 1:6 1:3 1:6 1:6 1:6 Equipment Graseby Metal Works body w/ Sierra Anderson 1200 Head Graseby Metal Works body w/ Sierra Anderson 1200 Head Graseby Metal Works body w/ Sierra Anderson 1200 Head 2025 w/o Very Sharp Cut Cyclone Graseby Metal Works body w/ Sierra Anderson 1200 Head Graseby Metal Works body w/ Sierra Anderson 1200 Head Graseby Metal Works body w/ Sierra Anderson 1200 Head Glossary of Terms Monitor Type Method (Sampling/Analysis) Affiliation E= EPA CL= Chemiluminescence BG= Border Grant O= Other CT= Low Volume, size selective inlet, continuous CSN STN= Trends Speciation SLAMS= State & Local monitoring station FL= Fluorescence CSN SU= Supplemental Speciation SPM= Special purpose monitor HV= High volume NATTS= National Air Toxics Trends Stations CATAC= California Toxics Monitoring IR= Nondispersive infrared NCORE= National Core Multi-pollutant SI= High volume, size selective inlet Monitoring Stations SP= Low volume, size selective inlet, speciated NR= Near-road Q= Low volume, size selective inlet, sequential PAMS= Photochemical Assessment Monitoring UV= Ultraviolet absorption Stations Site Type Canister= Evacuated stainless steel canisters UNPAMS= Unofficial PAMS site EXDN= Extreme downwind Cartridges= Di-nitrophenylhydrazine cartridges HC= Highest concentration FSL= Fused Silica Lined Monitor Designation MXO= Maximum ozone concentration Filter= Quartz filters PRI= Primary MXP= Maximum precursor impact QAC= Collocated PE= Population exposure O= Other SO= Source oriented UPBD= Upwind background Spatial Scale Objective (Federal) G/B= General/Background MI= Micro NAAQS= Suitable for NAAQS comparison RT= Regional Transport MS= Middle Research= Research support WRI= Welfare related impacts NS= PI= Public Information QA= Quality assurance US= Urban Scale
122 Chapter 9: Particulate Matter 10 µm (PM 10 ) Page 3 of 8 Section PM 10 Minimum Monitoring Requirements The District is federally mandated to monitor PM 10 levels in accordance with the CFR. This section will state the different monitoring requirements for each program, e.g. ambient, NCore, etc. that the District operates and references therein (Note: only the passages applicable/informative to the District are referenced). These monitors can serve as fulfilling other PM 10 network requirements, e.g. ambient PM 10 sampler can fulfill a NCore PM 10 sampler requirement. The District meets or exceeds all minimum requirements for PM 10 monitoring for all programs. Section PM 10 Minimum Monitoring Requirements-Ambient All Districts are required to operate a minimum number of PM 10 samplers irrespective of the PM 10 network affiliation. These monitors can serve as fulfilling other PM 10 network requirements, e.g. ambient PM 10 sampling can fulfill a NCore PM 10 sampling requirement. To ascertain the minimum number of samplers required, the Highest Concentration value must be calculated. Tables 9.2a - 9.2b summarizes these requirements. 4.6 Particulate Matter (PM10) Design Criteria A (a) Table D-4 indicates the approximate number of permanent stations required in MSAs to characterize national and regional PM10 air quality trends and geographical patterns. The number of PM10 stations in areas where MSA populations exceed 1,000,000 must be in the range from 2 to 10 stations, while in low population urban areas, no more than two stations are required. A range of monitoring stations is specified in Table D-4 because sources of pollutants and local control efforts can vary from one part of the country to another and therefore, some flexibility is allowed in selecting the actual number of stations in any one locale. Modifications from these PM10 monitoring requirements must be approved by the Regional Administrator. Table D 4 of Appendix D to Part 58 PM 10 Minimum Monitoring Requirements (Approximate Stations Per MSA) Population High Concentration Category (120% of NAAQS) Medium Concentration (>80% of NAAQS) Low Concentration (<80% of NAAQS) >1,000, Table 9.2a PM 10 Minimum Monitoring Requirement-Design Criteria for the Year (24-Hr), 2015 Site of Expected Maximum Concentration Site of Expected Maximum Concentration AQS ID Maximum Concentration for 24-hrs Does the 24-Hr Design Value meet the NAAQS? High Concentration Is the 24-Hr Design Value 120% of the NAAQS? Medium Concentration Is the 24-Hr Design Value > 80% of the NAAQS? Low Concentration Is the 24-Hr Design Value < 80% of the NAAQS? (name) (#) (µg/m 3 ) (yes/no) (yes/no) (yes/no) (yes/no) Donovan Yes No No Yes A 40 CFR Part 58, Appendix D, Network Design Criteria for Ambient Air Quality Monitoring, Section 4, Pollutant-Specific Design Criteria for SLAMS Sites, part 4.6 Particulate Matter (PM 10) Design Criteria and Table D-4
123 Chapter 9: Particulate Matter 10 µm (PM 10 ) Page 4 of 8 Table 9.2b PM 10 Minimum Monitoring Requirements-Ambient MSA County Population Estimated from 2010 Census Minimum PM 10 Samplers Required Active PM 10 Samplers Needed PM 10 Samplers (name) (name) (#) (#) (#) (#) San San None Diego Diego million (Low Concentration) Section PM 10 Minimum Monitoring Requirements-NCore The District is required to operate a PM 10 sampler as part of the NCore multipollutant monitoring program. This program was designed to measure pollutants at lower levels, as well as other pollutants. For the NCore program, the District is required to collect PM coarse (PM ) data. PM coarse data is the obtained by operating collocated PM 10 and PM 2.5 samplers of the same make and model and on the same sampling frequency. The PM 2.5 concentrations are then subtracted from the PM 10 concentrations to get the PM coarse fraction. Table 9.3 lists the NCore PM 10 requirements. 3. Design Criteria for NCore Sites B (b) The NCore sites must measure, at a minimum, PM 2.5 particle mass using continuous and integrated/filter-based samplers, speciated PM 2.5, PM particle mass, speciated PM , O 3, SO 2, CO, NO/NOy, wind speed, wind direction, relative humidity, and ambient temperature. Table 9.3 PM 10 Minimum Monitoring Requirements-NCore Minimum PM 10 samplers Required for NCore Sites Total PM 10 samplers Active at NCore Sites Total PM 10 samplers Needed at NCore Sites NCore Sites/Locations NCore Sites/Locations AQS ID (#) (#) (#) (name) (#) 1 1 None Floyd Smith Dr. (FSD) Section PM 10 Minimum Monitoring Requirements-Summary Table 9.4 summarizes all the PM 10 minimum monitoring requirements from Sections Table 9.4 PM 10 Minimum Monitoring Requirements-Summary CFR Programs Requirements for Active PM 10 samplers PM 10 samplers Minimum PM 10 samplers Required Needed PM 10 samplers (name) (#) (#) (#) CFR EPA Table D-2 only= None NCore only= 1 1 None B 40 CFR Part 58, Appendix D, Network Design Criteria for Ambient Air Quality Monitoring, Section 3, Design Criteria for NCore Sites, subsection (b).
124 NCore Ambient 2015 Network Plan Chapter 9: Particulate Matter 10 µm (PM 10 ) Page 5 of 8 Section PM 10 Suitability for Comparison to the NAAQS Many different criteria all required for PM10 data to be considered to be suitable for comparison to the NAAQS, e.g. siting, sampling frequency, etc. This section will state those criteria. Section PM 10 Suitability for Comparison to the NAAQS, Equipment & Siting The CFR requires that for PM 10 data to be used in regulatory determinations of compliance with the PM 10 NAAQS, the PM 10 monitors must be sited according to Federal Regulations C1. All District PM 10 samplers meets or exceeds all minimum monitoring and can be compared to the NAAQS. Table 9.5a summarizes these requirements. Table 9.5a PM 10 Suitability for Comparison to the NAAQS, Equipment & Siting Parameter Code Unit Code Duration Code Equipment Method Code Frequency Method ID Particulate Matter 10 µm (Hi-Vol) PM µg/m 3 LC STD Hr 7 Graseby Metal Works 2000H w/ Sierra Anderson 1200 Head Gravimetric :6 RFPS Particulate Matter 10 µm (Lo-Vol) PM µg/m 3 LC STD Hr 7 R & P Model 2025 PM-2.5 Sequential Air Sampler w/ovscc Gravimetric :3 RFPS Section PM 10 Suitability for Comparison to the NAAQS, Sampling Frequency The CFR requires that for PM 10 data to be used in regulatory determinations of compliance with the PM 10 NAAQS, the PM 10 monitors sampling frequency must be in accordance with Federal regulations C2. All District PM 10 samplers meets or exceeds all minimum monitoring requirements for the sampling frequency and can be compared to the NAAQS. Tables 9.5b summarize these requirements. Table 9.5b PM 10 Suitability for Comparison to the NAAQS, Sampling Frequency Site of Expected Maximum Concentration Site of Expected Maximum Concentration Maximum Concentration for 24-hrs Is the Ratio of the Maximum Concentration What is the Minimum EPA Permitted What is the Actual Sampling Frequency? AQS ID < 0.8 to the NAAQS Sampling Frequency? (name) (#) (µg/m 3 ) (yes/no) (#) (#) Donovan No 1:6 1:6 Section PM 10 Concentrations for San Diego PM 10 concentrations do not correlate well to growth in population or vehicle usage, and high PM 10 concentrations do not always occur in high population areas. Emissions from stationary sources and motor vehicles form secondary particles that contribute to PM 10 in many areas. This section will illustrate the different metrics for comparison. C1 40 CFR Part 58, Appendix E, Probe and Monitoring Path Siting Criteria for Ambient Air Quality Monitoring and Table E-4. C2 40 CFR Part 58.12, Subpart B, Operating Schedules.
125 Concentration (ug/m3) 2015 Network Plan Chapter 9: Particulate Matter 10 µm (PM 10 ) Page 6 of 8 Maximum 24-Hr Concentration (µg/m 3 ) Days above the National Standard Section PM 10 Concentrations for San Diego-for the Last 20 Years The three-year average of the annual average shows a large decrease; however, there is a great deal of variability from year-to-year. Much of this variability is due to meteorological conditions rather than changes in emissions. Due to the firestorms of 2003 and 2007, the annual average exceeded the National 24-hr standard for those years. The firestorms are considered as exceptional events and they do not have a lasting impact in the SDAB. Even with the last two firestorms, the County still qualifies for attainment status. Note: the Days Above the National 24-Hr Standard row in Table 9.6 and Figure 9.1 reflect the PM 10 standard for that year. Table 9.6 PM 10 Concentrations for San Diego-for the Last 20 Years, Figure 9.1 PM 10 Concentrations for San Diego-for the Last 20 Years Graph, PM10 Concentrations for the last 20 Years Years Maximum 24-Hr Concentration
126 Concentration (ug/m3) 2015 Network Plan Chapter 9: Particulate Matter 10 µm (PM 10 ) Page 7 of 8 Section PM 10 Concentrations for San Diego-by Site at Standard Conditions (STD) for the Year (24-Hr & Annual Average) All data from the PM 10 samplers are reported in STD conditions, as can be seen in Table 9.7 and Figure 9.2. The PM 10 (Lo-Vol) sampler presents the data in LC and must be converted to STD conditions. Table 9.7 PM 10 Concentrations for San Diego-by Site at Standard Conditions (STD) for the Year (24-Hr & Annual Average), 2015 No. Site Site Abbreviation Annual Average Maximum Concentration for 24-hrs Days Above the National Standard (#) (µg/m 3 ) (µg/m 3 ) (#) 1 Chula Vista CVA Donovan DVN Floyd Smith Dr. (Lo-Vol) FSD Escondido ESC 30 * Kearny Villa Road KVR San Diego-Beardsley DTN *Insufficient data; not operational for a sufficient number of months in 2015 for a comparable annual average. Figure 9.2 PM 10 Concentrations for San Diego-by Site at Standard Conditions (STD) for the Year (24-Hr & Annual Average), 2015 PM10 Concentrations by Site at STD Conditions for the Year (24-Hrs & Annual Avg) CVA DVN FSD *ESC KVR DTN 24-Hr Std (150 µg/m 3 ) Site Maximum 24-Hr Concentration Annual Average *Insufficient data; not operational for a sufficient number of months in 2015 for a comparable annual average.
127 Concentration (ug/m3) 2015 Network Plan Chapter 9: Particulate Matter 10 µm (PM 10 ) Page 8 of 8 Section PM 10 Concentrations for San Diego-by Site at Local Conditions (LC) for the Year (24-Hr & Annual Average) Table 9.8 and Figure 9.3 illustrate the data in Local Conditions (LC). Note the NAAQS is written for STD conditions; therefore the concentrations calculated to Local Conditions (LC) conditions are not comparable to the NAAQS. Table 9.8 PM 10 Concentrations for San Diego-by Site at Local Conditions (LC) for the Year (24-Hr & Annual Average), 2015 No. Site Site Abbreviation Maximum Concentration for 24-hrs Annual Average (#) (µg/m 3 ) (µg/m 3 ) 1 Chula Vista CVA Donovan DVN Floyd Smith Dr. (Lo-Vol) FSD Escondido ESC 31 * Kearny Villa Rd. KVR San Diego-Beardsley DTN *Insufficient data; not operational for a sufficient number of months in 2015 for a comparable annual average Figure 9.3 PM 10 Concentrations for San Diego-by Site at Local Conditions (LC) for the Year Graph (24-Hr & Annual Average), 2015 PM10 Concentrations by Site at Local Conditions for the Year (24-Hrs & Annual Avg) CVA DVN FSD *ESC KVR DTN 24-Hr Std** (150 µg/m 3 ) Site Maximum 24-Hr Concentration Annual Average *Insufficient data; not operational for a sufficient number of months in 2015 for a comparable annual average. **Note: the NAAQS is written for STD conditions; therefore the concentrations calculated to Local Conditions (LC) are not comparable to the NAAQS. The listed NAAQS is for informational purposes only.
 Page 1 of 4 Chapter 10")
128 Chapter 10: National Core (NCore) Page 1 of 4 Chapter 10 National Core (NCore) Section NCore Introduction National Core (NCore) is a multi-pollutant network that integrates several advanced measurement systems for particles, as well as pollutant gases with the existing equipment for a Photochemical Assessment Monitoring Station (PAMS). The EPA designated the El Cajon station (Figure 10.0) as the NCore site for the SDAB, so additional instrumentation that includes, PMcoarse (values calculated from paired Low- Volume particulate samplers, by subtracting the measured concentrations from a PM 2.5 Low Volume sampler from the measured concentrations from a PM 10 Low Volume sampler, CO (trace level), SO 2 (trace level), NOy (Reactive Nitrogen Oxides), and Lead-TSP (Pb-TSP). Please note: The El Cajon station was temporarily relocated to the Gillespie Field area off of Floyd Smith Drive, this station is called Floyd Smith Drive (FSD). NOy, PM 2.5 continuous, and meteorological sampling has been suspended at the temporary location. Once the District relocates to the original El Cajon location, NOy, PM 2.5 continuous and meteorological parameters will resume sampling. The criteria gaseous pollutants for trace, ambient, and total levels, are referenced to ambient standards from the NAAQS Standards of that year. Figure 10.0 NCore Network Map
129 Chapter 10: National Core (NCore) Page 2 of 4 Section NCore Minimum Monitoring Requirements The District is required to operate monitors as part of the NCore multipollutant monitoring program. This program was designed to measure pollutants at lower levels, low ppb-ppt range. Tables 10.1a-b summarize these requirements. The District meets or exceeds all minimum requirements for NCore monitoring except for the following: NOy monitoring (highlighted in red) Meteorological monitoring (highlighted in red) PM 2.5 continuous monitoring (highlighted in red) 3. Design Criteria for NCore Sites A (b) The NCore sites must measure, at a minimum, PM 2.5 particle mass using continuous and integrated/filter-based samplers, speciated PM 2.5, PM particle mass, speciated PM , O 3, SO 2, CO, NO/NOy, wind speed, wind direction, relative humidity, and ambient temperature. NCore sites in CBSA with a population of 500,000 people (as determined in the latest Census) or greater shall also measure Pb either as Pb-TSP or Pb-PM 10. Table 10.1a NCore Minimum Monitoring Requirements MSA County Population Estimated from 2010 Census Minimum Sites Required Active Sites (#) (#) (#) San Diego San Diego 3.3 million Sites Needed 1 1 None Table 10.1b NCore Minimum Monitoring Requirements-Equipment Parameters O 3 NOy Minimum Number of Monitors Required (#) Active Monitors (#) Monitors Needed (#) CO- TLE SO 2 - TLE Pb- TSP PM Manual PM Continuous PMcoarse Wind Speed/ Wind Direction/ External Temperature/ %Relative Humidity each= 1 set 1 0* * 1 0* None None* None None None None None* None None* *The FSD NCore location is temporary. Because FAA approval would be needed to erect the NOy and meteorological sensor towers, the EPA waived these NCore requirements at the FSD location. The PM 2.5 continuous sampler could not be installed, maintained, calibrated, and audited safely at the FSD location. Once EPA was informed, this requirement was likewise suspended. A 40 CFR Part 58, Subpart G-Federal Monitoring, Appendix D, Section 3-Design Criteria for NCore sites
130 Chapter 10: National Core (NCore) Page 3 of 4 Section NCore Suitability for Comparison to the NAAQS Requirements for the sampling frequency of monitors for NCore pollutants are in the 40 CFR Part 58- Ambient Air Quality Surveillance, Subpart B, Section Operating Schedules and are shown in Table Table 10.2 NCore Suitability for Comparison to the NAAQS-Frequency & Equipment Parameter Code Unit Code Duration Code Equipment Method Code Sampling Frequency Method ID Ozone O ppm Hr 1 49 series Ultraviolet absorption 047 7/24 EQOA Carbon monoxide Trace Level CO ppb Hr 1 48i-TLE Nondispersive infrared 554 7/24 RFCA Sulfur dioxide Trace Level SO ppb Hr 1 5-min 43i-TLE Fluorescence 560 7/24 EQSA Lead Pb Particulate Matter 2.5 µm (non-speciated) Particulate Matter 2.5 µm (speciated) PM PM 2.5 CSN See EPA µg/m 3 LC µg/m 3 LC STD See EPA Hr See EPA 24-Hr 7 Tisch TE-5170 BLVFC+ R & P Model 2025 PM-2.5 Sequential Air Sampler w/vscc 24-Hr 7 URG-3000N ICP/MS Acid filter extract with hot nitric acid Gravimetric See EPA 192 1:6 EQL See EPA 1:3 EQPM or RFPS :3 Not Applicable Particulate Matter 2.5 µm (speciated) PM 2.5 STN See EPA See EPA See EPA 24-Hr 7 Met One SASS See EPA See EPA 1:3 Not Applicable Particulate Matter 10 µm (Hi-Vol) PM µg/m 3 LC STD Hr 7 Graseby Metal Works 2000H w/ Sierra Anderson 1200 Head Gravimetric :3 RFPS
131 Chapter 10: National Core (NCore) Page 4 of 4 Section NCore Concentrations for San Diego The instrumentation needed for NCore designation are: PMcoarse (calculated values from paired PM 10 & PM 2.5 Low Volume samplers); CO (trace level); SO 2 (trace level); NOy (total reactive Nitrogen Oxides); and, Pb-TSP (not operational until the 1 st Qtr of 2012). Tables 10.3a-10.3e list the trend data. Table 10.3a NCore Concentrations for San Diego-PMCoarse *PMcoarse (µg/m 3 ) Max. 24-Hr. Concentration th Percentile of 24-Hr Concentration Average of the Quarterly Means *Note: PMcoarse (PMc) does not have FRM or FEM designation and cannot be compared to any NAAQS. FSD and ECA were combined Table 10.3b NCore Concentrations for San Diego-CO-TLE CARBON MONOXIDE (ppm) Maximum 1-Hr. Concentration Maximum 8-Hr. Concentration Table 10.3c NCore Concentrations for San Diego-SO 2 -TLE SULFUR DIOXIDE (ppm) Maximum 1-Hr SO Maximum 24-Hr SO Annual Average SO Table 10.3d1 NCore Concentrations for San Diego-NOy-NO *NOy NO (ppm) Maximum 1-Hr. Concentration ** ** Annual Average ** ** **The NOy sampler is not operational at the temporary NCore location; once we relocate back, NOy sampling will resume Table 10.3d2 NCore Concentrations for San Diego-NO 2 *NO 2 (ppm) Maximum 1-Hr. Concentration Annual Average * *Not sampled for an entire year, so no calculations Table 10.3e NCore Concentrations for San Diego-Pb LEAD (µg/m 3 ) Annual Average Maximum 3-Month Average
. KVR, is a PAMS- Carbonyl site, but due to irreparable failure of the sampler in late 2011, sampling was halted. As yet, there are no NAAQS standards to compare the data.")
132 Chapter 11: Photochemical Assessment Monitoring Stations (PAMS) Page 1 of 10 Chapter 11 Photochemical Assessment Monitoring Stations (PAMS) Section PAMS Introduction PAMS and PAMS-related sampling was conducted at four sites (see Figure 11.0). KVR, is a PAMS- Carbonyl site, but due to irreparable failure of the sampler in late 2011, sampling was halted. As yet, there are no NAAQS standards to compare the data. The locations and equipment are listed in Table Please note: The El Cajon station was temporarily relocated to the Gillespie Field area off of Floyd Smith Drive, this station is called Floyd Smith Drive (FSD). PAMS-VOCs at CMP, ALP and ECA PAMS-Carbonyls at KVR and ECA Unofficial PAMS-Carbonyls at DTN Figure 11.0 PAMS (Carbonyls and VOCs) Network Map The range of compounds for the PAMS program is in excess of 50 different possible ozone precursors and other compounds (See Tables 11.1b and 11.1c). The toxicity is gauged by risk factors instead of limits.
133 PAMS 2015 Network Plan Chapter 11: Photochemical Assessment Monitoring Stations (PAMS) Page 2 of 10 Table 11.0 PAMS Sampling Network Abbreviation ALP CMP FSD DTN KVR 1 Name Alpine Camp Pendleton Floyd Smith Dr. Address Latitude Longitude 2495A W. Victoria Dr W. B St Floyd Smith Dr San Diego Beardsley 1110A Beardsley St Kearny Villa Rd Kearny Villa Rd AQS ID Monitor Type SLAMS SLAMS SLAMS SLAMS SLAMS UNPAMS SLAMS Method Canister Canister Canister Canister Cartridges Cartridges Cartridges Affiliation PAMS (Type III) PAMS (Type I) PAMS (Type I) PAMS (Type II) PAMS (Type II) UNPAMS PAMS (Type II) Spatial Scale US NS NS NS NS NS NS Site Type MXO UPBD QA MXP MXP MXP MXP Objective (Federal) Research Research Research Research Research Research Research Analysis By APCD APCD APCD APCD APCD APCD APCD Frequency 1:6 1:6 1:6 1:6 1:6 1:6 1:6 Equipment Xontech 910/912 Xontech 910/912 Xontech 910/912 1 The station is still classified as a PAMS-Carbonyl location, but due to irreparable failure of the carbonyl collection sampler, the APCD was directed by the EPA to put the sampling on hiatus until the EPA can redesign the PAMS network. Glossary of Terms Monitor Type Method (Sampling/Analysis) Affiliation E= EPA CL= Chemiluminescence BG= Border Grant O= Other CT= Low Volume, size selective inlet, continuous CSN STN= Trends Speciation SLAMS= State & Local monitoring station FL= Fluorescence CSN SU= Supplemental Speciation SPM= Special purpose monitor HV= High volume NATTS= National Air Toxics Trends Stations CATAC= California Toxics Monitoring IR= Nondispersive infrared NCORE= National Core Multi-pollutant SI= High volume, size selective inlet Monitoring Stations SP= Low volume, size selective inlet, speciated NR= Near-road Q= Low volume, size selective inlet, sequential PAMS= Photochemical Assessment Monitoring UV= Ultraviolet absorption Stations Site Type Canister= Evacuated stainless steel canisters UNPAMS= Unofficial PAMS site EXDN= Extreme downwind Cartridges= Di-nitrophenylhydrazine cartridges HC= Highest concentration FSL= Fused Silica Lined Monitor Designation MXO= Maximum ozone concentration Filter= Quartz filters PRI= Primary MXP= Maximum precursor impact QAC= Collocated PE= Population exposure O= Other SO= Source oriented UPBD= Upwind background Spatial Scale Objective (Federal) G/B= General/Background MI= Micro NAAQS= Suitable for NAAQS comparison RT= Regional Transport MS= Middle Research= Research support Xontech 910/912 Xontech 925 Xontech 924 WRI= Welfare related impacts NS= PI= Public Information QA= Quality assurance US= Urban Scale Xontech 925
134 Chapter 11: Photochemical Assessment Monitoring Stations (PAMS) Page 3 of 10 Section PAMS Minimum Monitoring Requirements The PAMS program is a multipronged approached to understand, predict, and control ozone concentrations. Ozone is not emitted directly; it is created by the interactions of several different pollutants/emissions, e.g. oxides of nitrogen (NOx), and volatile organic compounds (VOC), some carbonyls, etc. This enhanced monitoring network to track these different emissions has several different monitoring requirements, e.g. laboratory needs, meteorological needs, etc. that the District operates and references therein (Note: only the passages applicable/informative to the District are referenced). This section will state these requirements. Some of these monitors or samplers can serve as fulfilling other network requirements, e.g. ambient O 3 monitor can fulfill a PAMS O 3 monitoring requirement. The District meets or exceeds all minimum requirements for PAMS monitoring except for the following: Carbonyl sampling at Kearny Villa Rd. (highlighted in red) Upper Air Meteorology at Kearny Villa Rd. (highlighted in red) Section PAMS Minimum Monitoring Requirements-Sampling Season (24-Hr & 3-Hr) The District is required to operate equipment required for the PAMS parameters for a minimum sampling period. Table 11.1 lists these requirements. 5.2 Monitoring Period. PAMS precursor monitoring must be conducted annually throughout the months of June, July and August (as a minimum) when peak O3 values are expected in each area. Alternate precursor monitoring periods may be submitted for approval to the Administrator as a part of the annual monitoring network plan required by A Table 11.1 PAMS Minimum Monitoring Requirements-Sampling Season (24-Hr & 3-Hr) Minimum PAMS Monitoring Period Actual PAMS Monitoring Period 24-Hr Samples Is the PAMS Monitoring Period 24-Hr Samples Adequate? Actual PAMS Monitoring Period 3-Hr Samples Is the PAMS Monitoring Period 3-Hr Samples Adequate? (months) (months) (yes/no) (months) (yes/no) June-July Jan-Dec July-Oct Yes 24-hr samples 3-Hr samples Yes Section PAMS Minimum Monitoring Requirements-VOC The District is required to operate PAMS stations for VOC speciation analysis. This section will state these requirements. Section PAMS Minimum Monitoring Requirements-VOC Type 2 Stations The District is required to operate Type 2 sites to monitor the magnitude and type of precursor emissions in the area where maximum precursor emissions are expected to impact and are suited for the monitoring of urban air toxic pollutants. Table 11.2 lists these requirements. 5.3 Minimum Monitoring Network Requirements. A Type 2 site is required for each area. Overall, only two sites are required for each area, providing all chemical measurements are made. For example, if a design includes two Type 2 sites, then a third site will be necessary to capture the NOy measurement. B1 A 40 CFR Part 58, Appendix D, Network Design Criteria for Ambient Air Quality Monitoring, Section 4, Pollutant-Specific Design Criteria for SLAMS Sites, part 5.2, Monitoring Period B1 40 CFR Part 58, Appendix D, Network Design Criteria for Ambient Air Quality Monitoring, Section 4, Pollutant-Specific Design Criteria for SLAMS Sites, part 5.3, Minimum Monitoring Network Requirements
135 Chapter 11: Photochemical Assessment Monitoring Stations (PAMS) Page 4 of 10 Table 11.2 PAMS Minimum Monitoring Requirements-VOC Type 2 Stations (Table D-6, Item #1B) Minimum VOC Sites Required Active VOC Sites Needed VOC Sites Minimum Type 2 VOC Sites Required Active Type 2 VOC Sites Needed Type 2 VOC Sites (#) (#) (#) (#) (#) (#) Floyd Smith Dr. None 1 None Floyd Smith Alpine Section PAMS Minimum Monitoring Requirements-VOC non-type 2 Stations The District is required to operate non-type 2 sites to monitor the magnitude and type of precursor emissions in the area where maximum precursor emissions are expected to impact and are suited for the monitoring of urban air toxic pollutants. Tables 11.3 lists these requirements. No 5.3 Minimum Monitoring Network Requirements. The minimum required number and type of monitoring sites and sampling requirements are listed in Table D-6 of this appendix. Any alternative plans may be put in place in lieu of these requirements, if approved by the Administrator. B2 Table D 6 of Appendix D to Part 58 Minimum Required PAMS Monitoring Locations and Frequencies B Measurement Where required Sampling frequenc 1 (all daily except for upper air meteorology) A B C Two sites per area, one of which must be a Type 2 site 1 Speciated VOC 2 2 Carbonyl sampling Type 2 site in areas classified as serious or above for the 8-hour ozone standard During the PAMS monitoring period: (1) Hourly auto GC, or (2) Eight 3-hour canisters, or (3) 1 morning and 1 a afternoon canister with a 3-hour or less averaging time plus Continuous Total Non-methane Hydrocarbon measurement. 3-hour samples every day during the PAMS monitoring period. 3 NO X All Type 2 sites Hourly during the ozone monitoring season. 4 One site per area at the NO y Type 3 or Type 1 site Hourly during the ozone monitoring season. 5 CO One site per area at a (ppb level) Type 2 site Hourly during the ozone monitoring season. 6 Ozone All sites Hourly during the ozone monitoring season. 7 Surface met All sites Hourly during the ozone monitoring season. 8 One representative Upper air Sampling frequency must be approved as part of the annual location within PAMS meteorology monitoring network plan required in 40 CFR area 1 Daily or with an approved alternative plan. B2 40 CFR Part 58, Appendix D, Network Design Criteria for Ambient Air Quality Monitoring, Section 4, Pollutant-Specific Design Criteria for SLAMS Sites, part 5.3, Minimum Monitoring Network Requirements
136 Chapter 11: Photochemical Assessment Monitoring Stations (PAMS) Page 5 of 10 Table 11.3 PAMS Minimum Monitoring Requirements-VOC non-type 2 Stations (Table D-6, Item #1B) Minimum non- Type II VOC Sites Active non- Type II VOC Sites Needed non- Type II VOC Sites Required (#) (#) (#) 1 1 Alpine None Section PAMS Minimum Monitoring Requirements-VOC Sampling Frequency The District is required to operate the VOC samplers on a specific frequency of collection. Table D-6 lists this information and Table 11.4 lists these requirements. Table 11.4 PAMS Minimum Monitoring Requirements-VOC Sampling Frequency* (Table D-6, Item #1C) Is There a Continuous Total NMHC analyzer? How many 3-Hr Samples Time of Day? Needed Samples (yes/no) (#) (#) (#) No 4 2-morning samples 2-afternoon samples None None *The District monitors for PAMS under the EPA approved California Alternative PAMS Sampling Plan. Section PAMS Minimum Monitoring Requirements-Carbonyls The District is required to operate PAMS stations for Carbonyl speciation analysis. This section will state these requirements. Section PAMS Minimum Monitoring Requirements-Carbonyls Type 2 Stations Table D-6 lists this information the number and type of PAMS Carbonyls stations required and Table 11.5 lists these requirements. Table 11.5 PAMS Minimum Monitoring Requirements-Carbonyls Type 2 Stations (Table D-6, Item #2B) Minimum Carbonyl Sites Required Active Carbonyl Sites Needed Carbonyl Sites Minimum Type II Carbonyl Sites Required Active Type II Carbonyl Sites Needed Type II Carbonyl Sites Unofficial Carbonyl Sites (#) (#) (#) (#) (#) (#) (#) 1* 1* 1 1 None 1 None Floyd Smith Dr. Floyd Smith Dr. Downtown *The carbonyl sampler experienced a catastrophic, irreparable failure at the San Diego-Kearny Villa Rd. site. In 2011, the EPA Region IX Authority instructed the District to suspend replacing the sampler until the PAMS program is re-engineered.
137 Chapter 11: Photochemical Assessment Monitoring Stations (PAMS) Page 6 of 10 Section PAMS Minimum Monitoring Requirements-Carbonyl Sampling Frequency The District is required to operate the Carbonyl samplers on a specific frequency of collection. Table D-6 lists this information and Table 11.6 lists these requirements. Table 11.6 PAMS Minimum Monitoring Requirements-Carbonyl Sampling Frequency* (Table D-6, Item #2C) How many 3-Hr Samples Time of Day? Needed Samples (#) (#) (#) 2-morning samples None 4 2-afternoon samples None *The District monitors for PAMS under the EPA approved California Alternative PAMS Sampling Plan. Section PAMS Minimum Monitoring Requirements-Gaseous Instruments There are associated gaseous instrumentation requirements at PAMS stations. These can depend upon the Type of station, etc. section will state these requirements. Section PAMS Minimum Monitoring Requirements-Gaseous Instruments, NOx The District is required to operate oxides of nitrogen analyzers as part of the PAMS program Table D-6 lists this information and Table 11.7 lists these requirements. Table 11.7 PAMS Minimum Monitoring Requirements-Gaseous Instruments, NOx (Table D-6, Item #3B) Active Type II Sites Active Type II Sites with NOx Monitors NOx Monitors Needed at Type II Sites Unofficial Type II Sites Active Unofficial Type II Sites with NOx Monitors NOx Monitors Needed at Unofficial Type II Sites (#) (#) (#) (#) (#) (#) Floyd Smith Dr. None None Downtown Downtown Kearny Villa Rd. 2 Floyd Smith Dr. Kearny Villa Rd.
138 Chapter 11: Photochemical Assessment Monitoring Stations (PAMS) Page 7 of 10 Section PAMS Minimum Monitoring Requirements-Gaseous Instruments, NOy The District is required to operate a reactive oxide of nitrogen analyzer as part of the PAMS program Table D-6 lists this information and Table 11.8 lists these requirements. Table 11.8 PAMS Minimum Monitoring Requirements-Gaseous Instruments, NOy (Table D-6, Item #4B) Minimum NOy Monitors Required Active Type I or Type III Sites Active NOy Monitors NOy Monitors Needed Either at a Type I or Type III Site at a Type I or Type III Site (#) (#) (#) (#) 1 2 1* None Floyd Smith *The District measures for NOy at the NCore location, a PAMS Type II site. The District was granted a waiver by the EPA Region IX Authority in 2011 to designate this site/location to satisfy the PAMS NOy requirement. NOx monitors are used at the PAMS Type I and III sites. Section PAMS Minimum Monitoring Requirements-Gaseous Instruments, CO The District is required to operate a carbon monoxide analyzer as part of the PAMS program Table D-6 lists this information and Table 11.9 lists these requirements. Table 11.9 PAMS Minimum Monitoring Requirements-Gaseous Instruments, CO (Table D-6, Item #5B) Minimum CO Monitors Active Type II Sites Active CO Monitors CO Monitors Needed Required at a Type II Site at a Type II Site (#) (#) (#) (#) None
139 Chapter 11: Photochemical Assessment Monitoring Stations (PAMS) Page 8 of 10 Section PAMS Minimum Monitoring Requirements-Gaseous Instruments, O 3 The District is required to operate ozone analyzers as part of the PAMS program Table D-6 lists this information and Table lists these requirements. Table PAMS Minimum Monitoring Requirements-Gaseous Instruments, O 3 (Table D-6, Item #6B) Active PAMS Sites Active PAMS Sites with O 3 Monitors O 3 Monitors Needed at PAMS Sites Unofficial PAMS Sites Active Unofficial PAMS Sites with O 3 Monitors O 3 Monitors Needed at Unofficial PAMS Sites (#) (#) (#) (#) (#) (#) 4 Floyd Smith Dr. 1 1 Kearny Villa Rd. None Downtown Downtown Camp Pendleton None Alpine 4 Floyd Smith Dr. Kearny Villa Rd. Camp Pendleton Alpine Section PAMS Minimum Monitoring Requirements-Meteorology Instruments There are meteorological instrumentation requirements at PAMS stations. This section will state those requirements. Section PAMS Minimum Monitoring Requirements-Meteorology Instruments, Surface The District is required to operate surface meteorology sensors as part of the PAMS program Table D-6 lists this information and Table lists these requirements. Table PAMS Minimum Monitoring Requirements-Meteorology Instruments, Surface (Table D-6, Item #7B) Active PAMS Sites Active PAMS Sites with Meteorology Meteorology Needed at PAMS Sites Unofficial PAMS Sites Active Unofficial PAMS Sites with Meteorology Meteorology Needed at Unofficial PAMS Sites (#) (#) (#) (#) (#) (#) 4 Floyd Smith Dr. 1 1 Kearny Villa Rd. None Downtown Downtown Camp Pendleton None Alpine 4 Floyd Smith Dr. Kearny Villa Rd. Camp Pendleton Alpine
140 Chapter 11: Photochemical Assessment Monitoring Stations (PAMS) Page 9 of 10 Section PAMS Minimum Monitoring Requirements-Meteorology Instruments, Upper Atmosphere The District is required to operate upper atmosphere sensors as part of the PAMS program Table D-6 lists this information and Table lists these requirements. Table PAMS Minimum Monitoring Requirements-Meteorology Instruments, Upper Atmosphere (Table D-6, Item #8B) Minimum Upper Air Meteorology Required in a PAMS area Active Upper Air Meteorology Sites Upper Air Meteorology Sites Needed Upper Air Meteorology Site Location (#) (#) (#) (name) 1 0* 1* Kearny Villa Road *No longer operational Section PAMS Minimum Monitoring Requirements-Summary Table summarizes all the PAMS minimum monitoring requirements from sections Table PAMS Summary of Minimum Monitoring Requirements CFR Programs Minimum Requirements for Requirement PAMS Active Needed Requirements (name) (#) PAMS monitoring season, 24-Hrs samples July-June Yes None PAMS monitoring season, 3-Hrs samples July-Oct Yes None PAMS season sample duration= 3-Hrs 3-Hrs Yes None Minimum # of Type 2 VOC sites 1 Yes None Minimum # of non-type 2 VOC sites 1 Yes None VOC sampling frequency during PAMS season, 3-Hrs 2 morning 2 afternoon Yes None Minimum # of Type 2 Carbonyl sites 1 1 None Carbonyl sampling frequency during PAMS season, 3-Hrs 2 morning 2 afternoon Yes None Minimum # of NOx monitors = # of Type 2 sites 3 3 None Minimum # of NOy monitors at non-type 2 sites 1 1 None Minimum # of CO monitors at one Type 2 sites 1 1 None Minimum # of O3 monitors = # of PAMS sites 5 5 None Minimum # of meteorological sensors = # of PAMS sites 5 5 None Minimum # of upper atmosphere sensors 1 0 1
141 Chapter 11: Photochemical Assessment Monitoring Stations (PAMS) Page 10 of 10 Section 11.2 PAMS Sampling Frequency & Equipment During the non-pams season (November to the end of June), the samples have a 24-hour sampling duration. During the PAMS season (July to the end of October), the samplers collect four samples that each have a 3-hour sampling duration. The 3-hour samples are collected on a set time schedule, as follows: , , , and Table PAMS Sampling Equipment Pollutant Abbreviation Samplers Collection Volatile Organic Compounds Carbonyl Compounds Carbonyl Compounds VOC's n/a n/a Xontech 910/912 Xontech 925 Xontech 924 Method Summa Canister DNPH cartridges DNPH cartridges Collection Frequency Analytical Method 1:6 GC-FID Parameter Code Table 11.2b Method Code 126 1:6 HPLC Table 11.2c 202 1:6 HPLC Table 11.2c 202 Table PAMS VOC Parameter Codes Table PAMS Carbonyls Compound Parameter Compound Parameter Compound Parameter Ethylene Methylhexane Formaldehyde Acetylene Trimethylpentane Acetaldehyde Ethane n-heptane Acetone Propylene Methylcyclohexane Propane Trimethylpentane Isobutane Toluene Isobutylene Methylheptane Butene Methylheptane n-butane n-octane trans-2-butene Ethylbenzene cis-2-butene m-xylene Isopentane p-xylene Pentene Styrene n-pentane o-xylene Isoprene n-nonane Trans-2-pentene Isopropylbenzene cis-2-pentene n-propylbenzene Dimethylbutane Ethyl 3-methylbenzene Cyclopentane Ethyl 4-methylbenzene Cimethylbutane Trimethylbenzene Methylpentane Ethyl 2-methylbenzene Methylpentane Trimethylbenzene Hexene n-decane n-hexane Trimethylbenzene Methylcyclopentane m-diethylbenzene Dimethylpentane p-diethylbenzene Benzene Undecane cyclohexane Total PAMS Methylhexane Total NMOC Dimethylpentane 43291
. As yet, there are no NAAQS standards which to compare the data.")
142 Chapter 12: Toxics Page 1 of 3 Chapter 12 Toxics Program Section Toxics Introduction Toxics-related sampling was conducted at five sites; three SDAPCD sites and two CARB sites (Figure 12.0 and Table 12.0). As yet, there are no NAAQS standards which to compare the data. Please note: The El Cajon station was temporarily relocated to the Gillespie Field area off of Floyd Smith Drive, this station is called Floyd Smith Drive (FSD). Toxics-VOC at DVN, DTN, and ESC Toxics-Metals at DTN and DVN Toxics-Metals, VOC, and Carbonyls (CARB CA-TAC program) at ECA & FSD (only) and CVA Figure 12.0 Toxics Network Map The range of defined compounds for the Toxics program is in excess of 100 different possible carcinogenic, irritant, and mutagenic chemicals. Their toxicities are gauged by risk factors rather than limits.
143 Toxics 2015 Network Plan Chapter 12: Toxics Page 2 of 3 Table 12.0 Toxics Sampling Network Abbreviation CVA FSD ESC DTN DVN Name Chula Vista El Cajon/Floyd Smith Dr. Escondido San Diego Beardsley Donovan Address Latitude Longitude 80 E. J St Floyd Smith Dr E. Valley Pkwy A Beardsley St Alta Rd AQS ID Pollutant Toxics- VOCs Toxics- Metals Toxics- Cr +6 Toxics- Aldehydes Toxics- VOCs Toxics- Metals Toxics- Cr +6 Toxics- Aldehydes Monitor Type CA TAC CA TAC CA TAC CA TAC CA TAC CA TAC CA TAC CA TAC Toxics- VOCs Not Applicable Toxics- VOCs Not Applicable Toxics- Metals Not Applicable Toxics- VOCs Not Applicable Method Canister Filter Filter Cartridges Canister Filter Filter Cartridges Canister Canister Filter Canister Filter Affiliation Not Applicable Not Applicable Not Applicable Not Applicable Not Applicable Not Applicable Not Applicable Not Applicable Not Applicable Not Applicable Not Applicable Not Applicable Spatial Scale NS NS NS NS NS NS NS NS NS NS NS NS SN Toxics- Metals Not Applicable Not Applicable Site Type PE PE PE PE PE PE PE PE PE PE PE PE PE Objective (Federal) Research Research Research Research Research Research Research Research Research Research Research Research Research Analysis By ARB ARB ARB ARB ARB ARB ARB ARB APCD APCD APCD APCD APCD Frequency 1:12 1:12 1:12 1:12 1:12 1:12 1:12 1:12 1:6 1:6 1:6 1:6 1:6 Equipment Xontech 910/912 Xontech 924 Xontech ECA station temporarily relocated to the FSD area 2 OTM station relocated to the DVN area Xontech 924 Xontech 910/912 Xontech 924 Xontech 924 Xontech 924 Xontech 910A FSL Xontech 910A FSL Xontech 924 Xontech 910A FSL Xontech 924 Glossary of Terms Monitor Type Method (Sampling/Analysis) Affiliation E= EPA CL= Chemiluminescence BG= Border Grant O= Other CT= Low Volume, size selective inlet, continuous CSN STN= Trends Speciation SLAMS= State & Local monitoring station FL= Fluorescence CSN SU= Supplemental Speciation SPM= Special purpose monitor HV= High volume NATTS= National Air Toxics Trends Stations CATAC= California Toxics Monitoring IR= Nondispersive infrared NCORE= National Core Multi-pollutant Monitoring Stations SI= High volume, size selective inlet NR= Monitors at sites meeting near road designs as per Part 58 SP= Low volume, size selective inlet, speciated PAMS= Photochemical Assessment Monitoring Stations Site Type Q= Low volume, size selective inlet, sequential UNPAMS= Unofficial PAMS site EXDN= Extreme downwind UV= Ultraviolet absorption HC= Highest concentration Canister= Evacuated stainless steel canisters Monitor Designation MXO= Maximum ozone concentration Cartridges= Di-nitrophenylhydrazine cartridges PRI= Primary MXP= Maximum precursor impact FSL= Fused Silica Lined QAC= Collocated PE= Population exposure Filter= Quartz filters O= Other SO= Source oriented UPBD= Upwind background Spatial Scale Objective (Federal) G/B= General/Background MI= Micro NAAQS= Suitable for NAAQS comparison RT= Regional Transport MS= Middle Research= Research support WRI= Welfare related impacts NS= PI= Public Information QA= Quality assurance US= Urban Scale
144 Chapter12: Toxics Page 3 of 3 Section Toxics Minimum Monitoring Requirements There are minimum monitoring requirements for the Toxics program. Section Toxics Sampling Frequency & Equipment Used The EPA established the minimum collection frequency for VOCs, aldehydes, and other Hazardous Air Pollutants (HAPs) with respect to 24-hour integrated samples and are listed in Table 12.1a. The VOC analyzed compounds are in Table 12.1b. See ARB for parameter codes for their CA Toxic program. Table 12.1a Toxics Equipment Pollutant Volatile Organic Compounds Abbrev. VOCs Collection Equipment Xonteck 910A-FSL (SDAPCD) Xonteck 910/912 (ARB) Collection Method Fused Silica Lined (SDAPCD) Summa Canister (ARB) Aldehydes none XonTech 924 DNPH cartridge Cr (VI) none XonTech 924 Teflon Filter Metals none XonTech 924 Teflon Filter Collection Frequency 1:6 (SDAPCD) 1:12 (ARB) 1:12 (ARB) 1:12 (ARB) 1:12 (SDAPCD) 1:12 (ARB) Analytical Method GC-MS Parameter Code Table 12.1.b (SDAPCD) (See ARB) Method Code 210 HPLC (See ARB) (See ARB) IC (See ARB) (See ARB) Not analyzed (SDAPCD) (See ARB) Not analyzed (SDAPCD) (See ARB) Not analyzed (SDAPCD) (See ARB) Table 12.1b Toxics VOCs Parameters Codes Compound Parmeter Compound Parmeter Compound Parmeter Dichlorodifluoromethane Bromoform Toluene Chloromethane Styrene ,2-Dibromoethane Methyl-2-pentanone 2-Methoxy-2- (MIBK) methylpropane trans-1,3-dichloropropene Vinyl Chloride o-xylene Chlorobenzene ,3-Butadiene Ethyltoluene Ethylbenzene Bromomethane ,3,5-Trimethylbenzene m,p-xylene Chloroethane ,2,4-Trimethylbenzene Tetrachloroethene Trichlorofluoromethane ,3-Dichlorobenzene ,1,2-Trichloroethane Acrolein ,4-Dichlorobenzene Benzene Acetone ,2-Dichlorobenzene ,1,1-Trichloroethane Methyl-1,3-butadiene ,2,4-Trichlorobenzene Carbon Tetrachloride ,1-Dichloroethene Hexachlorobutadiene cis-1,3-dichloropropene Acrylonitrile Acetonitrile ,2-Dichloroethane Methylene Chloride Vinyl acetate Trichloroethene Trichlorotrifluoroethane n-hexane cis-1,2-dichloroethene trans-1,2-dichloroethene Ethyl acetate Chloroform ,1,2,2-Tetrachloroethane Methyl methacrylate Naphthalene ,1-Dichloroethane Dichlorotetrafluoroethane ,2-Dichloropropane Butanone Benzyl chloride 45809
145 1 (left intentionally blank)
146 1 APPENDICES
147 Appendix A: Site Description Introduction Page 1 of 4 Site Description Introduction The appendices list the stations that comprise the San Diego Air Pollution Control District s ambient air quality network (Network) along with specific information required by the EPA for each monitor. This specific information is cross-referenced against the requirements for siting. Federal requirements for the monitoring objectives and spatial scales, Table A1, are in the CFR annual update on July 1 of every year, 40 CFR Part 58, Subpart G-Federal Monitoring, Appendix D, Network Design Criteria for Ambient Air Quality Monitoring. Table A1 summarizes these requirements and Table a2 defines the terminology and lists the monitor types and the definitions. Table A1 Relationship between Site Types and Scales or Representativeness Site Type Definition Appropriate Siting Scales Permissible Scales & Highest concentration, Maximum ozone concentrations Maximum precursor impact Population Exposure Source Oriented General/Background Regional transport Welfare-related impacts Upwind Background Quality Assurance Site located to determine the highest concentrations expected to occur in the area covered by the network Occurring downwind from the area of maximum precursor emissions. Are typically placed near the downwind boundary of the central business district (CBD) or primary area of precursor emissions mix Sites located to determine typical concentrations in areas of high population density Site located to determine the impact of significant sources or source categories on air quality Sites located to determine general background concentration levels Sites located to determine the extent of regional pollutant transport among populated areas and in support of secondary standards. Sites located to measure air pollution impacts on visibility, vegetation damage, or other welfare based impacts Sites located to measure overwhelming incoming transport of ozone. Situated in the predominant upwind direction from the maximum precursor emissions location Site located for quality assurance requirements Micro, Middle,, Urban Micro, Middle,, Urban Micro, Middle,, Urban, Urban Micro, Middle, Urban, Regional Urban, Regional Urban, Regional Urban Regional Micro, Middle,, Urban Definitions Micro (0 100 meters), Middle ( meters) (500 meters 4 kilometers) Urban (4 50 kilometers) Micro (0 100 meters), Middle ( meters) (500 meters 4 kilometers) Urban (4 50 kilometers) Micro (0 100 meters), Middle ( meters) (500 meters 4 kilometers) Urban (4 50 kilometers) (500 meters 4 kilometers) Urban (4 50 kilometers) Micro (0 100 meters), Middle ( meters) (500 meters 4 kilometers) Urban (4 50 kilometers) Regional (50 1,000 kilometers) Urban (4 50 kilometers) Regional (50 1,000 kilometers) Urban (4 50 kilometers) Regional (50 1,000 kilometers) (500 meters 4 kilometers) Urban (4 50 kilometers) Regional (50 1,000 kilometers) Micro (0 100 meters), Middle ( meters) (500 meters 4 kilometers) Urban (4 50 kilometers)
148 Appendix A: Site Description Introduction Page 2 of 4 Table A2 Summary of Definitions in the Site Description Template Glossary of Terms Monitor Type Method (Sampling/Analysis) Network Affiliation E= EPA CL= Chemiluminescence BG= Border Grant O= Other CT= Low Volume, size selective inlet, continuous CSN STN= Trends Speciation SLAMS= State & Local monitoring station FL= Fluorescence CSN SU= Supplemental Speciation SPM= Special purpose monitor HV= High volume NATTS= National Air Toxics Trends Stations CATAC= California Toxics Monitoring IR= Nondispersive infrared NCORE= National Core Multi-pollutant Monitoring SI= High volume, size selective inlet NR= Monitors at sites meeting near road designs SP= Low volume, size selective inlet, speciated PAMS= Photochemical Assessment Monitoring Site Type Q= Low volume, size selective inlet, sequential UNPAMS= Unofficial PAMS site EXDN= Extreme downwind UV= Ultraviolet absorption HC= Highest concentration Canister= Evacuated stainless steel canisters Monitor Designation MXO= Maximum ozone concentration Cartridges= Di-nitrophenylhydrazine cartridges PRI= Primary MXP= Maximum precursor impact FSL= Fused Silica Lined QAC= Collocated PE= Population exposure Filter= Quartz filters O= Other SO= Source oriented UPBD= Upwind background Spatial Scale Objective (Federal) G/B= General/Background MI= Micro Data= Provide pollution data in a timely manner RT= Regional Transport MS= Middle NAAQS= Suitable for NAAQS comparison WRI= Welfare related impacts NS= Research= Research support QA= Quality assurance US= Urban Scale PI= Public Information Federal requirements for correctly siting the inlet sample probe(s) are in the 40 CFR Part 58, Subpart G- Federal Monitoring, Appendix E, Probe and Monitoring Path Siting Criteria for Ambient Air Quality Monitoring. This specific information is presented in a site description template required by the EPA in all network plans. The pollutant monitors must be assigned a specific scale, type, monitoring objective, and designation. These parameters have specific guidelines that must be followed in order for the data collected from the monitors to be considered valid. Additionally, each monitor must meet certain physical parameters, e.g., distance from each other, distance from the road, distance from obstructions, etc. Table A3 summarizes these requirements. Figure A1 illustrates the distances PM samplers must be from the nearest traffic lane. Modifications to the Site Template and General Information The EPA supplies monitoring organizations with a site description template to use for the input of site information in the annual network plan. The District has modified the site description template into two tables. The section of the EPA template that lists the distance from obstructions, collocated monitors, etc., has been moved into a separate table with a more detailed accounting of the requirements provided in Table A3. The traffic count is referenced to the closest cross street listed in the current Traffic Count database maintained by the San Diego Association of Governments (SANDAG). At some station locations, the closest cross street with an Annual Average Daily Traffic (AADT) count may be several hundred meters away. The vehicle count is estimated visually (this is stated, when applicable) and the traffic count for the closest major thoroughfare is also reported for comparison purposes.
149 Appendix A: Site Description Introduction Page 3 of 4 Table A3 Pollutant Summary of Probe Monitoring Paths Scale <maximum monitoring path length> Height from the ground to the probe, inlet or 80% of monitoring path 1 Horizontal and vertical distance from supporting structures 2 to probe, inlet, or 90% of monitoring path 1 trees to probe, inlet, or 90% of the monitoring path 1 Average daily traffic count roadways to probe, inlet, or monitoring path 1,10 (Name) SO 2 3,4,5,6 (Name) Middle Urban Regional Micro (meters) Min= 2, Max= 15 Min= 2, Max= 15 Min= 2, Max= 15 Min= 2, Max= 15 Min= 3.5, Max= 15 (meters) > 1 > 1 > 1 > 1 > 1 (meters) > 10 > 10 > 10 > 10 > 10 (#) For all scales Not Applicable For micro scale Not Applicable (meters) For all scales Not Applicable For micro scale Min= 2, Max= 10 CO 4,5,7 O 3 3,4,5 NOy & NO 2 3,4.5 PAMS 3,4,5 Middle Middle Urban Regional Micro Middle Urban, Regional Urban Micro Min= 2, Max= 15 Min= 2, Max= 15 Min= 2, Max= 15 Min= 2, Max= 15 Min= 2, Max= 15 Min= 2, Max= 15 Min= 2, Max= 7 Min= 2, Max= 15 Min= 2, Max= 15 Min= 2, Max= 15 Min= 2, Max= 15 Min= 2, Max= 15 Min= 2, Max= 15 Min= 2, Max= 7 > 1 > 1 > 1 > 1 > 1 > 1 > 1 > 1 > 1 > 1 > 1 > 1 > 1 > 2 > 10 > 10 > 10 > 10 > 10 > 10 > 10 > 10 > 10 > 10 > 10 > 10 > 10 > 10 For all other scales 10,000 15,000 20,000 30,000 40,000 50,000 60,000 For all scales 10,000 15,000 20,000 40,000 70, ,000 For all scales 10,000 15,000 20,000 40,000 70, ,000 For all scales > 10,000 15,000 20,000 40,000 70, ,000 For all other scales For all scales For all scales For all scales Min= 5, Max= 15 (street canyon) Min= 2, Max= 10 (street) Pb 3,4,5,6,8 PM 3,4,5,6,8,9 Min= 2, Max= 15 > 2 > 10 See Figure E-1 (below) Urban Min= 2, Max= 15 > 2 > 10 1 Monitoring path for open path analyzers is applicable only to middle or neighborhood scale CO monitoring, middle, neighborhood, urban, and regional scale Now monitoring, and all applicable scales for monitoring SO 2, O 3 and O 3 precursors. 2 When probe is located on a rooftop, this separation distance is in reference to walls, parapets, or penthouses located on roof. 3 Should be > 20 meters from the dripline of tree(s) and must be 10 meters from the dripline when the tree(s) act as an obstruction 4 sampler, probe, or 90% of monitoring path to obstacle, such as a building, must be at least twice the height the obstacle protrudes above the sampler, probe, or monitoring path. Sites not meeting this criterion may be classified as middle scale. 5 Must have unrestricted airflow 270 degrees around the probe or sampler; 180 degrees if the probe is on the side of a building or a wall. 6 The sampler, probe, or monitoring path should be away from minor source, such as furnace or incineration flues. The separation distance is dependent on the height of the minor source s emission point, the type of waste burned, and the quality of the fuel (sulfur, ash, or lead content). This criterion is designed to avoid undue influences from minor sources. 7 For microscale CO monitoring sites, the probe must be > 10 meters from a street intersection and preferably at a midblock location 8 Collocated monitors must be within 4 meters of each other and at least 2 meters apart for flow rates > 200 liters/min or at least 1 meter apart for samplers having flow rates < 200 liters/min 9 For particulate sampling, a minimum of 2 meters of separation from walls, parapets, and structures is required for rooftop site placement. 10 Measured from the edge of the nearest lane to the sampler or inlet.
150 Figure A1 Distance of PM samplers to nearest traffic lane 2015 Network Plan Appendix A: Site Description Introduction Page 4 of 4

151 Appendix 1: Site Description Alpine Site Abbreviation: ALP Site AQS#: Page 1 of 6 Section Alpine Station Description and Statement of Purpose Table 1.1 General Site Information County: San Diego Representative Area: San Diego MSA Site Name: Alpine Year Established: 4/29/2015 Site Address: 2462 W. Victoria Dr. Site Name Abbreviation: ALP AQS Number: Latitude: Longitude: Elevation above Sea Level: 627 m General Location: Trailer adjacent to Padre reservoir Ground Cover: Asphalt Distance to Road: 17 m west= W. Victoria Drive Traffic Count (2010 AADT): No traffic count is available for the closest cross street, W. Victoria Dr. estimated= 500 Alpine Blvd. at W. Victoria Dr.(south/slightly upwind 760 m) = 2,200 Site Description: Due to its geographical location, each year the Alpine station records the highest ozone levels within the air basin. All particulate equipment is on the rooftop of the station. The Alpine location is a PAMS Type III site, intended to monitor maximum ozone concentrations occurring downwind from the area of maximum precursor emissions (NO x and Monitoring Objectives: VOCs). It is also a site used to assess downwind transport of fine particulates (PM 2.5 ). NO 2 data continues to provide information on trends are an indication of the relative effectiveness of NO x regulatory and control measures. The Alpine site also provides information used in making burn/no-burn decisions. Planned Changes: None Figure 1.1 Alpine Picture of the Location of the Station
152 Appendix 1: Site Description Alpine Site Abbreviation: ALP Site AQS#: Page 2 of 6 Table 1.2a Pollutant Alpine - Gaseous Pollutants Monitor Designations + Other O 3 NO 2 Other Zero Air POC 1 1 Not Applicable Monitor designation Other Primary Not Applicable Parameter code (NO 2) Not Applicable Basic monitoring objective Site type PI, NAAQS Maximum ozone concentrations PI, NAAQS Population Exposure Not Applicable Not Applicable Monitor type SLAMS SLAMS Not Applicable Network affiliation PAMS PAMS Not Applicable Instrument manufacturer & model 49i 42i Teledyne-API 701H Method code Not Applicable FRM/FEM/ARM/Other FEM FRM Not Applicable Collecting agency APCD APCD APCD Analytical laboratory APCD APCD APCD Reporting agency APCD APCD APCD Spatial scale Urban Scale Urban Scale Not Applicable Monitoring start date 4/29/2015 4/29/2015 4/29/2015 Current sampling frequency Required sampling frequency Continuous Continuous Not Applicable Continuous Continuous Not Applicable Sampling season Year-round Year-round Not Applicable Probe height 7.1 meters 7.1 meters Not Applicable supporting structure obstructions on roof obstructions not on roof trees 13.3 meters 13.3 meters Distance to furnace or incinerator flue Distance between collocated monitors Unrestricted airflow 360 O 360 O 360 O Probe material for reactive gases Residence time for reactive gases Any changes within the next 18 months? Suitable for comparison to the NAAQS? Frequency of QC check (one-point) Annual Performance Evaluation date Borosilicate glass Borosilicate glass Not Applicable 3.1 sec 3.1 sec Not Applicable Yes Yes Yes Yes Yes 1:14 1:2 11/19 12/7 12/4 NPAP (ARB) date 8/13/2015 8/13/2015
153 Appendix 1: Site Description Alpine Site Abbreviation: ALP Site AQS#: Page 3 of 6 Table 1.2b Alpine - Particulate Pollutants Monitor Designations Pollutant Monitor designation Parameter code Basic monitoring objective PM 2.5 Continuous (non-fem) POC 1 Site type Monitor type Other (LC) PI, Research Population Exposure SLAMS Network affiliation Instrument manufacturer & model Met One BAM 1020 Method code 733 FRM/FEM/ARM/Other Collecting agency Analytical laboratory Reporting agency Spatial scale Other (non-fem) APCD APCD APCD Urban Scale Monitoring start date 4/29/2015 Current sampling frequency Required sampling frequency Sampling season Probe height supporting structure obstructions on roof obstructions not on roof trees Distance to furnace or incinerator flue Distance between collocated monitors Unrestricted airflow Probe material for reactive gases Residence time for reactive gases Any changes within the next 18 months? Suitable for comparison to the NAAQS? Frequency of flow rate verification Semi-Annual flow rate audits dates Continuous Continuous Year-round 5.0 meters 24.4 meters 360 O Yes No Semi-Monthly 11/7* NPAP (ARB) date 8/13/2015 *Only operational for the last half of the year.
154 Appendix 1: Site Description Alpine Site Abbreviation: ALP Site AQS#: Page 4 of 6 Table 1.2c Pollutant POC Monitor designation Parameter code Basic monitoring objective Site type Monitor type Alpine - Other Pollutants Monitor Designations PAMS- VOC 1 for 3-Hr samples 2 for 24-Hr samples Other See PAMS Table 12.2b Research Maximum ozone concentrations SLAMS Network affiliation PAMS Type III Instrument manufacturer & model Xontech 910 & 912 Method code 126 FRM/FEM/ARM/Other Collecting agency Analytical laboratory Reporting agency Spatial scale Other APCD APCD APCD Urban Scale Monitoring start date 4/29/2015 Current sampling frequency Required sampling frequency Sampling season Probe height supporting structure obstructions on roof obstructions not on roof trees Distance to furnace or incinerator flue Distance between collocated monitors Unrestricted airflow Probe material for reactive gases Residence time for reactive gases Any changes within the next 18 months? Suitable for comparison to the NAAQS? Frequency of QC check (one-point) Annual Performance Evaluation date NPAP (ARB) date 1:6 1:6 3-Hr (Jul-Oct) 24-Hr (Nov-Jun) 4.8 meters 13.3 meters 360 O Yes
155 Appendix 1: Site Description Alpine Site Abbreviation: ALP Site AQS#: Page 5 of 6 Table 1.2d Pollutant Alpine - Meteorology Equipment Designations + Other Other Internal Temp Meteorological Wind Speed Meteorological Wind Direction Meteorological External Temp Meteorological Rel. Humidity POC Monitor designation Parameter code Basic monitoring objective Site type Monitor type SLAMS SLAMS SLAMS SLAMS SLAMS Network affiliation PAMS PAMS PAMS PAMS PAMS Instrument manufacturer & model Qualimetrics Qualimetrics Qualimetrics Rotronics Rotronics Method code FRM/FEM/ARM/Other Other Other Other Other Other Collecting agency APCD APCD APCD APCD APCD Analytical laboratory APCD APCD APCD APCD APCD Reporting agency APCD APCD APCD APCD APCD Spatial scale Urban Urban Urban Urban Urban Monitoring start date 4/29/2015 4/29/2015 4/29/2015 4/29/2015 4/29/2015 Current sampling frequency Required sampling frequency Continuous Continuous Continuous Continuous Continuous Continuous Continuous Continuous Continuous Continuous Sampling season Year-round Year-round Year-round Year-round Year-round Probe height 7.2 m 7.2 m 5.7 m 5.7 m supporting structure obstructions on roof obstructions not on roof 360 o 360 o 360 o 360 o trees 13.3 meters 13.3 meters 13.3 meters 13.3 meters Distance to furnace or incinerator flue Distance between collocated monitors Unrestricted airflow Probe material for reactive gases Residence time for reactive gases Any changes within the next 18 months? Suitable for comparison to the NAAQS? Frequency of QC check (one-point) Annual Performance Evaluation date Yes Yes Yes Yes Yes 11/8 11/8 11/8 11/8 11/8 NPAP (ARB) date * * * * *ARB does not have the equipment to audit.


156 Appendix 1: Site Description Alpine Site Abbreviation: ALP Site AQS#: Page 6 of 6 Figure 1.2 Alpine Pictures (Directional) from the Rooftop
 Year Established: 8/18/2010 Site Address: 2495A W. Victoria Dr.")
157 Appendix 1: Site Description Alpine (temporary) Site Abbreviation: ALP Site AQS#: Page 1 of 6 Section Alpine Station (temporary) Station Description and Statement of Purpose Table 1.1 General Site Information County: San Diego Representative Area: San Diego MSA Site Name: Alpine (temporary) Year Established: 8/18/2010 Site Address: 2495A W. Victoria Dr. Site Name Abbreviation: ALP AQS Number: Latitude: O Longitude: O Elevation above Sea Level: 630 m General Location: Trailer in the SW corner of the Alpine cemetery Ground Cover: Packed dirt Distance to Road: 20 m west= W. Victoria Drive Traffic Count (2010 AADT): No traffic count is available for the closest cross street, W. Victoria Dr. estimated= 500 Alpine Blvd. at W. Victoria Dr.(south/slightly upwind 760 m) = 2,200 The temporary Alpine location was on the Alpine cemetery on 08/18/2010, about 33 meters E of its original location. The original location was adjacent to the Padre reservoir and pump station. Site Description: When the equipment and land underwent renovation, the sampling station relocated across the street. Due to its geographical location, each year the Alpine station records the highest ozone levels within the air basin. The Alpine location is a PAMS Type III site, intended to monitor maximum ozone concentrations occurring downwind from the area of maximum precursor emissions (NO x and Monitoring Objectives: VOCs). It is also a site used to assess downwind transport of fine particulates (PM 2.5 ). NO 2 data continues to provide information on trends are an indication of the relative effectiveness of NO x regulatory and control measures. The Alpine site also provides information used in making burn/no-burn decisions. Planned Changes: Decommissioned in 4/2015 Figure 1.1 Alpine - Picture of the Location of the Station
158 Appendix 1: Site Description Alpine (temporary) Site Abbreviation: ALP Site AQS#: Page 2 of 6 Table 1.2a Pollutant Alpine (t) - Gaseous Pollutants Monitor Designations + Other O 3 NO 2 Other Zero Air POC 1 1 Monitor designation Other Primary Parameter code (NO 2) Basic monitoring objective Site type PI, NAAQS Maximum ozone concentrations PI, NAAQS Population Exposure Monitor type SLAMS SLAMS Network affiliation PAMS PAMS Instrument manufacturer & model 49i 42i Teledyne-API 701H Method code FRM/FEM/ARM/Other FEM FRM Collecting agency APCD APCD APCD Analytical laboratory APCD APCD APCD Reporting agency APCD APCD APCD Spatial scale Urban Scale Urban Scale Monitoring start date 8/18/2010 8/18/2010 8/18/2010 Current sampling frequency Required sampling frequency Continuous Continuous Continuous Continuous Sampling season Year-round Year-round Probe height 6.0 meters 6.0 meters supporting structure obstructions on roof obstructions not on roof trees 13 meters 13 meters Distance to furnace or incinerator flue Distance between collocated monitors Unrestricted airflow 360 O 360 O 360 O Probe material for reactive gases Residence time for reactive gases Any changes within the next 18 months? Suitable for comparison to the NAAQS? Frequency of QC check (one-point) Annual Performance Evaluation date NPAP (ARB) date MONITORING END DATE Borosilicate glass Borosilicate glass 4.15 sec 4.15 sec Yes Yes Yes Yes Yes 1:14 1:2 Closed before Evaluation Closed before NPAP Closed before Evaluation Closed before NPAP 4/2015 4/2015 4/2015
159 Appendix 1: Site Description Alpine (temporary) Site Abbreviation: ALP Site AQS#: Page 3 of 6 Table 1.2b Alpine (t) - Particulate Pollutants Monitor Designations Pollutant Monitor designation Parameter code Basic monitoring objective PM 2.5 Continuous (non-fem) POC 1 Site type Monitor type Other (non-fem) (LC) PI, Research Population Exposure SLAMS Network affiliation Instrument manufacturer & model Met One BAM 1020 Method code 733 FRM/FEM/ARM/Other Collecting agency Analytical laboratory Reporting agency Spatial scale Other (non-fem) APCD APCD APCD Urban Scale Monitoring start date 8/18/2010 Current sampling frequency Required sampling frequency Sampling season Probe height supporting structure obstructions on roof obstructions not on roof trees Distance to furnace or incinerator flue Distance between collocated monitors Unrestricted airflow Probe material for reactive gases Residence time for reactive gases Any changes within the next 18 months? Suitable for comparison to the NAAQS? Frequency of flow rate verification Semi-Annual flow rate audits dates NPAP (ARB) date PEP (EPA) date MONITORING END DATE Continuous Continuous Year-round 5.0 meters 13 meters 360 O Yes No Semi-Monthly Closed before Evaluation Closed before NPAP n/a 4/2015
160 Appendix 1: Site Description Alpine (temporary) Site Abbreviation: ALP Site AQS#: Page 4 of 6 Table 1.2c Pollutant POC Monitor designation Parameter code Basic monitoring objective Site type Monitor type Alpine (t) - Other Pollutants Monitor Designations PAMS- VOC 1 for 3-Hr samples 2 for 24-Hr samples Other See PAMS Table 12.2b Research Maximum ozone concentrations SLAMS Network affiliation PAMS Type III Instrument manufacturer & model Xontech 910 & 912 Method code 126 FRM/FEM/ARM/Other Collecting agency Analytical laboratory Reporting agency Spatial scale Other APCD APCD APCD Urban Scale Monitoring start date 8/18/2010 Current sampling frequency Required sampling frequency Sampling season Probe height supporting structure obstructions on roof obstructions not on roof trees Distance to furnace or incinerator flue Distance between collocated monitors Unrestricted airflow Probe material for reactive gases Residence time for reactive gases Any changes within the next 18 months? Suitable for comparison to the NAAQS? Frequency of QC check (one-point) Annual Performance Evaluation date NPAP (ARB) date MONITORING END DATE 1:6 1:6 3-Hr (Jul-Oct) 24-Hr (Nov-Jun) 4.9 meters 13 meters 360 O Yes Closed before NPAP 4/2015
161 Appendix 1: Site Description Alpine (temporary) Site Abbreviation: ALP Site AQS#: Page 5 of 6 Table 1.2d Pollutant Alpine (t) - Meteorology Equipment Designations + Other Other Internal Temp Meteorological Wind Speed Meteorological Wind Direction Meteorological External Temp Meteorological Rel. Humidity POC Monitor designation Parameter code Basic monitoring objective Site type Monitor type SLAMS SLAMS SLAMS SLAMS SLAMS Network affiliation PAMS PAMS PAMS PAMS PAMS Instrument manufacturer & model Qualimetrics Qualimetrics Qualimetrics Rotronics Rotronics Method code FRM/FEM/ARM/Other Other Other Other Other Other Collecting agency APCD APCD APCD APCD APCD Analytical laboratory APCD APCD APCD APCD APCD Reporting agency APCD APCD APCD APCD APCD Spatial scale Urban Urban Urban Urban Urban Monitoring start date 08/18/ /18/ /18/ /18/ /18/2010 Current sampling frequency Required sampling frequency Continuous Continuous Continuous Continuous Continuous Continuous Continuous Continuous Continuous Continuous Sampling season Year-round Year-round Year-round Year-round Year-round Probe height 7.2 m 7.2 m 5.7 m 5.7 m supporting structure obstructions on roof obstructions not on roof 360 o 360 o 360 o 360 o trees 13 meters 13 meters 13 meters 13 meters Distance to furnace or incinerator flue Distance between collocated monitors Unrestricted airflow Probe material for reactive gases Residence time for reactive gases Any changes within the next 18 months? Suitable for comparison to the NAAQS? Frequency of QC check (one-point) Annual Performance Evaluation date Yes Yes Yes Yes Yes Closed before Evaluation Closed before Evaluation Closed before Evaluation Closed before Evaluation Closed before Evaluation NPAP (ARB) date * * * * MONITORING END DATE *ARB does not have the equipment to audit. 4/2015 4/2015 4/2015 4/2015 4/2015


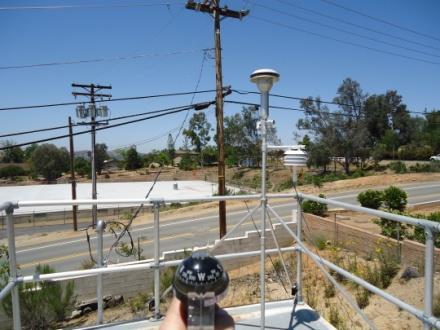


162 Appendix 1: Site Description Alpine (temporary) Site Abbreviation: ALP Site AQS#: Page 6 of 6 Figure 1.2 Alpine Pictures (Directional) from the Rooftop

163 Appendix 2: Site Description Camp Pendleton Site Abbreviation (CMP) AQS# Page 1 of 6 Section Camp Pendleton Station Description and Statement of Purpose Table 2.1 General Site Information County: San Diego Representative Area: San Diego MSA Site Name: Camp Pendleton Year Established: 4/1997 Site Address: West B St. Site Name Abbreviation: CMP AQS Number: Latitude: O Longitude: O Elevation above Sea Level: 16 m General Location: Trailer in the W corner of the parking lot across the Corporal Training facility and above the Del Mar beach on Camp Pendleton Ground Cover: Asphalt Distance to Road: 41 m west= B St. Traffic Count (2010 AADT): No traffic count is available for the base; B St. estimated= 500 Interstate 5 (east/downwind 440 m)= 160,000 This station is a trailer located within the Marine Corps Camp Pendleton Base and sits atop a bluff overlooking the Pacific Ocean. In 1997, it replaced the Oceanside station about 7.6 km Site Description: south east (east of I-5) of the CMP location. Due to its geographical location, this station records over-water transport from the South Coast Air Basin. Diesel truck motor pool 61 m west of the stations and at the base of the bluffs. Monitoring Objectives: This site functions as an upwind, PAMS Type I background characterization site. Planned Changes: None Figure 2.1 Camp Pendleton Picture of the Location of the Station
164 Appendix 2: Site Description Camp Pendleton Site Abbreviation (CMP) AQS# Page 2 of 6 Table 2.2a Pollutant Camp Pendleton - Gaseous Pollutants Monitor Designations + Other O 3 NO 2 Other Zero Air POC 1 1 Monitor designation Other Primary Parameter code (NO 2) Basic monitoring objective Site type PI, NAAQS Upwind Background PI, NAAQS Upwind Background Monitor type SLAMS SLAMS Network affiliation PAMS PAMS Instrument manufacturer & model 49i 42i Teledyne-API 701H Method code FRM/FEM/ARM/Other FEM FRM Collecting agency APCD APCD APCD Analytical laboratory APCD APCD APCD Reporting agency APCD APCD APCD Spatial scale Scale Scale Monitoring start date Current sampling frequency Required sampling frequency Continuous Continuous Continuous Continuous Sampling season Year round Year round Probe height 5.9 meters 5.9 meters 5.9 meters supporting structure obstructions on roof obstructions not on roof 5.6 meters 5.6 meters 5.6 meters trees 35 m 35 m Distance to furnace or incinerator flue Distance between collocated monitors Unrestricted airflow 360 O 360 O 360 O Probe material for reactive gases Residence time for reactive gases Any changes within the next 18 months? Suitable for comparison to the NAAQS? Frequency of QC check (one-point) Annual Performance Evaluation date Borosilicate glass Borosilicate glass 7.0 sec 7.0 sec No No No Yes Yes n/a 1:2 1:2 8/28 9/11 12/9 NPAP (ARB) date Not done this year Not done this year
165 Appendix 2: Site Description Camp Pendleton Site Abbreviation (CMP) AQS# Page 3 of 6 Table 2.2b Camp Pendleton - Particulate Pollutants Monitor Designations Pollutant Monitor designation Parameter code Basic monitoring objective PM 2.5 Continuous (non-fem) POC 1 Other (LC) PI, Research Site type Monitor type Network affiliation UPBD O Instrument manufacturer & model Met One BAM 1020 Method code 733 FRM/FEM/ARM/Other Collecting agency Analytical laboratory Reporting agency Spatial scale Other (non-fem) APCD APCD APCD Urban Monitoring start date 10/24/2005 Current sampling frequency Required sampling frequency Sampling season Probe height supporting structure obstructions on roof obstructions not on roof trees Distance to furnace or incinerator flue Distance between collocated monitors Unrestricted airflow Probe material for reactive gases Residence time for reactive gases Any changes within the next 18 months? Suitable for comparison to the NAAQS? Frequency of flow rate verification Semi-Annual flow rate audits dates NPAP (ARB) date Continuous Continuous Year-round 5.0 meters 3.9 meters 35 meters 360 O No No Semi-monthly 8/27 2/5 Not done this year
166 Appendix 2: Site Description Camp Pendleton Site Abbreviation (CMP) AQS# Page 4 of 6 Table 2.2c Pollutant POC Camp Pendleton - Other Pollutants Monitor Designations PAMS- VOC 1 for 3-Hr samples 2 for 24-Hr samples PAMS- VOC (collocated) 1 for 3-Hr samples 2 for 24-Hr samples Monitor designation O QAC Parameter code Basic monitoring objective Site type See PAMS Table 12.2b Research Upwind background See PAMS Table 12.2b Research Quality Assurance Monitor type SLAMS O Network affiliation PAMS Type I Instrument manufacturer & model Xontech 910 & 912 Xontech 910 & 912 Method code FRM/FEM/ARM/Other Collecting agency APCD APCD Analytical laboratory APCD APCD Reporting agency APCD APCD Spatial scale Scale Scale Monitoring start date /2011 Current sampling frequency Required sampling frequency Sampling season 1:6 1:6 1:6 1:6 3-Hr (Jul-Oct) 24-Hr (Nov-Jun) 3-Hr (Jul-Oct) 24-Hr (Nov-Jun) Probe height 5.6 meters 5.6 meters supporting structure obstructions on roof obstructions not on roof 7.2 meters 7.5 meters trees 35 meters 35 meters Distance to furnace or incinerator flue Distance between collocated monitors 0.7 meters 0.7 meters Unrestricted airflow 360 O 360 O Probe material for reactive gases Residence time for reactive gases Any changes within the next 18 months? Suitable for comparison to the NAAQS? Frequency of QC check (one-point) Annual Performance Evaluation date No No NPAP (ARB) date
167 Appendix 2: Site Description Camp Pendleton Site Abbreviation (CMP) AQS# Page 5 of 6 Table 2.2d Pollutant Camp Pendleton - Meteorological Equipment Designations + Other Other Internal Temp Meteorological Wind Speed Meteorological Wind Direction Meteorological External Temp POC Monitor designation Parameter code Basic monitoring objective Site type Monitor type SLAMS SLAMS SLAMS SLAMS Network affiliation PAMS PAMS PAMS PAMS Instrument manufacturer & model Qualimetrics Qualimetrics Qualimetrics Rotronics Method code FRM/FEM/ARM/Other O O O O Collecting agency APCD APCD APCD APCD Analytical laboratory APCD APCD APCD APCD Reporting agency APCD APCD APCD APCD Spatial scale Monitoring start date Current sampling frequency Required sampling frequency Continuous Continuous Continuous Continuous Continuous Continuous Continuous Continuous Sampling season Year-round Year-round Year-round Year-round Probe height 10 m 10 m 5 m supporting structure obstructions on roof obstructions not on roof trees 35 meters 35 meters 35 meters 35 meters Distance to furnace or incinerator flue Distance between collocated monitors Unrestricted airflow 360 O 360 O 360 O Probe material for reactive gases Residence time for reactive gases Any changes within the next 18 months? Suitable for comparison to the NAAQS? Frequency of QC check (one-point) Annual Performance Evaluation date No No No No 9/25 9/25 9/25 9/25 NPAP (ARB) date * * * *ARB does not have the equipment to audit.


168 Appendix 2: Site Description Camp Pendleton Site Abbreviation (CMP) AQS# Page 6 of 6 Figure 2.2 Camp Pendleton Pictures (Directional) from the Rooftop

169 Appendix 3: Site Description Chula Vista Site Abbreviation: CVA AQS# Page 1 of 6 Section Chula Vista Station Description and Statement of Purpose Table 3.1 General Site Information County: San Diego Representative Area: San Diego MSA Site Name: Chula Vista Year Established: 01/20/1972 Site Address: 80 East J St. Site Name Abbreviation: CVA AQS Number: Latitude: O Longitude: O Elevation above Sea Level: 55 m General Location: Trailer in the W corner of the Chula Vista Elementary School District offices parking lot Ground Cover: Asphalt Distance to Road: 51 m northwest= E. J St.; 301 m south-southeast Hilltop Dr. Traffic Count (2010 AADT): Hilltop Dr. at E. J St.= 9,100 Site Description: This station is a trailer located on the western corner of the Chula Vista Elementary School District Administration property, immediately south of Chula Vista Fire Station No. 2. Monitoring Objectives: Helps track trends for an area that has a high rate of asthma. Planned Changes: A new wood deck will replace the old one in Upon completion, a collocated PM 2.5 Manual sampler relocated from KVR and sited at CVA. Figure 3.1 Chula Vista Pictures of the Location of the Station
170 Appendix 3: Site Description Chula Vista Site Abbreviation: CVA AQS# Page 2 of 6 Table 3.2a Pollutant Chula Vista - Gaseous Pollutants Monitor Designations + Other O 3 NO 2 Other Zero Air POC 1 1 Monitor designation Other Primary Parameter code (NO 2) Basic monitoring objective Site type PI, NAAQS Population Exposure PI, NAAQS Population Exposure Monitor type SLAMS SLAMS Network affiliation Instrument manufacturer & model 49i 42i Teledyne-API 701H Method code FRM/FEM/ARM/Other FEM FRM Collecting agency APCD APCD APCD Analytical laboratory APCD APCD APCD Reporting agency APCD APCD APCD Spatial scale Scale Scale Not Applicable Monitoring start date Current sampling frequency Required sampling frequency Continuous Continuous Continuous Continuous Sampling season Year-round Year-round Probe height 6.0 meters 6.0 meters 6.0 meters supporting structure obstructions on roof obstructions not on roof trees Distance to furnace or incinerator flue Distance between collocated monitors Unrestricted airflow 360 O 360 O 360 O Probe material for reactive gases Residence time for reactive gases Any changes within the next 18 months? Suitable for comparison to the NAAQS? Frequency of QC check (one-point) Annual Performance Evaluation date Borosilicate glass Borosilicate glass 4.77 sec 4.77 sec Yes Yes Yes Yes Yes 1:2 1:2 5/28, 3/5 5/25, 3/27 7/6 NPAP (ARB) date Not Done this Year Not Done this Year
171 Appendix 3: Site Description Chula Vista Site Abbreviation: CVA AQS# Page 3 of 6 Table 3.2b Chula Vista - Particulate Pollutants Monitor Designations Pollutant PM 2.5 Manual (FRM) POC 1 PM 10 Manual 1 (LC) 2 (STD) PM 10 Manual (collocated) 2 (LC) 3 (STD) Monitor designation Primary Primary Quality Assurance Parameter code Basic monitoring objective Site type (LC) (LC) (STD) (LC) (STD) PI, Research NAAQS NAAQS NAAQS Population Exposure Population Exposure Monitor type SLAMS SLAMS SLAMS Network affiliation Instrument manufacturer & model 2025 GMW 2000H w/ SA 1200 Head GMW 2000H w/ SA 1200 Head Method code 145 (LC) FRM/FEM/ARM/Other FRM FRM FRM Collecting agency APCD APCD APCD Analytical laboratory APCD APCD APCD Reporting agency APCD APCD APCD Spatial scale Scale Scale Scale Monitoring start date /6/2012 Current sampling frequency Required sampling frequency 1:3 1:6 1:12 1:3 1:6 1:12 Sampling season Year-round Year-round Year-round Probe height 5.6 meters 5.0 meters 5.0 meters supporting structure obstructions on roof obstructions not on roof trees Distance to furnace or incinerator flue Distance between collocated monitors Unrestricted airflow 360 O 360 O 360 O Probe material for reactive gases Residence time for reactive gases Any changes within the next 18 months? Suitable for comparison to the NAAQS? Frequency of flow rate verification Semi-Annual flow rate audits dates Yes Yes Yes Yes Yes Yes (if PRI does not run) Monthly Monthly Monthly 6/4, 12/30 2/4, 7/21 2/4, 7/21 NPAP (ARB) date Not Done this Year Not Done this Year Not Done this Year PEP (EPA) date 2/17
172 Appendix 3: Site Description Chula Vista Site Abbreviation: CVA AQS# Page 4 of 6 Table 3.2c Pollutant Chula Vista - Other Pollutants Monitor Designations Toxics- VOC Toxics- Metals Toxics- Cr(VI) Toxics- Aldehyde POC See ARB See ARB See ARB See ARB Monitor designation Parameter code See ARB See ARB See ARB See ARB Basic monitoring objective Site type Research Research Research Research Population Exposure Population Exposure Population Exposure Population Exposure Monitor type CA Toxics CA Toxics CA Toxics CA Toxics Network affiliation CA Toxics CA Toxics CA Toxics CA Toxics Instrument manufacturer & model Xontech 910 Xontech 924 Xontech 924 Xontech 924 Method code See ARB See ARB See ARB See ARB FRM/FEM/ARM/Other Other Other Other Other Collecting agency APCD APCD APCD APCD Analytical laboratory ARB ARB ARB ARB Reporting agency ARB ARB ARB ARB Spatial scale Scale Scale Scale Scale Monitoring start date Current sampling frequency Required sampling frequency 1:12 1:12 1:12 1:12 1:6 1:6 1:6 1:6 Sampling season Year-round Year-round Year-round Year-round Probe height 5.6 meters 5.6 meters 5.6 meters 5.6 meters supporting structure obstructions on roof obstructions not on roof trees Distance to furnace or incinerator flue Distance between collocated monitors Unrestricted airflow 360 O 360 O 360 O 360 O Probe material for reactive gases Residence time for reactive gases Any changes within the next 18 months? Suitable for comparison to the NAAQS? Frequency of flow rate verification Semi-Annual flow rate audits dates Yes Yes Yes Yes NPAP (ARB) date
173 Appendix 3: Site Description Chula Vista Site Abbreviation: CVA AQS# Page 5 of 6 Table 3.2d Pollutant Chula Vista - Meteorological Equipment Designations + Other Other Internal Temp Meteorological Wind Speed Meteorological Wind Direction Meteorological External Temp POC Monitor designation Parameter code Basic monitoring objective Site type Monitor type SLAMS SLAMS SLAMS SLAMS Network affiliation Instrument manufacturer & model Qualimetrics Qualimetrics Qualimetrics Rotronics Method code FRM/FEM/ARM/Other O O O O Collecting agency APCD APCD APCD APCD Analytical laboratory APCD APCD APCD APCD Reporting agency APCD APCD APCD APCD Spatial scale Monitoring start date Current sampling frequency Required sampling frequency Continuous Continuous Continuous Continuous Continuous Continuous Continuous Continuous Sampling season Year-round Year-round Year-round Year-round Probe height 10 m 10 m 5 m supporting structure obstructions on roof obstructions not on roof trees Distance to furnace or incinerator flue Distance between collocated monitors Unrestricted airflow 360 O 360 O 360 O Probe material for reactive gases Residence time for reactive gases Any changes within the next 18 months? Suitable for comparison to the NAAQS? Frequency of QC check (one-point) Annual Performance Evaluation date No No No No 6/3 6/3 6/3 6/3 NPAP (ARB) date * * * *ARB does not have the equipment to audit.


174 Appendix 3: Site Description Chula Vista Site Abbreviation: CVA AQS# Page 6 of 6 Figure 3.2 Chula Vista Pictures (Directional) form the Rooftop

175 Appendix 4: Site Description Del Mar Site Abbreviation: DMR AQS# Page 1 of 4 Section Del Mar Station Description and Statement of Purpose Table 4.1 General Site Information County: San Diego Representative Area: San Diego MSA Site Name: Del Mar Year Established: 10/14/1983 Site Address: th St. Site Name Abbreviation: DMR AQS Number: Latitude: Longitude: Elevation above Sea Level: 39 m General Location: Trailer in the NW corner of the Winston School parking lot Ground Cover: Asphalt Distance to Road: 12.2 m west= Stratford Ct. Traffic Count (2010 AADT): Site Description: Monitoring Objectives: Planned Changes: No traffic count is available for the Stratford Ct, nor the closest cross street, 9 th St.; the estimated AADT= 3,000 Del Mar Heights Rd. at Camino Del Mar (SE/downwind 512 m)= 16,200 This station is a trailer located on the western section of the fence line of Winston School parking lot in the city of Del Mar. The primary function of this site is to monitor background levels of ozone on non-transport days, and to measure ozone concentrations during periods of over-water transport from the South Coast Air Basin. There are bushes less than 10 m from the inlet or the probe, but the bushes are 2 m below the inlet and are trimmed regularly to maintain this height. The measured values at this location compare with the ones at CMP and the vegetation does not impact the quality of the data. Figure 4.1 Del Mar Picture of the Location of the Station
176 Appendix 4: Site Description Del Mar Site Abbreviation: DMR AQS# Page 2 of 4 Table 4.2a Pollutant Del Mar - Gaseous Pollutants Monitor Designations + Other O 3 Other Zero Air POC 1 Monitor designation O Parameter code Basic monitoring objective Site type PI, NAAQS General/ Background Monitor type SLAMS Network affiliation Instrument manufacturer & model 49 series Teledyne-API 701H Method code 047 FRM/FEM/ARM/Other FRM Collecting agency APCD APCD Analytical laboratory APCD APCD Reporting agency APCD APCD Spatial scale Scale Not Applicable Monitoring start date 10/ Current sampling frequency Required sampling frequency Continuous Continuous Sampling season Year- round Probe height 4.2 meters 6.0 meters supporting structure obstructions on roof obstructions not on roof trees 19.7 meters Distance to furnace or incinerator flue Distance between collocated monitors Unrestricted airflow 360 O 360 O Probe material for reactive gases Residence time for reactive gases Any changes within the next 18 months? Suitable for comparison to the NAAQS? Frequency of QC check (one-point) Annual Performance Evaluation date Teflon 2.7 sec No Yes Yes 1:14 6/29 6/29 NPAP (ARB) date Not done this Year
177 Appendix 4: Site Description Del Mar Site Abbreviation: DMR AQS# Page 3 of 4 Table 4.2b Pollutant Del Mar - Meteorology Equipment Designations + Other Other Internal Temp Meteorological Wind Speed Meteorological Wind Direction POC Monitor designation Parameter code Basic monitoring objective Site type Monitor type SLAMS SLAMS SLAMS Network affiliation Instrument manufacturer & model Qualimetrics Qualimetrics Qualimetrics Method code FRM/FEM/ARM/Other O O O Collecting agency APCD APCD APCD Analytical laboratory APCD APCD APCD Reporting agency APCD APCD APCD Spatial scale Monitoring start date Current sampling frequency Required sampling frequency Continuous Continuous Continuous Continuous Continuous Continuous Sampling season Year-round Year-round Year-round Probe height 10 m 10 m supporting structure obstructions on roof obstructions not on roof trees 19.7 m 19.7 m 19.7 m Distance to furnace or incinerator flue Distance between collocated monitors Unrestricted airflow 360 O 360 O Probe material for reactive gases Residence time for reactive gases Any changes within the next 18 months? Suitable for comparison to the NAAQS? Frequency of QC check (one-point) Annual Performance Evaluation date No No No 7/29 7/29 7/29 NPAP (ARB) date * * *ARB does not have the equipment to audit.


178 Appendix 4: Site Description Del Mar Site Abbreviation: DMR AQS# Page 4 of 4 Figures 4.2 Del Mar Pictures (Directional) from the Ground* *There is no deck from which to take pictures.

179 Appendix 5: Site Description Donovan Site Abbreviation: DVN AQS# Page 1 of 6 Section Donovan Station Description and Statement of Purpose Table 5.1 General Site Information County: San Diego Representative Area: San Diego MSA Site Name: Donovan Year Established: 1/2005 PM10 sampler original site date; Relocated 800 m east on 7/2014 Site Address: Donovan State Prison Rd. (200 m west of Alta Rd.) Site Name Abbreviation: DVN AQS Number: Latitude: O Longitude: O Elevation above Sea Level: 185 m General Location: 200 m east of Alta Rd on the Donovan Prison Rd. Ground Cover: Asphalt Distance to Road: 26 m north= Donovan Prison Rd. Traffic Count (2010 AADT): No traffic count is available for Donovan Prison Rd.; AADT estimated= 300 Otay Mesa Rd. at Alta Rd. southwest/downwind 2,100 m = 5,900 Site Description: This site is situated at the entrance to the Richard J. Donovan Correctional Facility. Monitoring Objectives: This site is primarily used to measure neighborhood scale concentrations in the southeast county. Planned Changes: None Figure 5.1 Donovan Picture of the Location
180 Appendix 5: Site Description Donovan Site Abbreviation: DVN AQS# Page 2 of 6 Table 5.2a Pollutant Donovan - Gaseous Pollutants Monitor Designations + Other O 3 NO 2 Other Zero Air POC 1 1 Monitor designation Other Primary Parameter code (NO 2) Basic monitoring objective Site type PI, NAAQS Population Exposure PI, NAAQS Population Exposure Monitor type SLAMS SLAMS Network affiliation Instrument manufacturer & model 49i 42i Teledyne-API 701 Method code FRM/FEM/ARM/Other FEM FRM Collecting agency APCD APCD APCD Analytical laboratory APCD APCD APCD Reporting agency APCD APCD APCD Spatial scale Scale Scale Monitoring start date 7/2014 7/2014 7/2014 Current sampling frequency Required sampling frequency Continuous Continuous Continuous Continuous Sampling season Year-round Year-round Probe height 6.6 meters 6.6 meters supporting structure obstructions on roof obstructions not on roof trees Distance to furnace or incinerator flue Distance between collocated monitors Unrestricted airflow 360 O 360 O 360 O Probe material for reactive gases Residence time for reactive gases Any changes within the next 18 months? Suitable for comparison to the NAAQS? Frequency of QC check (one-point) Annual Performance Evaluation date Borosilicate glass Borosilicate glass 5.48 sec 5.48 sec Not Applicable Not Applicable No No No Yes Yes 1:2 1:2 1:2 4/24 4/23 5/1 NPAP (ARB) date Not Done this year Not Done this year
181 Appendix 5: Site Description Donovan Site Abbreviation: DVN AQS# Page 3 of 6 Table 5.2b Donovan - Particulate Pollutants Monitor Designations Pollutant PM 2.5 Continuous (non-fem) PM 10 Manual (Hi-Vol) POC 1 1 Monitor designation Other Other Parameter code Basic monitoring objective Site type (LC) PI, Research Population Exposure (LC) (STD) NAAQS Population Exposure Monitor type SLAMS SLAMS Network affiliation Instrument manufacturer & model Met One BAM 1020 GMW 2000H w/ SA 1200 Head Method code FRM/FEM/ARM/Other Other (non-fem) FRM Collecting agency APCD APCD Analytical laboratory APCD APCD Reporting agency APCD APCD Spatial scale Population Exposure Scale Monitoring start date 1/21/2015 7/2014 Current sampling frequency Required sampling frequency Continuous 1:6 Continuous 1:6 Sampling season Year-round Year-round Probe height 6.7 meters 6.0 meters supporting structure obstructions on roof obstructions not on roof trees Distance to furnace or incinerator flue Distance between collocated monitors Unrestricted airflow 360 O 360 O Probe material for reactive gases Residence time for reactive gases Any changes within the next 18 months? Suitable for comparison to the NAAQS? Frequency of flow rate verification Semi-Annual flow rate audits dates No No Semi-monthly 7/28, 11/30 No No monthly 5/01, 10/28 NPAP (ARB) date Not Done this year Not Done this year
182 Appendix 5: Site Description Donovan Site Abbreviation: DVN AQS# Page 4 of 6 Table 5.2c Pollutant Monitor designation Parameter code Basic monitoring objective Donovan - Other Pollutants Monitor Designations TOXICS- VOC TOXICS- VOC (collocated) TOXICS- Metals POC Site type Monitor type Not Applicable See Toxics sec Table QAC See Toxics sec Table Not Applicable Collected; Not analyzed Research Research Research Population Exposure Other (SDAPCD Network) Population Exposure Other (SDAPCD Network) Population Exposure Other (SDAPCD Network) Network affiliation Instrument manufacturer & model Xontech 910A (Fused Silica Lined) Xontech 910A (Fused Silica Lined) Method code Xontech 924 Collected; Not analyzed FRM/FEM/ARM/Other Other Other Other Collecting agency APCD APCD APCD Analytical laboratory APCD APCD APCD Reporting agency APCD APCD APCD Spatial scale Scale Scale Scale Monitoring start date 7/2014 7/2014 7/2014 Current sampling frequency Required sampling frequency 1:12 1:12 1:12 1:6 1:6 1:6 Sampling season Year-round Year-round Year-round Probe height 6.4 meters 6.4 meters 6.5 meters supporting structure obstructions on roof obstructions not on roof trees Distance to furnace or incinerator flue Distance between collocated monitors Unrestricted airflow 360 O 360 O 360 O Probe material for reactive gases Residence time for reactive gases Any changes within the next 18 months? Suitable for comparison to the NAAQS? Frequency of flow rate verification Semi-Annual flow rate audits dates Yes Yes Yes NPAP (ARB) date
183 Appendix 5: Site Description Donovan Site Abbreviation: DVN AQS# Page 5 of 6 Table 5.2d Pollutant Donovan - Meteorological Equipment Monitor Designations + Other Other Internal Temp Meteorological Wind Speed Meteorological Wind Direction Meteorological External Temp POC Monitor designation Parameter code Basic monitoring objective Site type Monitor type SLAMS SLAMS SLAMS SLAMS Network affiliation Instrument manufacturer & model Qualimetrics Qualimetrics Qualimetrics Rotronics Method code FRM/FEM/ARM/Other O O O O Collecting agency APCD APCD APCD APCD Analytical laboratory APCD APCD APCD APCD Reporting agency APCD APCD APCD APCD Spatial scale Monitoring start date 7/2014 7/2014 7/2014 7/2014 Current sampling frequency Required sampling frequency Continuous Continuous Continuous Continuous Continuous Continuous Continuous Continuous Sampling season Year-round Year-round Year-round Year-round Probe height 10 m 10 m 5 m supporting structure obstructions on roof obstructions not on roof trees Distance to furnace or incinerator flue Distance between collocated monitors Unrestricted airflow 360 O 360 O 360 O Probe material for reactive gases Residence time for reactive gases Any changes within the next 18 months? Suitable for comparison to the NAAQS? Frequency of QC check (one-point) Annual Performance Evaluation date No No No No 7/14 7/14 7/14 7/14 NPAP (ARB) date * * * *ARB does not have the equipment to audit.


184 Appendix 5: Site Description Donovan Site Abbreviation: DVN AQS# Page 6 of 6 Figure 5.2 Donovan Pictures (Directional) from the Rooftop

185 Appendix 6: Site Description San Diego Beardsley St. Site Abbreviation: DTN AQS# Page 1 of 6 Section San Diego / Beardsley St. Station Description and Statement of Purpose Table 6.1 General Site Information County: San Diego Representative Area: San Diego MSA Site Name: San Diego-Beardsley St. Year Established: 7/14/2005 Site Address: 1110a Sigsbee St. Site Name Abbreviation: DTN AQS Number: Latitude: O Longitude: O Elevation above Sea Level: 8 m General Location: Trailer in the SW corner of the Perkins Elementary school parking lot Ground Cover: Asphalt Distance to Road: 10.7 m north= Sigsbee St. Traffic Count (2010 AADT): Main St. at Sigsbee St.= 3,000 This site is centered in the heart of the Downtown/South Bay industrial zone, and captures Site Description: emissions from Interstates 5, 805, 15 and Route 94, downtown San Diego, Lindbergh Field, North Island Naval Air Station, marine terminals, NASSCO shipyards, Continental Maritime shipyard, Southwest Marine, train yards, and harbor ship traffic. This site is in an Environmental Justice area. Forecasting of PM 2.5 levels for several monitoring Monitoring Objectives: sites (from Chula Vista to Kearny Mesa) is partially based upon the values collected at this site. This location is useful for capturing high NO 2 concentrations, and assessing ozone transport from the south (Baja, Mexico). Planned Changes: In July 2016, due to a multi-year school redevelopment construction project, the District had to permanently relocate to Sherman Elementary School in Sherman Heights. Figure 6.1 Downtown Picture of the Location of the Station
186 Appendix 6: Site Description San Diego Beardsley St. Site Abbreviation: DTN AQS# Page 2 of 6 Table 6.2a Pollutant Downtown - Gaseous Pollutants Monitor Designations + Other O 3 NO 2 CO Other Zero Air POC Monitor designation Other Primary Other Parameter code (NO 2) Basic monitoring objective Site type PI, NAAQS Population Exposure PI, NAAQS Population Exposure PI, NAAQS Population Exposure Monitor type SLAMS SLAMS SLAMS Network affiliation Instrument manufacturer & model 49i 42i 48i Teledyne-API 701H Method code FRM/FEM/ARM/Other FEM FRM FRM Collecting agency APCD APCD APCD APCD Analytical laboratory APCD APCD APCD APCD Reporting agency APCD APCD APCD APCD Spatial scale Scale Scale Scale Monitoring start date 7/2005 7/2005 7/2005 7/2005 Current sampling frequency Required sampling frequency Continuous Continuous Continuous Continuous Continuous Continuous Sampling season Year-round Year-round Year-round Probe height 6.0 meters 6.0 meters 6.0 meters supporting structure obstructions on roof obstructions not on roof trees 21 meters 21 meters 21 meters Distance to furnace or incinerator flue Distance between collocated monitors Unrestricted airflow 360 O 360 O 360 O 360 O Probe material for reactive gases Residence time for reactive gases Any changes within the next 18 months? Suitable for comparison to the NAAQS? Frequency of QC check (one-point) Annual Performance Evaluation date Borosilicate glass Borosilicate glass Borosilicate glass 5.01 sec 5.01 sec 5.01 sec Yes Yes Yes Yes Yes Yes Yes 1:2 1:2 1:2 2/26 3/4 2/27, 6/26 NPAP (ARB) Date 8/12/2015 8/12/2015 Not Done
187 Appendix 6: Site Description San Diego Beardsley St. Site Abbreviation: DTN AQS# Page 3 of 6 Table 6.2b Downtown - Particulate Pollutants Monitor Designations Pollutant PM 2.5 Continuous PM 2.5 Manual PM 2.5 CSN, SU PM 10 Manual POC Monitor designation Other Primary Other Parameter code (LC) (LC) Basic monitoring objective Site type See PM 2.5 Table 9.3b (LC) (STD) PI, Research NAAQS Research NAAQS Population Exposure Population Exposure Monitor type SLAMS SLAMS Network affiliation Instrument manufacturer & model Met One BAM Method code Population Exposure Supplemental Speciation CSN SU SDAPCD Network Met One SASS See PM 2.5 Chapter Population Exposure SLAMS GMW 2000H w/ SA 1200 Head FRM/FEM/ARM/Other Other (non-ffem) FRM Other FRM Collecting agency APCD APCD APCD APCD Analytical laboratory APCD APCD APCD APCD Reporting agency APCD APCD APCD APCD Spatial scale Scale Scale Scale 063 Scale Monitoring start date 7/2005 7/2005 8/10/2008 7/2005 Current sampling frequency Required sampling frequency Continuous 1:3 1:6 1:6 Continuous 1:3 1:6 1:6 Sampling season Year-round Year-round Year-round Year-round Probe height 5.7 meters 5.7 meters 5.5 meters 5.1 meters supporting structure obstructions on roof obstructions not on roof trees 21 meters 21 meters 21 meters 21 meters Distance to furnace or incinerator flue Distance between collocated monitors Unrestricted airflow 360 O 360 O 360 O 360 O Probe material for reactive gases Residence time for reactive gases Any changes within the next 18 months? Suitable for comparison to the NAAQS? Frequency of flow rate verification Semi-Annual flow rate audits dates Yes Yes Yes Yes No Yes Yes Semi-monthly Monthly Monthly Monthly 3/30, 8/25 3/24, 8/25 3/24, 8/25, 12/7 6/26, 12/17 NPAP (ARB) Date 8/12/2015 8/12/2015 8/12/2015 8/12/2015 PEP (EPA) date 8/19, 12/28
188 Appendix 6: Site Description San Diego Beardsley St. Site Abbreviation: DTN AQS# Page 4 of 6 Table 6.2c Pollutant Downtown - Other Pollutants Monitor Designations TOXIC- VOC TOXIC- Metals PAMS- Carbonyls (unofficial) POC Monitor designation Other Parameter code Basic monitoring objective Site type Monitor type See Toxics sec Table 13.b Collected; not analyzed See PAMS Table 12.2 Research Research Research Population Exposure Other (SDAPCD Network) Population Exposure Other (SDAPCD Network) Population Exposure Unofficial PAMS Network affiliation Instrument manufacturer & model Xontech 910A (Fused Silica Lined) Method code 210 Xontech 924 Xontech 924 Collected; not analyzed FRM/FEM/ARM/Other Other Other Other Collecting agency APCD APCD APCD Analytical laboratory APCD APCD APCD Reporting agency APCD APCD APCD Spatial scale Scale Scale 202 Scale Monitoring start date 1/2007 1/2005 7/2012 Current sampling frequency Required sampling frequency 1:6 1:12 1:6 1:6 1:6 1:6 Sampling season Year-round Year-round Year-round Probe height 6.0 meters 5.7 meters 5.7 meters supporting structure obstructions on roof obstructions not on roof trees 21 meters 21 meters 21 meters Distance to furnace or incinerator flue Distance between collocated monitors Unrestricted airflow 360 o 360 o 360 o Probe material for reactive gases Residence time for reactive gases Any changes within the next 18 months? Suitable for comparison to the NAAQS? Frequency of QC check (one-point) Annual Performance Evaluation date Yes Yes Yes Yes Yes Yes NPAP (ARB) Date
189 Appendix 6: Site Description San Diego Beardsley St. Site Abbreviation: DTN AQS# Page 5 of 6 Table 6.2d Pollutant Downtown - Meteorological Equipment Designations + Other Other Internal Temp Meteorological Wind Speed Meteorological Wind Direction Meteorological External Temp POC Monitor designation Parameter code Basic monitoring objective Site type Monitor type SLAMS SLAMS SLAMS SLAMS Network affiliation PAMS PAMS PAMS PAMS Instrument manufacturer & model Qualimetrics Qualimetrics Qualimetrics Rotronics Method code FRM/FEM/ARM/Other O O O O Collecting agency APCD APCD APCD APCD Analytical laboratory APCD APCD APCD APCD Reporting agency APCD APCD APCD APCD Spatial scale Monitoring start date 7/2005 7/2005 7/2005 7/2005 Current sampling frequency Required sampling frequency Continuous Continuous Continuous Continuous Continuous Continuous Continuous Continuous Sampling season Year-round Year-round Year-round Year-round Probe height 10 m 10 m 5 m supporting structure obstructions on roof obstructions not on roof trees 21 m 21 m 21 m 21 m Distance to furnace or incinerator flue Distance between collocated monitors Unrestricted airflow 360 O 360 O 360 O Probe material for reactive gases Residence time for reactive gases Any changes within the next 18 months? Suitable for comparison to the NAAQS? Frequency of QC check (one-point) Annual Performance Evaluation date No No No No 7/15 7/15 7/15 7/15 NPAP (ARB) Date * * * *ARB does not have the equipment to audit.


190 Appendix 6: Site Description San Diego Beardsley St. Site Abbreviation: DTN AQS# Page 6 of 6 Figure 6.2 Downtown Pictures (Directional) from the Rooftop
 Year Established: 3/10/2012 at old location; 11/1/2014 and current location Site")
191 Appendix 7: Site Description McClellan-Palomar Airport Site Abbreviation: CRQ AQS# Page 1 of 3 Section McClellan-Palomar Airport Station Description and Statement of Purpose Table 7.1 General Site Information County: San Diego Representative Area: San Diego MSA Site Name: McClellan-Palomar (Palomar) Year Established: 3/10/2012 at old location; 11/1/2014 and current location Site Address: 2192 Palomar Airport Rd. Site Name Abbreviation: CRQ AQS Number: Latitude: O Longitude: O Elevation above Sea Level: 92 m General Location: Adjacent to the business park (immediately north of the paved access road) Ground Cover: Paved Distance to Road: 380 m east= El Camino Real Traffic Count (2010 AADT): El Camino Real at Palomar Airport Rd. (27,300) Site Description: Adjacent to business park. In 2014, the samplers were moved from the blast shield area to the current location. There is an auxiliary Airport only access road about 3 meters from the samplers with an AADT= 8; because of this low traffic count, the El Camino Real Drive AADT was used. Additionally, the measurements from the road used El Camino Real Drive. Monitoring Objectives: To quantify airborne lead particulates from the combustion of aviation gasoline. Planned Changes: AQS number changed to from to reflect the change in the site location from the run-up area to by the business park Figure 7.1 Palomar Airport Picture of the Location
192 Appendix 7: Site Description McClellan-Palomar Airport Site Abbreviation: CRQ AQS# Page 2 of 3 Table 7.2a Pollutant Palomar Airport - Particulate Pollutants Monitor Designations Pb-TSP Hi-Vol (primary) Pb-TSP Hi-Vol (collocated) POC 1 2 Monitor designation PRI QAC Parameter code Basic monitoring objective NAAQS NAAQS Site type Source Oriented Source Oriented Monitor type SLAMS SLAMS Network affiliation Instrument manufacturer & model Tisch TE-5170BLVFC+ Tisch TE-5170BLVFC+ Method code FRM/FEM/ARM/Other FRM FRM Collecting agency APCD APCD Analytical laboratory APCD APCD Reporting agency APCD APCD Spatial scale Micro Scale Micro Scale Monitoring start date Current sampling frequency Required sampling frequency 3/10/2012 (old site) 11/1/2014 (current site) 3/10/2012 (old site) 11/1/2014 (current site) 1:6 1:12 1:6 1:12 Sampling season Year-round Year-round Probe height 3.1 meters 3.1 meters supporting structure obstructions on roof obstructions not on roof trees Distance to furnace or incinerator flue Distance between collocated monitors 3.0 meters 3.0 meters Unrestricted airflow 360 O 360 O Probe material for reactive gases Residence time for reactive gases Any changes within the next 18 months? Suitable for comparison to the NAAQS? Frequency of flow rate verification Semi-Annual flow rate audits dates No Yes Monthly 5/7, 9/25 No Yes Monthly 5/7, 9/25 NPAP (ARB) date 8/17/2015 8/17/2015 PEP (EPA) date None None


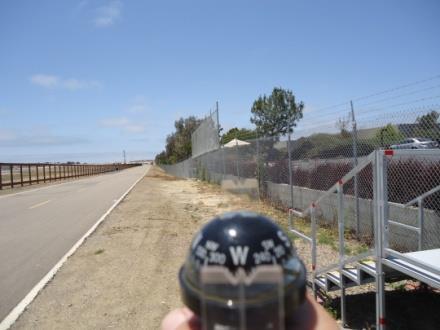


193 Appendix 7: Site Description McClellan-Palomar Airport Site Abbreviation: CRQ AQS# Page 3 of 3 Figure 7.1 Palomar Airport Pictures (Directional) from the Ground* *The sampler is situated at ground level

194 Appendix 8: Site Description Escondido Site Abbreviation: ESC AQS# Page 1 of 6 Section Escondido Station Description and Statement of Purpose Table 8.1 General Site Information County: San Diego Representative Area: San Diego MSA Site Name: Escondido Year Established: 5/1972 Site Address: 600 E. Valley Parkway Site Name Abbreviation: ESC AQS Number: Latitude: O Longitude: O Elevation above Sea Level: 200 m General Location: Trailer in the SE corner of the County Heath Complex Ground Cover: Asphalt Distance to Road: 85 m northeast= Fig St. Traffic Count (2010 AADT): E. Valley Parkway at Fig St. = 2,500 Escondido is a city located in the north-eastern region of the populated portion of the County. It Site Description: is located about 21 miles between Camp Pendleton and El Cajon. It has a population of about 140,000 people and covers an area of about 37 square miles. The station is across the street from Pomerado hospital. The Escondido site represents a major population center located in the inland North County along the Interstate 15/Highway 78 section of the County. It is impacted from the transportation Monitoring Objectives: corridor from the communities along these two highways. This location is like the El Cajon site and can be classified as a PAMS II location; it provides valuable data concerning the fate of coastal emissions, which react in sunlight to form ozone as they are carried eastward with the prevailing winds. This site is extremely important for burn/no-burn decisions. In August 2016, due to a multi-year redevelopment construction project, the District had to shut Planned Changes: down this station. Once the construction has been complete, the District will re-start monitoring (early 2017). Figure 8.1 Escondido Picture of the Location
195 Appendix 8: Site Description Escondido Site Abbreviation: ESC AQS# Page 2 of 6 Table 8.2a Pollutant Escondido - Gaseous Pollutants Monitor Designations + Other O 3 NO 2 CO Other Zero Air POC Monitor designation Other Primary Other Parameter code (NO 2) Basic monitoring objective Site type PI, NAAQS Population Exposure PI, NAAQS Population Exposure PI, NAAQS Population Exposure Monitor type SLAMS SLAMS SLAMS Network affiliation Instrument manufacturer & model 49i 42i 48i Teledyne-API 701 Method code FRM/FEM/ARM/Other FEM FRM FRM Collecting agency APCD APCD APCD APCD Analytical laboratory APCD APCD APCD APCD Reporting agency APCD APCD APCD APCD Spatial scale Scale Scale Scale Monitoring start date 11/21/1973 6/1/ /29/ Current sampling frequency Required sampling frequency Continuous Continuous Continuous Continuous Continuous Continuous Sampling season Year round Year round Year round Probe height 6.2 meters 6.2 meters 6.2 meters supporting structure obstructions on roof obstructions not on roof trees 15.2 meters 15.2 meters 15.2 meters Distance to furnace or incinerator flue Distance between collocated monitors Unrestricted airflow 360 O 360 O 360 O Probe material for reactive gases Residence time for reactive gases Any changes within the next 18 months? Suitable for comparison to the NAAQS? Frequency of QC check (one-point) Annual Performance Evaluation date Borosilicate glass Borosilicate glass Borosilicate glass 4.76 sec 4.76 sec 4.76 sec Yes Yes Yes Yes Yes Yes Yes 1:14 1:14 1:14 * * * * NPAP (ARB) date 8/18/2015 8/18/2015 8/18/2015 MONITORING END DATE *Shut-down before Annual Performance Evaluation and NPAP. 8/27/2015 8/27/2015 8/27/2015 8/27/2015
196 Appendix 8: Site Description Escondido Site Abbreviation: ESC AQS# Page 3 of 6 Table 8.2b1 Escondido - Particulate Pollutants Monitor Designations Pollutant PM 2.5 Continuous PM 2.5 Manual PM 2.5 STN PM 2.5 CSN PM 2.5 CSN, SU POC Monitor designation O PRI PRI Parameter code (LC) (LC) See CARB See CARB Basic monitoring objective Site type PI, Research Population Exposure See PM 2.5 Chapter PM 10 Manual (Hi-Vol) (LC) (STD) NAAQS Research Research Research NAAQS Population Exposure Population Exposure Population Exposure Population Exposure Population Exposure Monitor type SLAMS SLAMS SLAMS SLAMS SLAMS Network affiliation CSN STN CSN STN CSN SU Instrument manufacturer & model Met One BAM Met One SASS Met One SASS Method code See CARB See CARB Met One SASS See PM 2.5 Chapter Not Applicable GMW 2000H w/ SA 1200 Head FRM/FEM/ARM/Other Other FRM Other Other Other FRM Collecting agency APCD APCD APCD APCD APCD APCD Analytical laboratory APCD APCD CARB CARB APCD APCD Reporting agency APCD APCD CARB CARB APCD APCD Spatial scale Scale Scale Scale Scale Scale 063 Monitoring start date 2/22/05 1/1/1999 7/20/2007 5/3/2007 2/24/2008 9/4/1991 Current sampling frequency Required sampling frequency Continuous 1:3 1:6 1:6 1:6 1:6 Continuous 1:6 1:6 Sampling season Year round Year round Year round Year round Year round Year round Probe height 5.9 meters 5.6 meters 5.9 meters 5.9 meters 5.9 meters 5.6 meters supporting structure obstructions on roof obstructions not on roof trees 15.2 meters 15.2 meters 15.2 meters 15.2 meters 15.2 meters 15.2 meters Distance to furnace or incinerator flue Distance between collocated monitors Unrestricted airflow 360 O 360 O 360 O 360 O 360 O 360 O Probe material for reactive gases Residence time for reactive gases Any changes within the next 18 months? Suitable for comparison to the NAAQS? Frequency of flow rate verification Semi-Annual flow rate audits dates Yes Yes Yes Yes Yes Yes No Yes Yes Semi-monthly Monthly Monthly Monthly Monthly Monthly 5/21, * 7/15 * 5/21, * NPAP (ARB) date 8/18/2015 8/18/2015 8/18/2015 PEP (EPA) date * MONITORING END DATE *Shut-down before Annual Performance Evaluation and NPAP. 8/27/2015 8/27/2015 8/27/2015 8/27/2015 8/27/2015 8/27/2015 5/21, * 5/21, * 7/2 *
197 Appendix 8: Site Description Escondido Site Abbreviation: ESC AQS# Page 4 of 6 Table 8.2c Pollutant Monitor designation Parameter code Basic monitoring objective Escondido - Other Pollutants Monitor Designations TOXIC- VOC POC 1 Site type Monitor type See Toxics Chapter Research Population Exposure Not Applicable Network affiliation SDAPCD Network Instrument manufacturer & model Xontech 910A (Fused Silica Lined) Method code 210 FRM/FEM/ARM/Other Collecting agency Analytical laboratory Reporting agency Spatial scale Other APCD APCD APCD Scale Monitoring start date 1/2007 Current sampling frequency Required sampling frequency Sampling season Probe height supporting structure obstructions on roof obstructions not on roof trees Distance to furnace or incinerator flue Distance between collocated monitors Unrestricted airflow Probe material for reactive gases Residence time for reactive gases Any changes within the next 18 months? Suitable for comparison to the NAAQS? Frequency of flow rate verification Semi-Annual flow rate audits dates NPAP (ARB) date MONITORING END DATE 1:6 1:6 Year-round 5.7 meters 15.2 meters 360 O Yes 8/27/2015
198 Appendix 8: Site Description Escondido Site Abbreviation: ESC AQS# Page 5 of 6 Table 8.2d Pollutant Escondido - Meteorological Equipment Designations + Other Other Internal Temp Meteorological Wind Speed Meteorological Wind Direction Meteorological External Temp POC Monitor designation Parameter code Basic monitoring objective Data Data Data Data Site type Monitor type SLAMS SLAMS SLAMS SLAMS Network affiliation Instrument manufacturer & model Qualimetrics Qualimetrics Qualimetrics Rotronics Method code FRM/FEM/ARM/Other Other Other Other Other Collecting agency APCD APCD APCD APCD Analytical laboratory APCD APCD APCD APCD Reporting agency APCD APCD APCD APCD Spatial scale Scale Scale Scale Scale Monitoring start date 6/1/1974 6/1/1974 6/1/1974 2/20/1975 Current sampling frequency Required sampling frequency Continuous Continuous Continuous Continuous Continuous Continuous Continuous Continuous Sampling season Year-round Year-round Year-round Year-round Probe height 10 m 10 m 5.0 m supporting structure obstructions on roof obstructions not on roof trees 15.2 meters 15.2 meters 15.2 meters Distance to furnace or incinerator flue Distance between collocated monitors Unrestricted airflow 360 O 360 O 360 O Probe material for reactive gases Residence time for reactive gases Any changes within the next 18 months? Suitable for comparison to the NAAQS? Frequency of QC check (one-point) Annual Performance Evaluation date Yes Yes Yes Yes ** ** ** ** NPAP (ARB) date * * * * MONITORING END DATE *ARB does not have the equipment to audit. *Shut-down before Annual Performance Evaluation and NPAP. 8/27/2015 8/27/2015 8/27/2015 8/27/2015


199 Appendix 8: Site Description Escondido Site Abbreviation: ESC AQS# Page 6 of 6 Figure 8.2 Escondido - Pictures (Directional) from the Rooftop

200 Appendix 9: Site Description San Diego Kearny Villa Road Site Abbreviation: KVR AQS# Page 1 of 7 Section Kearny Villa Road Station Description and Statement of Purpose Table 9.1 General Site Information County: San Diego Representative Area: San Diego MSA Site Name: Kearny Villa Rd. Year Established: 11/5/2010 Site Address: None Site Name Abbreviation: KVR AQS Number: Latitude: O Longitude: O Elevation above Sea Level: 132 m General Location: Trailer in the SW corner of Camp Elliot (adjacent to Marine Corps Air Station Miramar). Ground Cover: Asphalt & Packed dirt Distance to Road: 180 m west= Kearny Villa Rd. 542 m southwest= Ruffin Rd. Traffic Count (2010 AADT): Kearny Villa Rd. at Ruffin Rd = 11,000 When this location housed only a wind profiler, it was originally called Miramar (MMR). In Site Description: 2011, when the District relocated the Overland station alongside the wind profiler, it was formally redesignated as KVR. Both are located on the southeast section of Marine Corps Air Station Miramar (MCAS). Monitoring Objectives: This site is a PAMS II location. It provides representative data for a large area and is quality assurance location for the PM 2.5 Manual program. Planned Changes: PAMS-Carbonyl sampling will resume in mid-2016 Table 9.1 Kearny Villa Road Picture of the Location
201 Appendix 9: Site Description San Diego Kearny Villa Road Site Abbreviation: KVR AQS# Page 2 of 7 Table 9.2a Pollutant Kearny Villa Road - Gaseous Pollutants Monitor Designations + Other O 3 NO 2 Other Zero Air POC 1 1 Monitor designation PRI Parameter code (NO 2) Basic monitoring objective Site type PI, NAAQS Population Exposure PI, NAAQS Population Exposure Monitor type SLAMS SLAMS Network affiliation PAMS PAMS Instrument manufacturer & model 49i 42i Teledyne-API 701H Method code FRM/FEM/ARM/Other FEM FRM Collecting agency APCD APCD APCD Analytical laboratory APCD APCD APCD Reporting agency APCD APCD APCD Spatial scale Scale Scale Monitoring start date 11/5/ /5/ /5/2010 Current sampling frequency Required sampling frequency Continuous Continuous Continuous Continuous Sampling season Year-round Year-round Probe height 7.3 meters 7.3 meters 7.3 meters supporting structure obstructions on roof obstructions not on roof trees Distance to furnace or incinerator flue Distance between collocated monitors Unrestricted airflow 360 O 360 O 360 O Probe material for reactive gases Residence time for reactive gases Any changes within the next 18 months? Suitable for comparison to the NAAQS? Frequency of QC check (one-point) Annual Performance Evaluation date Borosilicate glass Borosilicate glass 5.04 sec 5.04 sec No No No Yes Yes 1:2 1:2 1/28, 9/17 1/29 NPAP (ARB) date Not Done this Year Not Done this Year
202 Appendix 9: Site Description San Diego Kearny Villa Road Site Abbreviation: KVR AQS# Page 3 of 7 Table 9.2b Kearny Villa Road - Particulate Pollutants Monitor Designations Pollutant PM 2.5 Manual PM 2.5 Manual (collocated) PM 10 Manual Hi-Vol POC Monitor designation PRI QAC PRI Parameter code (LC) (LC) Basic monitoring objective Site type (LC) (STD) NAAQS NAAQS NAAQS Population Exposure QA Population Exposure Monitor type SLAMS SLAMS SLAMS Network affiliation Instrument manufacturer & model GMW 2000H w/ SA 1200 Head Method code FRM/FEM/ARM/Other FRM FRM FRM Collecting agency APCD APCD APCD Analytical laboratory APCD APCD APCD Reporting agency APCD APCD APCD Spatial scale Scale Scale Scale Monitoring start date 11/5/ /5/ /5/2010 Current sampling frequency Required sampling frequency 1:3 1:12 1:6 1:3 1:12 1:6 Sampling season Year-round Year-round Year-round Probe height 5.6 meters 5.6 meters 5.6 meters supporting structure obstructions on roof obstructions not on roof trees Distance to furnace or incinerator flue Distance between collocated monitors 2.1 meters 2.1 meters Unrestricted airflow 360 O 360 O 360 O Probe material for reactive gases Residence time for reactive gases Any changes within the next 18 months? Suitable for comparison to the NAAQS? Frequency of flow rate verification Semi-Annual flow rate audits dates No No No Yes Yes Yes Monthly Monthly Monthly 3/29, 10/22 *, 10/22 2/4, 7/21 NPAP (ARB) date Not Done this Year Not Done this Year Not Done this Year PEP (EPA) date 8/19 8/19 *Power supply problem with the collocated sampler. It did not get resolved until after the close of the quarter. All QC activities before and after the audit showed that the sampler was working within specifications.
203 Appendix 9: Site Description San Diego Kearny Villa Road Site Abbreviation: KVR AQS# Page 4 of 7 Table 9.2c Pollutant POC Monitor designation Parameter code Basic monitoring objective Site type Monitor type Kearny Villa Road - Other Pollutants Monitor Designations *PAMS- Carbonyls 1 for 3-Hr samples 2 for 24-Hr samples See PAMS Table 12.2 Research Population Exposure SLAMS Network affiliation PAMS Type II Instrument manufacturer & model Xontech 925 Method code 202 FRM/FEM/ARM/Other Collecting agency Analytical laboratory Reporting agency Spatial scale Other APCD APCD APCD Scale Monitoring start date 11/5/2010* Current sampling frequency Required sampling frequency Sampling season 1:6 1:6 3-Hr (Jul-Oct) 24-Hr (Nov-Jun) Probe height * supporting structure obstructions on roof obstructions not on roof trees Distance to furnace or incinerator flue Distance between collocated monitors Unrestricted airflow Probe material for reactive gases Residence time for reactive gases Any changes within the next 18 months? Suitable for comparison to the NAAQS? Frequency of flow rate verification Semi-Annual flow rate audits dates NPAP (ARB) date 360 O *While at the original PAMS Type II location in Kearny Mesa (San Diego-Overland), the instrument used to collect PAMS-carbonyl samples experienced catastrophic irreparable failure in the 4 th quarter, The District was instructed by the EPA to cease PAMS-carbonyl sampling at this location until the EPA reengineers the PAMS program; therefore, PAMS-carbonyl monitoring was never undertaken at the Kearny Villa Road location.
204 Appendix 9: Site Description San Diego Kearny Villa Road Site Abbreviation: KVR AQS# Page 5 of 7 Table 9.2d1 Pollutant Kearny Villa Road - Meteorological Equipment Designations + Other Other Internal Temp Meteorological Wind Speed Meteorological Wind Direction Meteorological External Temp Meteorological Rel. Humidity POC Monitor designation Parameter code Basic monitoring objective Site type Monitor type SLAMS SLAMS SLAMS SLAMS SLAMS Network affiliation PAMS PAMS PAMS PAMS PAMS Instrument manufacturer & model Qualimetrics Qualimetrics Qualimetrics Rotronics Rotronics Method code FRM/FEM/ARM/Other O O O O O Collecting agency APCD APCD APCD APCD APCD Analytical laboratory APCD APCD APCD APCD APCD Reporting agency APCD APCD APCD APCD APCD Spatial scale Scale Scale Scale Scale Scale Monitoring start date 11/5/ /5/ /5/ /5/ /5/2010 Current sampling frequency Required sampling frequency Continuous Continuous Continuous Continuous Continuous Continuous Continuous Continuous Continuous Continuous Sampling season Year round Year round Year round Year round Year round Probe height 10 m 10 m 5.5 m 5.5 m supporting structure obstructions on roof obstructions not on roof trees Distance to furnace or incinerator flue Distance between collocated monitors Unrestricted airflow 360 o 360 o 360 o 360 o Probe material for reactive gases Residence time for reactive gases Any changes within the next 18 months? Suitable for comparison to the NAAQS? Frequency of QC check (one-point) Annual Performance Evaluation date No No No No No 5/13 5/13 5/13 5/13 5/13 NPAP (ARB) date * * * *ARB does not have the equipment to audit
205 Appendix 9: Site Description San Diego Kearny Villa Road Site Abbreviation: KVR AQS# Page 6 of 7 Table 9.2d2 Pollutant Kearny Villa Road - Meteorological Equipment (Additional) Designations Barometric Pressure Solar Radiation **Upper-air wind & temperature POC 1 1 Monitor designation Parameter code Basic monitoring objective Site type Monitor type SLAMS SLAMS SLAMS Network affiliation PAMS PAMS PAMS Instrument manufacturer & model Rotronics Eppley Radian LAP 3000 Method code FRM/FEM/ARM/Other O O O Collecting agency APCD APCD APCD Analytical laboratory APCD APCD APCD Reporting agency APCD APCD APCD Spatial scale Scale Scale Scale Monitoring start date 11/5/ /5/ Current sampling frequency Required sampling frequency Continuous Continuous Continuous Continuous Continuous Continuous Sampling season Year-round Year-round Year-round Probe height 5.2 meters 5.2 meters supporting structure obstructions on roof obstructions not on roof trees Distance to furnace or incinerator flue Distance between collocated monitors Unrestricted airflow 360 o Probe material for reactive gases Residence time for reactive gases Any changes within the next 18 months? Suitable for comparison to the NAAQS? Frequency of QC check (one-point) Annual Performance Evaluation date No No No 5/13 5/13 NPAP (ARB) date * * **The Equipment is not operational and must be replaced


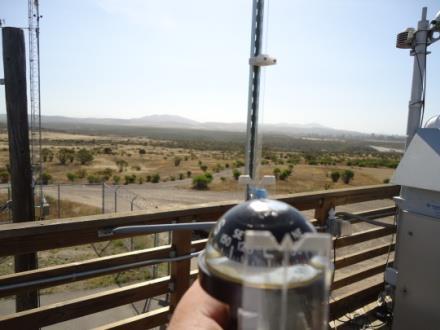


206 Appendix 9: Site Description San Diego Kearny Villa Road Site Abbreviation: KVR AQS# Page 7 of 7 Figure 9.2 Kearny Villa Road Pictures (Directional) from the Rooftop

207 Appendix 10: San Ysidro Site Abbreviation: SAY AQS# Page 1 of 3 Section San Ysidro Station Description and Statement of Purpose Table 10.1 General Site Information County: San Diego Representative Area: San Diego MSA Site Name: San Ysidro Year Established: 1/27/2015 Site Address: 795 East San Ysidro Blvd. Site Name Abbreviation: SAY AQS Number: Latitude: O Longitude: O Elevation above Sea Level: 20 m General Location: Rooftop of Federal detention facility Ground Cover: Paved Distance to Road: 19 meters (Border Crossing lanes) Traffic Count (2010 AADT): AADT= 39, 691 (from border crossing) Site Description: On the rooftop of the Federal detention facility overlooking the San Ysidro Border Point of Entry (POE)/border crossing. This site is intended for the EPA Border 2020 program and is to measure the PM2.5 contributions from the POE. Monitoring Objectives: To quantify airborne particulates from the San Ysidro POE Planned Changes: Relocation about 180 meters east-southeast, due to demolition of the building on which the sampler is located. Figure 10.1 San Ysidro Picture of the Location
208 Appendix 10: San Ysidro Site Abbreviation: SAY AQS# Page 2 of 3 Table 10.2a San Ysidro Particulate Pollutants Monitor Designations Pollutant Monitor designation Parameter code Basic monitoring objective PM 2.5 Continuous (non-fem) POC 1 Site type Monitor type Other (LC) PI, Research Source Oriented SPM Network affiliation BG Instrument manufacturer & model Met One BAM 1020 Method code 733 FRM/FEM/ARM/Other Collecting agency Analytical laboratory Reporting agency Spatial scale Other (non-fem) APCD APCD APCD Scale Monitoring start date 1/27/2015 Current sampling frequency Required sampling frequency Sampling season Probe height supporting structure obstructions on roof obstructions not on roof trees Distance to furnace or incinerator flue Distance between collocated monitors Unrestricted airflow Probe material for reactive gases Residence time for reactive gases Any changes within the next 18 months? Suitable for comparison to the NAAQS? Frequency of flow rate verification Semi-Annual flow rate audits dates NPAP (ARB) date Continuous Continuous Year-round 16.0 meters 360 O Yes No Semi-Monthly * 7/10 Not done this year *Not operational for an entire year, so two audits were not conducted


209 Appendix 10: San Ysidro Site Abbreviation: SAY AQS# Page 3 of 3 Figure 10.2 San Ysidro Pictures (Directional) from the Roof

210 Appendix 11: Site Description Floyd Smith Dr. Site Abbreviation: FSD AQS# Page 1 of 5 Section Floyd Smith Dr. Station Description and Statement of Purpose Table 11.1 General Site Information County: San Diego Representative Area: San Diego MSA Site Name: El Cajon Floyd Smith Dr. Year Established: 7/2014 Site Address: Floyd Smith Drive Site Name Abbreviation: FSD AQS Number: Latitude: Longitude: Elevation above Sea Level: 119 m General Location: Trailer at the junction of Floyd Smith Dr. and W. Bradley Ave. Ground Cover: Packed dirt with some ground vegetation and mulch Distance to Road: 14.9 m south= W. Bradley Ave. Traffic Count (2010 AADT): Site Description: Monitoring Objectives: Planned Changes: W. Bradley St. at N. Johnson Ave. (250 m East of the FSD)= 5,300. Floyd Smith Dr. is a circuit street to access the back area of some facilities on airport property. No traffic count is available for Floyd Smith Drive; estimated= 200 This station is a trailer on a lot at the junction of Floyd Smith Dr. and W. Bradley Ave., perpendicular to hangars to the northwest and an abandoned parking lot to the northeast. The gaseous monitors and samplers inlets are above the roof of the trailer. All particulate samplers are on the ground. The El Cajon site represents a major population center located in an inland valley, downwind of the heavily populated coastal zone. It is impacted from the transportation corridor of Interstate 8 and its major arteries. It is classified as a PAMS Type II site, being a maximum ozone precursor emissions impact site. The school grounds on which the station is located is to be remodeled, so the station has temporarily relocated to the Gillespie Field area. Once the remodeling is finished, the District will return to the same school, but located about 200 m west of the original location. This station will relocate back to Lexington Elementary School in Figure 11.1 Floyd Smith Dr. Picture of the Location
211 Appendix 11: Site Description Floyd Smith Dr. Site Abbreviation: FSD AQS# Page 2 of 5 Table 11.2a Floyd Smith Dr. - Gaseous Pollutants Monitor Designations + Other Pollutant O 3 NO 2 Other Zero Air CO- TLE POC Monitor designation Other Primary Not Applicable SO 2- TLE Not Applicable Parameter code (NO 2) Basic monitoring objective Site type PI, NAAQS Population Exposure PI, NAAQS Population ]Exposure PI, NAAQS Population Exposure PI, NAAQS Population Exposure Monitor type SLAMS SLAMS SLAMS SLAMS Network affiliation PAMS, NCore PAMS NCore NCore Instrument manufacturer & model 49i 42i Teledyne-API 701H 48i-TLE 43i-TLE Method code FRM/FEM/ARM/Other FEM FRM FRM FEM Collecting agency APCD APCD APCD APCD APCD Analytical laboratory APCD APCD APCD APCD APCD Reporting agency APCD APCD APCD APCD APCD Spatial scale Scale Scale Scale Scale Monitoring start date 7/2014 7/2014 7/2014 7/2014 7/2014 Current sampling frequency Required sampling frequency Continuous Continuous Continuous Continuous Continuous Continuous Continuous Continuous Sampling season Year-round Year-round Year-round Year-round Probe height 7.3 Meters 7.3 meters 7.3 Meters 7.3 meters supporting structure obstructions on roof obstructions not on roof trees Distance to furnace or incinerator flue Distance between collocated monitors Unrestricted airflow 360 O 360 O 360 O 360 O 360 O Probe material for reactive gases Residence time for reactive gases Any changes within the next 18 months? Suitable for comparison to the NAAQS? Frequency of QC check (one-point) Annual Performance Evaluation date Borosilicate glass Borosilicate glass Borosilicate glass Borosilicate glass 9.13 sec 9.13 sec 9.13 sec 9.13 sec Yes Yes Yes Yes Yes Yes Yes Yes Yes 1:14 1:2 1:2 1:2 7/23, 12/18 9/23, 12/21 12/29 6/17, 9/18, 12/22 6/17, 9/24, 12/22 ARB (NPAP) date 8/11/2015 8/11/2015 4/9/2015 4/9/2015
212 Appendix 11: Site Description Floyd Smith Dr. Site Abbreviation: FSD AQS# Page 3 of 5 Table 11.2b Floyd Smith Dr. - Particulate Pollutants Monitor Designations Pollutant PM 2.5 Manual PM 2.5 STN PM 2.5 CSN PM 2.5 CSN, SU POC PM 10 Manual (Lo-Vol) 2 (LC) 3 (STD) PM coarse Manual (paired samplers) Pb-TSP Manual (Hi-Vol) 1 1 Monitor designation Primary Other Other Other Other Other Other Parameter code (LC) See RTI See RTI Basic monitoring objective Site type See PM 2.5 Table 9.3b (LC) (STD) (LC) NAAQS Research Research Research NAAQS Research NAAQS Population Exposure Population Exposure Population Exposure Population Exposure Population Exposure Population Exposure Population Exposure Monitor type SLAMS SLAMS SLAMS SLAMS SLAMS SLAMS Network affiliation Instrument manufacturer & model NCore 2025 NCore, CSN STN Met One SASS NCore, CSN STN URG- 3000N Method code 145 See RTI See RTI CSN SU NCore NCore NCore Met One SASS See PM2.5 Table 9.3b Tisch TE- 5170BLVFC FRM/FEM/ARM/Other FRM Other Other Other FRM Other FRM Collecting agency APCD APCD APCD APCD APCD APCD APCD Analytical laboratory APCD EPA EPA APCD APCD APCD APCD Reporting agency APCD EPA EPA APCD APCD APCD APCD Spatial scale Scale Scale Scale Scale Scale Scale Scale Monitoring start date 7/2014 7/2014 7/2014 7/2014 7/2014 7/2014 7/2014 Current sampling frequency Required sampling frequency 1:3 1:3 1:3 1:6 1:3 1:3 1:6 1:3 1:6 1:6 1:6 1:3 1:3 1:6 Sampling season Year-round Year-round Year-round Year-round Year-round Year-round Year-round Probe height 3.1 meters 3.1 meters 3.1 meters 3.1 meters 3.1 meters 3.1 meters 3.1 meters supporting structure obstructions on roof obstructions not on roof trees Distance to furnace or incinerator flue Distance between collocated monitors Unrestricted airflow 360 O 360 O 360 O 360 O 360 O 360 O 360 O Probe material for reactive gases Residence time for reactive gases Any changes within the next 18 months? Suitable for comparison to the NAAQS? Frequency of flow rate verification Semi-Annual flow rate audits dates Yes Yes Yes Yes Yes Yes Yes Yes No No No Yes No No Monthly Monthly Monthly Monthly Monthly Monthly Monthly 6/18, 12/7 6/18, 12/7 6/18, 12/7 6/18, 12/7 6/18, 12/7 6/18, 12/7 6/18, 12/7 ARB date 8/11/2015 8/11/2015 8/11/2015 8/11/2015 PEP (EPA) date 12/5 Not done
213 Appendix 11: Site Description Floyd Smith Dr. Site Abbreviation: FSD AQS# Page 4 of 5 Table 11.2c Pollutant POC Floyd Smith Dr. - Other Pollutants Monitor Designations PAMS- VOC 1 for 3-Hr samples 2 for 24-Hr samples PAMS- Carbonyls 1 for 3-Hr samples 2 for 24-Hr samples Monitor designation Other Other Parameter code Basic monitoring objective Site type See PAMS Table 12.2b Research Maximum Precursor Impact See PAMS Table 12.2c Research Maximum Precursor Impact Monitor type SLAMS SLAMS Network affiliation PAMS Type II PAMS Type II Instrument manufacturer & model Xontech 910 & 912 Xontech 925 Method code FRM/FEM/ARM/Other Other Other Collecting agency APCD APCD Analytical laboratory APCD APCD Reporting agency APCD APCD Spatial scale Scale Scale Monitoring start date 7/2014 7/2014 Current sampling frequency Required sampling frequency Sampling season 1:6 1:6 1:6 1:6 3-Hr (Jul-Oct) 24-Hr (Nov-Jun) 3-Hr (Jul-Oct) 24-Hr (Nov-Jun) Probe height 6.1 meters 6.1 meters supporting structure obstructions on roof obstructions not on roof trees Distance to furnace or incinerator flue Distance between collocated monitors Unrestricted airflow 360 O 360 O Probe material for reactive gases Residence time for reactive gases Any changes within the next 18 months? Suitable for comparison to the NAAQS? Frequency of flow rate verification Semi-Annual flow rate audits dates Yes Yes ARB date
214 Appendix 11: Site Description Floyd Smith Dr. Site Abbreviation: FSD AQS# Page 5 of 5 Table 11.2d Pollutant Monitor designation Floyd Smith Dr. - Meteorological Equipment Monitor Designations + Other Other Internal Temp POC 1 Parameter code Basic monitoring objective Site type Monitor type Network affiliation Instrument manufacturer & model SLAMS NCore, PAMS Qualimetrics Method code 012 FRM/FEM/ARM/Other Collecting agency Analytical laboratory Reporting agency Spatial scale Other APCD APCD APCD scale Monitoring start date 7/2014 Current sampling frequency Required sampling frequency Sampling season Probe height supporting structure obstructions on roof obstructions not on roof trees Distance to furnace or incinerator flue Distance between collocated monitors Unrestricted airflow Probe material for reactive gases Residence time for reactive gases Any changes within the next 18 months? Suitable for comparison to the NAAQS? Frequency of flow rate verification Semi-Annual flow rate audits dates ARB date Continuous Continuous Year-round Yes 9/25

215 Appendix 12: Site Description Rancho Carmel Drive Site Abbreviation: RCD AQS# Page 1 of 3 Section Rancho Carmel Drive Station Description and Statement of Purpose Table 12.1 General Site Information County: San Diego Representative Area: San Diego MSA Site Name: Rancho Carmel Drive Year Established: 3/26/2015 Site Address: Rancho Carmel Drive Site Name Abbreviation: RCD AQS Number: Latitude: Longitude: Elevation above Sea Level: 218 m General Location: On City of San Diego Pump Station grounds Ground Cover: Packed Dirt Distance to Road: 33 meters to I-15 North; 24 meters to Rancho Carmel Drive Traffic Count (2010 AADT): AADT (FE adjusted) for I-15= 358,000 (estimated) AADT for Rancho Carmel Dr. at Carmel Mtn Rd.(700 meters downwind) = 14,500 Site Description: Is on the hill overlooking I-15. The probe is horizontal. Monitoring Objectives: This is the 1 st near-road site. It measures NO2 & CO contributions from I-15 Planned Changes: None. Figure 12.1 Rancho Carmel Drive - Picture of the Location of the Station
216 Appendix 12: Site Description Rancho Carmel Drive Site Abbreviation: RCD AQS# Page 2 of 3 Table 12.2a Pollutant Rancho Carmel Drive - Gaseous Pollutants Monitor Designations + Other NO 2 CO Other Zero Air POC 1 1 Monitor designation Primary Other Parameter code (NO 2) Basic monitoring objective Site type PI, NAAQS Source Oriented PI, NAAQS Source Oriented Monitor type SLAMS SLAMS Network affiliation NR NR Instrument manufacturer & model 42i 48i Teledyne-API 701H Method code FRM/FEM/ARM/Other FRM FRM Collecting agency APCD APCD APCD Analytical laboratory APCD APCD APCD Reporting agency APCD APCD APCD Spatial scale Micro Scale Micro Scale Monitoring start date 3/26/2015 4/24/2015 3/26/2015 Current sampling frequency Required sampling frequency Continuous Continuous Continuous Continuous Sampling season Year-round Year-round Probe height supporting structure obstructions on roof obstructions not on roof trees 11.0 meters 11.0 meters Distance to furnace or incinerator flue Distance between collocated monitors Unrestricted airflow 270 O 270 O Probe material for reactive gases Residence time for reactive gases Any changes within the next 18 months? Suitable for comparison to the NAAQS? Frequency of QC check (one-point) Annual Performance Evaluation date Borosilicate glass Borosilicate glass 6.1 sec 6.1 sec Yes Yes Yes Yes Yes 1:2 1:2 12/8 12/15 12/28 NPAP (ARB) Date 8/13 8/13


")


217 Appendix 12: Site Description Rancho Carmel Drive Site Abbreviation: RCD AQS# Page 3 of 3 Figure 12.2 Rancho Carmel Drive Pictures (Directional) from the Ground* *There is no deck from which to take pictures. The probe is horizontal from the side of station on an incline, so all picture are taken from behind the stations (about 5 meters behind the probe for safety reasons).
5-YEAR AIR QUALITY MONITORING NETWORK ASSESSMENT 2015
 MONITORING AND TECHNICAL SERVICES DIVISION 5-YEAR AIR QUALITY MONITORING NETWORK ASSESSMENT 2015 JULY, 2015 David N. Shina Bill Brick Laura Shields Monitoring and Technical Services Division 10124 Old
2018 ANNUAL NETWORK PLAN DIVISION OF NATURAL RESOURCES AND ENVIRONMENTAL MANAGEMENT AMBIENT AIR QUALITY MONITORING PROGRAM CITY OF HUNTSVILLE, ALABAMA
 2018 ANNUAL NETWORK PLAN DIVISION OF NATURAL RESOURCES AND ENVIRONMENTAL MANAGEMENT AMBIENT AIR QUALITY MONITORING PROGRAM CITY OF HUNTSVILLE, ALABAMA NATURAL RESOURCES AND ENVIRONMENTAL MANAGEMENT Post
Designing a Network Assessment for an Ambient Air Monitoring Program
 This document is intended to help facilitate compiling an assessment of an agency s air quality surveillance system by State and where delegated, local air monitoring programs. The requirement to submit
SAN DIEGO COUNTY AIR POLLUTION CONTROL DISTRICT Ambient Air Monitoring Network Plan Submitted: July 1, 2009
 SAN DIEGO COUNTY AIR POLLUTION CONTROL DISTRICT 2008 Ambient Air Monitoring Network Plan Submitted: July 1, 2009 10124 Old Grove Road San Diego, CA 92131 (858) 586-2600 PREPARED BY Mike Kaszuba with David
OAQPS Update. Outline. Kevin A Cavender EPA/OAQPS/AAMG. MARAMA Monitoring Meeting September 17, 2012
 OAQPS Update Kevin A Cavender EPA/OAQPS/AAMG MARAMA Monitoring Meeting September 17, 2012 1 Outline Selected NAAQS Updates Notable monitoring program issues Quality Assurance Topics 2 1 NAAQS Summary Table
APPENDIX C: Bakersfield-Golden AMS Closure and Replacement
 APPENDIX C: Bakersfield-Golden AMS Closure and Replacement Appendix C: Bakersfield-Golden AMS Closure and Replacement This page is intentionally blank. Appendix C: Bakersfield-Golden AMS Closure and Replacement
Appendix B: Minimum Monitoring Requirements and 2016 Monitor Classifications in AQS
 Appendix B: Minimum ing Requirements and 2016 Classifications in AQS Summary The EPA establishes the minimum number of monitoring sites required to meet national ambient monitoring objectives. The minimum
AIR POLLUTION. History of Clean Air Act Clean Air Update The Role of APCD
 AIR POLLUTION History of Clean Air Act Clean Air Update The Role of APCD History 1940-1959 1947 California Air Pollution Control Act First state legislation Permitted APCD s 1945 City of Los Angeles Bureau
Air Quality Measurement Methods. Tim Morphy Regional Manager Thermo Electron October 20 th, 2006
 Air Quality Measurement Methods Tim Morphy Regional Manager Thermo Electron October 20 th, 2006 Main Criteria Pollutants US EPA Federal Reference Methods US EPA Federal Equivalent Methods http://www.epa.gov/ttn/amtic/criteria.html
2012 AMBIENT AIR MONITORING NETWORK PLAN
 2012 AMBIENT AIR MONITORING NETWORK PLAN Monitoring and Compliance Division July 9, 2012 SLOAPCD 2012 Network Plan - 1-7/9/2012 Table of Contents 1. Introduction... 1 2. Overview of Network Operation...
San Joaquin Valley Air Pollution Control District. Air Monitoring Network Plan
 San Joaquin Valley Air Pollution Control District Air Monitoring Network Plan June 30, 2010 For Submittal to the U.S. Environmental Protection Agency in July 2010 San Joaquin Valley Unified Air Pollution
Five-Year Air Monitoring Network Assessment
 Five-Year Air Monitoring Network Assessment Arizona Department of Environmental Quality Air Quality Division Assessment Section Data Management & Quality Assurance Unit August 2, 2011 40 CFR 58.10 (d)
Lab 7 Measurement of Ozone
 Georgia Institute of Technology School of Earth and Atmospheric Sciences EAS 4641 Spring 2007 Lab 7 Measurement of Ozone Purpose of Lab 7: In this lab you will measure the ambient concentration of ozone
VENTURA COUNTY AIR POLLUTION CONTROL DISTRICT 2009 AMBIENT AIR MONITORING NETWORK PLAN. September County Square Drive Ventura, CA 93003
 VENTURA COUNTY AIR POLLUTION CONTROL DISTRICT 2009 AMBIENT AIR MONITORING NETWORK PLAN September 2009 669 County Square Drive Ventura, CA 93003 Contact: Keith Duval Table of Contents 1. 0 Introduction..................................................................................................................
Pinal County Air Quality Control District Ambient Monitoring Network Plan And 2009 Data Summary
 Pinal County Air Quality Control District 2010 Ambient Monitoring Network Plan And 2009 Data Summary June 30, 2010 Final Pinal County Air Quality 31 N. Pinal St., Bldg. F P.O. Box 987 Florence AZ, 85132
Ozone. Number of Days Exceeding Federal and State 1-Hour Ozone Standards San Diego County
 Ozone Number of Days Exceeding Federal and State 1-Hour Ozone Standards Number of Days Exceeding Number of Days Exceeding Previous Federal 1-Hour Standard: State 1-Hour Standard: Maximum 1-Hour Concentration
2007 Area Source Emissions Inventory Methodology UNSPECIFIED COMBUSTION SOURCES
 San Joaquin Valley AIR POLLUTION CONTROL DISTRICT 2007 Area Source Emissions Inventory Methodology 099 - UNSPECIFIED COMBUSTION SOURCES I. Purpose This document describes the Area Source Methodology used
State of Arizona Air Monitoring Network Plan
 State of Arizona Air Monitoring Network Plan For the Year 2 Arizona Department of Environmental Quality Air Quality Division Air Assessment Section Final Report August 2, 2 Publication Number EQR -2 Table
San Joaquin Valley Air Pollution Control District Air Monitoring Network Plan
 San Joaquin Valley Unified Air Pollution Control District June 30, 2011 San Joaquin Valley Air Pollution Control District 2011 Air Monitoring Network Plan June 30, 2011 For Submittal to the U.S. Environmental
2019 Annual Air Monitoring Network Plan. Appendix B:
 2019 Annual Air ing Network Plan Appendix B: Minimum ing Requirements and 2018 Classifications in AQS Summary The U.S. Environmental Protection Agency (EPA) establishes the minimum number of monitoring
An Introduction to Air Quality
 An Introduction to Air Quality Learning Goals "We came all this way to explore the Moon, and the most important thing is that we discovered the Earth - William Anders After this lesson, you will be able
Annual Monitoring Network Plan for the North Carolina Division of Air Quality
 2017-2018 Annual Monitoring Network Plan for the North Carolina Division of Air Quality Volume 2 Site Descriptions by Division of Air Quality Regional Office and Metropolitan Statistical Area B. The Winston-Salem
Standard Operating Procedure (SOP) for. Completing the Annual Network Review. for the. North Carolina Division of Air Quality (DAQ) SECTION 2
 for. Completing the Annual Network Review. for the. North Carolina Division of Air Quality (DAQ) SECTION 2") Page 1 of 36 Standard Operating Procedure (SOP) for Completing the Annual Network Review for the North Carolina Division of Air Quality (DAQ) SECTION 2 Page 3 of 36 Table of Contents 2.43 Standard Operating
Page 1 of 36 Standard Operating Procedure (SOP) for Completing the Annual Network Review for the North Carolina Division of Air Quality (DAQ) SECTION 2 Page 3 of 36 Table of Contents 2.43 Standard Operating
Clean Air Act History
 Clean Air Act Compliance Clean Air Act Compliance Clean Air Act History 1940s serious smog in LA, CA and Donora, PA raised concerns about air quality. 1955, Air Pollution Control Act was the 1st national
Chapter 10 National Ambient Air Monitoring Programs
 Chapter 10 National Ambient Air Monitoring Programs Introduction Ambient air monitoring systems are a critical part of the nation's air quality management program infrastructure. Environmental management
Ambient Air Quality Monitoring
 Ambient Air Quality Monitoring Ambient Air Quality Division Air Quality and Noise Management Bureau Pollution Control Department 7/31/2012 2:09 PM 1 Carbon Monoxide (CO) Nitrogen Dioxide (NO 2 ) Ozone
Air Monitoring Data Quality Assessment Report Fourth Quarter Prepared by: Donovan Rafferty. Air Quality Program
 Air Monitoring Data Quality Assessment Report Fourth Quarter Prepared by: Donovan Rafferty Air Quality Program TABLE OF CONTENTS Introduction... 1 Data Quality... 2 Automated Data... 3 Data Quality Indicators
2017 Air Monitoring Network Plan
 San Joaquin Valley Air Pollution Control District June 28, 2017 This page is intentionally blank. San Joaquin Valley Unified Air Pollution Control District June 28, 2017 TABLE OF CONTENTS The District
Gila River Indian Community 2016 AMBIENT AIR MONITORING NETWORK REVIEW
 Gila River Indian Community 2016 AMBIENT AIR MONITORING NETWORK REVIEW GRIC San Tan Mountains to the north, 2016 Gila River Indian Community Department of Environmental Quality Air Quality Air Monitoring
2017 ANNUAL MONITORING NETWORK PLAN
 2017 ANNUAL MONITORING NETWORK PLAN SACRAMENTO METROPOLITAN AIR QUALITY MANAGEMENT DISTRICT PROGRAM COORDINATION DIVISION 777 12 TH STREET, 3 RD FLOOR SACRAMENTO, CA 95814 (916) 874-4800 AIRQUALITY.ORG
2017 Ambient Air Monitoring Network Plan
 2017 Ambient Air Monitoring Network Plan Fiscal, Administrative & Technical Services June 2017 Table of Contents List of Abbreviations... 4 Introduction... 5 General Information on Air Monitoring Networks...
Oklahoma Department of Environmental Quality Air Quality Division Monitoring Section Annual Network Review for Ambient Air Monitoring Fiscal Year 2013
 Oklahoma Department of Environmental Quality Air Quality Division Monitoring Section Annual Network Review for Ambient Air Monitoring Fiscal Year 2013 Under 40 CFR, Part 58, Subpart B, states are required
2015 Ambient Air Quality Monitoring 5 Year Network Assessment For Mecklenburg County Air Quality
 M E C K L E N B U R G C O U N T Y A I R Q U A L I T Y A I R Q U A L I T Y M O N I T O R I N G G R O U P 2015 Ambient Air Quality Monitoring 5 Year Network Assessment For Mecklenburg County Air Quality
Wildfires: Smoke Impacts and Public Health Protection
 Wildfires: Smoke Impacts and Public Health Protection Julie Hunter, Senior Air Quality Specialist Washoe County Health District, Air Quality Management Division Great Basin Climate Forum December 6, 2018
Lecture 4 Air Pollution: Particulates METR113/ENVS113 SPRING 2011 MARCH 15, 2011
 Lecture 4 Air Pollution: Particulates METR113/ENVS113 SPRING 2011 MARCH 15, 2011 Reading (Books on Course Reserve) Jacobson, Chapter 5, Chapter 8.1.9 Turco, Chapter 6.5, Chapter 9.4 Web links in following
Appendix B National Core (NCore) Multi-pollutant Monitoring
 Multi-pollutant Monitoring") Appendix B National Core (NCore) Multi-pollutant Monitoring Table of Contents Background...B-1 NCore Monitoring in Minnesota...B-2 Monitoring Objective...B-2 Quality Assurance Status...B-4 Area of Representativeness...B-4
Appendix B National Core (NCore) Multi-pollutant Monitoring Table of Contents Background...B-1 NCore Monitoring in Minnesota...B-2 Monitoring Objective...B-2 Quality Assurance Status...B-4 Area of Representativeness...B-4
Fiscal, Administrative & Technical Services May 2018 Public Review Draft
 2018 Ambient Air Monitoring Network Plan Fiscal, Administrative & Technical Services May 2018 Public Review Draft Table of Contents List of Abbreviations... 4 Introduction... 5 General Information on Air
CHAPTER 2 - Air Quality Trends and Comparisons
 CHAPTER 2 - Air Quality Trends and Comparisons Particulate Sampling Total Suspended Particulate Matter With the monitoring for PM 2.5 particulate matter being labor intensive, DEP reduced the number of
PM 2.5 Continuous Monitoring. Program Objectives, History, Requirements, and Flexibility. National Ambient Air Monitoring Conference Atlanta 2014
 PM 2.5 Continuous Monitoring Program Objectives, History, Requirements, and Flexibility National Ambient Air Monitoring Conference Atlanta 2014 1 Program Objectives, History, Requirements, and Flexibility
2013 ANNUAL AIR MONITORING NETWORK PLAN CHECKLIST (Updated 2/27/2013) Year: Agency:
 Year: Agency:") 2013 ANNUAL AIR MONITORING NETWORK PLAN CHECKLIST (Updated 2/27/2013) Year: Agency: 40.10(a)(1) requires that each ANP include regarding the following types of monitors: SLAMS monitoring stations including
2013 ANNUAL AIR MONITORING NETWORK PLAN CHECKLIST (Updated 2/27/2013) Year: Agency: 40.10(a)(1) requires that each ANP include regarding the following types of monitors: SLAMS monitoring stations including
Ambient Air Monitoring. Wexford. 10 th March st March 2006
 Ambient Air Monitoring In Wexford 10 th March 2005 31 st March 2006 Contents Summary....... 3 Introduction........ 4 Time Period........ 5 Siting......... 5 Monitoring Methods....... 6 Results.........
6.1 INTRODUCTION 6.2 REGULATORY FRAMEWORK NATIONAL AMBIENT AIR QUALITY STANDARDS COMPLIANCE STATUS TRANSPORTATION CONFORMITY
 Chapter 6 Air Quality 6.1 INTRODUCTION This chapter presents a project-level analysis of the potential for air quality impacts that could result from mobile and stationary sources of air emissions generated
Chapter 17 Air and Air Pollution
 Chapter 17 Air and Air Pollution The Atmosphere Each layer characterized by abrupt changes in temperature, the result of differences in the absorption of incoming solar energy. Troposphere: Weather Breeder
ENVIRONMENTAL PROTECTION AGENCY APTI 435: Atmospheric Sampling Course. Student Manual
 ENVIRONMENTAL PROTECTION AGENCY APTI 435: Atmospheric Sampling Course Student Manual Table of Contents Chapter 1: An Introduction to Atmospheric Sampling... 1-1 1.1 Introduction... 1-2 1.2 Sampling Train
CE 213A Introduction to Environmental Science
 CE 213A Introduction to Environmental Science Module D Air Pollution Dr. Anubha Goel FB 308, anubha@iitk.ac.in, x 7027 Nazaroff, Ch. 7 Air Pollution 2 Key Concepts Structure and composition of the atmosphere
PORT OF LONG BEACH AIR QUALITY MONITORING PROGRAM: SUMMARY REPORT CALENDAR YEAR 2009
 PORT OF LONG BEACH AIR QUALITY MONITORING PROGRAM: SUMMARY REPORT CALENDAR YEAR 2009 Prepared For: Prepared By: June 2010 POLB Air Quality Monitoring Program: CY 2009 Summary Report Table of Contents LIST
2017 Annual Network Plan for Ambient Air Monitoring
 2017 Annual Network Plan for Ambient Air Monitoring July 1, 2017 North Coast Unified Air Quality Management District 707 L Street, Eureka, CA 95501 Telephone (707) 443-3093 - FAX (707) 443-3099 http://www.ncuaqmd.org
GE 2211 Environmental Science and Engineering Unit III Air Pollution. M. Subramanian
 GE 2211 Environmental Science and Engineering Unit III Air Pollution M. Subramanian Assistant Professor Department of Chemical Engineering Sri Sivasubramaniya Nadar College of Engineering Kalavakkam 603
Ambient Air Monitoring
 Ambient Air Monitoring At Shannon, Co. Clare 15 th March 2011 18 th July 2012 Contents Summary........ 3 Introduction........ 4 Time Period........ 5 Siting......... 5 Monitoring Methods....... 6 Results.........
Ambient Air Monitoring
 Ambient Air Monitoring At Newbridge, Co. Kildare 1 st October 2009 24 th May 2010 Contents Summary........ 3 Introduction........ 4 Time Period........ 5 Siting......... 5 Monitoring Methods....... 6 Results.........
Air Quality Management (AQM) Clean Air Act (History, Objectives, NAAQS) Non-attainment regions
 Clean Air Act (History, Objectives, NAAQS) Non-attainment regions") Air Quality Management (AQM) Clean Air Act (History, Objectives, NAAQS) Non-attainment regions National Ambient Air Quality Standards (NAAQS) The Clean Air Act, which was last amended in 1990, requires
Air Quality Management (AQM) Clean Air Act (History, Objectives, NAAQS) Non-attainment regions National Ambient Air Quality Standards (NAAQS) The Clean Air Act, which was last amended in 1990, requires
Air Quality. in San Diego Annual Report AIR POLLUTION CONTROL DISTRICT C O U N T Y O F S A N D I E G O
 Air Quality AIR POLLUTION CONTROL DISTRICT C O U N T Y O F S A N D I E G O in San Diego 2009 Annual Report Director s Message More than ever in 2009, the San Diego Air Pollution Control District recognized
Ambient Air Monitoring. Bray. 21st October th May 2006
 Ambient Air Monitoring In Bray 21st October 2005 10th May 2006 Contents Summary....... 3 Introduction........ 4 Time Period........ 5 Siting......... 5 Monitoring Methods....... 6 Results......... 8 Carbon
2018 Annual Network Plan for Ambient Air Monitoring
 2018 Annual Network Plan for Ambient Air Monitoring July 1, 2018 North Coast Unified Air Quality Management District 707 L Street, Eureka, CA 95501 (707) 443-3093 www.ncuaqmd.org Contents Contents... 2
2006 Area Source Emissions Inventory Methodology 670 NON-AGRICULTURAL OPEN BURNING
 San Joaquin Valley AIR POLLUTION CONTROL DISTRICT 2006 Area Source Emissions Inventory Methodology 670 NON-AGRICULTURAL OPEN BURNING I. Purpose This document describes the Area Source Methodology used
2018 Ambient Air Monitoring Plan Air Protection Branch Ambient Monitoring Program
 2018 Ambient Air Monitoring Plan Air Protection Branch Ambient Monitoring Program Introduction Table of Contents Table of Contents... i Acronyms and Glossary... ii Agency Contacts... iv 1.0 Executive
2013 Network Summary
 R 2013 Network Summary New Jersey Department of Environmental Protection NETWORK DESCRIPTION In 2013, the New Jersey Department of Environmental Protection (NJDEP) operated 39 ambient air monitoring stations.
Final Ozone NAAQS - PAMS and Enhanced Monitoring Plans- Ambient Air Monitoring in NESCAUM
 Final Ozone NAAQS - PAMS and Enhanced Monitoring Plans- Ambient Air Monitoring in NESCAUM Robert Judge Air Monitoring Coordinator EPA- Region 1 Providence, RI December 7, 2016 1 Overview 2015 Final Ozone
COMMONWEALTH OF PENNSYLVANIA DEPARTMENT OF ENVIRONMENTAL PROTECTION BUREAU OF AIR QUALITY
 COMMONWEALTH OF PENNSYLVANIA DEPARTMENT OF ENVIRONMENTAL PROTECTION BUREAU OF AIR QUALITY 2009 AMBIENT AIR QUALITY MONITORING and EMISSION TRENDS REPORT DIVISION OF AIR QUALITY MONITORING 400 MARKET STREET
2004 Network Summary
 2004 etwork Summary ew Jersey Department of Environmental Protection ETWORK DESIG In 2004, the Bureau of Air Monitoring maintained 43 Ambient Air Monitoring Sites in ew Jersey. These monitoring sites are
Air Quality Monitoring Program at the Port of Los Angeles Year Eleven Data Summary May April 2016
 Air Quality Monitoring Program at the Port of Los Angeles Year Eleven Data Summary May 2015 - April 2016 Prepared For: Port of Los Angeles Environmental Management Division 425 South Palos Verdes Street
State of Arizona Air Monitoring Network Plan. For the Year Final Report June 30, 2008
 State of Arizona Air Monitoring Network Plan For the Year 2008 Arizona Department of Environmental Quality Air Quality Division Air Assessment Section Final Report June 30, 2008 Table of Contents 1.0 INTRODUCTION...
Air Permi>ng: A Major Piece of the Puzzle or Trying to Keep All of
 Air Permi>ng: A Major Piece of the Puzzle or Trying to Keep All of the Balls in the Air Insert then choose Picture select your picture. Right click your picture and Send to back. The world s leading sustainability
Lab 6 Measurement of Ozone
 Georgia Institute of Technology School of Earth and Atmospheric Sciences EAS 4641 Spring 2008 Lab 6 Measurement of Ozone Purpose of Lab 6: In this lab you will measure the ambient concentration of ozone
Chapter 6 CO, PM 10, and Other Pollutant Air Quality Impacts and Mitigation For Project Operation
 Chapter 6 CO, PM 10, and Other Pollutant Air Quality Impacts and Mitigation For Project Operation 6.1 Introduction This Chapter addresses the recommended techniques for quantifying emissions of carbon
2006 Area Source Emissions Inventory Methodology 020 COGENERATION - NG
 San Joaquin Valley AIR POLLUTION CONTROL DISTRICT 2006 Area Source Inventory Methodology 020 COGENERATION - NG I. Purpose This document describes the Area Source Methodology used to estimate emissions
COMMONWEALTH OF VIRGINIA STATE AIR POLLUTION CONTROL BOARD REGULATIONS FOR THE CONTROL AND ABATEMENT OF AIR POLLUTION
 COMMONWEALTH OF VIRGINIA STATE AIR POLLUTION CONTROL BOARD REGULATIONS FOR THE CONTROL AND ABATEMENT OF AIR POLLUTION 9VAC5 CHAPTER 30. AMBIENT AIR QUALITY STANDARDS. 9VAC5-30-10. General. 9VAC5-30-15.
Oregon. 800 NE Oregon St. #640 Portland, OR (971)
") Air Quality Frequently Asked Questions Oregon Environmental Public Health Tracking (EPHT) Oregon ENVIRONMENTAL PUBLIC HEALTH TRACKING 800 NE Oregon St. #640 Portland, OR 97232 www.oregon.gov/dhs/ph/epht
Air Quality Frequently Asked Questions Oregon Environmental Public Health Tracking (EPHT) Oregon ENVIRONMENTAL PUBLIC HEALTH TRACKING 800 NE Oregon St. #640 Portland, OR 97232 www.oregon.gov/dhs/ph/epht
Ambient Air Quality and noise Measurements Report Gas pipeline network at Farshout- Naqada, Waqf, and Qeft - Qena governorate
 Ambient Air Quality and noise Measurements Report Gas pipeline network at Farshout- Naqada, Waqf, and Qeft - Qena governorate CONTENTS CONTENTS 2 1. INTRODUCTION 4 1.1 Objectives... 4 1.2 Scope of Work...
2010 AIR POLLUTION CONTROL
 1 AIR POLLUTION CONTROL Monitoring Report for Lake and Geauga Counties Lake County General Health District 33 Mill Street Painesville, Ohio 4477 Table of Contents INTRODUCTION... 1 STATE AND FEDERAL AIR
PM2.5 Implementation Rule- Modeling Summary. Brian Timin EPA/OAQPS June 20, 2007
 PM2.5 Implementation Rule- Modeling Summary Brian Timin EPA/OAQPS Timin.brian@epa.gov June 20, 2007 Attainment Demonstrations CAA Section 172(c) requires States with a nonattainment area to submit an attainment
Spokane Regional Clean Air Agency Air Quality Report - January 2012
 Spokane Regional Clean Air Agency Air Quality Report - January 2012 Air quality in January varied as weather systems moved through the region at regular intervals. Storms on January 5, 10 and 14 helped
Ambient Air Quality and noise Measurements Report Gas pressure reduction station in Marsa Matrouh Governorate
 Ambient Air Quality and noise Measurements Report Gas pressure reduction station in Marsa Matrouh Governorate CONTENTS CONTENTS 1 1. INTRODUCTION 2 1.1 Objectives... 2 1.2 Scope of Work... 3 1.2.1 Sampling
2016 ANNUAL MONITORING NETWORK PLAN
 2016 ANNUAL MONITORING NETWORK PLAN SACRAMENTO METROPOLITAN AIR QUALITY MANAGEMENT DISTRICT PROGRAM COORDINATION DIVISION 777 12 TH STREET, 3 RD FLOOR SACRAMENTO, CA 958114 (916) 874-4800 AIRQUALITY.ORG
State of Arizona Air Monitoring Network Plan
 State of Arizona Air Monitoring Network Plan For the Year 2009 Arizona Department of Environmental Quality Air Quality Division Air Assessment Section Final Report July 1, 2009 Publication Number: EQR
Environmental Science 101 Air Resources. Fall Lecture Outline: Terms You Should Know: Learning Objectives: Reading Assignment:
 Environmental Science 101 Air Resources Fall 2012 1 Lecture Outline: 10. AIR POLLUTION A. The Atmosphere An Introduction B. Background Information About Air Pollution C. Six Principal Pollutants D. Air
TITLE 800 AIRPORT CORPORATION. Introduction 800 RICR CHAPTER 10 OPERATIONS SUBCHAPTER 00 N/A. PART 3 Air Quality Monitoring Work Plan
 800 RICR 10 00 03 TITLE 800 AIRPORT CORPORATION CHAPTER 10 OPERATIONS SUBCHAPTER 00 N/A PART 3 Air Quality Monitoring Work Plan 3.1 Introduction A. The Rhode Island Airport Corporation (RIAC) operates
State Implementation Plans for Federal 8-Hour Ozone and PM2.5 Standards San Joaquin Valley Eastern Kern County
 State Implementation Plans for Federal 8-Hour Ozone and PM2.5 Standards San Joaquin Valley Eastern Kern County Public Meeting January 4, 2005 Fresno, Bakersfield, Modesto 1 San Joaquin Valley Air Pollution
Vista Canyon Transit Center - Air Quality Technical Memorandum
 803 Camarillo Springs Road, Suite C Camarillo, California 93012 (805) 437-1900 FAX (805) 437 1901 www.impactsciences.com MEMORANDUM To: Kris Markarian, City of Santa Clarita Job No. 1046.003 From: Susan
2007 Area Source Emissions Inventory Methodology 052 AGRICULTURAL IRRIGATION IC ENGINES- NG
 San Joaquin Valley AIR POLLUTION CONTROL DISTRICT 2007 Area Source Emissions Inventory Methodology 052 AGRICULTURAL IRRIGATION IC ENGINES- NG I. Purpose This document describes the Area Source Methodology
RULE 701 EMERGENCY EPISODE PLAN Adopted (Amended , , , , , ) INDEX
 INDEX") RULE 701 EMERGENCY EPISODE PLAN Adopted 5-6-74 (Amended 9-15-75, 8-3-77, 12-6-78, 5-25-93, 9-5-96, 5-27-99) INDEX 100 GENERAL 101 PURPOSE 102 APPLICABILITY: STATIONARY AND MOBILE SOURCE EMERGENCY EPISODE
RULE 701 EMERGENCY EPISODE PLAN Adopted 5-6-74 (Amended 9-15-75, 8-3-77, 12-6-78, 5-25-93, 9-5-96, 5-27-99) INDEX 100 GENERAL 101 PURPOSE 102 APPLICABILITY: STATIONARY AND MOBILE SOURCE EMERGENCY EPISODE
MacAleese Lane Air Quality Report Monitoring Program
 MacAleese Lane Air Quality Report 2009 Monitoring Program Department of Environment April 2010 MacAleese Lane Air Quality Report 2009 Monitoring Program Introduction In February of 2009, the New Brunswick
Northeast Ohio NAAQS Nonattainment Factsheet Covering the counties of Ashtabula, Cuyahoga, Geauga, Lake, Lorain, Medina, Portage and Summit
 215 November 2 1 5 Northeast Ohio NAAQS Nonattainment Factsheet Covering the counties of Ashtabula, Cuyahoga, Geauga, Lake, Lorain, Medina, Portage and Summit 1 Northeast Ohio NAAQS Nonattainment Factsheet
Monitoring Network Design and Changes
 Monitoring Network Design and Changes Craig Anderson Air Quality Analysis Section ARB Air Quality Planning & Science Division PQAO Training 2017: January 24-26, 2017 2 Outline California Monitoring Network
Clean Air Act of 1970
 Clean Air Act of 1970 Set National Ambient Air Quality Standards (NAAQS), to protect public health and welfare Set New Source Performance Standards (NSPS), that strictly regulated emissions of a new source
Air Quality Monitoring Program at the Port of Los Angeles Year Twelve Data Summary May April 2017
 Air Quality Monitoring Program at the Port of Los Angeles Year Twelve Data Summary May 2016 - April 2017 Prepared For: Port of Los Angeles Environmental Management Division 425 South Palos Verdes Street
Spokane Regional Clean Air Agency Air Quality Report - September 2011
 Spokane Regional Clean Air Agency Air Quality Report - September 211 An atmospheric high pressure ridge brought exceptionally warm, sunny and dry weather, light winds and marginal to poor ventilation to
REDESIGNATION REQUEST AND MAINTENANCE PLAN FOR THE COLUMBUS, OHIO HOUR OZONE NONATTAINMENT AREA
 REDESIGNATION REQUEST AND MAINTENANCE PLAN FOR THE COLUMBUS, OHIO 2015 8-HOUR OZONE NONATTAINMENT AREA Delaware, Fairfield, Franklin, and Licking Counties, Ohio Prepared by: Ohio Environmental Protection
1. Lab report from each person, not 1 per group. 2. Progress on Lab 5, particle composition? Lab 5 due April Lab 6 due April 20.
 1. Lab report from each person, not 1 per group. 2. Progress on Lab 5, particle composition? Lab 5 due April 13. 3. Lab 6 due April 20. LAB 6: Ozone/NOx Source of Ozone Volatile Organic Compounds (VOCs)
ANALYSIS OF PAMS DATA IN CALIFORNIA VOLUME III: TRENDS ANALYSES OF CALIFORNIA PAMS AND LONG-TERM TREND AIR QUALITY DATA ( )
") ANALYSIS OF PAMS DATA IN CALIFORNIA VOLUME III: TRENDS ANALYSES OF CALIFORNIA PAMS AND LONG-TERM TREND AIR QUALITY DATA (1987-1997) FINAL REPORT STI-998393-1885-FR By: Beth Wittig Hilary H. Main Paul T.
ANALYSIS OF PAMS DATA IN CALIFORNIA VOLUME III: TRENDS ANALYSES OF CALIFORNIA PAMS AND LONG-TERM TREND AIR QUALITY DATA (1987-1997) FINAL REPORT STI-998393-1885-FR By: Beth Wittig Hilary H. Main Paul T.
Stack Sampling. requires airflow through the sampling probe to be at the same rate as that flowing in the waste gas stream isokinetic
 Stack Sampling emissions associated with combustion, velocity and temperature may be much higher than ambient conditions - measure to correct to standard conditions Velocity data determined from pressure
History of significant air pollution events
 Ch17 Air Pollution A thick layer of smoke and haze covers Santiago, Chile. History of significant air pollution events Many of the worst air pollution episodes occurred in the last two centuries in London
Ambient Air Monitoring. Kilkitt, Co. Monaghan. 11 th September th March 2003
 Ambient Air Monitoring In Kilkitt, Co. Monaghan 11 th September 2002 4 th March 2003 Contents Summary........ 3 Introduction........ 4 Time Period........ 5 Siting......... 5 Monitoring Methods.......
Table of Contents. (a) APPLICABILITY... 1 (b) EXEMPTIONS... 1 (c) DEFINITIONS... 1 (d) STANDARDS... 2
 APPLICABILITY... 1 (b) EXEMPTIONS... 1 (c) DEFINITIONS... 1 (d) STANDARDS... 2") RULE 20.4 NEW SOURCE REVIEW PORTABLE EMISSION UNITS (ADOPTED AND EFFECTIVE 5/17/94) (REV. ADOPTED AND EFFECTIVE 12/17/97) (REV. ADOPTED 11/4/98; EFFECTIVE 12/17/98) (REV. ADOPTED AND EFFECTIVE 4/27/16)
RULE 20.4 NEW SOURCE REVIEW PORTABLE EMISSION UNITS (ADOPTED AND EFFECTIVE 5/17/94) (REV. ADOPTED AND EFFECTIVE 12/17/97) (REV. ADOPTED 11/4/98; EFFECTIVE 12/17/98) (REV. ADOPTED AND EFFECTIVE 4/27/16)
Fpollutant-free zero air for analytical
 Ambient Air Quality Monitoring System AQMS-100 Zero Air Generator PI AQMS-100 provides ultra pure Fpollutant-free zero air for analytical purpose. Remote monitoring and configuration can also be achieved
Summary of National Monitoring Steering Committee Meeting of December 2010
 Summary of National Monitoring Steering Committee Meeting of December 2010 MARAMA Monitoring Committee Meeting April 12 13, 2011 RTP, North Carolina Charlie Pietarinen, NJDEP Summary of AIRNow Pre-Meeting
Air Quality Monitoring
 Air Quality Monitoring in the vicinity of a CNRL well blowout February 25, 2010 to March 9, 2010 Summary report Overview All monitoring sites were downwind of the Canadian Natural Resources Limited (CNRL)
STATEMENT OF BASIS for NEWARK BAY COGENERATION PARTNERSHIP L.P.
 I. FACILITY INFORMATION Newark Bay Cogeneration Partnership L.P. is located at 414-514 Avenue P, Newark, New Jersey, Essex County and consists of a 120-megawatt cogeneration plant. The facility is owned
I. Pollutants A. Harmful substances the enter the environment
 I. Pollutants A. Harmful substances the enter the environment II. Two Classifications A. Particulates 1. Tiny substances (liquid or solid) suspended in the atmosphere 2. Examples: Dust, Ash, and Soot 3.
A. INTRODUCTION B. POLLUTANTS FOR ANALYSIS
 Chapter 2, Section F: Air Quality A. INTRODUCTION This section examines the potential for air quality impacts due to the proposed operational and geometric changes in traffic conditions along Fulton Street