SUBJECT: Comments of the New Jersey Department of Environmental Protection on the 2016 Regional Greenhouse Gas Initiative (RGGI) Program Review
|
|
|
- Britton Booth
- 6 years ago
- Views:
Transcription
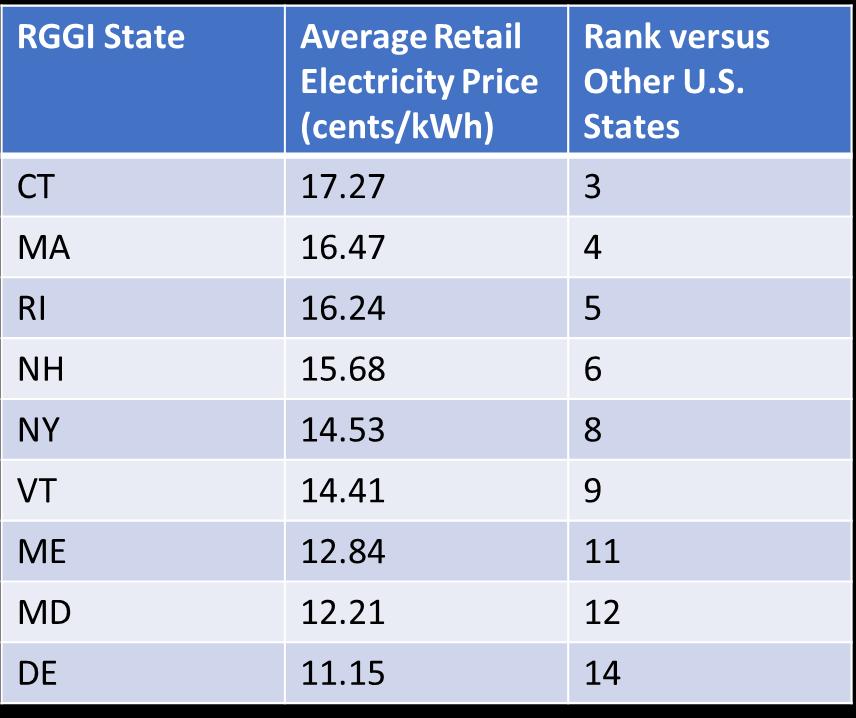
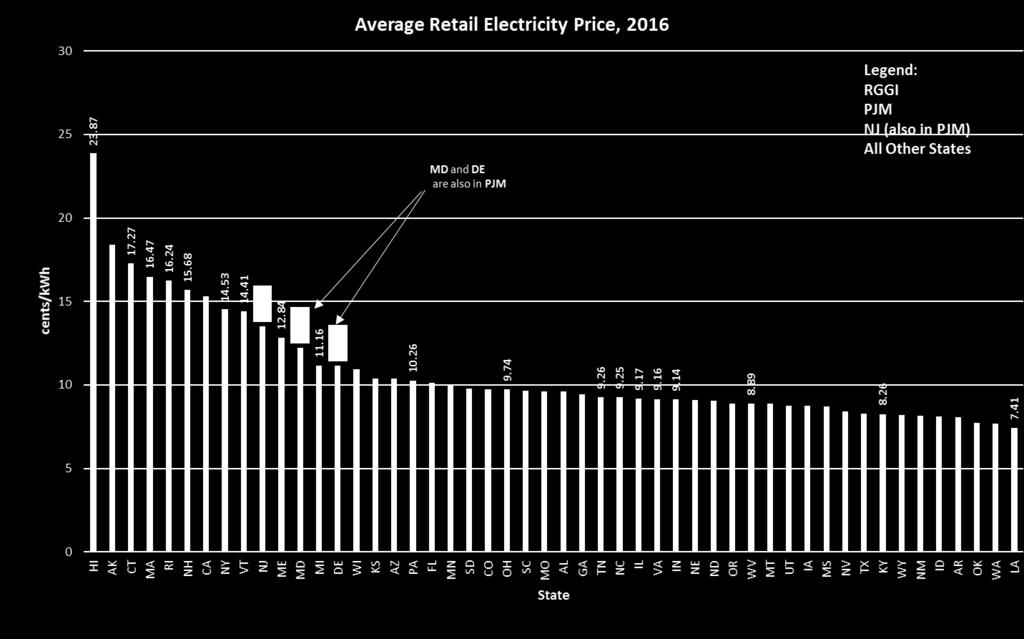
1 TO: FROM: Mr. Andrew McKeon Executive Director RGGI Incorporated William O Sullivan, Air and Energy Advisor New Jersey Department of Environmental Protection SUBJECT: Comments of the New Jersey Department of Environmental Protection on the 2016 Regional Greenhouse Gas Initiative (RGGI) Program Review DATE: October 6, 2017 We have reviewed the announced plan to amend and extend a revised RGGI program out to 2030, with a goal of cutting CO2 emissions an additional 30% between 2020 and Of particular importance, we note that RGGI proposes to establish a range of allowance prices, implemented through an Emission Containment Reserve (ECR) and a Cost Containment Reserve (CCR), to avoid either very low or very high allowance costs. These tools, in effect, would establish a floor price and a ceiling price for RGGI allowances during the program period. The ECR price is proposed at $6 per ton in 2021, with an increase to $11 per ton by The CCR is $13 per ton in 2021, and rises to $23.90 in Since the RGGI allowance price under the current RGGI program is about $3 in 2030, the cost of RGGI allowances under the new proposal may rise by a factor of 8 by Our review suggests that the proposed RGGI program could result in significant increases in electricity rates for any participating RGGI state. We understand that efforts for EE can reduce the total amount spent on electricity and can offset increases in electric rates. However, there is a point where returns on EE investments diminish, which is not sufficiently acknowledged in the proposal. The proposal simply suggests or implies that as more money is spent on EE, the savings will continue to rise proportionately. RGGI should acknowledge and evaluate the impacts on individuals and businesses that will see increases in energy rates and little to no reductions in energy use. In this vein, we note that participating RGGI states already have some of the highest retail electricity rates in the nation, with six of the nine states in the top ten, and increased energy costs should be of major concern. If increased electric rates drive business and industry to other states or nations with less costly and more polluting electric power production, net increases in CO2 emissions would result, to the detriment of the environment as well as the local RGGI economies that have suffered the loss of business and industry. The proposed 8-fold increase in RGGI allowance costs will increase the difference in electric rates between RGGI and PJM states, causing a greater shift of electric production to PJM states. Leakage does not appear to be sufficiently addressed in the proposal, and can result in a net global increase in CO2 emissions, even if the participating RGGI states reduce their own mass emissions. ICF International, a consulting firm hired by RGGI, predicts that for the period of 2017 through 2031, imports from the PJM region into the RGGI states can be expected to increase significantly. The rate of emissions from the PJM power sector is significantly higher than the RGGI rate and, accordingly, a 1
2 decrease in mass of emissions for the RGGI states could be offset by an increase in emissions elsewhere, as RGGI imports of electricity increase. The New Jersey Department of Environmental Protection offers the attached questions, comments, and concerns regarding the cost and effectiveness of the proposed RGGI program. In the attachments, we highlight some of New Jersey s experiences and results of efforts to reduce emissions through air quality regulation, permitting and enforcement, as well as clean energy programs for energy efficiency (EE), renewable energy (RE) and also billing assistance, which are administered through the New Jersey Board of Public Utilities (NJBPU) Clean Energy Program. New Jersey ratepayers support such investments in annual amounts of approximately $1.23 billion per year. New Jersey has experienced significant environmental and economic benefits from these initiatives. We have greatly expanded our EE efforts, annually increased the RE portion of our electric generation portfolio (in compliance with our Renewable Portfolio Standard), reduced coal generation to approximately 2% of our annual in-state generation mix, and added significant new, highly efficient and low-emitting combined cycle natural gas generation. When we couple nuclear and RE, approximately 50% of our in-state generation is now zero emission. And the United States Energy Information Administration identifies NJ s CO2 emission rate for 2016 as 561 lbs/mwh, amongst the lowest in the nation. Targeting improvements in emission rates can make more sense on a national scale. Piecemeal focus on mass emissions can merely result in shifting the production of global and criteria pollutants to other states or nations. Also, it is not clear whether RGGI has accounted for the CO2 emissions from the increased imports of electricity from PJM in its projections of CO2 emission reductions for RGGI states. We recommend this be calculated and included in CO2 projections. Appendix D shows the trends in rates of CO2 emissions per MWhr of electric production in NJ, RGGI, and PJM states. NJ has the lowest rates, with RGGI close behind. PJM has much higher rates of CO2 emissions. Capping RGGI mass emissions to the extent that it increases imports from PJM is counter-productive to the RGGI goal of reducing CO2 emissions. Optimally, RGGI would further reduce its CO2 emission rates and decrease its imports of electricity from PJM. That could result in lower CO2 emissions in the PJM/RGGI region, even though the CO2 mass emissions in RGGI states may be somewhat higher than proposed. Higher electric production in the cleanest units throughout the larger region makes most sense for overall CO2 emission reductions. We appreciate the opportunity to comment on the draft scenario. 2
3 Table of Contents I. Questions 1. Preliminary Issues for Further Consideration Issues Related to Natural Gas Prices The Role of Energy Efficiency in RGGI Banking and Availability of Banked Allowances... 7 II. More Detailed Comments 1. RGGI Proposes to Raise the Trigger for the Cost Containment Reserve RGGI Allowance Revenue is Less Than Ratepayer Costs Electricity Price Increases Resulting From the RGGI Initiative Could Benefit Existing Nuclear Generation RGGI Could Result in Net Air Pollution Increases in the PJM Region Estimates on Potential RGGI Program Price Impact on NJ Electric Rates The Projection of Average Wholesale Energy Prices for the RGGI Policy Case is Lower Than Expected 7. RGGI State Electric Rates Are Already High Does RGGI Exacerbate USEIA Projection of a Short-Term Increase in Coal Consumption? RGGI Comments on the Clean Power Plan Affirm Natural Gas Was Key to RGGI Reductions 10. NJ Renewable Portfolio Standard (RPS) Compliance Costs Energy Efficiency Progress: NJ s Reduction in Energy Use is Almost Twice That of the RGGI Region Over the Past 10 Years..12 3
4 12. Energy Efficiency Funding Under Current RGGI Program Energy Efficiency is Not Available to Everyone NJ Has Efficient Sources of Funding for EE NJ As a Net Exporter of Cleaner Energy Banking and the Availability of Banked Allowances III. Appendices Appendix A: Adding a RGGI Allowance Cost to Gas Combustion Reduces Gas Competitiveness, Drives Increased Coal Combustion From Non-RGGI States in PJM Appendix B: Analysis of Trends in New Jersey Electric Generation Mix Versus...18 RGGI States Generation Mix Appendix C: PJM Capacity Clearing Price and Base Clearing Price by Region Appendix D: PJM, RGGI, and NJ CO2 Emission Rate Trends ( )...22 Appendix E: Average Retail Electric Price Comparison for NJ, RGGI States, PJM States And All Fifty U.S. States 4
5 I. Questions on the 2016 Regional Greenhouse Gas Initiative Program Review A. Preliminary Issues for Further Consideration: 1) The RGGI proposal should provide an estimate of the range of wholesale electric price increases for each state, with consideration for the frequency that fossil fuel power plants set the price of electricity. In PJM, fossil fuel power plants generally set the price of electricity in the daily and capacity energy markets. Coal set the price of electricity 45% of the time and NGCC units set the price 44% of the time in (Source: Monitoring Analytics: PJM State of the Market Report for 2016 (section 3 Energy Markets Table 3-6, page 13). The report can be found at: 2) Some electricity users may be able to reduce electric consumption with EE to offset some or all of the increase in electric rates, but many will see much higher bills; especially energy-intensive industries that have already implemented EE to contain electric costs. RGGI s proposed program for 2020 to 2030 should evaluate measures, or recommended options for states, to address energy intensive industries that may transfer production to non-rggi states or overseas, due to increases in electric rates resulting from the cost of RGGI allowances. USEIA projects an increase in coal consumption in the short-term based upon EIA s own projections of higher gas prices. The RGGI proposal should evaluate the impact of increased allowance prices relative to increased imports from PJM and the potential for increases in coal and natural gas usage within the PJM region. Alternatively, the RGGI proposal should evaluate the impact of increasing allowance pricing should USEIA s projection of higher natural gas pricing prove inaccurate. 3) Page 9 of the 9/25/17 IPM Potential Scenario Customer Bill Analysis is titled RGGI Average Projected Energy Prices ($/MWhr). These projections show about a 5% difference in average electric prices (rates) by 2031, between the reference case and policy case for the RGGI states. However, the projection also shows a dramatic increase for average electric rates between 2018 and 2019, escalating from about $28 per MWhr to $35 per MWhr. An explanation should be provided for this approximately 25% increase in wholesale electric rates over 1 year. 4) Page 11 of the 9/25/17 Overview contains a graph of projected CO2 emissions in the RGGI region. There is no analysis for the apparent discontinuity between 2016 actual emissions and the 2017 projected emissions. The discontinuity should be explained. In this vein, the reference case for 2017 shows CO2 higher than the 2016 actual CO2, without explanation. More specifically, why is the high policy case 2017 emissions lower than the 2016 actual emissions? If the reference case and high policy case start in 2017 at the same level as the policy case and the 5
6 lines shifted accordingly, would the reference case end up with lower emissions than the high policy case? 5) The RGGI proposal should identify the type of units that typically set the on-margin electric rates, and identify the on-margin CO2 emission rates of those units. The proposal should also identify the average on-margin emission rates for the New England and New York power grids. B. Issues Related to Natural Gas Prices Natural gas prices have been shown to be a significant driver for projections of electric generation mix in other other modeling efforts. ICF should address the potential for price variations to influence modeling results. Specifically, Henry Hub gas prices can vary significantly from Marcellus gas prices and there should be discussion of this variation could significantly affect RGGI modeling. Modeling shows a difference in price of natural gas between 2017 and 2020 a large differential in the assumed gas prices between 2017 and 2020, of $1.81 for the high sensitivity case and $1.42 for the base case. There should be a discussion of the confidence level for such price projections and the impact on modeling results. 6) There needs to be clarification as to whether and to what extent estimates of natural gas prices were used to calculate savings from energy efficiency and how such savings may vary under different price projections. 7) A number of studies have identified the need for additional natural gas pipeline infrastructure in the RGGI region. The RGGI proposal should evaluate whether such constraints could impact RGGI s CO2 reduction goals in the timeframe. C. The Role of Energy Efficiency in RGGI: The materials provided for the 9/25/17 stakeholder meeting show a significant reliance upon allowance revenue to fund expanding energy efficiency efforts and that EE investments are critical to reducing electricity price increases attributable to increasing allowance costs. In this regard, the materials appear to state the following: Allowance revenue will continue to be applied to EE in the % amounts identified by each RGGI state; - Rising allowance revenue will continue to increase EE investments by the RGGI states; - The amount of EE for the draft policy scenario will be higher than for the reference case; and, - EE will reduce the demand for electricity and reduce electric rates. Based upon the above, graphs that support such projections and conclusions over the 2020 to 2030 timeframe should be developed and provided, along with the identification of EE assumptions and 6
7 analysis to support the differing conclusions between the reference case and policy scenario. More specifically, 8) Explain the difference in EE between the reference case and the draft policy scenario as relates to energy use reduction and savings on electric bills. 9) Explain the means by which each EE dollar from RGGI allowances are invested, and then converted to watthours of electric savings. For example, how many watthours per year are saved per EE dollar spent? Do these factors change over time as the major EE improvements are implemented and less cost-effective EE improvements remain? 10) With respect to the reference case and the draft policy case identify the total amount of new EE in the reference case and draft policy cases? the proportion of the reference case new EE and draft policy scenario new EE that is independent of RGGI allowance revenue; the proportion of the reference case new EE and draft policy scenario new EE that is dependent on RGGI allowance revenue; if available, the % reduction of electric use caused by new EE for each year between 2020 and 2030 for the reference and policy cases, comparing projections of electric generation without the extra EE paid by allowance revenue; Since ratepayers will implement various levels of EE, there should be a prediction of the distribution of electric bill changes for all the ratepayers 11) Increasing use of electric vehicles will increase electric demand and will impact electricity rates relative to cost savings sought to be achieved through EE investments to decrease electric demand. Explain how EV penetration may impact RGGI cost projections over time. D. Banking and Availability of Banked Allowances 12) The footnote for the 2032 cap in the 9/25/17 overview material indicates that there would be no bank beyond Clarify whether the 2031 projected emissions on page 12 are without any reduction in banking and whether the 2032 cap on page 12 is with the elimination of banking? 13) Explain whether states joining RGGI will be allocated a bank of allowances at the start of their RGGI program. 14) Explain or evaluate whether allowances will be readily available to power plants in states that join RGGI, from the holders of the banks in other states. 7
8 15) Evaluate whether the proposed elimination of currently banked allowances could result in a hording of allowances, thereby driving up the cost of allowances relative to the Cost Containment Reserve price. E. More Detailed Comments 1. RGGI Proposes to Raise the Trigger for the Cost Containment Reserve (CCR) When this price of allowances is reached, it would result in releasing more credits to control further cost increases. It does not guarantee costs will not go above the CCR trigger. However, use of the CCR amount is a reasonable estimate of the high end of RGGI allowance costs. In 2030 the CCR would be $ This is much higher (8 times) than the $3 allowance price predicted in 2030, if the current RGGI program had been extended as is (page 14 of 9/25/17 overview). 2. RGGI Allowance Revenue is Less Than Ratepayer Costs The amount of RGGI allowance revenue returned to the states is less than the increase in ratepayer costs due to electric rate increases. This is especially true for states with nuclear power plants. In New Jersey we estimate that for every $1 in electric cost increase, there would be about a 50 cent return of allowance revenue if NJ was in RGGI. This is because RGGI regulates at the wholesale level, and increased electric bids by fossil fuel units to recover allowance costs results in increased wholesale prices for all electric producers in the area, including nuclear. NJ s current practice of funding EE and other clean energy programs at the retail level ensures that for every $1 in electric bill increase, there is $1 in revenue for EE and other clean energy programs. RGGI allowances are a more costly way to fund EE. 3. Increased Price of Electricity Could Benefit Existing Nuclear RGGI allowance costs increase the price of all electricity sold. For states with existing nuclear, such units would likely benefit from increased auction prices caused by rising RGGI allowance prices on fossil fuels. These price increases, however, would be levied on ratepayers and, accordingly, reduce the value of allowance revenue returned to the respective states, which could be significant. These impacts should be evaluated for RGGI states with existing nuclear. With respect to New Jersey s power sector where nuclear and RE energy combine for about 50% of in-state generation, we estimate that under a RGGI program, New Jersey ratepayers would likely see a return of only $0.50 on each $1 invested, and such costs would come on top of current ratepayers assessments under existing programs, which totaled, as mentioned above, approximately $1.23 billion in Energy Year Net Air Pollution Increases in PJM Higher RGGI allowance costs could result in net air pollution emission increases in the PJM region. Generators must submit bids to the electric market that include the price of RGGI allowances. These generators are competing with PJM units located in other non-rggi states to supply power to the PJM grid. This competitive disadvantage could result in the PJM market selecting power from higher-emitting units in the non-rggi PJM states. Hence, the power generation and the associated CO2 emissions leak out of RGGI. The net result would be that 8
9 the overall generation mix shifts from RGGI units with lower emission rates to non-rggi units that generally have higher emission rates. This could result in increased, rather than decreased, CO2 emissions in the PJM region. The CO2 emission rate for the marginal units that clear the PJM energy auction is about 1500 lb/mwhr, which is about 50% higher than the NJ approximately 1000 lb/mwhr NGCC rate (assuming NGCC units set the marginal electric rate in NJ). Hence, for every ton of NJ CO2 reduction due to power shifting, there could be a 1.5 ton of PJM CO2 increase, resulting in a net increase in CO2 emissions. Using 1500 and 1000 lbs per MWhr are conservative assumptions to calculate CO2 increases in PJM. Similar CO2 increase calculations could be done for RGGI states leakage to non-rggi PJM states. In RGGI states this leakage issue is exacerbated by the electric import trends documented in Appendix B, and RGGI projections of increasing imports of electricity between 2020 and Additionally, leakage due to higher RGGI allowance costs may have other unintended consequences, such as NOx emissions increases in non-rggi PJM states, adding to, or causing, exceedances of the ozone health standard in NJ and RGGI states due to ozone transport. 5. Estimates on Potential RGGI Program Price Impact on NJ Electric Rates The following exercise provides an estimate of the potential impact of RGGI participation on NJ electric rates. Assumptions/methodology are outlined below: A. Estimated increase in NJ electric rates: 74 million MWhrs x $23.90/ton allowance cost x 1000 lb/mwhr for avg electric price setter / 2000 lb/ton = $884 million per year in 2030 B. Minimum estimated increase in NJ total electric cost: Assuming the minimum RGGI allowance price will be $11.03, based on the ERC trigger, the minimum increase in NJ electric rates would be: 74 million MWhrs x $11.03 x ( 1000 lb/mwhr) /2000 lb/ton = $408 million per year in 2030 C. The above cost estimates assume that a 1000 lb/mwhr NGCC unit is always the price-setter. In PJM coal plants at 2000 lbs/mwhr can also be the price-setter. Appendix D includes information on the CO2 emission rate for the average unit that sets the price of electricity, which is referred to as the on-margin average on this graph. Assuming an average of 1500 lbs/mwhr sets the price in PJM, the cost increase for NJ ratepayers could be $612 million to $1.3 billion in D. Conclusion: The potential electricity cost increase in NJ in 2030 due to RGGI is therefore in the range of $400 million to $1.3 billion per year in That is 4% to 13% of the current approximately $10 billion of electric sales in NJ. Appendix D includes information on the CO2 emission rates for the average unit that sets the price of electricity each year for the PJM grid. This is referred to as the on-margin average on the Appendix D graph. The actual amount of the RGGI increase will depend on the RGGI allowance market price (based on the supply and demand for RGGI allowances), the amount of energy efficiency (reduces demand), the amount of nuclear retirements (decreases supply), and CO2 emission characteristics of the electric plants that are setting the price of electricity in the energy and capacity markets (lower CO2 reduces the impact of allowance prices). It is not unreasonable to expect that the proposed 9
10 revised RGGI program could increase NJ electric bills by $1 billion in 2030, resulting in a 10% increase in retail electricity costs. Even if NJ is not in RGGI, electric rates would likely increase in NJ as a result of Maryland and Delaware being in the Eastern Mid-Atlantic Area Council (EMAAC) region of PJM if the proposed RGGI changes are implemented. (See appendix C for a map of the PJM and EMAAC regions, and a table ranking all fifty states by electricity rates). This is because fossil fuel power plants in Maryland and Delaware could set the market price of electricity in EMAAC at times, and the increased price of allowances (about four to eight times higher than current allowance prices) would then be included in that EMAAC market price. Note that six of nine RGGI-participating states are in the top ten of electricity rates, and, collectively, all within the top 14 states. 6. The Projection of Average Wholesale Energy Prices for the RGGI Policy Case is Lower Than Expected Page 9 of the 9/25/17 IPM Potential Scenario Customer Bill Analysis is titled RGGI average projected energy prices ($/MWhr). This shows about a 5% difference in average electric prices (rates) by 2031, between the reference case and policy case for the RGGI states. That seems inconsistent with the increase in RGGI allowance price projected on page 14 of the 9/25/17 Overview. The differential between the policy $13 per ton projection and the reference case $3 per ton projection is $10 per ton for If 1000 lb/mwhr emission rate (typical of natural gas combined cycle units) on average sets the electric prices in RGGI, and the increase in $10 per ton for a RGGI allowance is included in that rate, then the electric rates for the policy case would be $5 per MWhr more than the reference case in If the reference case is $36 per MWhr, then the policy case would be $41 per MWhr (instead of about $38 per MWhr projected). That would be about a 14% increase in electric rates as compared to the reference case. However, the graph shows a difference of less than $2 per MWhr, a bit over a 5% difference. In the RGGI region, what type of units typically set the on - margin electric rates, and what is the on - margin CO2 emission rates of those units? See appendix D which shows PJM s on-margin CO2 emission rates. Does RGGI have similar information for the on- margin emission rates for the New England and NY power grids? 7. RGGI State Electric Rates are Already High The nine RGGI states rank amongst the states in the nation with the highest average retail electricity costs; specifically, six states are in the top ten and the remaining three states are in the top fourteen. NJ is ranked tenth in terms of costs. See Appendix C for a table ranking all fifty states by electricity rates. RGGI impacts on electricity costs should be of concern since such costs could serve to drive business and industry to other states or nations with less efficient power sectors, resulting in a net detriment to global emissions, localized air quality and negative impacts on the regional economy. 8. USEIA Projects Increase in Coal Consumption in the Short-Term. Does RGGI Exacerbate This? Recently, the USEIA projected that USA coal use would increase in 2017 relative to gas because of an increase in gas prices (Source: International Energy Outlook 2017, United States Energy Information Administration. See RGGI allowance prices have the purpose of 10
11 increasing the cost of coal and gas combustion units in RGGI states. Under such circumstances, RGGI may serve to support the USEIA projections of greater coal combustion. 9. RGGI Comments on the Clean Power Plan Affirm Natural Gas Was Key to RGGI Reductions The RGGI States acknowledged the role of natural gas in their comments on the Clean Power Plan. RGGI staff have previously commented that increased use of natural gas within the RGGI region, rather than the RGGI program itself, is the primary factor which led to CO2 reductions in the region over the last decade. RGGI representatives have stated that between 2005, when an agreement to implement RGGI was announced, and 2012, power sector CO2 emissions in the RGGI participating states fell by more than 40 percent. RGGI was not the primary driver for these reductions, but the reductions led RGGI-participating states to later adjust the CO2 emission limits downward (Fed Reg, vol 79, no 117, p June 18, 2014). It is our understanding that the primary driver of these emission reductions was the advent of cheap natural gas, which supplanted dirtier fuel stocks. Also, we note that gas is the largest fuel component in the ICF projections for RGGI states in 2023 and 2031 (page 10 of 9/25/17 overview). To decrease natural gas combined cycle (NGCC) use in New Jersey and increase coal use in PJM would dampen the declining regional CO2 trend. RGGI States Supplemental Comments on Proposed Clean Power Plan, December 1, 2014 The RGGI states respectfully reiterate their support for consideration of the potential for new NGCC plants in Building Block Two. The significant increase in NGCC generation in the RGGI region in recent years is illustrative of the potential on a nationwide scale. In New York alone, 18 new NGCC units came on-line between 2004 and 2011, increasing the State s natural gas-fired nameplate capacity by approximately 150 percent in a seven-year period. This experience is typical of the RGGI region, which added more than 21 gigawatts of natural gas-fired generation capacity between 1997 and RGGI Chairwoman Katie Dykes on need for pipeline infrastructure "Because we made such a rapid transition to natural gas-fired generation [in New England], we have work to do to get gas pipeline infrastructure developed to serve that gas generation," RGGI chairwoman and Connecticut Department of Energy and Environmental Protection deputy commissioner Katie Dykes said at an event hosted by the Center for Strategic and International Studies in Washington, DC. (Washington, 5 June 2015 Argus) Does RGGI still support these views under the Program Update? PJM projects that under low natural gas price scenarios, the PJM region will by 2019 reach the CO2 reduction target EPA established for 2030 under the Clean Power Plan. The significant increase in natural gas generation that NJ has experienced is also seen in the data for RGGI, in the charts included in Appendix B. 11
12 10. NJ Renewable Portfolio Standard (RPS) Compliance Costs Second Only to California NJ spends the 2 nd highest amount in the USA (after CA) and highest in the eastern USA on RPS compliance in 2016 (7.5% RPS costs vs 1.6% average for other states with RPS) with Massachusetts close behind. (Source: U.S. Renewables Portfolio Standards, 2017 Annual Status Report, Lawrence Berkeley National Laboratory, July 2017). The 7.5 % of NJ electric bill that is dedicated to renewable energy and energy efficiency is high relative to the average state in the USA. Not further increasing the electric rates significantly is important in states like NJ that already have major EE and RE programs. 11. Energy Efficiency Progress Based on EIA data, over the last 10 years, the overall electricity consumption in the RGGI region has declined by about 5%. The approximately 9% decline in New Jersey electricity use has been almost twice as much over these same 10 years. See appendix B for more information. We recognize that the reduction in electric sales is not solely the result of EE progress, but the greater decline in NJ could be the result of NJ s EE program. 12. Energy Efficiency Funding Under Current RGGI Program NJ s energy efficiency program is much better funded with the New Jersey Board of Public Utilities (NJBPU) Clean Energy Program, than if NJ had relied on RGGI allowance revenue to fund our EE program. NJ s Clean Energy Program budget for 2017 is $145 million, with approximately $100 million of this dedicated to electric EE (Source: NJBPU Clean Energy Program Comprehensive Resource Analysis), while RGGI would have only generated about $60 million in annual allowance revenue (at about $3 per ton) to potentially have been used for EE. 13. Energy Efficiency is Not Available for Everyone We understand that funding of energy efficiency does reduce the total amount spent on electricity and can offset the increase in electric rates for some persons. However, if a state is already spending significant amounts on energy efficiency (NJ spends over $200 million per year), the cost of additional EE will likely be higher and result in less benefit. Over the last decade, NJ has reduced electric consumption by about 9%, which is almost two times higher than the RGGI region s approximately 5% reduction in electric usage. The ICF International conclusion that EE will almost fully offset the cost of higher electric rates for the average ratepayer in RGGI may not apply to all states. Also, there will be a significant number of persons and industries that will not benefit from the energy efficiency improvements that may be funded with RGGI allowance revenue. There will be persons and industries that will see the full effect of the proposed electric rate increases resulting from the much higher cost of RGGI allowances. RGGI should evaluate the distribution of EE benefits and show the effect on persons and industries that achieve little or no reductions in electricity use, not just analyze the average bill. 14. New Jersey Has Efficient Sources of Funding for EE 12
13 The New Jersey Board of Public Utility s (BPU s) energy efficiency program and Renewable Portfolio Standard (RPS) are well funded and effective. If NJ funded energy efficiency with RGGI allowance revenue, this would result in greater increases in the cost of wholesale power since the RGGI allowance value would be bid into the electricity markets. For every $1 in allowance revenue from RGGI NJ ratepayers would pay up to about $2 in increased electric costs. For every $1 invested in energy efficiency and renewable energy in NJ, the NJ ratepayers now pay about $1. A. RGGI - Since RGGI regulates at the wholesale market level, the cost of a RGGI allowance would be included in the bid prices for fossil fueled electric production in NJ, which is mostly natural gas combined cycle (NGCC) units. This would increase the bid price for NJ NGCC units, but not the bid price for coal units in non RGGI PJM states. When the price of coal-fired power approaches the cost of NGCC fired power, the RGGI allowance price difference in bids will result in less NJ NGCC electric production and more PJM coal fired electric production. That results in greater emissions of NOx and CO2 in the non RGGI PJM states, than the reductions in NOx and CO2 from less use of much cleaner NGCC power in RGGI states. Hence, the way RGGI prices CO2 at the wholesale level results in more CO2 and other air pollutants being emitted regionally. This is detailed further in the charts in Appendix A, attached. RGGI would also result in higher electric prices in NJ because of the increase in bids for wholesale electric production by NGCC plants in NJ. If NJ were in RGGI, New Jersey could have a deficit of RGGI allowances as the RGGI cap declines. New Jersey would need to purchase RGGI allowances from the RGGI allowance banks in other states, which would result in the flow of a portion of the NJ retail electric revenue to other RGGI states. B. SBC - The societal benefit charge (SBC) which is used to fund energy efficiency in New Jersey, is placed on the retail use of electricity, not the wholesale production of electricity. Therefore, it has no direct effect on the wholesale price of electricity and does not cause a shift of electric production from clean NGCC units in NJ to much higher emitting coal units in non RGGI PJM states. While increasing retail electric rates, the SBC can also indirectly reduce wholesale electric rates because the energy efficiency financed by the SBC reduces the demand for electricity. That reduction in the demand for electricity reduces emissions of air pollutants. The reduction in wholesale prices of electricity may offset the price of the SBC. The use of all SBC funds in NJ contributes to NJ s economy. SBC funds do not flow to other states. Revenue amounts raised by the SBC and the effect on electric rates are predictable and certain compared to the revenue raised by selling RGGI allowances at an uncertain auction price. A dollar of ratepayer expenditure under the SBC results in a dollar of benefit to the NJ ratepayers. About half the ratepayer increase caused by RGGI would benefit the nuclear power industry. 13
14 15. NJ As a Net Exporter of Cleaner Energy New Jersey s imports of out-of-state electricity have declined by 70% since Beginning in , NJ became a net exporting state. NJ has the cleanest power sector within the PJM region and also ranks amongst states with the lowest CO2, NOx and SO2 emission rates in the nation. Displacing less efficient sources reduces both global and local pollutants. While mass emissions of CO2 may have increased within NJ s power sector, PJM regional mass emissions have decreased and will continue to decrease due to NJ s contribution. (See NJ Trend Chart included in Appendix B). Curtailed output from NJ, which could be the case under a RGGI program as higher allowance costs undermine the competitiveness of NJ s cleaner fossil units, would serve to undermine the dynamic of displacing the operation of less efficient units within PJM. Under such circumstances, global CO2 increases and local air quality suffers. And higher energy costs may drive business to other states or nations with no net benefit for global or local pollution reductions. 16. Banking and Availability of Banked Allowances The RGGI power plant CO2 cap is proposed to decline by 30% between 2020 and 2031 (3% decline each year). However, RGGI predicts that actual power plant emissions would not decline by 30% because of banked allowances. Actual CO2 reductions from RGGI power plants are projected to be about 18% less by 2031, per page 12 of the 9/25/17 overview; (74 ref case - 61 policy case ) /74 = RGGI intends to reduce the amount of banked allowances, has a draft plan on that reduction, but has not decided on the details of that plan. It is not clear how the plan to reduce banked allowances affects actual emission reductions. On page 12 of the 9/25/17 overview, the 2031 projected emissions of 61 million tons per year for the policy case is about 18% less than the reference case 74 million tons. The footnote for the 2032 cap indicates that there would be no bank beyond Please clarify what that means. Is the 2031 projected emissions on page 12 without any reduction in banking and the 2032 cap on page 12 with elimination of banking? Would states joining RGGI have a bank of allowances at the start of their RGGI program? If not and the cap is set based on actual emissions in 2020, the 3% per year decline means power plants in the new RGGI state must produce less electricity from their fossil fuel plants (causing leakage to non RGGI PJM) and/or buy allowances from RGGI states with allowance banks. Has RGGI evaluated whether allowances will be readily available to power plants in states that join RGGI, from the holders of the banks in other states? RGGI to date has had an excess of allowances by design, so there has not been an issue with allowance availability. With the proposed program, one goal is to reduce the amount of banked allowances to zero by 2031, and to significantly increase the price of allowances (by 4 to 8 times the current price). Could a reduction in banked allowances result in the hording of a scarce commodity, driving up the cost of allowances to the cost containment reserve amount? Appendix A: 14
15 Adding a RGGI Allowance Cost to Gas Combustion Reduces Gas Competitiveness, Drives Increased Coal Combustion From Non-RGGI States in PJM Introduction - This analysis qualitatively discusses a potential environmental downside to NJ rejoining RGGI. It also provides, as attachments, graphical tools for estimating potential increases in carbon dioxide (CO2) emissions in the PJM electric grid should NJ rejoin RGGI. Over the 10 year period from 2020 to 2030, NJ membership in RGGI could increase cumulative CO2 emissions in the non RGGI PJM states by over 16 million tons (see charts, below). This analysis does not estimate the increases in NJ wholesale and retail electric rates that would result from NJ rejoining RGGI. According to the 9/25/17 RGGI analysis by ICF International, RGGI allowances could cost between $13 and $24 by These allowance costs would directly increase the price of electricity. The higher the wholesale price of electricity in NJ, the greater the shift of electric power production (and higher CO2 emissions) to non RGGI PJM states that continue to produce a significant amount of electricity with coal fired power plants. A recent USEIA projection indicates that USA coal use would increase in 2017 relative to gas because of increases in gas prices. RGGI allowance prices would further increase the cost of gas combustion in NJ and other RGGI states, resulting in more coal use in non RGGI states on the same or contiguous electric grids. Load shifting from NJ NGCC generators to other non-rggi PJM resources could result in the following net CO2 emission increases due to leakage: 15
16 The first chart shows the potential net CO2 emission increases in PJM if New Jersey were to rejoin RGGI. The net CO2 emission increases are shown for six scenarios that depict various assumptions regarding non-rggi PJM generation replacing New Jersey generation due to the relatively higher prices of New Jersey generation caused by the RGGI allowance prices. The potential net CO2 emission increases are shown for various levels of RGGI allowance deficits in New Jersey that result in reduced New Jersey NGCC operation. The second chart (below) uses Scenario 6 from the first chart as an example of the potential escalating annual CO2 emission increases in PJM should New Jersey rejoin RGGI. Scenario 6 assumes that generation by units that emit the PJM on-margin average for 2016 (1471 lbs CO2/MWhr from the chart in Appendix D) replaces New Jersey NGCC generation that emits at a rate of 1000 lbs CO2/MWhr. This chart shows how the potential net CO2 emission increase, each year, due to additional leakage as the RGGI allowance deficits in New Jersey increase. The RGGI allowance deficits increase due to the 3% RGGI yearly declining cap. The overall potential net CO2 increase over the 11 years ( ) can be 16
17 estimated by adding each annual increase which results in a cumulative total of over 16 million tons of additional CO2 in the PJM region. 17

18 Appendix B: Comparison of Trends in New Jersey Electric Generation Mix Versus RGGI States Generation Mix 18

19 The charts above indicate the following: 1. Electric generation in RRGI declined significantly, and electric imports into RGGI increased significantly over the last decade. This is the most important take away from this slide. This highlights the leakage problem because some of those imports came from PJM which has higher CO2 emission rates than the RGGI states. In contrast, NJ electric generation increased significantly. 2. RGGI electric sales are mostly flat in the last 5 years, with a 5% decline over the last decade. NJ s 9% decline in electric consumption was almost twice that of RGGI. 3. Coal use declined significantly in RGGI, similar to what we are seeing in the PJM states. NJ had a somewhat greater decline, and coal is now only about 2% of the generation in NJ. 19
20 4. Gas use increased in RGGI, but not to the degree we are seeing in the PJM states. NJ gas use increased much more than in RGGI, primarily because of the construction and use of NGCC units. Bottom line: Most of the electric generation changes inside and outside of RGGI appear to have been primarily because of the economics of cheaper gas, with gas replacing coal. What is different is that RGGI has increased imports of electricity, while NJ has decreased imports. RGGI should evaluate how its increased imports of electricity increases CO2 emissions in PJM and take steps in the design of RGGI program changes to avoid further leakage of electricity and CO2 to the PJM region. 20

21 Appendix C 21
22 Appendix D Source: RGGI, PJM and USEIA data 22

23 Appendix E 23
24 24
Technical Supplement to Opening Statement April 28, 2016 Clean Air Council Hearing The Clean Power Plan: Impact on New Jersey
 Technical Supplement to Opening Statement April 28, 2016 Clean Air Council Hearing The Clean Power Plan: Impact on New Jersey Assistant Commissioner John Giordano, Esq. Air Quality, Energy and Sustainability
Emission Portfolio Standards
 Emission Portfolio Standards I. Introduction The Northeast states are developing a regional initiative (known as the Regional Greenhouse Gas Initiative, or RGGI) with the goal of reducing carbon dioxide
Outpacing the Nation: RGGI s environmental and economic success
 Outpacing the Nation: RGGI s environmental and economic success September 2017 2 Table of Contents Executive Summary... 3 Emissions Trends... 4 CO 2 Reductions... 4 Health Impacts... 5 Economic Trends...
CO 2 Emissions from Electricity Generation and Imports in the Regional Greenhouse Gas Initiative: 2015 Monitoring Report
 CO 2 Emissions from Electricity Generation and Imports in the Regional Greenhouse Gas Initiative: 2015 Monitoring Report April 27, 2018 1 This report was prepared on behalf of the states participating
Cost-Benefit Analysis of the PSE&G Energy Efficiency Program 2014 Prospective
 Nov 2014 Cost-Benefit Analysis of the PSE&G Energy Efficiency Program 2014 Prospective CENTER FOR ENERGY, ECONOMICS & ENVIRONMENTAL POLICY EDWARD J. BLOUSTEIN SCHOOL OF PLANNING AND PUBLIC POLICY RUTGERS,
2014) (amending 40 C.F.R. Part 60).
 (amending 40 C.F.R. Part 60).") A WHITE PAPER BY 2 Executive Summary In June 2014, the U.S. Environmental Protection Agency (EPA) announced its Clean Power Plan proposed rule, a comprehensive regulatory proposal to reduce carbon pollution
A WHITE PAPER BY 2 Executive Summary In June 2014, the U.S. Environmental Protection Agency (EPA) announced its Clean Power Plan proposed rule, a comprehensive regulatory proposal to reduce carbon pollution
Clean Power Plan. The Effect on Pennsylvania s Energy Outlook. Joshua Carey, Michael Spiessbach, and Pj Tatano
 Clean Power Plan The Effect on Pennsylvania s Energy Outlook Joshua Carey, Michael Spiessbach, and Pj Tatano Presentation Outline 1. Clean Power Plan (CPP) Summary 2. Projected Nationwide Emission Outlook
Fundamentals of Policy. Matt Clouse U.S. Environmental Protection Agency Renewable Energy Markets Conference September 16, 2009
 Fundamentals of Policy Matt Clouse U.S. Environmental Protection Agency Renewable Energy Markets Conference September 16, 2009 Discussion Goals This session should help you understand and participate in
Dominion Virginia Power and Clean Power Plan Costs: A brief review of the Dominion s 2015 Integrated Resource Plan compliance cost estimates
 Dominion Virginia Power and Clean Power Plan Costs: A brief review of the Dominion s 2015 Integrated Resource Plan compliance cost estimates by William Shobe Center for Economic and Policy Studies and
Demand side energy efficiency was not used in setting rate based targets although it still may be used for compliance.
 Annual Energy Outlook 2016 Full Release Dates: September 15, 2016 Next Early Release Date: January 2017 Report Number: DOE/EIA 0383(2016) Issues in Focus Effects of the Clean Power Plan Laura Martin and
EPA s Proposed Clean Power Plan: Rate to Mass Conversion
 EPA s Proposed Clean Power Plan: Rate to Mass Conversion JENNIFER MACEDONIA ARKANSAS STAKEHOLDER MEETING OCTOBER 1, 2014 EPA S PROPOSED CLEAN POWER PLAN: RATE TO MASS CONVERSION 2 EPA June Guidance on
The Regional Greenhouse Gas Initiative (RGGI)
") The Regional Greenhouse Gas Initiative (RGGI) Air and Radiation Management Administration Climate Change Division May 27, 2016 Basics Maryland officially became the 10 th member of RGGI on April 20, 2007
The Regional Greenhouse Gas Initiative (RGGI) Air and Radiation Management Administration Climate Change Division May 27, 2016 Basics Maryland officially became the 10 th member of RGGI on April 20, 2007
Congress, Congressional Research Service, , R41836, The Regional Greenhouse Gas Initiative: Lessons Learned and Issues for Congress.
 Historical Data Considerations of the Regional Greenhouse Gas Initiative and Implications for Going Forward Environmental Energy Alliance of New York June 1, 2016 The Environmental Energy Alliance of New
EPA s Clean Power Plan Proposal Review of PJM Analyses Preliminary Results
 EPA s Clean Power Plan Proposal Review of PJM Analyses Preliminary Results Paul Sotkiewicz Chief Economist Muhsin Abdur-Rahman Senior Engineer, Market Simulation Members Committee Webinar November 17,
Comparison of CAIR and CAIR Plus Proposal using the Integrated Planning Model (IPM ) Mid-Atlantic Regional Air Management Association (MARAMA)
 Mid-Atlantic Regional Air Management Association (MARAMA)") Draft Report Comparison of CAIR and CAIR Plus Proposal using the Integrated Planning Model (IPM ) Prepared for Mid-Atlantic Regional Air Management Association (MARAMA) Prepared by ICF Resources, L.L.C.
Draft Report Comparison of CAIR and CAIR Plus Proposal using the Integrated Planning Model (IPM ) Prepared for Mid-Atlantic Regional Air Management Association (MARAMA) Prepared by ICF Resources, L.L.C.
The Impacts of the Green Communities Act on the Massachusetts Economy:
 The Impacts of the Green Communities Act on the Massachusetts Economy: A Review of the First Six Years of the Act s Implementation Paul J. Hibbard Susan F. Tierney Pavel G. Darling Analysis Group, Inc.
05/23/14. Power Sector Transition: GHG Policy and Other Key Drivers
 5/23/14 Power Sector Transition: GHG Policy and Other Key Drivers JENNIFER MACEDONIA, BLAIR BEASLEY, MEGHAN MCGUINNESS, STUART ILER MAY 214 5/23/14 POWER SECTOR TRANSITION: GHG POLICY AND OTHER KEY DRIVERS
Voluntary Renewable Energy and the Regional Greenhouse Gas Initiative (RGGI): Solutions for Positive Interactions and Greater Impact
: Solutions for Positive Interactions and Greater Impact") Voluntary Renewable Energy and the Regional Greenhouse Gas Initiative (RGGI): Solutions for Positive Interactions and Greater Impact Prepared for the Pace Energy and Climate Center Updated September 5,
Voluntary Renewable Energy and the Regional Greenhouse Gas Initiative (RGGI): Solutions for Positive Interactions and Greater Impact Prepared for the Pace Energy and Climate Center Updated September 5,
EPA's Clean Power Plan Proposal: A Summary of Key Results from PJM's Economic Analysis
 EPA's Clean Power Plan Proposal: A Summary of Key Results from PJM's Economic Analysis National Association of State Utility Consumer Advocates June 9, 2015 www.pjm.com PJM as Part of the Eastern Interconnection
Table 1. Wellhead Gas Price Assumptions in CCSD and AESC Modeling ($2003/mmBtu)
") To: Brooke Suter, Connecticut Climate Coalition From: Bruce Biewald, David White and Geoff Keith Date: December 15, 2003 Subject: Review of GHG Modeling for Connecticut We have reviewed the modeling performed
To: Brooke Suter, Connecticut Climate Coalition From: Bruce Biewald, David White and Geoff Keith Date: December 15, 2003 Subject: Review of GHG Modeling for Connecticut We have reviewed the modeling performed
Subject: Comments on Virginia s proposal to join the Regional Greenhouse Gas Initiative. Dear Executive Director McKeon and Members of the RGGI Board,
 February 9, 2018 Andrew McKeon, Executive Director RGGI, Inc. 90 Church Street, 4th Floor New York, NY 10007 Regional Greenhouse Gas Initiative VIA ELECTRONIC SUBMISSION Subject: Comments on Virginia s
CO 2 Emissions from Electricity Generation and Imports in the Regional Greenhouse Gas Initiative: 2011 Monitoring Report
 CO 2 from Electricity Generation and Imports in the Regional Greenhouse Gas Initiative: 2011 Monitoring Report June 27, 2013 1 This report was prepared on behalf of the states participating in the second
PJM Interconnection Economic Analysis of the EPA Clean Power Plan Proposal
 PJM Interconnection Economic Analysis of the EPA Clean Power Plan Proposal March 2, 2015 This page is intentionally left blank. PJM 2015 www.pjm.com 2 P age Contents Executive Summary 6 Introduction and
Decarbonization: Energy Policy Planning in California and Its Implications for the Northeast
 Decarbonization: Energy Policy Planning in California and Its Implications for the Northeast S E P T E M B E R 1 3, 2 0 1 6 N O R T H E A S T G A S A S S O C I A T I O N 2 0 1 6 E X E C U T I V E C O N
Eastern Trends: Modeling the Evolving Power Sector and Impacts of the Final Clean Power Plan
 Eastern Trends: Modeling the Evolving Power Sector and Impacts of the Final Clean Power Plan JENNIFER MACEDONIA* POWER SECTOR TRENDS IN THE EASTERN INTERCONNECT ATLANTA, GEORGIA SEPTEMBER 13, 2016 *Excerpts
Impact of Regional Greenhouse Gas Initiative and Renewable Portfolio Standards on Power System Planning
 Impact of Regional Greenhouse Gas Initiative and Renewable Portfolio Standards on Power System Planning Panel on Impacts of GHG Programs and Markets on the Power Industry PESGM2006 Montreal June 21, 2006
ZERO-EMISSION CREDITS. April 2018
 ZERO-EMISSION CREDITS April 2018 INTRODUCTION Nuclear energy provides reliable baseload electricity without carbon emissions or other air pollution. The plants that produce this electricity are economic
Does Wind Power Reduce Air Pollution?
 Does Wind Power Reduce Air Pollution? Effects of Power Dispatch & Cap and Trade Design National Research Council Committee on Environmental Impacts of Wind Energy Projects December 14, 2005 Richard Cowart
Power Sector Transition: GHG Policy and Other Key Drivers
 Power Sector Transition: GHG Policy and Other Key Drivers JENNIFER MACEDONIA ARKANSAS 111(D) STAKEHOLDER MEETING MAY 28, 214 5/23/14 POWER SECTOR TRANSITION: GHG POLICY AND OTHER KEY DRIVERS 2 Purpose
Regional Greenhouse Gas Initiative: Updates
 Regional Greenhouse Gas Initiative: Updates A Multi-State Collaboration Current Participants Connecticut Delaware Maine Maryland Massachusetts New Hampshire New York Rhode Island Vermont 2 RGGI in Brief
RGGI 2016 Program Review: Principles to Accompany Model Rule Amendments December 19, 2017
 RGGI 2016 Program Review: Principles to Accompany Model Rule Amendments December 19, 2017 The Regional Greenhouse Gas Initiative (RGGI) is a cooperative effort of nine Northeast and Mid-Atlantic states
THE REGULATORY ASSISTANCE PROJECT
 THE REGULATORY ASSISTANCE PROJECT The Regional Greenhouse Gas Initiative in the Northeastern United States: Auctioning Emissions Allowances Introduction and Overview December 2008 The Regional Greenhouse
PJM Analysis of the EPA Clean Power Plan
 PJM Analysis of the EPA Clean Power Plan PJM Interconnection October 6, 2016 PJM CPP Study Objectives Evaluate potential impacts to: Resource adequacy Transmission system operations PJM energy and capacity
CHAPTER 3: RESOURCE STRATEGY
 Seventh Northwest Conservation and Electric Power Plan CHAPTER 3: RESOURCE STRATEGY Contents Key Findings... 3 A Resource Strategy for the Region... 3 Summary... 3 Scenario Analysis The Basis of the Resource
RGGI Program Review: September 25, 2017 Stakeholder Meeting. rgg.ora
 THE REGIONAL GREENHOUSE GAS INITIATIVE An Initiative of the Northeast and Mid-Atlantic States of the U.S. RGGI Program Review: September 25, 2017 Stakeholder Meeting rgg.ora GG1 Program evie September
2009 Power Smart Plan
 2009 Power Smart Plan July 2009 *Manitoba Hydro is a licensee of the Official Mark Executive Summary The 2009 Power Smart Plan forecasts Manitoba Hydro s costs and savings to the benchmark year of 2024/25
COMMENTS OF COMVERGE, INC. NEW JERSEY CAPACITY ISSUES TECHNICAL CONFERENCE
 COMMENTS OF COMVERGE, INC. NEW JERSEY CAPACITY ISSUES TECHNICAL CONFERENCE Overview The Board of Public Utilities (BPU) is understandably concerned about the adequacy and composition of electric energy
Waxman-Markey Bill May 18, 2009
 Waxman-Markey Bill May 18, 2009 The American Clean Energy and Security Act of 2009 May 2009 Agenda 1 Structure of the Bill 2 3 4 5 6 7 8 9 10 Renewable Electricity & Energy Efficiency Resource Standard
Implications of Policy-Driven Residential Electrification
 ENERGY Implications of Policy-Driven Residential Electrification An American Gas Association Study prepared by ICF July 2018 IMPORTANT NOTICE: This is an American Gas Association (AGA) Study. The analysis
Calculating Alabama s 111(d) Target
 Target") Calculating Alabama s 111(d) Target Prepared for the Southern Environmental Law Center November 26, 2014 AUTHORS Spencer Fields Elizabeth A. Stanton, PhD Pat Knight Bruce Biewald Joe Daniel Sarah Jackson
Calculating Alabama s 111(d) Target Prepared for the Southern Environmental Law Center November 26, 2014 AUTHORS Spencer Fields Elizabeth A. Stanton, PhD Pat Knight Bruce Biewald Joe Daniel Sarah Jackson
A Perspective on the Clean Power Plan: Stringency, Scope and Form
 A Perspective on the Clean Power Plan: Stringency, Scope and Form Sophie Pan, Dallas Burtraw, Anthony Paul, Karen Palmer Presented at TAI Conference 10/06/2014 Presented by Sophie Pan Outline 1. Introduction
MISO/PJM Joint Modeling Case Study: Clean Power Analysis
 MISO/PJM Joint Modeling Case Study: Clean Power Analysis MISO PJM Interconnection March 10, 2017 This page is intentionally left blank. 2 P a g e Executive Summary... 5 Study focus and key observations...
Regional Greenhouse Gas Initiative (RGGI; Reggie ) Will Space Massachusetts Department of Environmental Protection Washington, DC March 15, 2013
 Will Space Massachusetts Department of Environmental Protection Washington, DC March 15, 2013") Regional Greenhouse Gas Initiative (RGGI; Reggie ) Will Space Massachusetts Department of Environmental Protection Washington, DC March 15, 2013 Climate Change: Massachusetts Impacts Source: UCS, 2007
Regional Greenhouse Gas Initiative (RGGI; Reggie ) Will Space Massachusetts Department of Environmental Protection Washington, DC March 15, 2013 Climate Change: Massachusetts Impacts Source: UCS, 2007
Joint Study Session on Carbon Reduction
 Joint Study Session on Carbon Reduction City of Tacoma Tacoma Power City Council Meeting/Committee Name September 18, 2018 ITEM # 1 Agenda 1. Legal Briefing on Voter Initiatives Bill Fosbre 2. Background
Preview of Analysis of an Emissions Containment Reserve (ECR)
") Preview of Analysis of an Emissions Containment Reserve (ECR) Dallas Burtraw, Karen Palmer, Anthony Paul Resources for the Future Bill Shobe, Charles Holt University of Virginia RGGI Experience with Allowance
Preview of Analysis of an Emissions Containment Reserve (ECR) Dallas Burtraw, Karen Palmer, Anthony Paul Resources for the Future Bill Shobe, Charles Holt University of Virginia RGGI Experience with Allowance
Statement of Stephen A. Smith, DVM Executive Director Southern Alliance for Clean Energy
 Statement of Stephen A. Smith, DVM Executive Director Southern Alliance for Clean Energy Submitted to the U.S. House of Representatives Committee on Ways and Means September 18, 2008 Mr. Chairman, Ranking
Connecting the Dots: Major New England Energy Initiatives
 SEPTEMBER 30, 2016 BOSTON, MASSACHUSETTS Connecting the Dots: Major New England Energy Initiatives Restructuring Roundtable Robert Ethier VICE PRESIDENT, MARKET OPERATIONS New England Has Two Overarching
Pacific Northwest Low Carbon Scenario Analysis
 Pacific Northwest Low Carbon Scenario Analysis Achieving Least-Cost Carbon Emissions Reductions in the Electricity Sector November 8, 2017 Arne Olson, Partner Nick Schlag, Sr. Managing Consultant Jasmine
The Regional Greenhouse Gas Initiative Experience
 The Regional Greenhouse Gas Initiative Experience May 13, 2013 19th Annual Energy and Climate Change Research Seminar David Littell Commissioner, Maine Public Utilities Commission Treasurer, RGGI, Inc.
Energy Efficiency. Energy Efficiency
 OCE 1 st Revised Staff Straw Proposal for the NJCEP 2009 through 2012 Funding Levels Comprehensive Energy Efficiency and Renewable Energy Resource Analysis March 20, 2008 On or about January 11, 2008,
Impacts of Announced Nuclear Retirements in Ohio and Pennsylvania
 Impacts of Announced Nuclear Retirements in Ohio and Pennsylvania Dean Murphy and Mark Berkman April 2018 The owners of four nuclear plants in Ohio and Pennsylvania have announced that these plants will
Energy Efficiency and Climate Change
 Energy Efficiency and Climate Change Why cap and trade design choices really matter 50 State Street, Suite 3 Montpelier, Vermont USA 05602 Tel: 802.223.8199 Fax: 802.223.8172 ACEEE October 2, 2007 Richard
Potential Electricity and Energy Price Outcomes under EPA s Federal Plan Alternatives for the Clean Power Plan
 Potential Electricity and Energy Price Outcomes under EPA s Federal Plan Alternatives for the Clean Power Plan The American Forestry and Paper Association American Wood Council American Chemistry Council
PROPOSAL OF INDEPENDENT POWER PRODUCERS OF NEW YORK, INC. FOR INTEGRATING CARBON PRICING INTO THE WHOLESALE ENERGY MARKET
 NEW YORK STATE PUBLIC SERVICE COMMISSION Matter 17-01821 In the Matter of Carbon Pricing in New York Wholesale Markets PROPOSAL OF INDEPENDENT POWER PRODUCERS OF NEW YORK, INC. FOR INTEGRATING CARBON PRICING
Keeping A Lid On It: Emissions and Price Interactions Between RGGI and the Clean Power Plan
 Keeping A Lid On It: Emissions and Price Interactions Between RGGI and the Clean Power Plan Dallas Burtraw Resources for the Future New York Workshop, July 12, 2016 Opportunities and Challenges of Trading
State of New Jersey Board of Public Utilities New Jersey Zero Emission Certificate Program for Eligible Nuclear Power Plants BPU Docket No.
 State of New Jersey Board of Public Utilities New Jersey Zero Emission Certificate Program for Eligible Nuclear Power Plants BPU Docket No. EO18080899 Testimony for the Record Nuclear Energy Institute
Exploring Natural Gas and Renewables in ERCOT, Part IV
 Exploring Natural Gas and Renewables in ERCOT, Part IV The Future of Clean Energy in ERCOT P R E P A R E D F O R The Texas Clean Energy Coalition P R E P A R E D B Y Ira Shavel Yingxia Yang Roger Lueken
New England States Committee on Electricity
 Renewable and Clean Mechanisms 2.0 Study Phase I: Scenario Analysis Winter 2017 New England States Committee on Electricity Overview Context Analytical Approach and Modeling Assumptions Scenario Analysis
Understanding the Massachusetts RPS. Eugenia Gibbons, Mass Energy Consumers Alliance & Joel Wool, Clean Water Action
 Understanding the Massachusetts RPS WEDNESDAY, JUNE 21, 2017 Eugenia Gibbons, Mass Energy Consumers Alliance & Joel Wool, Clean Water Action Agenda Introduction to Massachusetts current Renewable Portfolio
Evaluating Costs of Energy Efficiency Programs
 Evaluating Costs of Energy Efficiency Programs South-Central Partnership for Energy Efficiency as a Resource Phil Mihlmester, ICF International August 4, 2014 Outline Introduction to ICF Energy efficiency
EPA s Clean Power Plan
 EPA s Clean Power Plan Potential Implications of the Proposed CO 2 Emissions Standard under CAA Section 111(d) PRESENTED TO Harvard Electricity Policy Group October 3, 2014 PRESENTED BY Judy Chang Other
Discussion of Carbon Management
 March 22, 2018 Discussion of Carbon Management Vermont Law School Professor Scott s Air Pollution Class David Farnsworth Senior Associate The 50 State Street, Suite 3 Montpelier, Vermont United States
Impacts of a Modest Carbon Tax: A Review of the Success of the Regional Greenhouse Gas Initiative
 Impacts of a Modest Carbon Tax: A Review of the Success of the Regional Greenhouse Gas Initiative By David T. Stevenson June 8, 2017 CATO WORKING PAPER No. 45 1000 Massachusetts Avenue NW Washington DC
EPA should allow States to retain existing, market-based carbon-control programs and encourage States neighboring such programs to join them.
 EPA CO 2 RULE REGIONAL COMPLIANCE and RELIABILITY SAFETY VALVE PROPOSALS I. Introduction and Summary The New York Independent System Operator, Inc. ( NYISO ) appreciates the opportunity to provide EPA
Please see response to Question 9 for information related to final TVA resource estimates.
 SACE Questions 1. A document or documents showing TVA s assumed capital costs in the base case strategy for all storage, solar, and wind resource options for each year of the forecast (2019-2038). Although
ELECTRICITY TRADE AGREEMENT. An Assessment of the Ontario-Quebec Electricity Trade Agreement
 ELECTRICITY TRADE AGREEMENT An Assessment of the Ontario-Quebec Electricity Trade Agreement Spring 2018 About this Document Established by the Financial Accountability Officer Act, 2013, the Financial
REGIONAL GREENHOUSE GAS INITIATIVE (RGGI):
:") JAN / 2018 REGIONAL GREENHOUSE GAS INITIATIVE (RGGI): An Emissions Trading Case Study www.edf.org www.ieta.org The World s Carbon Markets Background The Regional Greenhouse Gas Initiative (RGGI) is a cooperative
JAN / 2018 REGIONAL GREENHOUSE GAS INITIATIVE (RGGI): An Emissions Trading Case Study www.edf.org www.ieta.org The World s Carbon Markets Background The Regional Greenhouse Gas Initiative (RGGI) is a cooperative
G MM3^^R6!N^ William F. Stephens Director. (804) FAX (804) '^m Si~^
 FAX (804) '^m Si~^") G MM3^^R6!N^ William F. Stephens Director. (804)371.9611 FAX (804) 371-9350 '^m Si~^ PO Box 1197 Richmond, Virginia 23218-1197 STATE CORPORATION COMMISSION PUBLIC UTILITY REGULATION February 25, 2019 Mr,
G MM3^^R6!N^ William F. Stephens Director. (804)371.9611 FAX (804) 371-9350 '^m Si~^ PO Box 1197 Richmond, Virginia 23218-1197 STATE CORPORATION COMMISSION PUBLIC UTILITY REGULATION February 25, 2019 Mr,
Atlantic Coast Pipeline: Economics and Manufacturing Jobs
 Atlantic Coast Pipeline: Economics and Manufacturing Jobs Prepared for the Natural Resources Defense Council Authors: Rachel Wilson Sagal Alisalad Emrat Nur Marzan Bryndis Woods December 5, 2017 Page 1
The Value of Markets. The History of Markets
 The Value of Markets Organized wholesale electricity markets were created to address ever-increasing electricity prices and to encourage innovation through free-enterprise competition. PJM Interconnection
Reducing Carbon Pollution in Maryland s Renewable Portfolio Standard Will Clean the Air without Impacting Ratepayers. Frequently Asked Questions
 Reducing Carbon Pollution in Maryland s Renewable Portfolio Standard Will Clean the Air without Impacting Ratepayers Summary: Frequently Asked Questions While fellow Mid-Atlantic States like Delaware and
Economic Analysis of US Decarbonization Pathways
 Economic Analysis of US Decarbonization Pathways Prepared for: NextGen Climate America, Inc. November 5, 2015 This study was prepared by ICF International, using data and inputs obtained from the Pathways
Building a Modern Grid. September 24, New Jersey Energy Master Plan Stakeholder Meetings. Summary Comments of the Enel Group Companies
 Building a Modern Grid September 24, 2018 New Jersey Energy Master Plan Stakeholder Meetings Summary Comments of the Enel Group Companies I. Introduction The Enel Group appreciates the opportunity to provide
FirstEnergy Solutions Energy Market Update AEE Meeting March 20, John Ogurchak PE/CEM Manager, Commercial/Industrial Energy Sales
 FirstEnergy Solutions Energy Market Update AEE Meeting John Ogurchak PE/CEM Manager, Commercial/Industrial Energy Sales FirstEnergy Solutions Corp. (FES) Retail subsidiary of FirstEnergy Corp. and headquartered
The Economic Impacts of the Regional Greenhouse Gas Initiative on Nine Northeast and Mid-Atlantic States
 FINAL COPY; EMBARGOED UNTIL JULY 13, 10:00 PM Eastern Time The Economic Impacts of the Regional Greenhouse Gas Initiative on Nine Northeast and Mid-Atlantic States Review of RGGI s Second Three-Year Compliance
The Future of Greenhouse Gas Emissions Trading in North America
 The Future of Greenhouse Gas Emissions Trading in North America 14 th IEA-IETA-EPRI Annual Workshop on Greenhouse Gas Emission Trading Thursday October 9, 2014 Agenda California s AB 32 and Cap-and-Trade
Cutting Electric Bills with the Clean Power Plan
 Cutting Electric Bills with the Clean Power Plan EPA s Greenhouse Gas Reduction Policy Lowers Household Bills: March 2016 Update March 17, 2016 AUTHORS Pat Knight Avi Allison Wendy Ong Nidhi R. Santen,
Is the "duck curve" eroding the value of energy efficiency?
 Is the "duck curve" eroding the value of energy efficiency? Edward Burgess, Strategen Consulting Jeff Schlegel, Schlegel & Associates/Southwest Energy Efficiency Project (SWEEP) Ellen Zuckerman, Schlegel
Impacts of High Variable Renewable Energy (VRE) Futures on Electric-Sector Decision Making
 Futures on Electric-Sector Decision Making") Impacts of High Variable Renewable Energy (VRE) Futures on Joachim Seel, Andrew Mills, Ryan Wiser Lawrence Berkeley National Laboratory Presentation at International Conference on Energy Systems Integration
Impacts of High Variable Renewable Energy (VRE) Futures on Joachim Seel, Andrew Mills, Ryan Wiser Lawrence Berkeley National Laboratory Presentation at International Conference on Energy Systems Integration
State CO2 Emission Rate Goals in EPA s Proposed Rule for Existing Power Plants
 State CO2 Emission Rate Goals in EPA s Proposed Rule for Existing Power Plants Jonathan L. Ramseur Specialist in Environmental Policy July 21, 2014 Congressional Research Service 7-5700 www.crs.gov R43652
Financial Issues and the Future of Coal
 Financial Issues and the Future of Coal David Schlissel January 10, 2012 45 Horace Road, Belmont MA 02478 david@schlissel-technical.com (office) 617-489-4840 (cell) 617-947-9507 Economic vs. Financial
The Regional Greenhouse Gas Initiative (RGGI) and the Clean Power Plan (CPP) Luke Wisniewski - MDE, Climate Change Division
 and the Clean Power Plan (CPP) Luke Wisniewski - MDE, Climate Change Division") The Regional Greenhouse Gas Initiative (RGGI) and the Clean Power Plan (CPP) Luke Wisniewski - MDE, Climate Change Division Mitigation Working Group Meeting - May 23, 2016 RGGI Overview Clean Power Plan
The Regional Greenhouse Gas Initiative (RGGI) and the Clean Power Plan (CPP) Luke Wisniewski - MDE, Climate Change Division Mitigation Working Group Meeting - May 23, 2016 RGGI Overview Clean Power Plan
The Clean Power Plan NJ Clean Air Council Meeting
 M.J. Bradley & Associates The Clean Power Plan NJ Clean Air Council Meeting D E C E M B E R 9, 2 0 1 5 DRAFT FOR DISCUSSION PURPOSES ONLY Chris Van Atten vanatten@mjbradley.com (978) 369 5533 / www.mjbradley.com
Potential Impacts of a Renewable and Energy Efficiency Portfolio Standard in Kentucky
 Potential Impacts of a Renewable and Energy Efficiency Portfolio Standard in Kentucky Prepared for the Mountain Association for Community Economic Development & the Kentucky Sustainable Energy Alliance
APPENDIX B: WHOLESALE AND RETAIL PRICE FORECAST
 APPENDIX B: WHOLESALE AND RETAIL PRICE FORECAST Contents Introduction... 3 Key Findings... 3 Background... 5 Methodology... 7 Inputs and Assumptions... 8 Load... 8 Fuel Prices... 9 Resources... 9 Pacific
EPA Analysis of the Waxman-Markey Discussion Draft: The American Clean Energy and Security Act of 2009 Executive Summary April 20, 2009
 Summary EPA Analysis of the Waxman-Markey Discussion Draft: The American Clean Energy and Security Act of 2009 Executive Summary April 20, 2009 At the request of House Energy and Commerce Committee Chairman
Cost-benefit Analysis of the New Jersey Clean Energy Program Energy Efficiency Programs
 Cost-benefit Analysis of the New Jersey Clean Energy Program Energy Efficiency Programs January 9, 2008 Table of Contents I. Summary...3 II. Methodology...4 III. Cost-Benefit Analysis Assumptions...6 IV.
SENATE, No STATE OF NEW JERSEY 218th LEGISLATURE
 LEGISLATIVE FISCAL ESTIMATE SENATE, No. 2314 STATE OF NEW JERSEY 218th LEGISLATURE DATED: APRIL 11, 2018 SUMMARY Synopsis: Types of Impact: Agencies Affected: Establishes and modifies clean energy and
Energy Efficiencies: How or Will Energy Efficiency Play in Compliance Markets
 Energy Efficiencies: How or Will Energy Efficiency Play in Compliance Markets 2010 Environmental Markets Association Conference Brian M. Jones Director 1 M.J. Bradley & Associates LLC M.J. Bradley & Associates
Entergy Arkansas, Inc Integrated Resource Plan. Follow-Up Materials June 18, 2018 entergy-arkansas.com/irp
 Entergy Arkansas, Inc. 2018 Integrated Resource Plan Follow-Up Materials June 18, 2018 entergy-arkansas.com/irp Follow-up Materials to the 2018 IRP Stakeholder Meeting The following information is provided
Economic and Energy Market Implications of the Clean Power Plan
 Economic and Energy Market Implications of the Clean Power Plan Anne E. Smith, Senior Vice President 118 th National Western Mining Conference & Exhibition Denver, CO March 22, 2016 Overview of Clean Power
7 Jul 2015 NECG Commentary #10 U.S. government role in merchant nuclear?
 7 Jul 2015 NECG Commentary #10 U.S. government role in merchant nuclear? Merchant nuclear projects, created by U.S. electricity industry reform, sell power into electricity markets. Two merchant nuclear
Preliminary Modeling of the Final Clean Power Plan
 Preliminary Modeling of the Final Clean Power Plan MSEER MEETING LITTLE ROCK, ARKANSAS OCTOBER 2, 215 TABLE OF CONTENTS Phase I Modeling Effort High-Level Insights Preliminary Modeling Results Appendix
Collaborative EPRI Analysis of CO 2 Price Impacts on Western Power Markets:
 Collaborative EPRI Analysis of CO 2 Price Impacts on Western Power Markets: Preliminary Results for Discussion Vic Niemeyer, EPRI Lew Rubin, Portal Solutions Webcast Background Been working with 9 utilities
Combined Heat and Power: Markets and Challenges
 Combined Heat and Power: Markets and Challenges Bruce A. Hedman ICF International Roundtable on Industrial Energy Efficiency and CHP June 28, 2012 Acknowledgements Based on work supported by: DOE s Advanced
THE ECONOMIC IMPACTS OF THE REGIONAL GREENHOUSE GAS INITIATIVE ON NINE NORTHEAST AND MID-ATLANTIC STATES
 THE ECONOMIC IMPACTS OF THE REGIONAL GREENHOUSE GAS INITIATIVE ON NINE NORTHEAST AND MID-ATLANTIC STATES Review of RGGI s Third Three-Year Compliance Period (2015-2017) Paul J. Hibbard Susan F. Tierney
MEETING NOTES I/M/O A GREENHOUSE GAS EMISSIONS PORTFOLIO STANDARD AND OTHER REGULATORY MECHANISMS TO MITIGATE LEAKAGE DOCKET NO.
 MEETING NOTES I/M/O A GREENHOUSE GAS EMISSIONS PORTFOLIO STANDARD AND OTHER REGULATORY MECHANISMS TO MITIGATE LEAKAGE DOCKET NO. EO08030150 THE NEW JERSEY BOARD OF PUBLIC UTILITIES 2 GATEWAY CENTER, 8TH
State-Level Modeling of. Clean Power Plan. Compliance Pathways with EPRI s US-REGEN Model
 State-Level Modeling of Clean Power Plan Compliance Pathways with EPRI s US-REGEN Model Vic Niemeyer Senior Technical Executive Electric Power Research Institute RFF-EPRI Seminar on Modeling the Clean
Delivering Energy Efficiency on a Large Scale: Challenges and Lessons Learned
 Delivering Energy Efficiency on a Large Scale: Challenges and Lessons Learned Richard Cowart & Blair Hamilton Managing Energy Demand November 4, 2009 The Regulatory Assistance Project China India European
Selected Findings from Scenario and Sensitivity Analysis Conducted To Date. August 6, 2015
 Selected Findings from Scenario and Sensitivity Analysis Conducted To Date August 6, 2015 Progress Since The July Council Meeting: All Planned Scenario Analysis Completed! RPM Systems 2 Progress Since