2017 annual results. 07 March 2018
|
|
|
- Griffin Ramsey
- 6 years ago
- Views:
Transcription


1 2017 annual results 07 March 2018
2 2 Contents Highlights Strategic positioning Operational performance Financial results 2017 Outlook Appendix
3 3 1 Highlights 3
4 Highlights in 2017 Performance Excellent operating performance from thermal power plants in France and Mauritius: 89.6% and 93.8% availability rates respectively, ensuring security and stability in these noninterconnected networks Development Two biomass plants: Galion 2 (Martinique) and combustion turbine at Saint-Pierre (Reunion Island) underlining Albioma's commitment to the energy transition. Very good performance of Brazilian power plants New project signed in Brazil as part of a second partnership with the Jalles Machado group IED: successful planned shutdowns for both power plants on Reunion Island Continued growth in the photovoltaic projects portfolio Results beyond objectives 1. Highlights 4
5 5 2 Strategic positioning 5

6 Albioma Independent producer of renewable energy Key figures for 2017 Committed to the energy transition through biomass and photovoltaic MW In French overseas territories, Mauritius and Brazil thermal power stations experts installed Unique partnership for 20 years with the sugar industry to produce renewable energy from bagasse, the fibrous residue from sugar cane The leading producer of photovoltaic energy in the French overseas territories 2.5 M people supplied with electricity 2.3 Mt of recovered bagasse 403 m of revenue 138 m of EBITDA 3.6 TWh of electricity produced 120 kwh/tc exported the grid in the overseas territories 2. Strategic positioning 6
7 Diversified geographical footprint Total installed capacity 752 MW West Indies and French Guyana MW Guadeloupe, Martinique, French Guyana Metropolitan France 16 MW and the rest of Europe 3 MW 13 MW Strong market shares (2016) 48% of power generated on Reunion Island 43% in Mauritius 31% in Guadeloupe 142 MW 31 MW Indian Ocean MW Reunion Island, Mauritius, Mayotte Brazil MW 108 MW 425 MW 30 MW 2. Strategic positioning 7


8 Our historical model Industry reference for the energy efficient recovery of bagasse Sugar cane 1 tonne Highly energy-efficient cogeneration operator supplying steam to the sugar refinery and electricity to the grid Additional fuel used outside of the sugar harvest: Historic alternative: coal Gradually being replaced by biomass Customer/partner Steam 450 kg Customer Sugar refinery Electricity 30 kwh Cogeneration plant Electricity 120 kwh Electricity grid Sugar or bio-ethanol 115 kg Bagasse 300 kg 2. Strategic positioning 8


9 Three-pronged strategy 1 Working on the energy transition in French overseas territories 2 Global roll-out of the "bagasse" model 3 Development of innovative solar projects with storage 2. Strategic positioning 9
10 Work towards energy transition Albioma's action is part of the French governmental Climate plan Substituting biomass for coal in plants which currently recover bagasse Give priority to local biomass, while avoiding conflicting uses (cane straw, forest residues, etc.) and contribute to a circular economy (green waste, etc.) Use imported biomass as a complement Providing traceability and durability through certification systems and inspections by third-party organisations Conversion of our power plants to biomass already written into the decrees relating to Multi-Year Energy Plans on Reunion Island and in Guadeloupe Supporting the rise of renewable energy production Production of reliable energy, guaranteeing security and stability of the grid through renewable resources Solar projects with energy storage to counter the intermittent nature of production Going further (with studies) Make use of solid recovered fuel (SRF) to optimise the share of local renewable fuels 2. Strategic positioning 10
11 Global roll-out of the biomass model Exporting the partnership model with agro-industry players From 2000 up until today Mauritius 45% of the electricity produced on the island today 3 plants currently in operation 1 project under development Brazil, international priority since 2013 The world's leading sugar cane producer (700 Mtp) In the medium term Brazil, reaching critical size 40% of Group investments over 10 years ( ) with one project every 12 to 18 months 2 projects currently under construction: Jalles Machado and Vale do Paraná Continued expansion Geographical approach: Latin America, Asia Bagasse recovery: Sector average yield of kwh/tc (compared with 120 kwh/tc at Albioma plants) Project approach: supporting existing sugar-refining partners or exploiting other sources of biomass 2 plants currently in operation 2. Strategic positioning 11
 Niche")

12 Development of high value-added solar projects Leader in the photovoltaic power market in the French overseas territories Pioneer since % market share (2016) Niche positioning focused on innovative high-tech projects 10 MWp won via tender calls in 2016 and 2017 Solar projects with integrated storage Triple QSE certification 2. Strategic positioning 12
13 80% renewable energy by % 80% 53% 36% 64% 50% 47% 2023 target Renewable Fossil Rapid change in the energy mix thanks to: Conversion of the existing bagasse-coal power plants to biomass Construction of all-biomass plants in the French overseas territories and of photovoltaic plants Acquisition and development of all-bagasse plants in Brazil Notes: Aggregate of fully consolidated companies 2. Strategic positioning 13
14 1 4 3 Operational performance 14

15 France
16 France Thermal Biomass Plant availability Power generation (GWh) 2,053 2, % 89.6% High availability rate of plants, up in comparison to 2016: Performance levels in line with objectives Well run maintenance shutdowns and IED shutdowns Production slightly down v due to a reduction in the call rate (West Indies) Tense social context (strike notice in November 2017) Signing of new riders to electricity sale agreements for West Indies power plants (compensation for combustion by-products management costs and for investments towards compliance with IED requirements) 3. Operational performance 16
17 France - Solar Power Number of equivalent full power hours 1,307 1,274 Power generation (GWh) Fewer hours of sunlight, particularly in French Guyana, the West Indies and Reunion Island Disposal of 1 MWp in February 2017 For a constant scope, production stable (-1%) compared to 2016 and still high 3. Operational performance 17

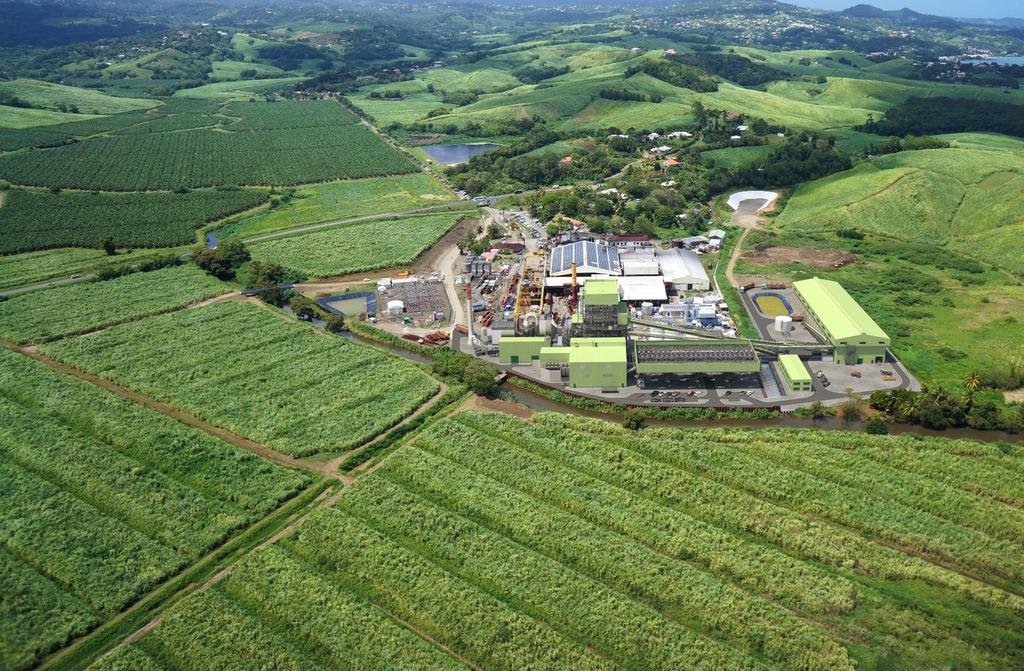
18 Two plants constructed in France in 2017 The Galion 2 plant in Martinique, the first 100% bagasse/biomass plant in French overseas terrotories The combustion turbine in Saint-Pierre on Reunion Island, the first bio-ethanol plant in the world 3. Operational performance 18
 certification system 30-year contract 205 million investment Project debt 120 million over 20 years First coupling to the grid")
19 Galion 2 Martinique (1/2) The first 100% bagasse/biomass power plant in the French overseas territories 80% of capital held by Albioma 40 MW installed Fuel: bagasse, local and imported biomass in the form of pellets, compliant with the Sustainable Biomass Program (SBP) certification system 30-year contract 205 million investment Project debt 120 million over 20 years First coupling to the grid planned for March 2018 with commissioning in Q2 of Operational performance 19
 The first 100%")


20 Galion 2 Martinique (2/2) The first 100% bagasse/biomass power plant in the French overseas territories Fume treatment system Boiler and stack Boiler and biomass conveyor Biomass storage shed Pellet storage dome in the port at Fort-de- Machine room France 3. Operational performance 20

21 Combustion turbine at Saint-Pierre Reunion Island (1/2) 51% of capital held by Albioma 41 MW installed Fuel: mainly bio-ethanol 25-year contract 60 million investment Project debt 45 million over 24 years Commissioning scheduled for Q Operational performance 21


22 Combustion turbine at Saint-Pierre Reunion Island (2/2) View from the turbine building Connection - Sub-station Combustion turbine Electrical panel Turbine building and air extraction system - Stack Electrical room 3. Operational performance 22
 10 MWp of photovoltaic plants with energy storage 3.")
23 Other projects in progress in France Modernisation investments in existing installations (fume treatment) 10 MWp of photovoltaic plants with energy storage 3. Operational performance 23

24 Modernisation work at existing thermal plants Installation of denitrification catalysers and flue gas desulphurisation reactors for commissioning by the end of 2019 Riders now signed for all power plants: investment of 295 million On Reunion Island, successful plant shutdown in Gol in June and Bois-Rouge in November Operational performance 24
 Project work started at Sainte-Rose in Guadeloupe (3.")
25 Construction of solar power plants with energy storage 10 MWp awarded to Albioma in 2016 and 2017 following tender calls Projects with energy storage 22 million investment Commissioning: A few examples Construction of a 1.4 MWp power plant at Reunion Island main port (Grand Port Maritime de La Réunion) Project work started at Sainte-Rose in Guadeloupe (3.3 MWp on a waste storage centre) 3. Operational performance 25

26 Mauritius
27 Mauritius: excellent performance of the installations Plant availability 93.4% 93.8% Power generation (GWh) 1,151 1, Excellent availability of power plants operated by Albioma Increased call rate The share of net income from these consolidated entities has been integrated using the equity method since 2014 in the Group's operating income (EBITDA and EBIT) 3. Operational performance 27

28 Brazil 2017 JALLES MACHADO GO 2015 CODORA 2016 VALE DO PARANA SP 2014 RIO PARDO
29 Growth of Albioma in Brazil Brazil, the international priority for Albioma Acquisition of Rio Pardo Termoelétrica Acquisition of Codora Energia Vale do Paraná project agreement Jalles Machado project agreement 3. Operational performance 29

30 Favourable change in macroeconomic indicators Decrease in Brazilian inflation rate: Interest rate of 6.9% at the end of 2017 v. 13.6% at the end of 2016 Decrease in Brazilian inflation rate: 2.9% at the end of 2017 v. 6.3% at the end of 2016 Increase in average electricity price on the spot market: Average of R$323 in 2017 v. R$94 in In spite of the decline in the real R$3.97/ at the end of 2017 v. R$3.43/ at the end of Operational performance 30
31 Brazil Power generation (GWh) Energy efficiency (kwh/tp) Generation up over 2016, despite despite the late start of the sugar harvest High efficiency level, in line with target objectives at the time of the acquisition Selling price excluding long-term contracts very favourable in Operational performance 31
32 Cogeneration plant currently being acquired in Brazil Jalles Machado 18 December 2017: agreement signed for the acquisition by Albioma of 60% of the bagasse cogeneration plant adjacent to the Jalles Machado sugar refinery (annual milling capacity of 2.8 M tonnes of cane) Renovation of existing boilers and installation of a new 25 MW turbine to bring the total capacity up to 65 MW Second partnership with the Jalles Machado group 20-year contract 80% of sales secured, of which 75 GWh at R$258/MWh (base 2018) as from 2021 Anticipated generation 145 GWh starting from the 2019 sugar harvest 3. Operational performance 32
 as from 1 January 2021 (i.e. 120 GWh) over 20 years 3.")
33 Project under construction in Brazil Vale Do Paraná 40% of capital held by Albioma Equivalent results 48 MW installed eventually 25-year contract R$100m of investment Permit granted for connection to the grid in 2017 according to the road map Commissioning: 2021 Secured electricity sales at a price of R$243 per MWh (base 2016) as from 1 January 2021 (i.e. 120 GWh) over 20 years 3. Operational performance 33
34 4 Financial results
35 Income statement by region/business (In millions) Change 17/16 France - Thermal Biomass % France - Solar Power (1) % Brazil % Holding and others % Revenue % France - Thermal Biomass % France - Solar Power (1) % Mauritius (MEE) % Brazil % Holding and others (6.9) (6.3) -9% EBITDA % Excellent availability of thermal installations and well run technical shutdowns New riders signed for the thermal plants in Guadeloupe Good operational performance in Brazil Net income (Group share) % (1) Including Spain and Italy. 4. Financial results
36 Sales up to 403 million In millions Q Materials price effect raw Set premiums Bonus/Malus/Penalties Fuel price effect Rise in fixed capacity payments 10.2 Bonus/Malus Volume TH volume effect Thermal France Biomass France Other effects Others Thermal France Thermal Biomass France 2.2 (3.8) 3.0 Exchange effect Real v. Brazil Euro Volume effect Price effect and others Others W Price effect FX change Brazil And others Others real v. euro Volume effect (0.4) Thermal Biomass France m Brazil m Other - 0.4m Cumulative excluding fuel price effect Excluding fuel price effect, sales are up by 4% over 2016 thanks to (i) the increase in fixed capacity payments linked to contractual indexing and recent riders to contracts signed with EDF and (ii) to the good operational performance of thermal biomass facilities in France and Brazil 4. Financial results
37 Ebitda million up 5% over 2016 In millions Retroactivity and other exceptionals Rise in fixed capacity payments 10.2 Bonus/Malus 2.2 Stock impact (4.6) Others Thermal France FX change real v. euro Volume effect Brazil (1.8) Price effect Brazil Others Brazil Others 1.0 (1.8) Thermal Biomass France m Brazil m Other m EBITDA up compared to 2016 with, in particular, (i) the increase in sales, (ii) the retroactive application of the latest riders signed with EDF and (iii) despite a negative change in the stock effect 4. Financial results
38 Net result, Group share of 37,4 m up 13% over 2016 In millions 33.0 Retroactivity and other exceptionals Rise in fixed capacity payments 4.9 Bonus/Malus 1.4 Stock impact (2.5) Other Thermal Biomass France (2.6) FX change real v. euro Volume effect Brazil (0.1) 0.6 Other Other Brazil 0.8 (1.4) 2.3 Price effect Brazil Thermal Biomass France m Brazil - Other m Compared to 2016, the net result, Group share includes (i) the effects linked to the change in deferred taxes (Finance Act 2018), (ii) the effects associated with the repayment of the additional dividend contribution and (iii) depreciation and financial charges associated with new installations 4. Financial results
39 92 million in cash at 31 December 2017 Almost 147 million of development CAPEX in Cash-flow cash 2017 flow Group cash flow position Debt service 66 Capital repayment 41 Operational Cash flow 121 Interest costs 24 Albioma SA dividends 11 Investments 157 New debts 106 Operations 12 Development 147 Disposals/Others (2) Others 3 Sources Uses 01-Jan /12/ Jan /12/ Financial results
40 A strong balance sheet to finance growth Gross debt increased following debt raisings to finance projects currently under construction (Galion 2, TAC Saint-Pierre, IED) Residual life of 11 years Group average interest rate of 4.0% (of which France 3.8% and Brazil 11.9%) 91% of debt covered or at fixed rates Non-recourse project debts other than Brazil debt ( 25 m) and projects under construction (In millions) 31-Dec Dec-16 Change Project debt % Corporate debt % Total gross debt % Cash (92) (96) -5% Guarantee deposits and equivalents (3) (3) -5% Total net debt % Notes 1. Net debt/equity Net debt / EBITDA 12 moving months 4.4x 4.2x Net debt excluding construction projects / EBITDA 12 moving months 3.4x 3.6x Gearing 1 131% 125% 4. Financial results
41 2018 targets millions Reported Recurrent EBITDA Net income (Group share) Financial results
42 5 Outlook 42 42
43 75% of the investment programme already committed Progress of the bn investment programme In millions Brazil IED Solar Power 39 Other Beyond 2017, the target is to secure c. 100 m new investments per year Galion 2 Martinique Combustion turbine Reunion Island > Completed, under construction or signed investments 5. Outlook 43
 Confirmation of the policy to distribute 50% of the net result, Group share, excluding exceptional items Proposal to distribute a dividend for the 2017 financial year: 0.")
44 Albioma: growth and efficiency value More than 75% of the investment plan already secured which should translate into significant growth in 2018 Objective to double net income (Group share) in 10 years (baseline 2013) Confirmation of the policy to distribute 50% of the net result, Group share, excluding exceptional items Proposal to distribute a dividend for the 2017 financial year: 0.60 per share, up by 5% Payable 100% in cash or 50% in cash and 50% in Albioma shares 5. Outlook 44

45 6 Appendix 45 45
46 Income statement for the year ended 31 December 2017 (In millions) Var 17/16 Sales % EBITDA % Depreciation, amortisation, provisions & other (58.4) (53.6) -9% Operating income % Net financial income (23.7) (26.8) +11% Tax (11.9) (8.9) -34% Effective tax rate % 18.6% Consolidated net income % Net income (Group share) % Weighted average number of shares 30,250,507 29,902,275 Net income per share (consolidation scope) % 1 The normative tax rate is 34.4% (effective tax rate less the effects of non-deductible depreciation, excluding Brazil and the effect of the change in the tax rate from 2019). For the year ended 31 December 2017, the noramtive tax rate does not include the cancellation of the 3% tax on distributed dividends. At 31 December 2016 the rate was 38.3%. 6. Appendix 46
47 Cash flow statement for the year ended 31 December 2017 (In millions) Cash flow from operations Change in working capital requirements (1.9) 8.1 Tax paid (17.0) (19.2) Net cash flow from operating activities Operating capex (12.4) (17.3) Free cash flow from operations Development capex (146.9) (117.5) Other/Acquisitions/Disposals Cash flow from investing activities (144.4) (113.5) Dividends paid to Albioma SA shareholders (10.6) (11.6) Borrowings (increases) Borrowings (repayments) (41.4) (74.4) Cost of financial debt (24.3) (27.1) Other 4.0 (0.8) Net cash flow from financing activities Currency effect on cash (0.9) 1.4 Net change in cash and cash equivalents (3.9) 47.8 Opening cash and cash equivalents Closing cash and cash equivalents Appendix 47
48 Balance sheet at 31 December 2017 ASSETS (In millions) 31-Dec Dec-16 Goodwill Intangible assets & Property, plant and equipment 1,141 1,048 Other non-current assets Total non-current assets 1,186 1,096 Current assets Cash and cash equivalents Total ASSETS 1,419 1,329 EQUITY & LIABILITIES (In millions) 31-Dec Dec-16 Shareholders' equity, Group share Non-controlling interests Total equity Current and non-current financial liabilities Other non-current liabilities Current liabilities Total LIABILITIES 1,419 1, Appendix 48
49 Long-term debt matched to business profile Existing debt repayment profile Residual life of 11 years Project debt Corporate debt Notes 1. Financial liabilities, excluding bank overdrafts, accrued interest and borrowing costs and excluding new projects 6. Appendix 49
50 Shareholder structure at 4 February 2018 Free float 65,0% 0,3% 1,4% Directors (other than Altamir and BPI) Employees 1,2% Treasury shares 13,5% Altamir and affiliates Financière de l Échiquier 3,5% 4,0% CDC 5,1% 6,0% BPI France COFEPP 6. Appendix 50


51 6. Appendix 51


52 Thank you for your attention Follow us on and on Appendix 52
FIRST-HALF 2016 RESULTS. 26 July 2016 Paris
 26 July 2016 Paris SOMMAIRE 1. 2. 3. 4. 5. 6. INTRODUCTION STRATEGIC POSITIONING - REMINDER OPERATIONAL PERFORMANCE: FIRST-HALF 2016 ASSESSMENT AND OUTLOOK 3.1 FRANCE 3.2 BRAZIL 3.3 MAURITIUS FIRST-HALF
Albioma AT A G L A N C E. Energy: it s time to switch!
 Albioma AT A G L A N C E Energy: it s time to switch! 201 8 2 Albioma Albioma, an independent producer of renewable energy 2017 key figures 480 employees 403m in revenue 2.5m people supplied with electricity
2015 ANNUAL RESULTS. 2 March Paris
 2 March 2016 - Paris SOMMAIRE 1. 2. 3. 4. 5. 6. INTRODUCTION STRATEGIC POSITIONING - REMINDER OPERATIONAL PERFORMANCE: 2015 RESULTS AND OUTLOOK 3.1 FRANCE 3.2 MAURITIUS 3.3 BRAZIL FINANCIAL RESULTS 2015
FIRST-HALF 2014 RESULTS
 PRESS RELEASE PARIS LA DÉFENSE, JULY 22, 2014 FIRST-HALF 2014 RESULTS Excellent start to operations at the Thermal Biomass plant in Brazil Albioma wins a contract for a 40 MW peak-power plant project on
SECOND INVESTMENT IN BRAZIL. April , Paris
 April 16 2015, Paris 1. ALBIOMA IN BRAZIL 2 2 ALBIOMA ANNOUNCES ITS SECOND ACQUISITION IN BRAZIL Signing of Codora Energia March 2014 April 2015 July 2013 Acquisition of Rio Pardo Termoelétrica March 2013
FIRST INVESTMENT IN BRAZIL 2013 ANNUAL RESULTS. March 5, 2014 Paris
 FIRST INVESTMENT IN BRAZIL 2013 ANNUAL RESULTS March 5, 2014 Paris DISCLAIMER The present document contains projections and descriptions of Albioma s future strategy, objectives and prospects. Declarations
First-half 2017 results
 F i r t - h a l f 2 0 1 7 r e u l t 1 26 July 2017 F i r t - h a l f 2 0 1 7 r e u l t 2 Content 1 2 3 4 5 Highlight Strategic poitioning Operational performance Financial reult Outlook 3 5 13 31 39 Appendice
OUR NATURE IS FULL OF ENERGY
 OUR NATURE IS FULL OF ENERGY june 2013 a new identity to mark a new stage in our history For more than 20 years, our Group has established itself as a unique force in energy generation. With a tradition
The present document was prepared by Séchilienne-Sidecfor the purposes of a presentation on 16 March 2010.
 Disclaimer The present document was prepared by Séchilienne-Sidecfor the purposes of a presentation on 16 March 2010. The information contained in the present document has not been checked independently.
YTL POWER INTERNATIONAL BERHAD (Company No H) (Incorporated in Malaysia)
 (Incorporated in Malaysia)") Interim financial report on consolidated results for the quarter ended 30 June 2007. The figures have not been audited. CONDENSED CONSOLIDATED INCOME STATEMENTS INDIVIDUAL QUARTER CUMULATIVE PERIOD PRECEDING
Interim financial report on consolidated results for the quarter ended 30 June 2007. The figures have not been audited. CONDENSED CONSOLIDATED INCOME STATEMENTS INDIVIDUAL QUARTER CUMULATIVE PERIOD PRECEDING
YTL POWER INTERNATIONAL BERHAD (Company No H) (Incorporated in Malaysia)
 (Incorporated in Malaysia)") Interim financial report on consolidated results for the quarter ended 31 March 2007. The figures have not been audited. CONDENSED CONSOLIDATED INCOME STATEMENTS INDIVIDUAL QUARTER CUMULATIVE PERIOD PRECEDING
Interim financial report on consolidated results for the quarter ended 31 March 2007. The figures have not been audited. CONDENSED CONSOLIDATED INCOME STATEMENTS INDIVIDUAL QUARTER CUMULATIVE PERIOD PRECEDING
The present document contains projections and descriptions of Séchilienne-Sidec s future strategy. objectives and prospects.
 1 DISCLAIMER The present document contains projections and descriptions of Séchilienne-Sidec s future strategy. objectives and prospects. These projections and descriptions may be affected by known or
FIRST HALF REPORT 2009
 200 NET PROFIT ROSE 31.4% FROM 1H08 TO 81.7 MM EUROS EBITDA WAS 1.2% HIGHER AT 140.8 MM EUROS FIRST HALF RESULTS 200 REVENUE ADVANCED 15.6% TO OVER 470 MM EUROS THE EBITDA MARGIN WAS 2.%, COMPARED TO 2.0%
MEDSERV PLC Interim Report CONDENSED CONSOLIDATED INTERIM FINANCIAL STATEMENTS AND DIRECTORS REPORT
 MEDSERV PLC Interim Report CONDENSED CONSOLIDATED INTERIM FINANCIAL STATEMENTS AND DIRECTORS REPORT For the Period 1 January 2018 to 30 June 2018 This report is published in terms of Chapter 5 of the Listing
COMPANY ANNOUNCEMENT MEDSERV P.L.C. (THE COMPANY ) Half Yearly Report. Date of Announcement 27 August 2018 Reference 177/2018
 Half Yearly Report. Date of Announcement 27 August 2018 Reference 177/2018") COMPANY ANNOUNCEMENT MEDSERV P.L.C. (THE COMPANY ) Half Yearly Report Date of Announcement 27 August 2018 Reference 177/2018 Listing Rule LR5.16.20 Quote The Board of Directors has today approved the half
COMPANY ANNOUNCEMENT MEDSERV P.L.C. (THE COMPANY ) Half Yearly Report Date of Announcement 27 August 2018 Reference 177/2018 Listing Rule LR5.16.20 Quote The Board of Directors has today approved the half
Export & import possibilities and fuel prices
 AFB-net V Targeted actions in bioenergy network Export & import possibilities and fuel prices Task 2 Country report of FRANCE CONTENTS 1 INTRODUCTION...3 2 BIOMASS RESOURCES...3 3 CURRENT ENERGY USE OF
YTL POWER INTERNATIONAL BERHAD (Company No H) (Incorporated in Malaysia)
 (Incorporated in Malaysia)") Interim financial report on consolidated results for the quarter ended 31 December 2006. The figures have not been audited. CONDENSED CONSOLIDATED INCOME STATEMENTS INDIVIDUAL QUARTER CUMULATIVE PERIOD
Interim financial report on consolidated results for the quarter ended 31 December 2006. The figures have not been audited. CONDENSED CONSOLIDATED INCOME STATEMENTS INDIVIDUAL QUARTER CUMULATIVE PERIOD
Next Up forum. May 15, 2018
 Next Up forum May 15, 2018 Voltalia, an integrated renewable player 508 MW Own installed capacity 4 Renewable energy sources 180 EURm FY 2017 revenues 464 76% 40% Revenues CAGR since FY 2013 EBITDA margin
Lessons learnt from AFD bioelectricity portfolio Expert workshop on wood energy
 Lessons learnt from AFD bioelectricity portfolio Expert workshop on wood energy Frankfurt March 1-2, 2016 Lise BREUIL & Guillaume MEYSSONNIER Sustainable Transport and Energy Division Outline 1. AFD at
Third quarter and first nine months 2017 Results Release. October 19 th, 2017
 Third quarter and first nine months 2017 Results Release October 19 th, 2017 Safe harbor statement Any statements contained in this document that are not historical facts are forward-looking statements
Second Quarter and Half Year 2016 Results. Wednesday, July 20, 2016
 Second Quarter and Half Year 2016 Results Wednesday, July 20, 2016 Safe Harbor Statement Any statements contained in this document that are not historical facts are forward-looking statements as defined
- A 300 million investment to acquire Befesa through a take-over bid.
 Main strategic actions taken in recent years In recent years, Abengoa has performed strategic actions to build upon the strategic plan set out in 1996, when the company was first listed on the stock exchange.
Introduction. Review of Performance
 Introduction This report is published in terms of section 6.05.06 (I) of the Malta Stock Exchange Bye-Laws. Figures in the report have been prepared in accordance with the requirements of International
power ethanol Sugar Shree Renuka Sugars Ltd Audited Results for Quarter ended 30 th Jun 2014 Earnings Presentation
 Sugar ethanol power Shree Renuka Sugars Ltd Audited Results for Quarter ended 30 th Jun 2014 Earnings Presentation 18 th Aug 2014 1 Important Notice Forward Looking Statements This presentation contains
DP World Limited and its subsidiaries
 Condensed consolidated income statement For the six months ended 30 June 2013 Period ended 30 June 2013 Period ended 30 June 2012 (Restated *) Before separately disclosed items Separately disclosed items
Axway H Results. Christophe Fabre, Chief Executive Officer 02 August 2012
 Axway H1 2012 Results Christophe Fabre, Chief Executive Officer 02 August 2012 Forward looking statements This document contains forecasts in respect of which there are risks and uncertainties concerning
RenovAr PROJECT ON ARGENTINA Ministry of Energy and Mining Argentina Republic
 RenovAr PROJECT ON RENEWABLE ENERGIES ARGENTINA 2016-2025 Ministry of Energy and Mining Argentina Republic THE ACT ON RENEWABLE ENERGIES SETS A NEW STAGE IN THE ARGENTINE REPUBLIC It is a historic event
Summary 2003 Summary 2003 ABENGOA 9 Annual Report 2003
 9 Over the last decade, we have increased our results at a rate of 20% a year as a consequence of the new activities related to Bioenergy, and Information Technologies, as well as through the internationalization
Company Presentation 2Q and 1H 2013 Results 14 Aug Company Presentation 4Q and FY 2012 Results. 27 Feb 2013
 Company Presentation 2Q and 1H 2013 Results 14 Aug 2013 Company Presentation 4Q and FY 2012 Results 27 Feb 2013 Presentation Outline 1 Plantation Highlights 2 Financial Highlights Click to edit Master
Contact: Ken Bond Deborah Hellinger Oracle Investor Relations Oracle Corporate Communications
 For Immediate Release Contact: Ken Bond Deborah Hellinger Oracle Investor Relations Oracle Corporate Communications 1.650.607.0349 1.212.508.7935 ken.bond@oracle.com deborah.hellinger@oracle.com Q1 FY18
Fiscal Year 2014 & Outlook 2015
 Fiscal Year 2014 & Outlook 2015 Agenda Ralph Dommermuth Company development 2014 Outlook 2015 Norbert Lang Results 2014 2 Fiscal Year 2014 & Outlook 2015 Frankfurt/Main, 26 March 2015 2009 Company development
(Loss) earnings from operations (432) 480 (190%) Other income (expense), net 3 9 (67%) (Benefit) provision for taxes (154) 161 (195%)
 earnings from operations (432) 480 (190%) Other income (expense), net 3 9 (67%) (Benefit) provision for taxes (154) 161 (195%)") PRO FORMA CONDENSED CONSOLIDATED STATEMENT OF EARNINGS Excluding Amortization of Goodwill and Other Intangibles, Acquisition and Divestiture Related Items and Other One-Time and Non-Operational Items (In
PRO FORMA CONDENSED CONSOLIDATED STATEMENT OF EARNINGS Excluding Amortization of Goodwill and Other Intangibles, Acquisition and Divestiture Related Items and Other One-Time and Non-Operational Items (In
India: Perspectives on the Draft National Wind-Solar Hybrid Policy
 India: Perspectives on the Draft National Wind-Solar Hybrid Policy June 8, 2018 Asia Clean Energy Forum Panel on Renewable Energy Auctions Gu-Yoon Chung Head of Business Development Asia Pacific Enel Green
Sale of Vattenfall Heat Poland s assets. revenue sources. Strategy Department
 Sale of Vattenfall Heat Poland s assets in the context t of PGNiG SA s strategy t to diversify if revenue sources Strategy Department Contents t 1. Strategic context of the transaction 2. Domestic gas
CLINICAL COMPUTING PLC HALF YEAR RESULTS FOR THE SIX MONTHS TO 30 JUNE 2010
 CLINICAL COMPUTING PLC HALF YEAR RESULTS FOR THE SIX MONTHS TO 30 JUNE 2010 Clinical Computing Plc ( the Group ), the international developer of clinical information systems for the healthcare market and
Servelec FY 2015 results
 Servelec FY 2015 results Alan Stubbs, Chief Executive Officer Mike Cane, Chief Financial Officer 1 Servelec Group Overview Central services 41 employees HQ: Sheffield Health & Social Care 255 employees
Star St ar Conf Con er f ence, London
 Star Conference, 2011 London October, 4 th 2011 Falck Group & Falck Renewables Group Overview Financials Strategy and Business Plan Conclusions 2 F G FALCK GROUP HISTORY 1833 Falckbegan its first activities
WINDSTREAM CORPORATION UNAUDITED CONSOLIDATED STATEMENTS OF INCOME (In millions, except per share amounts)
") (A) (B) (C) (D) WINDSTREAM CORPORATION UNAUDITED CONSOLIDATED STATEMENTS OF INCOME (In millions, except per share amounts) THREE MONTHS ENDED SIX MONTHS ENDED Increase Increase June 30, June 30, (Decrease)
(A) (B) (C) (D) WINDSTREAM CORPORATION UNAUDITED CONSOLIDATED STATEMENTS OF INCOME (In millions, except per share amounts) THREE MONTHS ENDED SIX MONTHS ENDED Increase Increase June 30, June 30, (Decrease)
FIRST QUARTER RESULTS 2016 INVESTOR PRESENTATION
 FIRST QUARTER RESULTS 2016 INVESTOR PRESENTATION THREE MONTH RESULTS 21 APRIL 2016 Highlights and key figures Operating and financial review Outlook and priorities Appendix FIRST QUARTER RESULTS 21 APRIL
Financial results 2014 Press conference. Amsterdam, 20 maart 2015
 Financial results 2014 Press conference Amsterdam, 20 maart 2015 Content Introduction Key financial highlights Key financial figures & main developments Outlook Developments gas transport Mission, vision
Enel Green Power. Clean Energy Summit. Gu Yoon Chung, Head of Business Development for Asia and Pacific area. Sydney, July 27 th 2016
 Enel Green Power Clean Energy Summit Gu Yoon Chung, Head of Business Development for Asia and Pacific area Sydney, July 27 th 2016 Enel today 1 Italy North America Capacity: 2.5 GW Capacity: 30.7 GW Networks:
Consolidated Financial Results for the Second Quarter of Fiscal Year Ending December 31, 2017 (Japan GAAP)
") Note: This English translation is solely for reference purposes and not a legally definitive translation of the original Japanese text. In the event a difference arises regarding the meaning herein, the
Note: This English translation is solely for reference purposes and not a legally definitive translation of the original Japanese text. In the event a difference arises regarding the meaning herein, the
General overview for investors in Hungary s energy market
 General overview for investors in Hungary s energy market WHY INVEST IN THE HUNGARIAN GREEN INDUSTRY? Competitive investment environment Competitive energy prices Favorable implementation costs Government
ECONOMIC TRENDS OF ITALIAN ELECTRICITY SECTOR SHORT TERMS STATISTICS
 NEWSLETTER January - March 2017 ECONOMIC TRENDS OF ITALIAN ELECTRICITY SECTOR SHORT TERMS STATISTICS In the first three months of 2017 data of national electricity sector has shown an increase in electricity
ANNUAL RESULTS 2013/14 (April 1st, 2013 / March 31st, 2014)
") Press release Lille, June 19th 2014 ANNUAL RESULTS 2013/14 (April 1st, 2013 / March 31st, 2014) For 2013/14, Tereos, the largest sugar producer in France and fifth sugar producer in the world, reported
Press release Lille, June 19th 2014 ANNUAL RESULTS 2013/14 (April 1st, 2013 / March 31st, 2014) For 2013/14, Tereos, the largest sugar producer in France and fifth sugar producer in the world, reported
For personal use only
 ASX RELEASE APPENDIX 4C & OPERATIONAL UPDATE MSL DELIVERS GROWTH 26 July 2018: MSL Solutions Limited (ASX: MPW) (MSL or the Company) has today lodged its Report and is pleased to provide an update on the
edp wind installed capacity in 2006 totaled 1,568 MW (of which 29 MW in France) or 8% above our target for 2006 (including AE acquisition)
 or 8% above our target for 2006 (including AE acquisition)") EDP Business Plan 2010 January 2007 Electricity Museum - Lisbon edp wind installed capacity in 2006 totaled 1,568 MW (of which 29 MW in France) or 8% above our target for 2006 (including AE acquisition)
EDP Business Plan 2010 January 2007 Electricity Museum - Lisbon edp wind installed capacity in 2006 totaled 1,568 MW (of which 29 MW in France) or 8% above our target for 2006 (including AE acquisition)
INTERIM FINANCIAL REPORT
 INTERIM FINANCIAL REPORT HALF YEAR 2016 0 Interim Financial Report Half Year 2016 HIGHLIGHTS Positive trend in financials for H1 2016 Profit year to date 2016 6% decrease in revenuee to EUR 25.3M 7% increase
2012 Annual Results Presentation. 2 April 2013
 2012 Annual Results Presentation 2 April 2013 1 The presentation is prepared by China High Speed Transmission Equipment Co., Ltd (the Company ) and is solely for the purpose of corporate communication
DP WORLD LIMITED UNAUDITED RESULTS FOR THE 6 MONTHS TO 30 JUNE 2009
 DP WORLD LIMITED UNAUDITED RESULTS FOR THE 6 MONTHS TO 30 JUNE 2009 Dubai, United Arab Emirates, 27 August, 2009: - Global container port operator DP World today announces financial results from its portfolio
Value in uncertain times
 Value in uncertain times 13. InvestorenForum J.P. Morgan AG, Frankfurt January 23, 2013 Dr. Stephan Lowis Head of Investor Relations (as of January 2013) Forward Looking Statement This presentation contains
NOPA Norske Skog 5 April 2017 Carsten Dybevig VP Communication
 NOPA Norske Skog 5 April 2017 Carsten Dybevig VP Communication Norske Skog in brief Publication paper producer in Europe and Australasia Total production capacity 2.7 million tonnes 2016 revenue NOK 12
9M 2018 Consolidated Results
 9M 2018 Consolidated Results Milan, November 13 th,2018 AGENDA HIGHLIGHTS ANALYSIS OF RESULTS ANNEXES 2 Highlights 9M 2018 vs 9M 2017 CCGT AND HYDRO VOLUMES WASTE TREATMENT PRICES ENVIRONMENTAL MARKETS
microgen plc Audited Preliminary Results for the year ended 31 December 2015
 microgen plc Audited Preliminary Results for the year ended 31 December 2015 To be read in conjunction with the audited preliminary results announcement released on 3 March 2016 1 Group Overview Across
INVESTOR PRESENTATION
 INVESTOR PRESENTATION SWISS EQUITIES CONFERENCE BAADER HELVEA R. ERNI, CFO BAD RAGAZ 12 JANUARY 2018 Panalpina Biz Model / Strategy Achievements and key figures Operating and financial review Appendix
FY18 FY17 change (1.4) (240.2)
 (240.2)") 1 2 3 4 FY18 FY17 % $m $m change Total Revenue 357.3 320.3 11.5% Share of Profits (Loss) (1.4) (1.2) (15.5%) Expenses (240.2) (216.2) (11.1%) Operating EBITDA 115.7 102.9 12.5% EBIT 89.5 86.1 3.9% Net
1 2 3 4 FY18 FY17 % $m $m change Total Revenue 357.3 320.3 11.5% Share of Profits (Loss) (1.4) (1.2) (15.5%) Expenses (240.2) (216.2) (11.1%) Operating EBITDA 115.7 102.9 12.5% EBIT 89.5 86.1 3.9% Net
E1/83. ACS Servicios Comunicaciones y Energía S.L. Green Notes. Green Evaluation. Transaction Overview. Green Evaluation Overview.
 Green Evaluation ACS Servicios Comunicaciones y Energía S.L. Green Notes Transaction Overview ACS Servicios Comunicaciones y Energía S.L. (ACS SCE) plans to issue 750 million of direct, general, unconditional,
CAPACITY. Domestic market. 2.5 m t. 243 k ha 700 k t. Domestic and export markets. 1.7 m t. 145 k t. 960 k t. Domestic market 250 k t.
 DISCLAIMER The statements contained in this presentation related to the business outlook, operating and financial projections, and growth prospects of Klabin S.A. are merely projections, and as such are
Full year results Amsterdam, 5 February 2015
 Full year results 2014 Amsterdam, 5 February 2015 Disclaimer The information contained herein shall not constitute or form any part of any offer or invitation to subscribe for, underwrite or otherwise
Fresenius Investor News
 Analysts Meeting and Live video webcast today Fresenius Medical Care at 2.30 p.m. CET / 8.30 a.m. EDT Fresenius AG at 4.30 p.m. CET / 10.30 a.m. EDT health care worldwide May 4, 2005 Contact: Birgit Grund
1Q18 results. Investor and analyst update. 16 th May 2018
 1Q18 results Investor and analyst update 16 th May 2018 DISCLAIMER The information contained in this presentation is intended solely for your reference. This presentation contains forward-looking statements
/ IBE-WATCH FACT SHEET Q1 2017
 IBERDROLA: Net Electricity Production (provisional) TOTAL GROUP GWh % Weight vs 2016 GWh % Weight vs 2016 Renewables 16,331 43% -10.0% 16,331 43% -10.0% Onshore wind 9,501 25% -3.8% 9,501 25% -3.8% Offshore
Q3 & 9M FY15 Results. Leading Diversified Renewable Energy Generation Company
 Q3 & 9M FY15 Results Leading Diversified Renewable Energy Generation Company Financial & Operational Highlights Q3 & 9M FY15 Performance Highlights Q3 FY15 witnessed a sales growth of 11% on a Y-o-Y basis
Munksjö historical. Ahlstrom- Munksjö Net sales Other operating income Total income
 1 APPENDIX: UNAUDITED PRO FORMA FINANCIAL INFORMATION The following unaudited pro forma consolidated financial information (the Pro forma financial information ) is presented for illustrative purposes
Review report of the Auditors to the Board of Directors of Aramex PJSC (formerly Arab International Logistics (ARAMEX) Co.
 Co.") Review report of the Auditors to the Board of Directors of Aramex PJSC (formerly Arab International Logistics (ARAMEX) Co. (PJSC) ) We have reviewed the accompanying condensed consolidated interim balance
Review report of the Auditors to the Board of Directors of Aramex PJSC (formerly Arab International Logistics (ARAMEX) Co. (PJSC) ) We have reviewed the accompanying condensed consolidated interim balance
VeriFone Files Restated Reports
 VeriFone Files Restated Reports SAN JOSE, Calif. -- August 19, 2008 --VeriFone Holdings Inc. (NYSE: PAY) today filed its amended and restated quarterly report on Form 10-Q/A for the fiscal quarters ended
Tailoring Financing to Islands' Specificities. Olivier Grandvoinet SAIREC - October 5th, 2015
 Tailoring Financing to Islands' Specificities Olivier Grandvoinet SAIREC - October 5th, 2015 1 AFD at a glance The French bilateral development bank In the top 12 of international donors 2 AFD in Island
Steelcase Inc. Reports Third Quarter Fiscal 2002 Results; Declares Quarterly Dividend of Six Cents Per Share
 Steelcase Inc. Reports Third Quarter Fiscal 2002 Results; Declares Quarterly Dividend of Six Cents Per Share GRAND RAPIDS, Mich.--(BUSINESS WIRE)--Dec. 19, 2001--Steelcase Inc. (NYSE:SCS) today reported
Tres Valles Cogeneration Project. Frederik Staun, UNEP Risoe Centre, Carbon finance Belize City August, 2010
 Tres Valles Cogeneration Project Frederik Staun, fsta@risoe.dtu.dk UNEP Risoe Centre, Carbon finance Belize City 24 26 August, 2010 Description of the project Tres Valles Cogeneration Project consists
INTERIM RESULTS FIRST QUARTER 2003 (January - March 2003) RECOLETOS GRUPO DE COMUNICACIÓN S.A.
 RECOLETOS GRUPO DE COMUNICACIÓN S.A.") INTERIM RESULTS FIRST QUARTER 2003 (January - March 2003) RECOLETOS GRUPO DE COMUNICACIÓN S.A. The consolidated financial results for the first quarter of 2003 demonstrate profit improvement and enhanced
INTERIM RESULTS FIRST QUARTER 2003 (January - March 2003) RECOLETOS GRUPO DE COMUNICACIÓN S.A. The consolidated financial results for the first quarter of 2003 demonstrate profit improvement and enhanced
Solid start into the year
 Deutsche Post DHL Group results Q 203 Solid start into the year Larry Rosen, CFO Bonn, 4 May 203 Q 203 Highlights (/2) Delivering solid results in still challenging macro-environment EBIT increase reflects
Vattenfall Q1 results 2011
 Vattenfall Q1 results 2011 Øystein Løseth, CEO and Dag Andresen, CFO Press conference, 5 May 2011 Fukushima accident in Japan consequences for nuclear Earth quake and tsunami in Japan and accident in the
Full-year 2012 results presentation
 Full-year 2012 results presentation Contents 1. ID Logistics, France s leader in contractual logistics 2. 2012 highlights 3. FY 2012 results 4. 2013 outlook 5. Appendix 2 FY 2012 results, 26 March 2013
Axpo posts half-year profit of CHF 350 million and raises revenues from renewable energies
 The first half of in brief Axpo posts half-year profit of CHF 350 million and raises revenues from renewable energies Dear shareholders In the first half of (1 October 2015 to 31 March 2016), the Axpo
Renewable & Alternative Energy Resources: What s the difference? 2
 The Development of Renewable & Alternative Energy Resources: The Role of the Commissioner Jeff Davis Commissioner Missouri Public Service Commission 1 Renewable & Alternative Energy Resources: What s the
INTERIM RESULTS FIRST HALF OF 2002 RECOLETOS GRUPO DE COMUNICACIÓN S.A.
 INTERIM RESULTS FIRST HALF OF 2002 RECOLETOS GRUPO DE COMUNICACIÓN S.A. The consolidated financial results for the first half of 2002 show good progress against the first quarter of the year, with particularly
TXT e-solutions. Corporate Presentation March 2015
 TXT e-solutions Corporate Presentation March 2015 2014: Another year of Growth Revenues: 55.9 m (+6.3%), 57% from Int l Operations EBIT: 5.5 m (+10%) Cash Flow from Op. 9.3% of Revenues NFP: 8.5m (+ Treasury
2016 half year results August 10 th 2016
 2016 half year results August 10 th 2016 HALF YEAR RESULTS 2016 1 Certain statements in this document are forward looking statements. These forward looking statements speak only as at the date of this
1H 2018 Consolidated Results
 1H 2018 Consolidated Results Milan, July 31 st,2018 AGENDA HIGHLIGHTS ANALYSIS OF RESULTS ANNEXES 2 Highlights 1H 2018 vs 1H 2017 ENVIRONMENTAL MARKETS CCGT AND HYDRO VOLUMES CCGT PERFORMANCE ON MSD WASTE
MOL CEZ Joint Venture. Budapest, 20 Dec 2007
 MOL CEZ Joint Venture Budapest, 0 Dec 007 Disclaimer "This presentation and the associated slides and discussion contain forward-looking statements. These statements are naturally subject to uncertainty
2009 Full Year Results. September, 2009
 2009 Full Year Results September, 2009 Doug Rathbone Managing Director 2009 Full Year results A challenging year Glyphosate profit impact was substantial Credit related pressures in Brazil Non-glyphosate
Dedicated focus on Renewables
 Dedicated focus on Renewables Anders Dahl Head of Renewables London, 22 September 2010 Vattenfall Today s Focus Delivering Vattenfall s Vision A major and expanding Wind player Developing the business
S E C O N D H A L F R E S U L T S
 S E C O N D H A L F R E S U L T S 2 0 0 6 Flebogamma DIF had been approved by the FDA in December 2006. The product has several presentations. 2 G R I F O L S 2 0 0 6 General evolution of the year 2006
SB 838: Oregon Renewable Energy Act Establishing an Oregon Renewable Energy Standard
 SB 838: Oregon Renewable Energy Act Establishing an Oregon Renewable Energy Standard Section-by-Section Summary SB 838, C-engrossed version As passed by Oregon House of Representatives, May 23 rd, 2007.
Independent auditors review report to the Board of Directors of Aramex PJSC
 Independent auditors review report to the Board of Directors of Aramex PJSC Introduction We have reviewed the accompanying condensed consolidated interim balance sheet of Aramex PJSC ( the Company ) and
Renewable Energy: Wind Energy
 Environmental Policy Renewable Energy: Wind Energy Prof. C. San Juan Annika Karstadt, Martin Galonska Wind energy - Agenda 1 2 3 4 5 What is renewable energy Wind energy Wind farms EU policy (White Paper
LUIS HENRIQUE GUIMARÃES
 LUIS HENRIQUE GUIMARÃES DISCLAIMER This presentation contains estimates and forward-looking statements regarding our strategy and opportunities for future growth. Such information is mainly based on our
Second Quarter Financial Summary and Projections for FY2016
 Second Quarter Financial Summary and Projections for FY2016 President and CEO Shunsuke Betsukawa 1 INDEX 01 Financial Summary for 2Q-FY2016 02 Performance Forecast for FY2016 03 Progress Status of Medium-Term
Preliminary Results for Year Ended 31 st July th November 2018
 Preliminary Results for Year Ended 31 st July 2018 8 th November 2018 Presenting today 2 Index Page Introduction 4 Headline Numbers 5 Recap of actions since Half Year 6 Financial Results P&L 10 Financial
Company Presentation 1Q 2015 Results. 30 April 2015
 Company Presentation 1Q 2015 Results 30 April 2015 Presentation Outline 1 Business Overview 2 Plantation Highlights 3 Financial Highlights 4 Strategies and Expansion 5 Appendix Integrated Agribusiness
MVV Energie Energising the Future
 MVV Energie Energising the Future Fact book Consolidated financial statements for the 2009/10 financial year pursuant to IFRS 12 January 2011 www.mvv-investor.de Our Understanding of Our Business MVV Energie
2Q'18 Earnings Release. July 26, 2018 LG Electronics
 2Q'18 Earnings Release July 26, 2018 LG Electronics All information regarding management performance and financial results of LG Electronics (the Company ) during the 2 nd quarter of 2018 as contained
Quarterly Financial Information at 31 March 2018 Sales up 3.0% targets confirmed Key figures. Highlights
 Quarterly Financial Information at 31 March 2018 Sales up 3.0% 1 2018 targets confirmed Key figures Group sales Electricity Output Nuclear France: Nuclear United Kingdom: Group Renewables: of which Hydropower
ACCIONA Energía. A global operator in renewables unique in the sector The developer s experience in INDIA
 ACCIONA Energía A global operator in renewables unique in the sector The developer s experience in INDIA ACCIONA, PIONEERS IN DEVELOPMENT AND SUSTAINABILITY Four lines of business with the common link
2014 Preliminary Results & Strategy Review Update March 12, 2015
 2014 Preliminary Results & Strategy Review Update March 12, 2015 Agenda Highlights Richard Tyson, Chief Executive Officer Financial Review Mark Hoad, Chief Financial Officer Strategy Review - Update Richard
Integrated Report 2018 Audited Financial Report
 Integrated Report 2018 Audited Financial Report Consolidated Statement of Financial Position 1 Consolidated Statement of Profit or Loss 3 Consolidated Statement of Comprehensive Income 4 Consolidated Statement
2013 Interim Results Presentation. 26 August 2013
 2013 Interim Results Presentation 26 August 2013 1 Forward-Looking Statements The presentation is prepared by China High Speed Transmission Equipment Co., Ltd (the Company ) and is solely for the purpose
Pearson! Interim results. 28 July 2003
 Pearson! Interim results 28 July 2003 On track for full year! Strong competitive performances! Continuing efficiency gains Financial highlights m H1 2003 H1 2002 change as reported change underlying Sales
SOLVAY GROUP Consistent implementation of our strategy for sustainable
 Sustainable Energy Management : Opportunities & Challenges SOLVAY GROUP Consistent implementation of our strategy for sustainable Philippe Warny, Manager of the Competence Center Energy, Utilities, Electrical
DP WORLD LIMITED AND ITS SUBSIDIARIES CONSOLIDATED FINANCIAL STATEMENTS 31 DECEMBER 2010
 DP WORLD LIMITED AND ITS SUBSIDIARIES CONSOLIDATED FINANCIAL STATEMENTS 31 DECEMBER 2010 1 Consolidated income statement for the year ended 31 December 2010 Year ended 31 December 2010 Year ended 31 December