Suitability of Wind Power for Texas Urban Areas
|
|
|
- Emily Woods
- 6 years ago
- Views:
Transcription
1 Suitability of Wind Power for Texas Urban Areas Jenna Kamholz School of Architecture University of Texas December 13, 2008 CRP 386
2 Executive Summary The limitations of fossil fuel resources are being felt in rising prices as well as political conflicts. Among other things, we are going to have to begin to rely more on clean and renewable sources of energy in order to sustain our civilization. Wind power can play a large role in the solution to the current energy and environmental crisis. Its non-polluting nature, and its increasing cost effectiveness, the compatibility of wind power with other land uses, and the abundance of the wind resources and all qualify it as a powerful option for meeting future energy needs. Texas size and varied climate makes it the state with the most potential in terms of renewable resources. According to InfinitePower.org, the annual wind power available in Texas is approximately 250,000 MW, almost four times the amount of electricity currently produced in the state. In addition, wind farms could play a major role in developing the vast rural areas of Texas many of which are currently experiencing depopulation. With the growing necessity to switch to clean, renewable energy sources it is imperative that we identify areas of unmet potential. This project focused on determining locations in Texas suitable to produce wind power to supply the energy demands of urban areas. An examination of existing conditions and future growth predictions was be used to determine which Texas counties have the greatest possibility as future centers of renewable energy. The majority of the data used in this analysis came from the Texas General Land Office. Other sources include the National Renewable Energy Laboratory (NREL), the Alternative Energy Institute at West Texas A&M University, the Berkeley/Penn Urban and Environmental Modeler s Datakit and The GeoCommunity website. To conduct the analysis on the suitability of wind power for Texas urban areas I researched the qualities that were both positive factors and negative factors in siting wind farms. I classified factors into three categories. First, favorable conditions included adequate wind power, low sloping land, and proximity to roads and utility lines. Second, constraining factors included urban areas, forested areas, major water features, and protected landscapes. Thirdly, population factors included growing demand centers and areas in need of new industry. After individually mapping these factors, they were overlayed to reveal the locations with the greatest potential in terms of demand and need. The findings support the initial hypothesis that Texas has a lot of potential sites that are adequate for wind power facilities as well as growing power needs. However, it appears that natural and existing man made conditions should not be the main determining factor in selected sites for new wind farms. Rather, changes in future population will have the greatest effect on the location demand and industry need. Based on this study the thirteen identified counties: Hardeman, Foard, Baylor, Callahan, Motley, Dickens, Kent, Fisher, Coke, Jeff Davis, Refugio, San Patricio, Aransas are the prime locations for wind farms by the presence of favorable sites without constrains, their need for industry and their proximity to growing counties. These counties should conduct further analysis at the local level to determine land availability and local interest. 2

3 Introduction The limitations of fossil fuel resources are being felt in rising prices as well as political conflicts. We are relying increasingly on foreign sources of energy as our own sources are tapped. The Energy Information Administration of the Department of Energy states that the U.S. peaked in oil production in the 1970 s and we have since exhausted 75% of all the known oil reserves in this country. Furthermore, the U.S. peaked in natural gas production in 1973, and in order to keep gas production steady in the U.S., we have had to drill thousands more wells every year. In sum, we have very little remaining oil and gas reserves. While we do have a considerable supply of coal resources, we do not have the technology to use them without putting a substantial amount of carbon into the atmosphere. With growing concerns over global warming and its far reaching environmental impact, coal is not currently a reasonable option. Furthermore, electricity generation is the largest industrial source of air pollution in the U.S. and forty percent of CO 2 comes from the electric power sector. 1 Among other things, we are going to have to begin to rely more on clean and renewable sources of energy in order to sustain our civilization. Why Wind? Mankind has put wind to work for centuries, yet its large-scale application for electricity generation has only occurred in the past two decades. Wind power can play a large role in the solution to the current energy and environmental crisis. Its non-polluting nature, and its increasing cost effectiveness, the compatibility of wind power with other land uses, and the abundance of the wind resources and all qualify it as a powerful option for meeting future energy needs. Wind power avoids many of the negative effects of traditional electricity generation including, emissions of heavy metals, emissions associated with extracting and transporting fuels, lake and streambed acidification from acid rain or mining, water consumption associated with mining, production of toxic solid wastes, ash, or slurry, and greenhouse gas emissions. The table to the left indicates the substantial amount of CO2 emissions that could be avoided by generating 20% of our electricity from wind power by In addition to lower emissions, wind power is becoming increasingly efficient in terms of material use. One study, conducted in Germany by Gerd Hagedorn, showed that wind turbines produce 4 to 33 times more energy during their 20-year lifetimes than that used in their construction. Coal plants produce 64 times more energy and nuclear 108 times more than that used in their construction. Current photovoltaic 1 AWEA Facts Sheets 3
4 technology produces one to three times the energy represented by their materials. When fuel is included, coal and nuclear plants deliver only one-third of the total energy used in their construction and in their fuel supply because fuel consumption dwarfs the amount of energy in the plant s materials. 2 Furthermore, wind power is now fairly cost effective. The results of three European studies showed that medium-sized wind turbines installed in areas with commercially usable wind resources will pay for themselves within one year. 3 Moreover, wind power can be a catalyst to the development of rural areas where the best resources are often located. There are several economic development benefits associated with wind projects, including: job creation, local project spending, annual property and sales taxes, and annual landowner easement payments. According to the studies conducted by Wind Powering America in conjunction with the National Renewable Energy Laboratory jobs are created during the construction phase for every 100 MW of installed capacity; 6 to 10 new jobs are created during the operations phase for every 100 MW of installed capacity. Additionally, $500,000- $1,000,000 in new annual property tax payments are generated for every 100 MW of installed capacity and annual landowner easement payments are typically $2,000- $5,000 per MW of installed capacity. Although wind power plants have relatively little impact on the environment compared to other conventional power plants, there is some concern over the noise, aesthetic impacts, and bird and bat mortality. Most of these problems have been resolved or greatly reduced through technological development or by properly siting wind plants. According to the American Wind Energy Association, the total potential amount of wind generated electricity in the United States is more than twice the total amount of electricity generated in the U.S. today, about 10,777 billion kwh annually. The states with the top five wind energy potential are North Dakota, Texas, Kansas, South Dakota, and Montana. 2 Gipe, Gipe,

5 Why Texas? Texas size and varied climate makes it the state with the most potential in terms of renewable resources. According to InfinitePower.org, the annual wind power available in Texas is approximately 250,000 MW, almost four times the amount of electricity currently produced in the state. A state law signed in 1999 set a goal to install 2,000 MW of new renewable energy resources by In 2005, Texas legislators increased it to 5,000 MW by 2015 and to 10,000 MW by The costeffectiveness of wind turbines makes them a likely source of approximately 5,000 MW of the renewable goals of the state. In addition, wind farms could play a major role in developing the vast rural areas of Texas many of which are currently experiencing depopulation. As noted above, wind turbines can benefit the economy in rural areas. As the turbines use only a fraction of the land, by being built on farms or ranches the residents can continue to work the land while collecting rent payments from the wind power plant owners. 5
6 Problem Statement With the growing necessity to switch to clean, renewable energy sources it is imperative that we identify areas of unmet potential. Its cost effectiveness and the appropriate geography in Texas make wind power a viable choice as a sustainable power source for a large part of the state. Unfortunately, good wind sites are typically in remote locations, far from cities where the electricity demand is high. This project will focus on determining locations in Texas suitable to produce wind power to supply the energy demands of urban areas. An examination of existing conditions and future growth predictions will be used to determine which Texas counties have the greatest possibility as future centers of renewable energy. Research Questions What are the areas of unmet potential in terms of wind resources? What are suitable locations for new wind power infrastructure? What existing urban areas can take greater advantage of wind resources? What areas may support new developments around the wind power industry? Methodology To conduct an analysis on the suitability of wind power for Texas urban areas I first researched the qualities that were both positive factors and negative factors in siting wind farms. The involved a thorough review of literature produced by both government and private organizations. As the basis of my analysis I used the criteria put forth in a 2001 study by Baban and Parry titled Developing and applying a GISassisted approach to locating wind farms in the UK. According to their criteria the Wind farm location must: 1. avoid summits of large hills 2. have slope angles less than 10% 4. have a wind speed greater than 5m/s 5. not be located within 500m of woodland 6. not be located within 2000m of large Settlements 7. not be located within 500m of single dwellings 8. not be located further than 10000m from roads 9. not be located further than 10000m of National Grid 10. not be located within 400m of water bodies 11. not be located within 1000m of areas of ecological value/special scientific interest 12. not be located on or within 1000m of historic sites 13. not be located within 1000m of National Trust property 14. avoid taking grade 1 and grade 2 agricultural land As this was a study for the UK, I converted the distances from meters to miles for my buffers. In addition due to the scale of my research area and the time constraints of the project I was unable to include all of the factors in my analysis. The factors not included in my study were numbers 1, 7, 12, 13, 14. For factor 9 I used large utility lines and for factor 11 I used state and national parks. Secondly, to determine the future energy needs in Texas I sought information on the current and future population size to determine areas of increasing demand. I acquired the population projections from the Texas State Data Center and Office of the Demogapher (TSDC). The projections are of the population all counties in the 6
7 State for each year from 2000 through The projections were completed using a cohort-component projection technique. Data Acquisition The majority of the data used in this analysis came from the Texas General Land Office. I large portion of the data was available to download from their website. For the purposes of my analysis I acquired the following files: city limits, counties, major water, national parks, state parks, urban areas, and vegetation. In addition to these freely available files I contacted GIS Analyst, Jon Painter for the shape file containing the locations of current Texas wind farms. For the wind power data I relied on two sources. First, the National Renewable Energy Laboratory (NREL) has low resolution wind data for the entire country and high resolution data for some states. Unfortunately, Texas is not one of those states. Therefore, I used the NREL data on the context map showing the continental US only. The more detailed wind energy for the state of Texas only was retrieved from the Alternative Energy Institute at West Texas A&M University through contact with Director Kenneth Starcher. For the slope of the topography I acquired two raster images from the Berkeley/Penn Urban and Environmental Modeler s Datakit for the west and south regions that divide Texas. Lastly, I downloaded files for statewide Texas roads and utility lines from The GeoCommunity website. Data Preparation For the purposes of my analysis all files were projected to the NAD 1983 Texas Centric Mapping System Lambert. To make the population projection data usable, the excel file was modified and edited so that it only included the total population for the years 2000, 2020, and 2040 for each county. This file was then joined to the counties shape file using the county name as the common field. The raster images containing the slope information we too detailed and included an area large than my study zone. In addition the state of Texas was divided between the two files. I began by performing a raster calculation to differentiate only between slopes less than or equal to 10% and slopes greater than 10%. Then I converted the two simplified raster images to polygons. I merged the polygons and clipped the resultant shape to the Texas state border. Maps The Case for Texas Create a data frame named U.S. distribution containing national wind data symbolize by the wind power class Create a data frame named Texas Distribution Copy the wind data layer and symbology from the U.S. distribution frame 7
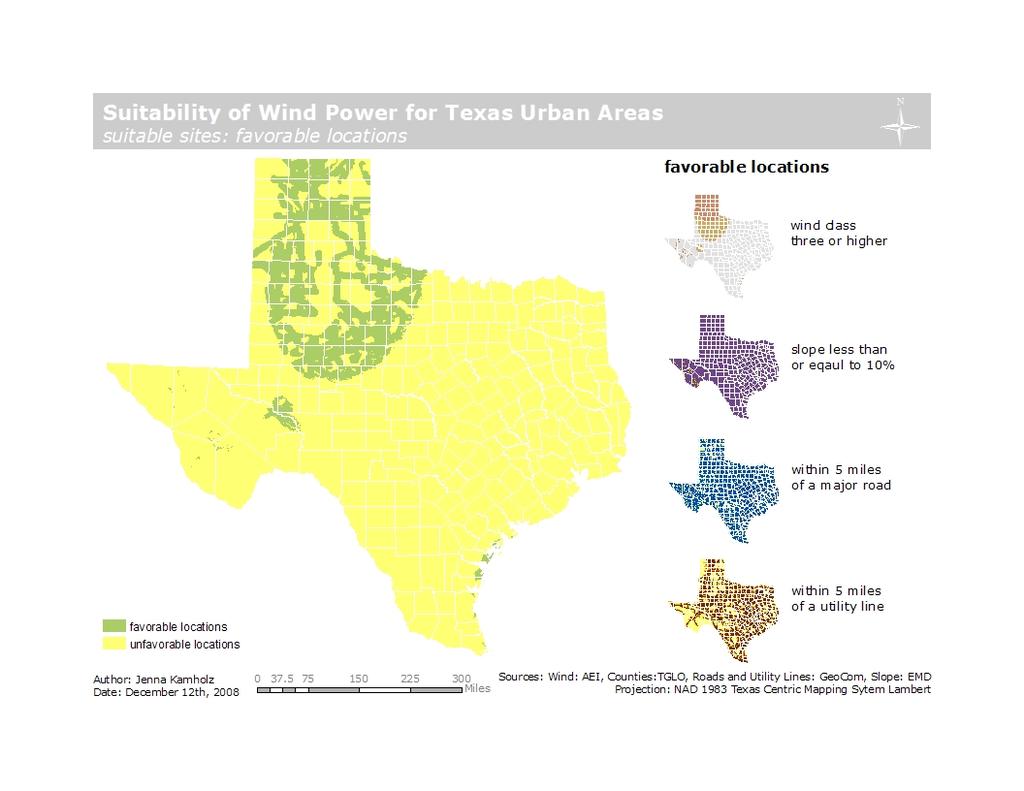
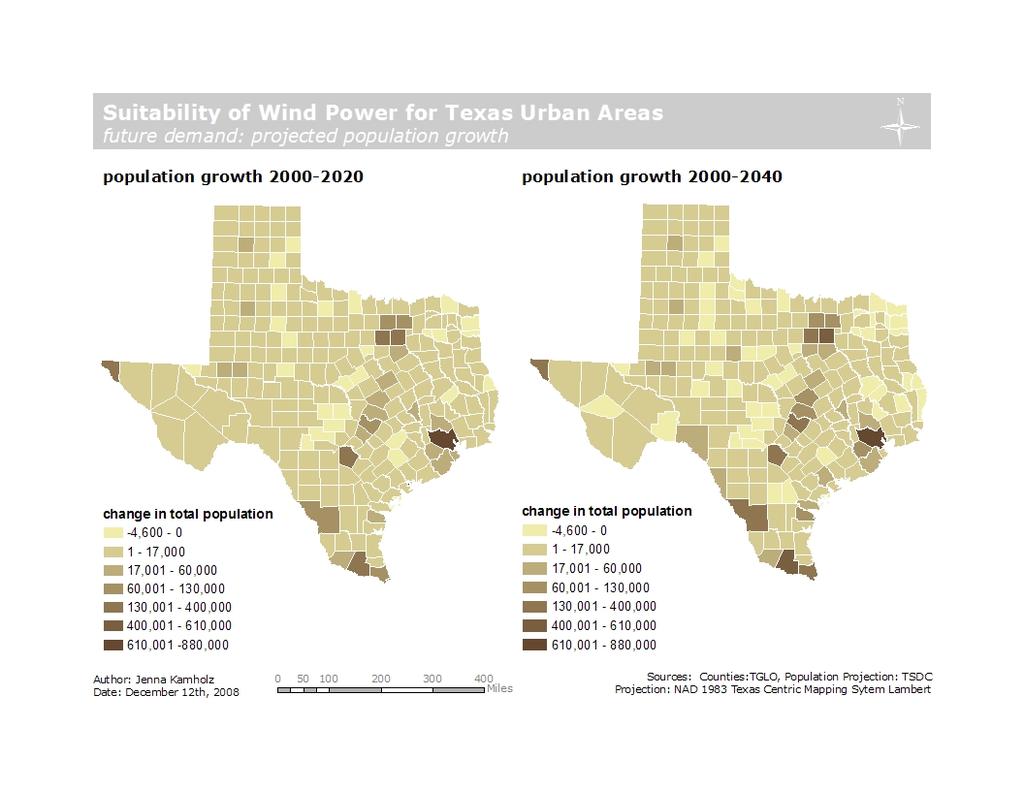
8 Resources and Demand Create a data frame named Adequate Wind Supply Add the K2final.rst showing Texas wind classes from the Alternative Energy Institute symbolized by wind power class, remove values 1 and 2 as they are too low for commercial use Add current wind farm locations Create a data frame named 2000 Demand Add counties layer, symbolize by 2000 total population Add urban areas Add current wind farm locations Suitable Sites: Favorable Conditions Create a data frame named adequate wind with values 3-7 extracted from Texas wind data symbolized by wind class Create a data frame named percentage slope with topography layer symbolized by percent slope less and greater than 10% Create a data frame named proximity to roads with the roads layer Create a buffer from roads of five miles Create a data frame named proximity to utility lines with the utility lines layer Create a buffer from utility lines of five miles Suitable Sites: Favorable Locations Create a data frame named favorable locations with extracted areas with slope less than 10% Clip low slope layer using good wind, roads buffer, and utility lines buffer, name the resultant file favorable locations Suitable Sites: Constraints Create a data frame named urban areas with the urban_areas layer Create a buffer from urban_areas of 1-1/4 miles- dissolve all to create one polygon Create a data frame named forested area with extract areas classified as forests from the veg layer Create a buffer from forests of ¼ mile- dissolve all to create one polygon Create a data frame named major water features with the lakes_rivers layer Create a buffer from lakes_rivers of 1/2 mile- dissolve all to create one polygon Create a data frame named protected landscapes the state and national parks layer Create a buffer from the parks of 1/2 mile- dissolve all to create one polygon Suitable Sites: Constrained Locations Create a data frame named constrained locations Merge the four buffers: urban, forest, water, and parks into one layer named constrained locations Suitable Sites: Create a data frame named unfavorable locations Erase constrained locations from favorable sites, name resultant layer suitable sites Future Demand: Projected Population Growth Create a data frame named population growth Add counties data layer and edited 2006allcntymigtot.xls table 8
9 Join table to the counties layer using county names Add a new field 2020_2000 and calculate values based on population population 2000 Symbolize population based on this new field using seven categories Repeat for population growth Adjust the breaks of the categories in the two data frames to be consistent Potential Impact: Areas of New Growth Create a new data frame named New Growth Add the suitable areas layer Add cities layer, label features Suitable Sites: Population Factors Create a data frame locating by future demand Add counties layer with extracted areas with a change in population from of over 100,000 Buffer this new layer by 200 miles, and clip to the Texas state border, Clip suitable locations using the 200 mile buffer Create a data frame locating by industry need Add counties layer with extracted areas with a change in population from less than 0 Clip suitable locations using the to counties with negative growth, name the resultant layer by industry need Suitable Sites: Prime Locations Add the by demand layer and by industry need layer Clip demand by industry need, name the resultant layer prime locations Select the counties that include this new layer Label selected counties Findings Reference: Resources and Demand Determining Suitable Sites: Favorable Conditions Favorable Locations Constraints Constrained Locations Suitable Sites Future Demand: Areas of New Growth Projected Population Growth Determining Prime Locations: Population Factors Prime Locations 9
10
11
12

13
14
15

16
17
18
19
20 Analysis Through mapping the existing resources it is evident that Texas has a large quantity of wind resources they are predominately located in the northwestern portion of the state an along the coast. Furthermore, the main centers of demand tend to be located along a band that runs north to south through the central portion of the state. The discrepancy between locations of supply and demand will make transmission a key issue in the development of wind power in Texas. While there are already a fair number of wind farms in Texas, they are not all located in the regions with the greatest wind resources and there is still plenty of potential for future growth. The analysis of favorable conditions for siting the wind farms reveals that wind resources are the largest limiting factor. In terms of landscape, the majority of Texas is well suited for wind power as the vast majority of the state has less than 10% slope. In terms of infrastructure, aging the majority of the state is within range of existing roads and utility lines. Furthermore, research revealed that the existing transmission infrastructure will not be able to handle the addition of substantial new power sources and it is likely new infrastructure will be needed no matter the location. However, these factors were still used to limit the scope of this study. The analysis of constraining conditions shows that the location of major water features may be the largest constraining factor. The majority of other factors: forested areas, urban areas, and protected landscapes had the greatest concentration in the middle, and eastern portions of the state. This is true of the water features as well, yet there seemed still be a significant amount in the northwestern portion. The population analysis of Texas revealed that it is predicted to experience depopulation in the rural areas and a densification in the cities. This will have two effects on locating potential wind farms. First, the cities will be experiencing the greatest amount of demand increase. This means that facilities located nearer to the cities will be preferable because they will experience less loss in transmission. Secondly, the rural areas are in need of new industry to maintain and increase their population levels. Counties projected to experience negative growth in the next forty years are good candidates for wind farms or wind power manufacturing facilities and their associated economic benefits. An overlay of these two factors revealed 13 counties in Texas that are both expected to decrease in population by 2040 and are within 200 miles of a county expected to grow by over 100,000 people by These findings are the result of the population projection used in this study. Updated projections using future census information or projections using a different model may yield different results. The findings support the initial hypothesis that Texas has a lot of potential sites that are adequate for wind power facilities as well as growing power needs. However, it appears that natural and existing man made conditions should not be the main determining factor in selected sites for new wind farms. Rather, changes in future population will have the greatest effect on the location demand and industry need. 19
21 Conclusion The biggest challenge to implementing wind power for Texas is the discrepancy between the location of supply and demand. Developing new infrastructure for transmission will necessary to achieve the full potential of the resource. The boundary for this study was the state of Texas only. However, the new transmission technology makes long distance transmission feasible. This means that if the infrastructure can be created Texas could supply energy to surrounding states with lesser wind resources. Based on this study the thirteen identified counties: Hardeman, Foard, Baylor, Callahan, Motley, Dickens, Kent, Fisher, Coke, Jeff Davis, Refugio, San Patricio, Aransas are the prime locations for wind farms by the presence of favorable sites without constrains, their need for industry and their proximity to growing counties. These counties should conduct further analysis at the local level to determine land availability and local interest. The constraints used in this study are by no means exhaustive. Additional analysis may exclude sites shown in this study to be acceptable or favorable. Furthermore, this study was conducted at the state level to determine which counties had the highest potential. Further studies should be conducted at a finer resolution for the actual siting of wind farms. A certain distance from roads and residences should be maintained to decrease the potential problems associated with noise, shadow flicker from the sun crossing the blades and low frequency vibrations. In addition, local ecosystems and animal habitats should be taken into consideration when selecting the site. 20
22 References Baban S.M.J. and Parry T. Developing and applying a GIS-assisted approach to locatingwind farms in the UK. Renewal Energy Gipe, Paul. Wind Energy Comes of Age. New York: John Wiley & Sons, Inc, National Research Council. Environmental Impacts of Wind Power Projects. The National Academies Press. Pasqualetti, Martin, Paul Gipe and Robert Righter. Wind Power in View Energy Landscapes in a Crowded World. San Diego, California: Academic Press, The Infinite Power of Texas. InfinitePower.org. The State Energy Conservation Office < Wind and Hydro Power Technologies. Energy Efficiency and Renewable Energy. U.S. Department of Energy. < Wind Energy Facts Sheets. American Wind Energy Association. < Wizelius, Tore. Developing Wind Power Projects. London: Earthscan Publications, % Wind Scenario: Wind Energy Provides 20% of U.S. Electricity Needs by Department of Energy, July < 21
23 APPENDIX 22
24 Data Acquisition Texas General Land Office (TGLO) Website: Contact: Jon Painter, GIS Analyst: (512) Disclaimers for data: Some areas may, with improved data, may turn out to be windier than indicated, while others may be worse. The data simply identifies promising regions in which to focus future assessment activities and development. True potential of a specific site can only be determined from long-term quality measurements. Wind farm locations are in the approximate location in the county. The Texas General Land Office makes no representations or warranties regarding the accuracy or completeness of the information depicted on this map or the data from which it was produced. This map IS NOT suitable for navigational purposes and does not purport to depict or establish boundaries between private and public land. Data Files: citylimits.shp, counties.shp, major_water.shp, natparks.shp, roads.shp, stateparks.shp, subblocks.shp, urban_areas.shp, veg.shp Berkeley/Penn Urban and Environmental Modeler s Datakit (EMD) Website: Data Files: DEM slope south, DEM slope west National Renewable Energy Laboratory (NREL) Website: Data File: l48wndatlas.shp Texas State Data Center and Office of the Demogapher (TSDC) Website: Data Files: 2006allcntymigtot.xls Alternative Energy Institute: West Texas A&M University (AEI) Website: Contact: Kenneth Starcher, Director: (806) aeimail@mail.wtamu.edu Data Files: K2final.rst The GeoCommunity Website: Data Files: rdline.e00, utline.e00 Expanded Methodology Re-project all layers to NAD 1983 Texas Centric Mapping System Lambert The Case for Texas Create a data frame named U.S. distribution Add the l48wndatlas.shp file containing national wind data Symbolize with the wind power class Add the Texas counties layer Dissolve counties into a Texas state outline Symbolize as hollow with white outline Create a data frame named Texas Distribution Copy the wind data layer and symbology from the U.S. distribution frame 23
25 Copy the Texas outline layer Clip wind layer with the Texas outline layer Add the counties layer and symbolize as hollow with white borders Resources and Demand Create a data frame named Adequate Wind Supply Add the K2final.rst showing Texas wind classes from the Alternative Energy Institute Symbolize by wind power class, remove values 1 and 2 as they are too low for commercial use Add counties layer, symbolize as grey with white borders Add wind farms file Create new symbol from windmill bitmap image Use new symbol to represent wind farm locations Create a data frame named 2000 Demand Add counties layer, symbolize by 2000 total population Add urban areas Add current wind farm locations Suitable Sites: Favorable Conditions Create a data frame named adequate wind Add the K2final.rst showing Texas wind classes from the AEI Convert raster to polygon wind class Select values 3-7 and extract as a separate shape file good wind Symbolize by wind class Remove raster and wind class polygon Create a data frame named percentage slope Add the topography layer Symbolize by gridcode, percent slope less and greater than 10% Create a data frame named proximity to roads Add the roads layer Create a buffer from roads of five miles- dissolve all to create one polygon Create a data frame named proximity to utility lines Add the utility lines layer Create a buffer from utility lines of five miles- dissolve all to create one polygon Suitable Sites: Favorable Locations Create a data frame named favorable locations Add topography layer Extract areas with slope less than 10%, save as low slope Remove topography layer Add good wind layer Add roads buffer layer Add utility lines buffer layer Clip low slope layer using good wind, roads buffer, and utility lines buffer, name the resultant file favorable locations Remove low slope, good wind, roads buffer, and utility lines buffer Add counties layer, symbolize as grey with white borders Suitable Sites: Constraints Create a data frame named urban areas Add the urban_areas layer 24
26 Create a buffer from urban_areas of 1-1/4 miles- dissolve all to create one polygon Create a data frame named forested area Add the veg layer Extract areas classified as forests- name the new layer forests Create a buffer from forests of ¼ mile- dissolve all to create one polygon Create a data frame named major water features Add the lakes_rivers layer Create a buffer from lakes_rivers of 1/2 mile- dissolve all to create one polygon Create a data frame named protected landscapes Add the st_parks layer Create a buffer from st_parks of 1/2 mile- dissolve all to create one polygon Add the nat_parks layer Create a buffer from nat_ parks of 1/2 mile- dissolve all to create one polygon Suitable Sites: Constrained Locations Create a data frame named constrained locations Add urban areas buffer Add forest buffer Add water buffer Add parks buffer Merge the four buffers into one layer named constrained locations Remove individual buffers Add counties layer, symbolize as grey with white borders Suitable Sites: Create a data frame named unfavorable locations Add favorable locations Add constrained locations Erase constrained locations from favorable sites, name resultant layer suitable sites Remove favorable and constrained locations Future Demand: Projected Population Growth Create a data frame named population growth Add counties data layer Open 2006allcntymigtot.xls in excel and format to show county name, population in 2000, population in 2020, and population in 2040 in four columns Add edited 2006allcntymigtot.xls table to data frame Join table to the counties layer using county names Add a new field 2020_2000 and calculate values based on population population 2000 Symbolize population based on this new field using seven categories Create a data frame named population growth Copy counties layer Add a new field 2040_2000 and calculate values based on population population 2000 Symbolize population based on this new field using seven categories Adjust the breaks of the categories in the two data frames to be consistent Suitable Sites: Population Factors Create a data frame locating by future demand Add counties layer 25
27 Extract all areas with a change in population from of over 100,000 Buffer this new layer by 200 miles Clip the buffer to the Texas state border, name the resultant layer by demand Add suitable locations Clip suitable locations using the 200 mile buffer Create a data frame locating by industry need Add counties layer Extract all areas with a change in population from less than 0 Add suitable locations Clip suitable locations using the to counties with negative growth, name the resultant layer by industry need Suitable Sites: Prime Locations Add the by demand layer and by industry need layer Clip demand by industry need, name the resultant layer prime locations Select the counties that include this new layer Label selected counties Potential Impact: Areas of New Growth Create a new data frame named New Growth Add the suitable areas layer Add cities layer, label features 26
20% Wind Energy by 2030
 20% Wind Energy by 2030 Steve Lindenberg Senior Advisor, Renewable Energy Department of Energy World Bank Energy Week April 1, 2009 Presentation Overview Background 20% Wind Scenario Costs Benefits Challenges
New Jersey Forest Stewardship Program Spatial Analysis Project Map Products And Data Layers Descriptions
 New Jersey Forest Stewardship Program Spatial Analysis Project 2007 Map Products And Data Layers Descriptions 01/07 NJ Forest Stewardship Program (FSP) Spatial Analysis Project (SAP) Methodology Project
Tyler Archer December 4, 2012 NRS509 August GIS & Wind Turbine Siting
 Tyler Archer December 4, 2012 NRS509 August GIS & Wind Turbine Siting In a world with growing energy needs, maybe countries and power companies are looking to expand into alternative and renewable energies.
Data Driven Generation Siting for Renewables Integration in Transmission Planning. Prepared by: Ty White, John Kuba, and Jason Thomas
 Data Driven Generation Siting for Renewables Integration in Transmission Planning Prepared by: Ty White, John Kuba, and Jason Thomas May 2014 Section 1.0 -- Background & Purpose Background As public policy
OFFSHORE WIND POWER IN THE UNITED STATES: AN EMERGING ALTERNATIVE ENERGY SOURCE
 OFFSHORE WIND POWER IN THE UNITED STATES: AN EMERGING ALTERNATIVE ENERGY SOURCE David B. Joyce, University of Miami School of Law and Rosenstiel School of Marine & Atmospheric Science Introduction The
Wind Energy and Wildlife: Frequently Asked Questions
 Wind Energy and Wildlife: Frequently Asked Questions Q: How does wind energy work? How is electricity generated from the wind? A: A wind energy system transforms the kinetic energy of the wind into mechanical
Big Sky, Big Wind. Wind Power Development in Montana. Marty Schnure GG320: GIS December 7, 2009 Word count: 908
 Big Sky, Big Wind Wind Power Development in Montana Marty Schnure GG320: GIS December 7, 2009 Word count: 908 Introduction Historically, Montana's energy has come primarily from coal and hydroelectric
Renewable energy (RE) is any energy source that naturally replenishes and cannot be exhausted. Renewable energies include:
 is any energy source that naturally replenishes and cannot be exhausted. Renewable energies include:") What is Renewable Energy? With greenhouse gas (ghg) emissions as the the primary contributor to human-caused climate change, one countermeasure that can be taken to limit our impact on the climate is by
What is Renewable Energy? With greenhouse gas (ghg) emissions as the the primary contributor to human-caused climate change, one countermeasure that can be taken to limit our impact on the climate is by
LUCIS Modeling for Renewable Energy in Cochise County, Arizona
 LUCIS Modeling for Renewable Energy in Cochise County, Arizona Melanie Meyers Colavito 1, Iris Patten 2, Mark Apel 3 & Erik Glenn 4 1 School of Geography and Development, University of Arizona, Tucson,
Environmental Science 101 Energy. Fall Learning Objectives: Reading Assignment:
 1 Environmental Science 101 Energy Fall 2012 Lecture Outline: 9. RENEWABLE ENERGY RESOURCES WIND AND SOLAR A. Solar Energy B. Wind Energy Terms You Should Know: Passive solar system Active solar system
Innovations in Energy Efficiency Transmission & Distribution Advances Helping to Meet Energy Demands of 21st Century
 Innovations in Energy Efficiency Transmission & Distribution Advances Helping to Meet Energy Demands of 21st Century Jim Greer Chief Operating Officer Oncor Electric Delivery 2012 Summer Seminar August
Electric Power from Sun and Wind
 Electric Power from Sun and Wind Fred Loxsom Eastern Connecticut State University Willimantic, Connecticut Many environmental problems are related to energy consumption. A college-level environmental science
POTENTIAL FOR GEOLOGICAL CARBON SEQUESTRATION USING DEEP SALINE AQUIFERS IN THE ILLINOIS BASIN
 POTENTIAL FOR GEOLOGICAL CARBON SEQUESTRATION USING DEEP SALINE AQUIFERS IN THE ILLINOIS BASIN DECEMBER 4, 2015 GIS TERM PAPER Julien Botto Table of Contents Introduction... 2 Background... 3 Objective...
A Solar System Project to Promote Renewable Energy Education
 Session 2249 A Solar System Project to Promote Renewable Energy Education Youakim Al Kalaani Northern Illinois University, Technology Department Abstract As issues such as climate change, global warming,
Section 2: Sources of Energy
 Section 2: Sources of Energy Types of Energy¹ All the things we use every day to meet our needs and wants are provided through the use of natural resources.natural resources are either renewable or nonrenewable.
Feasibility Study and Cost-Benefit Analysis of Tidal Energy: A Case Study for Ireland
 Feasibility Study and Cost-Benefit Analysis of Tidal Energy: A Case Study for Ireland D. Jackson 1 and T. Persoons 2 1 Dept. of Mechanical and Manufacturing Engineering, University of Dublin, Trinity College,
11. Prioritizing Farmlands for Future Protection
 11. Prioritizing Farmlands for Future Protection Identification of Important Farmlands in Putnam County I n order to implement this Plan successfully, Putnam County decision-makers will have to take advantage
The following is a status report on the development of wind energy in the USA at the end of 2004 by Paul Gipe.
 June 10, 2005 The following is a status report on the development of wind energy in the USA at the end of 2004 by Paul Gipe. United States of America Country Description Country Description USA Total 9,631,418
Exploring Energy Science Texts for Close Reading
 Science Texts for Close Reading Solar Energy Solar energy is a way to harness sunlight for heating or electricity. There are different ways to convert sunlight into usable energy. Concentrated solar power
Problem Statement. Design and construct a small wind turbine to produce as much power as possible while
 Problem Statement Design and construct a small wind turbine to produce as much power as possible while still maintaining efficiency. One must be able to measure the output of the turbine, the design must
Characterizing the Fire Threat to Wildland Urban Interface Areas in California
 Introduction Characterizing the Fire Threat to Wildland Urban Interface Areas in California This document outlines the procedures used to identify areas in California that pose significant threats from
Energy Unit Framework
 Energy Unit Framework Driving Question: How do we plan for future energy use? Enduring Understandings: Distinguish among forms of energy (e.g. nuclear, electrical, gravitational), sources of energy (e.g.,
Minnesota Stewardship Spatial Analysis Project Methodology and Analysis documentation January 28, 2008
 Minnesota Stewardship Spatial Analysis Project Methodology and Analysis documentation January 28, 2008 Summary In the fall of 2004, Minnesota DNR and the U.S. Forest Service began working together to create
Your Guide to Wind Generation
 Your Guide to Wind Generation The Statistics Wind energy is one of the fastest growing renewable energy sources in the world. The UK installed 1.7GW of new offshore wind capacity in 2017, growing by 25%
Social Acceptance of Wind Energy Projects
 Task 28 within IEA RD&D Wind Social Acceptance of Wind Energy Projects Winning Hearts and Minds March 16 th 2011 IEA Wind side event at EWEA 2011 Eric Lantz, NREL For Robert Horbaty, ENCO Energie-Consulting
REGIONAL CONTEXT STEUBEN COUNTY
 MAP 1/ REGIONAL CONTEXT t f a r D Steuben County s culture and economy has long been shaped by agriculture. Located in the Southern Tier of New York, rural Steuben County sits along the Pennsylvania border
The Tehachapi Renewable Transmission Project
 The Tehachapi Renewable Transmission Project GREENING THE GRID Celebrating California s Progress in Renewable Energy March 2010 Tehachapi Renewable Transmission Project: Leading the Way to a Greener Future
Department of Development Services Tim Snellings, Director Pete Calarco, Assistant Director AGENDA REPORT
 Department of Development Services Tim Snellings, Director Pete Calarco, Assistant Director 7 County Center Drive T: 530.538.7601 Oroville, California 95965 F: 530.538.7785 buttecounty.net/dds AGENDA REPORT
Proceedings, the Range Beef Cow Symposium XX December 11, 12, 13, 2007 Fort Collins, CO
 Proceedings, the Range Beef Cow Symposium XX December 11, 12, 13, 2007 Fort Collins, CO ANTAGONISMS AND PROTAGONISMS OF ALTERNATIVE ENERGY SOURCES AND THEIR EFFECTS ON RANCHERS By Leanne Stevenson Manager
Using GIS to Analyze Wind Turbine Sites within the Shakopee Public Utilities Electric Service Territory, Shakopee, MN USA
 Using GIS to Analyze Wind Turbine Sites within the Shakopee Public Utilities Electric Service Territory, Shakopee, MN USA Jay T. Berken Department of Resource Analysis, Saint Mary s University of Minnesota,
Environmental Science Sixth Edition
 Environmental Science Sixth Edition Daniel B. Botkin Edward A. Keller 978--47-499-7 CHAPTER 19 Alternative Energy and the Environment Introduction Fossil Fuels supply about 9% of energy All others are
Wind power... can compete with other power generation options at good sites.
 Debunking the myths The Myth: Wind power is expensive The Facts: Wind power... can compete with other power generation options at good sites. Wind cannot compete with the cost of producing electricity
THERE S SOMETHING IN THE AIR: A PRIMER ON WIND LEASES. by Robert P. Wright
 THERE S SOMETHING IN THE AIR: A PRIMER ON WIND LEASES by Robert P. Wright In order to understand the dynamics of a wind lease, it is useful to have some appreciation of the current state of the U.S. windpower
GREEN NORMS FOR WIND POWER. Potential Impacts and the Need for Green Norms
 GREEN NORMS FOR WIND POWER Potential Impacts and the Need for Green Norms INDIA WORLD RE: 1% Hydro 2% Biomass 34% Oil: 8% Coal, 43% Nuclear 6% Natural Gas: 21% Hydro 2% Biomass 10% RE 1% Oil: 32% Coal
The Leader in Wind Energy
 The Leader in Wind Energy About the Cover: The 159-megawatt Langdon Wind Energy Center in North Dakota is capable of generating enough electricity to power more than 47,000 homes. NextEra Energy Resources
We are here to:
 Welcome! We are here to: Provide an overview and update of the proposed wind energy project Introduce the Project team Review the wind project development process Answer your questions NextEra Energy Resources
Wind Energy Development for rural communities of color.
 Wind Energy Development for rural communities of color. ENERGY DEMOCRACY USING Wind ENERGY Development Upepo Energy Group Paul Reeves Upepo Energy Group Agenda Introduction UPEPO What is Energy Democracy?
Abstract. The renewable energy revolution
 Pumped Hydro Energy Storage and the Renewable Energy Revolution Professor Andrew Blakers Australian National University Andrew.blakers@anu.edu.au Ph 02 6125 5905 September 2015 Abstract In Australia and
Implications for Solar Energy Expansion
 Alex Nguyen November 30, 2015 PPD 631: GIS for Policy, Planning, and Development Barry Waite and Bonnie Shrewsbury Introduction Implications for Solar Energy Expansion The expansion of solar energy production
AN ORENDA WHITEPAPER. Rural Siting of Wind Turbines: Improve Performance and Mitigate Risk
 AN ORENDA WHITEPAPER Rural Siting of Wind Turbines: Improve Performance and Mitigate Risk Rural Siting of Wind Turbines - Improve Performance and Mitigate Risk Wind power is a clean energy source that
Environment and Climate Change
 Environment and Climate Change ALTERNATIVE FEDERAL BUDGET 2017 ENVIRONMENT AND CLIMATE CHANGE HIGH STAKES Climate change threatens the prosperity and well-being of all Canadians. The climate policy ambition
looking for some different options of where to go for renewable energy. Natural
 Kevin Diers IDS 102 Wind Energy With a major possible energy crisis on the horizon, the United States has been looking for some different options of where to go for renewable energy. Natural resources
Designing Energy Solutions
 Designing Energy Solutions without Borders Energy, Environmental Policy, & the Recession Impact of Proposed Federal Policies Illinois State University April 30, 2009 John Flynn, Managing Director-AEP Transmission
Energy : Expanding Clean Energy and Energy Efficiency Manitoba Helping the World
 Energy : Expanding Clean Energy and Energy Efficiency Manitoba Helping the World 16 Manitoba is fortunate to have access to many sources of renewable energy. Our provincial greenhouse gas (GHG) emissions
The Global Grid. Prof. Damien Ernst University of Liège December 2013
 The Global Grid Prof. Damien Ernst University of Liège December 2013 1 The Global Grid: what is it? Global Grid: Refers to an electrical grid spanning the whole planet and connecting most of the large
The Greening of Texas?
 The Greening of Texas? June 24, 2009 Jay Zarnikau, PhD Frontier Associates, LLC and University of Texas at Austin LBJ School of Public Affairs and College of Natural Sciences Questions.... Can one of the
Risks And Opportunities For PacifiCorp State Level Findings:
 Risks And Opportunities For PacifiCorp State Level Findings: Oregon Author: Ezra D. Hausman, Ph.D. A Risks and Opportunities for PacifiCorp, State Level Findings: Oregon Power Generation at Bonneville
Forest Stewardship Spatial Analysis Project Illinois Methodology March, 2007
 Forest Stewardship Spatial Analysis Project Illinois Methodology March, 2007 Project Summary Administered by the U.S. Forest Service and implemented by State forestry agencies, the Forest Stewardship Program
The Economic Impact of Wind Power Development
 University of Colorado, Boulder CU Scholar Undergraduate Honors Theses Honors Program Spring 2014 The Economic Impact of Wind Power Development Sam Smith University of Colorado Boulder Follow this and
Wild Horse Solar Photovoltaic Project
 Wild Horse Solar Photovoltaic Project Steven J. St.Clair Manager Renewable Assets Phone: 425-462-3057 Email: steven.stclair@pse.com November 19, 2009 Agenda Introduction PSE Renewable Energy Facilities
COVENANT UNIVERSITY NIGERIA TUTORIAL KIT OMEGA SEMESTER PROGRAMME: PHYSICS
 COVENANT UNIVERSITY NIGERIA TUTORIAL KIT OMEGA SEMESTER PROGRAMME: PHYSICS COURSE: PHY 229 DISCLAIMER The contents of this document are intended for practice and leaning purposes at the undergraduate level.
Coal is obtained from mines. It's a black solid material that must be transported by ships, trains or big trucks to the power plants where it's burnt
 Energy Sources Fossil Fuels Coal, Oil and Gas are called "fossil fuels" because they have been formed from the fossilized remains of prehistoric plants and animals. They provide most of the world's total
WEST COAST ENERGY PROPOSAL FOR BRAINT WIND FARM
 WEST COAST ENERGY PROPOSAL FOR BRAINT WIND FARM BRAINT WIND FARM: OUR PROPOSALS 1 2 3 Site Layout WEST COAST ENERGY IS PLEASED TO PRESENT ITS PROPOSALS FOR A WIND FARM ON ANGLESEY Ynys Môn Wind Energy
Site Suitability Analysis for Animal Manure Methane Digesters in California
 Introduction: Site Suitability Analysis for Animal Manure Methane Digesters in California Anaerobic manure digesters (also called methane digesters) collect manure and convert the energy stored in its
Tilting at Windmills: Wind Power in the Twenty-First Century. October 6, 2012
 Tilting at Windmills: Wind Power in the Twenty-First Century October 6, 2012 Tilting at Windmills Wind Tex Energy, LP Developed 4 projects currently in operation in Texas. These comprise 5-10% of current
Wind Energy Basics & Project Cycle
 Wind Energy Basics & Project Cycle Wind Energy Basics & Project Cycle 1.800.580.3765 WWW.TTECI.COM Pramod Jain, Ph.D. Presented to: DFCC Bank and RERED Consortia Members January 26 27, 2011 Colombo, Sri
GIS ANALYSIS FOR MULTICRITERIA RESERVOIR SITE SELECTION: NISP Project, Colorado
 presented at: 2011 ESRI International User Conference San Diego Convention Center San Diego, CA GIS ANALYSIS FOR MULTICRITERIA RESERVOIR SITE SELECTION: NISP Project, Colorado Johannes van Zyl and John
Wind Power and the Iowa Economy
 Executive Summary Wind Power and the Iowa Economy David Osterberg Elaine Ditsler October 2003 A report for The Iowa Policy Project 318 2nd Avenue North, Mount Vernon, Iowa 52314 319-643-3628 (phone) 319-895-0022
BC Hydro Wind Data Study Update
 PUBLIC DOCUMENT September 24, 2009 Prepared for: British Columbia Hydro & Power Authority 333 Dunsmuir Street Vancouver, BC V6B 5R3 DNV Global Energy Concepts Inc. 1809 7th Avenue, Suite 900 Seattle, Washington
APPENDIX R SHADOW FLICKER REPORT
 APPENDIX R SHADOW FLICKER REPORT Shadow Flicker Study Palo Alto Wind Energy Project - Palo Alto County, Iowa Prepared for: Palo Alto Wind Energy LLC One South Wacker Drive Suite 1800 Chicago, Illinois
Increasing Renewable Energy Generation in Kansas
 Increasing Renewable Energy Generation in Kansas The Feasibility and Economic Impacts of Achieving 50% Renewable Energy Generation June 2016 Executive Summary Increasing wind and solar development would
SYRACUSE SCIENCE AND TECHNOLOGY LAW REPORTER VOLUME 19. Wind Power in Europe: Politics, Business and Society
 SYRACUSE SCIENCE AND TECHNOLOGY LAW REPORTER VOLUME 19 Wind Power in Europe: Politics, Business and Society By: Joseph Szarka Citation: JOSEPH SZARKA, WIND POWER IN EUROPE: POLITICS, BUSINESS AND SOCIETY
Wind Energy Basics & Project Cycle
 Wind Energy Basics & Project Cycle WIND POWER PROJECT DEVELOPMENT PRACTICAL APPROACHES TO LAUNCHING SUSTAINABLE WIND PROJECTS October 18-19, 2011 1.800.580.3765 WWW.TTECI.COM Pramod Jain, Ph.D. Presented
TOP WIND ENERGY MYTHS #ACTONCLIMATE WIND MYTHS 1
 TOP WIND ENERGY MYTHS #ACTONCLIMATE WIND MYTHS 1 Today, cities, states, countries and companies around the world are increasingly turning to wind energy to power their everyday lives. As wind systems keep
ESD 28 th Annual Solid Waste Technical Conference
 Revenue Stream from Solar Photovoltaic Systems at Landfill Sites ESD 28 th Annual Solid Waste Technical Conference Lansing, Michigan April 11, 2018 ABOUT NOVA A Minority owned company, established in 1992
The Potential for Offshore Wind Power in the Southeast A Regional Approach
 The Potential for Offshore Wind Power in the Southeast A Regional Approach ASERTTI 2007 State & Local Clean Energy Forum 13 February 2007 Robert Leitner Associate Director South Carolina Institute for
Siting Guidelines for Windpower Projects in Kansas
 Siting Guidelines for Windpower Projects in Kansas The Kansas Renewable Energy Working Group Environmental and Siting Committee Introduction The Environmental and Siting Committee of the Kansas Renewable
Chapter 4 Agricultural Resources of Juniata and Mifflin Counties
 Chapter 4 Agricultural Resources of Juniata and Mifflin Counties Agricultural Resources of Juniata and Mifflin Counties Introduction Juniata and Mifflin Counties have significant farmland nestled between
Winter College on Optics and Energy February Solar energy strategy in AFRICA. A. Wague University Cheikh Anta Diop Dakar SENEGAL
 2132-35 Winter College on Optics and Energy 8-19 February 2010 Solar energy strategy in AFRICA A. Wague University Cheikh Anta Diop Dakar SENEGAL SOLAR ENERGY STRATEGY IN AFRICA Presentation at the LAM
Environmental Impact Assessment
 The Project Hoben International Ltd proposes to develop a single 500kW wind turbine at their Manystones Lane site near Brassington. The turbine will be located approximately 350m to the south east of the
The Impacts of Oil and Natural Gas Activities on ALR Land in the Peace River Valley of Northern British Columbia Katie Eistetter 2015
 The Impacts of Oil and Natural Gas Activities on ALR Land in the Peace River Valley of Northern British Columbia Katie Eistetter 2015 Introduction, Background and Study Area British Columbia has one of
Chapter 5 Renewable Energy. Helping to Sustainably Power the Town of Veteran into the Future
 Chapter 5 Renewable Energy Helping to Sustainably Power the Town of Veteran into the Future VISION: The Town of Veteran understands the potential to diversify their energy mix and is encouraging the deployment
A Utility Perspective on Coal Utilization and West Virginia s Electric Infrastructure
 A Utility Perspective on Coal Utilization and West Virginia s Electric Infrastructure James R. Haney VP, Compliance and Regulated Services December 10, 2012 About FirstEnergy (FE) Headquartered in Akron,
108+ MW Wind Energy Farm in NE Colorado In Logan County, Colorado
 108+ MW Wind Energy Farm in NE Colorado In Logan County, Colorado Phase 1: $200,000,000 wind farm venture to produce 40 to 46 MW per year of clean renewable energy at roughly 6 cents per KW. Projection
Solar Energy Supporting the rural community
 Solar Energy Supporting the rural community 1 Welcome With a portfolio of over 9,000 acres and 2 GW of solar energy capacity under management, Lightsource Renewable Energy has become a trusted solar partner
HOW CAN THE SUN S ENERGY BE USED?
 SOURCES OF ENERGY HOW CAN THE SUN S ENERGY BE USED? Most of the living things on Earth obtain their energy directly or indirectly from the Sun. Humans consume solar energy by eating plants and animals.
4.2.3 Regulatory Setting
 4.2.3 Regulatory Setting Federal State Farmland Protection Policy Act (7 U.S.C. Section 4201) The purpose of the Farmland Protection Policy Act (FPPA) is to minimize the extent to which federal programs
2012 TRANSMISSION PLANNING WIND INTEGRATION CHALLENGES IN KANSAS AND DEVELOPMENT CONFERENCE
 2012 TRANSMISSION PLANNING AND DEVELOPMENT CONFERENCE WIND INTEGRATION CHALLENGES IN KANSAS NOMAN WILLIAMS V.P. TRANSMISSION POLICY SUNFLOWER ELECTRIC POWER CORPORATION SEPTEMBER 12, 2012 Outline Who are
WIND BRINGS JOBS AND ECONOMIC DEVELOPMENT TO ALL 50 STATES
 WIND BRINGS JOBS AND ECONOMIC DEVELOPMENT TO ALL 50 STATES ISSUE DATE March 9, 2017 PREPARED BY American Wind Energy Association 1501 M St. NW, Suite 1000 Washington, DC 20005 Chad Heggen Wind Turbine
Clean Energy for ALL
 Clean Energy for ALL The importance of new emerging power generating technologies and others can't be over-stated. For the past 120 years, the world has been powered by fossil fuel and the terrible scars
A Visualization of Water Resources in Montgomery County, Texas By James Bronikowski
 A Visualization of Water Resources in Montgomery County, Texas By James Bronikowski Introduction: Groundwater has been a cheap reliable source of water since people first began settling the upper gulf
PERCEPTIONS OF THE IMPACT OF WIND ENERGY GENERATION IN COASTAL COMMUNITIES
 PERCEPTIONS OF THE IMPACT OF WIND ENERGY GENERATION IN COASTAL COMMUNITIES Policy Priorities prepared by the msu land policy institute and the great lakes commission July 22, 2011 Introduction Wind energy
Photovoltaic cells transfer light energy to electrical energy. The electricity company pays the householder for the energy transferred.
 Q1.Solar panels are often seen on the roofs of houses. (a) Describe the action and purpose of a solar panel............. (b) Photovoltaic cells transfer light energy to electrical energy. In the UK, some
PRINCE GEORGE NATURAL AREAS AND THE EFFECTS OF CLIMATE CHANGE: CASE STUDY
 PRINCE GEORGE NATURAL AREAS AND THE EFFECTS OF CLIMATE CHANGE: CASE STUDY Natural Areas in Prince George The City of Prince George is dominated by natural, undeveloped areas within city limits and in adjacent
california CCS coalition Created to represent CCS industry to ensure CCS is part of state s carbon stabilization program. Bring voices to the table th
 california CCS coalition A Voice for California s CCS Industry SUPPORTING THE DEPLOYMENT OF CCS TECHNOLOGIES THROUGHOUT CALIFORNIA california CCS coalition Created to represent CCS industry to ensure CCS
Harnessing the sun s energy to power our future.
 Installing a well designed Solar Matters PV system on your property or building will protect you from increasing electricity prices, increase the value of the property, and help keep our environment clean.
Highlights and Key Results
 Highlights and Key Results June 15, 2015 Eric Lantz National Renewable Energy Laboratory 1 Program Name or Ancillary Text eere.energy.gov Wind Vision: Goals Understand the potential role of wind power
Berkeley Climate Action Coalition Community Choice Energy Economic Development for Our Communities
 Berkeley Climate Action Coalition Community Choice Energy Economic Development for Our Communities By Local Clean Energy Alliance What is Community Choice Energy? It s about electricity: Where our electricity
Conflicts of Location in the Rural-Urban Fringe Area
 2012, TextRoad Publication ISSN 2090-4304 Journal of Basic and Applied Scientific Research www.textroad.com Conflicts of Location in the Rural-Urban Fringe Area 1 Imma Widyawati Agustin, 2 Hisashi Kubota
An Exploration of the Present and Future State of Concentrated Solar Power in the U.S. Southwest. Reber, Joseph E. 12/11/2012
 An Exploration of the Present and Future State of Concentrated Solar Power in the U.S. Southwest Reber, Joseph E. 12/11/2012 Table of Contents Abstract...1 Introduction...1 CSP Technology...2 Parabolic
Renewable Energy: Wind Energy
 Environmental Policy Renewable Energy: Wind Energy Prof. C. San Juan Annika Karstadt, Martin Galonska Wind energy - Agenda 1 2 3 4 5 What is renewable energy Wind energy Wind farms EU policy (White Paper
Deriving Harvestable Area in Arcata Community Forest
 Deriving Harvestable Area in Arcata Community Forest By: Abstract Kittens with Mittens Corey Humphrey and Taylor Jensen The Arcata Community Forest (ACF), along with education and recreation, is used for
4.11 AGRICULTURAL RESOURCES INTRODUCTION ENVIRONMENTAL SETTING. Regional. Project Site Setting
 4.11 AGRICULTURAL RESOURCES 4.11.1 INTRODUCTION This section addresses the potential for the Proposed Project to impact the agricultural resources in and around the Proposed Project location. Following
Pricing Carbon in Oregon:
 I S S U E B R I E F Pricing Carbon in Oregon: Potential Implications for Oregon Agriculture Lydia Mendoza Camila Rodriguez Taylor Brian Kittler June 2018 Leadership in Conservation Thought, Policy and
Wind Power Land Use and Policy Issues. M. Klepinger, Land Policy Institute Michigan State University
 Wind Power Land Use and Policy Issues M. Klepinger, Land Policy Institute Michigan State University 1 Interest in Wind Power Why is everyone talking about wind power? 1. Farmers and large tract owners,
Outlook on Solar Energy
 Rio 6 World Climate & Energy Event Rio de Janeiro, Brazil 17th and 18th of November, 2006 Outlook on Solar Energy Hansjörg Gabler Zentrum für Sonnenenergie- und Wasserstoff-Forschung (ZSW) Baden-Württemberg
Carbon-Free and Nuclear-Free: A Roadmap for U.S. Energy Policy. Arjun Makhijani, Ph.D. January 15,
 Carbon-Free and Nuclear-Free: A Roadmap for U.S. Energy Policy Arjun Makhijani, Ph.D. January 15, 2008 301-270-5500 www.ieer.org ieer@ieer.org Energy framework must address multiple issues Climate Oil
Welcome to our Open House!
 Welcome to our Open House! Please sign in at the front desk and provide your contact information if you would like to receive project updates. We invite you to walk around and look at the displays. If
Basic Policy for Nature Restoration
 Basic Policy for Nature Restoration Basic Directions for Promotion of Nature Restoration (1) Status of Japan s Natural Environment The natural environment, based on biodiversity and a natural material