DEPARTMENT OF THE NAVY
|
|
|
- Noah Butler
- 6 years ago
- Views:
Transcription
1 DEPARTMENT OF THE NAVY TECHNICAL GUIDELINES FOR EVALUATING MONITORED NATURAL ATTENUATION OF PETROLEUM HYDROCARBONS AND CHLORINATED SOLVENTS IN GROUND WATER AT NAVAL AND MARINE CORPS FACILITIES Prepared for: Southwest Division Naval Facilities Engineering Command Southern Division Naval Facilities Engineering Command Engineering Field Activity, Northwest In Cooperation with: Northern Division Naval Facilities Engineering Command Atlantic Division Naval Facilities Engineering Command Pacific Division Naval Facilities Engineering Command Engineering Field Activity, Chesapeake Engineering Field Activity, West Naval Facilities Engineering Service Center Prepared by: Parsons Engineering Science, Inc. Pasadena, California and United States Geological Survey Columbia, South Carolina SEPTEMBER 1998
2 EXECUTIVE SUMMARY This document provides guidance for Navy and Marine Corps Remedial Project Managers (RPMs) and their contractors on how to assess natural attenuation as a remedial strategy for ground-water systems contaminated with petroleum hydrocarbons and/or chlorinated solvents. Common natural attenuation processes include dispersion, dilution, sorption, hydrolysis and biodegradation. Of these processes, biodegradation is the most common mechanism causing the transformation of contaminants to nontoxic products such as carbon dioxide. Because of this, this document places more emphasis on biodegradation than other natural attenuation processes. Natural attenuation processes act to decrease concentrations of dissolved petroleum hydrocarbon and chlorinated solvent contaminants as they are transported by flowing ground water. The efficiency of natural attenuation processes, as defined in this document, refers to a quantitative comparison of contaminant transport rates to rates of biodegradation. If rates of biodegradation are fast relative to rates of transport, contaminant migration will be highly restricted, and the efficiency of natural attenuation will be relatively high. Conversely, if rates of biodegradation are slow relative to transport rates, contaminants will not be as restricted, and the efficiency of natural attenuation will be relatively low. When natural attenuation efficiency is high, contaminant transport to sensitive receptor exposure points may be prevented, and natural attenuation can be an effective part of overall site remediation. Conversely, when natural attenuation efficiency is low, contaminants may move freely and reach receptor exposure points. In this case, natural attenuation may not be the sole remedy but could be an appropriate component of a remedial strategy. Because the conditions that affect biodegradation of petroleum hydrocarbons and chlorinated solvents are well-known, it is possible to assess the efficiency of natural attenuation with a high degree of confidence. Assessing the efficiency of natural attenuation requires information on (1) concentrations of contaminants and daughter products in space and/or time; (2) ambient geochemical conditions such as the reduction/oxidation (redox) state of ground water; (3) rates and directions of groundwater flow; (4) rates of contaminant biodegradation; and (5) demographic considerations such as presence of nearby receptor exposure points. This document outlines the chemical, hydrologic, and biologic data needed to assess the efficiency of natural attenuation, and provides guidance on how to use these data to determine if natural attenuation would be a viable component of site remediation. It is recognized that natural attenuation often will be used in conjunction with engineered actions to remove a non-aqueous-phase source of dissolved contamination. Long-term monitoring is always part of a remediation system that includes natural attenuation as a component (USEPA, 1997). This document also provides guidance for establishing groundwater monitoring networks to document the long-term performance of remedial systems that include natural attenuation as part of the overall site remediation strategy. ES-1
3 TABLE OF CONTENTS 1.0 Purpose and Scope Overview of Natural Attenuation Biodegradation of Petroleum Hydrocarbons Biodegradation of Chlorinated Solvents Assessing the Efficiency of Natural Attenuation Documented Loss of Contaminant Mass - Time versus Space Geochemical Conditions Chemical Data Needed to Assess Natural Attenuation Kinetic Evaluation of Intrinsic Biodegradation The use of Laboratory Studies A Weight-of-Evidence Approach for Dealing With Uncertainty Natural Attenuation of Petroleum hydrocarbons Introduction Methods for Evaluating Natural Attenuation of Petroleum Hydrocarbons Natural Attenuation of Chlorinated Solvents Introduction Background Information Delineating Terminal Electron-Accepting Processes in Ground-Water Systems Organic Carbon Substrates that Support Reductive Dechlorination Daughter Products as indicators of Reductive Dechlorination Methodology for Evaluating the Efficiency of Natural Attenuation of Chlorinated Ethenes Implementing Long-Term Monitoring Placement of Long-Term Monitoring and Contingency Wells, Analytical Requirements, and Sampling Frequency Interactions Between Natural Attenuation and Engineered Remediation Systems Contingency Plans Exit Strategy References APPENDIX A: Natural Attenuation of Petroleum Hydrocarbons - A Case Study APPENDIX B: Natural Attenuation of Chlorinated Solvents - A Case Study i
4 Glossary of Terms Aerobe: Bacteria that use oxygen as an electron acceptor. Anaerobe: Organisms that can use electron acceptors other than molecular oxygen to support their metabolism. Anoxic ground water: Ground water that contains oxygen in concentrations less than about 0.5 mg/l. This term is synonymous with the term anaerobic. Anthropogenic: Man-made. Cometabolism: The process in which a compound is fortuitously degraded by an enzyme or cofactor produced during microbial metabolism of another compound. Daughter Product: A compound that results directly from the biodegradation of another. For example cis-1,2-dichloroethene (cis-1,2-dce) is commonly a daughter product of trichloroethene (TCE). Diffusion: The process whereby molecules move from a region of higher concentration to a region of lower concentration as a result of Brownian motion. Dispersion: The tendency for a solute to spread from the path that it would be expected to follow under advective transport. Dispersivity: A property that quantifies the physical dispersion of a solute being transported in a porous medium. Effective Porosity: The percentage of void space that is available for fluid flow. Electron Acceptor: A compound capable of accepting electrons during oxidation-reduction reactions. Microorganisms obtain energy by transferring electrons from electron donors such as organic compounds (or sometimes reduced inorganic compounds such as sulfide) to an electron acceptor. Electron acceptors are compounds that are relatively oxidized and include oxygen, nitrate, Fe(III), Mn(IV), sulfate, carbon dioxide, or in some cases the chlorinated aliphatic hydrocarbons such as perchloroethene (PCE), TCE, DCE, and vinyl chloride. Electron Donor: A compound capable of supplying (giving up) electrons during oxidationreduction reactions. Microorganisms obtain energy by transferring electrons from electron donors such as organic compounds (or sometimes reduced inorganic compounds such as sulfide) to an electron acceptor. Electron donors are compounds that are relatively reduced and include fuel hydrocarbons and native organic carbon. Facultative Anaerobes: Microorganisms that use (and prefer) oxygen when it is available, but can also use alternate electron acceptors such as nitrate under anoxic conditions when necessary. Fermentation: Microbial metabolism in which a particular compound is used both as an electron donor and an electron acceptor resulting in the production of oxidized and reduced daughter products. Heterotroph: An organism that uses organic carbon as an external energy source and as a carbon source. ii
5 Hydraulic Conductivity: The relative ability of a unit cube of soil, sediment, or rock to transmit water. Hydraulic Head: The height above a datum plane of the surface of a column of water. In the ground-water environment, it is composed dominantly of elevation head and pressure head. Hydraulic Gradient: The maximum change in head per unit distance. Mechanical Dispersion: A physical process of mixing along a flow path in an aquifer resulting from differences in path length and flow velocity. This is in contrast to mixing due to diffusion. Metabolic Byproduct: A product of the reaction between an electron donor and an electron acceptor. Metabolic byproducts include volatile fatty acids, daughter products of chlorinated aliphatic hydrocarbons, methane, and chloride. Obligate Aerobe: Microorganisms that can use only oxygen as an electron acceptor. Thus, the presence of molecular oxygen is a requirement for survival and growth of these microbes. Obligate Anaerobes: Microorganisms that grow only in the absence of oxygen; the presence of molecular oxygen either inhibits growth or kills the organism. For example, methanogens are very sensitive to oxygen and can live only under strictly anoxic conditions. Sulfate reducers, on the other hand, can tolerate exposure to oxygen, but cannot grow in its presence (Chapelle, 1993). Oxic ground water: Ground water that contains oxygen in concentrations greater than about 0.5 milligram per liter (mg/l). Reduction/Oxidation Reactions: A chemical or biological reaction wherein an electron is transferred from and electron donor to an electron acceptor. Porosity: The ratio of void volume to total volume of a rock or sediment. Predominant Terminal Electron-Accepting Process: The electron-accepting process (oxygen reduction, nitrate reduction, Fe(III) reduction, etc.) that sequesters the majority of the electron flow in a given system. Reductive Dechlorination: Reduction of a chlorine-containing organic compound via the replacement of chlorine with hydrogen. Respiration: The process of coupling the oxidation of organic compounds with the reduction of inorganic compounds, such as oxygen, nitrate, Fe(III), Mn(IV), and sulfate. Seepage Velocity: The average velocity of ground water in a porous medium. Substrate: A compound used by microorganisms to obtain energy for growth. The term can refer to either an electron acceptor or an electron donor. iii
6 List of Acronyms and Abbreviations AFB: Air Force Base ASTM: American Society for Testing and Materials BTEX: benzene, toluene, ethylbenzene, and xylenes cm 2 : square centimeter(s) CO 2 : carbon dioxide CT: carbon tetrachloride DCE: dichloroethene, dichloroethylene DOC: dissolved organic carbon DQO: data quality objective Fe(II): ferrous iron Fe(III): ferric iron ft/d: feet per day ft 2 /d: square feet per day IC: ion chromatography L: liter(s) LLNL: Lawrence Livermore National Laboratory µg: microgram(s) µs: microsiemen(s) MCL: maximum contaminant level mg: milligram(s) Mn(II): soluble manganese Mn(IV): manganese oxide MTBE: methyl tert-butyl ether mv: millivolt(s) NAPL: nonaqueous phase liquid ORP: oxidation/reduction potential PCE: perchloroethene, perchloroethylene, tetrachloroethene POC: particulate organic carbon Redox: reduction/oxidation RPM: remedial project manager SW: solid waste iv
7 TCA: trichloroethane TCE: trichloroethene, trichloroethylene TOC: total organic carbon USEPA: United States Environmental Protection Agency VC: vinyl chloride VOC: volatile organic compound v
8 SECTION 1 PURPOSE AND SCOPE Monitored natural attenuation is the use of naturally occurring, contaminant degrading and dispersing processes combined with environmental monitoring to remediate contaminated ground water. Natural attenuation processes occur in all ground-water systems, but their effectiveness varies considerably from site to site and among different kinds of contaminants. It often is difficult to identify those sites where monitored natural attenuation is appropriate, and just as importantly, those sites where natural attenuation is not appropriate, as a remedial strategy. The purpose of this document is to: 1) Provide a concise overview of natural attenuation; 2) Describe how the efficiency of natural attenuation of petroleum hydrocarbons and chlorinated solvents can be assessed ; 3) Identify the hydrologic and geochemical data needed to make these assessments; and 4) Summarize the monitoring requirements needed to verify the effectiveness of natural attenuation. The efficiency of natural attenuation depends on particular hydrologic and geochemical characteristics of the ground-water system into which the contaminants have been introduced. This makes it possible to assess the efficiency of natural attenuation using a few general hydrologic, geochemical, and biological principles. It is not possible to assess natural attenuation at all sites using exactly the same procedures. It is possible, however, to identify guidelines that can be applied to a wide variety of hydrologic conditions. This document is intended to provide this general guidance. Ultimately, the accurate assessment of natural attenuation will rely as much on the sound professional judgment of the practitioner responsible for the assessment as on the guidelines being followed. 1-1
9 SECTION 2 OVERVIEW OF NATURAL ATTENUATION Natural attenuation processes (biodegradation, dispersion, dilution, sorption, volatilization, and abiotic degradation mechanisms) affect the fate and transport of petroleum hydrocarbons and chlorinated solvents in all hydrologic systems. When these processes are shown to be protective of human health and the environment, and when an adequate monitoring program is in place to document the effectiveness of these processes, they can be used as an exclusive remedy or as a component of an engineered remedy at a site. Monitored natural attenuation is a term that refers specifically to the use of natural attenuation processes as part of overall site remediation. The United States Environmental Protection Agency (USEPA, 1997) defines monitored natural attenuation as follows: The term monitored natural attenuation, as used in this Directive, refers to the reliance on natural attenuation processes (within the context of a carefully controlled and monitored site clean-up approach) to achieve site-specific remedial objectives within a time frame that is reasonable compared to that offered by other more active methods. The natural attenuation processes that are at work in such a remediation approach include a variety of physical, chemical, or biological processes that, under favorable conditions, act without human intervention to reduce the mass, toxicity, mobility, volume, or concentration of contaminants in soil or groundwater. These insitu processes include biodegradation; dispersion; dilution; sorption; volatilization; and chemical or biological stabilization, transformation, or destruction of contaminants. In practice, natural attenuation also is referred to by several other names, such as intrinsic remediation, intrinsic bioremediation, natural restoration, or passive bioremediation. Natural attenuation processes are dominant factors in the fate and transport of contaminants. Biodegradation processes are of special importance in natural attenuation because they reduce the mass of contaminants and generally transform toxic contaminants to nontoxic byproducts. Therefore, biodegradation mechanisms are the principal focus of this document. Additional useful guidance documents for evaluating natural attenuation include McCallister and Chiang (1994), Buscheck and O Reilly (1995), Wiedemeier et al., (1995a and 1996a), and Chapelle et al. (1996b). 2.1 BIODEGRADATION OF PETROLEUM HYDROCARBONS Over the past two decades, numerous laboratory and field studies have shown that hydrocarbon-degrading microorganisms are ubiquitous in the subsurface environment, and that these microorganisms can degrade a variety of organic compounds, including components of gasoline, kerosene, diesel, jet fuel, and many other petroleum hydrocarbons. Recent research conducted by the Lawrence Livermore National Laboratory (LLNL, Rice et al., 1995) and the 2-1
10 Texas Bureau of Economic Geology (Mace et al., 1997) shows that about 85 to 90 percent or more of the dissolved fuel hydrocarbon plumes present in the shallow subsurface of the United States are at steady-state equilibrium, or are receding. Petroleum hydrocarbons are biodegraded via biological oxidation when electron donors and electron acceptors are combined to produce energy for microbial growth (and metabolic byproducts). In general, fuel hydrocarbon biodegradation proceeds via the following generalized equation: Electron Donor + Electron Acceptor Metabolic Byproducts + Energy Petroleum hydrocarbons serve as electron donors in microbial metabolism. Electron acceptors include oxygen, nitrate, Mn(IV), Fe(III), sulfate, and carbon dioxide. Carbon dioxide, water, nitrogen gas, Mn(II), Fe(II), hydrogen sulfide, and methane are some of the metabolic byproducts typically produced from the biodegradation of petroleum hydrocarbons. The biodegradation of petroleum hydrocarbons, especially benzene, toluene, ethylbenzene, and xylenes (BTEX), is mainly limited by electron acceptor availability, and generally will proceed until all of the contaminants that are biochemically accessible to the microbes are oxidized. It is generally observed that an adequate supply of electron acceptors is present in most, if not all, hydrogeologic environments (Wiedemeier et al., 1995b and 1998). Methyl tert-butyl ether (MTBE), a fuel oxygenate that has been added to gasoline since the early 1970s, also is susceptible to microbially mediated degradation processes. However, because MTBE is a relatively oxidized compound, it is an inefficient electron donor in microbial metabolism. Field studies have shown that while MTBE biodegrades in ground-water systems, its degradation is less efficient than degradation of BTEX compounds (Borden et al., 1997; Landmeyer et al., 1998). 2.2 BIODEGRADATION OF CHLORINATED SOLVENTS In contrast to the simple biological oxidation of petroleum hydrocarbons, where contaminants are used exclusively as electron donors, the common chlorinated solvents such as perchloroethene, (PCE), trichloroethene (TCE), trichloroethane (TCA), and carbon tetrachloride (CT) are biodegrade by predominantly reductive processes. Reductive dechlorination, which is typically the initial step in biodegradation, requires an adequate supply of electron donors. These electron donors can include petroleum hydrocarbons or other types of anthropogenic carbon (e.g., landfill leachate) as well as natural organic carbon. Furthermore, the organic carbon driving reductive dechlorination can be either dissolved or particulate. Once degradation has commenced via reductive dechlorination, reduced daughter products such as dichloroethene (DCE) or vinyl chloride (VC) can be further degraded by direct oxidation. In addition to direct oxidation and reduction, chlorinated ethenes can be degraded by cometabolic processes. Specific cometabolic processes, such as in the methane monoxygenase system (McCarty and Semprini, 1994), can be important in some natural environments. It is more common, however, for growthsupporting oxidation or reduction to dominate in natural systems. In general, the efficient degradation of chlorinated solvents is facilitated by initial reducing conditions, followed by oxidizing conditions as contaminants are transported along ground-water flowpaths. 2-2
11 Because of the complex nature of these reductive/oxidative degradation pathways, the behavior of chlorinated solvents in ground-water systems is more variable than that of petroleum hydrocarbons. Thus, it is important to have a good understanding of the interactions among chlorinated aliphatic hydrocarbons, anthropogenic or natural carbon, dissolved and/or particulate organic carbon, and inorganic electron acceptors at the site. Site-specific characterization is the only way to adequately document and understand these processes. 2-3
12 SECTION 3 ASSESSING THE EFFICIENCY OF NATURAL ATTENUATION The efficiency of natural attenuation can be defined in terms of rates of contaminant attenuation relative to rates of contaminant transport. If rates of contaminant attenuation are fast relative to rates of contaminant transport, the efficiency of natural attenuation is relatively high. Conversely, if rates of attenuation are slow relative to rates of transport, the efficiency of natural attenuation is relatively low. The two most practical lines of evidence for assessing the efficiency of natural attenuation are (Wiedemeier et al., 1996a): 1) Historical ground-water chemistry data showing plume stabilization and/or loss of contaminant mass over time. 2) Ground-water chemistry data showing that geochemical conditions are suitable for biodegradation, and that active biodegradation has occurred as indicated by the consumption of electron acceptors and/or the production of final products. These chemical and geochemical analytical data can include evidence of - depletion of electron acceptors and donors - increasing metabolic byproduct concentrations - decreasing parent compound concentrations - increasing daughter compound concentrations. The first line of evidence involves using historical ground-water-chemistry data to show that the contaminant plume is shrinking, stable, or growing at a rate slower than predicted by groundwater seepage velocity calculations. In some cases a biologically recalcitrant (nonreactive or conservative) tracer commingled within the contaminant plume (e.g., trimethylbenzene) can be used to show that a reduction in contaminant mass is occurring and to estimate biodegradation rate constants (Wiedemeier et al., 1996b). When microorganisms degrade organic contaminants in the subsurface they cause measurable changes in soil and ground-water chemistry. The second line of evidence involves documenting these biochemical and geochemical changes. The first line of evidence shows that the contaminant plume is being attenuated, and in some cases can show that contaminant mass is being destroyed. The second line of evidence can show that the geochemical conditions are either favorable or unfavorable for biodegradation to occur. 3.1 DOCUMENTED LOSS OF CONTAMINANT MASS - TIME VERSUS SPACE An historical database showing plume stabilization and/or loss of contaminant mass over time can be used to show that natural attenuation is occurring at a site. This is perhaps the best line of evidence to support selection of monitored natural attenuation as a remediation approach. Database adequacy is determined on a site by site basis. 3-1
13 A useful method for presenting historical data is to prepare isopleth maps of contaminant concentrations in space and/or time. It is important to consider that incomplete site characterization may bias the interpretation of these isopleth maps. Figure 3.1 shows isopleth maps of total VOC concentrations in ground water at the depth of highest contaminant concentrations. Note that the multi-year contaminant data were collected during approximately the same seasonal time period. This is important because seasonal variations in aquifer recharge can cause significant changes in contaminant concentrations and ground-water geochemistry. Thus, an apparent reduction in plume size and/or contaminant concentrations could be the result of a seasonal phenomenon, and may not reflect a significant overall trend in contaminant concentrations. Also plotted on Figure 3.1 is the projected extent of contamination if biodegradation were not occurring. These projections were made using a fate and transport model that incorporated the effects of advection, dispersion, and sorption only; biodegradation was assumed not to occur in these simulations. Model predictions suggest that if biodegradation were not occurring at this site, the plume would advance approximately 1,500 feet per year. Because chemical data show that this is not the case, plume stabilization is likely the result of biodegradation. Such an analysis provides credible evidence for the occurrence of ongoing biodegradation. 3.2 GEOCHEMICAL CONDITIONS The efficiency of petroleum hydrocarbon and chlorinated solvent biodegradation varies under different geochemical conditions (Chapelle, 1996; Wiedemeier et al., 1998). Biodegradation of petroleum hydrocarbons, for example, occurs more rapidly under oxic (aerobic) conditions than under anoxic (anaerobic) conditions. In contrast, some chlorinated solvents (such as PCE) degrade more efficiently under anoxic conditions, while others (such as VC) degrade more efficiently under oxic conditions. Documenting the geochemical conditions present at a site, specifically the sequence of redox processes along ground-water flowpaths, provides important information about the occurrence or non-occurrence of biodegradation processes. 3.3 CHEMICAL DATA NEEDED TO ASSESS NATURAL ATTENUATION In order to assess the second line of evidence for evaluating natural attenuation it is necessary to characterize the ground-water chemistry, both within and outside the contaminant plume. The first line of evidence is collected by directly measuring contaminant concentrations over space and- time. But the biodegradation of organic compounds also brings about distinct and measurable changes in ground-water geochemistry. Documenting these changes can provide the information necessary to assess the occurrence and efficiency of specific biodegradation processes. Table 3.1 presents ground-water analytical parameters that can be used to assess and quantify natural attenuation, including biodegradation, for petroleum hydrocarbons and chlorinated solvents. The data collection process should be conducted in accordance with the data quality objectives process outlined by USEPA (1994) and summarized in Table 3.2. Conforming with this process will ensure that the data collected are appropriate for evaluating natural attenuation at individual sites. 3-2
14 3-3
15 Table 3.1 Ground-Water Analyses for Assessing Natural Attenuation (From Wiedemeier et al., 1996a)* Analysis Method/Reference Comments Data Use SW-846 Method Analysis may be 8020 (sites with extended to highermolecular-weight petroleum alkyl hydrocarbons only) benzenes. SW-846 Method 8260B (sites with chlorinated solvents or mixed solvents/petroleum hydrocarbons) Aromatic and chlorinated hydrocarbons (BTEX, trimethylbenzene isomers, chlorinated compounds) and MTBE Oxygen (O 2 ) Nitrate (NO - 3) Soluble Manganese [Mn(II)] Ferrous Iron [Fe(II)] Dissolved oxygen meter calibrated in the field according to the supplier s specifications Ion chromatography (IC) method E300 Colorimetric Hach Company Method 8149 Colorimetric Hach Company Method 8146 Refer to American Society for Testing and Materials (ASTM) Method A4500 for a comparable laboratory procedure. Can be done in the field, but analysis by a fixed-base laboratory is recommended. Filter if turbidity interferes with analysis. Filter if turbidity interferes with analysis. Sulfate (SO 2-4 ) IC method E300 Do not use the field method if this method is used. Sulfate (SO 4 2- ) Hydrogen Sulfide (H2S) Methane (CH 4 ), ethane a/, and ethene a/ Dissolved Inorganic Carbon Hach Company Method 8051 Color Disk Methylene Blue Method Kampbell et al. (1989) or SW-846 Method 3810 Modified Can be estimated from alkalinity and ph (Hach alkalinity test kit model AL AP MG- L) Colorimetric, do not use the fixed-base laboratory method if this method is used. Hach Catalog Number Method published by researchers at the USEPA. Limited to few commercial labs. Phenolphthalein method. Method of analysis for BTEX, MTBE, and chlorinated solvents/byproducts, which are the primary target analytes for monitoring natural attenuation; method can be extended to higher molecular weight alkylbenzenes; trimethylbenzenes are used to monitor plume dilution if degradation is primarily anoxic. Concentrations generally <0.5 mg/l generally indicate an anoxic pathway. Substrate for microbial respiration if oxygen is depleted. May indicate an anoxic degradation process due to depletion of oxygen and nitrate. May indicate an anoxic degradation process due to depletion of oxygen, nitrate, and manganese. Substrate for anoxic microbial respiration. Substrate for anoxic microbial respiration. The presence of H 2 S suggests biodegradation via sulfate reduction. The presence of CH 4 suggests biodegradation via methanogenesis. Ethane and ethene data are used where chlorinated solvents are suspected of undergoing biological transformation. Dissolved inorganic carbon is a byproduct of organic carbon oxidation and indicates the difference in microbial oxidation processes inside versus outside a contaminant plume. Field or Fixed-Base Laboratory Fixed-base Field Fixed-base Field Field Fixed-base Field Field Fixed-base Field 3-4
16 Table 3.1 (Concluded) Ground-Water Analyses for Assessing Natural Attenuation (From Wiedemeier et al., 1996a) Analysis Method/Reference Comments Data Use Total Organic SW-846 Method 9060 To determine the potential for Carbon reductive dechlorination. Oxidation/reducti ASTM Method on potential A2580B (ORP) Measurements made with electrodes and meter; protect samples from oxygen. Report results against the hydrogen electrode (Eh) by adding a correction factor specific to the electrode used. Chloride (Cl - ) IC method E300 SW-846 Method 9050 may also be used. ph Temperature Conductivity Hydrogen (H2) a/ Field probe with direct-reading meter calibrated in the field according to the supplier s specifications Field probe with direct-reading meter E120.1/SW-846 Method 9050, direct reading meter Equilibration with gas in the field; determined with a reduction gas detector. (Chapelle et al., 1997) Field. The ORP of ground water reflects the relative oxidizing or reducing nature of the ground-water system. ORP is influenced by the nature of the biologically mediated degradation of contaminants, and may range from 800 millivolts (mv) (oxygenated) to less than -400 mv (strongly reducing). Chloride is released during reductive dechlorination. Aerobic and anoxic processes are ph-sensitive. Field or Fixed-Base Laboratory Fixed-base Field Fixed-base Field Field only. Well purging. Field Optional specialized analysis. General water quality parameter used as a marker to verify that site samples are obtained from the same groundwater system. Determine terminal electron accepting process. Predicts the possibility for reductive dechlorination. NOTES: * These methods are commonly used for these analyses. Other analytical methods may be required to meet site-specific data quality objectives. a/ For use at sites with chlorinated solvents; not widely available at this time, but is expected to become more available in the future. Field Field 3-5
17 Table 3.2 Data Quality Objectives to Implement the Natural Attenuation Guidelines (From Wiedemeier et al., 1996a) Analysis Minimum Limit Precision Potential Data Quality Problems of Quantification Aromatic and chlorinated hydrocarbons (BTEX, Lesser of maximum contaminant levels Coefficient of variation 10 percent. Volatilization during shipment and biodegradation due to improper packaging/preservation. trimethylbenzene isomers, chlorinated compounds) and MTBE (MCLs) or riskbased screening levels Oxygen 0.2 mg/l +/- 0.2 mg/l. Improperly calibrated electrodes or bubbles behind the membrane, a fouled membrane, or introduction of atmospheric oxygen during sampling. Nitrate 0.1 mg/l +/- 0.1 mg/l. Must be preserved. Mn(II) 0.1 mg/l Coefficient of variation 20 percent. Fe(II) 0.5 mg/l Coefficient of variation 20 percent. Sulfate 5 mg/l Coefficient of variation 20 percent. Hydrogen Sulfide 0.5 mg/l Coefficient of variation 20 percent. Methane, ethane, and 1 µg/l. Coefficient of variation ethene 20 percent. Possible interference from turbidity (must filter if turbid). Protect from sunlight and analyze within minutes of collection. Possible interference from turbidity (must filter if turbid). Protect from sunlight and analyze within minutes of collection. Fixed-base. Possible interference from turbidity (must filter if turbid). Keep sample cool. Method standard operating procedure must be thoroughly understood by the laboratory before sample submittal. Sample must be preserved against biodegradation and collected without headspace (to minimize volatilization). 3-6
18 Table 3.2 (Concluded) Data Quality Objectives to Implement the Natural Attenuation Guidelines (From Wiedemeier et al., 1996a) Analysis Dissolved inorganic carbon Oxidation/reduction potential Minimum Limit of Precision Potential Data Quality Quantification Problems 1 mg/l Standard deviation 20 percent Analyze sample within 1 hour of collection. +/- 300 mv +/-+/- 50 mv Improperly calibrated electrodes or introduction of atmospheric oxygen during sampling. Samples must be collected from contaminanttransporting (i.e., transmissive) intervals. Total organic carbon 0.1 percent Coefficient of variation 20 percent ph 0.1 standard units 0.1 standard units Improperly calibrated instrument; time sensitive. Temperature 0 degrees Celsius +/- 1 degree Celsius Improperly calibrated instrument; time sensitive. Conductivity 50 microsiemens per square centimeter (µs/cm 2 ) Chloride 1 mg/l Coefficient of variation 20 percent +/- 50 µs/cm 2 Improperly calibrated instrument. May be hard to discern trends due to background conditions. Hydrogen a/ 0.1 nanomole (nm) +/- 0.1 nm. Several, see Chapelle et al., (1997). a/ Required for chlorinated solvents; not required for petroleum hydrocarbons. 3-7
19 There are numerous technical difficulties involved in collecting the chemical data used for assessing natural attenuation that can lead to sampling or analysis errors. Perhaps the most common error is inadvertently oxygenating water samples collected for dissolved oxygen measurements. Because of these potential difficulties, it is important to review the data for potential inconsistencies. For example, it would be highly unusual to find ground water containing significant concentrations of dissolved oxygen (>2 milligrams per liter, mg/l) that also contain high concentrations of Fe(II) (>5 mg/l) or high concentrations of dissolved methane (>1 mg/l). Such inconsistencies should be carefully screened to identify possible analytical errors, to avoid data misinterpretation, and to identify highly heterogeneous geochemical conditions. 3.4 KINETIC EVALUATION OF INTRINSIC BIODEGRADATION The natural attenuation of contaminants in ground-water systems depends largely on ambient rates of microbial biodegradation. One approach to measuring biodegradation rates is to collect aquifer material, construct either static or flow-through microcosms in the laboratory, and measure the decrease in concentrations of particular compounds, or the production of 14 CO 2 from radiolabeled compounds (Chapelle et al., 1996a). These methods are advantageous in that they can be applied to a wide range of hydrologic systems and because abiotic controls can be used to separate biotic from abiotic effects. However, the laboratory approach introduces uncertainties due to sediment disturbance and difficulties in reproducing in situ conditions. Another approach to measuring biodegradation rates is to track the loss of contaminants along groundwater flowpaths. This approach also is subject to various uncertainties, particularly in separating the effects of microbial processes from abiotic processes such as hydrodynamic dispersion, advection, and sorption. Uncertainty is associated with estimating contaminant mass from a limited number of data points in a heterogeneous medium. Microbial utilization of substrates (contaminants) conforms to enzyme saturation (Monod) kinetics according to the Michaelis-Menton equation: V = [v max /K s + S] (SB) eq. 3.1 Where V is the rate of substrate uptake (moles per time), v max is the maximum rate of substrate uptake (moles of substrate per time per gram of cells), K s is the substrate concentration at which v = ½ v max (moles of substrate per liter), S is substrate concentration (moles per liter), and B is the amount of cells (grams). At low substrate concentrations where S ~ K (i.e., substrate uptake is not limited by enzyme availability), and when the microbial population is neither increasing or decreasing with time, the Michaelis-Menton equation is approximated by first-order kinetics: V ~ ks eq. 3.2 Where k is a rate constant (units of 1/time). In many substrate-limited ground-water systems, first-order kinetics are a adequate approximation of contaminant degradation, and this approach has been widely used to simulate solute-transport of organic contaminants. It is recognized, however, that this simplification is not appropriate for sites with (1) high contaminant concentrations (> 1 mg/l, Beakins et al., 1998) where the availability of degradation enzymes is significantly less than the availability of the contaminant; (2) contaminant concentrations that are toxic to microorganisms; (3) more than one substrate that limit microbial degradation rates; and/or (4) microbial populations that are increasing or decreasing. Two methods for estimating biodegradation rates from field data are a dispersionmodel approach (Chapelle et al., 1996a), and a conservative-tracer approach (Wiedemeier et al., 1996b). Both of these methods were originally developed for dissolved BTEX compounds, but can be applied to dissolved chlorinated solvents as well. 3-8
20 The dispersion-model approach assumes that the dispersion, advection, and biodegradation of a soluble contaminant in flowing ground water may be described by the equation: C t = D x 2 C 2 x v x C x SC n kc eq. 3.3 Where C is the solute concentration (µg/l), D is the coefficient of hydrodynamic dispersion (square feet per day, ft 2 /d), v x is ground-water seepage velocity (feet per day, ft/d), S and n are Freundlich adsorption isotherm parameters, and k is a first-order rate constant for biodegradation of solute C (1/day). Solutions to this equation can be obtained by analytical or numerical methods, depending on the complexity of the problem at hand. Assuming that the plume has reached approximate steady-state conditions (i.e., the plume is not expanding or contracting with time and ( C/ t=0), the solute-transport equation simplifies to the ordinary differential equation: 2 d C dc 0 = D vx kc eq dx dx Which for boundary conditions of C = C 0 at x=0, and C=0 as x has the solution: C( x) = C o v exp x + 2 vx 4Dk x 2D Equation 3.5 describes the exponential decrease in solute concentrations away from a constant source. The decrease is proportional to ground-water velocity (v x ), the coefficient of hydrodynamic dispersion (D), and the biodegradation rate constant (k). This solution does not take into account transverse dispersion. The seepage velocity of ground water can be estimated by applying a modification of Darcy's equation, and the coefficient of hydrodynamic dispersion can be estimated from the scale of the plume. Given these estimates, k can be estimated by curve-fitting solutions of equation 3.5 to field data. For chlorinated ethenes, this procedure is complicated by the fact that TCE, DCE, and VC are produced as daughter products from PCE as well as being degraded. TCE, DCE, and VC concentration changes along a flowpath segment reflect the difference between production and degradation. Thus, for TCE, cis-1,2-dce, and VC, this procedure yields apparent degradation rate constants that underestimate actual degradation rate constants. In addition to underestimating degradation rate constants for daughter products, this method introduces several other sources of uncertainty, including those related to (1) source concentrations, (2) ground-water flow rates, (3) adequately sampling within the plume, and (4) deviations from steady-state conditions within the plume. While these sources of uncertainty can be reduced by extensive data collection and the use of more sophisticated models, they cannot be entirely eliminated. Because of these uncertainties, it is clear that degradation rate constants obtained with these methods should be regarded as rough estimates. The conservative-tracer approach (Wiedemeier et al., 1996b) corrects for dispersion and advection by using biologically conservative tracers such as chloride or trimethylbenzenes that are present in many contaminant plumes. If the decrease in contaminant concentration along a flowpath (which is affected by dispersion, dilution, and biodegradation) is a first-order relationship then it can be described by the equation: C eq. 3.5 ktott = Coe eq
21 Where C is contaminant concentration at some point downgradient along the flowpath, C o is the initial contaminant concentration, k tot is the total contaminant decay rate constant, and t is time. Then, the decrease in concentration of the conservative tracer (which is affected only by dispersion and dilution) is fit to the equation: C λt TD = Coe eq. 3.7 Where C TD is the tracer-normalized contaminant concentration at some point downgradient along the flowpath, C o is the initial contaminant concentration, λ is the biodegradation decay rate constant, and t is time. The first-order degradation rate constant λ is the biodegradation rate constant because the effects of dispersion, dilution, and volatilization have been removed by using the ratio of the conservative tracer concentration at the upgradient and downgradient points. The tracer-normalized contaminant concentration at some point downgradient along the flowpath is given by: T A C = TD CD eq. 3.8 TB Where C D is the measured concentration of the compound of interest at the downgradient point along the flowpath, T A is the measured concentration of the tracer at the upgradient point, and T B is the measured concentration of the tracer at the downgradient point. The reader is referred to Wiedemeier et al. (1996b) for an example of how to complete these calculations. Biodegradation rates calculated by the mass-balance approach are subject to the same assumptions made in applying the dispersion-model approach. Therefore, it is clear that degradation rate constants obtained with these methods should be regarded as rough estimates In addition, the mass-balance approach assumes that a conservative tracer is present in the plume and can be used to correct for dilution and dispersion. 3.5 THE USE OF LABORATORY STUDIES Caution should be exercised when using laboratory studies to assess the efficiency of natural attenuation processes at particular sites. Biodegradation processes are often specific to ambient redox conditions (i.e., oxic vs. anoxic conditions), the availability of electron donors and acceptors, and the availability of nutrients. All of these factors can be changed significantly, either intentionally or unintentionally, when sediments or ground water from a particular site are brought to the laboratory. For example, if anoxic sediments are collected and incubated under oxic conditions in the laboratory, these experimental results may greatly overestimate in situ rates of petroleum hydrocarbon biodegradation, or greatly underestimate rates of in situ chlorinated solvent biodegradation. It is difficult to verify that experimental conditions in the laboratory match ambient in situ conditions. Thus, conclusions from such studies are often difficult to interpret. There are some circumstances, however, when laboratory studies are necessary. When specific questions are raised concerning conditions under which biodegradation processes occur or do not occur, controlled laboratory studies may be required (Bradley and Chapelle, 1996). For example, if concentrations of a particular compound are observed to decrease in the field, it may not be clear whether this decrease is due to sorption, dilution, or biodegradation. Laboratory studies in which the effects of each process can be isolated and controlled (they usually cannot be controlled in the field) are the only available method for answering these questions. 3-10
22 3.6 A WEIGHT-OF-EVIDENCE APPROACH FOR DEALING WITH UNCERTAINTY The terrestrial subsurface varies in complexity from relatively straightforward sand box systems to extremely complex systems. In addition, the bio- and geochemical fate of dissolved organic compounds, especially the chlorinated solvents, can be quite complicated, and will vary depending on site conditions. To reduce the uncertainty associated with sampling and analyzing sediment and ground water from complicated systems, care should be taken when collecting samples, and independent and converging lines of evidence should be used to evaluate the efficiency of natural attenuation. Such a weight-of-evidence approach will greatly increase the likelihood of successfully implementing natural attenuation at sites where natural processes are restoring the environmental quality of the ground water. For example, methane data may suggest that redox conditions are sufficiently reducing to allow reductive dechlorination, but this piece of evidence alone is insufficient to show that reductive dechlorination is occurring. Additional evidence that could be used to document reductive dechlorination includes hydrogen concentrations in the range of sulfate reduction or methanogenesis; depleted dissolved oxygen, nitrate, and sulfate concentrations; lowered oxidation/reduction potential (ORP), the presence of daughter products that were not released at the site, and a stable contaminant plume. In total, the weight of this evidence strongly supports the inferred occurrence of reductive dechlorination. 3-11
23 SECTION 4 NATURAL ATTENUATION OF PETROLEUM HYDROCARBONS 4.1 INTRODUCTION Field and laboratory studies conducted in the last twenty years have demonstrated that petroleum hydrocarbons, including aliphatic and aromatic compounds, are subject to a variety of biodegradation processes. More recent studies have shown that fuel oxygenates, such as MTBE, also are subject to microbial degradation processes. However, available data indicate that MTBE degrades less efficiently than BTEX. These processes are most commonly oxidative and can transform petroleum contaminants into carbon dioxide (CO 2 ) and water. Petroleum hydrocarbon degradation occurs in all shallow hydrologic systems under both oxic and anoxic conditions. These processes can effectively remediate contaminated ground water without human intervention. If it can be reliably shown that natural attenuation processes are sufficient to protect receptors from contamination, then they should be included in remedial action plans. Biodegradation of petroleum hydrocarbons most commonly occurs by means of aerobic, nitrate-reducing, Fe(III)-reducing, sulfate-reducing, and methanogenic respiration. In addition Mn(IV) reduction can occur in some hydrologic environments, but is a minor component of electron flow compared to other electron acceptors. For this reason, Mn(IV) reduction is not explicitly discussed in this text but can be evaluated in the same manner as the other electron acceptors discussed in this document. Figure 4.1 illustrates the evolution of ground-water geochemistry in an initially pristine aquifer into which petroleum hydrocarbons are introduced. This hypothetical aquifer initially contains dissolved oxygen, nitrate, biologically available Fe(III), sulfate, all necessary nutrients, and has a positive ORP (oxidizing). Shortly after the introduction of petroleum hydrocarbons into an aquifer such as this, aerobic bacteria begin to biodegrade soluble organic compounds. Because of the low aqueous solubility of oxygen and the plethora of aerobic bacteria, the system soon becomes anoxic. After dissolved oxygen concentrations in an aquifer fall below about 0.5 mg/l, denitrification will begin if nitrate is present. During denitrification, nitrate concentrations typically decrease to the point where denitrification can no longer be supported. After the majority of the available nitrate is consumed, Fe(III) reducers will begin utilizing petroleum hydrocarbons if a suitable source of Fe(III) is available. During Fe(III) reduction, the amount of biologically available Fe(III) decreases, and Fe(II) concentrations increase. After the majority of the biologically available Fe(III) is consumed, sulfate reducers will begin utilizing petroleum hydrocarbons if sulfate is available. During sulfate reduction, sulfate concentrations decrease, typically to the point where this process can no longer be supported. After the majority of the available sulfate is consumed, methanogenesis becomes the dominant biodegradation mechanism. During methanogenesis, methane concentrations increase. Table 4.1 summarizes trends in contaminant, electron acceptor, metabolic byproduct during biodegradation of fuel hydrocarbons. 4-1
24 4-2
25 Table 4.1 Trends in Contaminant, Electron Acceptor, and Metabolic Byproduct Concentrations During Biodegradation Analyte Trend in Analyte Concentrations During Biodegradation Terminal Electron Accepting Processes Causing Trend Petroleum hydrocarbons Decrease Aerobic Respiration, Denitrification, Mn(IV) Reduction, Fe(III) Reduction, Sulfate Reduction, Methanogenesis Highly Chlorinated Solvents and Daughter Products Parent Compound Concentrations Decrease, Daughter Products Increase Initially and Then May Decrease Reductive Dechlorination and Cometabolic Oxidation Lightly Chlorinated Solvents Decrease Aerobic Respiration and Fe(III) Reduction (Direct Oxidation) and Cometabolism (Indirect Oxidation) Dissolved Oxygen Decrease Aerobic Respiration Nitrate Decrease Denitrification Mn(II) Increase Mn(IV) Reduction Fe(II) Increase Fe(III) Reduction Sulfate Decrease Sulfate Reduction Methane Increase Methanogenesis Chloride Increase Reductive Dechlorination or Direct Oxidation of Chlorinated Compound Oxidation/Reduction Potential Decrease Aerobic Respiration, Denitrification, Mn(IV) Reduction, Fe(III) Reduction, Sulfate Reduction, Methanogenesis, and Halorespiration Dissolved Inorganic Carbon Increase Aerobic Respiration, Denitrification, Fe(III) Reduction, and Sulfate Reduction 4.2 METHODS FOR EVALUATING NATURAL ATTENUATION OF PETROLEUM HYDROCARBONS The precise methods for assessing the natural attenuation of petroleum hydrocarbons will vary from site to site depending on ambient conditions. Nevertheless, the following steps can be executed in sequence to evaluate the efficiency of natural attenuation processes in ground-water systems: Step 1-- Install sufficient number of monitoring wells at the site to delineate the areal and vertical extent of ground-water contamination and determine the distribution of hydrostratigraphic units (see Section 6). Data quality objectives (DQOs) such as those presented in USEPA (1994) should be used when designing a sampling plan. Step 2--Measure water levels in the wells, prepare a potentiometric map, determine hydraulic gradient, and perform slug tests or pumping tests to determine the distribution of hydraulic conductivity. Use measured hydraulic conductivity data, hydraulic gradient data, and estimates of aquifer porosity to determine the direction and velocity of ground-water flow using: 4-3
26 v x K dh = eq. 4.1 n dl e where v x is the average ground-water seepage velocity (feet/day), dh/dl is the hydraulic gradient (dimensionless), K is the hydraulic conductivity (ft/d), and is n e is the effective porosity (dimensionless). Step 3--Measure concentrations of the indicator parameters listed in Table 3.1. The spatial relationships among contaminants, daughter products, inorganic electron acceptors, and metabolic byproducts can be used qualitatively to evaluate the occurrence of petroleum hydrocarbon degradation. Isopleth (isoconcentration) maps allow the investigator to map the relationships among these parameters in space. These maps portray graphically the first and second lines of evidence used to document natural attenuation. Figure 4.2 gives examples of completed isopleth maps for BTEX, dissolved oxygen, nitrate, Fe(II), sulfate, and methane. The patterns illustrated on Figure 4.2 show that there is a strong correlation among areas with elevated BTEX, depleted electron acceptor, and elevated metabolic byproduct concentrations. These relationships provide strong evidence that biodegradation is occurring via the processes of aerobic respiration, denitrification, Fe(III) reduction, sulfate reduction, and methanogenesis. Step 4--Estimate Biodegradation Rates. Such estimates can be made by evaluating field or laboratory data (Buscheck and Alcantar 1995; Chapelle et al., 1996a; Wiedemeier et al., 1996b). Experience has shown that biodegradation kinetics for petroleum hydrocarbons are adequately described by a first-order rate law. In addition, experience has shown that there is a fairly narrow range (within an order of magnitude) of first-order rate constants for soluble petroleum hydrocarbons, as shown in Table 4.2. Step 5--Using the Results of Steps 1, 2, and 4, Compare Rate of Contaminant Transport to Rate of Biodegradation. Such comparisons can be made using simple analytical solutions of the advection/dispersion equation such as that presented in the model BIOSCREEN (Newell et al., 1996). For complex problems (e.g., sites with a heterogeneous distribution of hydraulic conductivity), numerical solute transport models may be appropriate (Wiedemeier et al., 1995a; Chapelle et al., 1996). Step 6--Evaluate Potential Receptor Impacts. If the efficiency of natural attenuation is sufficient to prevent contaminant transport to potential receptor exposure points (e.g., domestic wells or surface water bodies), then monitored natural attenuation may be a viable remedial option. If the efficiency of natural attenuation is insufficient to prevent contaminant transport to exposure points, then monitored natural attenuation may be ruled out as the sole remedial option, but may be used as a component of the overall cleanup strategy. 4-4
27 4-5
28 Table 4.2 Biodegradation Rate Constants Biodegradation Rate Constant Site or Reference Benzene (1/day) Toluene (1/day) Ethylbenzene (1/day) Xylenes (1/day) Total BTEX (1/day) Hill AFB, UT a/ b/ a/ b/ a/ b/ a/ b/ a/ b/ Madison ANGB, a/ WI Elmendorf AFB, 0.01 a/ AK Hangar 10 Elmendorf AFB, a/ AK ST-41 MacDill AFB, FL a/ Pump House 75 Myrtle Beach, SC b/ POL facility Pope AFB, NC b/ FPTA #4 Fairchild AFB, b/ WA Bldg 1212 Eaker AFB, AR b/ Gas Station Dover AFB, DL a/ Site SS27/XYZ Bolling AFB, D.C a/ Car Care Center Westover AFB, b/ MA Christmas Tree Fire Training Area Columbus AFB, 0.08 b/ MS ST-24 Landmeyer et al (1996) Chapelle et al (1996a) Chapelle et al., (1996b) Stauffer et al (1994) MacIntyre et al. (1993) to to 0.14 a/ Biodegradation rate constant calculated using trimethylbenzene as a conservative tracer. b/ Biodegradation rate constant calculated using the method of Buscheck and Alcantar (1995). c/ Biodegradation rate constant from microcosm study. d/ Biodegradation rate constant calculated using the method of Chapelle et al. (1996a). 4-6
29 SECTION 5 NATURAL ATTENUATION OF CHLORINATED SOLVENTS 5.1 INTRODUCTION Field and laboratory studies conducted in the last ten years have demonstrated that chlorinated solvents, including chlorinated ethenes, ethanes, and benzenes, are subject to a variety of biodegradation processes. These biological processes include reductive and oxidative degradation pathways, and can ultimately transform these contaminants to environmentally innocuous carbon dioxide (CO 2 ) and chloride (Cl - ). In addition, abiotic mechanisms such as hydrolysis can work to degrade some of the common chlorinated solvents. For example, 1,1,1- trichloroethane can be degraded to 1,1-DCE via hydrolysis. Figure 5.1 summarizes the common biological and abiotic degradation reaction pathways for the chlorinated ethenes, ethanes, and methanes. If it can be reliably shown that natural attenuation processes are sufficient to protect receptors from contamination, then it is appropriate that they be included in remedial action plans. Conversely, if it can be reliably shown that natural attenuation processes are not sufficient to protect receptors, natural attenuation can be ruled out as a sole remedial option. Even when natural attenuation is not viable as the sole remedial action, it may be used as part of the overall site remediation strategy. It is less common for natural biodegradation to be efficient for chlorinated solvents than for petroleum hydrocarbons. This section provides technical guidelines for assessing the efficiency of natural attenuation processes for chlorinated solvents. 5.2 BACKGROUND INFORMATION The microbial degradation of chlorinated solvents is complex. Under some redox conditions, these compounds can serve as electron donors in microbial metabolism; that is, microorganisms use them as a source of energy in the form of electrons. Under other redox conditions, chlorinated ethenes serve as electron acceptors, where microorganisms use them as a sink for electrons. In addition, these compounds can be degraded by various cometabolic processes. Under anoxic conditions, chlorinated solvents can be reductively dechlorinated. For chlorinated ethenes (PCE, TCE, DCE, and VC) this process occurs in the following sequence: PCE TCE + Cl - DCE + Cl - VC + Cl - ethene + Cl - eq. 5.1 However, the efficiency of dechlorination differs for particular compounds and for particular geochemical conditions. It is observed, for example, that dechlorination of PCE and TCE to DCE occurs under either mildly or strongly reducing conditions (Vogel et al., 1987), whereas the transformation of DCE to VC, and the transformation of VC to ethene, require the more strongly reducing conditions characteristic of methanogenesis (Friedman and Gossett, 1989; DeBrunin et al., 1992). Research indicates that reductive dechlorination is driven by molecular hydrogen, as shown on Figure 5.2 (DiStefano et al., 1991). As shown by this figure, a chlorine on the solvent molecule is removed and replaced with hydrogen during reductive dechlorination. 5-1
30 5-2
31 5-3
32 This, in turn, shows why the efficiency of reductive dechlorination is sensitive to redox conditions. Hydrogen is continuously produced in anoxic systems by fermentation of organic matter. This is represented by the generalized relationship: 3CH 2 O + H 2 O CH 3 COOH + CO 2 +2H 2 The hydrogen produced by fermentation is then utilized by respirative microorganisms such as methanogens: CO 2 + 4H 2 CH 4 +2H 2 O In microbial ecology, these coupled processes are known as interspecies hydrogen transfer. Because methanogenesis is a relatively inefficient hydrogen-consuming process, concentrations of molecular hydrogen are relatively high (Table 5.1). Hydrogen concentrations are progressively lower under sulfate-reducing, Fe(III)-reducing, and denitrifying conditions, which support successively more efficient hydrogen utilizers (Table 5.1). Table 5.1 Hydrogen Concentrations Characteristic of Different Terminal Electron-Accepting Processes Terminal Electron-Accepting Process Characteristic Hydrogen Concentration (nm) Denitrification <0.1 Fe(III) Reduction Sulfate Reduction 1-4 Methanogenesis >5 The efficiency of reductive dechlorination is directly linked to the availability of molecular hydrogen. Under denitrifying conditions, relatively little hydrogen is available, and reductive dechlorination is relatively inefficient. Conversely, significantly more hydrogen is available under methanogenic conditions and reductive dechlorination is proportionally more efficient. While chlorinated solvents such as PCE and TCE are most commonly degraded by reductive dechlorination, the daughter products of reductive dechlorination can be directly oxidized (Davis and Carpenter, 1990; Bradley and Chapelle, 1996). For example, under oxic conditions, DCE and VC can be oxidized to carbon dioxide according to the equations: for DCE Cl2C2H2 + 2O2 2CO2 + 2H + + 2Cl - eq. 5.2 for VC ClC2H3 + 5/2 O2 2CO2 + H20 + H + + Cl - eq
33 The complete degradation of chlorinated solvents is favored by sequential anoxic/oxic conditions (Chapelle, 1996): anoxic (reductive dechlorination) cometabolism) oxic (direct oxidation, PCE, TCE DCE and VC DCE, VC 2CO2 and Cl - eq. 5.4 The key to assessing the natural attenuation of chlorinated solvents, therefore, is an accurate delineation of redox conditions in ground-water systems. 5.3 DELINEATING TERMINAL ELECTRON-ACCEPTING PROCESSES IN GROUND-WATER SYSTEMS The most common terminal electron-accepting processes (TEAPs) in ground-water systems are oxygen-, nitrate-, Fe(III)-, sulfate-, and carbon dioxide-reduction (methanogenesis). The stoichiometry of these processes can be represented by the generalized equations: O 2 + CH 2 O CO 2 + H 2 O eq NO H + + 5CH 2 O 2N 2 + 5CO 2 + 7H 2 O eq Fe(OH) 3 + CH 2 O + 8H + 4Fe 2+ + CO H 2 O eq CH 2 O + SO H + 2CO 2 + HS - + 2H 2 O eq CH 2 O CH 4 + CO 2 eq. 5.9 The microorganisms that effect these electron-accepting processes compete with each other for available organic carbon sources. Because oxygen is the most efficient electron-accepting process, oxygen-reducing microorganisms outcompete other electron-accepting processes if dissolved oxygen is present in ground water. Once oxygen is depleted, nitrate-reducing microorganisms will predominate if nitrate is available. Similarly, Fe(III)-reduction follows nitrate reduction, sulfate reduction follows Fe(III) reduction, and methanogenesis follows sulfate reduction. This process of competitive exclusion leads to the formation of discrete redox zones in ground-water systems. Furthermore, this zonation can be deduced based on the presence/absence of electron acceptors, and the formation of specific end products (equations 5.5 through 5.9). For example, if dissolved oxygen is present in ground-water at concentrations greater than 0.5 mg/l, then oxygen reduction (equation 5.5) will be the predominant microbial process. If dissolved oxygen concentrations are less than 0.5 mg/l, but nitrate is present at concentrations greater than 0.5 mg/l, nitrate reduction (equation 5.6) will be the predominant microbial process. Because nitrite (NO 2 ) is an unstable intermediate product of nitrate reduction (equation 5.6), the presence of measurable NO 2 concentrations is indicative of nitrate reduction. If ground water lacks dissolved oxygen or nitrate, and concentrations of Fe(II) increase along the flow path, Fe(III) reduction (equation 5.7) is the most likely predominant process. If ground water contains concentrations of sulfate greater than 0.5 mg/l and hydrogen sulfide greater than 0.05 mg/l, then sulfate reduction (equation 5.8) is the most likely predominant process. Finally, if the water 5-5
34 lacks dissolved oxygen, nitrate, Fe 2+, sulfate, and hydrogen sulfide, but contains concentrations of methane greater than 0.2 mg/l, then methanogenesis (equation 5.9) is the most likely predominant process. This logic is summarized in Figure 5.3 (Chapelle et al., 1995). In practice, uncertainty is inherent in this method. Many products of microbial metabolism, such as Fe(II), hydrogen sulfide, and methane can be transported by ground-water flow. In cases where such transport is significant, it is difficult to determine the exact redox zonation with this water-chemistry information. In these cases, direct measurement of dissolved hydrogen gas (H 2 ) concentrations can be used to evaluate ambient redox processes (Figure 5.3). Fermentative microorganisms in ground-water systems continuously produce H 2 during anoxic decomposition of organic matter. This H 2 is then consumed by respiratory microorganisms that may use Fe(III), sulfate, or carbon dioxide as terminal electron acceptors. In microbial ecology, this process is referred to as interspecies hydrogen transfer. Significantly, Fe(III)-, sulfate-, and carbon-dioxidereducing (methanogenic) microorganisms exhibit different efficiencies in utilizing H 2. Fe(III) reducers are relatively efficient in utilizing H 2, and thus they maintain lower steady-state H 2 concentrations (0.2 to 0.8 nm) than either sulfate reducers (1-4 nm H 2 ) or methanogens (> 5 nm H 2 ). Because each TEAP has a characteristic hydrogen concentration associated with it, H 2 concentrations can be an indicator of predominant redox processes in ground-water systems. 5.4 ORGANIC CARBON SUBSTRATES THAT SUPPORT REDUCTIVE DECHLORINATION Reductive dechlorination, a process in which chlorinated solvents serve as an electron acceptor, requires an organic carbon substrate in order to proceed. These organic carbon substrates initially are degraded by fermentative bacteria that produce molecular hydrogen (H 2 ) and other organic compounds. This H 2 then reacts directly with the chlorinated solvent, resulting in reductive dechlorination (Figure 5.2). Many different kinds of organic carbon, including BTEX compounds, aliphatic petroleum hydrocarbons, naturally occurring particulate organic carbon (POC) in aquifer sediments, and natural dissolved organic carbon (DOC) can be fermented to H 2 to support reductive dechlorination. However, organic carbon compounds differ substantially in how efficiently they are fermented, and thus in how efficiently they can support reductive dechlorination. In particular, it is difficult to assess how efficiently natural DOC and POC are fermented. For these reasons, it is not currently technically feasible to quantitatively measure the mass of fermentable total organic carbon (TOC), which is the sum of DOC and POC, available in a ground-water system. TOC, some portion of which may be fermentable, can be measured (Table 3.1), and such measurements are appropriate for assessment of the reductive dechlorination capacity of a given system. While it is difficult to quantify the available mass of fermentable organic carbon supporting reductive dechlorination, it is feasible to assess the geochemical conditions resulting from organic carbon metabolism in an aquifer. For these reasons, it is more appropriate for assessments of natural attenuation to focus on ambient geochemical conditions (Section 5.3) than on measuring available organic carbon. 5-6
35
36 5.5 Daughter Products as indicators of Reductive Dechlorination Concentrations of chlorinated solvents and their degradation products give a direct indication of the presence or absence of microbial degradation (both reductive and oxidative) processes. In many cases, the production of cis-1,2-dce, VC, and chloride ions along aquifer flowpaths is direct evidence of intrinsic bioremediation. It is possible that VC and some DCE isomers can be primary contaminants in some ground-water systems. However, VC is not normally present as a primary contaminant in solvent spills associated with military activities, because VC was not used as a solvent. Thus, the presence of VC in ground water associated with a chlorinated ethene spill is strong evidence of reductive dechlorination. Also, cis-1,2-dce (rather than trans-1,2- DCE) is usually produced from the reductive dechlorination of TCE. As a rule of thumb, if cis- 1,2-DCE comprises more than 80 percent of the total DCE, then the DCE is likely of biogenic origin (Wiedemeier et al., 1996a). Based on these concepts, VC and cis-1,2-dce are reliable indicators of microbial reductive dechlorination. 5.6 METHODOLOGY FOR EVALUATING THE EFFICIENCY OF NATURAL ATTENUATION OF CHLORINATED ETHENES The precise methods for assessing redox processes in ground-water systems will vary from site to site depending on ambient conditions. Nevertheless, the following steps are often appropriate to assess the efficiency of natural attenuation in a given ground-water system: Step 1-- Install sufficient polyvinyl-chloride (PVC-) cased monitoring wells (if hydrogen measurements are to be taken) at the site to delineate the areal and vertical extent of ground-water contamination and to determine the distribution of hydrostratigraphic units (see Section 6). Data quality objectives (DQOs) such as those presented in USEPA (1994) should be used when designing a sampling plan. Step 2--Measure water levels in the wells, prepare a potentiometric map, determine hydraulic gradient, and perform slug tests or pumping tests to determine the distribution of hydraulic conductivity. Use measured hydraulic conductivity data, hydraulic gradient data, and estimates of aquifer porosity to determine the direction and velocity of ground-water flow using equation 4.1 (repeated below): v x = K n e dh dl where v is the average ground-water seepage velocity (ft/d), dh/dl is the hydraulic gradient (dimensionless), K is the hydraulic conductivity (ft/day), and is n e is the effective porosity (dimensionless). Step 3--Measure concentrations of the ground-water chemistry parameters listed in Table 3.1. Step 4--Using the results of Step 3, apply the logic of Figure 5.3 to deduce the distribution of ambient redox processes at the site. In addition, use these data to document contaminant and chloride concentration changes as ground water flows downgradient. Step 5--Categorize the site according to the progression of redox processes. The most common, but certainly not the only, progressions observed in the field include: 5-8
37 1. Methanogenic conditions at contaminant source area, grading to Fe(III)-reducing conditions immediately downgradient from the source area, and finally grading to oxic conditions further downgradient. 2. Sulfate-reducing or Fe(III)-reducing conditions at contaminant source area, grading to oxic conditions downgradient. 3. Oxic conditions at contaminant source area grading to reducing (Fe(III)-reducing, sulfate-reducing, or methanogenic) conditions downgradient. 4. Uniformly oxic conditions in contaminant source area and downgradient areas. Step 6--Deduce the efficiency of natural biodegradation according to the progression of redox conditions, mass loss of solvent concentrations, and the production/destruction of daughter products according to the following general guidelines: Progression of methanogenic Fe(III) reduction oxic conditions--rapid and efficient reductive dechlorination at the source area, followed by oxidation of DCE and VC downgradient of the source area. Extensive mass loss of solvent along aquifer flowpaths, and production and subsequent mass loss of daughter products along aquifer flowpaths. Highly efficient natural attenuation is probable. Progression of sulfate- or Fe(III) reduction oxic conditions--reductive dechlorination at source area followed by oxidation of DCE and VC downgradient from source area. Partial mass loss of solvents, and production and subsequent loss of daughter products along aquifer flowpaths. Low concentrations of PCE and TCE transported to oxic zone, where biodegradation processes stop, but dilution continues. Moderately efficient natural attenuation is probable. Progression from oxic to anoxic conditions--no reductive dechlorination at source area, some dechlorination and mass loss of solvent downgradient. Production and degradation of daughter products. Moderately efficient natural attenuation is probable. Uniformly oxic conditions--no reductive dechlorination, no production of oxidizable daughter products. Inefficient natural attenuation is probable. Step 7--Evaluate the viability of monitored natural attenuation as a remedial strategy in the context of contaminant transport to receptors. Efficient biodegradation, receptors not impacted--monitored natural attenuation is a viable sole remedial strategy for ground water. Efficient biodegradation, receptors impacted--monitored natural attenuation is not a viable sole remedial strategy, but may be used in conjunction with other remedial strategies. 5-9
38 Moderate biodegradation, receptors not impacted--monitored natural attenuation may be either a viable sole remedial strategy, or may be used in conjunction with other remedial strategies. Moderate biodegradation, receptors impacted--monitored natural attenuation is not a viable sole remedial strategy, but may be used in conjunction with other remedial strategies. Inefficient biodegradation, receptors not impacted physical processes such as dispersion and dilution natural attenuation sufficient to disperse contaminants, monitored natural attenuation a possible remedial strategy. Inefficient biodegradation, receptors impacted--monitored natural attenuation not an appropriate sole remedial strategy, but may be used as part of a treatment train. Step 8--Engineer a site-specific remediation system. If biodegradation is highly efficient at a site, and receptors are not impacted, it may be appropriate to use monitored natural attenuation as a sole remedial strategy. Natural attenuation, even when it is highly efficient, does not rapidly remove significant sources of contamination. For this reason, it is considered good engineering practice to combine the use of monitored natural attenuation with source removal if feasible. Conversely, if natural attenuation is inefficient and receptors are impacted, then other engineered options for controlling dissolved contaminant migration should be considered. It should be emphasized that the utilization of monitored natural attenuation, either as a stand-alone remedial strategy or in conjunction with other engineered remedial options, is highly site specific. Its successful utilization, or non-utilization, depends ultimately on sound scientific and engineering decision-making. 5-10
39 SECTION 6 IMPLEMENTING LONG-TERM MONITORING To document that natural attenuation remains an effective and environmentally protective remedial approach, long-term monitoring must be implemented and a contingency plan developed. A comprehensive long-term monitoring and contingency plan is an integral part of any ground-water remedial action plan, and is necessary to demonstrate a commitment to protecting human health and the environment. These plans should be developed on a sitespecific basis using the guidance presented below. 6.1 PLACEMENT OF LONG-TERM MONITORING AND CONTINGENCY WELLS, ANALYTICAL REQUIREMENTS, AND SAMPLING FREQUENCY A typical long-term monitoring plan consists of siting ground-water monitoring wells and developing a ground-water sampling and analysis strategy. This plan is implemented to monitor the plume over time and to verify that natural attenuation is occurring at rates sufficient to protect potential downgradient receptors. The long-term monitoring plan should be developed based on site characterization data and the results of the receptor exposure pathways analysis. Table 6.1 presents guidance that can be used to develop a site-specific monitoring program. The long-term monitoring plan includes two types of monitoring wells. Long-term monitoring wells are intended to determine if the behavior of the plume is changing. Contingency wells are intended to detect movements of the plume outside the negotiated perimeter of containment, and to trigger an action to manage potential expansion. Figure 6.1 depicts (1) upgradient and crossgradient wells in unimpacted ground water; (2) a well in the source area; (3) a well downgradient from the source area in a zone of anoxic treatment; (4) a well in the zone of aerobic (oxic) treatment, along the periphery of the plume; (5) a well located downgradient from the plume where contaminant concentrations are below regulatory acceptance levels and soluble electron acceptors are depleted with respect to unimpacted ground water; and (6) three contingency wells. The locations of long-term monitoring wells should be based on the behavior of the plume interpreted from the initial site characterization and on regulatory considerations. Contingency wells should be placed at least 5-years travel time upgradient from potential receptor exposure points in the flow path of the impacted ground water. To be realistically conservative (i.e., protective of human health and the environment), this distance should be based on the advective velocity of the ground water rather than on the solute transport velocity. The final number and location of long-term monitoring and contingency wells should be developed in collaboration with the appropriate regulatory agencies. 6-1
40 Table 6.1 Progressive Monitoring Steps for a Natural Attenuation Program Step Description I. Establish Data Collection PointgsSpecify points of compliance and the points at which monitoring must be conducted II. Define What is to be Monitored Demonstration that natural attenuation is occurring according to expectations accomplished by including steps to: 1. Identify any potentially toxic transformation products; 2. Determine if plume is expanding (downgradient, laterally, or vertically); 3. Ensure no impact to downgradient receptors; detect new releases of contaminants to the environment that could impact the effectiveness of the natural attenuation remedy; 4. Demonstrate the efficacy of institutional controls that were put in place to protect potential receptors; 5. Detect changes in environmental conditions (e.g., hydrogeologic, geochemical, or microbiological) that may reduce the efficacy of any of the natural attenuation processes; and 6. Verify attainment of cleanup objectives. III. Establish the Time Period for Monitoring Monitoring should continue as long as contamination remains above required cleanup levels and for a period after cleanup levels have been achieved that is long enough to ensure that concentration levels are stable and will remain below target levels. IV. Define How Monitoring is to be Demonstration of the monitoring approach being appropriate and verifiable by including steps to: Done 1. Specify methods for statistical analysis of data (e.g., established tolerances, seasonal and spatial variability); 2. Establish performance standards; Collect data useful for monitoring the performance of natural attenuation (e.g. EPA/540/R-97/504, EPA/600/R-94/162) EPA/600/R-94/123: collection and evaluation of performance monitoring data for pump-and-treat remediation systems 3. Establish a time interval 4. Include in reporting: maps, tabulation of data and statistical analysis, identification of trends, recommendations for changes in approach, evaluationsof whether contaminants behave as predicted, and of whether other remedies are required. V. Define Action Levels or Process to Observe Monitoring VI. Define Contingency Plan (Modified from Sandia National Laboratories, 1998) Valid interpretation of the monitoring system is demonstrated by steps to: 1. Establish background levels; 2. Define criteria that show if a plume is expanding or diminishing; 3. Define criteria that show that the conceptual model is applicable to a site; and 4. Establish how measurement of cleanup objectives and effectiveness will be determined. Establishment of contingency plan if monitoring system action criteria are exceeded. Make sure that the following actions are taken before the contingency plan is implemented : 1. Ensure that changes in contaminant concentrations are statistically significant; 2. Identify extent and nature of non-predicted behavior; 3. Reevaluate conceptual model; and 4. Evaluate feasible corrective actions from previous and evolving contingency plan 6-2
41 6-3
42 The results of a solute fate and transport model can be used to help site the long-term monitoring and contingency wells. In order to provide a valid monitoring system, all monitoring wells must be screened in the hydrogeologic unit(s) affected by the contaminant plume. Geochemical data should be used when possible to confirm that downgradient wells are sampling ground water that was once contaminated with organic compounds. Wells downgradient from and completed in the same stratigraphic horizon as a contaminant plume that do not contain organic compounds but have depleted electron acceptor (e.g., dissolved oxygen, nitrate, sulfate) or elevated metabolic byproduct concentrations (e.g., Fe(II), methane, chloride, alkalinity) relative to background provide conclusive evidence that the ground water being sampled flowed through the contaminant plume and has been treated. Because concentrations of electron acceptors and metabolic byproducts will equilibrate with ambient conditions at some distance downgradient from the contaminant plume, it is important to locate at least one well close to the downgradient edge of the contaminant plume. This also will allow better resolution of the behavior of the leading edge of the plume. Figure 6.2 illustrates how geochemical data can be used to ensure correct placement of downgradient monitoring wells. A ground-water sampling and analysis plan should be prepared in conjunction with contingency and long-term monitoring well placement. For long-term monitoring wells, groundwater analyses should include organic contaminants of concern. In addition, samples for analysis of dissolved oxygen, nitrate, Fe(II), sulfate, methane, and hydrogen (chlorinated solvent plumes only) analyses should be collected on a periodic basis to ensure that the prevailing ground-water geochemistry has not changed to the extent that intrinsic bioremediation ceases. This is particularly important for sites contaminated with chlorinated solvents. If monitored natural attenuation is selected as part of site remediation, a long-term monitoring program is necessary to verify its effectiveness. The long-term monitoring strategy should consider the possibility that the behavior of a plume may change over time and monitor for the continued availability of a carbon source to support reductive dechlorination. For contingency wells, ground-water analyses should be limited to contaminants of concern. Any state-specific analytical requirements also should be addressed in the sampling and analysis plan to ensure that all data required for regulatory decision making are collected. Water-level measurements must be made during each sampling event. Except at sites with very low hydraulic conductivity and gradients, quarterly sampling of long-term monitoring wells is recommended during the first year to help determine the direction of plume migration and to establish baseline conditions. Based on the results of the first year s sampling, the sampling frequency may be reduced to annual sampling (or less). Sampling frequency is dependent on the final placement of the contingency wells and on ground-water flow velocity. The final sampling frequency should be determined after consideration of well spacing and solute transport velocity. 6-4
43
44 6.2 Interactions Between Natural Attenuation and Engineered Remediation Systems The guidance issued by the USEPA (1997) Office of Solid Waste and Emergency Response recommends that source reduction should be considered for all sites where monitored natural attenuation is used for site remediation. Although engineered remediation systems may be effective in removing contaminant mass from ground water, some systems may have an adverse impact on intrinsic bioremediation (Table 6.2). For example, the introduction of oxygen via air sparging into a system contaminated with chlorinated solvents will inhibit reductive dechlorination, thus decreasing the effectiveness of natural attenuation. Similarly, a groundwater pump-and-treat system can affect the natural treatment system by delivering oxygen-rich ground water to the contaminant plume. In light of this, it is very important to consider the interactions between a proposed engineered remediation system and naturally occurring processes. In addition, these interactions can be expected to affect the efficiency and total cost of the remediation effort. The impact of such costs, which are not included in Table 6.2, may be considerable. 6.3 CONTINGENCY PLANS Because changing site conditions (e.g., redox conditions, ground-water recharge rates, the availability of organic carbon, etc.) can result in variable plume behavior over time, especially with chlorinated solvent plumes, contingency plans should be developed. These plans will ensure protection of human health and the environment should a contaminant plume begin migrating, and typically will involve some kind of engineered remediation. A properly designed contingency monitoring system will allow plume expansion to be detected so that the contingency plan can be implemented before receptors are exposed. The placement of contingency wells should be made based on the ground-water seepage velocity and the distance to potential receptors. It is important when placing contingency wells and determining sampling frequencies that the guidelines discussed in Section 6.1 be followed. The trigger that initiates contingency plan implementation should be based on statistically significant contaminant detections in contingency monitoring wells. For example, one detection of TCE at 3 micrograms per liter in the seventh of 10 sampling events may be due to random error in the data. Thus, depending on the placement of contingency wells relative to potential receptor locations, one detection of contaminants in a contingency well typically is not sufficient to trigger implementation of the contingency plan. Additional time-series data should be collected to determine if the plume is actually migrating. Guidance on statistical significance is given in Gilbert (1987) and USEPA (1989). Careful thought must be given to the remedial action to be implemented should natural attenuation prove not to be effective. The contingency remedial option should be selected so that it will (1) prevent further plume migration, and (2) minimize the detrimental impacts on the natural treatment system. The most common remediation technologies and their relationship with natural attenuation are listed in Table
45 Table 6.2 Interactions Between Active Remediation Technologies and Natural Attenuation Technology Possible Benefits Possible Detriments Bioslurping Pump and Treat Air Sparging In-Well Circulation/Stripping Landfill Caps Petroleum Hydrocarbons Volatilization, enhanced oxygen delivery/aerobic biodegradation Plume containment, enhanced oxygen delivery/aerobic biodegradation Volatilization, enhanced oxygen delivery/aerobic biodegradation Volatilization, enhanced oxygen delivery/aerobic biodegradation Source containment/ isolation Chlorinated Solvents Volatilization, enhanced oxidation of DCE and VC, possible enhanced aerobic cometabolism Plume containment, enhanced oxidation of DCE and VC, possible enhanced aerobic cometabolism Volatilization, enhanced oxidation of DCE and VC, possible enhanced aerobic cometabolism Volatilization, enhanced oxidation of DCE and VC, possible enhanced aerobic cometabolism Source containment/isolation, reduced oxygen delivery through elimination of recharge/stimulation of reductive dechlorination Petroleum Hydrocarbons None None None None Reduced oxygen delivery/aerobic biodegradation Chlorinated Solvents Enhanced oxygen delivery/decreased reductive dechlorination Enhanced oxygen delivery/decreased reductive dechlorination Enhanced oxygen delivery/decreased reductive dechlorination Enhanced oxygen delivery/decreased reductive dechlorination Decreased oxidation of DCE and VC, decreased aerobic cometabolism 6-7
46 Table 6.2 Interactions Between Active Remediation Technologies and Natural Attenuation (Con t) Technology Possible Benefits Possible Detriments Phytoremediation Excavation/Backfilling Chemical Oxidation (e.g, Fenton s Reagent, potassium permanganate, etc.) Petroleum Hydrocarbons Chlorinated Solvents Petroleum Hydrocarbons Plant-specific transpiration/enzymatically -mediated degradation, enhanced biodegradation in the rhizosphere, and plume containment Source Removal, enhanced oxygen delivery/aerobic biodegradation Plant-specific transpiration/enzymatically -mediated degradation, enhanced biodegradation in the rhizosphere, and plume containment Source Removal, enhanced oxidation of DCE and VC, possible enhanced aerobic cometabolism None None Chlorinated Solvents Unknown Enhanced oxygen delivery/decreased reductive dechlorination Enhanced oxidation Enhanced oxidation None Enhanced oxygen delivery/decreased reductive dechlorination through oxidation and removal of fermentable carbon substrates. Lowered ph possibly inhibits microbial activity 6-8
47 Table 6.2 Interactions Between Active Remediation Technologies and Natural Attenuation (Concluded) Technology Possible Benefits Possible Detriments Chemical Reduction (e.g., sodium dithionate) Oxygen-Releasing Materials Petroleum Hydrocarbons Unknown Enhanced oxygen delivery/aerobic biodegradation Chlorinated Solvents Scavenges inorganic electron acceptors/enhanced reductive dechlorination Enhanced oxidation of DCE and VC Carbon Substrate Addition None Stimulation of reductive dechlorination Zero-Valent-Iron Barrier Walls Unknown Enhanced reductive dechlorination Biological Barrier Walls Unknown Enhanced reductive dechlorination Petroleum Hydrocarbons Scavenges inorganic electron acceptors/decreased oxidation None Competing carbon source Unknown Unknown Chlorinated Solvents Decreased oxidation of DCE and VC, decreased aerobic cometabolism Decreased reductive dechlorination through oxidation and removal of fermentable carbon substrates. Decreased oxidation of DCE and VC, decreased aerobic cometabolism at injection point None None 6-9
48 6.4 EXIT STRATEGY The long-term monitoring plan should include an exit strategy that will allow closure of the site after a reasonable amount of data based on site conditions has been collected to show that natural attenuation will remain protective of human health and the environment. For example, an exit strategy may state that long-term monitoring will cease after remediation goals are achieved. These remediation goals are site-specific and depend on ground-water use, future land development and use, and potential receptor considerations. The exit strategy should be clearly stated in the remedial action plan. 6-10
49 SECTION 7 REFERENCES Beakins, B.A., E. Warren, and E.M. Godsy, 1998, A comparison of zero order, first order, and Monod biotransformation models: Ground Water, v36, Borden, R.C., R.A. Daniel, L.E. LeGrun, and C.W. Davis, 1997, Intrinsic biodegradation of MTBE and BTEX in a gasoline contaminated aquifer: Water Resources Research, v33, p Bouwer, E.J., and McCarty, P.L., 1984, Modeling of trace organics biotransformation in the subsurface: Ground Water, vol. 22, no. 4, p Bradley, P.M. and F.H. Chapelle Anaerobic mineralization of vinyl chloride in Fe(III) reducing aquifer sediments. Environmental Science & Technology 40: Buscheck, T.E., and O Reilly, K.O., 1995, Protocol for Monitoring Intrinsic Bioremediation in Groundwater: Chevron Research and Development Company. Buscheck, T.E. and Alcantar, C.M., 1995, Regression Techniques and Analytical Solutions to Demonstrate Intrinsic Bioremediation. In, Proceedings of the 1995 Battelle International Conference on In-Situ and On Site Bioreclamation, April 1995 Chapelle, F.H., 1993, Ground-Water Microbiology and Geochemistry: John Wily & Sons, Inc., New York, 424 p. Chapelle, F.H., 1996, Identifying redox conditions that favor the natural attenuation of chlorinated ethenes in contaminated ground-water systems. Symposium on Natural Attenuation of Chlorinated Organics in Ground Water, EPA/540/R-96/509, p Chapelle, F.H., P.B. McMahon, N.M. Dubrovsky, R.F. Fujii, E.T. Oaksford, and D.A. Vroblesky Deducing the distribution of terminal electron-accepting processes in hydrologically diverse groundwater systems. Water Resources Research 31: Chapelle, F.H., Bradley, P.M., Lovley, D.R., and Vroblesky, D.A., 1996a, Measuring rates of biodegradation in a contaminated aquifer using field and laboratory methods: Ground Water, v. 34, no. 4, p Chapelle, F.H., Landmeyer, J.E., and Bradley, P.M., 1996b, Assessment of intrinsic bioremediation of jet fuel contamination in a shallow aquifer, Beaufort, South Carolina: USGS Water-Resources Investigations Report , 30p. Chapelle, F.H., Vroblesky, D.A., Woodward, J.C., and Lovley, D.R., 1997, Practical considerations for measuring hydrogen concentrations in groundwater: Environmental Science and Technology, v. 31: Davis, J.W., and Carpenter, C.L., 1990, Aerobic biodegradation of vinyl chloride in groundwater samples: Applied and Environmental Microbiology, 56: DeBrunin, W.P., M.J.J. Kotterman, M.A. Posthumus, G. Schraa, and A.J.B. Zehnder Complete biological reductive transformation of tetrachloroethene to ethane. Applied and Environmental Microbiology 58: DiStefano, T.D., J.M. Gossett, and S.H. Zinder Reductive dechlorination of high concentrations of tetrachloroethene to ethene by an anaerobic enrichment culture in the absence of methanogenesis. Applied and Environmental Microbiology 57: Friedman, D.L., and J.M. Gossett Biological reductive dechlorination of tetrachloroethylene and trichloroethylene to ethylene under methanogenic conditions. Applied and Environmental Microbiology 55: Gilbert, R.O., 1987, Statistical Methods for Environmental Pollution Monitoring: Van Nostrand Reinhold, 320 p. Kampbell, D.H., Wilson, J.T., and Vandegrift, S.A., 1989, Dissolved oxygen and methane in water by a GC headspace equilibrium technique: International Journal of Environmental Analytical Chemistry, v. 36, p Landmeyer, J.E., Chapelle, F.H., and Bradley, P.M., 1996, Assessment of intrinsic bioremediation of gasoline contamination in the shallow aquifer, Laurel Bay Exchange, Marine Corps Air Station, Beaufort, South Carolina: USGS Water-Resources Investigations Report , 50p. 7-1
50 Landmeyer, J.E., F.H. Chapelle, P.M. Bradley, J.F. Pankow, C.D. Church, and P.G. Tratnyek, 1998, Fate of MTBE relative to benzene in a gasoline contaminated aquifer ( ): Ground Water Monitoring and Remediation, Fall Mace, R.E., Fisher, R.S., Welch, D.M., and Parra, S.P., 1997, Extent, mass, and duration of hydrocarbon plumes from leaking petroleum storage tank sites in Texas: Bureau of Economic Geology Geological Circular MacIntyre, W.G., Boggs, M., Antworth, C.P., and Stauffer, T.B., 1993, Degradation kinetics of aromatic organic solutes introduced into a heterogeneous aquifer: Water Resources Research, v. 29, no. 12, p McCallister, P.M., and Chiang, C.Y., 1994, A practical approach to evaluating natural attenuation of contaminants in ground water: Ground Water Monitoring Review, Spring, 1994, p McCarty, P.L., and Semprini, L., 1994, Ground-water treatment for chlorinated solvents, In Norris, R.D., Hinchee, R.E., Brown, R., McCarty, P.L, Semprini, L., Wilson, J.T., Kampbell, D.H., Reinhard, M., Bouwer, E.J., Borden, R.C., Vogel, T.M., Thomas, J.M., and Ward, C.H., editors, Handbook of Bioremediation: Lewis Publishers, p Newell, C.J., McLeod, R.K., and Gonzales, J.R., 1996, BIOSCREEN Natural Attenuation Decision Support System, Version 1.3, U.S. Air Force Center for Environmental Excellence, Brooks Air Force Base, San Antonio, Texas ( Rice, D.W., R.D. Grose, J.C. Michaelsen, B.P. Dooher, D.H. MacQueen, S.J. Cullen, W.E. Kastenberg, L.G. Everett, and M.A. Marino, 1995, California Leaking Underground Fuel Tank (LUFT) Historical Case Analyses: California State Water Resources Control Board. Sandia National Laboratories, 1998, Site Screening and Technical Guidance for Monitored Natural Attenuation at DOE Sites, Draft, June 29, Stauffer, T.B., T.B. Antworth, J.M. Boggs, and W.G. MacIntyre A Natural Gradient Tracer Experiment in a Heterogeneous Aquifer with Measured In Situ Biodegradation Rates: A Case for Natural Attenuation. In Proceedings of the Symposium on Intrinsic Bioremediation of Groundwater, August 30 - September 1, US Environmental Protection Agency, p USEPA, 1989, Statistical Analysis of Ground-Water Monitoring Data at RCRA Facilities Interim Final Guidance, EPA/530-SM , Interim Final, April USEPA, 1994, Guidance for the Data Quality Objectives Process, EPA QA/G-4, Final, Sept 1994 USEPA, 1997, Use of Monitored Natural Attenuation at Superfund, RCRA Corrective Action, and Underground Storage Tank Sites, Draft Interim Final :U.S. EPA Office of Solid Waste and Emergency Response Directive ( Vogel, T.M., C.S. Criddle, and P.L. McCarty Transformations of halogenated aliphatic compounds. Environmental Science and Technology 21: Wiedemeier, T.H., Wilson, J.T., Kampbell, D.H., Miller, R.N., and Hansen, J.E., 1995a, Technical Protocol for Implementing Intrinsic Remediation with Long-Term Monitoring for Natural Attenuation of Fuel Contamination Dissolved in Groundwater: US Air Force Center for Environmental Excellence, San Antonio, Texas. Wiedemeier, T.H., Wilson, J.T., and Miller, R.N., 1995b, Significance of Anaerobic Processes for the Intrinsic Bioremediation of Fuel Hydrocarbons: In Proceedings of the Petroleum Hydrocarbons and Organic Chemicals in Ground Water: Prevention, Detection, and Restoration Conference: NWWA/API. Wiedemeier, T.H., Swanson, M.A., Moutoux, D.E., Gordon, E.K., Wilson, J.T., Wilson, B.H., Kampbell, D.H., Hansen, J.E., Haas, P., and Chapelle, F.H., 1996a, Technical Protocol for Evaluating Natural Attenuation of Chlorinated Solvents in Groundwater, Draft - Revision 1:, Air Force Center for Environmental Excellence, San Antonio, Texas. Wiedemeier, T.H., Swanson, M.A., Wilson, J.T., Kampbell, D.H., Miller, R.N., and Hansen, J.E., 1996b, Approximation of biodegradation rate constants for monoaromatic hydrocarbons (BTEX) in ground water: Ground Water Monitoring and Remediation, v. 16, no. 3, Summer 1996, p Wiedemeier, T.H., Rifai, H.S., Newell, C.J., and Wilson, J.T., 1998, Natural Attenuation of Fuels and Solvents in the Subsurface: John Wiley and Sons, New York, In Press. 7-2
51 APPENDIX A NATURAL ATTENUATION OF PETROLEUM HYDROCARBONS A CASE STUDY
52
53
54
55
56
57
58
59
60
61
62
63
64
65
66
67
68
69
70
71
72
73
74
75
76
77
78
79
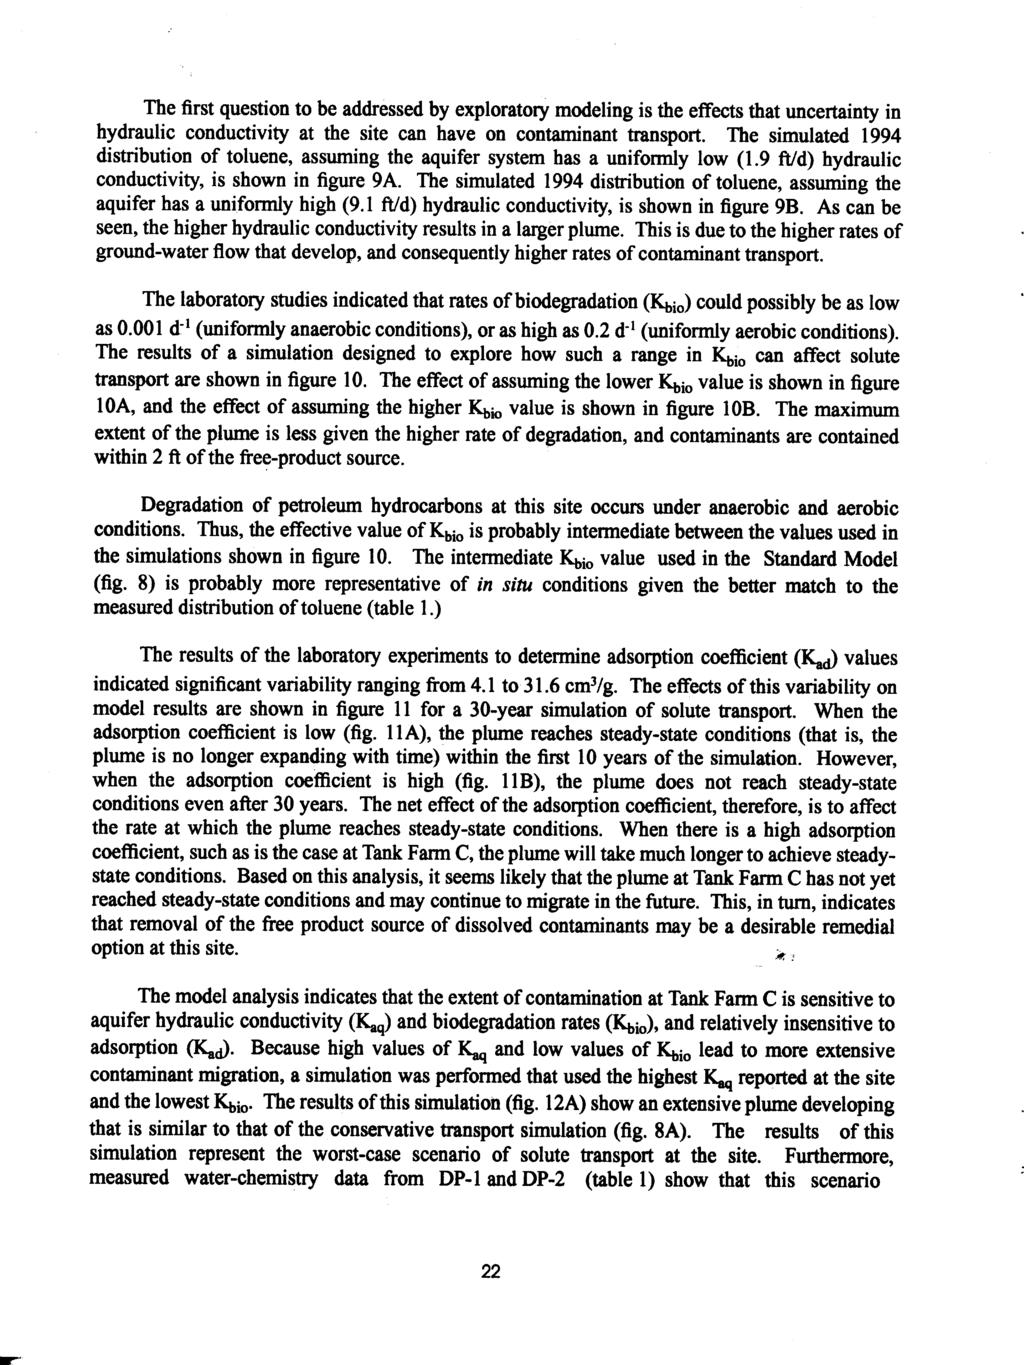
80
81
82
83
84
85
86
87
88 APPENDIX B NATURAL ATTENUATION OF CHLORINATED SOLVENTS A CASE STUDY
89
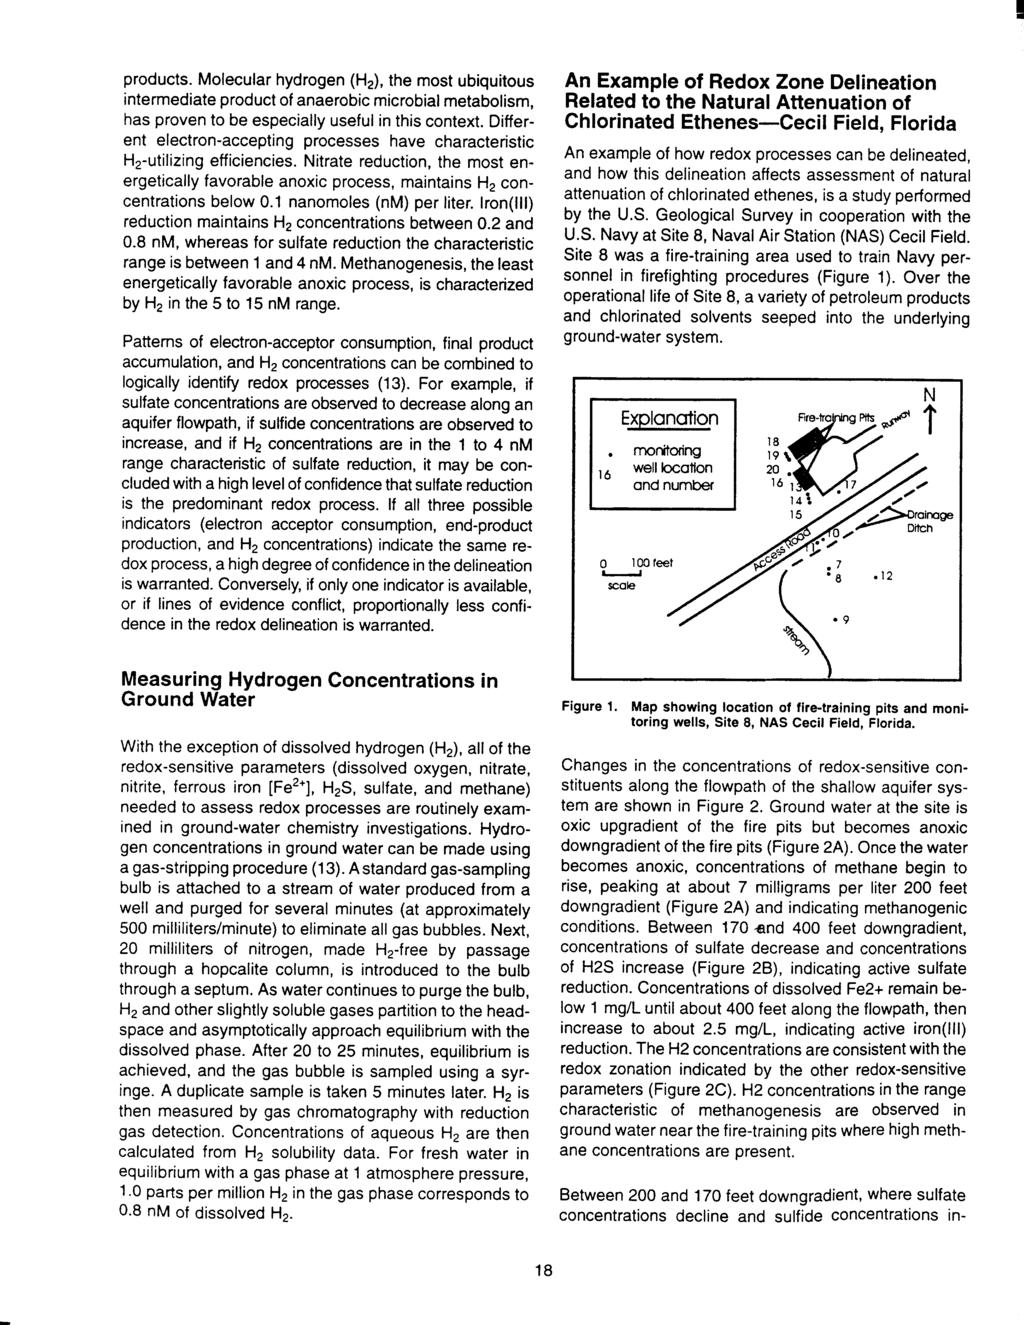
90
Sections 5 & 6. Site Characterization and Lines of Evidence. Steve Posten
 Sections 5 & 6 Site Characterization and Lines of Evidence Steve Posten Overview Section 5 Site Characterization Conceptual site model Aquifer characteristics Hydraulic conductivity/gradient Porosity Organic
6. Organic Compounds: Hydrocarbons. General Comments Borden, Canada, tracer test Laurens, SC, gasoline spill Bemidji, MN, crude oil spill
 6. Organic Compounds: Hydrocarbons General Comments Borden, Canada, tracer test Laurens, SC, gasoline spill Bemidji, MN, crude oil spill In the subsurface, biogeochemical processes that control contaminant
TREATMENT OF PERCHLORATE AND 1,1,1-TRICHLOROETHANE IN GROUNDWATER USING EDIBLE OIL SUBSTRATE (EOS )
") Paper 4B-1, in: A.R. Gavaskar and A.S.C. Chen (Eds.), Remediation of Chlorinated and Recalcitrant Compounds 24. Proceedings of the Fourth International Conference on Remediation of Chlorinated and Recalcitrant
Paper 4B-1, in: A.R. Gavaskar and A.S.C. Chen (Eds.), Remediation of Chlorinated and Recalcitrant Compounds 24. Proceedings of the Fourth International Conference on Remediation of Chlorinated and Recalcitrant
OBSTACLES TO COMPLETE PCE DEGRADATION DURING REDUCTIVE DECHLORINATION
 OBSTACLES TO COMPLETE PCE DEGRADATION DURING REDUCTIVE DECHLORINATION Judie A. Kean, Florida Department of Environmental Protection, Tallahassee, Florida, USA; Duane Graves, Dgraves@GeoSyntec.com, (GeoSyntec
Contaminant Bioremediation
 Contaminant Bioremediation Petroleum hydrocarbons, chlorinated solvents, metals and radionuclides Dr. Al Cunningham Center for Biofilm Engineering Montana State University Bozeman MT USA Natural Attenuation
Impacts of a Zero Valent Iron PRB on Downgradient Biodegradation Processes. John E. Vidumsky DuPont Corporate Remediation Group
 Impacts of a Zero Valent Iron PRB on Downgradient Biodegradation Processes John E. Vidumsky DuPont Corporate Remediation Group Why is Downgradient Biodegradation Important? Significant contaminant mass
Behavior of a Chlorinated Ethene Plume following Source-Area Treatment with Fenton s Reagent
 Behavior of a Chlorinated Ethene Plume following Source-Area Treatment with Fenton s Reagent by Francis H. Chapelle, Paul M. Bradley, and Clifton C. Casey Abstract Monitoring data collected over a 6-year
BIOREMEDIATION APPROACHES AND TOOLS FOR BENZENE REMEDIATION UNDER ANAEROBIC CONDITIONS
 BIOREMEDIATION APPROACHES AND TOOLS FOR BENZENE REMEDIATION UNDER ANAEROBIC CONDITIONS Sandra Dworatzek*, Jennifer Webb, Peter Dollar, SiREM, Guelph, ON; Elizabeth Edwards, Nancy Bawa, Shen Guo, Fei Luo,
NATURAL ATTENUATION OF CHLORINATED SOLVENTS IN GROUNDWATER: PRINCIPLES AND PRACTICES T E C H N I C A L -FINAL- R E Q U I R E M E N T S.
 NATURAL ATTENUATION OF CHLORINATED SOLVENTS IN GROUNDWATER: PRINCIPLES AND PRACTICES T E C H N I C A L R E Q U I R E M E N T S The Interstate Technology and Regulatory Cooperation Work Group, In Situ Bioremediation
Advanced Tools for Subsurface Sampling and Analysis
 Advanced Tools for Subsurface Sampling and Analysis 220 William Pitt Way Pittsburgh, PA 15238 412-286-5245 www.pacelabs.com Advanced Tools TABLE OF CONTENTS: 1. Table of Contents 2. Introduction 3. PAES
August Prepared by:
 Case Study for the Use of a Decision Support Tool: Evaluating the Applicability of Remediation by Natural Attenuation Using BIOSCREEN at the Administration Area Naval Exchange (NEX) Gas Station, Naval
Biological Reductive Dechlorination of Chlorinated Compounds. Barry Molnaa WSW Remediation Practice Manager ARCADIS
 Biological Reductive Dechlorination of Chlorinated Compounds Barry Molnaa WSW Remediation Practice Manager ARCADIS 1 Presentation Outline What are we trying to do? How is it supposed to work? What are
John Wilson, Principal Scientist, Scissortail Environmental Solutions, LLC, Ada, OK
 Data Needs for Effective Application of MNA and In-Situ Bioremediation Featuring Framework to Apply vel Molecular and Other Screening Tools for MNA Evaluations John Wilson, Principal Scientist, Scissortail
Full Scale Implementation Of Sulfate Enhanced Biodegradation To Remediate Petroleum Impacted Groundwater
 Proceedings of the Annual International Conference on Soils, Sediments, Water and Energy Volume 14 Article 15 January 2010 Full Scale Implementation Of Sulfate Enhanced Biodegradation To Remediate Petroleum
MEMORANDUM. To: Billy Meyer. Christie Zawtocki, PE Timothy Klotz. Date: April 8, 2014
 MEMORANDUM To: Billy Meyer From: Christie Zawtocki, PE Timothy Klotz Date: April 8, 2014 Project: One Hour Martinizing Site, DSCA ID 32-0013 1103 W Club Blvd, Durham, NC Subject: Monthly Update Hart &
Bioremediation Product Series
 No. PREX-GEN101007 In-situ Remediation of Contaminated Soil and Groundwater using the Power of Mother Nature Bioremediation Product Series 694-2, Akada, Toyama 939-8064 Japan Phone: +81-76-420-3122 Fax:
A Robust Model for Biotic and Abiotic Degradation of Chlorinated Aliphatic Hydrocarbons in an In Situ Bioreactor
 A Robust Model for Biotic and Abiotic Degradation of Chlorinated Aliphatic Hydrocarbons in an In Situ Bioreactor Robert Edwards- Noblis Gabriel Moreno-Ferguson Camp Stanley Storage Activity Chris Beal
Site Profiles - View. General Information. Contaminants: Site Hydrology:
 Site Profiles - View General Information Site Name and Location: Description: Historical activity that resulted in contamination. Tiger Cleaners Memphis, Tennessee, United States Tiger Cleaners is located
Advancing the Science of In Situ Groundwater Remediation Petroleum Hydrocarbon Remediation Technologies
 Advancing the Science of In Situ Groundwater Remediation Petroleum Hydrocarbon Remediation Technologies TASK Tersus Advanced Surface Kinetics NAPL Surfactants Tersus is the worldwide distributor of the
In Situ Bioremediation Technologies by Tersus Environmental
 In Situ Bioremediation Technologies by Tersus Environmental Page 2 Gas infusion Page 3 Tersus Environmental In Situ bioremediation Gas delivery Edible oil Achieve site closure Low cost solution Soil vapor
Processes that can be Modeled with RT3D
 Natural attenuation of contaminants in aquifer Advanced Environmental Technology Dragan Kaludjerovic PhD Hydrogeologist Email: advancedgwt@gmail.com Web site: www.advancegwt.com Mobile: +381-(0) (0)-62-965-1748
Aerobic and Anaerobic Biodegradation
 Polimernet Plastik San.Tic.Ltd.Şti. Tel:+90 216 393 77 46 / Email: info@polimernet.com www.polimernet.com 1 Aerobic and Anaerobic Biodegradation This document provides an in depth explanation, detailing
Anaerobic Bioremediation of Chlorinated Solvents in Groundwater Using Edible Oil Substrate EOS
 Anaerobic Bioremediation of Chlorinated Solvents in Groundwater Using Edible Oil Substrate EOS Matt Sedor, M.S., Yonathon Yoseph, P.G., C.H.G. (Remediation Sciences, Inc.) Jeff Baker (Vironex, Inc. ),
In Situ Bioremediation of DNAPL Source Zones
 In Situ Bioremediation of DNAPL Source Zones August 2005 Prepared by Lisa Moretti National Network of Environmental Management Studies Fellow for U.S. Environmental Protection Agency Office of Solid Waste
(,,,) = ( )exp ( + C(x,y,z,t) = the concentration of the contaminant at location x, y, z from the source at time t.
 = ( )exp ( + C(x,y,z,t) = the concentration of the contaminant at location x, y, z from the source at time t.") INTRODUCTION Quick Domenico.xls (QD) is a Microsoft Excel spreadsheet application of An Analytical Model For Multidimensional Transport of a Decaying Contaminant Species, by P.A. Domenico, Journal of Hydrology,
INTRODUCTION Quick Domenico.xls (QD) is a Microsoft Excel spreadsheet application of An Analytical Model For Multidimensional Transport of a Decaying Contaminant Species, by P.A. Domenico, Journal of Hydrology,
Advancing the Science of In Situ Groundwater Remediation Petroleum Hydrocarbon Remediation Technologies
 Advancing the Science of In Situ Groundwater Remediation Petroleum Hydrocarbon Remediation Technologies RemBind Vadose Zone Treatment Tersus is the exclusive North American distributor for RemBind (US
In Situ Bioreactors for In-Well Groundwater Remediation. Eric J. Raes, P.E., LSRP Kerry Sublette
 In Situ Bioreactors for In-Well Groundwater Remediation Eric J. Raes, P.E., LSRP Kerry Sublette The Bio-Sep In Situ Bioreactor (ISBR) Enhancement of in situ bioremediation in groundwater with compact bioreactor
AFCEE PROTOCOL FOR ENHANCED ANAEROBIC BIOREMEDIATION USING EDIBLE OILS
 Paper 3D-03, in: A.R. Gavaskar and A.S.C. Chen (Eds.), Remediation of Chlorinated and Recalcitrant Compounds 2004. Proceedings of the Fourth International Conference on Remediation of Chlorinated and Recalcitrant
The emamoc (electrolytic methanogenicmethanotrophic FOR BIOREMEDIATION OF CHLORINATED SOLVENTS
 The emamoc (electrolytic methanogenicmethanotrophic coupling) SYSTEM : A TOOL FOR BIOREMEDIATION OF CHLORINATED SOLVENTS Boris Tartakovsky, Ruxandra Cimpoia, Michelle-France Manuel, Marie-Josée Lévesque,
Learning about Secondary Water Quality Impacts from the Bemidji Oil Spill
 Learning about Secondary Water Quality Impacts from the Bemidji Oil Spill Crystal Ng (gcng@umn.edu) Univ of Minnesota, Twin Cities Barbara Bekins Research Coordinator USGS, Menlo Park, CA Jard Trost Site
Report Documentation Page
 Report Documentation Page Form Approved OMB No. 0704-0188 Public reporting burden for the collection of information is estimated to average 1 hour per response, including the time for reviewing instructions,
ENHANCED REDUCTIVE DECHLORINATION AND THE RELATIONSHIP BETWEEN CIS-1,2-DCE ACCUMULATION AND METHANOGENESIS
 ENHANCED REDUCTIVE DECHLORINATION AND THE RELATIONSHIP BETWEEN CIS-1,2-DCE ACCUMULATION AND METHANOGENESIS Judie A. Kean, (Judie.Kean@dep.state.fl.us) (Florida Department of Environmental Protection),
Phytoremediation Technology Evaluation and Preliminary Design
 Phytoremediation Technology Evaluation and Preliminary Design Chlorinated and Petroleum Hydrocarbon Groundwater Plume at Former Gas Liquids Extraction Facility, Colorado November 13, 2012 Dustin Krajewski
REMEDIATION OF GROUNDWATER CONTAMINATED WITH ORGANICS AND RADIONUCLIDES AN INNOVATIVE APPROACH EASES TRADITIONAL HURDLES
 REMEDIATION OF GROUNDWATER CONTAMINATED WITH ORGANICS AND RADIONUCLIDES AN INNOVATIVE APPROACH EASES TRADITIONAL HURDLES ABSTRACT Jeff Scott, Safety and Ecology Corporation 2800 Solway Rd., Knoxville,
PASSIVE GROUNDWATER SAMPLING METHODS. Applications and Experience
 PASSIVE GROUNDWATER SAMPLING METHODS Applications and Experience Dave Kindig, PE Environmental Monitoring and Data Quality Workshop April 29, 2015 Portland, OR BMT Designers & Planners Applied Environmental
Final Report for the Enhanced Anaerobic Bioremediation Pilot Test. Bountiful/Woods Cross Superfund Site, Bountiful, Utah
 Enhanced Anaerobic Bioremediation Pilot Test Bountiful/Woods Cross Superfund Site, Bountiful, Utah U.S. Department of the Interior Bureau of Reclamation Technical Service Center Denver, Colorado December
Natural attenuation and biological remediation a contradiction?
 VI International Seminar on Remediation and Redevelopment of Contaminated Sites. Natural attenuation and biological remediation a contradiction? Thilo Schenk IBL Umwelt- und Biotechnik GmbH Heidelberg,
Catalyzed Persulfate Remediation of Chlorinated and Recalcitrant Compounds in Soil
 Catalyzed Persulfate Remediation of Chlorinated and Recalcitrant Compounds in Soil Shanna Thompson, E.I.T. (shanna.thompson@erm.com), Jack Riggenbach, P.E., DEE (ERM, Kennesaw, GA), Richard A. Brown, PhD
OPTIMIZATION OF A CHEMICAL OXIDATION TREATMENT TRAIN PROCESS FOR GROUNDWATER REMEDIATION. Gary Cronk, P.E., CHMM
 OPTIMIZATION OF A CHEMICAL OXIDATION TREATMENT TRAIN PROCESS FOR GROUNDWATER REMEDIATION Gary Cronk, P.E., CHMM Presentation at the Battelle 5 th International Conference on Remediation of Chlorinated
Contaminant Degradation and Forensics Using Compound Specific Isotope Analysis
 Contaminant Degradation and Forensics Using Compound Specific Isotope Analysis Aaron Peacock, Pat McLoughlin and Bob Pirkle 220 William Pitt Way, Pittsburgh, PA 15238 Tel: 412-826-5245 What Is a Stable
Subsurface Distribution of ZVI/EHC Slurry Validating Radius of Influence. Josephine Molin, PeroxyChem October
 Subsurface Distribution of ZVI/EHC Slurry Validating Radius of Influence Josephine Molin, PeroxyChem October 2 2014 Presentation Objective / Outline To empirically summarize our experience from a range
Bioremediation of Comingled 1,4-Dioxane and Chlorinated Solvent Plumes
 Bioremediation of Comingled 1,4-Dioxane and Chlorinated Solvent Plumes Bilgen Yuncu, PhD, PE; Jessica L. Keener, PG and Robert C. Borden, PhD, PE Solutions-IES, Inc., Raleigh, NC TCE PCE Stephen D. Richardson,
Remediation Progress at California LUFT Sites: Insights from the GeoTracker Database
 API Technical Bulletin #25: Remediation Progress at California LUFT Sites: Insights from the GeoTracker Database Thomas E. McHugh, Roopa Kamath, Poonam R. Kulkarni, Charles J. Newell, and John A. Connor,
Interpreting Analytical Results
 Interpreting Analytical Results Beyond Guidelines and Exceedances Frans Hettinga Tetra Tech EBA Inc. Calgary, Alberta Contents Focus on groundwater chemistry Some basics and tricks What is the value? A
ESTCP Project ER
 ADDENDUM TO THE PRINCIPLES AND PRACTICES MANUAL Loading Rates and Impacts of Substrate Delivery for Enhanced Anaerobic Bioremediation ESTCP Project ER-200627 JANUARY 2010 Bruce Henry Parsons Infrastructure
Chlorinated Solvent Remediation Technologies
 Advancing the Science of In Situ Groundwater Remediation Chlorinated Solvent Remediation Technologies TFE CFC-1113 CFC-123a CFC-113 Other, Dhc, Dhb PCE 1,1,2-TCA Other, Dhc, Dhb TCE Other, Dhb Dhc cdce
James Studer, 2 Barry Ronellenfitch, 2 Adam Mabbott, 2 Heather Murdoch, 2 Greg Whyte, and 3 Ian Hakes. REMTECH 2008 at Banff, Alberta
 PILOT TEST OF ISCO TECHNOLOGIES LEADS TO IMPROVED UNDERSTANDING OF IMMEDIATE AND MID-TERM GEOCHEMICAL RESPONSE AND CONTAMINANT DESTRUCTION WITHIN PETROLEUM HYDROCARBON PLUME 1 James Studer, 2 Barry Ronellenfitch,
Technical Protocol for Evaluating the Natural Attenuation of MtBE Regulatory and Scientific Affairs Department
 Technical Protocol for Evaluating the Natural Attenuation of MtBE Regulatory and Scientific Affairs Department API PUBLICATION 4761 MAY 2007 Technical Protocol for Evaluating the Natural Attenuation of
Comparison of EHC, EOS, and Solid Potassium Permanganate Pilot Studies for Reducing Residual TCE Contaminant Mass
 Comparison of EHC, EOS, and Solid Potassium Permanganate Pilot Studies for Reducing Residual TCE Contaminant Mass Defense Distribution Depot San Joaquin-Sharpe Site Lathrop, California Corinne Marks, PE
Remediation of 1, 4-Dioxane
 Do it Right, Do it once Remediation of 1, 4-Dioxane Presented by Mike Marley February 12, 2016 Agenda Basic properties of 1,4-dioxane with respect to remediation A discussion of applicable reliable remedial
Monitored Natural Attenuation of MTBE as a Risk Management Option at Leaking Underground Storage Tank Sites
 Monitored Natural Attenuation of MTBE as a Risk Management Option at Leaking Underground Storage Tank Sites EPA/600/R-04/1790 January 2005 Monitored Natural Attenuation of MTBE as a Risk Management Option
Technology Overview KLOZUR PERSULFATE
 KLOZUR PERSULFATE Klozur persulfate is a high purity environmental grade product used as an in situ chemical oxidation (ISCO) technology to treat a wide variety of contaminants of concern in soil and groundwater
Groundwater Risk Assessment
 Groundwater Risk Assessment ELQF - 6 November 2012 Katy Baker Technical Director ARCADIS (UK) Limited Imagine the result Problem definition The importance of the CSM 2 The definition of the problem: 3
CHARACTERIZATION OF CHLORINATED SOLVENT DEGRADATION IN A CONSTRUCTED WETLAND THESIS. Nathan D. Clemmer, Captain, USAF AFIT/GEE/ENV/03-03
 CHARACTERIZATION OF CHLORINATED SOLVENT DEGRADATION IN A CONSTRUCTED WETLAND THESIS Nathan D. Clemmer, Captain, USAF AFIT/GEE/ENV/03-03 DEPARTMENT OF THE AIR FORCE AIR UNIVERSITY AIR FORCE INSTITUTE OF
GROUNDWATER INFORMATION SHEET. Methyl tertiary-butyl ether (MTBE)
") GROUNDWATER INFORMATION SHEET Methyl tertiary-butyl ether (MTBE) The purpose of this groundwater information sheet is to provide general information regarding a specific constituent of concern (COC). The
GROUNDWATER INFORMATION SHEET Methyl tertiary-butyl ether (MTBE) The purpose of this groundwater information sheet is to provide general information regarding a specific constituent of concern (COC). The
Environmental Solutions. Klozur CR. Combined Chemical and Bio-Remediation
 Combined Chemical and Bio-Remediation Klozur CR A combination mixture that supports a two fold mechanism for treating contaminates of concern, short term In Situ Chemical Oxidation (ISCO), with alkaline
Draft Petroleum Vapor Intrusion Information Paper. Michael Lowry, RTI International Matthew Young, EPA OUST
 Draft Petroleum Vapor Intrusion Information Paper Michael Lowry, RTI International Matthew Young, EPA OUST g, Describe differences between petroleum vapor intrusion (PVI) and chlorinated solvent vapor
Overburden and Bedrock Remediation Using Activated Carbon Based Injectates. Mike Mazzarese AST Environmental, Inc.
 Overburden and Bedrock Remediation Using Activated Carbon Based Injectates Mike Mazzarese AST Environmental, Inc. SMART Remediation Toronto, ON SMART is Powered by: www.vertexenvironmental.ca Overburden
The Norman Landfill Research Site
 The Norman Landfill Research Site By Bill Andrews (OU-CEES) and Scott Christenson (USGS) For the State Solid Waste Managers Conference of ASTSWMO Portland, Oregon August 14, 2007 1 A brief history-- The
APPENDIX H REVIEW OF TECHNICAL LITERATURE ON SEPTIC SYSTEMS
 APPENDIX H REVIEW OF TECHNICAL LITERATURE ON SEPTIC SYSTEMS CRA APPENDIX H 2.0 REVIEW OF TECHNICAL LITERATURE ON SEPTIC SYSTEMS 2.1 HOW SEPTIC SYSTEMS WORK Septic systems, are composed of two treatment
Treatability Study for Edible Oil Deployment for Enhanced cvoc Attenuation for T-Area, Savannah River Site:
 SRNL-RP-9-39 Rev. Treatability Study for Edible Oil Deployment for Enhanced cvoc Attenuation for T-Area, Savannah River Site: Interim Report Year One Brian Riha Brian Looney Jay Noonkester Keith Hyde May
Dr. Robert Mitchell Ground Water Contamination. ES234 Winter
 Geology 474/574 Dr. Robert Mitchell Ground Water Contamination ES234 Winter 2017 650-3591 robert.mitchell@wwu.edu http://kula.geol.wwu.edu/rjmitch/ Office Hours: MWF from 9:00 to 10:00 am, or by arrangement
GREEN REMEDIATION OF cvoc DNAPL IN BEDROCK
 GREEN REMEDIATION OF cvoc DNAPL IN BEDROCK I. Richard Schaffner, Jr., P.G., C.G.W.P. (richard.schaffner@gza.com ) and Steven R. Lamb, P.G., C.G.W.P. (GZA GeoEnvironmental, Inc.; Manchester, New Hampshire)
Biodegradation Rates for Fuel Hydrocarbons and Chlorinated Solvents in Groundwater
 Biodegradation Rates for Fuel Hydrocarbons and Chlorinated Solvents in Groundwater Monica P. Suarez and Hanadi S. Rifai 1 Civil and Environmental Engineering, University of Houston, 4800 Calhoun Rd., Engineering
Remediation of 1,2-dichloroethane (1,2-DCA) and vinyl chloride (VC) contaminated groundwater: lab and field pilot test.
 and vinyl chloride (VC) contaminated groundwater: lab and field pilot test.") Paper A 31 Remediation of 1,2-dichloroethane () and vinyl chloride (VC) contaminated groundwater: lab and field pilot test. Ing. Claudio Sandrone 1, Ing. Paola Goria 1, Ing. Marcello Carboni 1, Dott. Luca
Paper A 31 Remediation of 1,2-dichloroethane () and vinyl chloride (VC) contaminated groundwater: lab and field pilot test. Ing. Claudio Sandrone 1, Ing. Paola Goria 1, Ing. Marcello Carboni 1, Dott. Luca
ESTCP Cost and Performance Report
 ESTCP Cost and Performance Report (ER-200824) Verification of Methods for Assessing the Sustainability of Monitored Natural Attenuation (MNA) January 2013 Environmental Security Technology Certification
Use Of High Concentration Magnesium Sulfate Solution To Remediate Petroleum Impacted Groundwater
 Proceedings of the Annual International Conference on Soils, Sediments, Water and Energy Volume 12 Article 24 January 21 Use Of High Concentration Magnesium Sulfate Solution To Remediate Petroleum Impacted
Use of ph Tolerant Bioaugmentation Cultures For Bioremediation at Low ph
 Use of ph Tolerant Bioaugmentation Cultures For Bioremediation at Low ph Jeff Roberts, Phil Dennis, Sandra Dworatzek and Peter Dollar 24 February 2016 Enhanced Bioremediation Injection of KB-1 at a site
Mixed Plume Remediation using EHC In-Situ Chemical Reduction and Oxidation Technologies
 Mixed Plume Remediation using EHC In-Situ Chemical Reduction and Oxidation Technologies Innovative Solutions for Federal Contaminated Sites in Pacific and Northern Regions October 15, 2008 John Vogan,
Overburden and Bedrock Remediation Using Activated Carbon Based Injectates. Gary Simpson AST Environmental, Inc.
 Overburden and Bedrock Remediation Using Activated Carbon Based Injectates Gary Simpson AST Environmental, Inc. SMART Remediation Ottawa, ON SMART is Powered by: www.vertexenvironmental.ca Insitu Remediation
MTBE Fact Sheet #2 Remediation Of MTBE Contaminated Soil And Groundwater Background
 United States Office Of Solid Waste And EPA 510-F-98-002 Environmental Protection Emergency Response Agency (5401G) www.epa.gov/oust/mtbe/ Office Of Underground Storage Tanks MTBE Fact Sheet #2 Remediation
A Multi-Site Performance Review of Liquid Activated Carbon for Groundwater Treatment
 A Multi-Site Performance Review of Liquid Activated Carbon for Groundwater Treatment Doug Davis Director of Remediation Design, Central/East Region Technical Services Manager This presentation is the property
In-Situ Remediation of Chlorinated Solvent Source Zone using ZVI-Clay Treatment Technology
 In-Situ Remediation of Chlorinated Solvent Source Zone using ZVI-Clay Treatment Technology Detailed site assessment work at a manufacturing facility in South Carolina indicated that a former French drain
Phytoremediation of Persistent Organic Pollutants. John H. Pardue Louisiana State University
 Phytoremediation of Persistent Organic Pollutants John H. Pardue Louisiana State University Outline Technology description Laboratory and greenhouse evidence for mechanism Applications of technology Pilot
Site Verified Contaminant Transport Model as a Mathematical Vehicle for Prevention of the Natural Aquifer Contamination
 PUBLS. INST. GEOPHYS. POL. ACAD. SC., E-10 (406), 2008 Site Verified Contaminant Transport Model as a Mathematical Vehicle for Prevention of the Natural Aquifer Contamination Andrzej ANISZEWSKI Szczecin
In Situ and Ex Situ Biodegradation Technologies for Remediation of Contaminated Sites
 In Situ and Ex Situ Biodegradation Technologies for Remediation of Contaminated Sites Index 1.0 PURPOSE 2.0 INTRODUCTION 3.0 TECHNOLOGY DESCRIPTION 3.1 In Situ Bioremediation 3.1.1. Intrinsic In Situ Bioremediation
BIOVENTING. History. Where was the mass of contaminant going? The answer: Bacterial degradation!
 BIOVENTING History When SVE was implemented, progress of remediation was monitored by measuring the concentrations of contaminants in the extracted gas (Ca) and the depletion of contaminant mass in the
Tyree 26 Town Forest Road, Webster, MA Fax: Phone:
 Tyree 26 Town Forest Road, Webster, MA 01570 Fax: 508-640-0370 Phone: 508-640-0300 April 9, 2012 Massachusetts Department of Environmental Protection Northeast Regional Office 205B Lowell Street Wilmington,
EFFECTIVE CLEANUP AT LAWRENCE LIVERMORE NATIONAL LABORATORY: INNOVATIVE TECHNOLOGIES AND APPROACHES
 EFFECTIVE CLEANUP AT LAWRENCE LIVERMORE NATIONAL LABORATORY: INNOVATIVE TECHNOLOGIES AND APPROACHES Albert L. Lamarre Lawrence Livermore National Laboratory Kathy Angleberger U.S. Dept. of Energy Michael
Optimizing In Situ Bioremediation of Chlorinated Ethenes in British Columbia s Groundwater. SMART Remediation Vancouver, ON February 11, 2016
 Optimizing In Situ Bioremediation of Chlorinated Ethenes in British Columbia s Groundwater Phil Dennis SiREM SMART Remediation Vancouver, ON February 11, 2016 SMART is Powered by: www.vertexenvironmental.ca
HW6 - MGP Site Bioremediation
 HW6 - MGP Site Bioremediation 1. Given the following group of compounds commonly found in coal tars at MGP sites, determine the relative concentration and total mass of each in the air, water, and soil
Multiphase flow and enhanced biodégradation of dense non-aqueous phase liquids: experimental design
 Groundwater Quality: Natural and Enhanced Restoration of Groundwater Pollution (Proceedings of die Groundwater Quality 2001 Conference held at Sheffield. UK., June 2001). IAHS Publ. no. 275.2002. 265 Multiphase
1,4-Dioxane Remediation Technology Development An Overview Based on 70+ Projects
 1,4-Dioxane Remediation Technology Development An Overview Based on 70+ Projects Paul M. Dombrowski, P.E. NEWMOA 1,4-Dioxane Assessment & Remediation Workshop Outline Overview of AECOM 1,4-Dioxane Sites
In situ Remediation of 1,4-Dioxane using Electrical Resistance Heating
 In situ Remediation of using Electrical Resistance Heating Daniel Oberle, P.E. Emily Crownover, Ph.D. INTRODUCTION An increasing number of states are establishing enforceable 1,4-dioxane cleanup goals
In-situ Remediation Lessons Learned
 Slide 1 In-situ Remediation Lessons Learned John Sankey, P.Eng., True Blue Technologies, Long Beach, CA Vancouver, BC Slide 2 In-situ Remediation Lessons Learned Introduction Case studies LNAPL Remediation
FACT SHEET. SERDP Project ER New Developments in 1,4-Dioxane Site Management NOVEMBER David Adamson, Ph.D., P.E. GSI Environmental Inc.
 FACT SHEET New Developments in 1,4-Dioxane Site Management SERDP Project ER-2307 David Adamson, Ph.D., P.E. GSI Environmental Inc. NOVEMBER 2016 Distribution Statement A Page Intentionally Left Blank This
MNA PERFORMANCE EVALUATION FOR CONTAMINATED SITE REMEDIATION: FATE &TRANSPORT MODELING BASED APPROACH
 Congrès annuel de la Société canadienne de génie civil Annual Conference of the Canadian Society for Civil Engineering Montréal, Québec, Canada 5- juin / June 5-, MNA PERFORMANCE EVALUATION FOR CONTAMINATED
In Situ Thermal NAPL Remediation at the Northeast Site Pinellas Environmental Restoration Project
 ABSTRACT In Situ Thermal NAPL Remediation at the Northeast Site Pinellas Environmental Restoration Project R. Juhlin, M. Butherus S.M. Stoller Corporation 2597 B ¾ Road, Grand Junction, C0 81506 USA The
Obtaining Representative Groundwater Samples
 Obtaining Representative Groundwater Samples Two field studies demonstrating the effect of sampling method and device selection Water Technologies Symposium April 2016 Acknowledgments Clients Maxxam and
USGS Groundwater Quality Assessment in the Williston Basin
 USGS Groundwater Quality Assessment in the Williston Basin Joel Galloway Acting Director USGS North Dakota Water Science Center ND Water Quality Monitoring Conference Bismarck, ND March 2-4, 2016 U.S.
Interactions Between Biological and Abiotic Pathways in the Reduction of Chlorinated Solvents
 University of Nebraska - Lincoln DigitalCommons@University of Nebraska - Lincoln U.S. Environmental Protection Agency Papers U.S. Environmental Protection Agency 29 Interactions Between Biological and
Kerry Sublette, Eric Raes, Kate Clark, Dora
 An In Situ Bioreactor for Treatment of Hydrocarbon- Impacted Groundwater Kerry Sublette, Eric Raes, Kate Clark, Dora Taggart, Brett Baldwin, Anita Biernacki Bioremediation of Contaminated Groundwater In
Aerobic and Anaerobic Biodegradation. Danny Clark ENSO Bottles LLC 06/29/2010
 2010 Aerobic and Anaerobic Biodegradation Danny Clark ENSO Bottles LLC 06/29/2010 Aerobic and Anaerobic Biodegradation A look into aerobic and anaerobic biodegradation By Danny Clark ENSO Bottles, LLC
Table 1. VOCs Detections (all data in µg/l)
") AMBIENT WATER QUALITY IN THE UPPER GLACIAL AQUIFER NEAR THE TOWN OF BROOKHAVEN LANDFILL, SUFFOLK COUNTY, NEW YORK David J. Tonjes Waste Reduction and Management Institute Marine Sciences Research Center
AMBIENT WATER QUALITY IN THE UPPER GLACIAL AQUIFER NEAR THE TOWN OF BROOKHAVEN LANDFILL, SUFFOLK COUNTY, NEW YORK David J. Tonjes Waste Reduction and Management Institute Marine Sciences Research Center
U.S. EPA s Vapor Intrusion Database: Preliminary Evaluation of Attenuation Factors
 March 4, 2008 U.S. EPA s Vapor Intrusion Database: Preliminary Evaluation of Attenuation Factors Office of Solid Waste U.S. Environmental Protection Agency Washington, DC 20460 [This page intentionally
Enhanced Anaerobic Biodegradation of a Refinery Benzene Groundwater Plume
 Enhanced Anaerobic Biodegradation of a Refinery Benzene Groundwater Plume Robert (Rory) S. Johnston, PE Michael Eberle SAWEA CONFERENCE DECEMBER 2007 Presentation Outline Go With the Flow Anaerobic Process
Comparison of Three Numerical Models for Chain-Decay Transport Simulation at a Closed AFB in Texas
 Comparison of Three Numerical Models for Chain-Decay Transport Simulation at a Closed AFB in Texas Ming-Shu Tsou 1, Kan Tu 1, Jan Kool 1, Christopher J. Neville 2, Steven C. Young 1* 1 HydroGeoLogic, Inc,
Environmental Site Assessment for Limited Remediation Protocol
 Environmental Site Assessment for Limited Remediation Protocol Adopted by the Minister of Environment Pursuant to the Contaminated Sites Regulations Adopted by the Minister of Environment, Hon. Sterling
Natural Attenuation of Contaminated Soil and Ground Water at Agricultural Chemical Incident Sites Guidance Document 20
 Minnesota Department of Agriculture 625 Robert Street North St. Paul, MN 55155-2538 Pesticide & Fertilizer Management Division Telephone: 651/201-6061 Fax: 651/201-6112 www.mda.state.mn.us/incidentresponse
GROUNDWATER INFORMATION SHEET. Tetrachloroethylene (PCE)
") GROUNDWATER INFORMATION SHEET Tetrachloroethylene (PCE) The purpose of this groundwater information sheet is to provide general information regarding a specific constituent of concern (COC). The following
GROUNDWATER INFORMATION SHEET Tetrachloroethylene (PCE) The purpose of this groundwater information sheet is to provide general information regarding a specific constituent of concern (COC). The following