Report on: Scientific Review of British Columbia CSST Soil Standards Derivation Protocol
|
|
|
- Emery Alexander
- 5 years ago
- Views:
Transcription
1 Report on: Scientific Review of British Columbia CSST Soil Standards Derivation Protocol Submitted to: Ministry of Environment October 2005 Submitted by: Science Advisory Board for Contaminated Sites in British Columbia
2 Science Advisory Board for Contaminated Sites in British Columbia Department of Chemistry, University of Victoria PO Box 3065 STN CSC Victoria, BC V8W 3V6 Phone: PREFACE The analysis provided in this report is intended to support a larger objective. The SAB was asked by the Ministry of Environment (formerly Ministry of Water, Land and Air Protection) to (i) conduct a scientific review of the 1996 Contaminated Sites Standards Taskgroup (CSST) protocols for deriving environmental standards under the BC Contaminated Sites Regulation (BC CSR), and (ii) propose revisions based on technical/scientific advances, and in cases where a gap existed in the previous guidance. The formal objectives of the overall project are Review with an aim to providing the Ministry with detailed recommendations to update and revise the Ministry's existing CSST soil standards derivation protocol. The project will include consideration of screening risk assessment scenarios and approaches, in additions to the development of exposure scenarios and derivation equations for the newly defined Wildlands and Condominium land uses. This project also to include consultation with the broader contaminated sites stakeholder community of any recommended revisions or newly developed components proposed for the revised soil standards derivation protocol. This report comprises a portion but not the entirety of the protocols review [item (i) above]; in support of future recommendations on revisions to the derivation protocols for soil standards under the British Columbia Contaminated Sites Regulation [item (ii)]. The review project involved oversight by an SAB Task group co-chaired by Jean Cho, PhD, Dennis Konasewich, PhD, and Jim Malick, PhD - that was instrumental in advising on the direction and critical issues in the review. The SAB recognizes and appreciates the in-depth technical review provided by Limited, as summarized in this report. Readers should note, however, that the views expressed within the report may not necessarily reflect the views of the SAB or the Ministry of Environment. At the time of release of this report, work on revisions to the Contaminated Soil Standards Derivation Protocols for British Columbia was beginning in earnest. Any recommendations on revisions to the Protocols may require the consideration of issues that were beyond the scope of the Golder review: for example, a desire for consistency in technical/scientific objectives across various levels of application of generic to highly site-specific guidance on contaminated sites assessment and remediation, albeit with reduced uncertainty and an allied reduced conservatism for increasingly site-specific determinations. In addition, this report in a few cases may not adequately reflect a consensus on preferred technical approaches, as reflected in peer review comments received during or subsequent to the finalization of the report. As one example see the comment by Professor Mayer, Attachment 1. It is the expectation of SAB that further work will be required on some technical issues and proposed approaches toward achieving a stronger scientific consensus. Such issues may include, but might not be limited to (i) prediction of soil groundwater partitioning of metals/metalloids or other contaminants; (ii) requirements for obtaining soil vapour data for volatile contaminants; and (iii) soil standards for wildlands land-uses.
3 Science Advisory Board for Contaminated Sites in British Columbia Department of Chemistry, University of Victoria PO Box 3065 STN CSC Victoria, BC V8W 3V6 Phone: Acknowledgement The SAB appreciates the financial support of the Ministry of Environment in the form of conditional grants that allowed the SAB to undertake the development of Screening Risk Assessment tools for approved professionals. The SAB also acknowledges and appreciates support under the Conditional Grant Program that facilitated the review of the CSST Soil Standard Derivation Protocols. PLEASE DO NOT CITE OR QUOTE WITHOUT EXPRESS PERMISSION OF SAB

4 Report on: SCIENTIFIC REVIEW OF BRITISH COLUMBIA CSST SOIL STANDARDS DERIVATION PROTOCOL Submitted to: Department of Chemistry, University of Victoria PO Box 3065, Stn CSC Victoria, BC V8W 3V July 2005
 298-5253 REPORT ON SCIENTIFIC REVIEW OF BRITISH COLUMBIA CSST SOIL STANDARDS DERIVATION")


5 Ltd Still Creek Drive Burnaby, British Columbia, Canada V5C 6C6 Telephone (604) Fax (604) REPORT ON SCIENTIFIC REVIEW OF BRITISH COLUMBIA CSST SOIL STANDARDS DERIVATION PROTOCOL Submitted to: Science Advisory Board for Contaminated Sites in British Columbia Department of Chemistry, University of Victoria PO Box 3065, Stn CSC Victoria, British Columbia V8W 3V6 DISTRIBUTION: 2 Copies - Science Advisory Board for Contaminated Sites in British Columbia 3 Copies - Ltd. July OFFICES IN AUSTRALIA, CANADA, GERMANY, HUNGARY, ITALY, SWEDEN, UNITED KINGDOM, UNITED STATES
6 July i PREFACE This report, prepared by Ltd. (Golder) for the Science Advisory Board for Contaminated Sites in British Columbia (SABCS), is a scientific review of the B.C. Ministry of Environment Contaminated Sites Standards Task Group (CSST) soil standards derivation protocol. The current CSST soil standards derivation protocol (the CSST protocol ) was issued in The scope of the review focuses on scientific issues for derivation of soil standards based on potential risk to human and ecological receptors. The review is not intended to address policy issues, although instances where policy and science overlap are identified for consideration by the appropriate decision makers. While comprehensive, the review was not intended to be exhaustive, and focused on exposure scenarios and issues deemed to be of relatively high priority, based on consultation with SABCS. Furthermore, this report is not intended to be a protocol for derivation of soil standards, although elements of this work will be useful for this purpose. The review included the existing exposure scenarios defined by the CSST protocol (e.g., human health direct contact pathways; groundwater pathways [protection of aquatic life, drinking water, irrigation watering, livestock watering]; toxicity to soil invertebrates and plants, and livestock ingesting soil and fodder). Two new exposure pathways were considered: inhalation of vapour intrusion in buildings, as well as toxicity to small mammals and birds. Two new land use categories were considered: high density urban residential (for locations such as high-rise apartments or condominiums) and wildlands. The regulatory context for the review of CSST standards is that the application of standards is the first step in the evaluation of contaminated sites, and that if standards are exceeded, there are further screening level and detailed risk assessment tools that can be applied for the assessment of contaminated sites. It is thus important that soil standards be reasonably conservative, based on relatively simple approaches and models that are applicable to a broad cross-section of sites recognizing that, when needed, there is the option for higher level assessment. This document was authored by Peter Chapman, Ph.D., Ian Hers, Ph.D., Blair McDonald, M.E.T., R.P.Bio., Christine Thomas, M.Sc. and Reidar Zapf-Gilje, Ph.D. of Golder Associates Ltd. External peer review comments were provided by Anne Fairbrother, Ph.D. of the USEPA and Mark Richardson, Ph.D. of Health Canada. Review comments were provided by members of the SABCS CSST Review Task Group and the BC Ministry of Environment. The findings and recommendations are based on the current state of the science. As the practice of risk assessment advances, there will be new developments for soil standard protocol development, contaminant transport modeling, and assessment of exposure and risk to human and ecological receptors. These new advances should be incorporated into future updates to the protocol, as warranted.
7 July ii LIST OF ACRONYMS BAF BCE BCWLAP BW CCME COPC CSST DAF DTPA ECL ECO-SSL EC X -NL ERA ESSD X ET EU FIR HC X IRIS K d K OW LC X LOEAL LOEC MATC NOAEL NOEC NRC ORNL PAH PBPK PCBs PDMS QSAR R f C R f D RFP SAF SABCS SSD SSL TDI TEC TRV USEPA WQG Bioaccumulation factor British Columbia Environment British Columbia Ministry of Water, Land and Air Protection Body weight Canadian Council of Ministers of the Environment Contaminant of potential concern Contaminated Sites Standards Task Group Dilution attenuation factor Diethylenetriaminepentaacetic acid Effect concentration low Ecological soil screening level Effective concentration resulting in a X% decrease, but not lethal Ecological risk assessment Estimated species sensitivity distribution concentration corresponding to the Xth percentile Exposure term European Union Food ingestion rate Hazardous concentration resulting in a Xth percentile Integrated Risk Information System Partition coefficient Octanol water partition coefficient Lethal concentration resulting in a X% decrease Lowest observed adverse effect level Lowest observed effect concentration Median acceptable test concentration No observed adverse effect level No observed effect concentration National Research Council Oak Ridge National Laboratory Polycyclic aromatic hydrocarbon Physiologically based pharmacokinetic Polychlorinated biphenyls Polydimethylsiloxane Quantitative structure activity relationship Reference concentration Reference dose Request for Proposal Soil allocation factor Science Advisory Board for Contaminated Sites; SAB Species sensitivity distribution Soil screening level Tolerable daily intake Threshold effect concentration Toxicity reference value United States Environmental Protection Agency Water quality guideline
8 July iii TABLE OF CONTENTS SECTION PAGE 1.0 INTRODUCTION Scope of Review Report Organization GROUNDWATER MODELS Review of Selected Groundwater Models CSST Groundwater Model CCME USEPA Soil Screening Guidance Screening Level Risk Assessment 2 (SRA-2) Soil and Groundwater Module Comparison and Evaluation of Groundwater Models Model Scenario Model Framework and Approach Implications of Adopting the USEPA DAF Approach Applicable Chemicals Unsaturated Zone Partitioning Unsaturated Zone Transport Mixing of Leachate with Groundwater Saturated Zone Transport Implication of Proposed Changes for Metals Standards NAPL Issues Groundwater and Surface Water Mixing Groundwater Model Protocol Documentation...40 List of Specific Parameter and Equation Errors in Help File Summary of Recommended Changes HUMAN HEALTH PROTECTIVE STANDARDS GENERAL CONSIDERATIONS General Considerations Contaminant Classification Level of Protection Toxicity Reference Values Receptor Selection and Assumptions Exposure Period HUMAN HEALTH PROTECTION: VAPOUR INHALATION Review of Soil Vapour Guidance CCME CWS-PHC (2000) CCME Protocol (2005) USEPA Draft Vapour Intrusion Guidance (2003) Draft Health Canada and SRA-2 VI Guidance Comparison of CCME, USEPA and HC/SAB Guidance Proposed Protocol for Soil Vapour Intrusion Criteria or Standards General Considerations Applicable Media Preliminary Screening and Precluding Factors Chemical Screening Proposed Standards and Vapour Attenuation Factors Soil Vapour Inhalation Standard Risk Equations...76
9 July iv Example Soil Vapour Intrusion Standards Contaminant Mass Flux Check Summary of Recommendations HUMAN HEALTH PROTECTION: GROUNDWATER USED FOR DRINKING WATER Groundwater Model Drinking Water Guideline Values HUMAN HEALTH PROTECTION: INTAKE OF CONTAMINATED SOIL Review of Selected Derivation Protocols BCE CCME (2005) Discussion of Differences Basis of Soil Intake Guideline Absorption Factors Soil Allocation Factors Estimated Daily Intake Check Mechanisms Summary of Recommended Changes ENVIRONMENTAL PROTECTION: TOXICITY TO SOIL INVERTEBRATES AND PLANTS Review of Selected Derivation Protocols BCE (1996) CCME (2005) USEPA (2003a) Scientific Issue: Compiling and Screening Literature Toxicity Data Potential Influence of Scope of Literature Search Status of ECO-SSL Literature Searches Scientific Issue: Selecting Appropriate Toxicological Endpoints Scientific Issue: Selecting Appropriate Toxicity Statistics Scientific Issue: Incorporating Bioavailability in the Derivation Protocol Introduction to the Issue Surrogate Methods for Measuring Bioavailability/ Bioaccessibility Equilibrium partitioning Chemical Extractions Solid-Phase Extraction Differential Bioavailability/Bioaccessibility between Laboratory and Field-Based Toxicity Testing How is Bioavailability/Bioaccessibility Addressed in Existing Protocols? Scientific Issue: Use of Species Sensitivity Distributions versus Lowest Toxicity Value Divided by an Uncertainty Factor Introduction to the Issue Derivation Methods Currently in Use Using Separate or Combined Distributions for Plants and Invertebrates Summary of Proposed Derivation Methodology ENVIRONMENTAL PROTECTION: TOXICITY TO SMALL MAMMALS AND BIRDS Review of Selected Derivation Protocol (USEPA, 2003a) Scientific Issue: Compiling and Selecting Appropriate Toxicity Data...140
10 July v Scientific Issue: Selecting Appropriate Receptors of Concern Scientific Issue: Receptor Parameterization Scientific Issue: Allometric Scaling Food Ingestion Rates Toxicity Reference Values Scientific Issue: Incorporating Bioavailability in the Derivation Protocol In Vivo Laboratory Experiments In Vitro Digestion Models for Soil Measurement of Relative Bioavailability Using In Vitro Models Application of In Vitro Digestion Models to Soil Standard Development Linkages Between Proposed Soil Standards and Ecological Risk Assessment Summary of Proposed Derivation Methodology ENVIROMENTAL PROTECTION: GROUNDWATER FLOW TO SURFACE WATER USED BY AQUATIC LIFE Groundwater Models Ambient Water Quality Guideline Values LIVESTOCK INGESTING SOIL AND FODDER Review of Selected Derivation Protocols Scientific Issue: Parameterization of Food Chain Model Apportionment Receptor Parameters Scientific Issue: Soil-to-Plant Bioaccumulation Factors Scientific Issue: Updates in Available Toxicity Data MATRIX PATHWAYS NOT REVIEWED HIGH DENSITY URBAN RESIDENTIAL LAND USE Land Use Scenario Application to Human Health Matrix Standards ANZECC Approach Develop Quantitative Exposure Factors Approach Qualitative Exposure Pathway Approach Application to Environmental Matrix Standards Proposed Land Use Standards WILDLANDS LAND USE Land Use Scenario Application to Human Health Matrix Standards Application to Environmental Matrix Standards CLOSURE REFERENCES Groundwater Model (Section 2.0) Soil Vapour (Section 4.0) Human Health Matrix Standards and Human Health Protection: Groundwater Used for Drinking Water (Sections 3, 5 and 6) Environmental Matrix Standards...177
11 July vi LIST OF TABLES Table 2.1 Comparison of Model Inputs for Non-Ionizing Organic Chemicals Table 2.2 Predicted Soil Water Contents Using Van Genuchten Model Table 2.3 Comparison of Soil Screening Levels Calculated with CSST and USEPA Recommended Soil-water Partition Coefficients Table 2.4 Comparison of Dilution Factors for Different Groundwater Mixing Models Table 2.5 Comparison of Dilution Factors for Different Groundwater Mixing Models Inputs Table 2.6 Comparison of BTEX Chemical Half-lives for First-Order Biodegradation Table 3.1 Human Receptor Characteristics Adopted by CSST (BCE 1996) and CCME (2005)/Health Canada (2004a) Table 3.2 Human Health Exposure Assumptions for Each Land Use Based on Existing CSST Protocol Table 4.1 Comparison Guidance Vapour Attenuation Factors Table 4.2 Preliminary Vapour Attenuation Factors for Standard Development Purposes Table 4.3 Example Soil Vapour Matrix Table Table 4.4 Example Standards for Vapour Intrusion Pathway Table 4.5 Physical-Chemical Properties and Toxicity Reference Values Table 5.1 Comparison CSR Schedule 6 and Canadian Federal Water Quality Guidelines Table 6.1 Pathway Specific Soil Standards for Cadmium and Chromium for the Commercial Land Use Scenario (mg/kg) Table 6.2 Summary of Recommended Changes to Existing CSST Protocol Table 7.1 Status of ECO-SSL Literature Reviews For Soil Invertebrates and Plants (June 2005) Table 7.2 Examples of Qualitative Bioavailability Ratings Based on Soil Properties (From USEPA, 2003a) Table 10.1 Differences in Parameterization for Cattle Table 12.1 Summary Of Land Use Standards Proposed For The Hdur Scenario LIST OF FIGURES Figure 2.1 K oc as a Function of ph for PCP (from SAB, 2004) Figure 2.2 Empirical K d Values Compiled by Sauve et al. (2000). Purple symbols are CSST values, orange symbols are USEPA SSL values. Figure 2.3 Predicted Benzene Attenuation using CSST Saturated Zone Model Figure 2.4 Predicted Toluene Attenuation using CSST Saturated Zone Model Figure 2.5 Predicted Benzo (a) Pyrene Attenuation for CSST Saturated Zone Model Figure 2.6 Biodegradation rate constants (λ) and Bulk Attenuation Rate Constants (k) for BTEX compounds from the literature (adapted from Rafai and Newell, 2001) Figure 4.1 Flow Chart for Health Canada SLRA Vapour Intrusion Guidance Figure 4.2 Framework for Generic Soil Vapour Intrusion Standards. Figure 4.3 Health Canada/SAB SRA-2 Vapour Attenuation Factor Charts Figure 4.4 Conceptual Model for Groundwater Mass Flux Adjustment
12 July vii Figure 7.1 Figure 7.2 Figure 13.1 Conceptual Model of Bioavailability Versus Bioaccessibilty in Soil (from Semple et al. 2004) Procedure for Deriving Wildlife Toxicity Reference Values (From USEPA, 2003A) Summary of Matrix Standards Applicable to Wildlands LIST OF APPENDICES Appendix I Review of Metals Partitioning for Generic Soil Standard Development. Appendix II Overview of CSST Procedures for the Derivation of Soil Quality Matrix Standards for Contaminated Sites.
13 July INTRODUCTION The Science Advisory Board for Contaminated Sites in British Columbia (SABCS) contracted Ltd (Golder) to conduct a scientific review of the B.C. Ministry of Water, Land and Air Protection s (BCWLAP) Contaminated Sites Standards Task Group (CSST) soil standards derivation protocol. The current CSST soil standards derivation protocol (the CSST protocol ) was issued in 1996 (BCE, 1996). SABCS requested a scientific review to address the following questions: Is the current CSST protocol scientifically sound? Have there been significant scientific developments in the last decade that should be incorporated into the CSST protocol? To the extent that the CSST protocol (or its associated default toxicological and/or hydrogeological parameter values) may not be scientifically sound or up-to-date, how should the protocol or the default parameter values of the protocol be revised or replaced? Specific recommendations to improve its scientific viability were requested. Are there exposure scenarios that are not adequately addressed by the CSST protocol? If so, how should these exposure scenarios be addressed? 1.1 Scope of Review The scope of the scientific review was developed in consultation with SABCS based on: a) the original Request for Proposal (RFP) dated October 6, 2004, b) Golder s response to the SABCS RFP, and, c) an initial kick-off meeting held January 21, 2005 between representatives from the Golder study team, SABCS, and BCWLAP. The scope of this review was limited by the following considerations: To the extent considered practical and appropriate, proposed revisions to the CSST protocol need to be harmonized with the contaminated site soil and water guideline derivation protocols of the Canadian Council of Ministers of the Environment (CCME). This review was not intended to provide an exhaustive analysis of derivation methodologies from all jurisdictions; rather, the review focused on differences between the existing methodology (BCE, 1996) and selected recent guidance documents (CCME, 2005; USEPA, 2003a). Guidance documents from other jurisdictions were reviewed on a case-by-case basis.
14 July The review was limited to those scientific concepts and approaches that were found to be sufficiently developed and/or validated to a level appropriate for regulatory use. This consideration was intended to act as a reality check on any proposed modifications to the existing CSST protocol. A review of policy decisions inherent in the existing derivation methodology was not included, except in those instances where policy decisions may be influenced by the findings of the technical review. We have identified instances where policy and science overlap for consideration by the appropriate decision makers. The following high priority review tasks were identified based on the original RFP and input from SABCS during the initial kick-off meeting: Propose defined exposure scenarios and derivation protocols for deriving new soil standards, if appropriate, for Wildlands and for High-Density Urban Residential settings such as high-rise apartments and condominiums. Propose methods to derive standards to address human exposure to soil- or groundwater-derived contaminants in indoor air via soil vapour intrusion into buildings. Propose methods to derive standards to address wildlife exposure to soil-derived contaminants (if the scientific review demonstrates that inclusion of such standards is defensible and appropriate). The regulatory context for the review of CSST standards is that the application of standards is the first step in the evaluation of contaminated sites, and that if standards are exceeded, there are further screening level and detailed risk assessment tools that can be applied for the assessment of contaminated sites. It is important that soil standards be reasonably conservative, based on relatively simple approaches and models that are applicable to a broad cross-section of sites, recognizing that, when needed, there is the option for higher level assessment. While not the focus of this assessment, it is essential that the broader implications of this review in relation to other regulatory guidance and standards in British Columbia be recognized. The scientific concepts, assumptions and approaches, where appropriate, should be consistent within the regulatory guidance and tools for assessment of contaminated sites.
15 July Report Organization The existing CSST protocols include derivation methods for a broad variety of land uses, human and environmental receptors, and environmental media, which resulted in a scientific review that, by necessity, covered a diverse variety of technical issues. We have opted to organize our scientific review by major topics such as matrix pathways, or proposed new land use classifications. A number of technical issues were applicable to multiple Schedule 5 matrix pathways (e.g., groundwater modeling), and therefore, are presented as separate sections. Our report is organized as follows: Section 1: Introduction and project overview. Sections 2-3: Technical issues common to multiple matrix standards. Section 2 provides recommendations regarding the groundwater models, while Section 3 provides a review of receptor parameters that are common to multiple human health matrix standards. Sections 4-6: Human health matrix standards. Section 4 provides recommendations regarding evaluation of soil vapour intrusion into buildings and development of standards for vapour inhalation. Section 5 provides a review with respect to drinking water standards (which share elements with the groundwater model review in Section 2), while Section 6 addresses standards for the ingestion of contaminated soil. Sections 7-10: Environmental matrix standards. Section 7 is focused on standards for the protection of soil invertebrates and plants. Section 8 provides recommendations for a derivation methodology for the protection of small mammals and birds. Section 9 provides a review of potential changes to soil standards for the protection of groundwater flow to surface water to aquatic life (which share elements with the groundwater model review in Section 2). Section 10 provides a review with respect to the livestock ingesting soil and fodder standards. Section 11: This section summarizes matrix standards that were not included in this scientific review since the scope for this project was insufficient to address these scenarios. Section 12: This section describes the proposed scenario for the High Density Urban Residential land use, and provides recommendations regarding the application of selected matrix standards. Section 13: This section describes the proposed scenario for the Wildlands land use, and provides recommendations regarding the application of selected matrix standards. Section 14: References consulted in the preparation of this scientific review.
16 July GROUNDWATER MODELS The groundwater model adopted by CSST was an integral part of the protocol used to back-calculate matrix soil standards for the protection of groundwater. This section of the report evaluates the groundwater fate and transport model used for this purpose. To simplify the discussion, the groundwater model adopted by CSST, as described in the CSST protocol, is referred to as the CSST model (BCE, 1996). Groundwater models adopted or proposed by other agencies are also reviewed. This includes a model by USEPA used to develop soil screening levels (SSLs), as documented in the USEPA Soil Screening Guidance (USEPA, 1996), henceforth referred to as the USEPA model, a groundwater model proposed by the Science Advisory Board (SAB) of British Columbia, as documented in the Screening Risk Assessment Level 2 protocol (SAB, 2004), henceforth referred to as the SRA-2 model, and a groundwater model proposed by CCME, as documented in their draft Protocol for the Derivation of Environmental and Human Health Soil Quality Guidelines, (CCME, 2005), henceforth referred to as the CCME model. 2.1 Review of Selected Groundwater Models CSST Groundwater Model Matrix soil standards for the protection of groundwater were derived using a groundwater transport model that simulates the movement of a contaminant from the soil to the groundwater, and the subsequent movement of the contaminant in the groundwater to a receptor. The model was developed by BC Environment, with the assistance of Golder Associates Ltd., and was based on the framework described in the draft USEPA Soil Screening Guidance (USEPA, 1994). Contaminant transport is modeled through four chemical/physical compartments, consisting of: (i) contaminant partitioning between soil, soil pore air, and soil pore water; (ii) contaminant leachate movement and attenuation through the unsaturated soil zone; (iii) contaminant leachate mixing with the groundwater, and (iv) contaminant movement and attenuation through the saturated groundwater zone to a receptor. Using this model, soil-groundwater protective standards were derived for the protection of drinking water, livestock watering, irrigation watering and use by aquatic life. The unsaturated zone transport ((ii), above) mixing of leachate of with groundwater (iii) and contaminant transport in the aquifer (iv) can be characterizing using a Dilution Attenuation Factor (DAF), which is the ratio between the leachate concentration at the contamination source and the groundwater concentration at the receptor. A leachate
17 July concentration that is protective of groundwater is back-calculated by multiplying the groundwater standard for a given constituent by the DAF. 1 Exhibits containing the model equations and default parameters for the CSST groundwater model are provided in Appendix II. The four chemical/physical compartments are described below. Unsaturated Zone Chemical Partitioning A linear distribution coefficient is used to describe the partitioning between the sorbed and aqueous phases ( K d model ). The partitioning of non-polar organic chemicals is a function of the organic carbon partitioning coefficient (K oc ) of the contaminant and the amount ( fraction ) of organic carbon (f oc ) in the soil. For weakly ionizing organic chemicals, such as pentachlorophenol, partitioning in the model is additionally influenced by the ph of the soil. The CSST protocol recognized that the partitioning of inorganic constituents was considerably more complex than for organic compounds, being additionally dependent on factors such as ph, sorption to clays, organic matter, iron oxides, oxidation/reduction conditions, major ion chemistry and the chemical form of the metal. However, to simplify the partition model, the distribution coefficients (K d ) used in the model were calculated as a function of ph, and as a function of an idealized soil with assigned physical and chemical characteristics. A detailed review of the CSST approach used to derive metal K d s and issues for prediction of metals partitioning is provided in Appendix I. Unsaturated Groundwater Zone The unsaturated zone groundwater transport model is a one-dimensional model for advection, dispersion, sorption, and first-order decay. The matrix soil standards were developed based on the default assumption that contamination is in contact with the saturated zone. Therefore, unsaturated zone processes are effectively turned off in the calculation of the matrix numerical soil standards. Groundwater Mixing Zone A groundwater mixing zone model is used to represent the dilution of leachate entering groundwater at the interface between the unsaturated zone and saturated zone. The mixing model is based on a mass-balance approach and considers the infiltration of leachate into the groundwater and mixing of chemicals in leachate within groundwater flowing through the aquifer, beneath the contamination source area. 1 The dilution attenuation factor (DAF) is different from the dilution factor (DF), defined in the CSST model, which is limited to mixing of leachate with groundwater.
18 July The mixing depth is calculated using an equation (Appendix II, Exhibit 6) that considers both vertical dispersion of the contamination along the length of the source area and mixing due to the downward velocity of the infiltrating leachate. The equation can, under certain circumstances, calculate a mixing zone thickness greater than the aquifer thickness (assumed to be 5 m for generic guideline development); if this occurs, the mixing depth should be set at the aquifer thickness. Saturated Zone Transport The groundwater model includes the Domenico and Robbins transient analytical equation to evaluate lateral saturated zone transport to a downgradient receptor. The analytical equation simulates one-dimensional uniform groundwater flow, three-dimensional dispersion, sorption and first-order decay. For the development of soil standards, no vertical dispersion was allowed and it was assumed that the distance to the receptor (well, surface water body) was 10 m. The saturated zone transport model requires that a saturated zone biodegradation rate be defined. For organic chemicals, the half-life chosen was obtained from literature values where the half-life was equal to 50 percent of anaerobic rate low (highest number of days) (Appendix II, Table B-2). For non-degrading chemicals (metals, PCB s), the model runs did not allow for contaminant decay. Since the saturated zone transport equation is time-dependent, the maximum concentration of the chemical at the receptor would be expected to occur at some time in the future, depending on the groundwater velocity and the retardation and decay of the chemical. Since source-depletion was not considered in the development of soil standards, the predicted concentration of the chemical at the receptor will eventually become stable. The default time used to calculate the downgradient concentration for derivation of the CSR Schedule 5 matrix soil standards was set at 2,200 years (personal communication, Mr. George Szefer, MWLAP, April 29, 2005). The CSST protocol documentation indicated a default time of 100 years (Appendix II, Exhibit 7). The rationale for the default travel time selected is not documented. As discussed in Section of this report, model simulations with a travel time of 2,200 years indicate that this is sufficient time for quasi-steady state conditions to develop for most Schedule 5 chemicals, with the exception of a few metals and higher molecular weight organics. Rationale for Use of CSST Groundwater Model As described in BCE (1996), BC Environment recommended its four component model because: the major transport processes are represented;
19 July the major variables affecting each of the transport components are included, can be identified, and can be modified; physical and chemical effects are considered; model assumptions and criteria derivations are "transparent"; the model can be calibrated; the model performs with reasonable accuracy using a small set of input parameters; the accuracy and reliability of the model increases as site specific information increases; the model can be used with assumed site characteristics or use site specific data; and, the model is scientifically based and defensible. Attenuation within the model is essentially confined to adsorption-desorption reactions (partitioning), dilution (mixing between contaminated leachate and groundwater), biological degradation (for organics only) and dispersion. CSST Groundwater Model Assumptions BCE (1996) indicates that the CSST groundwater model was based on assumptions generally typical of the climatic conditions of the lower Fraser River and Vancouver, and assumed groundwater characteristics typical of those found within the Fraser River sands of the Fraser River delta area. Other assumptions include: the site is medium sized (between 1,500 m 2 and 12,000 m 2 ); the total volume of contaminated soil is less than 450 cubic metres (5 m x 30 m x 3 m); the depth to groundwater is not more than three (3) metres; the distance to the receptor is at least 10 metres; the soil is physically and chemically homogeneous; the organic content of the soil is at least 0.6 percent;
20 July the moisture content is uniform throughout the unsaturated zone; the porosity of the soil is 30 percent, and 10 percent of the pore volume is water filled; the infiltration rate is uniform throughout the unsaturated zone; flow in the unsaturated zone is assumed to be one dimensional and downward only, with dispersion, retardation and biological degradation; the contaminant is not present as a free product phase (i.e., a non-aqueous phase liquid); the maximum concentration in the leachate is equivalent to the solubility limit of the chemical in water under the defined site conditions; the aquifer is unconfined; the groundwater flow is uniform and steady; co-solubility and oxidation/reduction effects are not considered; dispersion includes both mechanical dispersion and diffusion, and is assumed to occur in the longitudinal and horizontal transverse directions only; mixing of the leachate with the groundwater is assumed to occur through mixing of leachate and groundwater mass fluxes; and, dilution by groundwater recharge down gradient of the source is not included. Water Quality Standards Used to Derive Soil Standards The groundwater transport model derives soil concentration standards to ensure that the contaminant concentrations in the groundwater discharging and in contact with a receptor are less than or equal to established substance-specific water quality criteria for the receptor (i.e. aquatic life) or water use (i.e. irrigation watering, livestock watering or drinking water) of concern. BCE (1996) indicated that for the aquatic life pathway, surface water quality criteria were used to back-calculate soil standards. However, BCE policy was revised shortly after the publication of the above documents in that the surface water criteria was replaced with the water standard applicable to groundwater. The groundwater standard is typically 10 times greater than the surface water criteria, under the assumption that a minimum 10-fold dilution of groundwater would occur at the
21 July discharge point to the surface water body. In summary, the applicable matrix soil standards (CSR Schedule 5) were derived using the following water standards: Groundwater flow to surface water used by aquatic life: CSR Schedule 6 AW Standard; Groundwater used for livestock watering: CSR Schedule 6 LW Standard; Groundwater used for irrigation watering: CSR Schedule 6 IW Standard; and, Groundwater used for drinking water: CSR Schedule 6 DW Standard. The above water standards are evaluated in Section 5.0 of this report CCME The draft CCME protocol (CCME, 2005) provides methodology for the derivation of soil guidelines for the protection of (i) potable (drinking) water, (ii) groundwater used for agricultural uses (livestock watering and irrigation), and (iii) freshwater life in nearby surface water. The CCME groundwater model is the CSST 1996 groundwater model developed by the British Columbia Contaminated Sites Soil Taskgroup (CSST). While the model is identical, the CCME values for some input parameters are different than those assumed by CSST. In addition, CCME includes separate input parameters for coarse- and fine-grained soils. The allowable concentration of the chemical in groundwater at the receptor is the appropriate water quality guideline for the pathway. For the aquatic life pathway, CCME (2005) assumes a 10 m separation distance between the contamination source and the surface water body. For the development of generic guidelines, it is assumed that a water well or livestock dugout could be installed at the edge of (or even within) the boundaries of the remediated area. Therefore, no saturated zone transport is assumed, and instead the receptor concentration is assumed to be equal to the concentration in groundwater after mixing of leachate with groundwater for the water well or dug out pathways. The CCME protocol only applies to organic compounds due to the highly site-specific nature of partitioning for inorganic chemicals and the lack of generalized modeling techniques appropriate for inorganic substances. The CCME protocol indicates that where groundwater pathways may be of concern for sites contaminated by metals, these pathways should be addressed on a site-specific basis; this would likely include measurement of metals in groundwater at the source and/or at the point of exposure. The CCME protocol concludes that generalized techniques for evaluating the partitioning and transport of inorganic substances that are appropriate for generic guidelines are not expected to be developed in the foreseeable future.
22 July USEPA Soil Screening Guidance The USEPA Soil Screening Guidance (1996) provides a methodology for deriving soil screening levels (SSLs) for the protection of groundwater (drinking water). The SSLs are intended as a tool to facilitate prompt identification of contaminants and exposure areas of concern. USEPA (1996) indicates that SSLs can be used as Preliminary Remediation Goals (PRGs) provided that appropriate conditions are met (i.e., conditions found at a specific site are similar to conditions assumed in developing the SSLs). The development of soil leachate SSLs is based upon a two-step process. The first step is the development of a Dilution Attenuation Factor (DAF). The DAF accounts for leachate mixing and attenuation in the aquifer. A leachate concentration that is protective of groundwater is back-calculated by multiplying the groundwater standard for a given constituent by the DAF. That leachate concentration is then used to back-calculate a SSL that is protective of groundwater using a simple linear equilibrium soil/water partition equation. For the generic SSL approach, default parameter values are used for all nonchemical specific parameters. At sites that are not adequately represented by the default values and where more site-specific data are available, it may be more appropriate to use the site-specific SSL model. USEPA (1996) selected a dilution attenuation factor (DAF) of 20 to account for contaminant dilution and attenuation during transport through the saturated zone to a receptor well. The USEPA selected a DAF of 20 using a weight-of-evidence approach that considered the results of modeling conducted using two models: (i) the USEPA Composite Model for Leachate Migration with Transformation Products (EPACMTP), developed by the Office of Solid Waste (OSW), and (ii) the SSL dilution model, described below. The models were run using inputs based on data from 300 groundwater sites across the USA. The default DAF of 20 represents an adjustment from the DAF of 10 presented in the December 1994 draft Soil Screening Guidance (USEPA, 1994) to reflect a change in default source size from 30 acres to 0.5 acre. A DAF of 20 is protective for contamination sources up to 0.5 acre in size, although analysis by USEPA indicates that it can be protective of larger sources, as well. The default DAF assumes that contamination is located above the water table. The EPACMTP is a model for one-dimensional leachate transport in the unsaturated zone, mixing of leachate with groundwater, and three-dimensional transport in groundwater. Linear- and non-linear sorption and decay processes are included in the model. The model includes a Monte Carlo module, which generates model parameters from probability distributions representative of conditions across the USA. The key assumptions for generating the default DAF were:
23 July (i) (ii) (iii) The drinking water well is located next to the contamination source (no horizontal separation distance for transport). There is no chemical attenuation through sorption or decay. The well intake is located between 15 and 300 feet below the water table, thus providing for mixing of contaminants within the aquifer. Probabilistic modeling was conducted assuming varying inputs for contamination source size, location of the well relative to the plume, and hydrological parameters (e.g., infiltration, groundwater flow rate, dispersivity). The USEPA also evaluated dilution between leachate at a soil contamination source, and groundwater at a receptor using a mass-balance model that only incorporated dilution through mixing of leachate below the water table beneath the contamination source area. The SSL dilution model is identical to that incorporated in the CSST groundwater model, except that a slightly different model is used for calculation of the mixing zone depth. The USEPA mixing depth model is consistent with that used in the MULTIMED model (Sharp-Hansen et al., 1990) and the EPA CMTP model. The USEPA protocol applies to both organic and inorganic chemicals. The partitioning model used by USEPA to assess inorganic chemicals is described in detail in Appendix I Screening Level Risk Assessment 2 (SRA-2) Soil and Groundwater Module In October 2004, the SAB prepared a draft report entitled Screening Level Risk Assessment 2 (SRA-2) Soil and Groundwater module, which presents a proposed protocol for screening level risk assessment in British Columbia. The Soil Module is designed to evaluate the potential for unsaturated zone contaminant migration from soil to groundwater, and the Groundwater Module is designed to evaluate the potential for contaminant migration in groundwater to a down-gradient receptor. The purpose of the protocol is to provide practitioners a tool to estimate the receptor concentration for screening risk assessments. While the protocol is not intended to back-calculate soil standards, there are useful concepts in the protocol that are described below. The SRA-2 soil and groundwater modules cannot be applied if any of the following precluding factors exists: Soil or groundwater contamination occurs in fractured bedrock; The contaminant of potential concern (COPC) is an ionizing organic compound and the soil ph is either less than 4.9 or greater than 8.0;
24 July The COPC is an inorganic element or compound; and, Potentially mobile non-aqueous phase liquid (NAPL) exists in soil or groundwater. The SRA-2 Soil Module for organic chemicals uses the same linear distribution coefficient ( K d model ) as that in the CSST groundwater model. The Soil Module can not be used for inorganic compounds, but instead leaching tests are proposed to evaluate unsaturated zone leaching of inorganic constituents. The rationale for excluding inorganic chemicals is that metal release and mobility is highly variable and influenced by numerous site specific processes. There is large variability in measured K d values, and comparisons between model-predicted and measured K d values suggest that it is difficult to describe this natural variability with generic values, even if ph-dependency is included. The SRA-2 Groundwater Module includes several precluding factors, which indicate the Module cannot be used if any of the following are true: the receptor is a water supply aquifer (i.e., DW, IW, LW) and the groundwater plume has traveled beyond the property boundary; the distance between the contaminated site and a potential receptor is less than 30 m; and, the compound in question decays to harmful daughter products that have been detected in groundwater (e.g., transformation of certain chlorinated solvent compounds). Some of the above factors relate to science policy decisions and do not necessarily pertain to the validity of the model. The SRA-2 Groundwater Module incorporates a dilution model for mixing of leachate with groundwater beneath the contamination source, and a groundwater transport model, for simulating solute transport with groundwater away from the contamination source zone. The groundwater mixing model is identical to the USEPA Soil Screening Guidance (1996) mixing model. The groundwater transport model uses a onedimensional solution by Bear (1979) to the first-order reactive transport equation. The model is a steady-state solute transport model, and only accounts for longitudinal dispersion, and assumes that there is no lateral or vertical dispersive spreading of the plume. The context for the SRA-2 groundwater tool is screening level risk assessment. There is the option to use more sophisticated groundwater models in a subsequent detailed risk assessment phase.
25 July Comparison and Evaluation of Groundwater Models Model Scenario The CSST model scenario for development of the CSR matrix soil standards makes certain assumptions on the size and location of the contamination source and distance, selects a representative site for estimation of hydrogeological properties (e.g., Fraser River sand deposits; site located in the Fraser River delta area) and distance from the contamination source to the receptor (i.e., 10 m). The size of the contamination source does not affect the model predictions, as discussed in Section of this report. The location of the soil contamination source, assumed to be directly above the water table, is considered reasonably conservative. While there would be less mixing of contaminants leaching from impacted soil below the water table, the typical approach for this particular scenario is to evaluate regulatory compliance on the basis of groundwater quality monitoring. The influence of hydrogeological conditions on model predictions is addressed in the sections below. Overall, the assumptions related to Fraser River sand properties and location (Lower Mainland) may be reasonably conservative. It is noted that many of the contaminated sites in British Columbia are located within the Lower Mainland. A distance of 10 m to the receptor (i.e., surface water body, well) is considered reasonable for most contaminated sites in BC Model Framework and Approach The CSST and CCME groundwater model frameworks are identical, each consisting of a four-component analytical model. While certain elements of the CSST and USEPA groundwater models are similar, the USEPA only considered one groundwater scenario (transport to a receptor well) and used a different modeling approach (multiple models and a weight-of-evidence approach) to select a single default dilution attenuation factor (DAF equal to 20) for all chemicals of concern. The USEPA selected a default DAF of 20 based on a comprehensive modeling effort that involved the use of two different models and selection of input parameters using a probabilistic approach. The USEPA conducted simulations for a variety of site sizes and combinations of input parameters based on field data from hundreds of sites from across the USA. The approach has undergone a relatively extensive review including a review by the USEPA Science Advisory Board.
26 July The SRA-2 protocol is designed as a tool to facilitate derivation of site specific standards, and comprises two distinct modules ( Soil and Groundwater Modules ) for evaluation groundwater flow to a surface water body. The main differences between the CSST and SRA-2 models are that the SRA-2 model (i) incorporates the use of leaching tests to evaluate metals partitioning, (ii) does not include unsaturated zone transport, and (iii) assumes steady state conditions for groundwater (saturated zone) transport. As described in the SRA-2 report, the BC SAB also recommended as part of their review that a DAF of 20 be adopted for a receptor well scenario. At this time, it is recommended that a fourcomponent model be retained for both the drinking water and aquatic life scenarios, since different approaches for the two scenarios (i.e., DAF of 20 for water-well scenario and four-component model for aquatic life scenario) will result in inconsistent standards, as described in Section below. Although the CSST protocol and SRA-2 groundwater models are used for different purposes, the models should generally be consistent in their formulation and non-site specific model input parameters. Certain aspects of the CSST protocol review could be useful for refinement of the SRA-2 model and development of supplementary modeling tools to SRA-2. Recommendations Retain a multi-component analytical model consisting of (i) unsaturated zone partitioning, (ii) groundwater mixing, and (iii) saturated zone transport; however, consider refinements to the model and input parameters described in the sections below. Unsaturated zone transport does not affect the calculation of soil standards based on the current model scenario; therefore, at least for purposes of generic standard derivation, the unsaturated zone component could be removed from the model framework Implications of Adopting the USEPA DAF Approach The implications of adopting the USEPA DAF approach are discussed both in terms of implications for soil standards for protection of drinking water, and consistency between the water-well and aquatic life scenarios. The DAFs for individual chemicals and ph conditions, calculated using the current CSST model and inputs, are both greater than and less than the USEPA DAF of 20. A fixed DAF of 20 for the groundwater flow to a drinking water well scenario could result in either higher or lower soil standards depending on the soil-water partitioning coefficient (K d ), biodegradation half-life (for organics) and transport simulation time. Compared to a DAF of 20, in general, higher standards would be predicted for compounds with lower soil-water partition coefficients and moderate to high half-lives (e.g., benzene,
27 July trichloroethylene, tetrachloroethylene, pentachlorophenol) while lower standards would be predicted for compounds with higher soil-water partition coefficients (e.g., benzo(a)pyrene). For several metals, lower standards would be predicted at higher ph (corresponding to higher K d s), assuming transient conditions (e.g., 2,200 years). Considering the extensive analysis and review the USEPA approach has been subjected to, adopting the USEPA DAF potentially has merit; however, there are implications if a different approach (i.e., CSST model) is used for the groundwater flow to surface water scenario. For example, for benzo(a)pyrene, adopting a DAF of 20 would result in a soil standard for the protection of drinking water of 4 mg/kg. In contrast, using the CSST model there would be no soil standard possible for the protection of aquatic life (i.e., NS designation in the Contaminated Site Regulation) based on a higher DAF and groundwater concentration above the solubility limit. Different modeling approaches should not be used for the drinking water and surface water scenarios when significant differences in standards could result that are not supported based on science. Therefore, the USEPA DAF approach is not recommended at this time, and instead a multicomponent model consistent with the current CSST approach is recommended Applicable Chemicals The CSST and USEPA protocols are applied to both inorganic and organic chemicals. The CCME groundwater protocol only applies to organic chemicals since it is not considered appropriate by CCME at this time to develop generic nation-wide guidelines for metals due to the variability and uncertainty in partitioning relationships for metals. The SRA-2 protocol takes a similar approach to CCME as the model only applies to organic chemicals. Site-specific leaching tests are proposed for inorganic chemicals to quantify partitioning in the unsaturated zone between soil and water Unsaturated Zone Partitioning Non-ionizing Organics Model Characteristics: The CSST protocol, USEPA and CCME protocols use the same model for unsaturated zone partitioning of non-ionizing hydrophobic organics: C t = C w /ρ b *(K oc *f oc + θ w + θ a *H ) (2.1) where C t is the total soil concentration (mg/kg), C w is the soil-water concentration (mg/l), K oc is the organic carbon-water partition coefficient (L/kg), f oc is the fraction organic carbon (dimensionless), θ w is the water-filled porosity (dimensionless), θ a is the air-filled porosity (dimensionless), H is the Henry s Law constant (dimensionless) and ρ b is the bulk dry density (kg/l).
28 July The linear equilibrium partitioning model based on organic carbon content is widely used for non-ionizing organics. Numerous studies have shown that sorption of organics by soils is highly correlated with the organic matter content (e.g., Chiou et al. 1979, Hassett et al. 1980), provided the f oc is above a critical level. USEPA (1996) suggests that when f oc is below about 0.001, adsorption to inorganic mineral surfaces becomes important. For most non-ionic organics, sorption is a linear function of equilibrium solution concentration up to 60 percent to 80 percent of its water solubility (Hassett and Banwart 1989). Model Input Parameters: The non-specific chemical input parameters to equation 2.1 assumed by CSST, USEPA and CCME protocols are different, as shown below. TABLE 2.1: Comparison of Model Inputs for Non-Ionizing Organic Chemicals f oc θ w θ a ρ b (kg/l) K benzene (K oc = 62, H =0.23) 3 K TCE (Koc = 94, H =0.42) 3 K Naphthalene (K oc = 1200 H =0.0198) 3 CSST USEPA CCME USEPA (1996) 2. CCME (2005), coarse-grained soil 3. Source of the K oc s are SRA-2 Appendix C, Table C-1 The CCME defaults for organic carbon are based on review of organic carbon contents of various Canadian subsoils undertaken in support of the CWS-PHC (CCME, 2000), while the water- and air-filled porosities were chosen to be representative of typical sand (coarse-grained) soil. To further evaluate the effect of differing input parameters on the partitioning calculations, equation 2.1 is re-formulated, as follows: K = K oc *f oc + (θ w + θ a *H /ρ b ) (2.1) The back-calculated soil standard increases linearly as K increases. The fraction organic carbon has the greatest effect on the K parameter. As shown in Table 2.1, there is little difference in K calculated using the CSST and CCME defaults. The inputs for the CSST protocol were based on Fraser River sand, where information was available. To provide preliminary data on fraction organic carbon, Golder reviewed information where organic carbon testing was conducted on Fraser River sand at three sites. The f oc for twenty samples varied between and , with a median
29 July value of The test methods for organic carbon varied (loss on ignition organic matter content converted to f oc, Leco analyzer); therefore, the organic carbon values are approximate. While this data set would suggest a lower organic carbon content based the on results for Fraser River sand, it is suggested that the groundwater model should apply to varying hydrogeologic environments. Also there would likely be differences in organic carbon content for near-surface unsaturated soils compared to deeper aquifer material. Therefore, it may be appropriate to utilize different f oc values for the unsaturated and saturated zones. The water-filled porosity in the unsaturated zone will vary as a function of soil type and infiltration rate. Water-retention models can be used to estimate water contents for different soil types. The estimated water contents using the Van Genuchten model and model curve-fitting parameters by Schaap and Leij (1998) are shown in Table 2.2. Table 2.2 Predicted Soil Water Contents Using Van Genuchten Model Van Genuchten Parameters Predicted Porosity & Water Contents Bulk Density α 1 N M Total Porosity Residual Water Content Field Capacity SCS Soil Type (g/cm 3 ) (1/cm) (unitless) (unitless) θ (cm 3 /cm 3 ) θ r (cm 3 /cm 3 ) θ fc (cm 3 /cm 3 ) Clay Clay Loam Loam Loamy Sand Sand Sandy Clay Sandy Clay Loam Silt Silty Clay Silty Clay Loam Silt Loam Sandy Loam Arithmetic Mean The total porosity values in Table 2.2 are relatively high and bulk density values are low, since tests were conducted on near-surface agricultural soils. During dry periods, the unsaturated zone water contents in uncovered areas will tend to be between the residual water content and field capacity. Based on the data in Table 2.2, the water- and air-filled contents assumed by CSST are considered reasonable for sandy soils. The CSST unsaturated zone bulk dry density is somewhat high and could be reduced to 1.7 g/cm 3.
30 July Recommendations Adopt the K oc values for non-ionizing organics listed in SRA-2 Appendix C, Table C-1. It is noted that for several compounds, the K oc values proposed by SAB in the SRA-2 report are significantly different than the CSST values. 2 The source of most SRA-2 K oc values are those given in USEPA (1996). Revise the unsaturated zone bulk dry density to 1.7 g/cm 3, consistent with the value assumed by CCME. Consideration could be given to adjusting the fraction organic carbon; however, further evaluation of this parameter for different hydrogeologic environments is recommended before any changes are made. Since partitioning is sensitive to f oc, an alternative would be to develop multiple soil standards based on f oc ranges and to provide the option for testing of site soil samples for f oc. Ionizing Organics The K oc for an ionizing organic chemical will depend on the soil ph. The CSST protocol derived a ph-dependent K d isotherm for pentachlorophenol (PCP). As part of SRA-2, the method used to derive K d values for PCP was revised slightly based on the equations below, derived by Schwarzenbach et al. (2002), and analysis conducted by Mr. Don Burnett, Morrow Environmental, Burnaby, BC. For PCP, the K oc values were derived using the following equations: where K oc = Koc log K non ionic ocnon ionic K ocionic f i f + K i = 0 oc 1 = ionic = 0.82 log K ( i ( ph pka) 1 f ) ow (2.2) (2.3) The ionic K oc values were obtained from Schwarzenbach et al. (2002). The pka and K ow values used were obtained from Table , found on the MWLAP web site at: htm#P43552_ The USEPA (1996) K oc s are as follows (CSST values in parentheses): Benzene 62 (83.2), Ethylbenzene 200 (1096.5), Toluene 140 (302), Xylenes 200 to 310 (389), benzo (a) pyrene - 970,000 (891,251), naphthalene 1,200 (1,288.2), pyrene 72,444 (68,000), tetrachloroethylene 260 (158.5), trichloroethylene 94 (107.2).
31 July The revised PCP K oc is compared to the values used in the CSST protocol (SSS model) and USEPA protocol in Figure 2.1. As shown, the revised K oc values are slightly lower compared to the CSST protocol. PCP Koc Versus ph Koc (mg/l) SSS model USEPA 1996 SRA ph (ph units) Figure 2.1: K oc as a Function of ph for PCP (from SAB, 2004) Recommendation Adopt the ph-dependent K oc isotherm for pentachlorophenol derived by SAB, as documented in SRA-2. Inorganic Chemicals Three approaches for estimation of unsaturated zone partitioning are evaluated: (i) the use of measured total soil concentrations and model-predicted K d partitioning coefficients, (ii) an empirical approach where K d s are obtained from laboratory or field tests, and (iii) an approach where leaching tests are used to estimate unsaturated zone pore-water concentrations. Each approach is discussed below. K d Partitioning Model: The CSST and USEPA use the same model for unsaturated zone partitioning of inorganic chemicals: C t = C w /ρ b *(K d + θ w + θ a *H ) (2.4)
32 July where K d is the soil-water partition coefficient (except for mercury, the Henry s Law constant is assumed to be zero). The approach used by CSST and USEPA, as documented in the Soil Screening Guidance (USEPA, 1996), to derive ph-dependent K d values is discussed in detail in Appendix I. A summary of this discussion is provided below. The USEPA Model (USEPA, 1996) approach involved the use of the MINTEQ2A geochemical speciation model to generate ph-dependent isotherms for barium, beryllium, cadmium, chromium (III), mercury, nickel, silver and zinc due to the inherent difficulty in determining a generic K d value. For many metals, sorption characteristics are highly dependent on the ph. The ph is also a parameter that can be readily measured in the field; therefore, a ph-dependent approach is practical for generic soil standard application. There are several other important geochemical parameters that influence metals sorption, including hydrous ferric oxide (HFO) content, organic matter content, the presence of clay minerals, redox conditions, major ion chemistry, and chemical speciation of the metal. The USEPA MINTEQ2A modeling exercise assumed sorbent surfaces were limited to HFO and particulate organic matter (POM), and assumed constant values for these parameters based on mid-range values measured at sites across the USA. For HFO, a limited dataset of six measurements was used to derive model input values. Other important assumptions were (i) system equilibrium was assumed, (ii) the redox state of the system was not considered because of the lack of reliable data when the isotherms were modeled, (iii) metal competition was not considered, and (iv) the background porewater chemistry input into MINTEQ2A was defined based on 13 chemical constituents that commonly occur in groundwater. For arsenic (III), chromium (VI), selenium and thallium, experimental ph-dependent isotherms based on the properties of Wisconsin sand aquifer material were used to generate K d values. The USEPA did not provide K d values for lead and copper. The USEPA subsequently developed the 3MRA model system (Multimedia, Multipathway and Multireceptor Risk Assessment) in response to the 1995 Hazardous Waste Identification Rule (HWIR). The 3MRA system is a series of models for screening-level assessment of human and ecological health risks resulting from chronic exposure to contaminants. The 3MRA model includes isotherms that are used to predict soil-water metals partitioning. As part of 3MRA, the MINTEQA2 model was used to develop concentration-dependent partition coefficients for various combinations of four key parameters ( master variables ) affecting metal sorption (ph, HFO, POM and labile organic matter (LOM)). Representative values for master variables were calculated for conditions representing the saturated and unsaturated soil zones.
33 July The approach for modeling partition coefficients adopted for 3MRA was considered by USEPA to be an improvement upon the 1996 USEPA SSL approach for a number of reasons including: (i) thermodynamic data were updated within the MINTEQA2 thermodynamic database making it possible to model the behavior of several additional metals, including arsenic (III), arsenic (V), antimony, beryllium, chromium (VI), cobalt, selenium and vanadium; (ii) the database of hydrous ferric oxide sorption reactions was expanded to include sorption reactions for arsenic, antimony, beryllium, chromium (VI), cobalt, selenium and vanadium; and (iii) the mid-range HFO content was decreased by a factor of 10, which was considered warranted based on comparisons of MINTEQA2 estimates of K d with literature values. Empirical Data and Parametric Relationships: An alternate approach to the USEPA or 3MRA approach would be to rely completely on empirical data to determine K d s for use in partitioning models. As discussed above, the USEPA Model used a partial empirical approach for four metals based on limited data. There are more recent compilations of laboratory data where larger data sets are analyzed. For example, Sauvé et al. (2000) compiled data from 70 studies where there were both analyses of metals in leachate (batch tests, centrifugation) and total metals content. The results and statistical analysis for four metals (cadmium, copper, lead and zinc) are provided in Figure 2.2. As shown, there is a weak correlation between K d and ph; however, the K d s vary over two to three orders-of-magnitude. Sauvé et al. (2000) found that a parametric model based on the solution ph, soil organic matter and total metal content yielded improved predictions of dissolved metal concentrations than just the ph.
34 July FIGURE 2.2: Empirical K d Values Compiled by Sauvé et al. (2000). Purple symbols are CSST values, orange symbols are USEPA SSL values. The CSST and USEPA K d s are compared to the empirical K d s compiled by Sauvé et al. (2000) for cadmium and zinc (Figure 2.2). For these two metals, the comparison indicates the CSST and USEPA K d s are near the low end of the empirical K d range at lower ph; however, as ph increases, the CSST and USEPA K d s become less conservative when compared to the empirical K d s.
35 July Leaching Tests and Pore-Water Standards: A third possible approach would be to use leaching tests and to compare pore-water leachate concentrations to generic pore-water standards protective of the groundwater pathway, similar in concept to the approach recommended by SAB for SRA-2. The analysis of additional soil samples using leaching tests, such as the Synthetic Precipitation Leaching Procedure (SPLP) (EPA SW-846 Method 1312), would be required. The advantage of this approach is that leaching tests potentially provide for a more direct indication of metals that may be released to the unsaturated zone, and also measure desorption of metals, which is important since the leaching of metals can be affected by aging and weathering of soils. The State of New Jersey recently released a protocol (March 11, 2005) for the use of leaching tests (SPLP) to determine soil remediation criteria (see Appendix C of Appendix I). Replicate soil samples are analyzed for leachable and total metal concentrations. One option given is to directly compare the metals concentrations in leachate to the target pore-water concentration, which in New Jersey is the target groundwater concentration divided by a generic dilution attenuation factor (DAF) of 12. A second option is to back calculate a soil cleanup criteria based on the observed correlation between leachable and total metal concentrations. The New Jersey guidance also includes a correction factor to adjust leachate test results when metals are weakly sorbed and when the test dilution for the SPLP test (20 water: 1 solids) could exceed the unsaturated zone dilution. Discussion and Recommendations: There are significant limitations associated with soil-water partitioning coefficients developed using geochemical speciation models for the purpose of generic soil standard development. These limitations include (i) the model only accounts for some of the geochemical processes that result in metals sorption, (ii) there is a wide variation in model-predicted K d values, depending on the input parameters adopted, and (iii) model-predicted K d values are both greater than and less than reported empirical partition coefficients. However, the empirical tests themselves represent a range of different tests and conditions making direct comparison difficult. While there are obvious limitations, in our opinion, the use of the USEPA 1996 SSL partition coefficients represents the best available approach for deriving generic soil standards for metals at this time. This is reflected in guidance from several other regulatory jurisdictions, which essentially have adopted the USEPA ph-dependent isotherms. Discussions with the experts (Jerry Allison, Allison Geosciences; Robert Truesdale, RTI International) who were instrumental in developing the USEPA and 3MRA guidance over the past decade also indicate for generic standard purposes, it would be difficult to improve upon the USEPA approach, in the absence of site specific data for key geochemical parameters.
36 July The 3MRA isotherms provide additional flexibility through a parameterized approach based on several master geochemical parameters, and also provide MINTEQ2A generated isotherms for several oxy-anions, chemicals for which USEPA previously only provided empirically-derived isotherms for. While the use of the 3MRA approach could be applied when site-specific standards are derived, it is not considered practical for the development of generic soil standards since parameters such as iron oxide and organic matter content are not measured in typical site investigations in British Columbia. The 3MRA approach also does not lend itself readily to generation of ph-dependent isotherms, as described in Appendix I. Also, it is noted that the 3MRA iron oxide contents are considerably lower than those presented in the literature (Battelle, 1989). These lower iron oxide contents may be overly conservative with respect to natural conditions in British Columbia. The CSST protocol assumed that the K d isotherm for copper could be used as a surrogate for lead. This is not considered scientifically defensible, as copper and lead behave differently in natural environments (i.e., copper is considerably more mobile than lead). There is no USEPA isotherm for lead, but there is a 3MRA isotherm for this metal. Neither USEPA nor 3MRA include isotherms for copper. As described below, the 3MRA lead isotherm is used for initial evaluation of lead partitioning. The USEPA SSL K d s for mercury are not recommended since empirical data indicates the USEPA K d s are overly conservative and also do not correctly predict the influence of ph on K d (Bright and Telmar, 2003). From a regulatory perspective, it is desirable that soil-water partitioning models used to develop generic standards are conservative. The USEPA partition model likely underpredicts sorption since not all the processes that contribute to metals sorption are accounted for in the model. Because the USEPA model is based on a set of simplifying assumptions, it is not possible to verify whether or not the USEPA model is intrinsically conservative. Figure 2.2, for example, suggests that the USEPA model is reasonable conservative for zinc but not necessarily conservative for cadmium at a ph of 8. One way to gain further insight on the predictive capability of the groundwater fate and transport model, and indirectly metals partitioning, is to evaluate data for sites where there is soil and near-contaminated source groundwater quality data. It is recommended that the groundwater model be evaluated through analysis of field data from multiple contaminated sites. In summary, it is recommended that generic ph-dependent soil standards be derived using the USEPA SSL K d partition coefficient approach. In addition, it is recommended that pore-water standards for metals be developed as a complementary approach, to enable direct comparison of leachable concentrations to pore-water standards since use of leaching tests provides for the most direct indication of possible leaching and impacts to groundwater. To support this option, further evaluation of leaching test protocols and guidance on implementation of this approach for assessment of contaminated sites is
37 July required (e.g., similar in concept to protocol developed by NJDEP, Appendix I). A completely empirical approach based on, for instance, data compiled by Sauvé et al. (2000), is not recommended at this time since the conditions under which tests are conducted vary widely, the data varies over several order-of-magnitude (making selection of a representative empirical value difficult), and since it appears that comprehensive data has been compiled for only a few metals. Recommendations For derivation of soil standards, adopt the partition coefficients recommended by USEPA (1996) for the following metals: antimony; arsenic (III); barium; beryllium; cadmium; chromium (III); chromium (VI); nickel; selenium; silver; thallium; vanadium; and, zinc. It is noted that antimony, barium, beryllium, mercury, nickel, selenium, silver, thallium and vanadium are not currently included in the Schedule 5 matrix standards. The implications for use of USEPA partition coefficients to derive ph-dependent standards for these metals should be further evaluated before any changes to the CSR standards are considered. Such an evaluation goes beyond the scope of this report. The USEPA K d s for mercury are not recommended since empirical data indicates they are overly conservative and do not correctly predict the influence of ph on K d. Develop an isotherm for lead using data in the 3MRA database, assuming iron oxide and organic matter input values identical to those assumed by USEPA in development of SSLs. For comparison to CSST standards, an interim K d isotherm was developed using 3MRA predictions for mid-range iron oxide and organic matter conditions, with an iron oxide concentration of 0.05 wt% and organic matter concentration of 0.11 wt%. Using a similar approach to the 3MRA modeling effort, employ the MINTEQA2 thermodynamic database to develop an isotherm for copper assuming inputs identical to those assumed by USEPA in development of SSLs. Consideration should be given to a regulatory framework that includes pore-water standards and a protocol where the results of leaching tests can be compared to porewater standards. For metals, pore-water standards and leaching tests would avoid some of the scientific issues and uncertainty associated with the K d approach. To gain further insight on the predictive capability of the metals partitioning model, it is recommended that soil and near-contaminated source groundwater quality data from contaminated sites in British Columbia be evaluated to provide for field-based estimates of groundwater fate and transport, and indirectly partitioning behaviour.
38 July Comparison of CSST and USEPA K d s: The CSST and USEPA SSL s are compared in Table 2.3 for the range of ph values in the CSR standards. All other factors being equal, an increase in K d results in an increase in the soil standard. The Kd s for arsenic (III) and chromium (VI) are virtually identical within a ph range of 5 to 8. For cadmium, the USEPA K d s are slightly lower (however, both the CSST and USEPA the K d s are relatively high). For lead, the USEPA K d s, calculated using the provisional 3MRA isotherms, are lower than the CSST K d s, except at a ph of 5.0. For zinc, the USEPA K d s are lower than the CSST Kd s, except at a ph of 6.0. It is noted that for the purposes of calculations in Table 2.3, the mid-point of the ph range was selected for the ph ranges. 3 3 The protocol followed by MWLAP to derive the CSR soil standards rounded up the ph when selecting the Kd for each ph range in the standards. For example, for a ph range of 6 to 6.5, the Kd for a ph of 6.3 was chosen. For the calculations shown in Table 2.3, the mid-point ph was selected (e.g., 6.25). This difference is not considered significant.
39 July Date Printed: Table Comparison of soil screening levels calculated with CSST- and USEPA-recommended soil-water partition coefficients CSR Standards CSST Inputs (Transient Model) USEPA SSL 1996 (Steady State Model) Receptor Background ph for CSR ph CSST DAF DAF Calc. Tox Calculated ph USEPA Calc. Tox Calculated Groundwater Soil Matrix Matrix for Kd based Soil CSST Input USEPA SSL based Soil USEPA Input Metal Concentration 1 Concentration 2 Standard Standard 3 Table B K d years years Standard 5 Standard 6 SSL 7 K d Standard Standard 8 (mg/l) (mg/kg) (mg/kg) (L/kg) (mg/kg) (mg/kg) (L/kg) (mg/kg) (mg/kg) Arsenic N/A III N/A N/A N/A Cadmium < to < E to Out of range >= Out of range Chromium N/A 65 N/A N/A N/A N/A N/A N/A III N/A 65 N/A N/A N/A N/A N/A N/A N/A 65 N/A N/A N/A N/A N/A N/A N/A 65 N/A N/A N/A N/A N/A N/A Chromium N/A VI N/A N/A N/A Copper < N/A N/A N/A N/A to N/A N/A N/A N/A to N/A N/A N/A N/A to < Out of range N/A N/A N/A N/A >= Out of range N/A N/A N/A N/A Nickel 1.1 N/A N/A 100 to 500 N/A N/A N/A N/A N/A N/A N/A N/A 100 to 500 N/A N/A N/A N/A N/A N/A N/A N/A 100 to 500 N/A N/A N/A N/A N/A N/A N/A N/A 100 to 500 N/A N/A N/A N/A N/A N/A Lead < to to < Out of range >= Out of range Zinc < to < >6.5 to < >= Out of range Notes: 1. Receptor groundwater concentration is CSR AW freshwater standard (Schedule 6), unless otherwise noted. 2. Background soil concentration is that referenced in CSR matrix soil standard (Schedule 4). 3. CSR Schedule 5, freshwater standard 4. Table B-2 Overview of CSST Procedures for the Derivation of Soil Quality Matrix Standards for Contaminated Sites. 5. Tox Based Soil Standard = C g * DAF * (K d * θ u /ρ b ) where C g is groundwater concentration, DAF = dilution attenuation factor (3.29), θ u is water-filled porosity (0.1), ρ b = bulk dry density (1.75) 6. Calc. CSST Input Standard = Tox. Based Standard + Background Soil Conc. (freshwater standard) 7. USEPA Soil Screening Guidance (USEPA, 1996) cadmium, chromium III, zinc, mercury, nickel (Figure 11), Arsenic (III), chromium (VI) (Figure 10). For lead the approximate interpolated values obtained from 3MRA isotherms using a using a mid-range HFO (0.05 % wt) and mid-range POM (0.11% wt) for a dissolved lead concentration of 0.06 mg/l were used. 8. Calc. USEPA Input Standard = Tox. Based Standard + Background Soil Conc. (freshwater standard) 9. Based on correspondance from George Szefer, April 8, Based on hardness equal H>200, default value in SSS model, March 2005 version 11. Based on hardness equal H>200<300, default value in SSS model, March 2005 version 12. Based on hardness equal H>100<200, based on footnote 7 in Schedule 5 for zinc.
40 July Unsaturated Zone Transport The BCE (1996) and CCME (2005) unsaturated zone models are identical. However, for the purpose of calculating soil standards or guidelines, the thickness of soil between the contamination zone and water table is taken to be zero; therefore, unsaturated zone processes are not considered. The SRA-2 model does not include unsaturated zone transport. Further evaluation of unsaturated zone transport processes is on-going by the SAB in a separate project. If there are findings from this evaluation that have implications for the model used for generic soil standard development, the recommendation below should be updated, as warranted. Recommendation For clarity, eliminate unsaturated zone transport from the CSST model, subject to findings of on-going evaluation by SAB Mixing of Leachate with Groundwater Groundwater Mixing Model The CSST (BCE 1996), USEPA (1996), SRA-2 (2004) and CCME (2005) models for mixing of leachate with groundwater are based on identical mass-balance models for dilution of leachate below a contamination source zone: C w = C gw (1 + Z d V / I X ) (2.5) C w = C gw DF (2.6) where C w is the leachate concentration in the unsaturated zone (mg/l), C gw is the groundwater concentration at the down-gradient boundary of the source zone (mg/l), Z d is the average thickness of the mixing zone (m), V is the Darcy velocity in groundwater (m/year), I is the infiltration rate (m/year), X in the length of contaminated soil source parallel to groundwater flow (m), and DF is the dilution factor due to mixing of leachate with groundwater (dimensionless). Different equations are used for calculation of the mixing depth, as outlined below: CSST and CCME: Z d = r + s r = 0.01X s = d a {1 - exp-(2.178xi/vd a ))} (2.7a) (2.7b) (2.7c)
41 July USEPA Z d = r + s r = ( X 2 ) 0.5 s = d a {1 - exp[(-xi)/(vd a )]} (2.8a) (2.8b) (2.8c) SRA-2 Z d = r + s r = X 1.23 s = d a {1 - exp[(-xi)/(vd a )]} (2.9a) (2.9b) (2.9c) where r is the mixing depth available from dispersion and diffusion (m), s is the mixing depth available due to the infiltration rate and groundwater flow rate (m), and d a is the aquifer thickness (m). The reason for the difference in the mixing depth (r) calculated by USEPA and SRA-2 is that different equations were used to estimate the longitudinal dispersivity. The SRA-2 equation for longitudinal dispersivity is based on Neuman (1990) and was considered by SRA-2 to be a better model for short transport distances. The above mixing models are compared by calculating the DF using the CSST default input parameters (X = 5 m, I = 0.55 m/year, d a = 5 m, V = 12.6 m/year). TABLE 2.4: Comparison of Dilution Factors for Different Groundwater Mixing Models CSST USEPA SRA-2 Z d (m) Dilution Factor The revised SRA-2 mixing model results in a four percent increase in the back-calculated soil standard compared to the CSST model. The groundwater mixing zone equation is based on the assumption that the chemical is distributed evenly throughout a mixing zone. As noted in CCME (2005), in reality the concentration of the chemical would not be constant through this zone; however, further mixing would be expected at the point of exposure within a well or surface water body. Therefore, the mixing zone approach is considered to be a reasonable approximation for purposes of generic standard development. Recommendation Adopt the revised SRA-2 groundwater mixing model for derivation of soil standards.
42 July Groundwater Mixing Model Inputs CSST (BCE 1996) and CCME (2005) use different inputs for the mixing zone equation (USEPA can not be readily compared since a probabilistic approach was taken). The DF calculated using the SRA-2 groundwater mixing model, using the CSST and CCME inputs is provided in Table 2.5. TABLE 2.5: Comparison of Dilution Factors for Different Groundwater Mixing Models Inputs X (m) I (m/year) d a (m) K (m/year) i V (m/year) CSST N/A N/A CCME * 6.25 * calculated The reason for the higher CCME DF compared to CSST is primarily a lower infiltration rate (I) and to a lesser extent, longer contaminated source length (X), which results in a greater mixing depth. For both CSST and CCME, the infiltration rate was calculated using a simple water balance model where the infiltration is equal to the precipitation minus the sum of the surface runoff and evapotranspiration. The assumed CSST precipitation is the approximate mean precipitation at Vancouver International Airport. The CSST protocol does not give a rationale for the surface runoff and evapotranspiration. The CCME recharge is based on data for Halifax, Nova Scotia. The CSST and CCME contaminated source lengths are based on the typical dimension of a contaminated site. The CSST recharge rate is based on a simple model that does not take into consideration hydrological variations and the properties of soil. Estimation of percolation of water within the unsaturated zone is complex. API (1996) describes 13 different empirical methods and models that can be used to estimate recharge for input into environmental site assessments. Two common models that can be used for groundwater recharge estimation are (i) water balance models (HELP, SESOIL), and (ii) numerical models based on the Richards equation (VS2DT, HYDRUS). Water balance models couple climatic and hydrological data with a simple model for unsaturated zone groundwater flow. Numerical models based on Richard s equation provide for more realistic simulation of unsaturated flow processes, but generally do not have as extensive capabilities in terms of climatic and hydrological inputs. Recharge can also be estimated from rainfall infiltration measurement data. In the SAM model (GSI, 1997), infiltration data from 101 sandy soil sites in 18 geographic regions in the United States was analyzed, as compiled by Stephens & Associates (API, 1996). To DF
43 July obtain a high-range estimate of infiltration, a regression curve was fitted to mean annual precipitation and net infiltration measurements such that 80 percent of the measured infiltration rates would fall below the curve. The 80% regression curve was considered to provide a reasonably conservative estimate of infiltration rates and leachate impacts in most sandy soil conditions, and is expressed, as follows: I = P 2 where I is the mean annual net infiltration (cm/year), P is the mean annual precipitation (cm/year). This equation and the mean precipitation assumed in the CSST protocol results in a net infiltration rate of 0.18 m/year (compared to 0.55 m/year assumed by CSST). Site specific infiltration rates are dependent on climatic conditions and soil properties, which are highly variable within British Columbia. For generic soil standard purpose, it is difficult to select representative model input values. An infiltration rate of 0.55 m/year appears to be somewhat high compared to that assumed by CCME and the 80% percent value (0.18 m/year) based on US empirical data; however, climatic conditions within coastal British Columbia area are wet, therefore justifying a higher infiltration rate. The contaminated site source length of 10 m is considered reasonable based on typical contaminated site size. Recommendation At this time, no change to the infiltration rate is proposed. However, consideration should be given to more scientifically-based estimation of the recharge rate. This could consist of use of models such as HELP and VS2DT and inputs corresponding to several climatic zones within BC. It is recommended that a contaminated site source length of 10 m be adopted, consistent with the CCME protocol Saturated Zone Transport The CSST and CCME saturated zone models are identical. The CSST and CCME models are a transient analytical solution for one-dimensional flow, three-dimensional dispersion, sorption and first-order decay. The assumed input parameters are also identical, except that CCME (2005) assumes that a water well or irrigation dugout is located at the edge of the contamination source zone whereas CSST assumes a 10 m separation distance between the contamination source and receptor. For the aquatic life
44 July pathway, both CSST and CCME (2005) assume a 10 m separation distance. A different analytical model was proposed for SRA-2, which unlike CSST and CCME (2005), is not designed for soil standards development. The SRA-2 model is a steady state analytical solution for one-dimensional flow, one-dimensional dispersion and first-order decay. Dispersion: Model simulations using the CSST model indicate that for approximate steady state conditions, transverse (lateral) dispersion does not result in significant concentration attenuation at 10 m from the source. This is expected based on the source size and relatively small transport distance. First Order Decay Constant: The first-order decay constant can have a significant affect on the DAF for organic chemicals where a half-life was assumed. Predicted concentrations as a function of down-gradient distance and time are calculated for benzene (half-life 365 days), toluene (half-life of 105 days) and benzo (a) pyrene (1059 days) (Figures 2.3 to 2.5). The simulations at 100 years indicate a saturated zone DAF (i.e., excluding groundwater mixing) of 1.40 for benzene, 6.6 for toluene, and very high DAF (53 orders-of-magnitude) for benzo (a) pyrene. For inorganic chemicals, no decay was assumed. The combination of decay (half-life) and sorption (K oc ) has a significant effect on contaminant transport. A review of these parameters is recommended, particularly in the context of development of generic soil standards. Groundwater Benzene Concentration (mg/l) DF Groundwater Mixing (SRA-2 model) = 3.43 DAF Saturated Zone Transport = 1.4 (2200 yrs.) Total DAF = 4.8 (K oc = 83, f oc = 0.006, T1/2 = 105 days) T=0.1 yr T=0.5 yr T=1 yr T=10 yr T=100 yr T=2200 yr Distance Along Flow Path From Source (m) Figure 2.3 Predicted Benzene Attenuation using CSST Saturated Zone Model
45 July Groundwater Toluene Concentration (mg/l) DF Groundwater Mixing (SRA-2 model) = 3.43 DAF Saturated Zone Transport = 6.6 (100 yrs.) Total DAF = 22.6 (K oc = 140, f oc = 0.006, T1/2 = 105 days) Distance Along Flow Path From Source (m) Figure 2.4 Predicted Toluene Attenuation using CSST Saturated Zone Model T=0.1 yr T=0.5 yr T=1 yr T=10 yr T=100 yr T=2200 yr Groundwater B(a)P Concentration (mg/l) 4.5E E E E E E E E E-10 DF Groundwater Mixing (SRA-2 model) = 3.43 DAF Saturated Zone Transport = Very High (100 yrs.) Total DAF = Very High (K oc = 970,000, f oc = 0.006, T1/2 = 1059 days) T=0.5 yr T=1 yr T=10 yr T=50 yr T=100 yr T=2200 yr 0.0E Distance Along Flow Path From Source (m) Figure 2.5 Predicted Benzo (a) Pyrene Attenuation for CSST Saturated Zone Model
46 July The CSST half-lives were intended to be representative of anaerobic conditions. Since publication of the CSST protocol in 1996, there have been numerous published studies that present decay constants. An in-depth discussion of estimation and selection of representative decay constants goes beyond the scope of this report; a few key issues are discussed below. Biodegradation rates are highly chemical and site dependent. For certain chemicals (e.g., benzene), biodegradation, in some cases, will not occur under anaerobic conditions. For some chlorinated solvent chemicals, depending on the type of biotransformation, a co-substrate or hydrogen donor must be present at sufficient concentrations for reactions to occur. It is also important to recognize that rate constants in the literature represent a range of types of studies. The most reliable studies for estimation of conservative rate constants are generally field studies where biodegradation rate constants are obtained using tracers or calibration to models, as opposed to studies where bulk attenuation rates representative of biodegradation, dispersion and sorption are derived. A compilation of rate constants for BTEX published by Newell et al. (2002) is provided in Figure 2.6.
 and Bulk Attenuation Rate Constants (k) for BTEX")
47 July FIGURE 2.6: Biodegradation rate constants (λ) and Bulk Attenuation Rate Constants (k) for BTEX compounds from the literature (adapted from Rifai and Newell, 2001)
48 July The 25 th percentile decay constant may be a reasonable value for soil standard development purposes. For initial comparison purposes, the 25 th percentile decay constants by Suarez and Rafai (1999) are compared to the CSST and SRA-2 decay constants in Table 2.6. TABLE 2.6: Comparison of BTEX Chemical Half-lives for First-Order Biodegradation T 1/2 Benzene (days) T 1/2 Toluene (days) T 1/2 Ethylbenzene (days) T 1/2 m-xylene (days) CSST SRA-2 (Table 2) N/A th Suarez and Rafai (1999) N/A Although further review of decay constants should be conducted, some of the CSST constants appear to be non-conservative. Simulation Transport Time: The CSST default simulation time was set at 2,200 years. The rationale for selecting a default time of 2,200 years is not clear, although intuitively one would expect, for a travel distance of 10 m, steady state or near steady state conditions after this time period. Approximate steady state conditions do occur for most matrix chemicals; however, for several organics and metals with high K d values, steady state conditions are not predicted at 2,200 years due to their high sorption potential. For chemicals without decay, at steady state conditions, no attenuation within the saturated zone is predicted. For chemicals with both sorption and decay, some attenuation would be predicted at steady state conditions.
49 July Recommendations Retain the 10 m separation distance between the contamination source and the receptor for the saturated zone model for all water uses. It is recommended that a steady state model be adopted for a number of reasons. First, the model is relatively sensitive to the K d chosen; since there is significant uncertainty in K d, it is considered more appropriate to eliminate the influence of K d, at least for purposes of generic standard development. Second, it appears that from the travel time chosen, the intent was to simulate approximate steady state conditions. Third, adopting a steady state model would eliminate the very large differences in dilution attenuation factors based on ph variation, and would increase transparency of the protocol used to derive standards. A more in-depth review of decay constants should be conducted. When complete, representative values based upon this review should be selected for input into the model. For consistency, identical parameters should be selected for both the groundwater model used to back-calculate soil standards and SRA-2. The combination of decay (half-life) and sorption (K oc, f oc ) have a significant effect on model-predicted organic groundwater concentrations at 10 m from the source. Once representative half-lives have been selected, it is recommended that the steady state model be run to evaluate the effect of these two parameters. The simulation results, together with the mixing model results, should be used to derive example soil standards. The results should be carefully assessed to evaluate whether incorporation of these fate and transport processes is reasonable for generic soil standard development purposes Implication of Proposed Changes for Metals Standards The implications of proposed changes to partitioning coefficient (USEPA SSL K d s) and the use of a steady state model are evaluated for metals through comparison of example soil standards for protection of the aquatic life pathway calculated (i) using the CSST metal partitioning coefficients and transient model, and (ii) USEPA SSL partitioning coefficients and steady state model (Table 2.3). The soil standards in Table 2.3 are developed for ph ranges recommended in the CSR matrix standards (Schedule 5). The soil standard was back-calculated using Equation 2.10, as follows: C t θ w = C w * DAF * K d + ( ) ρ b (2.10)
50 July The CSST DAF was estimated using the transient groundwater transport model and CSST input parameters, assuming a default time of 2,200 years. For most chemicals and ph values, using this time results in a DAF of For comparison purposes, the DAF calculated assuming a default travel time of 100 years is also presented (this DAF is not used for standard calculation purposes). Consistent with the approach used for the CSR standards (footnotes in Schedule 5), the example soil standards are equal to the sum of the soil-based standard and the background soil concentration. For metals that were considered by both CSST and USEPA (1996b), the comparisons indicate the following: The example soil standards for arsenic (III) and chromium (VI) are virtually identical within a ph range of 5 to 8. For cadmium, the CSST and example USEPA soil standards are similar at low ph, but at higher ph, the USEPA soil standards are lower. The example lead soil standards calculated using provisional 3MRA isotherms, are slightly greater than the CSST standard for at ph less than 5.5, but are less than the CSST standards above ph 5.5. The example zinc soil standards, calculated using the USEPA K d values, are slightly greater than the CSST derived standard at ph less than 6.0, but are less than the CSST standards above a ph of 6.0. The USEPA K d values and example soil standards for chromium (III) and nickel, which re not included as matrix soil standards in the CSST protocol, are also provided in Table 2.3. As indicated above, the soil standards are equal to the sum of the toxicologically based standard and background soil concentration. The implicit assumption for this calculation protocol is that soils with background metals concentration will not leach metals to groundwater. This may a reasonable assumption at near neutral ph for relatively insoluble heavy metals in weathered soils. However, this assumption may be less appropriate for lower ph conditions and/or where there are mineralized conditions that result in elevated background groundwater concentrations. A more conservative approach would be to cap the lower limit of the standard as the greater of the background soil concentration and risk-based soil concentration. This would result in lower standards for several metals at low ph (e.g., arsenic, lead and zinc).
51 July NAPL Issues The CSST protocol partitioning equation for organics is limited to three phases (sorbed, aqueous and vapour) and does not address partitioning from a non-aqueous phase liquid (NAPL) source. A three-phase partitioning model is conservative since it does not incorporate an upper bound for soil to pore-water partitioning. A more accurate representation of organic partitioning is one in which concentrations in pore-water can not exceed an upper limit based on solubility considerations for partitioning from the NAPL phase. The partitioning model commonly used to describe dissolution of chemicals from NAPL is based on an effective solubility concept, where the maximum concentration in groundwater is equal to the mole fraction multiplied by the purechemical solubility. It is recommended that the CSST protocol be revised to include a check based on solubility considerations assuming a single chemical is present (no co-solubility effects). The check would involve comparison of the back calculated acceptable pore-water concentration to the pure-chemical solubility. If the pure-chemical solubility is exceeded, then no soil standard would be possible for that chemical. An example is provided below for toluene: Solubility = 530 mg/l; DAF = 22.6; Acceptable concentration in groundwater at receptor (marine water) = 3.3 mg/l; Acceptable pore-water concentration at contamination source = 74.6 mg/l; and, Acceptable pore-water concentration < solubility; soil standard is possible. It is expected that for most organic chemicals, the solubility check will indicate that the acceptable pore-water concentration is less the chemical solubility. Recommendation Include a check based on solubility considerations assuming a single chemical is present (no co-solubility) effects. If the acceptable pore-water concentration at the contamination source exceeds the pure-chemical solubility, then no soil standard would be possible for that chemical.
52 July Groundwater and Surface Water Mixing The CSR soil standards were derived using a groundwater standard that is typically 10 times greater than the surface water criteria, under the assumption that a minimum 10- fold dilution of groundwater would occur at the discharge point to the surface water body. Evaluation of the mixing and interaction of groundwater with surface water has in recent years received greater attenuation and study. The processes are complex, are highly site specific and involve consideration of numerous factors, including hydrogeology, hydrology and climate, and ecology. In particular, the biogeochemical processes within the upper few centimeters in sediments found beneath most surface water bodies (hyporheic zone) can have a profound effect on pore-water and surface water chemistry. New tools and concepts have been developed to assist in evaluating groundwater and surface water interaction, with considerable focus on processes within the hyporheic zone. Some of the recent studies highlight the variability in groundwater discharge zones based on site specific conditions. Due to the complexity and site specific nature of groundwater and surface water interaction, it is difficult to take the factors described above into account when developing generic criteria. Based on a brief review of regulatory guidance, little was found in terms of approaches to developing generic criteria based on groundwater and surface water mixing concepts, although there is some guidance for site specific evaluations, including consideration of flux concepts (i.e., consideration of groundwater mass flux relative to capacity for dilution with receiving surface water bodies), variation in physical-chemical and biological properties of contaminants, and habitat considerations. It is noted that both the State of Massachusetts (GW-3 Standards) and USEPA (Environmental Indicator Supplemental Guidance CA 750) adopted a dilution factor of ten between groundwater and surface water criteria. No change is recommended for the dilution factor that was adopted for the CSST protocol in BC. Recommendation Retain a dilution factor of ten between groundwater and surface water criteria Groundwater Model Protocol Documentation Mr. Chris Neville of S. S. Papadopulos & Associates, Inc. of Waterloo, Ontario was retained by SAB in Fall of 2004 to review the site-specific standard (SSS) model, which is the model that was adopted by CSST for derivation of soil standards. As part of his review, Mr. Neville provided comments on groundwater model documentation, which are provided below.
53 July Comments on Groundwater Model Document by Mr. Chris Neville In the existing site-specific standard (SSS) model documentation, there are multiple tables describing parameters. Two condensed tables of (1) user-specified model parameters and (2) internal model parameters would help the user to quickly identify the data requirements and to better understand the operation of the model. The default values and acceptable ranges of parameters could be included in these two tables. In addition, there is no need for the same parameter to be described in each of the four components of the model. However, in cases where there is an unsaturated and saturated version of the same parameter, the two parameters should been retained. The presentation of the four equations describing the four components of the model would be simplified if presented together along with the two equations for decay (see last page of this appendix). A schematic of these four pathways being modeled would improve user understanding. In this schematic is would be helpful to highlight that the parameter C w (contaminant concentration in groundwater at receptor) is set at the applicable water quality standard. An explanation of the Linked Parameter Sets (A, B, C) is also suggested. List of Specific Parameter and Equation Errors in Help File The following is a list of specific errors in the documentation. In all cases, the equations programmed in the SSS model are nevertheless correct, while the documentation is incorrect. 1. The definition of d (depth from surface to uncontaminated groundwater surface) is incorrect. In general, the groundwater surface will not be uncontaminated and the correct definition should be d = depth from the ground surface to the water table. 2. The water-filled porosity n u is the same as the value specified in the soil/leachate partitioning model. This fact should be made clear to the user. 3. The calculated value of K d is the same as the value specified in the soil/leachate partitioning model. This fact should be made clear to the user. 4. The parameter D 1/2US is not the average number of frost-free days in a year; rather, it is the average number of days during which there is frost. The SSS graphical interface has the following definition for the parameter FFD: Number of days when ground surface < 0ºC. This is correct. 5. The equation in the documentation for the unsaturated/saturated mixing zone model is incorrect (Equation 2 should contain Z d not Z m ).
54 July The definition of I is incorrect. Evapotranspiration (ET) should be added to runoff (RO) rather than subtracted from it. 7. The infiltration rate I in the saturated zone model is the same as the value specified in the unsaturated zone model. The apparent differences reflect only the fact that in the unsaturated zone model the value is specified in units of m/yr, while in the mixing zone unsaturated/saturated model the value is converted to units of m/s. The second definition is therefore redundant. 8. The explanation in the Help file of the air filled porosity, n a is not correct. The documentation states that n a =n-n u, when in fact the air and water filled porosities are specified independently by the user and no consideration is given to n, the total porosity. 9. The thickness of the aquifer, d a, specified in the unsaturated/saturated mixing zone model is not used in the saturated groundwater zone model calculations. In the groundwater model, the contamination beneath the source is assumed to extend across the full thickness of the aquifer. This fact should be made clear to the user. 10. It should be noted that the Darcy groundwater flux V in the mixing zone is the same as the value specified in the groundwater flow equation. The groundwater flux in the mixing zone will, in general, be better characterized than the groundwater flux in the downgradient groundwater flow regime. Therefore, if the downgradient groundwater flux is set as a constant in the model, the mixing zone groundwater flux should remain a variable that can be changed to reflect site conditions. 11. The decay constant in the saturated zone, L S, should be a factor of the half-life in the saturated zone, t 1/2S, rather than the half-life in the unsaturated zone, t 1/2US. 12. Only one parameter symbol should be used for the dry bulk density of the soil. r b is used in the interface and for consistency in Table 1. In other words, the Greek symbol ρ b, should be replaced. The use of footnotes is problematic. The footnotes in the text appear to be part of other decimal numbers making it very hard to decipher what the footnote at the end of the page is pertaining to. Footnotes should be removed and the footnote text should be incorporated into the tables.
55 July Summary of Recommended Changes A summary of the recommended changes to the groundwater model are provided below. Where applicable, the implication of the change on the current matrix soil standard is also provided (i.e., increase in the standard, no change in the standard, decrease in the standard). 1. Retain a multi-component analytical model consisting of (i) unsaturated zone partitioning, (ii) groundwater mixing, and (iii) saturated zone transport for all receptor scenarios; however, consider refinements to the model and input parameters as described in this section of the report and summarized below (no change in standard). Adopting the USEPA DAF of 20 for the receptor well scenario is not recommended at this time. 2. Since unsaturated zone transport does not affect the calculation of soil standards based on the current model scenario; for clarity, eliminate the unsaturated zone component from the CSST protocol, subject to findings of on-going evaluation of unsaturated zone transport by SAB (no change in standard). 3. Adopt the K oc values listed in SRA-2 Appendix C, Table C Adopt the ph-dependent K oc isotherm for pentachlorophenol derived by SAB, as documented in SRA-2 (slight decrease in soil standards). 5. Revise the unsaturated zone bulk dry density to 1.7 g/cm 3 input into the organic chemical partitioning equation, consistent with the value assumed by CCME (slight increase in the soil standards). 6. Consideration could be given to adjusting the fraction organic carbon used for the organic chemical partitioning equation; however, further evaluation of this parameter for different hydrogeologic environments is recommended before any changes are made. Since partitioning is sensitive to f oc, an alternative would be to develop multiple soil standards based on f oc ranges and to provide the option for testing of site soil samples for f oc. 7. Adopt the revised SRA-2 groundwater mixing model for derivation of soil standards (slight increase in the standards). 8. For derivation of soil standards, adopt the partition coefficients recommended by USEPA (1996b) for the following metals: antimony; arsenic(iii) (no change in soil standards); barium; beryllium; cadmium (increase in soil standards); chromium(iii) (increase in soil standards); chromium (VI) (no change in soil standards); cyanide;
56 July nickel; selenium; silver; thallium; vanadium; and, zinc (decrease in soil standards, in most cases). It is noted that antimony, barium, beryllium, mercury, nickel, selenium, silver, thallium and vanadium are not currently included in the Schedule 5 matrix standards. The implications for use of USEPA partition coefficients to derive phdependent standards for these metals should be further evaluated before any changes to the CSR standards are considered. Such an evaluation goes beyond the scope of this report. The USEPA K d s for mercury are not recommended since empirical data indicates they are overly conservative and do not correctly predict the influence of ph on K d. 9. Develop an isotherm for lead using data in the 3MRA database, assuming iron oxide and organic matter input values identical to USEPA SSL defaults. An interim K d isotherm was developed using 3MRA for mid-range iron oxide and organic matter conditions, with an iron oxide concentration of 0.05 wt% and organic matter concentration of 0.11 wt%. 10. Using a similar approach to the 3MRA modeling effort, employ the MINTEQA2 thermodynamic database to develop an isotherm for copper, assuming iron oxide and organic matter input values identical to USEPA SSL defaults. 11. Consideration should be given to a regulatory framework that includes pore-water standards and a protocol where the results of leaching tests can be compared to porewater standards. For metals, pore-water standards and leaching tests would avoid some of the scientific issues and uncertainty associated with the K d approach. 12. To gain further insight on the predictive capability of the metals partitioning model, it is recommended that soil and near-contaminated source groundwater quality data from contaminated sites in British Columbia be evaluated to provide for field-based estimates of groundwater fate and transport, and indirectly partitioning behaviour 13. At this time, no change to the infiltration rate used to calculate groundwater mixing is proposed. However, consideration should be given to more scientifically-based estimation of the recharge rate. This could consist of use of models such as HELP and VS2DT and inputs corresponding to several climatic zones within BC. 14. It is recommended that a contaminated site source length of 10 m be adopted for the groundwater mixing model, consistent with the CCME protocol (slight increase in the soil standards). 15. Retain the 10 m separation distance between the contamination source and the receptor for the saturated zone model for all water uses.
57 July Consideration should be given to adopting the SRA-2 steady state analytical model for saturated zone transport since the intent of the CSST model was to simulate steady state conditions and since dispersion does not affect the model simulations for a transport distance of 10 m (decrease in soil standards in some cases). 17. A comparison of literature half-lives for biodegradation suggests that some of the CSST half-lives assumed for organic chemicals may not be conservative. A more indepth review of decay constants should be conducted. When complete, representative values based upon this review should be selected for input into the model. For consistency, identical parameters should be selected for both the groundwater model used to back-calculate CSR soil standard and SRA The combination of decay (half-life) and sorption (K oc, f oc ) have a significant effect on model-predicted organic groundwater concentrations at 10 m from the source. Once representative half-lives have been selected, it is recommended that the steady state model be run to evaluate the effect of these two parameters. The simulation results, together with the mixing model results, should be used to derive example soil standards (i.e., similar to metals Table 2.3 described earlier). The results should be carefully assessed to evaluate whether incorporation of these fate and transport processes is reasonable for generic soil standard development purposes. 19. The CSST protocol should be revised to include a check based on solubility considerations assuming a single chemical is present (no co-solubility) effects. If the acceptable pore-water concentration at the contamination source exceeds the purechemical solubility, then no soil standard would be possible for that chemical. 20. Make the documentation changes to the groundwater protocol suggested by Mr. Chris Neville of S.S.Papadopulos & Associates, Inc. of Waterloo, Ontario.
58 July HUMAN HEALTH PROTECTIVE STANDARDS GENERAL CONSIDERATIONS The potential direct and indirect exposure pathways typically considered in the development of human health soil quality standards, along with the general contaminant classes for which they are evaluated, are: Intake of contaminated soil (soil ingestion, dermal contact and dust inhalation) applies to all contaminant classes with the exception of volatiles for the dust inhalation pathway; Inhalation of soil contaminants in indoor air applies only to volatile contaminants; and, Groundwater used for drinking water applies to only to soluble contaminants. The existing CSST protocol has derivation procedures for the intake of contaminated soil and groundwater used for drinking water, but not for the indoor inhalation pathway. However, the CSST is considering revising the protocol to include the indoor inhalation pathway. The proposed derivation process for the inhalation pathway is described in detail in Section 4.0. Sections 5.0 and 6.0 review the existing CSST protocol for derivation of soil standards for ingestion of groundwater used for drinking water and intake of contaminated soil, and provides recommendations where warranted. A discussion of the process for deriving soil quality guidelines for each of the direct and indirect exposure pathways identified above has been provided in separate sections. However, there is some overlap in the derivation process for all three exposure pathways. Areas where there is overlap are discussed in the following section. 3.1 General Considerations The derivation of human health soil quality guidelines typically involves consideration of the following: Classification of contaminants as a threshold (non-carcinogenic) or non-threshold (carcinogenic) contaminant; Identification of the acceptable level of risk associated with exposure to contamination at sites; Determination of a critical human toxicity reference value (TRV) representative of a defined acceptable toxicological hazard or risk posed by a chemical; Definition of appropriate critical human receptors for the specified land uses;
59 July Development of defined exposure scenarios for the specific land uses; and, Integration of exposure scenarios and toxicity information with CSST policy decisions to calculate soil quality standards. The above process was used to derive the Contaminated Sites Regulation matrix soil standards (Schedule 5) Contaminant Classification Environmental contaminants are classified according to their potential carcinogenicity and mutagenicity based on the quantity, quality and nature of the available toxicological and epidemiological studies. Agencies such as Health Canada, US EPA Integrated Risk Information System (IRIS; and the International Agency on Research for Cancer (IARC; have developed classification schemes for substances. The existing CSST protocol recommended supporting Health Canada carcinogenic classification when available. However, no official Health Canada TRVs were available prior to the release of the protocol. Therefore, the existing CSST protocol relied on the IARC and US EPA IRIS for carcinogenic classification. CCME (2005) relied on Health Canada to classify contaminants according to their potential carcinogenicity and mutagencity to humans. Recommendation The existing classification of contaminants for which there are matrix standards should be reviewed to see whether new information is available that would indicate a need for re-classification of a contaminant Level of Protection For non-threshold contaminants, it is assumed that there is some probability of harm to human health at any level of exposure. Consequently, it is not possible to determine a dose below which adverse effects do not occur. The philosophy of Health Canada (2004a) is such that human exposure to non-threshold contaminants should be reduced to the lowest levels deemed reasonably feasible. CCME (1996) agrees in principle with the Health Canada philosophy and adopted the position that contaminated site related risks arising from exposure to non-threshold agents should be at least remediated to levels within the range of 1x10⁻⁴ to 1x10⁻⁷. The soil quality guidelines derived by CCME (2005) reflect incremental risk levels from soil of both 1x10⁻⁵ and 1x10⁻⁶, as these were the target incremental risk levels specified by most Canadian jurisdictions. In BC, the CSST adopted an incremental risk level of 1x10⁻⁵ for deriving soil quality standards for human health.
60 July For threshold contaminants, it is common to ascribe some allowable proportion of the total exposure from a contaminated site to the soil or water media. Considering the five sources to which people are exposed (i.e., air, water, soil, food and consumer products), 20% is typically apportioned for both the soil and water media. Both CCME (2005) and the existing CSST protocol adopted the default value of 20% of the Residual Tolerable Daily Intake (RTDI) or Tolerable Daily Intake (TDI), respectively, for threshold substances. This means, for example, if a matrix soil standard is calculated for intake of soil, the TDI is multiplied by a soil allocation factor (SAF) of 0.2 to account for exposure via other exposure media. If defensible contaminant-specific evidence exists demonstrating that the contaminant does not occur in a given medium, CCME (2005) indicated that apportionment may be increased from 20% to a value given by: SAF = 100% / (number of applicable exposure media) Depending on the physical and chemical properties of a substance, it may not be present in all of the media. For example, a high molecular weight hydrocarbon has low solubility and volatility and as a result the contribution of the air and water pathways to exposure may be insignificant. In this case, a SAF of 33% may be appropriate based on three applicable exposure pathways (soil, food and consumer products). In order to provide consistent guidance on when to include or exclude the air and water media in the calculation of the SAF, the following cut-offs should be used: Soluble or Non-Soluble As recommended by CCME (2005), any substance for which a published water quality guideline is available in Canada can be considered soluble. For substances with no published water quality guidelines, if the pure phase solubility is equal to or greater than a derived concentration for the protection of potable groundwater or livestock watering, then the contaminant is considered to be soluble. Volatile or Non-Volatile A similar procedure would be followed as outlined in Section regarding determining whether a substance is volatile or not. The only exception would be that the attenuation factor would not be included in the equation. For a number of substances, Health Canada has derived estimated daily intake (EDIs) which represent the daily exposure of a chemical due to normal background exposure (i.e., not including exposure from a contaminated site). The EDI takes into account exposure from various media including ambient air, indoor air, soils, house dust, drinking water, food, and consumer products for the general Canadian population. We considered using the EDI to provide information on the distribution of a substance among the various media at a contaminated site. However, the EDI is not necessarily reflective of the distribution of a substance at a contaminated site because the apportionment of a substance in soil, water or air will be related to its physical and chemical properties,
61 July rather than background estimates. However, the EDI can be used to show which media account for the majority of the background exposure and thus which media can not be discounted. Recommendation Consider allowing for increasing the apportionment for soil, where appropriate. In order to provide consistent guidance on when to include or exclude the air and water media in the calculation of the SAF, the guidelines recommended above regarding solubility and volatility of a substance should be used. When available, the EDI should be consulted to see which media account for the majority of the background exposure and thus which media can not be discounted Toxicity Reference Values The existing CSST protocol indicated that when available, human health toxicity reference values (TRVs) were taken from CCME Ecological and Human Health Assessment documents (e.g., Canadian Soil Quality Guidelines for Pentachlorophenol: Environmental and Human Health [CCME 1997]). However, the CCME assessment documents were not available prior to the release of the existing CSST protocol and therefore, TRVs from other sources were consulted following the hierarchy shown, as discussed in detail by Fox (1995): 1. Health Canada 2. US EPA - Integrated Risk Information System (IRIS), or US EPA - Health Effects Assessment Summary Tables (HEAST) or US Department of Health and Human Services Agency for Toxic Substances and Disease Registry (ATSDR) or World Health Organization (WHO) 3. Open scientific literature or special purpose derivations A review of the existing matrix standards indicates that the majority of the TRVs used in the derivation process were taken from US EPA IRIS. Since issuing the CSST protocol, CCME and more recently Environment Canada have published assessment documents for all 28 of the substances for which CCME has derived soil quality guidelines. Furthermore, Health Canada has recently published TRVs for a variety of contaminants (Health Canada 2004b). For threshold contaminants, Health Canada derives a Tolerable Daily Intake (TDI) or Tolerable Concentration (TC) and for non-threshold contaminants, oral and inhalation slope factors have been derived.
62 July The CCME (2005) protocol follows a similar hierarchy to the existing CSST protocol where Health Canada is the first choice, followed by US EPA and WHO. However, CCME does not allow for use of TRVs derived from the open scientific literature or special purpose derivations. CCME recommends that if a soil quality guideline is derived using TRVs specified by an agency other than Health Canada, or a guideline developed in the absence of any human health toxicity benchmarks, is considered to be a provisional guideline. The US EPA hierarchy of human health TRVs was recently revised (US EPA 2003; OSWER Directive ) to the following: 1) US EPA IRIS; 2) US EPA Provisional Peer Reviewed Toxicity Values; and 3) Other toxicity values, including other US EPA sources such as HEAST, ATSDR, and National Center for Environmental Assessment (NCEA) provisional values and non US EPA sources (e.g., California EPA toxicity values). The revised hierarchy replaces that presented in Risk Assessment Guidance for Superfund, Volume I, Part A Human Health Evaluation Manual (US EPA 1989). Recommendation The CSST hierarchy for selection of TRVs is considered appropriate, and is similar to that proposed by CCME. Using the hierarchy adopted, determine whether new scientific information is available that supports changing the TRV. Calculate updated matrix soil standards using any TRVs that are revised as a result of this process Receptor Selection and Assumptions The selection of sensitive receptors is linked to land use considerations and is primarily dependent on the ages of the human receptors reasonably expected to be associated with those land uses. It is widely accepted that children (toddlers) are much more likely to come into contact with and ingest greater amounts of soil and dust each day then adults. Combine these higher rates with a lower average body mass and this puts a child more at risk from contaminated soil than an adult. This is why a child (toddler) is considered a more sensitive receptor than an adult in most scenarios. The CSST protocol, Health Canada (2004a) and CCME (2005) all assume the same typical age categories for receptors shown in Table 3.1. For non-threshold substances, an adult is typically the critical receptor for all land uses and exposure is assumed to be continuous over 70 years. For threshold substances, exposure is typically averaged over the most sensitive life stages. Generally, the toddler stage (six months to four years) is considered the most sensitive. Both the existing CSST protocol and CCME (2005) used an adult receptor for developing standards for nonthreshold substances and a toddler for threshold substances. However, for both non-
63 July threshold and threshold contaminants, the existing CSST protocol and CCME (2005) indicate if a different age group is determined to be more sensitive, then this more sensitive age group should be used as the receptor. The receptor assumptions used in the existing CSST protocol were a combination of values taken from Angus Environmental (1991), Newhook (1992) and MENVIQ (1992) and were identical to the values recommended in the original CCME (1996) protocol. Health Canada (2004a) recently revised their human receptor assumptions to reflect the current state of knowledge. The values recommended by Health Canada (2004a) were adopted by CCME (2005). A comparison of the existing receptor assumptions used in the CSST protocol to the recently revised values adopted by CCME (2005) and Health Canada (2004a) is provided in Table 3.1. Further details on the sources (i.e., scientific study) that each parameter selected by CCME/Health Canada is based on are provided in Appendix I of the CCME (2005) protocol document. TABLE 3.1: Human Receptor Characteristics Adopted by CSST (BCE 1996) and CCME (2005)/Health Canada (2004a) 1 Age Classes (years) Infant (0-0.5) Toddler (0.6-4) Child (5-11) Teen (12-19) Adult (20+) Body Weight BW (kg) 7 (8.2) 13 (16.5) 27 (32.9) 57 (59.7) 70 (70.7) Air Inhalation Rate IR (m 3 /day) 2 (2.1) 5 (9.3) 12 (14.5) 21 (15.8) 23 (15.8) Water Ingestion Rate - WIR (L/day) 0.75 (0.3) 0.8 (0.6) 0.9 (0.8) 1.3 (1.0) 1.5 (1.5) Soil Ingestion Rate SIR (kg/day) ( ) ( ) ( ) ( ) ( ) Skin Surface Areas 2, 3 SA (m 2 ) Hands (0.032) (0.043) (0.059) (0.080) (0.089) Other (0.146) (0.258) (0.455) (0.223) (0.250) Dermal Loading to Skin DL (kg/m 2 event) Hands (0.001) (0.001) (0.001) (0.001) (0.001) Other (0.0001) (0.0001) (0.0001) (0.0001) (0.0001) 1. The values not in brackets represent the CSST (BCE 1996) values, the values in brackets represent the values adopted by CCME (2005) and Health Canada (2004a). 2. BCE (1996) assumed total body is exposed for the infant; head, arms, hands, lower legs for toddler and child; and head, arms, and hands for teens and adults. Soil dermal contact rate (SR) = SA x DL. 3. CCME/Health Canada assume arms are exposed for adults and teens; arms and legs are assumed to be exposed for infants, toddlers and children. Soil dermal contact rate (SR) = (SA hands xdl hands + SA other xdl other )x event/day (where event/day = 1).
64 July Recommendation The receptor characteristics in the existing CSST protocol should be revised to reflect the above human health characteristics adopted by Health Canada and CCME Exposure Period The amount of time a receptor spends on site is linked to the land use. The exposure period depends on the frequency, duration and intensity of the exposure assumed for the land use. The sensitive receptors, exposure period and exposure pathways that were assumed for each land use in the existing CSST protocol are provided in Table 3.2. TABLE 3.2: Human Health Exposure Assumptions For Each Land Use Based On Existing CSST Protocol Sensitive Receptor Exposure Term (ET) Direct Soil Exposure Pathways Indirect Soil Exposure Pathways Agricultural toddler (TC) adult (NTC) Residential/ Parkland toddler (TC) adult (NTC) Commercial Industrial 1 toddler (TC) adult (NTC) TC TC TC NTC NTC NTC Ingestion dermal contact dust inhalation groundwater indoor inhalation 6 ingestion dermal contact dust inhalation groundwater indoor inhalation ingestion dermal contact dust inhalation groundwater indoor inhalation Not applicable Not applicable Not applicable groundwater Notes: TC Threshold Contaminant NTC Non-Threshold Contaminant 1. Soil intake standards are not derived for the industrial land use scenario as the CSST recognized that issues relating to soil quality for human health protection on industrial sites are the mandate and responsibility of WCB. 2. Exposure Term for TC for Agricultural, Urban Parkland and Residential Land Use: 24hr/d x 7d/wk x 52wk/yr x 3.5yr/3.5yr 3. Exposure Term for TC for Commercial Land Use: 12hr/24hr x 5d/7d x 48wk/52wk x 3.5 yr/3.5yr 4. Exposure Term for NTC for Agricultural, Urban Parkland and Residential Land Use: 24hr/d x 7d/wk x 52wk/yr x 70yr/70yr 5. Exposure Term for NTC for Commercial Land Use: 12hr/24hr x 5d/7d x 48wk/52wk x 70yr/70yr 6. This pathway was not part of existing CSST protocol but is recommended for inclusion based on this review. The exposure term (ET) is a modifying factor to account for non-continuous exposure, and referenced in Table 4 of the CSST protocol. Generally, the exposure terms used in the existing CSST protocol for each land use are the same as those used by CCME (2005). The only exceptions are outlined below.
65 July Exposure Term for Non-Threshold Contaminants - CCME (2005) assumes the ET for non-threshold contaminants for all land uses (including commercial) is 1.0 since the exposure period (i.e., 10 hrs/day, 5 d/wk, 48 wk/yr for 30 to 40 years over a lifetime) exceeds the likely latency period for most carcinogens. Assuming an ET of 1.0 for non-threshold substances for the agricultural and residential land use scenarios is fairly standard for guideline development purposes. However, assuming an ET of 1.0 for the commercial land use scenario is a fairly conservative assumption, as this assumes that a worker is exposed for their entire life expectancy. The existing CSST protocol assumes an ET of 1.0 for agricultural and residential land use, but uses an ET of 0.33 for commercial land use (see Table 3.2). In the existing CSST protocol, a commercial workers exposure (i.e., 12 hrs/d, 5 d/wk, 48 wk/yr, 70 yrs) to a non-threshold substance was amortized over life expectancy (i.e., 70 yrs), which resulted in a exposure term of Changing the exposure term to 1.0 for the commercial land use scenario for non-threshold substances would result in more conservative soil standards (approximately 3 times lower). It is worth noting that CSST did not adopt this approach when it was initially recommended in the original protocol (CCME 1996). Health Canada is currently looking into the validity and defensibility of amortization for carcinogenic substances. Until that time, Health Canada (2004a) currently recommends averaging daily exposure (i.e., hrs/d 4, d/wk, wk/yr, total yrs exposed to site) over the life expectancy. If cancer risks are estimated for adults, then the 56 year duration of adulthood (i.e., 20 to 75 years) should be used for life expectancy. If cancer risks are estimated on the basis of lifetime average daily intake, then an average life expectancy of 75 years should be used. Considering that CSST did not adopt the approach when it was initially recommended in the original protocol (CCME 1996) and considering that the Health Canada (2004a) approach is more in line with the existing CSST approach, no change is recommended at this time. However, further evaluation of exposure amortization may be warranted upon completion of the Health Canada study. Hours Per Day Exposure Term - CCME (2005) does not consider hours per day exposure for soil ingestion or dermal contact, consistent with Health Canada (2004a) recommendations, since soil ingestion and dermal contact are not expected to occur at a uniform rate throughout the day. The CCME (2005) recommends only applying the hours per day exposure to the dust/air inhalation pathway. For the ingestion and dermal pathways, the CCME commercial ET is 0.66 (5 days/7 daysx48 weeks/52 weeks). The existing CSST protocol currently incorporates hours per day exposure for the soil ingestion, dermal contact and dust inhalation pathways. If hours per day is excluded from the calculation for the soil ingestion and dermal contact pathways, the only 4 Hours per day exposure would only be applicable for the dust/air inhalation pathways.
66 July noticeable change would be for the commercial land use scenario, which was the only land use to assume a less than 24 hour exposure term 5. The exposure term would increase from 0.33 to 0.66, which would result in a two times more conservative soil standard for the soil ingestion and dermal contact pathways. CCME assumes a receptor spends 10 hrs/day on a commercial site and CSST assumes 12 hrs/day. This slight difference in exposure time translates into an exposure term of 0.27 versus 0.33 for CCME and CSST, respectively. The slight difference in hours per day exposure is only applicable for the inhalation pathways, if the hours per day exposure term is removed for the other pathways (see above paragraph). Sensitive Receptor for Threshold Contaminants at Commercial Sites - The CSST commercial standard for threshold contaminants is based on a toddler receptor, which is a conservative assumption, but typically a standard assumption for guideline derivation purposes. Toddlers are unlikely to be present at commercial sites for appreciable periods of time. While a toddler is assumed to ingest four-times more soil than a child, the conditions under which toddlers would ingest significant quantities of soil (i.e., direct contact with exposed dirt) would be unlikely at most commercial sites. While in residential back-yards, toddlers could quite readily come into contact with soil, unrestricted contact with soil at commercial sites with unpaved dirt surfaces would be infrequent. For the commercial scenario and threshold contaminants, a more realistic sensitive receptor may be a child receptor. We recognize that for most commercial sites an adult would be the most appropriate receptor; however; the commercial scenario is not defined to preclude children and therefore, it would not seem conservative enough to adopt the adult as the sensitive receptor. Therefore, we recommend adopting a child as the sensitive receptor for the commercial scenario. However, it is important that the commercial land use standard is defined to exclude any commercial scenarios where children or toddlers could be present for appreciable periods of time (e.g., daycare at commercial site, community centres, and hospitals). For commercial scenarios where toddlers or children could be present, the more conservative residential standards should be applied. As indicated in the above section, removing the hours per day exposure term for the soil ingestion pathway for the commercial scenario would result in a 2 times decrease in the soil standard. If the sensitive receptor for a commercial scenario is changed from a toddler to a child, the implication for the standard can be evaluated through use of a factor (F) that combines the receptor characteristics and exposure term, as follows: Current CSST protocol: F toddler = 13 kg / ( 8x10⁻⁵ kg/day x 0.33 ) = 4.9x10 5 day Proposed CSST protocol: F child = 32.9 kg / ( 2x10⁻⁵ kg/day x 0.66 ) = 2.5x10 6 day 5 Agricultural, Residential and Urban Park land use scenarios all assumed the receptor was present 24 hr/day. Therefore, if the hours per day exposure term is removed, the overall exposure term does not change (see Table 3.2).
67 July The implication is that instead of the intake standard decreasing by a factor of 2 times, it would increase by a factor of 5 times for commercial sites. Industrial Land Use - The CCME (2005) protocol also includes derivation of a human health soil intake guideline for industrial land use whereas the CSST protocol does not. The existing CSST protocol did not develop soil intake standards for the industrial land use exposure scenario as CSST recognized that issues relating to soil quality for human health protection on industrial sites are the mandate and responsibility of the Workers Compensation Board of British Columbia (WCB). It is fairly common practice in site investigations and risk assessment in B.C. to apply the commercial land use standards for soil intake to a site classified for industrial land use. This is a highly conservative practice as the sensitive receptor for an industrial setting is an adult whereas in a commercial setting the sensitive receptor for a threshold contaminant is a toddler. Considering that adults consume one quarter of the soil typically consumed by children and have about four times the body mass to distribute chemicals, an industrial land use standard would generally be higher than those generated for other land uses (including commercial). Recommendations Assuming an exposure term of 1.0 for non-threshold contaminants (i.e., CCME approach), regardless of the land use, is considered an overly conservative assumption. Considering that CSST did not adopt this approach from CCME when it was initially recommended in the original protocol (CCME 1996) and considering that the Health Canada (2004a) approach is more in line with the existing CSST approach, no change is recommended at this time. Further evaluation of exposure amortization may be warranted upon completion of the Health Canada study As recommended by Health Canada (2004a) and CCME (2005), the hours per day exposure term should not be applied to the soil ingestion and dermal contact exposure pathways as soil ingestion and dermal contact are considered to be independent of the time spent outdoors in contact with contaminated soil. For both of these pathways, 100% of the daily unintentional intake of contaminated soil should be assumed to come from the site, regardless of the number hours spent on site. Inhalation exposures should still be derived based on the number of hours spent on the contaminated site. BCMWLAP should engage in discussions with WCB to determine whether issues relating to soil quality for human health protection on industrial sites are the mandate and responsibility of the Workers Compensation Board of British Columbia (WCB) or BCMWLAP. Consideration should be given to adopting a less conservative sensitive receptor (child versus toddler) for the commercial land use scenario for threshold contaminants. This change is contingent on an appropriate designation of the commercial land use scenario.
68 July HUMAN HEALTH PROTECTION: VAPOUR INHALATION The migration of volatile chemicals into indoor air through soil vapour intrusion is an exposure pathway that was not part of the existing CSST protocol. The development of regulatory criteria or standards for this pathway is considered important since experience at contaminated sites has indicated the potential for unacceptable human health risk resulting from soil vapour intrusion. The scope of the evaluation presented below is the protection of human health based on chronic health risks due to long-term exposure to vapours. It does not address potential safety hazards associated with landfill gases such as methane. There have been significant recent developments for regulatory guidance for the soil vapour intrusion pathway, including guidance prepared by USEPA (2003), Golder (2004) ( Health Canada guidance) and Science Advisory Board for Contaminated Sites (SABCS) in British Columbia (SAB, 2004). has been integrally involved in the development of guidance for these agencies. The proposed framework and protocol for deriving standards presented in this chapter is generally consistent with that proposed by the Science Advisory Board (SAB) of British Columbia, as documented in the Screening Risk Assessment (SRA) Level 1 and 2 protocols (SAB, 2004a,b). The proposed SRA approach for vapour intrusion (VI) was presented during a workshop on July 16, 2004, and the SAB SRA VI report was completed in Fall Review of Soil Vapour Guidance Regulatory guidance for soil vapour intrusion developed by the Canadian Council of Ministers of Environment (CCME), US Environmental Protection Agency (USEPA), Health Canada (Golder, 2004) and SAB (SRA-VI) are reviewed below. Integral components of regulatory guidance for the vapour intrusion pathway are (i) partitioning equations used to estimate vapour concentrations, based on concentrations in soil or groundwater, (ii) prediction of vapour transport and indoor vapour concentrations, and (iii) procedures used to estimate potential human health risk based on predicted indoor air concentrations. The vapour transport component can be quantified through use of a vapour attenuation factor ( alpha ), which is the ratio of the indoor air concentration divided by soil vapour concentration at the point of interest (i.e., ppbv/ppbv or dimensionless ratio). The soil vapour concentration can either be measured or estimated from the concentration in groundwater. The vapour attenuation factor is the inverse of the dilution factor, which is used by CCME to describe vapour intrusion.
69 July There are three different types of vapour attenuation factors or alpha s: Groundwater-to-indoor air alpha: This alpha is based on the soil vapour concentration estimated from groundwater data (i.e., using Henry s Law constant) and represents chemical transport through both the capillary fringe immediately above the water table and higher regions of the unsaturated zone. Soil vapour-to-indoor air alpha: This alpha is based on the measured soil vapour concentration within the unsaturated zone and represents transport through the unsaturated zone. If the soil vapour concentration is estimated for a soil contamination source above the water table, then the soil vapour-to-indoor air alpha is the appropriate factor to apply for estimation of the indoor air concentration. Subslab vapour-to-indoor air alpha: This alpha is based on the measured subslab vapour concentration measured immediately below a building foundation and represents primarily transport through the foundation CCME CWS-PHC (2000) The Canadian Council of Ministers of the Environment (CCME) established generic soil standards for the vapour intrusion pathway as part of the Canada Wide Standards for Petroleum Hydrocarbon Compounds (CWS-PHC) (June 2000). The CCME framework was based on the US Total Petroleum Hydrocarbon Criteria Working Group (TPHCWG) approach, although some modifications to the fractions and toxicity reference values were made. Soil standards were developed for the F1 and F2 fractions for residential and commercial land use scenarios. These F1 and F2 fractions correspond to alkane equivalent carbon ranges between n-c6-10 (F1) and >n-c10-16 (F2). The Johnson and Ettinger (J&E) model was used to calculate the vapour attenuation ratio used to derive the standards. The CCME CWS-PHC (2000) guidance for vapour intrusion is similar to that proposed in the draft CCME Protocol for the Derivation of Environmental and Human Health Soil Quality Guidelines (2005). Additional details on the model and assumptions used to derive soil standards are provided below CCME Protocol (2005) The CCME guidance provides a method for estimating a soil quality guideline for a broad range of volatile organic compounds (VOCs) based on migration of subsurface soil vapour into buildings. Contamination of indoor air by volatilization from contaminated soil is considered by CCME to be a critical pathway of exposure for volatile organic chemicals.
70 July The migration of soil vapours into indoor air is considered to be a function of several factors including soil type, depth or distance of contamination from the building foundation, type of building foundation, the building air exchange rate, and building dimensions. The indoor air concentration is estimated using the one-dimensional analytical model developed by Johnson and Ettinger (1991). For purposes of generic guideline development, steady state conditions are assumed, and depletion of the contaminant source is not considered. The soil gas advection rate into the building is calculated using the Perimeter Crack Model, which estimates the soil gas flow rate to a drain, intended to approximate a crack in the floor/wall seam. The soil vapour concentration is calculated using a linear partitioning model that assumes equilibrium conditions between contaminants adsorbed to soil particles, dissolved in soil pore water, and in the vapour phase within the soil pores. The key input parameters assumed by CCME (2005) for the J&E model are summarized below: Depth to Contamination ( diffusional path length ): For purposes of generic guideline development, it is assumed that the soil-borne contamination is a minimum of 30 cm (0.3 m) from the building foundation. Indoor to outdoor pressure differential ( P): For residential dwellings, a building depressurization of 4 Pa was assumed based on an approximate annual pressure differential data from CMHC. For commercial and industrial buildings, a lower default negative pressure differential of 2 Pa was selected because of forced, calibrated air exchange designed into heating systems, and due to the more regular and routine movement of building occupants into and out of the structure. Soil permeability to soil gas flow: The soil gas permeability of soil beneath a building foundation was assumed to be 1x10⁻⁸ cm 2 for coarse-grained soil, and 1x10⁻¹⁰ cm 2 for fine-grained soil. For comparison, USEPA (2003) suggests that typical soil gas permeability s are within the following ranges: Medium sand: 1.0x10⁻⁷ to 1.0x10⁻⁶ cm 2 Fine sand: 1.0x10⁻⁸ to 1.0x10⁻⁷ cm 2 Silty sand: 1.0x10⁻⁹ to 1.0x10⁻⁸ cm 2 Clayey silt: 1.0x10⁻¹⁰ to 1.0x10⁻⁹ cm 2
71 July Building air exchange rate: A building air change rate of 1 hr -1 is assumed for a residential scenario, while an air change rate of 2 hr -1 is assumed for a commercial scenario. Building mixing height: A building mixing height of 4.88 m is assumed for a residential scenario, while a height of 3 m is assumed for a commercial scenario. Building footprint area: A building footprint of 150 m 2 is assumed for a residential scenario, while an area of 300 m 2 is assumed for a commercial scenario. Under the CCME protocol, the allowable indoor air concentration originating from soil contamination is the reference concentration (R f C) or tolerable concentration (TC) minus the background indoor air concentration for threshold substances, or the risk-specific concentration (RSC) for non-threshold substances USEPA Draft Vapour Intrusion Guidance (2003) The USEPA recently published draft guidance for the vapour intrusion pathway (USEPA, 2003) that enable derivation of screening groundwater and soil vapour criteria for a residential land use scenario. The USEPA guidance embodies a three-tiered approach, as follows: Preliminary Screening: This step involves qualitative screening of sites to evaluate the potential for vapour intrusion, and to identify site conditions that warrant immediate assessment and possible mitigation. Secondary Screening: This step involves the use of generic or semi-site-specific vapour attenuation factors to determine acceptable concentrations in groundwater or soil vapour (i.e., groundwater or soil vapour criteria) based on target risk levels and standard equations for estimating health risk. The USEPA approach is to calculate criteria using look-up tables of specified vapour attenuation factors based on 1/3 order-of-magnitude increments. Site Specific Screening: This step involves the site specific use of a model to predict indoor air concentrations. There is a strong emphasis on the use of direct measurements (subslab vapour, indoor air) to confirm model predictions as part of a site specific assessment. The semi-site-specific attenuation factors are provided in look-up charts ( alpha charts ) for four US Soil Conservation Soil (SCS) soil types and varying depth to contamination source. The generic vapour attenuation factors are as follows: Subslab vapour-to-indoor air alpha: 0.1;
72 July Soil vapour-to-indoor air alpha: ; Groundwater-to-indoor air alpha: The semi-site-specific vapour attenuation factors were developed using the Johnson and Ettinger (1991) model; however, empirical data were used to ensure that the modelderived values were reasonable. The model-predicted results were compared to measured attenuation factors from chlorinated solvent-impacted sites, and there has been debate concerning the appropriateness of these attenuation factors for chemicals that biodegrade aerobically. The semi-site-specific attenuation factors are up to 14 times lower than the generic attenuation factors for groundwater and up to 77 times lower for soil vapour (i.e., depending on the depth and soil type). The USEPA is currently preparing updated guidance that will likely include changes to the above generic attenuation factors. In addition, the alpha charts will be supplemented by a constrained version of the J&E model where users will be able to vary a limited number of parameters, within certain ranges, to estimate health risk and calculate groundwater and soil vapour criteria Draft Health Canada and SRA-2 VI Guidance The draft Health Canada (HC) and SAB SRA-2 VI guidance for screening level risk assessment are similar and provide a protocol for estimation of potential human health risk from vapour intrusion for both residential and commercial land use scenarios. Although the protocol includes methods for soil, groundwater and soil vapour concentration data, preference is given to use of groundwater and soil vapour media for screening level risk assessment, with use of soil data being strongly discouraged. The methodology described can also be used to derive screening groundwater and soil vapour criteria. The draft HC and SAB SRA-2 VI guidance follow a similar tiered evaluation framework for screening level risk assessment (SLRA) as the USEPA guidance, comprising Preliminary and Secondary Screening steps (Figure 4.1). The vapour intrusion SLRA guidance consists of two tiers. The first tier, Preliminary Screening, is a qualitative screening step to categorize sites according to their potential for vapour intrusion, to determine whether the assessment should proceed to the second tier, and to identify site conditions that warrant immediate assessment and possible mitigation. The second tier, Secondary Screening, consists of a screening-level quantitative risk assessment where representative semi-site specific vapour attenuation factors are used to estimate indoor air concentrations, which, in turn, are used to predict health risk. The semi-site specific 6 In context of USEPA guidance, the soil vapour-to-indoor air alpha is applicable when the vapour measurement is below 5 foot depth below the building slab.
73 July vapour attenuation factors are based on the results of model predictions using the Johnson and Ettinger (J&E) model. The look-up charts for the semi-site specific vapour attenuation charts were developed with the Johnson and Ettinger model using benzene as a representative chemical; however, empirical data was used to validate to model results. The user selects the vapour attenuation factor that is most relevant using site specific information such as depth to contamination, building type (residential and commercial) and soil type (coarse- and fine-grained).
74 July FIGURE 4.1: Flow Chart for Health Canada SLRA Vapour Intrusion Guidance
75 July Unlike the USEPA guidance, the HC/SAB guidance does not include generic attenuation factors and instead the user proceeds directly to semi-site-specific attenuation factors. The proposed HC/SAB semi-site specific attenuation factors are slightly lower (by about 30 percent) than the USEPA guidance since different input parameters were used for the J&E model. The HC/SAB guidance also includes several site-specific optional adjustments, when warranted based on site-specific conditions, which reflect contaminant mass flux and source depletion considerations, mixing height for vapour inside the building, and biodegradation of hydrocarbon vapours.. The SRA guidance also includes a check for where the risk-based target indoor air concentration are lower than the background indoor air concentration; in such cases, the target indoor air concentration is replaced by the median background concentration Comparison of CCME, USEPA and HC/SAB Guidance The CCME, USEPA and HC/SAB vapour attenuation ratios are compared in Table 4.1. A depth to contamination of 1.5 m was chosen to enable comparison to the USEPA semisite specific attenuation factors, since this is the minimum depth for which attenuation factors are provided for the USEPA guidance. The CCME attenuation factor is that given in Table 3.6 of the Canada Wide Standards Scientific Rationale Document (CCME, 2000). As noted in Section 4.1.1, the CCME (2005) protocol assumes an identical model and input parameters as CCME (2000). The USEPA semi-site specific attenuation factors are those provided in Figures 3a and 3b (USEPA, 2003). The HC/SAB attenuation factors are those provided in Figures 3 to 7 (SAB, 2004). TABLE 4.1: Comparison Guidance Vapour Attenuation Factors Groundwater to Indoor Air Soil Vapour (Soil) to Indoor Air Residential Commercial Residential Commercial Depth Coarse- Fine- Coarse- Fine- Coarse- Fine- Coarse- Fine- Grained Grained Grained Grained Grained Grained Grained Grained (Sand) (Loam) (Sand) (Loam) (Sand) (Loam) (Sand) (Loam) CCME CWS- 1.5 m N/A N/A N/A N/A 3.7E E E E-06 PHC (2000) 30 m N/A N/A N/A N/A 8.9E E E E-07 USEPA Draft Generic 1.0E E-03 N/A N/A 1.0E E-02 N/A N/A VI Guidance (2003) 1.5 m 1.2E E-04 N/A N/A 2.2E E-03 N/A N/A 30 m 2.7E E-05 N/A N/A 3.1E E-04 N/A N/A Health Canada Draft 1.5 m 8.3E E E E E E E E-04 VI Guidance (2004) 30 m 1.9E E E E E E E E-05 The HC/SAB attenuation factors are approximately 30 percent lower that the USEPA factors. The CCME attenuation factors are over one order-of-magnitude less than the HC/SAB factors. For example, for a residential scenario and coarse-grained soil, the CCME attenuation factors are 42 times less than the HC/SAB factors.
76 July The main reasons for the difference between the CCME and HC/SAB attenuation factors are summarized below for the residential scenario. Additional justification for input parameters is provided in SAB (2004): Air exchange Rate: CCME 1 hr -1, HC/SAB: 0.35 hr -1. The HC/SAB residential air exchange rate was chosen based on extensive literature review of published air change rates (Hers et al., 2001). In regions with relatively cold climates, the recent trend has been to construct air-tight houses with reduced ventilation rates to minimize energy consumption and costs (e.g., R-2000 houses in Canada; Gusdorf and Hamlin, 1995). In Canada, the minimum required ventilation rate under the CSA F326 standard for Residential Mechanical Ventilation Systems depends on the number and types of rooms in the house but usually works out to about 0.3 air changes per hour. Building Mixing Height: CCME 4.88 m, HC/SAB: 3.66 m. The CCME building mixing height assumes complete mixing over two stories, whereas HC/SAB assumes mixing over one and half stories, since some vapour attenuation would be expected between floors. Soil Gas Advection Rate: The CCME soil advection rate (Q soil ) is calculated using the Perimeter Crack Model. For coarse-grained soil, a Q soil of 0.6 L/min is obtained using the CCME default parameters (k a = 1x10⁻⁸ cm 2, r crack = 0.2 cm, X crack = 49 m, Z crack = 2.44 m, P = 4 Pa). For the HC/SAB guidance, the Q soil value (5 L/min) was directly input into the model and was based on a typical range of about 1 to 10 L/min observed for tracer test data for residential buildings and coarse-grained soils. The Perimeter Crack Model is most sensitive to the soil-air permeability. The CCME default soil-air permeability of 1x10⁻⁸ cm 2 is representative of fine sand. Soil Moisture: The CCME water-filled and total porosity is and 0.36, respectively. The HC/SAB water-filled and total porosity is and 0.375, respectively. The HC/SAB porosities are identical to those assumed by USEPA and are based on a waterretention model for sand assuming relatively dry conditions below a building. 4.2 Proposed Protocol for Soil Vapour Intrusion Criteria or Standards General Considerations Case studies at a number of sites throughout North America have indicated potential unacceptable health risk associated with soil vapour intrusion. In particular, there have been chlorinated solvent-impacted sites where elevated indoor vapour concentrations were well above background levels. This experience indicates that soil vapour intrusion can be a significant potential exposure pathway and that regulatory guidance is warranted.
77 July There are significant challenges associated with development of regulatory guidance for the soil vapour pathway. The pathway is fairly complex, vapour intrusion is highly variable depending on site conditions, and there is a relatively high level of uncertainty associated with predictive models used for this pathway. In particular, the development of a single-valued generic soil or groundwater criteria is challenging from a regulatory perspective since by necessity, generic criteria are conservative to ensure a low occurrence of false negatives (i.e., risks are identified as acceptable when, in fact, they are not). This results in many sites as being identified as needing further assessment, but where there is no unacceptable vapour intrusion risk at the site (i.e., high rate of false positives). For the above reasons, there is an increased emphasis on the use of a tiered guidance framework and use of site data and adjustments to generic criteria for more realistic and less conservative evaluation of soil vapour intrusion. The trend is also toward comprehensive, integrated guidance that addresses both screening and detailed risk assessment protocols, and which includes supporting guidance on methodology (e.g., soil vapour sampling). Recommendation If soil vapour intrusion standards are included in the BC regulatory framework, it is considered essential that a readily implementable screening risk assessment protocol be in place to facilitate the derivation of less conservative, site-specific standards, and that protocols be in place for technically defensible methods for soil vapour characterization Applicable Media The USEPA vapour intrusion guidance is limited to criteria for soil vapour and groundwater. The draft Health Canada guidance, while including a protocol for estimation of potential risks associated with contamination in soil, groundwater and soil vapour, indicates a strong preference for the use of soil vapour, and to a lesser extent groundwater, for risk assessment purposes. Soil vapour characterization provides for a more direct measurement of potential vapour intrusion risk since the partitioning calculations are by-passed. Potential limitations associated with soil vapour as a medium for standard development include possibly greater temporal variability compared to concentrations measured in groundwater, and less well-developed protocols for soil vapour characterization compared to groundwater. Groundwater characterization for evaluation of vapour intrusion studies should provide information on concentrations in groundwater near to the water table. This is because cross-media transfer from groundwater to soil vapour occurs when chemicals in porewater volatilize into soil gas, which occurs in the capillary transition zone above the
78 July water table. Relatively short monitoring well screens situated across the water table are desirable when evaluating the soil vapour intrusion pathway, although a combination of shallow and deeper well screens may be warranted for site characterization purposes, particularly when a DNAPL source is present. A limitation with groundwater as a media for standard development is that partitioning calculations are required to estimate the vapour concentration. Groundwater standards for the vapour intrusion pathway should only apply when contamination is limited to dissolved constituents in groundwater. In areas where LNAPL is present at the water table or where there is soil contamination above the water table, only soil vapour standards are applicable. The implication is that soil vapour characterization would be required at all sites with LNAPL contamination. Since petroleum hydrocarbon dissolved plumes are typically relatively short and since it is often difficult to distinguish between dissolved and residual NAPL zones, it is debatable whether groundwater standards would be of practical use at many petroleum hydrocarbon sites. In contrast, there are numerous examples of long chlorinated solvent dissolved plumes and therefore, there would be significant areas of these sites where groundwater standards could apply. Consideration could be given to only developing soil vapour standards for petroleum hydrocarbon compounds. There are significant limitations associated with the use of soil as a medium for standard development purposes, including: (i) soil-vapour partitioning relationships are complex and there is significant uncertainty in the partitioning relationships commonly used; (ii) there is considerable variability in natural organic carbon, which is a sensitive parameter for estimation of vapour concentrations; (iii) soil concentrations tend to exhibit greater small-scale variability than groundwater or soil vapour concentrations; and, (iv) measured soil concentrations may be biased low as a result of sampling methods and volatilization losses. It is noted that when typical default organic carbon fraction values (e.g., 0.006) are used, relatively conservative soil criteria are calculated. For an existing building scenario, the use of groundwater and soil vapour standards to evaluate potential soil vapour intrusion risks is considered technically sound and practically implementable. For sites under-going re-development or where future development may occur (e.g., Brownfield sites with no buildings), it is recognized that the absence of soil standards may be problematic in that remediation end-points are less well defined when based solely on groundwater and/or soil vapour. For sites undergoing remediation, it may be desirable to derive site specific remediation targets for soil that correspond to the generic or risk-based soil vapour standard, as applicable, to guide the site remediation process. The soil concentration targets can be calculated on a sitespecific basis using partitioning relationships described in the SRA-2 guidance (SAB, 2004b). Development of site specific target concentrations for jar or bag headspace vapour tests may be useful to guide remediation excavations. Post-remediation sampling of groundwater and soil vapour may be warranted to confirm standards have been met.
79 July Recommendation For purposes of standard development, applicable media should be limited to groundwater and soil vapour, and should not include soil. However, the contaminated sites regulatory framework should incorporate a process by which site-specific remediation targets may be developed for soil to guide site remediation, where groundwater and/or soil vapour concentrations exceed relevant standards. Groundwater standards are only applicable when contamination is limited to a dissolved plume in groundwater. If there is LNAPL at the water table or soil contamination above the water table, only vapour standards should apply. The implication is soil vapour characterization would be mandatory at sites with LNAPL or soil contamination. Since petroleum hydrocarbon dissolved plumes are typically relatively short and since it is often difficult to distinguish between dissolved and residual NAPL zones, it is debatable whether groundwater standards would be of practical use at many petroleum hydrocarbon sites. Consideration could be given to only developing soil vapour standards for petroleum hydrocarbon compounds Preliminary Screening and Precluding Factors Two important components of the SRA guidance are Preliminary Screening and evaluation of precluding factors (Figure 4.1). Preliminary Screening is a qualitative screening step where sites are categorized according to their potential for vapour intrusion. No further assessment of the vapour intrusion pathway is required (i) at sites where occupied or future buildings are greater than 30 m from concentrations in soil and/or groundwater that are above background levels 7, provided that certain conditions are met, or (ii) where the chemical is not of concern based on screening based on volatility and toxicity (see Section 4.2.4). At the opposite end of the spectrum, if there are indications of significant health or safety risk (contamination in sumps or basements, chemical odours indicative of a subsurface vapour source), immediate follow-up action including possible risk mitigation is required. Under the SRA protocol, all sites that fall between the above scenarios proceed to Secondary Screening; however, precluding factors are initially evaluated to determine whether Secondary Screening is appropriate, or whether the assessment should proceed to detailed risk assessment. These precluding factors are sites with the following characteristics: 7 30 m lateral or vertical distance
80 July Very high gas permeability media such as vertically or near vertically fractured bedrock, karst, cobbles or other media with unusually high gas permeability; Utility conduits that intersect a vapour contamination source and that are directly connected to the building, and/or; and, Buildings with earthen basements. Although the Health Canada and SAB guidance includes a precluding factor for shallow depth to contamination (less than 1 m), this precluding factor is not applicable for standards development since a separate vapour standard is proposed for shallow depths (see Section 4.2.5). The proposed protocol for derivation of generic vapour standards utilizes the Secondary Screening attenuation factors assuming conditions considered applicable to most sites (coarse-grained soil, 1 m depth to contamination). The attenuation factors proposed for derivation of standards may not be sufficiently protective for sites with conditions described by the above precluding factors. However, the above precluding factors would likely only apply at a small number of sites. Consideration should be given to including the above precluding factors in the regulation so that users are directed to proceed to detailed risk assessment when these factors apply.
81 July Recommendations The regulation accompanying the vapour standards should include the preliminary screening step to identify whether vapour standards apply based on the 30 m rule. This, in concept, would be similar to the procedure followed to determine whether the aquatic life standards apply for groundwater flow to surface water. The regulation accompanying the vapour standards should include a preliminary screening step to evaluate whether there are indications of significant health or safety risk (contamination in sumps or basements, chemical odours indicative of a subsurface vapour source) where immediate follow-up action including possible risk mitigation is required. The protocol should recognize that the attenuation factors used for SRA and proposed for the derivation of generic vapour standards may not be protective of all site conditions. The regulation accompanying the vapour standards should identify the site precluding factors which would require a detailed risk assessment to be conducted. The precluding factors could includes sites with the following characteristics: Very high gas permeability media such as vertically or near vertically fractured bedrock, karst, cobbles or other media with unusually high gas permeability; Utility conduits that intersect a vapour contamination source and that are directly connected to the building, and/or; Buildings with earthen basements Chemical Screening The HC guidance includes screening step for evaluation of chemical toxicity and volatility to determine whether a chemical is contaminant of potential concern (COPC). The approach taken for the HC guidance was to compare the target indoor air concentration to the maximum theoretical equilibrium soil vapour concentration based on either groundwater-to-vapour (Henry s Law constant) or NAPL-to-vapour (Raoult s Law) partitioning multiplied by a conservative attenuation factor, to determine whether the chemical was toxic and volatile, as follows: If C vapour * α screen > C target then chemical is volatile and toxic.
82 July where C vapour is the maximum predicted soil vapour concentration, α screen is a conservative attenuation factor, and C target is the risk-based target indoor air concentration (PAQS HH-VI defined below). The intent of chemical screening is to identify chemicals that should be included for risk assessment purposes. However, it is counterproductive to set too conservative a screen since this will needlessly identify additional chemicals as potentially of concern for vapour intrusion. It is proposed that the α screen be slightly higher than the upper range empirical subslab-to-indoor air alpha. The subslab alpha is reasonable for this purpose since the closest measurement point to the interior of the building is subslab soil vapour. As discussed in Section 4.2.5, empirical data indicates that 0.01 is a conservative upper bound subslab alpha. Considering the uncertainty in this alpha, a α screen of 0.02 is proposed. Recommendation A protocol for identifying chemicals of potential concern for vapour intrusion is required. It is recommended that this screening be based on the maximum predicted equilibrium vapour concentration and a conservative alpha factor of Proposed Standards and Vapour Attenuation Factors The proposed regulatory framework for evaluation of soil vapour intrusion is based on three different types of standards depending on depth to the vapour contamination source and measurement point: Subslab/shallow soil vapour standards (< 1 m): This empirical standard would apply when depth to the soil vapour measurement point is less than 1 m below the building foundation. Soil vapour standards (>=1 m): This model-derived standard would apply when the depth to the soil vapour measurement point is greater than or equal to 1 m below the building foundation. The soil vapour measurement must be above the contamination zone. Groundwater standards (>=1 m): This model-derived standard would only apply when there is only dissolved contamination and the depth to the water table is equal to or greater than 1 m below the building foundation.
83 July The vapour intrusion standard implementation framework is shown in Figure 4.2. The proposed generic vapour attenuation factors are provided below in Table 4.2. The source of the generic attenuation factors are shown in Figure 4.3. TABLE 4.2: Preliminary Vapour Attenuation Factors for Standard Development Purposes Residential Scenario Commercial Scenario Subslab/Shallow Vapour 1E-02 1E-03 Soil Vapour 1.8E E-04 1 Groundwater 8.8E E-04 1 Note: 1. Alpha s are for benzene for transport through 1 m of coarse soil; recommend that chemical-specific alpha s be calculated It is anticipated that the proposed soil vapour standards would require a new matrix table as part of the Contaminated Sites Regulation (CSR), if implemented. The format for a possible matrix table is provided below in Table 4.3. For the groundwater-to-indoor air pathway, inclusion of the vapour pathway would simply require an additional column to the Schedule 6 matrix standards. Min 0.5 m Min 1 m α s = 0.01 Subslab/shallow soil vapour standards apply Soil Vapour or groundwater standards apply α v = α g = FIGURE 4.2: Framework for Generic Soil Vapour Intrusion Standards
84 July E-02 1.E-02 Vapour Attenuation Factor 1.E-03 1.E-04 C. Grained F.Grained Vapour Attenuation Factor 1.E-03 1.E-04 C. Grained F.Grained 1.E Depth (m) Figure 4. Residential Groundwater to Indoor Air Attenuation Factors 1.E Depth (m) Figure 5. Residential Soil Vapour to Indoor Air Attenuation Factors 1.E-02 1.E-02 Vapour Attenuation Factor 1.E-03 1.E-04 C. Grained F.Grained Vapour Attenuation Factor 1.E-03 1.E-04 C. Grained F.Graine 1.E Depth (m) Figure 6. Commercial Groundwater to Indoor Air Attenuation Factors 1.E Depth (m) Figure 7: Commercial Soil Vapour to Indoor Air Attenuation Factors FIGURE 4.3: Health Canada/SAB SRA-2 Vapour Attenuation Factor Charts
85 July TABLE 4.3: Example Soil Vapour Matrix Table Chemical1 Chemical2 Residential Subslab/Shallow Soil Vapour (< 1 m) Soil Vapour (> 1 m) Commercial Subslab/Shallow Soil Vapour (< 1 m) Soil Vapour (> 1 m) Subslab/Shallow Soil Vapour Standards (< 1 m) The subslab/shallow soil vapour standard is calculated using a non-chemical specific vapour attenuation factor of 0.01 for residential sites and for commercial sites. The rationale for an attenuation factor of 0.01 for residential sites is that empirical data indicates that this is a reasonable upper bound (SAB, 2004; Hers et al., 2005). For commercial sites, there is virtually no empirical data. Therefore, the commercial subslab/shallow vapour alpha is obtained by scaling the residential empirical subslab alpha by the model predicted deeper soil vapour alpha s as follows: Commercial subslab/shallow alpha = 0.01 * Commercial soil vapour alpha / Residential soil vapour alpha = 2.5E-04/1.8E-03 = 1.4E-03 (rounded down to 1E-03) The rationale for the scaling is based on model predictions for the soil vapour to indoor air pathway, which indicate a roughly one order-of-magnitude reduction in alpha. A similar one order-of-magnitude reduction would be expected for the subslab alpha. The subslab/shallow soil vapour standards apply to soil vapour concentrations measured either below a building foundation or adjacent to the building; however, there are specific requirements for where the soil vapour measurement must be taken. If adjacent to the building, the soil vapour sample should be taken as close to the water table as possible. The soil vapour measurement depth must be at least 0.3 m below the building foundation, and 0.5 m below ground surface, and obtained reasonably close to the building (e.g., within 5 m). Below the building, the soil gas sample may be collected directly below the foundation slab. Soil Vapour Standard (> 1 m) The soil vapour standard is calculated using a chemical-specific J&E model-derived attenuation factor assuming a coarse-grained soil and 1 m depth to contamination. The proposed vapour attenuation factor for benzene is given in Table 4.2. The soil vapour standards are about five times less than the subslab/shallow vapour standard. Only about 20 percent of this difference is due to vapour attenuation over 1 m depth. There is a
86 July disjoint in the subslab/shallow and soil vapour standards since greater variability is expected for subslab and shallow soil vapour measurements based on a number of considerations including (i) greater variability in soil types and possible soil disturbance near to building foundations, (ii) environmental factors such as wind, atmospheric pumping and temperature will have a greater effect on shallow soil gas near the building, and (iii) the effect of biodegradation may be variable in shallow regions below and beside the building. The above processes will have less of an influence on deeper soil gas. Groundwater Standard (> 1 m) The groundwater standard is calculated assuming transport through both the capillary fringe and the unsaturated zone. Partitioning according to the Henry s law constant is used to estimate the vapour concentration from the concentration in groundwater. It is considered reasonable to limit the groundwater standard to depths greater than 1 m below the foundation to account for possible seasonal water table fluctuations and to allow for a certain thickness of the tension-saturated zone (i.e., capillary fringe), which varies with texture. The alpha value used to develop the example groundwater standard is consistent with the upper bound of the observed Health Canada empirical values. Precedence for Application of Standards Guidance is required on the precedence for application of standards since it is expected that at many sites both groundwater and soil vapour data will be obtained. Soil vapour samples could be obtained at a number of locations including near to the water table and from shallower regions either below or adjacent to the building. Repeat soil vapour sampling may be warranted to evaluate temporal variability. As discussed in Section 4.2.2, the use of soil vapour measurements is generally preferable since estimation of partitioning from groundwater is not required. However, appropriate protocols must be followed for soil vapour sampling and analysis. It is recommended that soil vapour standards take precedence over groundwater standards. However, if measured groundwater concentrations exceed standards by orders-of-magnitude, and soil vapour concentrations are less than the standards, the site investigation report should address possible reasons for this discrepancy. Recommendation Since soil vapour measurements provide for a more direct indication of potential vapour intrusion risk, it is recommended that soil vapour standards take precedence over groundwater standards, when measurements for both media are available.
87 July Biodegradation Adjustment The aerobic biodegradation of hydrocarbon vapours (e.g., BTEX) is well documented (Ostendorf and Kampbell, 1990; Ririe and Sweeney, 1995; Fischer et al., 1996, DeVaull et al., 1997, Hers et al, 2001, DeVaull et al., 2002). Several studies indicate significant attenuation in hydrocarbon vapour concentrations can occur over short vertical intervals. Unfortunately, there is still little information on the influence of buildings on oxygen transport and hydrocarbon vapour profiles below buildings. It is hypothesized that a building could limit the migration of oxygen to below the building thus potentially limiting biodegradation below the building. However, it is also possible that advective soil gas movement or pumping through barometric fluctuations could result in elevated oxygen levels below buildings. In the absence of field data, modeling studies have been used to gain insight on vapour biodegradation, as described below. The HC guidance includes an adjustment for hydrocarbons which readily biodegrade under aerobic conditions. The justification for the proposed adjustment is empirical data and the results of model predictions. For applicable chemicals, the base alpha is reduced by a factor of 10 when the depth from the foundation to the vapour contamination source is greater than 4 m and there is no significant capping effect beside the building. This depth was roughly based on the results of model predictions using a numerical model for diffusive vapour transport and oxygen-limited first-order biodegradation. The results of recent numerical modeling by Johnson (2005) of diffusive and advective transport combined with oxygen-limited biodegradation suggest that based on the model assumptions and inputs chosen for a residential scenario, the predicted alpha would be at least 10 times less than the base case alpha (i.e., which assumes no biodegradation) for a vapour contamination source greater than 3 m depth below the building. The State of New Jersey and Massachusetts are proposing for their vapour intrusion guidance to calculate generic criteria using an alpha that incorporates a 10 times reduction factor for readily biodegradable hydrocarbon compounds (e.g., BTEX) regardless of the depth to contamination. Aerobic biodegradation is an important process for hydrocarbon vapour attenuation. At this time, there is insufficient scientific basis for incorporation of a biodegradation adjustment for a generic groundwater or soil vapour standard based on a depth to contamination of 1 m, although it may be appropriate to include this adjustment for greater depths. However, a separate set of standards for deeper contamination sources would add to the complexity of the generic standards.
88 July Recommendation At this time, it is recommended that no biodegradation adjustment be incorporated in the calculation procedure for soil vapour intrusion standards. Further research into hydrocarbon vapour biodegradation below buildings is recommended. If warranted, the protocol should be revised to incorporate biodegradation for applicable chemicals. Chemical Specific Issues The SRA vapour intrusion protocol is non-chemical specific in that physical-chemical properties are not taken into account when selecting the attenuation factor. As noted in Section 4.1.4, the attenuation factor was derived using physical-chemical properties for benzene, since the diffusion coefficient, which is the only transport parameter influenced by physical-chemical properties, only varies by about a factor of two for most common VOCs. For SRA-2, benzene was assumed as a surrogate chemical for ease of calculations. However, for derivation of generic standards, it would be relatively simple to calculate chemical-specific attenuation factors when deriving groundwater or soil vapour standards. Recommendation It is recommended that chemical-specific properties be used to calculate a chemicalspecific alpha value used to derive groundwater and soil vapour standards. 4.3 Soil Vapour Inhalation Standard Risk Equations The proposed risk equations used to derive soil vapour and groundwater standards for the indoor vapour inhalation pathway are provided in Exhibit 4-1. The proposed protocol for deriving groundwater and soil vapour standards involves up to four steps: 1. Calculate target indoor air concentration. 2. Adjust target indoor air concentration based on background air concentrations, as warranted. 3. Calculate soil vapour standard, using the soil vapour-to-indoor air alpha. 4. Calculate groundwater standard, as follows:
89 July a. Calculate an acceptable soil vapour concentration using the groundwater-toindoor air alpha; b. Compare the soil vapour concentration to the maximum theoretical soil vapour concentration based on partitioning from NAPL phase; and, c. If the acceptable soil vapour concentration is less than the maximum theoretical concentration, calculate a groundwater standard using the Henry s Law constant partitioning equation (otherwise, no standard possible). Exhibit Equations for Soil Vapour Inhalation Standards Calculation Target Indoor Air Concentrations Threshold Substances (TC = R f C): PAQS HH VI T HQ TC = ( AF ) xet xet L 1 2 If no TC (R f C) is available, can calculate from TDI (R f D) as follows: TC = [ TDI ] ( IR) BW Non-Threshold Substances (unit risk (UR)): PAQS HH VI = T [ ILCR ] xed ( AFL UR) ATxET 1 ET2 If no UR is available, can calculate from slope factor (SF) as follows: UR = [ SF ] ( BW ) IR Adjustment for Background Air Concentration (when warranted) If PAQS HH-VI < C background air then PAQS HH-VI = C background air Calculation of Example Soil Vapour Standard The shallow soil vapour standard (< 1 m depth) is calculated as follows: PSVQS HH VI = PAQS a HH VI SV
90 July The deep soil vapour standard (> 1 m depth) is calculated as follows: PDVQS HH VI = PAQS a HH VI DV Calculation of Example Groundwater Standard The maximum theoretical vapour concentration is then calculated based on the maximum value for the predicted equilibrium concentration based on Henry s Law constant (i.e., dissolved source), and the predicted concentration based on Raoult s Law (i.e., NAPL source) and then compared to the back calculated vapour concentration based on the groundwater alpha. If the maximum possible vapour concentration is less than the back calculated vapour concentration, no groundwater standard is possible. Maximum theoretical C vapour Max = Maximum [ UCF1 * X * C solubility * H, UCF2 * X * VP / RT ] C Gdw vapour PAQS = a HH VI G If C vapour Max < C vapour Gdw then no standard possible. If a groundwater standard is possible, it is calculated as follows: PGQS where, HH VI = PAQS HH VI 1000 * a * H ' G = Slope factor (mg/kg-day) -1 PAQS HH-VI = Preliminary human health air standard (mg/m 3 ) PSVQS HH-VI = Preliminary human health shallow soil vapour standard (mg/m 3 ) PDVQS HH-VI = Preliminary human health deep soil vapour standard (mg/m 3 ) PGQS HH-VI = Preliminary human health groundwater standard (mg/l) HQ T = Target hazard quotient (recommend 0.5) ILCR T = Target incremental lifetime cancer risk (1x10⁻⁵ ) α SV = Shallow soil vapour-to-indoor air alpha (dimensionless) α DV = Deep soil vapour-to-indoor air alpha (dimensionless) α G = Groundwater-to-indoor air alpha (dimensionless) TC (R f C) = Tolerable concentration (mg/m 3 ) TDI (R f D) = Tolerable daily intake (mg/kg-day) UR = Unit risk factor (mg/m 3 ) -1 Slope factor TRV = toxicity reference value (mg/kg bw day) BW = body weight (kg) IR = air inhalation rate (m 3 /d) AF L = absorption factor for lung (unitless)
91 July ET 1 = exposure term 1 (unitless) days per week/7 x weeks per yr/52 ET 2 = exposure term 2 (unitless) hours per day/24 VP = vapour pressure (atm) X = mole fraction (dimensionless) R = Boltzman constant (m 3 -atm/k-mole) T = Temperature (K) H = Henry s Law constant (dimensionless) C solubility = Pure-phase solubility (mg/l) UCF1 = Unit conversion factor 1 (L/m3) UCF2 = Unit conversion factor 2 (1000 mg/g) Exposure Term for Non-Threshold Contaminants The exposure term for nonthreshold compounds includes the component related to the fraction of time exposed (ET 1 and ET 2 ) and amortization of less than a lifetime exposure over a lifetime (ED/AT). CCME (2005) assumes the ET for non-threshold contaminants for all land uses (including commercial) is 1.0 since the exposure period exceeds the likely latency period for most carcinogens as indicated in Section 3.0. The PQRA guidance by Health Canada (2005) assumes the ET for non-threshold contaminants for residential land use is 1.0. For commercial land-use, the ET is 0.24 based on ET 1 equal to 0.71 (5 days/7 days) and ET 2 equal to 0.33 (8 hours/24 hours). For the residential and commercial scenarios, Health Canada current policy is not to allow amortization for less than a lifetime of exposure for residential, commercial or industrial exposures (ED/AT = 1). As indicated in Section 3.0, Health Canada is currently evaluating their policy on amortization for carcinogenic substances. While the CSST protocol did not directly address inhalation of vapours, for the dust inhalation pathway, the ET s were 1.0 for the residential scenario and 0.33 for the commercial scenario. Exposure Term for Threshold Compounds The exposure term for threshold compounds is the fraction of time exposed (ET 1 and ET 2 ). CCME assumes an exposure term of 0.33 for threshold contaminants based on ET 1 equal to 0.71 (5 days/7 days) and ET 2 equal to 0.42 (10 hours/24 hours). Health Canada (2005) assumes the ET for threshold contaminants are 1.0 for residential land use and 0.24 for commercial land-use, as indicated above for non-threshold substances.
92 July While the CSST protocol did not directly address inhalation of vapours, for the dust inhalation pathway, the ET s were 1.0 for the residential scenario and 0.33 for the commercial scenario. Adjustment of Target Indoor Air Concentration for Background For a few chemicals, target indoor air concentrations are less than typical background indoor air concentrations. For example, for benzene and a residential scenario, the target air concentration (PAQS HH-VI ) is 3 µg/m 3 for an acceptable lifetime cancer risk of 1x10⁻⁵ and unit risk of mg/m 3 (Health Canada, 2005). Published background concentrations of benzene in indoor air are at similar levels to the unit risk factor. For example, the reported median indoor benzene concentration was 5.4 µg/m 3 for a large indoor air quality study (757 homes) conducted by Health Canada (Otson and Davis, 1993). It is recommended that the target risk-based indoor air concentration, if lower, be replaced with the background air concentration (e.g., median value from literature) since it is not considered practical to regulate to levels below background. An initial survey of Reference Concentrations (R f C) and Unit Risk (UR) factors for volatile chemicals suggest that there are only a few chemicals where the acceptable risk-based air concentrations (based on HQ=1; cancer risk = 1x10⁻⁵ ) are on the same order as typical background concentrations. Acceptable Risk Levels - The identification of acceptable risk levels is a policy decision; the discussion below is intended to provide background information on the approach taken by regulatory jurisdictions. The USEPA Soil Screening Guidance (USEPA, 1996) acceptable risk levels are a lifetime cancer risk of 1x10⁻⁶ for carcinogens and a hazard quotient of 1 for noncarcinogens. For carcinogens, USEPA believes that setting a 1x10⁻⁶ risk level for individual chemicals and pathways generally will lead to cumulative risks within the 1x10⁻⁴ to 1x10⁻⁶ range for the combinations of chemicals generally found at Superfund sites. For non-carcinogens, it was considered difficult to address additive effects since HQs should only be added for those chemicals with the same toxic endpoint and/or mechanism of action. USEPA also considered possible apportionment to adjust the HQ as a percentage of a regulatory health-based level that is allocated to the source and pathway being regulated to account for non site related exposures to other media. Apportionment was not applied since USEPA has traditionally focused on quantifying exposures to a receptor that are clearly site-related and has not included exposures from other sources The HC guidance assumes a hazard quotient of 0.2 and acceptable lifetime cancer risk of 1x10⁻⁵. Although not explicitly addressed, the rationale for a HQ of 0.2 is understood to be based on a similar concept to the soil allocation factor used for direct contact pathways where the HQ is adjusted to reflect apportionment for other potential background exposure sources.
93 July For the vapour inhalation pathway, there can be significant indoor sources of volatile chemicals from various sources including consumer products, building materials and emission sources. For some chemicals, there can also be relatively significant outdoor ambient sources. It is expected that other sources of volatiles (e.g., soil, groundwater, consumer products) would be small in comparison to indoor and outdoor sources. A reasonable apportionment factor may be 0.5 for non-carcinogens. Check Based on Maximum Theoretical Vapour Concentration: As indicated in Exhibit 4.1, the derivation procedure for groundwater includes a check to determine whether the back-calculated soil vapour concentration based on the groundwater alpha and target indoor air concentration (PAQS HH-VI ) exceeds the maximum theoretical vapour concentration. If this is the case, it is not possible to calculate a standard. The maximum theoretical vapour concentration is that predicted for either groundwater-to-vapour partitioning based on Henry s Law constant using the effective solubility, or NAPL-tovapour estimated from Raoult s Law using the effective vapour pressure. Except for petroleum fractions (i.e., CCME F1, F2), the effective solubility is equal to the purephase solubility and effective vapour pressure is equal to the pure-phase vapour pressure (i.e., mole fraction equal to one). Recommendations Assuming an exposure term of 1.0 for non-threshold contaminants (i.e., CCME approach), regardless of the land use, is considered an overly conservative assumption. Instead the exposure terms proposed by Health Canada (with slight modification) is recommended. The following exposure terms are proposed and would apply to both threshold and non-threshold compounds: Residential = ET 1 X ET 2 = 7 days/7days x 52 weeks/52weeks x 24 hrs/24hrs = 1.0 Commercial = ET 1 X ET 2 = 5 days/7days x 48 weeks/52weeks x 10 hrs/24hrs = 0.27 Further evaluation of exposure amortization may be warranted upon completion of the Health Canada study. It is recommended that the target risk-based indoor air concentration, if lower, be replaced with the median background air concentration based on a survey of literature values.
94 July Example Soil Vapour Intrusion Standards Example standards are calculated for selected chemicals for the soil vapour intrusion pathway (Table 4.4). For VPH and LEPH, the example standards are calculated using the protocol adopted from Golder (1995), while for the F1 and F2, the methodology outlined in the CCME CWS-PHC (CCME, 2000) are used. The toxicity reference values were obtained from CCME (2000). The surrogate chemicals and toxicity reference values are provided in Table 4.5. There are several issues associated with criteria development for petroleum hydrocarbon compounds; evaluation of these issues goes beyond the scope of this document. It is noted that the State of Washington and USEPA Region 9 are developing soil vapour intrusion guidance for total petroleum hydrocarbon (TPH) fractions.
95 July Date Printed: June 17, 2005 Table Example Standards for Vapour Intrusion Pathway Media Alpha Naphthalene Benzene TCE Xylenes n-hexane VPH LEPH F1 F2 Toxicity Reference Factors UR (mg/m 3 ) E E TC (mg/m 3 ) 4.9E E E-01 * * * * Residential Exposure Term PAQS HH-VI (mg/m 3 ) 4.9E E E E E-01 * * * * Groundwater (ug/l) 8.80E Soil Vapour (mg/m 3 ) 1.80E Commercial Exposure Term PAQS HH-VI (mg/m 3 ) 1.81E E E E E-01 * * * * Groundwater (ug/l) 1.60E-04 No Criteria No Criteria No Criteria Soil Vapour (mg/m 3 ) 2.50E CSR AW Fresh Std (ug/l) NS NS N/A N/A CSR AW Marine Std (ug/l) NS NS N/A N/A CSR Gdw DW Std (ug/l) NS NS NS NS N/A N/A Note: 1. For benzene, the example standard for residential scenario is calculated by replacing the risk-based air concentration with the background concentration (5 ug/m 3 ) 2. UR = unit risk factor, TC = tolerable concentration (RfC), NS = no standard, N/A = not applicable, * = see Table 4.5
96 July For groundwater-to-indoor air, the example standards are compared to the Contaminated Sites Regulation aquatic life (AW) and drinking water standards (DW). For benzene, VPH and LEPH, the example vapour standards for the residential scenario are significantly less than the CSR AW standards. The example TCE vapour standard is slightly (about 2 times) less than the CSR AW standard. For the chemicals selected, the CSR DW standards were less than the example residential vapour standards. The example groundwater standards for vapour inhalation do not include adjustment for potential mass flux limitations, which can be important, as further discussed below.
97 July Table Physical-Chemical Properties and Toxicity Reference Values Fraction Avg Tolerable Molecular Vapour Henry's Law Henry's Law Solubility Log (Koc) Mass Molecular Mole Parameter Surrogates Concentration Weight Pressure Constant Constant Fraction Weight Fraction (mg/m3) (g/mole) (atm) (atm-m3/mole) (dimensionless) (mg/l) (cm3/g) (-) (g/mole) (-) MWLAP VPH n-hexane E E E E N/A 0.6 Toluene E E E E N/A 0.4 MWLAP LEPH Naphthalene E E E E N/A 0.2 Decane E E E E N/A 0.8 CCME F1 C7-C8 Aromatic E E E E C8-10 Aromatic E E E E C6-8 Aliphatic E E E E C8-10 Aliphatic E E E E CCME F2 C10-12 Aromatic E E E E C12-16 Aromatic E E E E C10-12 Aliphatic E E E E C12-16 Aliphatic E E E E Note: Temperature-corrected to 12 degrees Celcius (Method 1, Golder 2004), source of physical-properties for F1 and F2 fractions are CCME CWS-PHC.

98 July Contaminant Mass Flux Check When contamination is limited to dissolved chemicals migrating in groundwater, the only source of vapours are chemicals that volatilize from groundwater. The available mass that could potentially volatilize under steady state conditions is controlled by the mass flux in groundwater flowing below the building. The development of the proposed alpha factors in Section did not take into consideration possible mass flux considerations and instead assumed that the available mass in groundwater matches or exceeds the volatilization rate represented by the attenuation factor, regardless of the attenuation factor volatilization rate. Mass flux limitations are particularly important for chemicals with high Henry s Law constants (e.g., aliphatic hydrocarbon compounds). The HC guidance includes a simple mass flux check to ensure that the predicted indoor air concentration, for the selected attenuation factor, is not unrealistic based on the available mass flux. The mass flux check is applicable when there is only a dissolved contamination source and requires an estimate of the Darcy velocity (specific discharge). The mass flux check is based on an analytical model that couples groundwater transport and unsaturated zone transport (Figure 4.4). The model assumptions are somewhat arbitrary, but considered reasonably conservative in that they are unlikely to over predict the influence of mass flux limitations. The mass flux check assumes that all dissolved chemicals within the top 1 m of groundwater flowing below the entire width of the building will volatilize and enter the building (i.e., leaving no chemicals in groundwater down-gradient of the building). In reality, dissolved plumes only loose a small portion of their mass through volatilization. In addition, it is assumed that the groundwater chemicals are not attenuated through biodegradation. For the HC guidance, if the predicted mass flux through volatilization is greater than the available mass flux in groundwater, then the predicted indoor air concentration is reduced (i.e., scaled) based on the available mass flux. FIGURE 4.4: Conceptual Model for Groundwater Mass Flux Adjustment
99 July For generic standards development, application of a mass flux check requires that a Darcy velocity be assumed. Although velocities will vary depending on site conditions, for initial evaluation of the potential significance of mass flux limitations, a Darcy velocity of 500 m/year is assumed. This velocity is unlikely to be exceeded at most contaminated sites is British Columbia. For this Darcy velocity, the mass flux adjustment is applicable to LEPH, F1 and F2. The adjusted groundwater concentrations (unadjusted values in parentheses) are as follows: LEPH: 840 ug/l (50 ug/l) F1: 51 ug/l (38 ug/l) F2: 50 ug/l (22 ug/l) Recommendation A mass flux adjustment should be considered if groundwater standards are included for petroleum hydrocarbon compounds. Alternately, if groundwater standards were not to be included for petroleum hydrocarbons (as suggested in Section 4.2.2), mass flux limitations and overly conservative (low) groundwater standards would not be an issue. 4.6 Summary of Recommendations The recommendations provided in the above sections are summarized below: 1. If soil vapour intrusion standards are included in the BC regulatory framework, it is considered essential that a readily implementable screening risk assessment protocol be in place to facilitate less conservative, site-specific standards to be derived for sites, and that protocols be in place for technically defensible methods for soil vapour characterization. 2. For purpose of standard development, applicable media should be limited to groundwater and soil vapour, and should not include soil. However, the contaminated sites regulatory framework should incorporate a process by which sitespecific remediation targets may be developed for soil to guide site remediation, where groundwater and/or soil vapour concentrations exceed relevant standards. Such site-specific remediation targets can be computed using partitioning relationships presented in SRA-2.
100 July Groundwater standards are only applicable when contamination is limited to a dissolved plume in groundwater. If there is LNAPL at the water table or soil contamination above the water table, only vapour standards would apply. The implication is vapour characterization would be mandatory within and near to LNAPL zones. 4. Since petroleum hydrocarbon dissolved plumes are typically relatively short and since it is often difficult to distinguish between dissolved and residual NAPL zones, it is debatable whether groundwater standards would be of practical use at many petroleum hydrocarbon sites. Consideration could be given to only developing soil vapour standards for petroleum hydrocarbon compounds. 5. The regulation accompanying the vapour standards should include the preliminary screening step to identify whether vapour standards apply based on the 30 m rule. This, in concept, would be similar to the procedure followed to determine whether the aquatic life standards apply for groundwater flow to surface water. 6. The regulation accompanying the vapour standards should include a preliminary screening step to evaluate whether there are indications of significant health or safety risk (contamination in sumps or basements, chemical odours indicative of a subsurface vapour source) where immediate follow-up action including possible risk mitigation is required. 7. The protocol should recognize that the attenuation factors used for SRA and proposed for derivation of generic vapour standards may not be protective of all site conditions. The regulation accompanying the vapour standards should identify the site precluding factors which would require a detailed risk assessment to be conducted. These precluding factors could include sites with the following characteristics: Very high gas permeability media such as vertically or near vertically fractured bedrock, karst, cobbles or other media with unusually high gas permeability; Utility conduits that intersects a vapour contamination source is directly connected to the building, and; Buildings with earthen basements. 8. A protocol for identifying chemicals of potential concern for vapour intrusion is required. It is recommended that this screening be based on the maximum predicted equilibrium vapour concentration and a conservative alpha factor of 0.02.
101 July Since soil vapour measurements provide for a more direct indication of potential vapour intrusion risk, it is recommended that soil vapour standards take precedence over groundwater standards, when measurements for both media are available. 10. At this time, it is recommended that no biodegradation adjustment be incorporated in the calculation procedure for soil standard development purposes. Further research into hydrocarbon vapour biodegradation below buildings is recommended. If warranted, the protocol should be revised to incorporate biodegradation for applicable chemicals. 11. It is recommended that chemical-specific properties be used to calculate a chemicalspecific alpha value used to derive groundwater and soil vapour standards. 12. Assuming an exposure term of 1.0 for non-threshold contaminants (i.e., CCME approach), regardless of the land use, is considered an overly conservative assumption. Instead the exposure terms proposed by Health Canada (with slight modification) is recommended. The following exposure terms are proposed and would apply to both threshold and non-threshold compounds: Residential = ET 1 X ET 2 = 7 days/7days x 52 weeks/52weeks x 24 hrs/24hrs = 1.0 Commercial = ET 1 X ET 2 = 5 days/7days x 48 weeks/52weeks x 10 hrs/24hrs = Further evaluation of exposure amortization may be warranted upon completion of the Health Canada study. 14. As part of the standard derivation process, it is recommended that the target riskbased indoor air concentration, if lower, be replaced with the median background air concentration based on a survey of literature values. 15. A mass flux adjustment should be considered if groundwater standards are included for petroleum hydrocarbon compounds. Alternately, if groundwater standards were not to be included for petroleum hydrocarbons (as suggested in Section 4.2.2), mass flux limitations and overly conservative groundwater standards would not be an issue.
102 July HUMAN HEALTH PROTECTION: GROUNDWATER USED FOR DRINKING WATER The existing CSST protocol derives a soil standard protective of groundwater used for drinking water Groundwater Model The groundwater models are independent of the drinking water guideline used to backcalculate the soil standard. The proposed changes in the groundwater models described in Section 2.0 are equally applicable to this pathway Drinking Water Guideline Values When available, the existing CSST protocol recommended using Health Canada drinking water quality guidelines as published in Guidelines for Canadian Drinking Water Quality (Health Canada 1993; revised 1996) 8. In the absence of a Health Canada guideline, the Ministry approved drinking water criteria (BCMWLAP 1998) was selected. The CSR Schedule 6 water quality standards are compared to Canadian Federal water quality guidelines in Table The following web site should be checked for recent updates to the Health Canada drinking water quality guidelines
103 July Date Printed: June 17, 2005 Table 5.1 Comparison CSR Schedule 6 and Canadian Federal Water Quality Guidelines Chemical CSR Schedule 6 (June 13, 2005) Water: Aquatic Life Irrigation Lifestock Freshwater Marine (µg/l) (µg/l) (µg/l) (µg/l) Drinking Water (µg/l) Canadian Environmental Quality Guidelines Water: Aquatic Life Water: Agriculture Freshwater (µg/l) Marine (µg/l) Irrigation (µg/l) Livestock (µg/l) Canadian Drinking Water Quality MAC AO (µg/l) (µg/l) Arsenic (5) 8 - Benzene NS NS Benzo(a)pyrene NS NS Cadmium 0.1 to Chromium 50 - Trivalent Chromium (Cr(III)) Hexavalent Chromium (Cr(VI)) Copper , Ethylbenzene NS NS Lead , Pentachlorophenol NS Polychlorinated Biphenyls (PCB) NS NS NS NS NS No EQG 2 No EQG PCDD and PCDF NS NS NS NS NS No EQG 2 No EQG Tetrachloroethylene (Perc) NS NS Toluene NS NS trichloroethylene (TCE) NS (5) 8 - Total Xylene NS NS NS NS Zinc No fact sheet created. For more information on this guideline, please refer to Canadian Water Quality Guidelines (CCREM 1987), available electronically on the accompanying CEQG CD. 2 No EQG: No environmental quality guideline is recommended; see environmental quality guidelines for other media where appropriate. 3 The guideline is considered protective of human health against exposure to other microcystins (total microcystins) that may alsobe present. 4 Copper Freshwater Guideline = 2µg/L at [CaCO 3 ] = 0-120mg/L = 3µg/L at [CaCO3] = mg/L = 4µg/L at [CaCO3] > 180mg/L 5 Lead Freshwater Guideline = 1µg/L at [CaCO 3 ] = 0-60mg/L = 2µg/L at [CaCO3] = mg/L = 4µg/L at [CaCO3] = mg/L = 7µg/L at [CaCO3] > 180mg/L 6 Copper Irrigation Guideline = 200µg/L for cereals, 1000µg/L for tolerant crops 7 Copper Irrigation Guideline = 500µg/L for sheep, 1000µg/L for cattle, 5000µg/L for swine and poultry 8 Proposed Guidelines in brackets
104 July Recommendations A review of the drinking water guidelines used to back calculate the soil standard should be conducted and if guidelines have changed or been revised, the standard should be updated.
105 July HUMAN HEALTH PROTECTION: INTAKE OF CONTAMINATED SOIL The review of the methods used for calculating soil standards for intake of contaminated soil (i.e., soil intake standard) is not intended to provide an exhaustive analysis of derivation methodologies from all jurisdictions; rather, the review focused on differences between the existing CSST protocol and CCME (2005). The CCME protocol was recently revised based on advances in the science and, where applicable, harmonization with recent Health Canada updates. Comparison to other jurisdictions, such as the USEPA, was incorporated in our review if an issue required further clarification. Typically the derivation of soil quality standards via soil intake or direct exposure considers the following three exposure pathways: soil ingestion, dermal contact and dust inhalation. It is anticipated that for most contaminants, soil ingestion will be the dominant exposure pathway (USEPA 2002a; Health Canada 2004a). Particulate inhalation is not expected to contribute significantly to exposure for most substances; however inhalation may become more important for non-volatile substances with high inhalation toxicity (e.g., cadmium; CCME 2005). 6.1 Review of Selected Derivation Protocols BCE 1996 The existing CSST protocol (BCE 1996) has been summarized below. Basis of Intake of Contaminated Soil Standard - Although consideration of all three exposure pathways was allowed for in the existing CSST protocol (Exhibit 9A CSST protocol), only the direct soil ingestion route was used to derive the existing matrix standards (Exhibit 9B existing CSST protocol). The CSST indicated that there was insufficient data to derive standards based on the dermal contact and dust inhalation pathways. A standard developed using this approach was referred to as a preliminary human health soil quality standard (PSQS HH ). Absorption Factor - The relative absorption factor for soil ingestion was assumed to equal 100% unless verifiable scientific evidence indicated otherwise. The existing matrix standards were derived based on a relative absorption factor equal to 100% for all substances. Soil Allocation Factor (SAF) - For the purpose of deriving soil intake standards, exposure to contaminated soil was apportioned to 20% of the TDI. The soil allocation factor (SAF) of 20% allows for 80% of remaining TDI to be reserved for other media.
106 July Background Adjustment Toxicologically derived soil standards for non-anthropogenic pollutants were compared to background soil concentrations for the Lower Mainland. Standards were capped at contaminant concentrations equivalent to the 90 th percentile of the Lower Mainland background soil concentrations. Estimated Daily Intake - Incorporation of the estimated daily intake (EDI) of a chemical due to normal background exposure (i.e., not including exposure from a contaminated site) was recognized by the CSST but the estimation of generic EDIs was considered both difficult and of questionable relevance for any specific site. For this reason, an EDI was not used in the soil standard derivation process. However, a methodology for incorporating background EDIs was provided in the protocol, which could be used when relevant information was available (see next bullet). Preliminary EDI Based Soil Standard (PSQS HH(EDI) ) - If published Health Canada data for both background EDI and national generic background soil concentrations are available, then these data can be incorporated into the equation used to derive preliminary human health EDI-based intake of contaminated soil standard (PSQS HH(EDI) ; Exhibit 10 in CSST protocol). No published Health Canada EDIs or background soil concentrations were available for matrix substances, at the time the soil standards were developed. The CSST protocol indicates that when a PSQS HH(EDI) can be calculated, it should be compared to the PSQS HH value calculated using CSST s preferred simplified formula (Exhibit 9B CSST protocol), and the more reasonable of the two preliminary values selected as the standard CCME (2005) The CCME (2005) protocol is similar to the BCE (1996) protocol. Subtle differences between the two protocols are highlighted below. Basis of Soil Intake Guideline The CCME soil intake guideline considers exposure from soil ingestion, dermal contact and dust inhalation. However, similar to BCE (1996), it appears that the majority of the existing CCME (1996) soil intake guidelines, were based on the ingestion pathway only. The only exception was volatile organic substances where ingestion was deemed to be an inappropriate exposure route as contaminants typically do not remain in surficial soil since they will volatilize over relatively short time frames. The recently revised CCME (2005) protocol allows for separate evaluation of each exposure pathway (i.e., soil ingestion, dermal contact, dust inhalation) in cases where the mechanism of toxicity may be different for the different exposure routes, and separate TDIs are available. This approach is reasonable since in many cases there are separate oral and inhalation TDIs and some chemicals are treated as a threshold chemical for some exposure routes and a non-threshold chemical for others. The lowest calculated value for any
107 July of the separate exposure pathways is then selected as the preliminary soil quality guideline (PSQG HH ). This applies to both threshold and non-threshold chemicals. The CCME also considers exposure from two indirect exposure pathways, referred to as check mechanisms, which can result in the lowering of the PSQG HH. Check mechanisms are described in more detail later in this section. Estimated Daily Intake - The estimated daily intake (EDI) of a chemical due to normal background exposure (i.e., not including exposure from a contaminated site) is included in the derivation process. CCME (2005) indicates that risk posed by a contaminated site must be determined in addition to this background exposure. Therefore, for the purpose of back-calculating a soil standard, CCME (2005) calculated a residual tolerable daily intake (RTDI) which is the difference between the tolerable daily intake (TDI) and the EDI. Soil Allocation Factor - A default value of 20% of the RTDI was apportioned to exposure to contaminated soil. However, if defensible contaminant-specific evidence exists demonstrating that the contaminant does not occur in a given medium, the SAF may be increased from 20% to a value given by: SAF = 100% / (number of applicable exposure media) Absorption Factors When there is sufficient information to evaluate the absorption into the body from both the environmental exposure route being evaluated and the study exposure route, a relative absorption factor other than 1 can be used. Background Adjustment - If the EDI is greater than the TDI, the CCME indicates that the provisional soil quality guideline should be set at the background soil concentration or analytical detection limit for that contaminant. Check mechanisms The CCME (2005) considers exposure from two indirect exposure pathways that are referred to as check mechanisms. The two check mechanisms are consumption of produce, meat and milk and off-site migration of soil contaminants via wind and water erosion. Exposure from ingestion of food grown on contaminated soils applies to agricultural and residential sites and is treated as a required exposure pathway or primary exposure pathway for substances that biomagnify. The off-site migration via wind and water erosion to more sensitive neighboring properties only applies to commercial or industrial sites and applies to all non-volatile contaminants. Due to the imprecise nature of the models used to evaluate these mechanisms, the above check mechanisms are considered by CCME to be Management Adjustment Factors and may or may not be used to adjust a generic guideline value, based on professional judgment. The check mechanism can result in the lowering of the final soil quality guideline via the Management Adjustment Factor.
108 July Discussion of Differences Basis of Soil Intake Guideline In theory, the existing CSST protocol for deriving the intake of contaminated soil standard took into account exposure from soil ingestion, dust inhalation and dermal contact by summing together exposure from each of these pathways. However, in practice, only the soil ingestion pathway was used to derive standards, as CSST was of the opinion that there was a lack of sufficient scientific data available to estimate exposures for the dermal contact and dust inhalation pathways. It is anticipated that for most contaminants, soil ingestion will be the dominant exposure pathway. However, for certain contaminants, other exposure pathways might be significant contributors to exposure (e.g., cadmium via dust inhalation). In these circumstances, it would be prudent to include these pathways in the derivation process. If the mechanism of toxicity is the same for each exposure route and the same TRV is applied to all three exposure pathways, the equation for deriving the soil intake standard would be the same as was used in the existing CSST protocol. However, this is typically not the case. If the mechanism of toxicity is different for the different exposure routes and separate TRVs are available, exposure pathways can be evaluated separately. This is the approach that CCME (2005) recommends, with the lowest calculated value for any of the separate pathways selected as the soil standard. The equations for calculating the pathway specific soil intake standard for soil ingestion, dermal contact and dust inhalation are shown in Exhibit 6-1 for threshold substances and Exhibit 6-2 for non-thresholds substances. Similar to the existing CSR Schedule 5 matrix soil standards, the soil standards calculated for each pathway would be shown in the Schedule 5 matrix template. Furthermore, as is the case today, we recommend that it be mandatory to calculate the soil ingestion standard for all Schedule 5 substances. When there is sufficient information to justify input parameters to calculate dermal contact and dust inhalation standards, these standards would also be calculated and shown in Schedule 5. In the United States, different methods are used in different regions for developing soil intake guidelines. For example, US EPA Region III (US EPA Region III 2004) calculates risk based concentrations (RBCs) in soil for the soil ingestion pathway but not for the dust inhalation and dermal contact pathways. Region III guidance indicates that RBCs should only be applied when dermal contact and dust inhalation are not expected to be significant, otherwise a site specific risk assessment should be conducted. US EPA Region IX (US EPA Region IX 2004) calculates preliminary remediation goals (PRGs) in soil that include soil ingestion, dermal contact and dust inhalation pathways when sufficient information is available.
109 July Recommendations If the mechanism of toxicity is different for the different exposure routes and separate TRVs are available as well as suitable absorption factors, exposure pathways can be evaluated separately. If the above information is not available or defensible for a specific pathway, a soil standard should not be calculated. The pathway specific soil standards calculated for soil ingestion, dermal contact and dust inhalation would all be shown in the Schedule 5 matrix template. Furthermore, as is the case today, we recommend that it be mandatory to calculate the soil ingestion standard for all Schedule 5 substances. When there is sufficient information to justify input parameters to calculate dermal contact and dust inhalation standards, these standards would also be calculated and shown in Schedule 5. Soil/Dust Inhalation It is anticipated that this exposure pathway will generally be insignificant relative to direct ingestion of soil and dermal absorption (Health Canada 2004a). US EPA (2002a) indicates that for semi-volatiles and metals, soil standards derived for the soil ingestion and dermal contact pathways are more conservative than the dust pathway. However, there are exceptions to the rule; for example, US EPA (2002a) reported that the carcinogenicity of hexavalent chromium via the inhalation route results in a soil screening level that is more stringent than the ingestion/dermal contact pathway. As a result, they recommend evaluating the fugitive dust pathway routinely for chromium. Health Canada (2004a) recommends using an average airborne concentration of respirable particulate matter of 0.76 µg/m 3 (based on US EPA 1992) in the dust inhalation calculation. This is based on wind generated dust only. Where significant vehicle traffic is expected on unpaved surfaces, Health Canada (2004a) recommends using a value of 250 µg/m 3 for vehicle generated dust. In generating PRGs for the dust inhalation pathway, the US EPA Region IX use a generic particle emission factor (PEF; m 3 /kg) that corresponds to a receptor point concentration of approximately 0.76 µg/m 3. Exposures to dust could be calculated for selected constituents if potential risk from exposure from this pathway is significant. Both the CCME (2005) and the existing CSST protocol considered the dust inhalation pathway when developing soil standards/guidelines but have not identified default soil inhalation rates (DR; kg/day) or methods to calculate these rates. Based on guidance provided by Health Canada (2004a), the soil inhalation rate can be calculated as follows:
110 July DR = PA x IR x ET 2 DR = soil inhalation rate (kg/d) PA = particulate concentration in air (kg/m 3 ) IR = air inhalation rate (m 3 /d) ET 2 = hours per day/24 (unitless) Exhibit 6-1 and 6-2 show the equation for the derivation of the soil standard for the dust inhalation pathway using the PA and IR. The existing CSST protocol indicated that the default parameters used to estimate exposure for the dust inhalation pathway lacked sufficient scientific validation. Although Health Canada (2004a) recommends evaluating the dust inhalation pathway, there is inherent uncertainty that arises from calculating exposure from dust inhalation, as site specific factors play a large role in influencing dust generation (i.e., particle size, vegetation cover, wind, rain, etc). Exhibit Equations for Threshold Substances Soil ingestion only: PSQS HH SI = SAF TRV BW ( AFG SIR) ET1 Dermal contact only: PSQS HH DC = [ SAF TRV ] ( AFS SR) ET1 Particulate Inhalation only: PSQS HH PI = BW [ SAF TRV ] BW ( AFL PA IR) ET 1 ET2 where, PSQS HH = Preliminary human health TDI-based soil standard (mg/kg) SIR = soil ingestion rate (kg/day) AFL = absorption factor for lung (unitless) PA = particulate concentration in air (kg/m 3 ) IR = air inhalation rate (m 3 /d) AF S = absorption factor for skin (unitless) SR = soil dermal contact rate (kg/day) see below ET 1 = exposure term 1 (unitless) days per week/7 x weeks per yr/52 ET 2 = exposure term 2 (unitless) hours per day/24
111 July Soil Dermal Contact Rate (SR): SR = (SA H x DL H ) + (SA O x DL O ) x EF SA H = exposed surface area of hands (m 2 ) SA O = area of exposed body surfaces other than hands (m 2 ) DL H = dermal loading of soil to hands (kg/m 2 ) DL O = dermal loading of soil to other surfaces (kg/m 2 ) EF = exposure frequency (events/d) The PSQS HH is then the lowest calculated value for any of the separate pathways. Exhibit Equations for Non-Threshold Substances Soil ingestion only: PSQS HH SI = RSD BW ( AFG SIR) ET1 Dermal contact only: PSQS HH DC = RSD BW ( AFS SR) ET1 Particulate Inhalation only: PSQS where, HH PI = RSD BW ( AFL PA IR) ET 1 ET2 PSQS HH = Preliminary human health RSD-based soil standard (mg/kg) RSD = risk specific dose (mg/kg day) BW = body weight (kg) AF G = relative absorption factor for gut (unitless) SIR = soil ingestion rate (kg/day) AF L = relative absorption factor for lung (unitless) PA = particulate concentration in air (kg/m 3 ) IR = air inhalation rate (m 3 /d) AF S = relative absorption factor for skin (unitless) SR = soil dermal contact rate (kg/day) see below ET 1 = exposure term 1 (unitless) days per week/7 x weeks per yr/52 ET 2 = exposure term 2 (unitless) hours per day/24
112 July Soil Dermal Contact Rate (SR): SR = (SA H x DL H ) + (SA O x DL O ) x EF SA H = exposed surface area of hands (m 2 ) SA O = area of exposed body surfaces other than hands (m 2 ) DL = dermal loading of soil to hands (kg/m 2 ) DL O = dermal loading of soil to other surfaces (kg/m 2 ) EF = exposure frequency (events/d) The PSQS HH is then the lowest calculated value for any of the separate pathways. Relative Contribution of Each Pathway To evaluate the relative contribution of the soil ingestion, dermal contact and dust inhalation pathways to the final PSQS HH, sample calculations were performed for cadmium and hexavalent chromium (Table 6.1). Cadmium was selected as it is known to be sensitive via the inhalation pathway (i.e., treated as a carcinogen) and there is recent scientific information to support using a dermal absorption factor of (US EPA 2004a). Hexavalent chromium was selected since it also is sensitive via the inhalation pathway. For chromium, the OME (1996) dermal adsorption factor of 0.09 was used. Calculations were conducted for the commercial land use scenario using the new receptor assumptions, exposure periods, and using Health Canada TRVs. The existing CSR commercial land use matrix soil standard (which is based only on the soil ingestion pathway) was shown for comparison purposes. Substance Classification TABLE 6.1: Pathway Specific Soil Standards for Cadmium and Chromium for the Commercial Land Use Scenario (mg/kg) Soil Ingestion Dermal Contact Dust Inhalation Cadmium Carcinogenic - - 4,160 Existing CSR CL Matrix Standard Non-carcinogenic 50 58, Chromium (VI) Carcinogenic 539 Non-carcinogenic Notes: 1. For the dust inhalation pathway, the adult was the sensitive receptor and for the soil ingestion and dermal contact pathways, the sensitive receptors was a toddler. Receptor assumptions are based on the revised Health Canada values shown in Table Exposure terms used were: ET 1 = 0.66 and ET 2 = For cadmium, the Health Canada TDI of mg/kg and inhalation slope factor of 42.9 (mg/kg-d) -1 were used in calculations. For chromium, the Health Canada TDI of mg/kg and inhalation slope factor of 331 (mg/kg-d) -1.
113 July The results indicate that even though cadmium and chromium (VI) are considered non-threshold contaminants for humans via the inhalation pathway (Health Canada 2004b), they do not drive the risk for the soil intake pathway. Instead the soil ingestion pathway is the driver by one to three orders-of-magnitude. Using the dermal absorption factor recommended by the US EPA (2004) for cadmium resulted in a 1,000 fold higher standard for the dermal pathway compared to that for the ingestion pathway. This exercise highlights the effect of removing the hours per day exposure term for the soil ingestion pathway and to a lesser degree for the dermal contact pathway (refer to Section for a detailed explanation). The exposure term used in the existing CSST protocol was 0.33 (i.e., based on 12hr/24hr x 5d/7d x 48wk/52wk x 70yr/70yr). When the hours per day exposure is removed the exposure term becomes 0.66 and results in a two times more conservative or lower soil standard. This would have an impact on the final soil intake standard for the commercial land use scenario and threshold contaminants only (i.e., the residential and agricultural land use scenario have an exposure term of 1.0). The commercial standard for threshold contaminants is based on a toddler receptor, which is a conservative assumption, as discussed in Section 3.0. If the child is adopted as the sensitive receptor for the commercial land use scenario, then the soil ingestion standard would increase by a factor of eight from that shown above in Table 6.1. Recommendations For most contaminants, soil ingestion is the dominant exposure pathway. The above calculations for cadmium and chromium suggest that dermal contact and dust inhalation would not be significant contributors to potential risk, based on the assumptions made respecting exposure concentrations and absorption factors. There is uncertainty in exposure concentrations, absorption factors, TRVs and, in some cases, different mechanisms of toxicity for different exposure routes, which complicate the derivation of soil standards for dermal contact and dust inhalation pathways. The minimum information that would typically be required to consider deriving a dust inhalation soil standard would be an inhalation TRV, especially when the mechanism of toxicity is different than the oral pathway. For the dermal pathway, in cases where only an oral TRV is available and a suitable relative absorption factor is not available for the dermal pathway, a soil standard should not be calculated for this pathway. Using the default relative absorption factor of 1 with an oral TRV would result in overly conservative dermal contact soil standards with high uncertainty. While it appears that ingestion will be the dominant risk driver, including dermal contact and dust inhalation standards, when appropriate, will add to completeness and transparency of the derivation process. The pathway specific soil standards calculated for
114 July soil ingestion, dermal contact and dust inhalation would all be shown in the Schedule 5 matrix template. Furthermore, as is the case today, we recommend that it be mandatory to calculate the soil ingestion standard for all Schedule 5 substances. When there is sufficient information to justify input parameters to calculate dermal contact and dust inhalation standards, these standards would also be calculated and shown in Schedule Absorption Factors The health risk posed by soil ingestion, dust inhalation or dermal contact depends on the absorbed dose of a contaminant. When the critical toxicological study has used a different medium than that under investigation, sometimes an absorption factor is applied to account for the difference in absorption of the contaminant by the body in the two different media, when this information is available. For the purpose of guideline development, it is usually assumed that the absorption factor will be 1 for the ingestion and inhalation pathways as most toxicity studies are based on ingested or inhaled doses of contaminants (i.e., assumes that absorption efficiency in the environmental exposure is equal to that of the toxicological study). However, if there is sufficient information to evaluate the relative absorption efficiencies between the media involved this should be considered. Absorption factors are more likely to be applied for the dermal contact exposure route, since very few TRVs are based on dermal exposure. In the absence of dermal TRVs, oral TRVs are routinely applied to the dermal pathway. To account for the difference between the environmental exposure media and the toxicological study used to derive the oral TRV, a relative absorption factor should be applied. In cases where only an oral TRV is available and a suitable relative absorption factor is not available for the dermal pathway, a soil standard should not be calculated for this pathway. Using the default relative absorption factor of 1 with an oral TRV would result in overly conservative soil standards with high uncertainty. Health Canada (2004a) has recommended the use of dermal relative absorption factors as outlined by OME (1996). The background supporting documents for the OME relative absorption factors are available from Health Canada (pers. comm. Mark Richardson, Health Canada). The US EPA also provides recommended dermal absorption factors in their recently revised Supplemental Guidance for Dermal Risk Assessment (US EPA 2004a). CCME (2005) currently allow for absorbtion factors other than 1.0 when there is sufficient information to evaluate the absorption into the body from both the environmental exposure route being evaluated and the study exposure route.
115 July Recommendation Unless there is sufficient information to indicate otherwise, it is anticipated that the relative absorption factor will be assumed equal to 1 for ingestion and inhalation pathways. However, we recommend continuing to evaluate scientific defensibility of applying absorption factors other than the default value of 1 for the ingestion and inhalation pathways. Absorption factors other than 1 are more likely to be applied for dermal contact exposure routes; since few TRVs are based on dermal exposure. Assuming that dermal TRVs are not routinely available and that the oral TRV would be adopted for the dermal pathway, a relative absorption factor other than the default value of 1 would be required to consider deriving a soil standard for the dermal pathway. Otherwise an overly conservative soil standard with high uncertainty would be generated for the dermal pathway Soil Allocation Factors Both the existing CSST protocol and CCME (2005) apply a default soil allocation factor (SAF) of 20% for threshold substances. Assigning a default value of 20% for the soil intake pathway allows for 80% of the remaining TDI or RTDI to be reserved for other media (i.e., air, water, food, consumer products). If defensible contaminant-specific evidence exists demonstrating that the contaminant does not occur in a given medium, the CCME (2005) protocol allows for the SAF to be increased from 20% to a value given by: SAF = 100% / (number of applicable exposure media) Increasing the SAF would allow for a greater percentage of the allowable daily exposure for threshold substances to come from the contaminated soil medium versus other media. Further details on the SAF were provided in Section An increase in the SAF would result in a corresponding increase in the soil standard. Recommendations Continue to use the default SAF of 20% but if defensible, allow for the SAF to be increased based on the equation provided by CCME (2005).
116 July Estimated Daily Intake The estimated daily intake (EDI) is an estimate of the typical total background exposure from all known or suspected sources and exposure routes for the average Canadian. The EDI does not include exposure from a contaminated or remediated site. The rationale that CCME (2005) provides for including the EDI is that risk posed by a contaminated site must be determined in addition to this background exposure. Therefore, CCME (2005) soil guidelines are calculated by taking into consideration the background soil exposure as well as the SAF (20%) of the tolerable daily intake (TDI). The adjustment of the TDI to account for background exposure (i.e., EDI) is referred to as the residual tolerable daily intake (RTDI) by CCME (2005). The CSST recognized the potential impact of normal background exposure; however, they also recognized that the estimation of generic EDIs was both difficult and of questionable relevance for any specific site. Furthermore, CSST noted that incorporation of an EDI often resulted in guidelines that typically approximated or on occasion were actually less than the background soil concentrations. Therefore, CSST recommended that the CCME methodology incorporating background EDIs not be followed. The CSST believed that apportioning 20% of the TDI (i.e., application of the SAF) to soil exposures would ensure an adequate level of protection. The original CSST protocol did recommend that if published Health Canada data for both background EDI and national generic background soil concentrations were available, then these could be incorporated into the equation for calculation of a separate standard referred to as the preliminary human health EDI-based intake of contaminated soil standard (PSQS HH(EDI) ). If a PSQS HH(EDI) could be calculated, it would be compared to the PSQS HH value calculated using CSST s preferred simplified formula and the more reasonable of the two preliminary values selected as the standard. However, no published Health Canada EDIs or background soil concentrations were available for matrix standard substances at the time the CSST protocol was developed and therefore, no PSQS HH(EDI) were derived. EDIs are now available for several chemicals from CCME Ecological and Human Health Assessment documents (e.g., Canadian Soil Quality Guidelines for Pentachlorophenol: Environmental and Human Health [CCME 1997]). In addition, Health Canada has developed EDIs for a range of other substances (pers. comm. Mark Richardson, Health Canada). Furthermore, Health Canada indicated that in situations where the EDI is greater than the TDI, a 10% increase in the EDI could be considered for guideline/standard development purposes.
117 July Recommendation No changes are recommended. The existing CSST protocol already recommends derivation of an EDI based soil guideline (i.e., PSQS HH(EDI) ) when information is available. The PSQS HH(EDI) is then compared to the PSQS HH and the more reasonable of the two preliminary values selected as the standard. Now that EDIs have been published for several substances, the PSQS HH(EDI) could be calculated to determine the potential impacts of background exposure Check Mechanisms The CCME (2005) considers exposure from two indirect exposure pathways that are referred to as check mechanisms; i) consumption of produce, meat and milk; and ii) off-site migration of soil contaminants via wind and water erosion. In the check mechanisms, exposure is evaluated through the use of simplified models that utilize conservative generic input values for site-specific characteristics. The CCME (2005) include the consumption of produce, meat and milk as a check mechanism for the agricultural and residential land use scenarios and the off-site migration of soil/dust check mechanism for the commercial or industrial land use scenarios. These two pathways are considered check mechanisms rather than actual soil quality guidelines as CCME (2005) acknowledges the imprecise nature of the models and the uncertainty in the underlying assumptions used for these pathways. CSST did not consider either of these pathways in the existing protocol as they were of the opinion that models or default parameters lacked sufficient scientific validation. Given CSST s original opinion regarding the check mechanisms, our review did not focus on evaluating either of these check mechanisms. Rather our review focused on highlighting any changes to the methods used to calculate the check values. Other than updating some of the assumptions, the calculation of the produce, metal and milk check value has not changed substantially from the original CCME (1996) protocol. The evaluation of the consumption of produce meat and milk pathway is required for agricultural land use if the substance biomagnifies. If it does not biomagnify, this pathway is recommended but not required to be evaluated. For residential land use, the evaluation of this pathway is recommended but not required regardless of the whether the substance biomagnifies. Given the inherent uncertainty involved in deriving values for this pathway due to the number of models and default assumptions, it may be more practical if substances that bioaccumulate or biomagnify be addressed on a site specific basis if they are present on an agricultural or residential site where produce, meat and milk are produced and consumed. ANZECC (NEPM 1999a,b) has developed a similar approach whereby numerical soil criteria are not derived for residential sites where vegetable gardens contribute greater than 10% of vegetable and fruit intake. For these scenarios a site specific assessment is required.
118 July The off-site migration of soil contaminants check mechanism was updated by CCME (2005) to include both environmental and human health soil quality at commercial and industrial sites. Previously, the model was only applied for human health at industrial sites. CCME (2005) indicated that the off-site migration check value calculated for nine metals was 12 times the value of the soil quality guideline for the more sensitive land use. CSST did not adopt this check mechanism in the existing protocol as they indicated that potential off-site pollution of neighboring properties can be better controlled through application of existing BC Environment legislative and regulatory controls. Given that CSST was of the opinion that models or default parameters lacked sufficient scientific validation and considering the inherent uncertainty in these models, as recommended by CSST previously, the two indirect check pathways defined above should not be included in the protocol. It is noted for cadmium, the CSR soil standard for intake of contaminated soil includes separate standards for an agricultural and residential scenario that does and does not include consumption of homegrown produce. If the ministry considers this warranted, the protocol should be revised to include consideration of homegrown produce or the alternative would be to address substances that bioaccumulate/biomagnify on a site specific basis if they are present on an agricultural or residential site where produce, meat and milk are produced and consumed. Recommendations The CSST did not consider either of the two indirect check pathways in the existing protocol as they were of the opinion that models or default parameters lacked sufficient scientific validation. A detailed review of the models and default assumptions used by CCME (2005) was not conducted at this time; however, the following is recommended: Given the inherent uncertainty involved in deriving values for the consumption of produce, meat, and milk, due to the number of models and default assumptions, it may be more practical if substances that bioaccumulate or biomagnify be addressed on a site specific basis if they are present on an agricultural site where produce, meat and milk are produced and consumed or for a residential site where garden produce contributes more than 10% of the produce intake for a residence. However, the ministry s position on this is not clear as they have generated separate soil intake standards for cadmium for agricultural and residential sites that do and do not include consumption of homegrown produce. Considering that the models and general assumptions used to evaluate the off-site migration of contaminated soil are similar to those used in the original CCME (1996) protocol, and given that CSST was of the opinion that that potential off-site pollution of
119 July neighboring properties can be better controlled through application of existing BC Environment legislative and regulatory controls this pathway is not recommended for inclusion in the protocol. 6.3 Summary of Recommended Changes A summary of the recommended changes to the existing CSST protocol have been summarized below in Table 6.2.
120 July TABLE 6.2: Summary of Recommended Changes to Existing CSST Protocol Parameter Rationale Recommended Change Impact Receptor Assumptions Health Canada (2004a) recently updated human receptor characteristics that are representative of the Canadian population. CCME (2005) have adopted the human receptors characteristic recommended by Health Canada. Adopt the values used by CCME and Health Canada. Various. Depends on the age category and the exposure pathway. Exposure Period - Hours per day exposure CCME and Health Canada do not include hours per day exposure for soil ingestion or dermal contact since soil ingestion and dermal contact are not expected to occur at a uniform rate throughout the day. Do not include hours per day exposure for soil ingestion and dermal contact. Exposure term for soil ingestion and dermal contact would increase from 0.33 to 0.66, which would result in a two times more conservative soil standard for the soil ingestion and dermal contact pathways. -Child vs Toddler as Sensitive Receptor for Commercial Scenario (threshold contaminants only) Toddlers are unlikely to be present at commercial sites for appreciable periods of time. For the commercial scenario and threshold contaminants, a more realistic sensitive receptor may be a child receptor. However, it is important that the commercial land use standard is defined to exclude any commercial scenarios where children or toddlers could be present for appreciable periods of time (e.g., daycare at commercial site, community centres, hospitals). Consideration should be given to adopting a less conservative sensitive receptor (child versus toddler) for the commercial land use scenario for threshold contaminants. This change is contingent on an appropriate designation of the commercial land use scenario. As indicated in the above row, removing the hours per day exposure term for the soil ingestion pathway for the commercial scenario would result in a 2 times decrease in the soil standard. If the child receptor is used instead of a toddler, the soil intake standard would increase by a factor of 5 for commercial sites instead of decreasing by a factor of 2. Separation of Equations For most contaminants, soil ingestion is the dominant exposure pathway. However, for certain contaminants, dermal contact and dust inhalation might be significant contributors to exposure. In addition if the mechanism of toxicity is different for the different exposure routes and separate TRVs are available it would be prudent to consider these pathways in the derivation process when there is sufficient information available to support derivation (e.g., relative absorption factors, TRVs). When necessary, derive separate guidelines for each soil intake pathway based on the equations shown in Exhibit 6-1 and 6-2. All three pathway specific soil standards would be shown in the Schedule 5 matrix template. However, at a minimum, the soil ingestion standard should be required to be derived for all Schedule 5 substances. When there is sufficient information to justify input parameters to calculate dermal contact and dust inhalation standards, these standards would also be calculated and shown in Schedule 5. Soil Allocation Factor (SAF) Both the existing CSST protocol and CCME apply a default SAF of 20%. However, the CCME (2005) protocol allows for the SAF to be increased from 20% if defensible contaminant-specific evidence exists demonstrating that the contaminant does not occur in all given medium (e.g., soil, water, air food, consumer products). Increasing the SAF would allow for a greater percentage of the allowable daily exposure to come from the contaminated soil medium versus other media. Continue to use the default SAF of 20% but if defensible, allow for the SAF to be increased as per CCME (2005). An increase in the SAF would result in a corresponding increase in the soil standard. This is only applicable for threshold contaminants. Absorption Factor (AF) Unless there is sufficient information to indicate otherwise, it is anticipated that the AF will be assumed equal to 1.0 for ingestion and inhalation based pathways as most TRVs are based on ingested and inhaled doses. AFs are more likely to be applied for dermal contact exposure routes, since few TRVs are based on dermal exposure. Continue to evaluate scientific defensibility of applying AFs other than the default value of 1.0, especially for the dermal contact pathway. The default value of 1.0 should be applied when there is insufficient scientific information to support otherwise. Applying an exposure factor less than 1.0 is less conservative and would result in higher standards.
121 June ENVIRONMENTAL PROTECTION: TOXICITY TO SOIL INVERTEBRATES AND PLANTS 7.1 Review of Selected Derivation Protocols BCE (1996) BCE (1996) describes the existing CSST derivation method as follows: Consider all appropriate invertebrate and plant toxicity data from CCME Substance Assessment documents 9 ; Separate data into discrete lethal and non-lethal effects distributions; Calculate median effect concentrations for the lethal and non-lethal effects distributions. See below for additional information regarding calculation of median effects concentrations; Fit linear regression lines to the lethal and non-lethal effects distributions. Use the Empirical Exception rule 10 if the R-squared value of the linear regression is < Determine the regression intercepts for EC 50 -NL and/or LC 20, and apply the appropriate level of protection for different land uses (i.e., take the lower of the two values for agricultural, residential and parkland uses; take the greater of the two values for commercial and industrial uses). Specific detailed guidance supporting the derivation method described in BCE (1996) is not available; however, the following clarification and additional information was obtained from a review of the working files (e.g., Excel spreadsheets) used to derive the CSST soil quality standards (BCE, undated): Data compiled from the CCME Substance Assessment reports are assigned to the following standardized point-estimate statistics: acute (LC X ) and sublethal (EC X -NL) x values of 0, 1, 10, 25, 50, 100. For example, a NOEC for a sub-lethal endpoint is considered an EC 0 -NL, while a LOEC for a sub-lethal endpoint is considered an EC 1 -NL. NOECs and LOECs for mortality endpoints are assigned as LC 0 and LC 1, respectively. Other point estimate statistics (e.g., a LC 23 ) are considered equivalent to the nearest standardized point estimate statistic (i.e., the LC 23 is classified as a LC 25 ). 9 The CSST derivation method relies on the literature search conducted by CCME, although data used by CCME may be excluded from consideration by CSST. 10 Empirical exception rule: estimate EC 50 -NL and/or LC 20 via empirical extrapolation from the median effects distribution (BCE, 1996).
122 July A median value for each of the standardized point estimate statistics is calculated (i.e., the average of all available LC 50 data, etc). These median values are then plotted on a graph of contaminant of potential concern (COPC) concentration versus percent effect. In some instances, a standardized endpoint (for which a median value was calculated) may be excluded from the regression. A linear regression equation is then fit to the distribution of the median values. An R 2 value is calculated. The overall EC 50 -NL is defined as the intersection of the regression line of the distribution of the non-lethal median values with the 50% effect level. The LC 20 is defined as the intersection of the regression line of the distribution of the lethal median values with the 20% effect level. These values are rounded as necessary. If the R 2 of the regression is less than 0.25, then the EC 50 -NL or LC 20 values used for setting the soil quality standard are visually estimated based on the distribution of the median effects concentrations. The lower of the LC 20 and EC 50 -NL values is used as the soil standard for agricultural, urban park and residential land uses, while the higher of the two values is used as the soil standard for commercial and industrial land uses CCME (2005) In the case of CCME (2005), an initial literature search is used to obtain relevant toxicological data, followed by one of the following derivation methodologies (presented in order of their preference): Weight of Evidence (EC 25 Distribution) Approach: Assumes a minimum of 10 data points (from three different studies; including minimum of two soil invertebrate and two crop/plant species). EC 20 to EC 30 are acceptable substitutes. Geometric means are calculated for multiple data points for a single species. Data are assembled in a ranking distribution, and the 25 th and 50 th percentiles are calculated (i.e., ESSD 25 and ESSD 50 values). The threshold effect concentration (TEC) is equal to the 25 th percentile of the distribution (ESSD 25 ) divided by a safety factor 11 of between 1 and 5. The Effects Concentration Low (ECL) is equal to the 50 th percentile of the distribution (ESSD 50 ) without a safety factor. 11 Safety factor considerations: available amount of data relative to minimum requirements; greater than 50% of data less than 25 th percentile; short-term toxicity data used; more than 50% of data based on toxicity data from low bioavailability. A safety factor need not always be applied.
123 July Weight-of-Evidence (Effects/No Effect Distribution) Approach: Same as above, but using a combined distribution of LOEC and L(E)C 50 data (i.e., applied in instances where the available literature data do not include EC 25 values). Lowest Observed Effect Concentration Approach: For compounds with fewer than 10 data points (but still from three different studies, including a minimum of one soil invertebrate and one terrestrial plant species), a species sensitivity distribution is not used; only LOEC values are considered. The TEC is the lowest LOEC divided by a safety factor of between 1 and 5. The ECL is the geometric mean of LOEC values without a safety factor. Median Effects Method Approach: Same data requirements as LOEC approach. A species sensitivity distribution is not used; only L(E)C 50 data are considered. TEC = Lowest L(E)C 50 / safety factor of between 5 and 10. No ECL can be calculated for this method, since the resulting level of protection is considered inadequate. The TEC is used as the soil quality guideline for residential/parkland and agricultural land uses, while the ECL is used as the soil quality guideline for commercial and industrial land uses. CCME (2005) derivation methods are the same as presented in CCME (2003), with the exception of the calculation of the ECL based on the effects/no effects distribution. CCME (2003) defined the ECL as the 25 th percentile of the no-effects data only. CCME (2005) defines the ECL as the 50 th percentile of the combined effects and no-effects data distribution USEPA (2003a) In the case of USEPA (2003a), an initial literature search was conducted and data were selected for consideration following a specific review process. This review involved a two-stage process: 1. Literature Exclusion: All papers identified from a literature search were checked against 22 literature exclusion criteria Study Acceptance: Non-excluded literature were further checked against 11 study acceptance criteria Examples of literature exclusion criteria (USEPA, 200a3): study conducted to test biological toxins, drugs, or sewage; study used in vitro (e.g., cell lines, tissue cultures) methods; testing involved a mixture of chemicals, or application of a petroleum product; data developed using QSAR or modeled results; data are not from a primary source; test duration not reported. USEPA (2003a) notes that for a total of 24 contaminants, the literature search identified 7,600 papers, which resulted in 5,200 acceptable papers.
124 July Toxicity data were extracted from the resulting acceptable studies. Data values extracted were: EC 20, MATC (i.e. the geometric mean of NOEC and LOEC), or EC 10 (presented in order of their preference). L(E) 50 data values were not extracted. Extracted data were then scored against the following nine study evaluation criteria: 1. Testing was done under conditions of high bioavailability; 2. Experimental designs were documented and appropriate; 3. Concentration of test substances in soil were reported; 4. Control responses were acceptable; 5. Chronic or life-cycle tests were used; 6. Contaminant dosing procedure was reported and was appropriate; 7. A dose-response relationship was reported or can be established from available data; 8. Statistical tests used and level of significance were described; and, 9. Origin of test organisms was described. Each of the nine study evaluation criteria received between zero and two points. Only studies that received a score of greater than 10 (of a possible 18) points were used in the derivation. The ECO-SSL value was calculated as the geometric mean of the available data at the highest bioavailability score. A minimum of three data values were required. Separate ECO-SSL values were calculated for plants and soil invertebrates. 7.2 Scientific Issue: Compiling and Screening Literature Toxicity Data Potential Influence of Scope of Literature Search We recognize that a policy decision was made to base provincial soil quality standards for the protection of soil invertebrates and plants on existing CCME data compilations. However, this policy decision has implications in terms of the quantity and quality of data used in the derivation process. The existing CSST standards are based only on the 13 Examples of study acceptance criteria (USEPA, 2003a): chemical form and concentration are reported; test medium was a natural or artificial soil; ph reported and within range of 4 8.5; organic content reported and less than 10%; study includes at least one control treatment, at least two addition test treatments were included; study reports ecologically relevant endpoints [reproduction; population, growth or plant physiology endpoints]. USEPA (2003a) notes that only 7% of the 5,200 acceptable papers met all 11 study acceptance criteria.
125 July data originally identified and deemed acceptable by CCME. Our experience in assembling toxicity data from the literature for the purpose of deriving environmental quality guideline values suggests that a considerable expenditure of resources is required to ensure a comprehensive literature search. A comparison of the literature searches conducted to derive Canadian and US soil quality guideline values for lead was conducted to illustrate the potential influence of the scope of the literature search on the number of studies retrieved. The Canadian soil quality guideline for the protection of soil invertebrates and plants was based on a compilation completed in 1997 and updated in 1999 (CCME, 1999a). A total of 16 different studies 14 were included (and an additional 7 studies were consulted but not used in the derivation). Data used to derive the CSST matrix standard for the protection of soil invertebrates and plants (BCE, undated) was limited to three of the 16 studies compiled by CCME (1999a) 15. We were unable to match six data values listed in the CSST working files to values listed in the CCME (1999a) compilation. Conversely, the ECO-SSL value for lead (USEPA, 2003b) retrieved a total of 439 different papers for plants, and an additional 179 papers for soil invertebrates. The literature review process reduced this number substantially: 28 and 13 papers met all study acceptability criteria for plants and soil invertebrates, respectively. This number resulted in 30 and 18 data values (for plants and soil invertebrates, respectively) that had a study acceptability score of greater than 10. Four data values for each taxonomic group had bioavailability scores of 2 (and thus formed the basis of the ECO-SSL). None of the studies used to derive the ECO-SSL values for lead were included in CCME (1999a), despite the fact that they were published prior to the updated compilation reported by CCME (1999a) Status of ECO-SSL Literature Searches ECO-SSL documents prepared by USEPA provide the most comprehensive review of soil toxicity data currently available in the literature, and therefore, are recommended for consideration by CSST in any revision of numerical standards for the protection of soil 14 Allinson and Dzialo (1981), Balba et al. (1991), Bengtsson et al. (1986), Dang et al. (1990), Davis and Barnes (1973), Dixon 1988, Hassett et al. (1976), Khan and Frankland (1983, 1984), Khan and Khan (1983), Ma (1982), Miller et al. (1977), Muramoto et al. (1990), Neuhauser et al. (1985), Spurgeon et al. (1994), plus additional studies listed in Footnote Data used for CSST derivation were limited to the following studies listed in CCME (1999): Seiler and Paganelli (1987) using loblolly pine; Environment Canada (1995) using lettuce and radish, and Environment Canada (1995) using earthworms. 16 Data used for ECO-SSL lead values were Davis and Barnes (1973), Marques Des Santos et al. (1993), Singh and Jeng (1993) and Sandifer and Hopkins (1996; 1997).
126 July invertebrates and plants. The status and scope of the ECO-SSL process is summarized in Table 7.1. Note that in most cases, data are summarized for ECO-SSL marked with insufficient data the issue for these compounds is that there were insufficient data with an acceptable study evaluation score. Limited toxicity testing using aged natural soils may be required to supplement the existing data additionally, we note that the costs associated with limited toxicity testing are likely less than the costs associated with reviewing and retrieving the amount of literature typically available. Conducting targeted toxicity testing also provides the greatest control over study design considerations such as those described elsewhere in this chapter. TABLE 7.1: Status of ECO-SSL Literature Reviews For Soil Invertebrates and Plants (June 2005) Compound Plants Soil Invertebrates Aluminum Screened as a COPC only if soil ph is less than 5.5 Antimony Insufficient data Available Arsenic Available Insufficient data Barium Insufficient data Available Beryllium Insufficient data Available Cadmium Available Available Chromium Insufficient data Insufficient data Cobalt Available Insufficient data Copper Pending Iron Not toxic to plants if soil ph is between 5 and 8 Lead Available Available Manganese Pending Nickel Pending Selenium Pending Silver Pending Vanadium Insufficient data Insufficient data Zinc Pending DDT and metabolites Pending Dieldrin Insufficient data Insufficient data Pentachlorophenol Available Available RDX Pending TNT Pending Total PAHs Pending
127 July Recommendations 1. Soil standards for the protection of soil invertebrates and plants should be based on the best available (i.e., comprehensive and recent) literature compilations. An assessment of the adequacy of the existing literature compilations used to derive CSST standards relative to: a) recent compilations published by other regulatory agencies; and/or, b) scientific literature published since the date of the original data compilation is recommended. Our experience suggests that additional toxicity data are available in the literature that has not been considered by CSST, although limited additional toxicity testing may still be necessary for some compounds. 2. A transparent mechanism for evaluating data quality should be established. The Ministry should review the data evaluation framework presented in USEPA (2003a) the conservatism inherent in the USEPA (2003a) framework may be screening out studies that are in fact appropriate for use. As a guiding principle, studies that report nominal concentrations only should be rejected. The existing CSST derivation methodology requires clarification regarding the rationale used for excluding data that were otherwise included in CCME. 7.3 Scientific Issue: Selecting Appropriate Toxicological Endpoints The three derivation protocols reviewed (BCE, 1996; CCME, 2005; USEPA, 2003a) differ in the toxicological endpoints included in their respective derivations. CCME (2005) notes that toxicity data used for the derivation of soil quality guidelines must be based on recognized toxicological endpoints (e.g., mortality, reproduction, growth), however, the preferred derivation methodology itself (as described in Section 7.1.2) is based only on sublethal data (e.g., the EC 25 not the LC 25 ). Mortality data (if used) is subject to an extrapolation factor. USEPA (2003a) does not permit consideration of mortality in the first generation of test organisms (i.e., the mortality endpoint common in toxicity testing). The survivability of subsequent generations is considered acceptable (USEPA, 2003a). Other endpoints acceptable to USEPA (2003a), but not CCME (2005) include plant physiological endpoints such as CO 2 uptake rates, decrease in chlorophyll content, membrane damage, and detrimental changes in dormancy measures. The existing CSST derivation protocol (BCE, 1996) requires explicit consideration of mortality data (without the use of an extrapolation factor), which is inconsistent with CCME (2005).
128 July Recommendation We agree with BCE s (1996) decision to include mortality data in the derivation protocol, and recognize that this reflects a policy decision regarding the desired level of protection for different land uses. 7.4 Scientific Issue: Selecting Appropriate Toxicity Statistics All three derivation protocols (BCE, 1996; CCME, 2005; USEPA, 2003a) have differing guidance regarding the selection of appropriate toxicity data for the derivation process. All three protocols support the use of point-estimate statistics (i.e., EC x ) over hypothesistesting statistics (i.e., NOEC/LOEC), but differ in terms of the mechanism involved in dealing with NOEC/LOEC data. CCME (2005) provides alternative derivation methodologies for those compounds where insufficient point-estimate data are available (but sufficient NOEC/LOEC data exist). A mathematical conversion of NOEC/LOEC to an equivalent point estimate statistic is not provided. The existing CSST derivation protocol (BCE, 1996) requires that NOEC data are converted to a L(E) 0, while LOEC data are converted to a L(E) 1. USEPA (2003a) requires that NOEC/LOEC data be converted to the maximum acceptable test concentration (MATC; the geometric mean of the NOEC and LOEC), and provides guidance in terms of which data are preferred for the distribution (EC 20 is preferred over MATC is preferred over EC 10 ). The utility of point-estimate data (EC x ) versus hypothesis-based data (NOEC/LOEC) has been broadly debated in the literature the general consensus is that the objective is to derive a threshold value that is considered adequately protective (i.e., no adverse effects or an acceptable level of low effects, depending on the underlying regulatory objectives). Criticisms of the use of a NOEC (i.e., the highest test concentration not statistically different from the negative control) include (Hanson and Solomon, 2002): NOECs (and, by extension, LOECs) are limited to the concentrations used in the toxicity test, which are often selected for convenience (e.g., based on a log or serial dilution) rather than biological significance. NOECs tend to increase as the precision of the study decreases (e.g., a NOEC from a rangefinder study tends to be larger than a NOEC from a definitive study).
129 July The reliance of statistically significant differences on the selection of NOEC and LOEC values means that a NOEC can, depending on the dose response, represent a substantial effect. Isnard et al. (2001) evaluated an aquatic data set 17, and found that the average effect level at the calculated NOEC and LOEC was 5 and 37%, respectively. Radix et al. (2000) evaluated an aquatic data set 18 and found that NOECs typically fell within the 95% confidence interval of the EC 10 value. However, Fairchild et al. (1997) found that NOECs for pesticide toxicity testing using algal reproduction and growth tests were frequently within the 95% confidence interval of the EC 50 value. In terms of testing with effluents (instead of single chemical compounds), Chapman et al. (1996) found NOEC values obtained by two testing facilities conducting independent oyster, mussel and echinoderm toxicity testing on the same effluent were considerably influenced by relatively minor differences in test concentration selection, as well as the statistical package used in the analyses. In short, a no observed effect concentration is not equivalent to a no effect concentration (van der Hoeven, 1997; Chapman et al., 1996), which is the assumption inherent in converting the NOEC values to an L(E) 0 value. Although the majority of studies investigating the relationship between hypothesis-based and point-estimate measures utilize aquatic toxicity data, the following terrestrial papers were identified that calculated both EC x and NOEC data points: Lock et al. (2002) found that 13 of 17 experiments on the effects of lindane on soil invertebrates 19 resulted in NOEC values that were higher than the EC 10 value, but less than the EC 50 value. Arrate et al. (2002) found that NOECs for earthworm reproduction 20 were at least twice the EC 10 value, and concluded that the EC 10 values were a more reliable measurement for risk assessment purposes. Recommendation The current CSST practice of converting NOEC and LOEC statistics to L(E) 0 and L(E) 1 statistics for derivation purposes should be discontinued. Instead, the underlying dose- 17 Data consisted of: 7 studies from a 72-h algal (Raphidocelis subcapitata or Scenedesmus subspicatus) growth test; 8 studies from a 21-d cladoceran (Daphnia magna) reproduction test; 5 studies from a 7-d cladoceran (Ceriodaphnia dubia) reproduction test, and 7 studies from a fish early life stage (Danio rerio) development test. 18 Data consisted of: 16 chemicals tested with 72-h algal (Psuedokirchneriella subcapitata) growth test; 21- d cladoceran (Daphnia magna) reproduction test; 48-h rotifer (Brachionus calyciflorus) reproduction test, and Microtox. 19 Data consisted of: 3 experiments using a 28-d springtail (Folsomia candida) reproduction test; 2 experiments using a 42-d potworm (Enchytraeus albidus) reproduction test, and a 21-d earthworm (Eisenia foetida) reproduction test 20 Data consisted of 21-d potworm (Enchrytraeus coronatus) reproduction toxicity tests using a pesticide degradation product (carbendazim) and potassium dichromate.
130 July response in the original paper should be reviewed in order to determine the appropriate L(E)C x. This may require recalculation based on original (measured concentration) data to determine the values for the standardized point-estimate statistics (e.g., EC 25 and EC 50 ) and/or determination of the effect size at the NOEC/LOEC test concentrations (e.g., a 33% reduction at the NOEC is equivalent to an EC 33 ). 7.5 Scientific Issue: Incorporating Bioavailability in the Derivation Protocol Introduction to the Issue Consideration of contaminant bioavailability is increasingly common in risk assessment and remediation planning, although wide-spread use remains limited by a lack of standardized guidance regarding the level of information that must be included in a bioavailability assessment as well as the scientific validity of different assessment tools and models (Ehlers and Luthy, 2003). Preparation of regulatory guidance is underway, however, as demonstrated by recent publications by the US National Research Council (NRC, 2002), as well as a draft USEPA framework for assessing risks associated with metals which emphasizes consideration of bioavailability (USEPA, 2004). However, the lack of a consistent definition of what constitutes the bioavailable fraction creates problems in terms of preparing the necessary regulatory frameworks. The following operational definitions are proposed, based on Semple et al. (2004): Bioavailable fraction: the fraction of the total contaminant concentrations that is immediately available for uptake by organisms. Bioaccessible fraction: the fraction of the total contaminant that may be available to an organism. This fraction includes the portion of the total that is currently bioavailable, plus the portions that may become bioavailable over time. The difference between bioavailable and bioaccessible is illustrated in Figure 7.1; the importance of differentiating bioaccessible versus bioavailable fractions with respect to developing numerical soil standards is that it facilitates an appropriate consideration of what is being measured by the various assessment tools. For example: Equilibrium partitioning approaches (see Section 7.5.3) are focused on the bioavailable fraction, but may not adequately address the potential variations in the bioavailable fraction as changes in soil conditions mobilize the bioaccessible fraction. Different chemical extractions (see Section and 7.5.5) may measure different proportions of the bioaccessible fraction, depending on the solvents used.


131 July Toxicity testing (see Section 7.5.6) using artificial soil samples spiked with contaminants may be measuring the effects associated with the bioavailable fraction, while toxicity testing with natural soil with aged contaminants may be measuring the effects associated with the bioaccessible fraction. The degree to which contaminant bioavailability is considered has substantial implications on the calculation of numerical soil standards. Recommendation Semple et al. (2004) s operational definitions of bioavailable and bioaccessible fractions should be incorporated into future revisions of the CSST derivation protocol. FIGURE 7.1: Conceptual Model of Bioavailability Versus Bioaccessibilty in Soil (from Semple et al. 2004) (Used with permission of K. Semple)
132 July Surrogate Methods for Measuring Bioavailability/ Bioaccessibility The development of surrogate methods to estimate COPC bioavailability in soil has been the subject of considerable research, in part, due to a desire to develop reliable and predictive analytical techniques (i.e., chemical methods) as a substitute for studies using biological test organisms. These surrogate methods can be broadly categorized as: 1) equilibrium partitioning, 2) chemical extraction, and 3) solid-phase extraction. A brief summary of each method as well as recommendations regarding their potential use for deriving provincial soil standards for the protection of soil invertebrates and plants is provided below Equilibrium partitioning Considerable research into the equilibrium partitioning of COPCs between solid and liquid phases of the soil matrix has been conducted (e.g., Sauve et al., 2000; Janssen et al., 1997a). Equilibrium partitioning assumes that the dissolved fraction of the COPC in the interstitial porewater represents the bioavailable fraction that could potentially be taken up by plant roots or soil invertebrates (and thus, cause toxicity). The remaining balance of the COPC concentrations is assumed to be tightly retained by soil solids, and therefore, unavailable for biological uptake 21 (Sauve et al., 2000). Equilibrium partitioning models rely on K d (i.e., the solid-water partition coefficient), which varies according to soil characteristics such as ph, cation exchange capacity, organic carbon content (Janssen et al., 1997a), and in the case of organic compounds, the octanol-water partition coefficient (K ow ). Numerous models for predicting K d exist, ranging from univariate linear regression models (i.e., K d varies according to soil ph) to estimates of the free ion concentration (e.g., similar to biotic ligand models for aquatic toxicology; e.g., Lofts et al., 2004). These equilibrium partitioning based models have been used to describe: Relationships between dissolved porewater concentrations and COPC accumulation for metals in soil invertebrates (e.g., Janssen et al., 1997b) as well as organic compounds in plants (e.g., Dowdy and McKane, 1997; Burken and Schnoor, 1998). Relationships between dissolved porewater concentrations and toxicity of metals to soil invertebrates (e.g., van Gestel and Mol, 2003; Smit and van Gestel, 1998), metals to plants (e.g., Weng et al., 2004), and organics to soil invertebrates (e.g., Lock et al., 2002). 21 Unavailable for biological uptake as defined by Sauve et al. (2000) consists of both the bioaccessible and non-bioaccessible fractions. Sauve et al. (2000) s use of equilibrium partitioning means only the bioavailable fraction is being estimated.
133 July Although the conceptual approach of equilibrium partitioning is attractive (and is useful for groundwater modeling purposes), its utility for predicting chronic soil toxicity is limited. Peijnenburg and Jager (2003) noted that equilibrium partitioning as a model for predicting soil toxicity suffered from its inability to account for other relevant exposure pathways although uptake of many COPCs in soft-bodied organisms is largely influenced by direct contact with the dissolved fraction (e.g., Scott-Fordsmand et al., 2004), the contribution of the dietary fraction is not negligible (e.g., Vijver et al., 2003). Additionally, equilibrium partitioning has not been validated for hard-bodied soil invertebrates, which represent a significant portion of the soil invertebrate community. Most equilibrium partitioning models focus on a single contaminant or invertebrate/plant species; they consider a relatively small number of factors that control K d ; and, in many cases, they are not able to accurately predict the dissolved porewater concentration in field collected soils. Additionally, the assumption that the dissolved porewater concentration is the primary factor governing soil toxicity has not been proven true for all contaminants. Fairbrother (2005) examined the utility of equilibrium partitioning for predicting the toxicity of PAH mixtures in soil and concluded that equilibrium partitioning was inappropriate, except as a means to identify conservative screening levels below which there would likely not be appreciable ecological risk 22 : The following limitations were noted (Fairbrother, 2005): Equilibrium assumptions are violated in nearly all soils. Most soils are not saturated, and therefore, equilibrium between soil and interstitial water is rarely (if ever) attained. Equilibrium partitioning in sediments assume an organic content greater than 0.2%. Low organic carbon contents in soil are more frequent than in sediment. Weathering and aging occur faster in soil than in sediment. This topic is discussed in greater detail in Section 7.5.9, however, the net effect of aging and weathering on soil COPC bioavailability means that the assumption that COPC bioavailability is governed solely by the sorption of COPCs to particle surfaces (inherent in equilibrium partitioning) is overly simplistic. Microbial degradation also confounds the assumption that equilibrium is achievable. These limitations do not invalidate the conceptual approach, nor do they suggest that further research into equilibrium partitioning should be discontinued they simply indicate that the sophistication of the available models is not suitable for predicting contaminant toxicity under field conditions at this time. 22 In other words, equilibrium partitioning only provides an alternate method for generating highly conservative (and therefore less ecologically-relevant) guideline values.
134 July Recommendation Equilibrium partitioning is not recommended as an approach for deriving soil quality standards for the protection of soil invertebrates and plants Chemical Extractions Chemical extractions have been proposed as an alternate measurement of the bioavailable fraction they represent an intermediate measurement between the total concentration in the soil sample as a whole, and soil porewater concentrations described above in the equilibrium partitioning approach (Peijnenburg and Jager, 2003). Numerous extraction techniques have been proposed in the literature 23 ; however, they generally fall into one of three categories: Non-exhaustive: Chemical solvents are relatively mild, and intended to measure the bioavailable fraction. Exhaustive: Chemical solvents are increasingly stronger and intended to measure varying degrees of the bioaccessible fraction. Sequential: Different solvents applied in sequence (i.e., non-exhaustive to exhaustive) to measure the proportion of a COPC associated with different organic and inorganic ligands in the soil. COPC concentrations in the extracted soil leachate are used to explore relationships between the supposed bioavailable fraction and bioaccumulation/toxicity in soil invertebrates and plants. Different extraction techniques have demonstrated relatively high degrees of concordance with bioaccumulation/toxicity in soil samples, including the following examples from the recent scientific literature: Barriuso et al. (2004): extracts using a combination of CaCl 2 and methanol were correlated to the amount of atrazine mineralized by soil bacteria. Conder and Lanno (2000), Conder et al. (2001): extracts using 0.1 M Ca(NO 3 ) 2 were correlated to acute toxicity to earthworms associated with Cd, Pb and Zn. Lock and Janssen (2003a): extracts using 0.1 M Ca(NO 3 ) 2 were correlated to toxicity to potworms, red clover and springtails associated with Cu. 23 Nineteen different chemical extractions for assessing the bioavailable fraction of metals in soil were listed in Peijnenburg and Jager (2003). Numerous other chemical extractions were also identified in the literature consulted for this project.
135 July Dai et al. (2004): extracts using diethylenetriaminepentaacetic acid (DTPA) were correlated to the Zn, Cd, Pb and Cu concentrations in earthworm tissues. Dean and Scott (2004): cyclodextrin extracts were correlated to the bioavailability of persistant organic pollutants. Liste and Alexander (2002): extracts using n-butanol extraction as a surrogate for PAH bioaccumulation in earthworms. Tang et al. (2002) also found strong correlations for PAH bioaccumulation and two other extraction techniques (ethanol or tetrahydrofuran). However, there is no consensus regarding the selection of an appropriate subset of extraction techniques for regulatory purposes, nor have the chemical extraction techniques currently described in the literature been adequately validated for a broad range of soil contaminants or species normally considered representative of the larger soil invertebrate/plant communities. Recommendation Chemical extraction methods are not recommended as an approach for deriving soil quality standards for the protection of soil invertebrates and plants Solid-Phase Extraction Solid phase extraction techniques have been developed as a substitute for using test organisms in bioaccumulation testing they involve the insertion of fibers or membranes coated with a substance that absorbs the contaminant from the porewater phase. Examples of solid-phase extraction include: Conder et al. (2001): ion-exchange membranes coated with DTPA were used as a surrogate for earthworm accumulation of Zn and Pb. Van der Wal et al. (2004): fibers coated with polydimethylsiloxane (PDMS) were used as a surrogate for earthworm accumulation of organic compounds. Tang et al. (2002): C 18 membrane disks were used as a surrogate for earthworm accumulation of PAHs. Results from the solid phase extraction techniques described above were mixed, and thus cannot be considered reliable. Tang et al. (2002) found a correlation of 0.77 or higher for four different PAHs, while van der Wal et al. (2004) found that the measured
136 July concentrations of organic compounds in earthworms were close to estimated concentrations in the solid-phase extracts. Conversely, Condor et al. (2001) found that uptake of metals by the solid-phase extraction technique was highly variable, and not well correlated to earthworm toxicity. Recommendation Solid-phase extraction techniques are not recommended as an approach for deriving soil quality standards for the protection of soil invertebrates and plants Differential Bioavailability/Bioaccessibility between Laboratory and Field-Based Toxicity Testing Reliance on laboratory-based toxicity test data as the basis for developing soil quality guidelines has been criticized in the literature (e.g., Cook and Hendershot, 1996), despite its advantages over chemistry-based estimates of bioavailability, whose failing are described above. These criticisms generally relate to the known differences in contaminant bioavailability/bioaccessibility between laboratory-based toxicity testing and actual adverse effects under field conditions 24. Differences between laboratory-based and field-based toxicity are divided into the following major topics: Artificial Soil Artificial soils for acute toxicity testing were introduced as a replacement for toxicity testing using filter paper impregnated with the compound of interest based on criticism that filter paper-based toxicity tests had minimal relevance in terms of the toxicity of a compound in soil (Neuhauser et al, 1986; van Gestel and van Dis, 1988; Fitzpatrick et al., 1996). The use of artificial soil facilitated comparison of the relative toxicity between different compounds (e.g., pesticides and chemical formulations) for regulatory purposes. Chronic toxicity testing protocols were based on guidance from acute toxicity testing (Van Gestel et al., 1992). Although arguments against the use of artificial soil toxicity testing for risk assessment purposes have been presented in the literature (e.g., Gibbs et al., 1996), artificial soil continues to be used for pesticide testing (e.g., USEPA, 1996); it is advantageous for situations where information regarding the relative toxicity of compounds under standardized test conditions is desired. Artificial soil toxicity testing is also advantageous for developing mathematical relationships between individual soil parameters (e.g., ph, calcium content, organic carbon content) and toxicity the 24 Acclimation and adaptation of populations to elevated COPC concentrations under field conditions is also a potential factor when extrapolating laboratory toxicity data as indicative of adverse effects under field conditions.
137 July simplicity of the geochemical interactions facilitates model development. However, Lock and Janssen (2001) found that a mathematical model 25 was able to predict chronic zinc toxicity in an artificial soil, but not in contaminated field soils. Amorim et al. (2002) found that the bioavailability and toxicokinetics of lindane in artificial soil and natural soils 26 over the course of a 10-month experiment were substantially different. Artificial soil does not reflect the natural capacity of soil to reduce contaminant bioavailability (i.e., render a portion of the bioavailable fraction non-bioaccessible). The bioavailability of contaminants in natural soil is a function of both the total contaminant concentration as well as the effects of numerous geochemical processes that cannot be readily simulated using an artificial soil. Consequently, the toxicity of a given concentration in artificial soil is not the same as under field conditions for example, Fountain and Hopkin (2004) found that zinc toxicity to F. candida was greater in artificial soil than in field-collected soils. In general, artificial soil testing tends to demonstrate greater toxicity than natural soils. We recognize that artificial soil provides a standardized matrix that facilitates comparisons between different contaminants, however, if this level of standardization is desired, we suggest that the Ministry establish specific locations from which appropriate natural soil should be collected. However, we believe that this level of standardization is unnecessary for the purposes of developing soil quality guidelines since it would greatly limit the amount of acceptable toxicity data and would reduce the applicability of the resulting soil guidelines to an unnecessary narrow subset of soil types. Recommendation Toxicity test data from studies using natural soils are preferred for the purposes of setting soil standards for the protection of soil invertebrates and plants over those using artificial soils. Spiked Soil Testing Artificial soils are often used in conjunction with spiked-soil toxicity testing 27 involving the addition of a single contaminant type via solution. COPCs under field conditions, however, exist as the sum of numerous organic and inorganic ligands, each with varying degrees of bioavailability/bioaccessibility. Davies et al. (2003) conducted earthworm (Eisenia foetida) toxicity testing in natural soil samples spiked with various forms of lead 25 The mathematical model was based on ph, cation exchange capacity, and total zinc concentrations. Toxicity testing was conducted using a 28-d springtail (Folsomia candida) survival and reproduction test. 26 Toxicity testing was conducted using a 28-d springtail (Folsomia candida) survival and reproduction test. 27 Examples include a metal salt dissolved in water, or an organic compound dissolved in a solvent.
138 July salts 28, and found that the toxicity of the lead increased with the solubility of the form of the lead salt used. Interpretation of the toxicity data in the literature (typically reported in terms of total metal concentrations) needs to consider the form of the metal used in the investigation. Similar challenges exist with the assessment of organic compounds in that spiked soil toxicity testing may not adequately evaluate the toxicity of the original compound plus its byproducts. Recommendation Toxicity data from spiked soil studies are acceptable for derivation purposes, however, the uncertainty associated with using data from a single type of contaminant (e.g., metal species) as representative of the toxicity of the compound as a whole should be acknowledged. Side-by-side toxicity testing with soils spiked with different metal species should be encouraged. Note: The use of aged natural soils for toxicity testing (see below) partially addresses this uncertainty. Soil Aging Toxicity testing conducted with freshly-spiked soil samples does not adequately represent the bioavailability of a soil that has been subjected to weathering and aging processes; newly-added contaminants are more bioavailable than an identical concentration in a aged soil. During aging, molecules of a COPC slowly move into locations within the soil matrix that cannot be accessed by organisms (Alexander, 2000); sorption to organic carbon is also a significant aging mechanism. In effect, aging renders a portion of the bioavailable COPC fraction less bioaccessible. Decreased bioavailability (and thus, toxicity) associated with soil aging has been well-documented in the literature, including the following recent examples: Morrison et al. (2000) found the bioavailability of dieldron to the earthworm Eisenia foetida were reduced by up to 72% in soils aged for 49 years. The bioavailability of DDT to earthworms was also markedly reduced in soils aged for only 190 days. Smit and van Gestel (1998) found that the toxicity of spiked zinc to the collembolan Folsomia candida was 5-8 times greater in a natural soil that was freshly spiked versus the same soil that was spiked and then allowed to age for 1.5 years. Ahmad et al. (2004) found that the bioavailability of a weakly-sorbed pesticide (1- naphthyl methylcarbamate) to microbes was reduced by 50% in natural soils that had been aged for 12 years. 28 Forms of lead included: Pb(NO 3 ) 2, PbCO 3 and PbS.
139 July However, it is not possible to develop a single aging factor that can predict toxicity as a function of time. The magnitude of the aging effect is likely soil- and contaminantspecific. For example, Lock and Janssen (2003b) found that the effect of aging on zinc toxicity increased with soil ph. Sverdrup et al. (2002) found that aging did not significantly reduce the toxicity of pyrene and phenanthrene to the collembolan Folsomia fimetaria over 120 days, however, this was thought be the result of a relatively low organic carbon content (1.6%) that reduced the aging effect. A standardized protocol for appropriate soil aging is not available (USEPA, 2003a). Several studies investigated the effects of aging using a side-by-side comparison of historically contaminated soil and clean soil that was freshly spiked to a similar COPC concentration (Lock and Janssen, 2001), or by repeated testing of soil over time (Amorin et al., 2002; Ahmad et al., 2004). Examples of the aging used for soil toxicity testing from the literature include: Kuperman et al. (2004): Freshly-spiked soil was stored in open plastic bags in a greenhouse for three weeks. The soil was rehydrated back to its original mass by the addition of water twice per week. Morrison et al. (2000): Freshly-spiked soil was stored in sealed glass jars in the dark at 22ºC for 90 days. Samples were rehydrated prior to use. Pedersen et al. (2000): Freshly-spiked soil was stored in closed plastic pots at 20ºC for up to 12 weeks. Alexander (2000): A summary of aging times used in seven different studies ranged from 68 to 365 days. Smit and van Gestel (1998): Freshly-spiked soil was placed in uncovered outdoor plots and left undistributed for 1.5 years except for the removal of weeds. Recommendation Toxicity test data from studies using aged soils should be preferred over those using non-aged soils. We recommend that soil aging for toxicity testing should involve storage in containers that allow air circulation (outdoor storage where aerial deposition of other contaminants can occur is not recommended). Aging should be conducted at ambient room temperatures (either at a constant temperature if stored under controlled conditions or naturally variable if stored in a non-controlled room). Samples should be rehydrated to their original moisture content at least weekly. Large soil volumes (e.g., 4-L or more) should be rehomogenized weekly. Samples should be aged for a minimum of 3 months prior to testing.
140 July How is Bioavailability/Bioaccessibility Addressed in Existing Protocols? The available derivation protocols differ significantly in terms of the methods used to address the potential uncertainty associated with differential bioavailability/ bioaccessibility between laboratory-based toxicity tests and field conditions. CCME (2005): CCME (2005) allows consideration of bioavailability through use of professional judgment. CCME (2005) states that, ideally, soil contact guidelines should be developed based on data reflective of typical Canadian soils; however, they acknowledge that data are frequently reflective of a limited range of conditions, and often biased towards conditions of relatively high bioavailability. CCME (2005) suggests that data be reviewed in terms of identifying data points based on low bioavailability conditions. Specific low bioavailability conditions (CCME, 2005) include: soil organic carbon contents of 6% or greater, or a soil ph outside a range of If more than 50% of the data used for the guideline derivation are considered indicative of low bioavailability, the safety factor should be increased to compensate (CCME, 2005). BCE (1996): Bioavailability is not addressed. USEPA (2003a): USEPA (2003a) provides the following two-stage method for incorporating bioavailability considerations: Qualitative bioavailability ratings (e.g., high, medium, low) are assigned to each study based on soil and contaminant properties. Examples of the framework used to assign the bioavailability ratings are provided in Table 7.2. Bioavailability scores (e.g., 0, 1, 2) are assigned to each study based on the qualitative bioavailability ratings A bioavailability score of 2 is assigned if the study was based on natural soil with a qualitative rating of high or very high. A bioavailability score of 1 is assigned if the study was based on natural soil with a qualitative rating of medium or a standard artificial soil. A bioavailability score of 0 is assigned if the study was based on natural soil with a qualitative rating of low or very low.
141 July TABLE 7.2: Examples of Qualitative Bioavailability Ratings Based on Soil Properties (From USEPA, 2003A) Qualitative Bioavailability of Metal Cations in Natural Soil to Plants <2% organic matter 2 to <6% organic matter 6 to 10% organic matter 4 Soil ph 5.5 Very High High Medium 5.5 < Soil ph < 7 High Medium Low 7 Soil ph 8.5 Medium Low Very Low Qualitative Bioavailability of Non Ionizing Organic Compounds in Natural Soil 4 Soil ph < Soil ph < 7 7 Soil ph 8.5 Log K OW > 3.5 Log K OW < 3.5 Log K OW > 3.5 Log K OW < 3.5 Log K OW > 3.5 Log K OW < 3.5 <2% organic matter 2 to <6% organic matter 6 to 10% organic matter High Medium Low Very High High Medium Medium Low Low High Medium Low Low Low Low Medium Low Low Bioavailability scores are used to sort the data for guideline derivation. ECO-SSLs are calculated using only the minimum amount of data with the highest available bioavailability score 30. This approach encourages the generation of toxicity data under conditions of natural bioavailability, since all toxicity data with artificial soil would be excluded from consideration if a minimum of three acceptable data values conducted using natural, aged soils were available (as was the case for manganese 31 ). 30 For example, if four data values had a bioavailability score of 2, then the ECO-SSL would be calculated on only those data (i.e., 3 values). If there were only two data values with a bioavailability score of 2, but an additional five data values with a bioavailability score of 1, then the ECO-SSL would be calculated on all seven data values (i.e., 3 values with a combined bioavailability score of 1 or 2). 31 Kuperman et al. (2004) spiked a natural sandy loam (ph 5.0; organic content 1.5%) with a manganese salt (MnSO 4 x H 2 O), and aged the soil for three weeks using an alternating sequence of wetting and drying cycles. EC 20 values were determined for earthworm (Eisenia foetida), potworm (Enchytraeus crypticus). and collembolan (Folsomia candida) reproduction. These were the only data used for the derivation of a manganese ECO-SSL value for the protection of soil invertebrates.
142 July Recommendation Numerical soil standards for the protection of soil invertebrates and plants should be based on toxicity data from natural, aged soils, even to the extent of excluding data from artificial soil toxicity testing from the derivation process (provided that sufficient natural soil toxicity data are available). The minimum data threshold (3 studies) set by USEPA (2003a) should, ideally, be exceeded, as its adequacy is uncertain. 7.6 Scientific Issue: Use of Species Sensitivity Distributions versus Lowest Toxicity Value Divided by an Uncertainty Factor Introduction to the Issue Derivation methods for establishing numerical environmental quality guidelines based on laboratory-based toxicity tests tend to utilize one of the following general approaches: Single Toxicity Data Value (and Uncertainty Factor) The use of laboratorybased toxicity data to set protective environmental quality guideline values often involves the selection of a single data value, followed by the application of an uncertainty factor. The lowest available data value is typically selected (i.e., the lowest NOEC, NOEC, or L(E)C 50 ), and one or more of the following uncertainty factors are applied: intra-to-interspecies, acute-to-chronic, NOEC-to-LOEC, laboratory-to-field. A default value of 10 is typically applied for each area of uncertainty, resulting in an overall safety factor ranging from 10 to 10,000. Safety factors are frequently misapplied their original purpose was to compensate for sparse data sets, not to facilitate an extreme application of the Precautionary Principle that requires the use of an infinitely large (and thus overprotective) safety factor (Chapman et al., 1998). Species Sensitivity Distributions (SSDs) SSDs provide a method for developing environmental quality guidelines that emphasize protection at the community level rather than traditional methods that emphasize protection of individual species (Posthuma et al., 2002). The basic premise of a SSD is that a safe concentration for the community at large can be extrapolated based on the distribution of toxicity data for the individual species that make up the community. In this respect, SSDs are fundamentally different from the common practice of dividing the lowest toxicity data point by a safety factor the SSD relies on the entire data distribution, not just the lowest data value. The common practice and terminology refers to the safe concentration as the HC 5, defined as the concentration that protects 95% of the species (Posthuma et al., 2002). Other HC x values can be calculated that reflect varying degrees of protection. SSDs are increasingly used to derive environmental quality guidelines for aquatic compounds, either at a national level (e.g., USEPA and EU water quality guidelines), or for ecological risk assessment purposes (e.g., tributyltin in Cheasapeake Bay: Hall et al., 2000).
143 July Derivation Methods Currently in Use There are substantial differences in the preferred derivation methods for each of the protocols reviewed: CCME (2005) derives soil quality guideline values for different land uses based on the 25 th and 50 th percentile from a single distribution (consisting of sublethal EC 25 data) 32. Mortality data are not included in the distribution. USEPA (2003a) derives a single ECO-SSL value for all land uses based on a geometric mean of a subset (based on bioavailability) of the available EC 20, MATC, and EC 10 data. Mortality data are not included in the distribution. The existing CSST protocol (BCE, 1996) derives soil standards for different land uses using a distribution of median values (based on a set of standardized endpoints). A regression line is used to identify the 20 th percentile of the mortality data distribution, and the 50 th percentile of the sublethal data distribution. CCME (2005) Two of the four CCME derivation methodologies reflect an SSD approach. For example, the weight-of-evidence (effects/no effect distribution) approach (described in Section 7.1.2) was the preferred method in previous versions of the CCME derivation methodology (CCME, 1996) and is still available in the current protocol (CCME, 2005). This method relies on a ranking of the available toxicity (LOEC and L(E) 50 ) data, followed by interpolation (or extrapolation) of the 25 th percentile (i.e., an HC 25 ) and application of a safety factor. This approach differs from a classic SSD methodology in two respects: a) multiple types of data values are combined into a single distribution, and b) a safety factor is applied to the HC 25. The recent update to the Canadian derivation protocol (CCME, 2005) provides another methodology that utilizes a SSD approach. The weight-of-evidence (EC 25 distribution) approach (described in Section 7.1.2) requires compilation of a single type of data (i.e., EC 25 ), and interpolation of the 25 th and 50 th percentiles (i.e., HC 25 and HC 50 ). This approach differs from a typical SSD procedure only in the respect that CCME (2005) still requires consideration of a safety factor to derive a soil quality guideline value 33, rather than incorporating statistical considerations of the uncertainty in the data set (e.g., use the lower 95% confidence interval of the HC 25 rather than apply a safety factor). 32 Weight-of-evidence (EC 25 distribution) approach. 33 Note that CCME (2005) states that: a) an uncertainty factor of between 1 and 5 can be applied to the ESSD 25 (i.e., the HC 25 ) based on examination of the data used in the distribution; and b) an uncertainty factor need not always be applied. Uncertainty factors are not normally applied to the ESSD 50 (i.e., the HC 50 ).
144 July Widespread use of SSDs is limited by the availability of sufficient toxicity data to meet the minimum data requirements. CCME (2005) uses a linear regression model (the most commonly-applied model), and requires a minimum data set consisting of ten data points from three different studies. Recommendations regarding the minimum number of data points needed to generate a relatively stable SSD (for aquatic contaminants) vary widely (e.g., from 10 to 15 by Wheeler et al., 2002; from 15 to 55 by Newman et al., 2000). No papers were identified that examined the minimum data points needed to generate a stable SSD for soil contaminants. Additionally, consensus on appropriate mathematical models (e.g., linear regression versus other types of statistical models) has not yet been achieved in the literature, and likely, will require consideration on a compound-by-compound basis. USEPA (2003a) The ECO-SSL approach does not utilize an SSD approach; instead, it adopts a modified selected toxicity data approach where the application of uncertainty factors is replaced by calculating a geometric mean of the selected toxicity data. Emphasis is placed on the selection of high-quality data with relatively protective toxicological endpoints. The laboratory-to-field extrapolation is partially addressed through the consideration of bioavailability under field conditions. Existing CSST Derivation Method (BCE, 1996) The existing CSST practice (BCE, 1996) contains several elements that are inconsistent with an SSD approach: Calculating a median value for each standardized point estimate statistic based on multiple species. SSDs are typically based on the distribution of the same point estimate statistic for multiple species. Calculating a geometric mean for a single species (or genus) is commonly used so that multiple studies using the same test organism do not overly bias the species distribution; however, calculation of a single median value based on a combination of plant and invertebrate data is not appropriate. Calculating a soil standard based on a distribution of the median values for multiple standardized point estimate statistics on the same graph. This approach results in a form of pseudo-replication in that the EC 10, EC 25, and EC 50 values from a single study are counted towards three distinct data points for the distribution of median values. In effect, the existing CSST approach eliminates the underlying rationale of the species sensitivity distribution in that the distributions no longer represent the response of multiple species to a given contaminant. The potential bias that this approach introduces cannot be determined (i.e., are the standards over or under-protective), since the calculation of a median value eliminates consideration distribution of species- and contaminant-specific sensitivities that would normally be expected in a natural ecosystem.
145 July We agree, however, with the CSST decision to develop separate distributions for lethal and non-lethal data. The use of two separate distributions for lethal and non-lethal data provides a broader range of potential protection goals than CCME (2005), which is based on a single distribution of only EC 25 data. This methodology (i.e., weight-of-evidence: EC 25 distribution) cannot generate a similar range of differing levels of protection, and as a result, CCME (2005) is limited to the following narrative explanation of its protection goals: 1. Agricultural, residential and parklands are allowed to have 25% of their species demonstrate a 25% reduction in the performance of sublethal endpoints (or less, if a safety factor is applied). 2. Commercial and industrial lands are allowed to have 50% of their species demonstrate a 25% reduction in the performance of sublethal endpoints. The existing CSST protocol allows a broader range of available protection goals by virtue of consideration of mortality data using a separate distribution. The selection of specific protection goals to reflect differing land uses is a policy-based decision and, therefore, is not considered within this scientific review. Recommendation CSST soil standards for the protection of soil invertebrates and plants should be based on a species sensitivity distribution approach wherever possible. Alternate methods for guideline derivation are available if data are insufficient. Separate distributions for mortality (e.g., LC 50 or LC 25 ) and sublethal (EC 50 or EC 25 ) data should be derived, instead of a single distribution consisting of only EC 25 data. This approach reflects the existing differences between existing Ministry and CCME policy Using Separate or Combined Distributions for Plants and Invertebrates CCME (2005) and the existing CSST derivation methods often (but not always) result in the derivation of a single guideline/standard to protect both soil invertebrates and plants 34. USEPA (2003a) requires separate screening values for soil invertebrates and plants. 34 CCME (2005) indicates that separate distributions should be used if the data are sufficient.
146 July Recommendation Separate numerical standards for soil invertebrates and plants should be derived for those contaminants that have sufficient and appropriate toxicity data. Combination of soil invertebrate and plant data on a single sensitivity distribution is acceptable. 7.7 Summary of Proposed Derivation Methodology Recommendations 1. The following derivation methodology is proposed, based on the scientific review described above and ensuing recommendations: 2. Assemble a toxicity data set where each toxicity data value has been screened, and assigned an appropriate bioavailability rating. The data review and bioavailability protocols established by USEPA (2003a) are recommended for consideration by BCWLAP. A policy decision regarding minimum data review scores is required (i.e., the requirement specified in USEPA 2003a may be overly conservative). 3. Data sets recently prepared and/or updated by USEPA, CCME, or other jurisdictions should be reviewed to determine if the data sets can be adopted for use by CSST. Supplemental literature searches should be conducted for those compounds not already recently reviewed by other jurisdictions. Regardless, additional toxicity testing may be required. 4. Select the appropriate test statistic for use in a species sensitivity distribution, based on the desired level of protection. We agree with the current BCWLAP approach of compiling both LC 20 and EC 50 test statistics, but recommend that a range of acceptable test statistics be established for each SSD in order to maximize the amount of data available. For example, the EC x SSD may include test statistics ranging from EC 25 to EC 50, while the LC x SSD may include test statistics ranging from LC 10 to LC Determine if sufficient toxicity data exist to allow calculation of a SSD based on testing with natural, aged soils. Determine if sufficient data exist to allow separate SSDs for plants and soil invertebrates. We agree with CCME (2005) that a minimum of 10 data values are desired for the SSD approach: under the proposed derivation method, this will translate into a minimum of 10 EC x values and 10 LC x values required per analyte.
147 July Toxicity data from testing with artificial soil should only be included if data from natural aged soils are insufficient to meet the minimum data requirements above. Data from soil invertebrates and plants should be combined on the same distribution only if there are insufficient data to allow separate distributions. 7. Select the appropriate HC x value to be derived for each SSD, based on the desired level of protection. Based on existing policy, this would consist of an HC 20 from the mortality (LC x ) data distribution, and an HC 50 from the sublethal (EC x ) data distribution. Differing levels of protection to reflect the increased range of proposed land uses may be appropriate. 8. Determine if application of a safety factor is necessary, and if so, what is reasonable (i.e., don t simply use a default value of 10). Safety factors are likely unnecessary except under exceptional circumstances. 9. If data are insufficient to support a SSD approach, other derivation methods as described by CCME are appropriate for developing interim soil quality standards. These interim standards should be reviewed every five years to determine if sufficient data are available for the SSD approach. 10. The preferred order of these alternate CCME-based methods are the same as described in CCME: Weight-of-Evidence (Effects/No Effect Distribution) Approach, Lowest Observed Effect Concentration Approach, and Median Effects Method Approach. 11. These alternate CCME methods should be modified as follows: a) separate analyses of lethal and non-lethal data should be conducted, b) data from natural, aged soil should be preferred over non-aged or artificial soil, and c) unnecessary safety factors should not be incorporated. The data evaluation used for this alternate CCME-based methods should be the same as for the proposed SSD approach as described above.
148 July ENVIRONMENTAL PROTECTION: TOXICITY TO SMALL MAMMALS AND BIRDS Soil standards for the protection of small mammals and birds are desirable for assessing contaminated sites, despite the fact that equivalent approaches are not currently incorporated into the federal guidance (CCME, 2005). We disagree with the following CCME (2005) assumptions that: The level of protection offered to soil-dependent organisms from direct contact exposures is adequate to protect wildlife from dermal and ingestion exposures. We are not aware of any data to support this assumption. Information on the effects of wildlife exposure to soil contaminants is severely lacking. In fact, a considerable body of literature exists regarding this potential exposure pathway. Developing soil standards for the protection of small mammals and birds would accomplish the following objectives: They would provide a basis for screening potential risks to a broader selection of terrestrial receptors than currently available. At present, the decision to conduct an ERA at a contaminated site is largely driven by potential toxicity to soil invertebrates and plants. Potential adverse effects on small mammals and birds associated with ingestion of dietary items and soil are not considered 35. Soil standards for the protection of small mammals and birds would increase the consistency in terms of screening sites for potential risks to wildlife. However, the context for the application of soil standards for the protection of small mammals and birds needs to be fully considered. We envision that soil standards for the protection of small mammals and birds would act only as a conservative screening tool applied to only land uses that have the physical habitat necessary to support small mammal and bird populations 36. The intended purpose of the standards is to identify those sites where risks to small mammals and birds are clearly negligible, and therefore, would not require further assessment. 35 Incidental soil ingestion rates for small mammals and birds vary considerably depending on feeding behaviour; however, Beyer et al. (1994) estimated that near 0 to 30% of an organism s diet consisted of soil (depending on the species). 36 Soil standards for the protection of small mammals and birds are only envisioned for the Wildlands and Agricultural land use (and potentially, the Urban Park land use). The remaining land uses are unlikely to contain sufficient habitat to support populations, and therefore, the soil standard would have minimal ecological relevance (Tannenbaum, 2005).
149 July The proposed methodology is not intended to generate quantitative risk estimates for those sites where the potential for adverse effects cannot be excluded; numerical soil standards are not intended as a replacement for a properly designed ecological risk assessment 37. Recommendation CSST should develop soil standards for the protection of small mammals and birds for selected land uses. The Ministry should decide which land uses will have a small mammal and bird exposure pathway we envision that these soil standards would only apply to Wildlands and Agricultural land uses (and potentially, Urban Park and Residential). Standards for the protection of small mammals and birds should not be applied to Commercial, High Density Urban Residential or Industrial land uses. 8.1 Review of Selected Derivation Protocol (USEPA, 2003a) At present, soil standards and/or guideline values for the protection of small mammals and birds are not available at the provincial (BCE, 1996) or federal (CCME, 2005) level. USEPA (2003a) provides a framework for calculating soil standards for the protection of small mammals and birds. ECO-SSLs are derived for the following receptor groups (representative species in brackets): Mammalian herbivore (meadow vole); Mammalian ground insectivore (short-tailed shrew); Mammalian carnivore (long-tailed weasel); Avian granivore (mourning dove); Avian insectivore (American woodcock); and, Avian carnivore (red-tailed hawk). For each receptor, an appropriate toxicity reference value (in terms of mg contaminant per kg body weight per day; mg/kg/day) is derived from the available scientific literature. The literature review consists of initial study retrieval, followed by a literature exclusion and study acceptance review 38. Each data value that passes the literature exclusion and 37 Further discussion of the intended role of numerical soil standards for the protection of small mammals and birds relative to the ecological risk assessment process is provided in Section Literature exclusion and study acceptance reviews were similar to the process described for ECO-SSL soil invertebrate and plant screening levels (Section 7.1.3).
150 July study acceptance reviews is scored (on a scale of 0 to 10) for each of the following ten study evaluation criteria: 1. Data source: Data from non-primary sources were excluded. 2. Dose route: Dietary exposures were scored higher than gavage or capsule exposures. Non-oral studies (e.g., injection) were excluded. 3. Test substance concentrations: Measured concentrations were scored higher than nominal concentrations. 4. Contaminant form: Contaminant forms similar to those encountered in soil were scored higher than those with dissimilar contaminant forms. 5. Dose quantification: Exposures reported in terms of dose (e.g., mg/day) were scored higher than those reported in terms of concentration (e.g., mg/kg). 6. Endpoints: Reproductive endpoints were scored higher than lethality or growth, while other endpoints (e.g., biochemical, behavioural) were scored lower. 7. Dose range: Studies with both NOEAL and LOEAL values were scored higher than studies reporting only one value. 8. Statistical power: The power associated with the NOEAL was scored. 9. Exposure duration: Multiple generation and critical life stages were scored higher than chronic, subchronic or acute studies. 10. Test conditions: Studies reporting standard exposure conditions were scored higher than studies that report non-standard exposure conditions (or that did not report exposure conditions). Data values that receive a total score of 65 or less are excluded from TRV derivation. The remaining data values are sorted according to toxicological endpoint the selected TRV is based on the available reproduction and growth NOAEL values. Avian and mammalian toxicity data are plotted separately. The distribution of the NOAEL-based data for the remaining toxicological endpoints (e.g., behavioural, biochemical), as well as the LOAEL-based data for all endpoints is used to select the specific method used to calculated the TRV. This procedure is illustrated in the flowchart provided in Figure 7.2. A food chain model is then used for each receptor in order to predict the ingested dose from the following exposure pathways:
. Consumption of dietary items (e.g., tissue concentrations predicted from soil concentrations using bioaccumulation factors or regression models from the literature).")
 includes the following guidance regarding the appropriate application of the ECO-SSL values which would be equally applicable to any CSST soil standards")

151 July Incidental soil ingestion (e.g., through grooming, foraging, etc). Consumption of dietary items (e.g., tissue concentrations predicted from soil concentrations using bioaccumulation factors or regression models from the literature). The soil concentration that would result in a daily ingested dose equal to the wildlife TRV (i.e., resulting in a hazard quotient of 1) is backcalculated and used as the ECO-SSL value for the receptor group. USEPA (2003a) includes the following guidance regarding the appropriate application of the ECO-SSL values which would be equally applicable to any CSST soil standards derived using a similar methodology: It is emphasized that the Eco-SSLs are soil screening numbers, and as such are not appropriate for use as cleanup levels. Screening ecotoxicity values are derived to avoid underestimating risk. Requiring a cleanup based solely on Eco-SSL values would not be technically defensible. FIGURE 7.2: Procedure for Deriving Wildlife Toxicity Reference Values (From USEPA, 2003A)
152 July Scientific Issue: Compiling and Selecting Appropriate Toxicity Data The USEPA (2003a) derivation method relies on a data set compiled through a comprehensive search of the available scientific literature, as well as a rigorous evaluation process. Although the USEPA (2003a) approach represents a considerable investment of resources, the magnitude of the literature search, combined with the transparency of the data review process, provides confidence in the resulting TRV. The utility of the TRV is also enhanced by the fact that all available data (with a data evaluation score greater than 65) are used in the derivation process. Growth and reproduction data are used as the basis of the TRV, while data from other endpoints are used to select the specific means of calculating the TRV, as well as to provide necessary context. The current scope of the ECO-SSL process includes 17 metals and 5 organic compounds 39, including a substantial number of contaminants that currently have matrixbased soil standards in British Columbia. One potential limitation with respect to the available mammalian and avian toxicity data is the reliance on NOAEL and LOEAL-based reporting (see Section 7.4 for general discussion on the limitations of this approach). However, emphasizing point-estimate based TRVs (e.g., EC 20 ) for avian and mammalian toxicity data is unlikely to be practical. The majority of studies are limited in terms of the number of test concentrations and replicates available (i.e., chronic, long-term mammalian studies are costly to run), and therefore, data are typically insufficient to accurately estimate point-estimate values for the desired lower percentiles. 39 Metals (the term metals used to include metalloids such as As and Se) include: Al, Sb, As, Ba, Be, Cd, Cr, Co, Cu, Fe, Mn, Pb, Ni, Se, Ag, V, and Zn. Organics include: DDT and metabolites, dieldrin, pentachlorophenol, RDX, TNT and total PAHs.
153 July Recommendation Soil standards for the protection of small mammals and birds should be based on literature searches with a level of effort and data evaluation process consistent with that described in USEPA (2003a). Data sets for many contaminants that may require matrix standards for protection of small mammals and birds are already being prepared by the USEPA. Point-estimate test statistics (e.g., EC 20 ) are preferred over NOAEL and LOAELs; however, they are not generally available in the mammalian and avian toxicological literature. Instead, the no-observed adverse effect level (NOAEL) is the appropriate test statistic for calculating highly conservative soil standards for the protection of individual small mammals and birds. The lowest-observed adverse effect level (LOAEL) is the appropriate test statistic to protect populations of small mammals and birds. A Ministry decision regarding the desired level of protection is required. The decision flowchart regarding the specific method for calculating the wildlife TRVs (see Figure 7.2) is recommended for use with either NOAEL or LOAEL data (suitably modified). 8.3 Scientific Issue: Selecting Appropriate Receptors of Concern The selection of receptor groups (and representative surrogate species) by USEPA (2003a) incorporated the following considerations: Generalist species (e.g., species with variable diets such as raccoons, crows) were excluded from consideration. Aerial insectivores and piscivores were excluded because their dietary composition lacked a direct connection to terrestrial habitats. Surrogate species were generally smaller in size than other species in the receptor group in order to maximize food consumption rates (i.e., smaller organisms have higher metabolic rates and therefore consume more food on a body weight basis). These surrogate species were assumed to be protective of larger species within the same receptor group. The guiding principles listed above are reasonable and appropriate for deriving soil standards for the protection of small mammals and birds in British Columbia; however, the following additional principles are also recommended: Surrogate species should be native to British Columbia, and preferably, resident on a year-round basis. The surrogate species for mammalian ground insectivores (short-
154 July tailed shrew), mammalian ground herbivore (meadow vole), and avian granivore (mourning dove) are appropriate in this respect. However, the range of the avian insectivore surrogate species (American woodcock) is limited to the eastern United States and Canada (Alsop, 2001) and, therefore, a different surrogate species should be selected. Receptor groups should be limited to those groups that consume food items with a direct exposure pathway to soil (e.g., soil invertebrates and plants). Inclusion of higher trophic level receptor groups (e.g., carnivores) is not recommended since the calculations requires an additional level of assumptions (and thus uncertainty) regarding COPC bioaccumulation. Additionally, draft provincial screening-level ERA guidance requires a detailed ERA and/or site remediation if biomagnifying compounds are present (SAB, 2004), and therefore, soil standards would be inappropriate for those compounds. Recommendations The following receptor groups (and surrogate species) from the existing USEPA (2003a) guidance may be applicable to British Columbia: mammalian ground insectivores (shorttailed shrew); mammalian ground herbivore (meadow vole); and avian granivore (mourning dove). A different surrogate species for the avian insectivore receptor group is required. Potential candidates include black-billed magpie (Pica hudsonia) or ruffed grouse (Bonasa umbellus) based on dietary preferences (i.e., soil invertebrates) and habitat range that includes British Columbia. We recommend that the Ministry provide guidance on specific receptors to be included in the soil guideline backcalculation based on the guiding principles described above. Further discussion regarding the selection of specific receptors is required. Soil standards for the protection of small mammals and birds are not recommended for biomagnifying compounds 40 or higher trophic levels (e.g., carnivores). 8.4 Scientific Issue: Receptor Parameterization Selection of receptor parameters by USEPA (2003a) incorporated the following conservative assumptions: Surrogate species were assumed to reside and forage exclusively at the contaminated site, and therefore, habitat range was not incorporated. 40 This proposed exclusion includes biomagnifying compounds under consideration for ECO-SSL values, including DDT and organo-se. The proposed risk assessment guidance (SAB, 2004) explicitly requires assessment of biomagnifying compounds through an ecological risk assessment process.
155 July The bioavailability of the contaminant in soil and dietary items was assumed to be comparable to the bioavailability of the compound in the laboratory studies used to set the TRV 41. The diet of the surrogate species was simplified to a single food type (e.g., the avian insectivore was assumed to have a diet of 100% soil invertebrates). Estimates for other receptor parameters (e.g., body weight, food ingestion rates, soil ingestion rate) were based on conservative estimates (e.g., 90 th percentile). Recommendation The USEPA (2003a) assumptions for selecting receptor parameters are appropriate for use in deriving CSST soil standards for the protection of small mammals and birds, however, the Ministry should review receptor parameters with respect to the desired level of conservatism and level of protection. For example, the use of 90 th percentile parameters is considered to be highly conservative, while the use of median parameters is considered to be moderately conservative. 8.5 Scientific Issue: Allometric Scaling Allometric scaling refers to the process of estimating a value for a physiological parameter for a given species, based on the mathematical relationship between that parameter and a measure of body size determined for similar species. In wildlife toxicology, allometric scaling is used to estimate the following types of physiological parameters based on body weight: Food ingestion rates; and, Toxicity reference values. Allometric scaling relies on an underlying relationship between body weight and metabolic rate: smaller organisms have higher metabolic rates as a function of body weight. Toxicokinetic variables linked to metabolic rate (e.g., blood flow, renal clearance, respiration rate; metabolic half-life) also share an allometric relationship (Bachmann et al., 1996; Kirman et al., 2003; Savage et al., 2004). The relationship between field metabolic rate and body weight has been well-documented, and is consistently found to approximate a value of ¾ (Nagy et al., 1999; Savage et al., 2004). 41 Bioavailability of a compound in the laboratory studies used to set the TRV is maximized, since the dose under laboratory conditions is typically delivered via drinking water (e.g., metal salts dissolved in water), or food (e.g., an organic compound mixed with moist food using a carrier solvent).
156 July Other authors have argued that the scaling factor is closer to ⅔ (e.g., Dodds et al., 2001), however, these relationships were based on basal metabolic rates and earlier assumptions that metabolism was a function of surface area instead of body weight (Savage et al., 2004) Food Ingestion Rates Allometric scaling is used to predict wildlife food ingestion rates based on a species body weight. Standardized formulae for food ingestion rates (FIR) are available for different taxonomic groups (USEPA, 1993), including: All mammals: FIR (g/day) = BW (g); Rodents: FIR (g/day) = BW (g); All birds: FIR (g/day) = BW (g); and, Passerine birds: FIR (g/day) = BW (g). These food ingestion rates are calculated from the allometric relationship between body weight (BW) and field metabolic rates, and estimates of the metabolizable energy of various dietary items (e.g., in calories per gram of food) (from Nagy, 1987) needed to maintain field metabolic rates. The use of the allometric scaling models described above provides a very rough estimate of food ingestion rates for any given species (USEPA, 1993). USEPA (2003a) converted the models presented by Nagy (1987; updated with data provided by Nagy et al., 1999) to a form suitable for Monte Carlo probabilistic modeling, and generated a distribution of FIR values for each receptor species based on the distribution of species-specific body weight data from the literature. The 90 th percentile of the range of estimated FIR values was then used in the ECO-SSL calculation.
157 July Recommendation Allometric scaling based on a probabilistic distribution of a receptor s body weight is an appropriate method for generating conservative estimates of food ingestion rates for wildlife receptors. A Ministry decision regarding the desired level of protection in this soil standards is required to decide between 90 th percentile (highly conservative) and median (moderately conservative) body weight values. A detailed literature review for species-specific information on food ingestion rates should also be conducted for each receptor as a backcheck to the allometric scaling approach Toxicity Reference Values Allometric scaling is used to extrapolate a safe dose (R f D) for humans based on toxicological investigations involving non-human mammalian species (e.g., rats, mice, rabbits, dogs); allometric scaling for wildlife toxicity reference values (TRVs) between non-human mammalian species follows an identical approach. The ¾ scaling factor has been previously shown to adequately explains the variation in acute mammalian toxicity data sets (i.e., an empirical test of the utility of the allometric scaling approach) (e.g., Goddard and Krewski, 1992; Travis and White, 1988) and has since been adopted by USEPA (1999) for human health assessment, as well as wildlife toxicology (Sample et al., 1996). Sample et al. (1996) converted toxicity reference values (TRVs; expressed in terms of mg COPC/kg body weight/day) using the formula below and a scaling factor (i.e., b ) of ¾ : LOAEL W = LOAEL T bw bw T W 1-b There are limited and contradictory data regarding the selection of an appropriate scaling factor for avian species. Nagy et al. (1999) calculated a scaling factor of based on an analysis of field metabolic rates for 95 bird species, suggesting that an allometric scaling factor for avian toxicity data would in fact be appropriate. However, a single scaling factor for all birds may not be appropriate, given the likely differences in energy requirements for various avian species (e.g., passerine versus non-passerine). Additionally, an empirical examination of acute avian toxicity data (pesticides) failed to support the use of the ¾ or ⅔ scaling factors used for mammalian toxicity data; in fact, a scaling factor greater than 1 was proposed (Mineau et al., 1996). Consequently, no scaling factors were used for avian TRVs (Sample et al., 1996). Different approaches to allometric scaling of TRVs in guidance documents have been adopted:
158 July USEPA (2003a) does not use any scaling factors in deriving ECO-SSL values for the protection of small mammals and birds. A detailed rationale is not provided. USEPA Region 9/US Navy TRVs for screening-level wildlife ERA suggest that allometric scaling occur only if the difference in the body weight between the laboratory and wildlife species is greater than 2 orders of magnitude (DTSC, 2000). Sample et al. (1996) used a scaling factor of ¾ for mammals, and 1 for birds in screening-level ERA wildlife TRVs. These TRVs have been used to backcalculate preliminary soil remediation goals for Superfund sites (Efroymson et al., 1997). Reexamination of the ability of default scaling factors (e.g., 1, 0.75 and 0.66) to explain variations in acute toxicity data (Sample and Arenal, 1999) suggests that default scaling factors may not be appropriate in all instances. Sample and Arenal (1999) calculated a mean scaling factor of 0.94 ± 0.03 (range: to 1.69) for mammalian species based on a broader variety of compounds than previously examined. A mean scaling factor of 1.19 ± 0.05 (range: 1.16 to 3.09) was determined for avian species, which was consistent with the 1.2 scaling factor proposed by Mineau et al. (1996). However, the majority of compound-specific scaling factors were not statistically different than any of the existing default scaling factors (0.66, 0.75 or 1). Sample and Arenal (1999) concluded that the default scaling factors were appropriate for drug compounds (e.g., the data originally used to evaluate rodent-to-human scaling factors), but might not be applicable for all classes of compounds. Conversely, Kirman et al. (2003) used physiologically-based pharmacokinetic (PBPK) modeling, and demonstrated that the ¾ scaling factor was applicable over a broad range of compounds other than drugs 42. Recommendation Allometric scaling should not be used to extrapolate wildlife TRVs for the purposes of backcalculating conservative screening soil standards for the protection of small mammals and birds, due to the uncertainty in selecting an appropriate default scaling factor. However, allometric scaling may still be appropriate for detailed ERAs (where the uncertainty with respect to the resulting risk estimate can be discussed in detail). 42 Compounds tested by PBPK modeling by Kirnan et al. (2003) included benzene, carbon tetrachloride, chloroform, ethanol, ethylene oxide, methylene chloride, methylmercury, tetrachloroethene and vinyl chloride.
159 July Scientific Issue: Incorporating Bioavailability in the Derivation Protocol Differential bioavailability between laboratory and field exposures represents a source of uncertainty in the development of soil standards for the protection of small mammals and birds. Current practice assumes that the bioavailability of a COPC under all field conditions is equal to that of the COPC under the laboratory test conditions; however, this assumption is rarely true. After feeding Japanese quail different diets (one containing lead acetate, the other containing oysters grown in lead-containing seawater), Stone et al. (1981) concluded that biologically-incorporated lead was substantially less bioavailable than lead acetate. Multiple authors have also demonstrated that the bioavailability of soilbound COPCs in the digestive tract is lower than 100% (Ruby et al., 1996; Casteel et al., 1997). The bioavailability of a COPC under laboratory testing methods is also influenced by the dosing methods used to administer the COPC to the test organism. Dosing methods used in mammalian and avian toxicology include administration via diet, drinking water, or gavage 43. Spann et al. (1986) evaluated the effects of methylmercury on northern bobwhite (Colinus virginianus) using four different carrier solutions 44 to incorporate equal concentrations of methylmercury chloride into a moist diet fed to the birds, and found that the differences in bioavailability (and thus, toxicity) in different carrier compounds were substantially different, despite an ingested dose (mg/kg Hg in food) that was consistent across all four dosing methods. Several approaches to reduce the uncertainty associated with differential bioavailability of COPCs in the dietary exposure pathways (especially, differences in the bioavailability of ingested soil) are available, as described below In Vivo Laboratory Experiments Direct measurement of the bioavailability of soil-bound contaminants by administering contaminated soil to laboratory test organisms (e.g., rats, juvenile pigs) has been used successfully (e.g., Casteel et al., 1997). However, this level of investigation requires considerable investment of project resources and specialized testing facilities In Vitro Digestion Models for Soil In lieu of in vivo laboratory experiments, multiple in vitro digestion models have been developed to simulate bioavailability in the digestive system. After ingestion, soil-bound 43 Gavage refers to force-feeding the COPC (typically in a carrier solution such as corn oil) via syringe. 44 Carriers included: powdered methylmercury chloride (MeHgCl) mixed directly into the diet; MeHgCl dissolved in corn oil; MeHgCl dissolved in acetone and then into propylene glycol; or MeHgCl dissolved in acetone only. All four carrier methods are common in mammalian and avian toxicology.
160 July contaminants are partially released into digestive juices (and are thus available for absorption across the intestinal wall). Measurement of the COPC concentration in the digestive juices provides a more realistic estimate of the bioavailable fraction than measurement of the total COPC concentration in the soil. In vitro models simulate the physical and chemical activity of the multistage digestion process to varying degrees of complexity, including: Variations in ph in different digestive compartments 45 ; Temperature of different digestive compartments; Addition of gastric secretions (e.g., bile); Volume of digestive fluids; Physical mixing of compartment contents (e.g., stirring, rotation, or peristaltic action); and, Incubation time. Numerous digestion models are available, including models proposed in the literature (e.g., Ruby et al., 1996; Oomen et al., 2003), as well as models designed by regulatory agencies 46. These models have been validated through comparison of in vitro results to those obtained by in vivo approaches (i.e., dosing of juvenile swine with soil from the area under investigation), although this level of validation is typically limited to metals such as arsenic, cadmium and lead (Schroder et al., 2004; Ellickson et al., 2001; Ruby et al., 1996). Researchers have also applied in vitro digestive models (without in vivo validation) to examine the bioavailability of other contaminants in soil, including Pu et al., 2004 (phenanthrene); Ruby et al., 2002 (dioxins and furans); Holman et al., 2002 (petroleum hydrocarbons); Oomen et al., 2000 (lindane, PCBs); and Hack and Selenka, 1996 (PAHs and PCBs) Measurement of Relative Bioavailability Using In Vitro Models Although the in vitro digestion models described above were designed primarily to assess bioavailability of soil for human health risk assessments, the general principles are also 45 Digestive compartments include: oral cavity, stomach and intestine (some models further subdivide the intestinal compartment). 46 A summary of five different models used in the UK, Germany, Netherlands (two models) and Belgium is provided in Oomen et al. (2002).
161 July being applied for wildlife risk assessments. (Mississauga, ON) is currently using an in vitro digestion model to determine the relative bioavailability between: a) COPC dosing methods used in the original laboratory mammalian toxicity study that forms the basis of a given wildlife TRV, and, b) COPC concentrations in soil from a contaminated site. This approach has advantages compared to the traditional application of in vitro digestion models in that validation with in vivo studies is not required. It also addresses the differential bioavailability between laboratory and field-based exposures, in that the bioavailability of a COPC under the dosing conditions used in the original laboratory investigation is compared to the bioavailability of the COPC in soil using an identical in vitro model. This approach has been accepted by regulatory agencies in Ontario for metals and PAHs; work continues for other COPCs including PCBs and dioxins (M. Dutton, Ltd., pers. comm). Extension of this approach to examine the relative bioavailability of COPCs in dietary items (e.g., soil invertebrates and plants) is also possible Application of In Vitro Digestion Models to Soil Standard Development Data from in vitro digestion models could be used to increase the relevance of standards involving ingestion of soil, provided that a conservative, standardized value for the relative bioavailability of each COPC in soil could be determined. However, bioavailability of a COPC appears to be highly site specific, and influenced by the in vitro digestion model selected. Oomen et al., (2002) found that the bioavailability of COPCs in a round-robin experiment involving five different in vitro digestion models was highly variable: Arsenic bioavailability ranged from 6-95%, 1-19%, and 10-59% for three different contaminated soils, respectively. Cadmium bioavailability ranged from 7-92%, 5-92%, and 6-99% for three different contaminated soils, respectively. Lead bioavailability ranged from 4-91%, 1-56%, and 3-90% for three different contaminated soils, respectively. Although the selection of a standardized in vitro digestion model would reduce the variability in the estimated soil bioavailability, the differences in bioavailability between samples from different areas would still remain. Determination of a single conservative
162 July soil bioavailability fraction for standard derivation purposes is unlikely 47. Modifications to existing in vitro digestion models to more closely simulate small mammal and bird digestive processes (rather than humans) would also need to be considered (e.g., simulated gizzards for birds; Levengood and Skowron, 2001). Recommendation Conservative soil standards for protection of small mammals and birds should continue to assume 100% bioavailability given the absence of a transparent, reproducible and defensible method to account for differential bioavailability. 8.7 Linkages Between Proposed Soil Standards and Ecological Risk Assessment Development of soil standards for the protection of small mammals and birds is not intended as a replacement for a properly-conducted ecological risk assessment, although the food chain model used to back-calculate a protective soil standard shares many similarities with food chain models used in a detailed ERA. These food chain models have a subtle yet highly significant difference in their intended application, as follows: The food chain model for back-calculating a soil standard is intended only to identify those sites where risks to small mammals and birds are clearly negligible, and therefore, do not require a detailed assessment. It does not provide a quantitative risk estimate, and by design, is highly conservative. The food chain model used in an ERA is intended to quantify the magnitude of potential risks to small mammals and birds. By design, food chain models for this application should maximize their ecological relevance to reduce the likelihood of generating unrealistically high estimates. The appropriate balance between conservatism and ecological relevance is a source of considerable debate in the literature when food chain models are used in risk assessments at contaminated sites. Food chain models used for ERA purposes typically contain numerous default conservative assumptions (each intended to compensate for areas of uncertainty) that contribute to unrealistic risk estimates (McDonald and Wilcockson, 2003). These food chain models tend to predict adverse biological effects (i.e., generate hazard quotient values) that prove to be unrealistically large or toxicologically impossible 47 As an example, consider the differences in bioavailability at sites impacted by lead from different potential sources such as sandblasting grit, ore extraction, application of lead-based paint, leaded gasoline, and lead shot. All five sites would share the same COPC, but likely have very different gastrointestinal bioavailability.
163 July (Tannenbaum et al., 2003). Predicted effects from a food chain model are rarely confirmed with field-based measurements (Tannenbaum, 2003). Sites with high hazard quotients are described as having a healthy and thriving ecology; the role that habitat plays in determining species assemblages at a site is ignored (Tannenbaum, 2005). Despite the differences in the intended application, the challenges associated with balancing conservatism and ecological realism must be considered with respect to using a food chain model to backcalculate protective soil standards. The use of appropriately conservative assumptions and parameters is paramount, and will likely require policy decisions regarding the desired level of conservatism. Also, the context of the soil standards needs to be clearly communicated. Exceeding a soil standard for protection of small mammals and birds at any given site does not indicate that adverse biological effects are in fact occurring; it simply indicates that the potential for risks cannot be excluded based on the available data. Therefore, further assessment using a properly conducted risk assessment (where food chain modelling is not the only line of evidence) is required. Recommendation Regulatory decisions regarding the desired level of protection for small mammals and birds are required in order to set an appropriate level of conservatism in the food chain model. If the decision is that the standard should protect populations of organisms, then it is appropriate to use less conservative assumptions such as LOAEL-based TRVs; median BAFs; median body weight; and median ingestion rates. If the decision is to protect individual organisms, then more conservative assumptions should be used, such as NOAEL-based TRVs and upper estimates of BAFs, body weight and ingestion rates.
164 July Summary of Proposed Derivation Methodology Recommendations The following derivation methodology is proposed, based on the scientific review described above and ensuing recommendations: Identify appropriate toxicity reference values for birds and mammals based on a comprehensive literature review and screening process. Data from existing compilations may be appropriate for use. Allometric scaling to adjust this TRV is not recommended. Determine relevant surrogate species for the desired receptor groups. Prepare conservative estimates of food and soil ingestion rates for the selected surrogate species. Food and soil ingestion rates may be derived using allometric scaling (preferably, within a probabilistic approach). Backcalculate protective soil standards using a mechanistic food chain model, assuming that there are no differences in bioavailability between soil versus food or laboratory versus field exposures. Additional safety factors in this backcalculation are not recommended given the conservatism already present in the model (i.e., 100% bioavailability).
165 July ENVIROMENTAL PROTECTION: GROUNDWATER FLOW TO SURFACE WATER USED BY AQUATIC LIFE Consideration of potential changes as a result of this review to the numerical soil standards for the protection of groundwater flow to surface water used by aquatic life can be divided into the following two conceptual categories: Potential changes to the groundwater models, which are used to backcalculate a protective soil standard from an appropriate ambient water quality guideline (WQG). Potential changes to the ambient WQG derivation protocols that would influence the backcalculation of the numerical soil standard. 9.1 Groundwater Models The groundwater models are independent of the WQG selected as the basis of the backcalculation. 9.2 Ambient Water Quality Guideline Values Our review included consideration of the potential implications of proposed changes in the existing CCME WQG derivation process. At present, the preferred method for deriving a CCME WQG involves selection of the lowest available and appropriate lowest observed effect concentration (LOEC) divided by a safety factor of 10 (i.e., similar to the single toxicity data value (and uncertainty factor) approach described in Section A new methodology for deriving WQGs is currently under development by Environment Canada. This methodology will likely involve the use of species sensitivity distributions 48 (see Section 7.6.1) however; several technical issues have not yet been resolved, including: The definition of the WQG (e.g., the HC 5 or the lower 95 th percentile of the HC 5 ). The appropriate mathematical models to be applied to the data distribution. The minimum data requirements (e.g., how many individual taxa and/or taxonomic groups are required). The number of distributions required (e.g., separate acute and chronic distributions; separate distributions for different taxonomic groups). 48 A species sensitivity approach was used by industry representatives to propose a draft Canadian WQG for alcohol ethoxylates (Belanger and Dorn, 2004). The regulatory status of the alcohol ethoxylate WQG was not known at the time this report was prepared.
166 July The preferred toxicological endpoint used in the distribution (e.g., NOEC; LOEC; EC 20 ). The integration of toxicity modifying factors (e.g., hardness, ph) within the species sensitivity distribution approach. A biotic ligand model (for selected metals) is one potential approach being considered as a method for normalizing toxicity data. The absence of a revised CCME derivation methodology at this time prevents a detailed review of its potential implications on the backcalculation of numerical soil standards for the protection of groundwater flow to surface water used by aquatic life. We cannot predict whether a SSD approach for WQG derivation would tend to result in lower or higher WQGs than the existing CCME approach. Regardless, our understanding is that an immediate recalculation of all existing CCME WQGs in the event that a SSD approach is approved is not contemplated. Existing CCME WQG based on the lowest LOEC divided by a safety factor would remain in effect until each WQG is reviewed in the normal course of events.
167 July LIVESTOCK INGESTING SOIL AND FODDER 10.1 Review of Selected Derivation Protocols Both CCME (2005) and BCE (1996) share a similar approach in that they backcalculate a protective soil standard for livestock 49 ingesting soil and fodder using a simplified food chain model approach that accounts for the daily dose ingested via soil, plus the daily dose ingested from fodder (estimated from soil concentrations using a bioaccumulation factor). There are subtle differences, however, in how the models are constructed and applied Scientific Issue: Parameterization of Food Chain Model CCME (2005) and BCE (1996) have subtle differences in terms of the parameterization of their respective simplified food chain models Apportionment CCME (2005) allocates a percentage of the allowable dose to different exposure pathways through the use of apportionment factors. CCME (2005) assumes that: Water consumption contributes 20% of an animal s daily intake (based on the assumption used in human health risk assessment). Dermal absorption and inhalation is thought to be a relatively minor exposure pathway, and therefore, was assumed to contribute 5% of an animal s daily intake. Soil and food ingestion contributes the remaining 75% of an animal s daily intake. As a result, CCME (2005) backcalculates the soil concentration that results in an ingested daily dose equal to 75% of the applicable TRV. Conversely, BCE (1996) does not include apportionment in its derivation approach, and backcalculates the soil concentration that results in an ingested daily dose equal to 100% of the applicable TRV. BCE (1996) notes that this modified approach was adopted because the CCME procedure was considered too complex and too dependent on default assumptions of questionable scientific veracity. 49 Herbivore checks for the CSST protocol described in this chapter also includes livestock species other than cattle, such as chicken, lamb, pigs, and duck.
168 July We agree that the assumptions regarding dose apportionment in CCME (2005) are not well supported by relevant scientific data 50 ; however, the underlying need for apportionment factors remains relevant dependent on the method used to calculate protective standards for livestock drinking water. CCME (2005) calculates soil quality guidelines for protection of livestock watering using a groundwater transport model, and WQG for the protection of agricultural water uses (CCME, 1999b). These WQG are based on the total tolerable daily intake (TDI), plus safety factors and the underlying assumption that water consumption consists of 20% of the daily intake. Apportionment is necessary for CCME (2005) since otherwise, livestock would have the potential to ingest more than the allowable daily intake (i.e., livestock could receive their TDI from soil and fodder ingestion, and receive an additional TDI from water consumption). We note that CCME (1999b) includes a safety factor, which may be overly conservative when combined with the apportionment approach. The specific method used to calculate soil standards for the protection of livestock watering is not provided in BCE (1996), and therefore, it is not possible to examine in detail the use of apportionment in the BCE (1996) methodology. Additional guidance with respect to the CSST methodology is available from internal memorandum (BCMELP 1995, 2000a,b). Further examination of the BCE (1996) approach to calculating soil standards for the protection of livestock watering and, standards for the protection of ingestion of soil and fodder, may be justified, depending on the implications of proposed changes to the groundwater model, as well as policy decisions regarding the desired level of protection for livestock in general (rather than on a pathway-by-pathway basis). Recommendation Incorporation of an apportionment factor in the calculation of soil standards for protection of livestock ingesting soil and fodder may be appropriate, depending on the level of desired protection for livestock and existing safety factors incorporated into the BCE (1996) approach. Further examination of the existing BCE (1996) approach was not possible based on the available documentation. 50 The water apportionment factor in CCME (2005) is based on humans, not livestock; the inhalation/ dermal absorption apportionment factor does not appear to be based on any measured data.
169 July Receptor Parameters Differences in the specific parameters used in the simplified food chain models by CCME (2005) and BCE (1996) were also observed. These differences are summarized in Table 10.1 and discussed below: Body weight: CCME (2005) recommends a standardized cattle body weight of 550 kg, based on the approach adopted in the Canada-wide Standards for Petroleum Hydrocarbons (CCME, 2000). BCE (1996) uses a standardized cattle body weight of 600 kg, which is cited as a default value without a specific reference. Both body weights fall within the range for dairy cattle ( kg) provided in CCME (1999b). Food ingestion rate: We were unable to verify that the formula provided in BCE (1996) resulted in a food ingestion rate of 13.5 kg/day based on a body weight of 600 kg; however, the stated food ingestion rate of 13.5 kg is similar to that calculated by the formula provided in CCME (2005). Soil ingestion rate: Methods used to calculate the soil ingestion rate are identical between CCME (2005) and BCE (1996). TABLE 10.1: Differences in Parameterization for Cattle CCME (2005) BCE (1996) Body weight (kg) Food ingestion rate (kg/day) Soil ingestion rate (kg/day) x BW ; results in estimate of 12.3 kg/day x BW ; but formula does not result in 13.5 kg/day as stated in BCE, x total dry matter intake rate x total dry matter intake rate Recommendation Future updates to the CSST protocol should use the same default body weight and food ingestion rates as CCME (2005).
170 July Scientific Issue: Soil-to-Plant Bioaccumulation Factors CCME (2005) suggests that bioaccumulation factors (BAFs) for soil-to-plant should be developed based on the geometric mean of the available and appropriate literature data. BAFs should preferably be based on field data instead of laboratory-based data, although it is permissible to estimate BAFs based on chemical properties (e.g., K ow ) in the absence of measured values. BCE (1996) uses BAFs from a single literature source (ORNL, 1984). ORNL (1984) generated two different BAFs in order to model the movement of radionuclides from soil to leafy vegetation (B V ), and from soil to reproductive vegetation (B R ) (e.g., grains) throughout the continental United States. These country-wide estimates of B V and B R include an inherent weighting of the available literature data according to the relative importance of the crop to US agricultural output. Consequently, although ORNL (1984) provides a systematic summary of BAFs for all metals and metalloids, it is unclear as to the extent to which its intended application may have influenced its derivation method. Regardless of the potential limitations of ORNL (1984), an update of the soil-to-plant BAFs used in the CSST derivation process is justified, given the availability of reputable compilations of soil-to-plant BAFs, including other publications from the Oak Ridge National Laboratory (Efroymson et al., 2001), and the ECO-SSL guidance document (USEPA, 2003a). Recommendation Soil-to-plant BAFs should be reviewed and updated as necessary Scientific Issue: Updates in Available Toxicity Data The livestock TRVs used in the existing CSST derivation method (BCE, 1996) was based on Puls (1994). We were unable to identify other compilations of relevant livestock toxicity data published subsequent to Puls (1994); additionally, our literature search indicates that the Puls compilation (with various printing dates of the 2 nd edition) continues to be widely cited as a source of TRVs. However, our understanding is that a new publication entitled Minerals and Toxic Substances in Diets and Water for Animals is currently being prepared by the US National Academy of Sciences (NAS, 2005). The scope of this report is described as:
171 July The report will address recent research on tolerance and toxicity of minerals in animal diets including the following areas: general considerations; mineral sources, discrepancies and difficulties in methods of analyses and evaluation of biological status; metabolic mineral interactions; assessments of form and species interactions; supplementation considerations; bioavailability of different mineral forms and sources; maximal tolerable levels; effects of diet composition, stressors, and animal physiological status on mineral utilization; and environmental exposure considerations. The report will include all species for which adequate information is available--updating the previous report, greatly expanding the topics covered, and increasing the usefulness of the report. Recommendations will be provided on maximum tolerable and toxic dietary levels of minerals in animal diets. Potential for toxic exposure, toxicosis, factors affecting toxicity, and essentiality of dietary minerals in various animal species will be discussed. (NAS, 2005). NAS (2005) should be reviewed to determine if livestock TRVs reported by Puls (1994) require modification. The anticipated publication date for NAS (2005) is July 2005 (A. Lewis, NAS, pers. comm.). Recommendation Livestock TRVs should be reviewed and updated as necessary.
172 July MATRIX PATHWAYS NOT REVIEWED The following matrix pathways were not included within the scope of this scientific review due to the requirement to allocate limited project resources to address highpriority issues (as described in Section 1.1). A brief summary of each pathway excluded from the detailed scientific review is provided below: Major microbial function: BCE (1996) recommends inclusion of a soil standard for the protection of major microbial function for agricultural land uses only. This soil standard is adopted directly from CCME without modification, and therefore, it was not necessary to review differences in protocol derivation. Groundwater used for irrigation watering: BCE (1996) does not provide a detailed description of derivation methods used to develop soil standards for the protection of groundwater used for irrigation watering, and therefore, it was not possible to review specific differences in protocol derivation. CCME (2005) backcalculates a protective soil standard from a water quality guideline to prevent phytotoxicity, and therefore we anticipate that any modification to the groundwater models will be equally applicable to this pathway. Groundwater used for livestock watering: BCE (1996) does not provide a detailed description of derivation methods used to develop soil standards for the protection of groundwater used for livestock watering, and therefore, it was not possible to review specific differences in protocol derivation. The potential interaction of this exposure pathway with the methods used to derive soil standards for the protection of livestock ingesting soil and fodder was described in Section Additionally, CCME (2005) backcalculates a protective soil standard from a water quality guideline for livestock watering and, therefore, we anticipate that any modification to the groundwater models will be equally applicable to this pathway.
173 July HIGH DENSITY URBAN RESIDENTIAL LAND USE 12.1 Land Use Scenario Conceptually, a High-Density Urban Residential (HDUR) site is assumed to consist primarily of a multi-storey building with underground parking (i.e., apartments, condominiums 51 ) located in areas without natural vegetation or exposed soil. Surrounding areas are assumed to be primarily paved and vegetation, if present at the site, is assumed to be actively managed (e.g., ornamental plants and/or landscaping) and growing on imported topsoil. Examples of areas that would fall into this category are Pacific Place and east False Creek area. Consultation with CCME indicated that a HDUR land use scenario was not being considered for future guideline development (J. Vigano, pers. Comm., January 2005). Based on a further review of jurisdictions outside of Canada, ANZECC (Australia and New Zealand Environment and Conservation Council) was identified as the only jurisdiction that had adopted an HDUR-like land use for developing soil guidelines. ANZECC (NEPM 1999a,b) refer to this land use as Residential D and define it as follows: residential setting with minimal opportunity for soil access, including dwellings with fully and permanently paved yard space such as high-rise apartments and flats. The definition of a HDUR scenario is important as it links back to the potentially operable pathways for that scenario. For example, if a HDUR site is assumed to consist of multi-family dwellings with little to no soil access due to paving or ground cover, some of the human and ecological exposure pathways could be excluded (e.g., human health soil intake pathway and ecological protection of soil invertebrates and plants). Further, if the HDUR scenario includes at least one level of underground parking, it is considered appropriate to apply residential exposure assumptions but indoor vapour concentrations representative of a commercial scenario, since there would be significant ventilation of vapours migrating into the building for this scenario. We note that when there is at least one level of parking or separation between soil and residential dwellings, conceptually the HDUR scenario is similar to the live-work scenario, where there is commercial use of the first floor, and where currently, the CSR commercial land use soil standards would apply (both the exposure assumptions and the indoor vapour concentrations are based on the commercial scenario). Ministry input will be required to define the HDUR scenario. However, the following sections will outline some of the options and their implications for development of soil standards for human and ecological receptors in a HDUR setting. 51 We assume that townhomes or other multifamily dwellings with yard space are considered residential, not high-density urban residential.
174 July Application to Human Health Matrix Standards ANZECC Approach The high density residential scenario defined by ANZECC (NEPM 1999a,b) only considers protection of human health and not protection of ecological receptors. Default exposure ratios were derived by NEPM (1999b) to account for differences in exposure between the typical residential scenario and the high density residential scenario. The default exposure ratios were developed by assigning a multiplication factor to each land use to take into account expected differences in levels of exposure relative to the typical residential scenario. According to NEPM (1999b), default exposure ratios were assigned based on professional judgment about what is likely to be protective of human health. In the case of the high density residential scenario, it was assumed that ingestion of contaminated soil or dust from on-site sources would be reduced by a factor of at least four; giving rise to a default exposure ratio of 0.25 for the high density residential scenario. For example, a lead guideline of 300 mg/kg for the typical residential scenario would result in a lead guideline of 1,200 mg/kg for the high density scenario. Given that this default exposure ratio was unsubstantiated, and not scientifically based, we do not consider it an appropriate approach for CSST to pursue Develop Quantitative Exposure Factors Approach Another approach considered was to develop a unique exposure scenario for HDUR sites. For example, the amount of time a child spends outside playing at a high rise complex may be considerably less than the time that would be spent playing in their own backyard. The US EPA (2002b) Child Specific Exposure Factors Handbook was consulted to determine whether there was information related to the amount of time a child would spend playing outdoors in one s own backyard versus a common green space associated with a high rise complex. Information of this nature was not available through the US EPA, Canada Mortgage and Housing Corporation, or other sources consulted (Richardson 1997, AIHC 1994). Statistics Canada was also consulted but a response was not received prior to finalization of this report. Without scientific justification to support a reduced or different exposure time for children that live in a HDUR setting, developing numerical soil guidelines for the soil intake pathway that differ from the residential scenario would not be justifiable and therefore, is not recommended at this time. One potential source of information that could be investigated further is the Pest Management Regulatory Agency (PMRA). The PMRA is jointly conducting a risk assessment with the US EPA on chromated copper arsenate (CCA) treated wood used on playgrounds and decks (Zartarian et. al., 2003). A preliminary risk assessment document was released in November 2003 ( and a finalized risk assessment is expected to be completed in The study uses data
175 July compiled by the US EPA from various American surveys compiled into CHAD (Consolidated Human Activity Database). The primary population of interest for the assessment was children in the United States who frequent public playsets (e.g., at a playground, a school, a daycare centre) and residential playsets. The results from both groups of children (those who contact public playsets only and those who contact public and residential playsets) are presented in the report Qualitative Exposure Pathway Approach A potential alternative to developing unique numerical soil standards for the human health exposure pathways for the HDUR scenario would be to define the HDUR scenario such that the existing land use scenarios under the CSR would apply. The typical HDUR scenario that is encountered involves multi-storey buildings (i.e., condominiums) with underground parking located in areas without natural vegetation or exposed soil. Surrounding areas are assumed to be paved (i.e., hard surfaces ) and vegetation, if present at the site, is assumed to be actively managed (e.g., ornamental plants and/or landscaping) and growing on imported topsoil. Based on the above, the exposure would be considered similar to the commercial scenario. For the indoor inhalation of volatiles, a hybrid residential/commercial soil standard unique to the HDUR land use scenario would need to be developed. The hybrid inhalation soil standard would be based on the receptor characteristics and exposure time for a residential scenario but the indoor air concentration assumed for a commercial building. Table 12.1 shows the pathways and the proposed land use standards that would apply under a HDUR scenario using this approach Application to Environmental Matrix Standards We envision that the HDUR land use scenario will be similar to the existing commercial land use with respect to the existing environmental matrix standards (Schedule 5 of CSR). For example, both Commercial and HDUR sites are largely covered by impervious surfaces (e.g., parking lots, building structures), and will tend to be located near urbanized areas. Therefore, we recommend applying the commercial land use standards to the HDUR scenario for the protection of ecological receptors. The SRA-1 guidance in terms of screening commercial sites is also applicable to this land use. We anticipate that toxicity to soil invertebrates and plants, and toxicity to small mammals and birds pathways would tend to screen out HDUR properties during the SRA-1 ecological exposure questionnaire based on the consideration of undeveloped land on the
176 July site (see SAB, 2004). Matrix standards unique to the agricultural land use 52 are not considered relevant for this land use Proposed Land Use Standards The HDUR scenario identified as the preferred option considering the information available is defined as follows: 1. Multi-storey building with minimum one-level underground parking below building (i.e., condominium, apartment). 2. Surrounding areas are either paved (i.e., hard) surfaces or small landscaped areas without natural vegetation. 3. Landscaped areas are actively managed (e.g., ornamental plants) and covered with imported topsoil. 4. There are no grass playing fields or play grounds. Based on the above definition, the commercial standards are considered applicable. The only exception is the proposed new indoor inhalation soil standards which would be derived based on a hybrid of the residential/commercial land use assumptions (residential exposure assumptions for indoor vapour concentrations based on commercial vapour intrusion assumptions). If further refinement of the HDUR scenario is required, further efforts should be focused on obtaining realistic estimates of the exposure time for children playing outdoors in a playground/greenspace in a HDUR setting where there is exposed soil. Adopting the commercial land use standards for the HDUR scenario scenario would result in a significant change (i.e. increase) in the applicable standards as previously the residential land use standards would have been applicable. Table 12.1 shows the proposed land use standards selected for human health and ecological exposure pathways for the HDUR scenario. 52 Protection of microbial function; livestock ingesting soil and fodder; groundwater used for irrigation; groundwater used for livestock watering.
177 July TABLE 12.1: Summary of Land Use Standards Proposed for the HDUR Scenario Exposure Pathway Definition HH Intake of Soil HH Indoor Inhalation ECO Plants, Inverts Proposed Land Use Standard Multi-storey building, minimum one-level underground parking below building, paved surfaces or small landscaped areas. Commercial Hybrid Residential/ Commercial Commercial 1. The soil standards protective of groundwater used for drinking water and protection of aquatic life are the same regardless of land use, and are therefore not included in the table. Recommendations Consideration should be given to incorporating a HDUR scenario in the protocol since there are substantial and definable differences in this exposure scenario compared to conventional residential land use. The HDUR scenario identified as the preferred option is defined as consisting of a multi-storey building with minimum one level of underground parking below the building, and either paved surfaces or small landscaped areas, covered with imported topsoil, beside building. Based on the above definition, the commercial standard would apply to the different human health and ecological exposure pathways with the exception of the inhalation pathway (see Table 12.1). Adopting the commercial land use standards for the HDUR scenario would result in a significant change (i.e. increase) in the applicable standards as previously the residential land use standards would have been applicable. If further refinement of this scenario is required, further efforts should be focused on obtaining realistic estimates of the exposure time for children playing outdoors in a playground/greenspace in a HDUR setting where there is exposed soil. Consideration should be given to development of a hybrid HDUR standard for soil vapour intrusion that assumes a residential receptor, and indoor air concentration predicted for a commercial scenario.
178 July WILDLANDS LAND USE 13.1 Land Use Scenario Conceptually, the Wildlands land use is envisioned to be similar to the existing Urban Park land use although, potentially, with a different level of protection to reflect that urbanized park areas do not support the same level of ecological function as wild areas by virtue of their proximity to anthropogenic influences. We envision that the Wildlands land use would apply to all areas not already covered by one of the other land use categories. A partial list of defined Wildlands land uses is included in the existing urban park land use definition, as follows: the use of urban land for the primary purpose of outdoor recreation, including but does not mean wildlands such as ecological reserves, national or provincial parks, protected wetlands or woodlands, native forests, tundra or alpine meadows 53. Examples of additional biological factors that may be relevant for defining the Wildlands land use include: Ability of the area to support populations of small mammals and birds. The SRA-1 terrestrial habitat screening process includes several relevant factors such as distance to sensitive habitats; connectivity to other undeveloped areas; size of the area in question; and shape of the area in question (SAB, 2004). We envision that designation of the Wildlands land use could be based on these considerations, which would effectively limit Wildlands areas to those areas that do not contain significant anthropogenic influences in close proximity. The degree to which vegetation on the site is actively managed. We envision that wildlands would have negligible vegetation management, whereas urban parks are actively managed (e.g., playing field upkeep, ornamental planting, tree trimming, brush removal, path maintenance, etc). The existing CCME (2005) residential/parkland land use specifies that both ornamental and native vegetation should be maintained the new Wildlands land use would address only native (and natural) vegetation, while the existing Urban Park land use would address ornamental (or managed) vegetation. Specification that the Wildlands land use is only applicable to native vegetation would assist in excluding managed areas that are more appropriately designated as Urban Park. 53 There are virtually no toxicity data available for representative soil invertebrate and plant species from tundra or alpine meadow environments. Extrapolation of existing toxicity data to these environments is uncertain due to unknown influences of different soil types and seasonal effects, as well as evolutionary changes in native species that may have resulted.
179 July The degree to which the site has been subjected to historical or wide-area impacts. How should one classify reclaimed mining areas (or other reclaimed industrial lands) that are surrounded by wild areas and support substantial wildlife populations? We envision that areas that have been subject to broad historical impacts but are no longer active industrial sites would be classified as wildlands. Specific areas surrounding the former industrial site (e.g., abandoned structures; waste rock dumps; former fuel storage locations; former roads and railways) would be classified as Industrial under this scenario; however, this classification may also require consideration of the length of time involved, as well as the desired future land use. A summary of matrix standards considered applicable to the proposed Wildlands land use is provided in Figure We anticipate that this definition and selection of applicable matrix standards will require policy decisions in order to reconcile the Wildlands land use with other existing land uses. The following questions were identified for consideration by policy makers based on our review of which matrix standards would be applicable to the proposed Wildlands land use: How should one classify park areas that are in proximity to urbanized areas, are intended to protect a natural ecosystem, but have not formally been designated as ecological reserves? How should one classify natural forested areas surrounding a residential dwelling or commercial structure (e.g., a small building on an otherwise undeveloped 5 acre lot)? How should one classify natural forested areas that are managed for timber harvesting? Are there instances where groundwater wells located on Wildlands are used to draw water from crop irrigation and livestock watering? We assume that the use of any area for livestock or crops means that it would be classified as Agricultural Application to Human Health Matrix Standards The Wildlands land use primary function would be to protect wildlife. However, considering that Wildlands includes areas such as provincial parks and forestry camp sites where the general public may hike or camp, human receptors also need to be considered, but are not likely to be the risk drivers. We envision that under a Wildlands type scenario, human receptor use would include overnight camping, ranging from 2 weeks up to 2 months, but not year round occupancy. The residential/urban park soil standards were not considered suitable as the assumptions were overly conservative for human receptor use in a Wildlands scenario (i.e., toddler
180 July spending 100% of their time in the area). The commercial land use soil standards also tend to over estimate exposure for human receptors in a Wildlands type scenario (i.e., 5 days/week, 48 weeks/year), but are more realistic than the residential/urban standards, especially if the child receptor is adopted as the sensitive receptor for the commercial scenario (see Section 3.0). Deriving a new land use scenario for human receptors in a Wildlands scenario is not considered warranted given that risks to ecological receptors will be the risk drivers. Based on the above, we recommend adopting the commercial land use standard for the Wildlands scenario. The applicable pathways for human receptors under the Wildlands scenario are listed below: Intake of contaminated soil (soil ingestion, dermal contact and dust inhalation); and, Groundwater used for drinking water. The inhalation of volatiles in indoor air was not considered applicable to this land use as human exposure is primarily anticipated to be via outdoor exposure Application to Environmental Matrix Standards The Wildlands land use supports the broadest range of potential ecological receptors and, therefore, also has the greatest number of relevant matrix standards, including: Toxicity to soil invertebrates and plants; Toxicity to small mammals and birds; and, Groundwater flow to surface water used by aquatic life. Existing policy restricts protection of microbial function to agricultural land uses only and, therefore, it was not included in the list of relevant matrix standards for the proposed Wildlands land use. Our opinion is that the existing level of protection afforded to Urban Park locations is likely adequate for the Wildlands land use (e.g., an EC 20 -based approach for soil invertebrates and plants; a LOAEL-based approach to protect populations of small mammals and birds), however, we caution that formal research into the field-based validation of these theoretical levels of protection has not been conducted.
181 July FIGURE 13.1: Summary of Matrix Standards Applicable to Wildlands Human Health Exposure Pathway Intake of contaminated soil Groundwater used for drinking water Vapour inhalation Ecological Toxicity to soil invertebrates and plants Groundwater flow to surface water used by aquatic life Toxicity to small mammals and birds Livestock ingesting soil and fodder Major microbial function Groundwater used for livestock watering Groundwater used for irrigation watering Proposed Approach Pathway is applicable. No additional changes (beyond those recommended for other land uses) for application to Wildlands Pathway is applicable. No additional changes (beyond those recommended for other land uses) for application to Wildlands Pathway is not applicable. Pathway is applicable. Recommended modifications are described in Section 7. Pathway is applicable. Recommended modifications are described in Section 9. Pathway is applicable. Recommended derivation methodology is described in Section 8. Pathway is potentially applicable. No modifications to existing derivation methodology is contemplated. Pathway is not applicable. Pathway is potentially applicable. No modifications to existing derivation methodology is contemplated. Pathway is potentially applicable. No modifications to existing derivation methodology is contemplated.
182
183 July REFERENCES 15.1 Groundwater Model (Section 2.0) American Petroleum Institute., 1996, Estimation of Infiltration and Recharge for Environmental Site Assessment, Stephens & Associates, API Publication Battelle Memorial Institute Chemical databases for the multimedia environmental pollutant assessment system (MEPAS): Version I. Prepared for the US Department of Energy under Contract DE-AC06-76RKI 1830 by Pacific Northwest Laboratory, operated by Battelle Memorial Institute. BCE (British Columbia Environment) Overview of CSST procedures for the derivation of soil quality matrix standards for contaminated sites. Prepared by Risk Assessment Unit, Environmental Protection Department, BC Environment. January 31, Includes CSST Policy Decision Summary and CSST Record of Response to Major Results and Recommendations Forthcoming from Eco- Workshop. Contaminated Sites Soil Taskgroup. October 20, Bright, D.A. and Telmer, K.D A Review of Soil-Water Partitioning Behaviour of Inorganic Mercury Species and Relevance for the Establishment of Generic Environmental Quality Benchmarks. Report to the British Columbia Contaminated Sites Implementation Committee (CSIC) Standards Subcommittee on behalf of the BC Ministry of Water Land and Air Protection. January CCME (Canadian Council of Ministers of the Environment) Draft A Protocol for the Derivation of Environmental and Human Health Soil Quality Guidelines. CCME, Winnipeg. Chiou, C.T Theoretical considerations of the partition uptake of nonionic organic compounds by soil organic matter. In: Reactions and movement of organic chemicals in soils. Sawney, B.L. and K. Brown, eds. SSSA Spec. Publ. 22. Soil Science Society of America Inc., Madison, WI. Chiou, C.T., L.J. Peters and V.H. Freed A physical concept of soil-water equilibrium for non-ionic organic compounds. Science 206: Groundwater Services, Inc. (GSI) Soil Attenuation Model for Derivation of Risk- Based Soil Remediation Standards. Consultant report.
184 July Hassett, J.J. and W.L. Banwart "The sorption of nonpolar organics by soils and sediments. In: Reactions and movement of organic chemicals in soils. Sawney, B.L. and K. Brown, eds. SSSA Spec. Publ. 22. Soil Science Society of America Inc., Madison, WI. Hassett, J.J., J.C. Means, W.L. Banwart and S.G. Wood Sorption properties of sediments and energy-related pollutants. EPA-600/ U.S. Environmental Protection Agency, Washington, DC. Neuman, S.P., Universal scaling of hydraulic conductivities and dispersivities in geologic media, Water Resour. Res., vol. 26, no.8, Charles J. Newell1, Hanadi S. Rifai, John T. Wilson, John A. Connor, Julia A. Aziz, and Monica P. Suarez Calculation and Use of First-Order Rate Constants for Monitored Natural Attenuation Studies, report for USEPA. Sauvé, S., Hendershot, W. and Allen, H.E Solid-Solution Partitioning of Metals in Contaminated Soils: Dependence on ph, Total Metal Burden and Organic Matter. Environmental Science and Technology. Vol. 34, No. 7, Schaap, M. G. and F. J. Leij Database related accuracy and uncertainty of pedotransfer functions. Soil Science. 163: Schwarzenbach, René, Gschwend, Philip M. and Dieter M. Imboden, Environmental Organic Chemistry, 2nd edition, New York: John Wiley and Sons, 1328 pages. Science Advisory Board (SAB) Screening Risk Assessment 2 (SRA-2). Soil and Groundwater Module. October Sauve, S., Hendershot, W. and Allen, H.E Solid-Solution Partitioning of Metals in Contaminated Soils: Dependence on ph, Total Metal Burden and Organic Matter. Environmental Science and Technology. Vol. 34, No. 7, Sharp-Hansen, S., C. Travers, P. Hummel, and T.L. Allison A Subtitle D Landfill Application Manual for the Multimedia Exposure Assessment Model (MULTIMED). Prepared for the Office of Research and Development, U.S. Environmental Protection Agency, Athens, Georgia. Suarez, M. P. and H. S. Rifai, Biodegradation Rates for Fuel Hydrocarbons and Chlorinated Solvents in Groundwater, Bioremediation J., 3(4): , 1999.
185 July US Environmental Protection Agency Draft Soil Screening Guidance. Washington. US Environmental Protection Agency Soil Screening Guidance. EPA540/F- 95/041, Washington, June Soil Vapour (Section 4.0) BCE (British Columbia Environment) Overview of CSST procedures for the derivation of soil quality matrix standards for contaminated sites. Prepared by Risk Assessment Unit, Environmental Protection Department, BC Environment. January 31, Includes CSST Policy Decision Summary. CCME (Canadian Council of Ministers of the Environment) Canada-wide standards for petroleum hydrocarbons (PHC) in soil: Scientific rationale Supporting technical document. CCME, Winnipeg. CCME (Canadian Council of Ministers of the Environment) Draft A Protocol for the Derivation of Environmental and Human Health Soil Quality Guidelines. CCME, Winnipeg. DeVaull, G., Ettinger, R., Gustafson, J., 2002, Chemical Vapor Intrusion from Soil or Groundwater to Indoor Air: Significance of Unsaturated Zone Biodegradation of Aromatic Hydrocarbons, Soil and Sediment Contamination, Vol. 11, No. 4, pp DeVaull, G., R.A. Ettinger, J.P. Salanitro, and J. Gustafson Benzene, toluene, ethylbenzene and xylenes degradation in vadose zone soils during vapour transport: first-order rate constants. Proceedings of 1997 Petroleum Hydrocarbons and Organic Chemicals in Ground Water, API/NGWA, Houston, Texas, November, Fischer, M.L., A.J. Bentley, K.A. Dunkin, A.T. Hodgson, W.W. Nazaroff, R.G. Sextro, and J.M. Daisay Factors affecting indoor air concentrations of volatile organic compounds at a site of subsurface gasoline contamination. Environ. Sci. Technol., 30: Ltd Recommendations to BC Environment for Development of Remediation Criteria for Petroleum Hydrocarbons in Soil and Groundwater. Report prepared for BC Environment. June.
186 July Ltd Draft Soil Vapour Intrusion Guidance for Health Canada Screening Level Risk Assessment (SLRA). Report prepared for Health Canada, November. Gusdorf, J.; T. Hamlin, Buildings Group, Residential Programs, Energy Technology Branch. Indoor Air Quality and Ventilation Rates in R-2000 Houses. Call-up No Energy Technology Branch, CANMET, Department of Natural Resources Canada, Ottawa, Ontario, 1995 (43 pg). Health Canada 2004 Federal Contaminated Site Risk Assessment in Canada. Part I: Guidance on Human Health Preliminary Quantitative Risk Assessment (PQRA), September. Hers, I Update on Empirical Attenuation Factors- Data Analysis and Results - Presentation at AEHS/USEPA Work Shop on Vapor Intrusion, March 15, San Diego. Hers, I., Zapf-Gilje, Li, L. and Atwater, J The use of indoor air measurements to evaluate exposure and risk from subsurface VOCs. J. Air & Waste Manage. Assoc. 51: Hers, I., Atwater, J., Li, L. and Zapf-Gilje, R. 2000a. Evaluation of vadose zone biodegradation of BTX vapours. Journal of Contaminant Hydrology, 46, Johnson, P. C D model What does it tell us about Study Design? Presentation at AEHS/USEPA Work Shop on Vapor Intrusion, March 15, San Diego. Johnson, P.C. and R.A. Ettinger Heuristic model for predicting the intrusion rate of contaminant vapours into buildings. Environ. Sci. Tech. 25: Ostendorf, D.W.; D.H. Kampbell. Biodegradation of Hydrocarbon Vapours in the Unsaturated Zone. Water Resources Research (4): April. Otson, R.; Fellin, P.; Tran, Q. Investigation of VOCs in Canadian Residences, In: Proc. Indoor Air 93: 6 th International Conference on Indoor Air Quality and Climate. Helsinki, Finland, Ririe, T. and B. Sweeney API Conference. Fate and Transport of Volatile Hydrocarbons in the Vadose Zone. In Proceedings of the 1995 Petroleum Hydrocarbon and Organic Chemicals in Groundwater: Prevention, Detection and Remediation Conference, Houston, Texas, November 29 to December 1:
187 July Science Advisory Board (SAB) Screening Risk Assessment 2 (SRA-2). Vapour Intrusion Module. October. US Environmental Protection Agency Draft Vapor Intrusion Guidance. OWSER, November Human Health Matrix Standards and Human Health Protection: Groundwater Used for Drinking Water (Sections 3, 5 and 6) American Industrial Health Council (AIHC) Exposure Factors Sourcebook. Angus Environmental Limited Review and Evaluation of Receptor Characteristics for Multi-Media Assessments. Report prepared for Health and Welfar Canada, Monitoring and Criteria Division. BCE (British Columbia Environment) Overview of CSST procedures for the derivation of soil quality matrix standards for contaminated sites. Prepared by Risk Assessment Unit, Environmental Protection Department, BC Environment. January 31, Includes CSST Policy Decision Summary. BC Ministry of Environment, Lands and Parks British Columbia Approved Water Quality Guidelines (Criteria) Edition Updated Water Quality Section, Water Management Branch, Environment and Resource Management Department, BCE. Canadian Council of Ministers of the Environment (CCME) A Protocol for the Derivation of Environmental and Human Health Soil Quality Guidelines. Prepared for the National Contaminated Sites Remediation Program. Canadian Council of Ministers of the Environment (CCME) Canadian Soil Quality Guidelines for Pentachlorophenol: Environmental and Human Health. Prepared by the CCME Subcommittee on Environmental Quality Criteria for Contaminated Sites. Canadian Council of Ministers of the Environment (CCME) A Protocol for the Derivation of Environmental and Human Health Soil Quality Guidelines. Draft. Prepared for the National Contaminated Sites Remediation Program. Fox, G.R Hierarchy of Preferred Sources of Toxicity Reference Values for Use in Calculation of CSST Numbers for use in Contaminated Sites Regulation. Risk Assessment Unit, Industrial Waste and Hazardous Contaminants, BC Environment.
188 July Health Canada Guidelines for Canadian Drinking Water Quality Sixth Edition. Health Canada. 2004a. Federal Contaminated Site Risk Assessment in Canada. Part I: Guidance of Human Health Preliminary Quantitative Risk Assessment (PQRA). Prepared by Environmental Health Assessment Services, Safe Environments Program, Health Canada. Health Canada. 2004b. Federal Contaminated Site Risk Assessment in Canada. Part II: Health Canada Toxicological Reference Values (TRVs). Prepared by Environmental Health Assessment Services, Safe Environments Program, Health Canada. MENVIQ (Ministere de l Environment du Quebec) Guidelines for Toxicological Risk Assessment. MENVIQ, Risk Assessment Service. National Evnironment Protection (Assessment of Site Contamination) Measures (NEPM). 1999a. Schedule B (7a) Guideline on Health Based Investigation Levels. National Environmental Health Forum Monographs. Soil Series No. 1. Third Edition, Revised July National Evnironment Protection (Assessment of Site Contamination) Measures (NEPM). 1999b. Schedule B (7b) Guideline on Exposure Scenarios and Exposure Settings. National Environmental Health Forum Monographs. Soil Series No. 2. Third Edition, Revised July Newhook, R Revised Approach and Reference Values for Exposure Assessment for CEPA Reference Values. Ontario Minister of Environment and Energy. Priority Substances Section. Internal Memo. January 21, Ontario Ministry of Environment and Energy (OMEE) Rationale for the Development and Application of Generic Soil, Groundwater and Sediment Criteria for Use at Contaminated Sites in Ontario. ISBN: Standards Development Branch, OMEE, Toronto. Richardson, G Compendium of Canadian Human Exposure Factors for Risk Assessment. O Connor Associates Environmental., Ottawa. United States Environmental Protection Agency (US EPA) Risk Assessment Guidance for Superfund, Volume I, Part A Human Health Evaluation Manual. Office of Emergency and Remedial Response, Washington, D.C. EPA 540/1-89/009.
189 July United States Environmental Protection Agency (US EPA) Risk Assessment Guidance for Superfund, Volume I, Part A Human Health Evaluation Manual (Part B, Development of Risk Based Preliminary Remediation Goals). Office of Emergency and Remedial Response, Washington, D.C. EPA 540/R-92/003. United States Environmental Protection Agency (US EPA). 2002a. Supplemental Guidance for Developing Soil Screening Levels for Superfund Sites. Office of Emergency and Remedial Response, Washington, D.C. OSWER United States Environmental Protection Agency (US EPA). 2002b. Child Specific Exposure Factors Handbook. Interim Report. National Center for Environmental Assessment-Washington DC; EPA-600-P B. United States Environmental Protection Agency (US EPA) Human Health Toxicity Values in Superfund Risk Assessments. Office of Solid Waste and Emergency Response, Washington, D.C. OSWER Directive , Dec. 5, United States Environmental Protection Agency (US EPA) Risk Assessment Guidance for Superfund Volume I: Human Health Manual (Part E, Supplemental Guidance for Dermal Risk Assessment). Final. Office of Superfund Remediation and Technology Innovation, U.S. Environmental Protection Agency, Washington, D.C. United States Environmental Protection Agency (US EPA) Region III Risk Based Concentration Table. United States Environmental Protection Agency (US EPA) Region IX Preliminary Remediation Goals. Zartarian, V.G., J. Xue, H. Ozkaynak, W. Dang, G.Glen, L. Smith and C. Stallins Draft Preliminary Report. A Probabilistic Exposure Assessment for Children Who Contact CCA-Treated Playsets and Decks. Using the Stochastic Human Exposure and Dose Simulation Model for the Wood Preservative Exposure Scenario [SHEDS-Wood]. Prepared for US EPA Office of Research and Development Environmental Matrix Standards Ahmad, R., R.S. Kookana, M. Megharaj and A.M. Alston Aging reduces the bioavailability of even a weakly sorbed pesticide (carbaryl) in soil. Environ. Toxicol. Chem. 23:
190 July Alexander, M Aging, bioavailability and overestimation of risk from environmental pollutants. Environ. Sci. Technol. 34: Allinson, D.W. and C. Dzialo The influence of lead, cadmium and nickel on the growth of ryegrass and oats. Plant Soil 62: Alsop, F.J Birds of Canada 1st Edition. Doring Kindersley Handbooks, Toronto ON. 687 p. Amorim, M.H., J.P. Sousa, A.J.A. Nogueira and A.M.V.M. Soares Bioavailability and toxicokinetics of 14C-lindane (γ-hch) in the enchytraeid Enchytraeus albidus in two soil types: the aging effect. Arch. Environ. Contam. Toxicol. 43: Arrate, J.A., P. Rodriguez and M. Martinez-Madrid Effects of three chemicals on the survival and reproduction of the oligochaete worm Enchytraeus corontus in chronic toxicity tests. Pedobiologia 46: Bachmann, K., D. Pardoe and D. White Scaling basic toxicokinetic parameters from rat to man. Environ. Health. Perspect. 104: Balba, A.M., G. El Shibiny and S. El-Khatib Effect of lead increments on the yield and lead content of tomato plants. Water Air Soil Pollut. 57/58: Barriuso, E., W.C. Koskinen and M.J. Sadowsky Solvent extraction characterization of bioavailability of atrazine residues in soil. J. Agric. Food Chem. 52: BCE (British Columbia Environment) Overview of CSST procedures for the derivation of soil quality matrix standards for contaminated sites. Prepared by Risk Assessment Unit, Environmental Protection Department, BC Environment. January 31, Includes CSST Policy Decision Summary. BCE. Undated. Working files with CSR soil standards calculations. Belanger, S.E. and P.B. Dorn Chronic aquatic toxicity of alcohol ethoxylate (AE) surfactants under Canadian exposure conditions. In: L.E. Burridge, K. Haya and A.J. Niimi (eds). Proceedings of the 31 st Annual Aquatic Toxicity Workshop, October 24-27, 2004, Charlottetown, PEI. Can. Tech. Rep. Fish. Aquat. Sci. 2562, p
191 July Bengtsson, G., T. Gunnarsson, and S. Rundgren Effects of metal pollution on the earthworm Dendrobaena rubida (Sav.) in acidified soils. Water, Air, Soil Pollut. 28: Beyer, W.N., E.E. Connor and S. Gerould Estimates of soil ingestion by wildlife. J. Wildl. Manage. 58: Burken, J.G. and J.L. Schnoor Predictive relationships for uptake of organic contaminants by hydrid poplar trees. Environ. Sci. Technol. 32: Casteel, S.W., R.P. Cowart, C.P. Weis, G.M. Henningsen, E. Hoffman, W.J. Brattin, R.E. Guzman, M.F. Starost, J.T. Payne, S.L. Stockman, S.V. Becker, J.W. Drexler and J.R. Turk Bioavailability of lead to juvenile swine dosed with soil from the Smuggler Mountain NPL site of Aspen, Colorado. Fundam. Appl. Toxicol. 36: CCME (Canadian Council of Ministers of the Environment) A protocol for the derivation of environmental and human health soil quality guidelines. Prepared by the Canadian Council of Ministers of the Environment, Winnipeg, MB. CCME. 1999a. Canadian soil quality guidelines for lead: scientific supporting document. National Guidelines and Standards Office, Environmental Quality Branch, Environment Canada, Ottawa, ON. CCME. 1999b. Canadian water quality guidelines for the protection of agricultural water uses: introduction. In: Canadian environmental quality guidelines, 1999, Canadian Council of Ministers of the Environment, Winnipeg, MB. CCME Canada-wide standards for petroleum hydrocarbons: scientific rationale. Technical supporting document. Prepared by the Canadian Council of Ministers of the Environment, Winnipeg, MB. CCME A protocol for the derivation of environmental and human health soil quality guidelines (CCME, 2003). Prepared by the Canadian Council of Ministers of the Environment, Winnipeg, MB. CCME A protocol for the derivation of environmental and human health soil quality guidelines. Prepared by the Canadian Council of Ministers of the Environment, Winnipeg, MB. Draft. Chapman, P.M., R.S. Cardwell and P.F. Chapman A warning: NOECs are inappropriate for regulatory use. Environ. Contam. Toxicol. 15:
192 July Chapman, P.M., A. Fairbrother and D. Brown A critical evaluation of safety (uncertainty) factors for ecological risk assessment. Environ. Contam. Toxicol. 17: Conder, J.M. and R.P. Lanno Evaluation of surrogate measures of cadmium, lead and zinc bioavailability to Eisenia foetida. Chemosphere 41: Conder, J.M., R.P. Lanno and N.T. Basta Assessment of metal availability in smelter soil using earthworms and chemical extractions. J. Environ. Qual. 30: , Cook, N. and W.H. Hendershot The problem with establishing ecologically-based soil quality criteria: the case of lead. Can. J. Soil. Sci. 76: Dai, J., T. Becquer, J.H. Rouiller, G. Reversat, F. Bernhard-Reversat, J. Nahmani and P. Lavelle Heavy metal accumulation by two earthworm species and its relationship to total and DTPA-extractable metals in soils. Soil Biol. Biochem. 36: Dang, Y.P., R. Chabbra and K.S. Verma Effect of Cd, Ni, Pb and Zn on growth and chemical composition of onion and fenugreek. Commun. Soil Sci. Plant Anal. 21: Davies, N.A., M.E. Hodson and S. Black Is the OECD acute worm toxicity test environmentally relevant? The effect of mineral form on calculated lead toxicity. Environ. Pollut. 121: Davis, J. B. and R.L. Barnes Effects of soil-applied fluoride and lead on growth of loblolly pine and red maple. Environ. Pollut. 5: Dean, J.R. and W.C. Scott Recent developments in assessing the bioavailability of persistent organic pollutants in the environment. Trends Anal. Chem. 23: Dixon, R.K Response of ectomycorrhizal Quercus rubra to soil cadmium, nickel and lead. Soil Biol. Biochem. 20: Dodds, P.S., D.H. Rothman and J.S. Weitz Re-examination of the 3/4 law of metabolism. J. Theor. Biol. 209: 9-27.
193 July Dowdy, D.L. and T.E. McKone Predicting plant uptake of organic compounds from soil or air using octanol/water and octanol/air partition ratios and a molecular connectivity index. Environ. Contam. Toxicol. 16: DTSC (Deparatment of Toxic Substances Control) Human and ecological risk division (HERD) EcoNote #4. Available online: ScienceTechnology /ftp/econote4.pdf. Accessed March 1, Efyromson, R.A., G.W. Suter II, B.E. Sample and D.S. Jones Preliminary remediation goals for ecological endpoints. Prepared for the US Department of Energy, Oak Ridge National Laboratory, TN. ES/ER/TM-162/R2. Efroymson, R.A., B.E. Sample, and G.W. Suter Uptake of inorganic chemicals from soil by plant leaves: Regressions of field data. Environmental Toxicology and Chemistry 20: Ehlers, L.J. and R.G. Luthy Contaminant bioavailability in soils and sediments. Environ. Sci. Technol. 37: 295A-207A. Ellickson, K.M., R.J. Meeker, M.A. Gallo, B.T. Buckley and P.J. Lioy Oral bioavailability of lead and arsenic from a NIST standard reference soil material. Arch. Environ. Contam. Toxicol. 40: Environment Canada Toxicity testing of National Contaminated Sites Remediation Program priority substances for the development of soil quality criteria for contaminated sites. Ottawa, ON. Fairchild, J.F., D. S. Ruessler, P. S. Haverland and A.R. Carlson Comparative sensitivity of Selenastrum capricornutum and Lemna minor to sixteen herbicides. Arch. Environ. Contam. Toxicol. 32: Fitzpatrick, L.C., J.F. Muratti-Ortiz, B.J. Venables and A.J. Goven Comparative toxicity in earthworms Eisenia foetida and Lumbricus terrestris exposed to cadmium nitrate using artificial soil and filter paper protocols. Bull. Environ. Contam. Toxicol. 57: Fountain, M.T. and S.P. Hopkin A comparative study of the effects of metal contamination on collembola in the field and in the laboratory. Ecotoxicology 13:
194 July Gibbs, M.H., L.F. Wicker and A.J. Stewart A method for assessing sublethal effects of contaminants to the earthworm, Eisenia foetida. Environ. Contam. Toxicol. 15: Goddard, M.J. and D. Krewski Interspecies extrapolation of toxicity data. Risk Anal. 12: Hack, A. and F. Selenka. Mobilization of PAHs and PCB from contaminated soil using a digestive tract model. Toxicol. Lett. 88: Hall, L.W. Jr., M.C. Scott, W.D. Killen and M.A. Unger A probabilistic ecological risk assessment of tributyltin in surface waters of the Chesapeake Bay watershed. Human Ecol. Risk Assess. 6: Hanson, M.L. and K.R. Solomon New techniques for estimating thresholds of toxicity in ecological risk assessment. Environ. Sci. Technol. 36: Hassett, J.J., J.E. Miller and D.E. Koeppe Interaction of lead and cadmium on maize root growth and uptake of lead and cadmium by roots. Environ. Pollut. 11: Holman, H.N., E. Goth-Goldstein, D. Aston. M. Yun and J. Kengsoontra Evaluation of gastrointestinal solubilization of petroleum hydrocarbon residues in soil using an in vitro physiologically based model. Environ. Sci. Technol. 36: Isnard, P., P. Flammarion, G. Roman, M. Babut, Ph. Bastien, S. Bintein, L. Essermeant, J.F. Ferard, S. Gallotti-Schmitt, E. Saouter, M. Saroli, H. Thiebaud, R. Tomassone and E. Vindimian Statistical analysis of regulatory ecotoxicity tests. Chemosphere 45: Janssen, R.P.T., W.J.G.M. Peijnenburg, L. Posthuma and M.A.G.T. van den Hoop. 1997a. Equilibrium partitioning of heavy metals in Dutch field soils. I. Relationship between metal partition coefficients and soil characteristics. Environ. Toxicol. Contam. 16: Janssen, R.P.T., W.J.G.M. Peijnenburg, L. Posthuma and M.A.G.T. van den Hoop. 1997b. Equilibrium partitioning of heavy metals in Dutch field soils. II. Prediction of metal accumulation in earthworms. Environ. Toxicol. Contam. 16:
195 July Khan, D.H. and B. Frankland Effects of cadmium and lead on radish plants with particular reference to movement of metals through soil profile and plant. Plant Soil 70: Khan, D.H. and B. Frankland Cellulolytic activity and root biomass production in some metal-contaminated soils. Environ. Pollut. 33: Khan, S. and N. Khan Influence of lead and cadmium on the growth and nutrient concentration of tomato (Lycopersicum esculentum) and egg-plant (Solanum melongena). Plant Soil 74: Kirman, C.R., L.M. Sweeney, M.E. Meek and M.L. Gargas Assessing the dosedependancy of allometric scaling performance using physiologically based pharmacokinetic modeling. Reg. Toxicol. Pharmacol. 38: Kuperman, R.G., R.T. Checkain, M. Simini and C.T. Phillips Managanese toxicity in soil for Eisenia foetida, Enchytraeus crypticus (Oligochaeta), and Folsomia candida (Collembola). Ecotox. Environ. Saf. 57: Levengood, J.M. and L.M. Skowron Use of a simulated gizzard to measure bioavailability of metals and other elements to waterfowl. Ecotoxicology 10: Liste, H.H. and M. Alexander Butanol extraction to predict bioavailability of PAHs in soil. Chemosphere 46: Lock, K. and C.R. Janssen. 2003a. Influence of aging on copper bioavailability in soils. Environ. Toxicol. Chem. 22: Lock, K. and C.R. Janssen. 2003b. Influence of aging on zinc bioavailability in soils. Environ. Pollut. 126: Lock, K. and C.R. Janssen Ecotoxicity of zinc in spiked artificial soils versus contaminated field soils. Environ. Sci. Technol. 35: Lock, K., K.A.C. De Schamphelaere and C.R. Janssen The effects of lindane on terrestrial invertebrates. Arch. Environ. Contam. Toxicol. 42: Lofts, S., D.K. Spurgeon, C. Svendsen and E. Tipping Deriving soil critical limits for Cu, Zn, Cd and Pb: a method based on free ion concentrations. Environ. Sci. Technol. 38:
196 July Ma, W.C The influence of soil properties and worm related factors on the concentration of heavy metals in earthworms. Pedobiologia 24: Marques Dos Santos, C., Neto, M. M. P., and DeVarennes, A Some effects of different levels of lead on berseem. In: M.A.C. Fragoso and M.L. van Beuxichen, (Eds.). Proceedings of the VIII International Colloquium for the Optimization of Plant Nutrition, Lisbon, Portugal, 1-8 September Series: Developments in Plant and Soil Sciences, Vol. 53. Springer Science and Business Media. McDonald, B.G. and J.B. Wilcockson Improving the use of toxicity reference values in wildlife food chain modeling and ecological risk assessment. Human Ecol. Risk. Assess. 9: Miller, J., J. Hassett and D.E. Koeppe Interactions of lead and cadmium on metal uptake and growth of corn plants. J. Environ. Qual. 6: Mineau, P., B.T. Collins and A. Baril On the use of scaling factors to improve interspecies extrapolation of acute toxicity in birds. Regul. Toxicol. Pharmacol. 24: Morrison, D.E., B.K. Robertson and M. Alexander Bioavailability to earthworms of aged DDT, DDE, DDD and dieldrin in soil. Environ. Sci. Technol. 34: Muramoto, S., H. Nishizaki and I. Aoyama The critical levels and the maximum metal uptake for wheat and rice plants when applying metal oxides to soil. J. Environ. Sci. Health B25(2): NAS (National Academy of Sciences) Board of Agricultural and Natural Resources (BANR) website. Accessed March 9, Nagy, K.A Field metabolic rate and food requirement scaling in mammals and birds. Ecol. Monogr. 57: Nagy, K.A., I.A. Girard and T.K. Brown Energetics of free-ranging mammals, reptiles and birds. Annu. Rev. Nutr. 19: Neuhauser, E.F., R.C. Loehr, D.L. Milligan and M.R. Malecki Toxicity of metals to the earthworm Eisenia fetida. Biol. Fertil. Soils 1:
197 July Neuhauser, E.F., P.R. Durkin, M.R. Malecki and M. Anatra Comparative toxicity of ten organic chemicals to four earthworm species. Comp. Bioch. Physiol. C. 83: Newman, M.C., D.R. Ownby, L.C.A. Mezin, D.C. Powell, T.R.L. Christensen, S.B. Lerberg and B.A. Anderson Applying species-sensitivity distributions in ecological risk assessment: assumptions of distribution type and sufficient numbers of species. Environ. Toxicol. Chem. 19: NRC (National Research Council) Bioavailability of Contaminants in Soils and Sediments: Processes, Tools and Applications. National Academies Press, Washington, DC. Oomen, A.G., A. J.A.M. Sips, J.P. Groten, D.T.H.M. Sijm and J. Tolls Mobilization of PCBs and lindane from soil during in vitro digestion and their distribution among bile salt micelles and proteins of human digestive fluid and the soil. Environ. Sci. Technol. 34: Oomen, A.G., A. Hack, M. Minekus, E. Zeijdner, C. Cornelis, G. Schoeters, W. Verstraete, T. Van De Wiele, J. Wragg, C.J.M. Rompelburg, A.J.A.M. Sips and J.H. Van Wijnen Comparison of five in vitro digestion models to study the bioaccessibility of soil contaminants. Environ. Sci. Technol. 36: Oomen, A.G., C.J.M. Rompelburg, M.A. Bruil, C.J.G. Dobbe, D.P.K.H. Pereboom and A.J.A.M. Sips Development of an in vitro digestion model for estimating the bioaccessibility of soil contaminants. Arch. Environ. Contam. Toxicol. 44: ORNL (Oak Ridge National Laboratory) A review and analysis of parameters for assessing transport of environmentally released radionuclides through agricultural. ORNL Oak Ridge National Laboratory, Oak Ridge, TN. Peijnenburg, W.J.G.M. and T. Jager Monitoring approaches to assess bioaccessibility and bioavailability of metals: matrix issues. Ecotox. Environ. Saf. 56: Posthuma, L., T.P. Traas and G.W. Suter II General introduction to species sensitivity distributions. In: Species Sensitivity Distributions. L. Posthuma, G.W. Suter II and T.P. Trass (eds). Lewis Publishers, New York, NY, USA. pp 3-11.
198 July Pu, X., L.S. Lee, R.E. Galinsky and G.P. Carlson Evaluation of a rat model versus a physiologically based extraction test for assessing phenanthrene bioavailability from soils. Toxicol. Sci. 79: Puls, R Mineral Levels in Animal Health: Diagnostic Data. Sherpa International, Aldergrove, BC. Radix, P., M. Leonard, C. Papantonious, G. Roman, E. Saouter, S. Gallotti-Schmitt, H. Thiebaud and P. Vasseur Comparison of four chronic toxicity tests using algae, bacteria and invertebrates assessed with sixteen chemicals. Ecotox. Environ. Saf. 47: Ruby, M.V., A. Davis, R. Schoof, S. Eberle and C.M. Sellstone Estimation of lead and arsenic bioavailability using a physiologically based extraction test. Environ. Sci. Technol. 30: Ruby, M.V., K.A. Fehling, D.J. Paustenback, B.D. Landenberger and M.P. Holsapple Oral bioaccessibility of dioxins/furans and low concentrations ( ppt toxicity equivalent) in soil. Environ. Sci. Technol. 36: SAB (Science Advisory Board) Screening-level risk assessment 1 (SRA-1) and SRA-2 guidance. Includes soil and groundwater and terrestrial wildlife modules. Submitted to the Ministry of Water, Land and Air Protection. Science Advisory Board for Contaminated Sites in British Columbia. Sample, B.E. and C.A. Arenal Allometric models for interspecies extrapolation of wildlife toxicity data. Bull. Environ. Contam. Toxicol. 62: Sample, B., D. Opresko and G. Suter II Toxicological benchmarks for wildlife: 1996 revision. Oak Ridge National Laboratory, Department of Energy. Oak Ridge, TN. ES/ER/TM-86/R3. Sandifer, R. D. and Hopkins, S. P Effects of ph on the toxicity of cadmium, copper, lead and zinc to Folsomia candida Willem, 1902 (Collembola) in a standard laboratory test system. Chemosphere 33: Sandifer, R. D. and Hopkins, S. P Effects of temperature on the relative toxicities of Cd, Cu, Pb, and Zn to Folsomia candida (Collembola). Ecotoxicol. Environ. Saf. 37:
199 July Sauve, S., W. Hendershot and H.E. Allen Solid-solution partitioning of metals in contaminated soils: dependence on ph, total metal burden and organic matter. Environ. Sci. Technol. 34: Savage, V.M., J.F. Gillooly, W.H. Woodruff, G.B. West, A.P. Allen, B.J. Enquist and J.H. Brown The predominance of quarter-power scaling in biology. Funct. Ecol. 18: Schroder, J.L., N.T. Basta, S.W. Casteel, T.J. Evans, M.E. Payton and J. Si Validation of the in vitro gastrointestinal (IVG) method to estimate relative bioavailable lead in contaminated soils. J. Environ. Qual. 33: Scott-Fordsmand, J.J., D. Stevens and M. McLaughlin Do earthworms mobilize fixed zinc from ingested soil? Environ. Sci. Technol. 38: Seiler, J.R. and D. Paganelli Photosynthesis and growth response of red spruce and loblolly pine to soil-applied lead and simulated acid rain. Forest Sci. 33(3): Semple, K.T., K.J. Doick, K.C. Jones, B. Burauel, A. Craven and H. Harms Defining bioavailability and bioaccessibility of contaminated soil and sediment is complicated. Environ. Sci. Technol. 38: 228A-231A. Singh, B. R. and A.S. Jeng Uptake of zinc, cadmium, mercury, lead, chromium and nickel by ryegrass grown in a sandy soil. Norw. J. Agric. Sci. 7: Smit, C.E. and C.A.M. van Gestel Effects of soil type, prepercolation and aging on bioaccumulation and toxicity of zinc for the springtail Folsomia candida. Environ. Contam. Toxicol. 17: Spann, J.W., G.H. Heinz, M.B. Camardese, E.F. Hill, J.F. Moore and H.C. Murray Differences in mortality among bobwhite fed methylmercury chloride dissolved in various carriers. Environ. Contam. Toxicol. 5: Spurgeon, D.J., S.P. Hopkin, and D.T. Jones Effects of cadmium, copper, lead, and zinc on growth, reproduction and survival of the earthworm Eisenia fetida (Sav.): assessing the environmental impact of point-source metal contamination in terrestrial ecosystems. Environ. Pollut. 84: Stone, C.L., M.R. Spivey Fox and K.S. Hogye Bioavailability of lead in oysters fed to young Japanese quail. Environ. Res. 26:
200 July Sverdrup, L.E., J. Jensen, P.H. Krogh and J. Stenersen Studies on the effect of soil aging on the toxicity of pyrene and phenanthrene to a soil-dwelling springtail. Environ. Toxicol. Chem. 21: Tang, J., H.H. Liste and M. Alexander Chemical assays of availability to earthworms of polycyclic aromatic hydrocarbons. Chemosphere 48: Tannenbaum, L.V Can ecological receptors really be at risk? Human Ecol. Risk. Assess. 9: Tannenbaum, L.V A critical assessment of the ecological risk assessment process: a review of misapplied concepts. Integr. Environ. Assess. Manag. 1: Tannenbaum, L.V., M.S. Johnson and M. Bazar Application of the hazard quotient method in remedial decisions: a comparison of human and ecological risk assessment. Human Ecol. Risk Assess. 9: Travis, C.C. and R.K. White Interspecific scaling of toxicity data. Risk Anal. 8: USEPA (United States Environmental Protection Agency) Wildlife exposure handbook. Office of Health and Environmental Assessment, Office of Research and Development, United States Environmental Protection Agency. EPA-600- R USEPA Ecological effects test guidelines: earthworm subchronic toxicity test. Office of Prevention, Pesticides and Toxic Substances. EPA 712/C-96/167. Available online: Test_ Guidelines/Drafts/ pdf. Accessed 24 February USEPA Draft revised guidelines for carcinogen risk assessment (external draft, July 1999). U.S. Environmental Protection Agency, Risk Assessment Forum, Washington, DC. USEPA. 2003a. Guidance for developing ecological soil screening levels. Office of Solid Waste and Emergency Response, Washington, DC. OSWER Directive USEPA. 2003b. Ecological soil screening levels for lead: interim final. Office of Solid Waste and Emergency Response, Washington, DC. OSWER Directive
201 July USEPA Framework for inorganic metals risk assessment (external review draft). U.S. Environmental Protection Agency, Washington, D.C., EPA/630/P-04/068B. Van der Hoeven, N How to measure no effect. Part III: Statistical aspects of NOEC, ECX and NEC estimates. Environmetrics 8: Van der Wal, L., T. Jager, R.H.L.J. Fleuren, A. Barendregt, T.L. Sinnige, C.A.M. van Gestel and J.L.M. Hermens Solid phase microextraction to predict bioavailability and accumulation of organic micropollutants in terrestrial organisms after exposure to a field-contaminated soil. Environ. Sci. Technol. 38: Van Gestel, C.A.M. and W.A. Van Dis The influence of soil characteristics on the toxicity of four chemicals to the earthworm Eisenia foetida andrei (Oligochaeta). Biol. Fertil. Soils 6: Van Gestel, C.A.M. and S. Mol The influence of soil characteristics on cadmium toxicity for Folsomia candida (Collembola: Isotomidae). Pedobiologia 47: Van Gestel, C.A.M., E.M. Dirven-Van Breemen, R. Baerselman, H.J.B. Emans, J.A.M. Janssen, R. Postuma and P.J.M. Van Vliet Comparison of sublethal and lethal criteria for nine different chemicals in standardized toxicity tests using the earthworm Eisenia andrei. Ecotox. Environ. Saf. 23: Vijver, M.G., J.P.M. Vink, C.J.H. Miermans and C.A.M. Van Gestel Oral sealing using glue: a new method to distinguish between intestinal and dermal uptake of metals in earthworms. Soil Biol. Biochem. 35: Weng, L.P., A. Wolthoorn, T.M. Lexmond, E.J.M. Temminghoff and W.H. van Riemsdijk Understanding the effects of soil characteristics on phytotoxicity and bioavailability of nickel using speciation models. Environ. Sci. Technol. 38: Wheeler, J.R., E.P.M. Grist, K.M.Y. Leung, D. Morritt and M. Crane Species sensitivity distributions: data and model choice. Mar. Pollut. Bull. 45:
202 APPENDIX I REVIEW OF METALS PARTITIONING FOR GENERIC SOIL STANDARD DEVELOPMENT Prepared by: Kristin Salzsauler Rens Verburg Ian Hers
203 July 2005 Appendix I - i TABLE OF CONTENTS SECTION PAGE 1.0 INTRODUCTION FATE AND TRANSPORT OF METALS Metal mobility Metal complex formation Reduction / oxidation condition Metal adsorption Metal solubility controls Summary CSST PROTOCOL FOR DETERMINATION OF SOIL MATRIX STANDARDS METHODS FOR PREDICTING METALS PARTITIONING Empirical models Theoretical background Measurement of K d values Parametric models of Kd prediction Mechanistic models of Kd prediction Metal partitioning coefficient definition using the chemical reaction model MINTEQA APPROACHES AND PROTOCOLS FOLLOWED BY OTHER REGULATORY JURISDICTIONS USEPA Soil Screening Guidance MRA Selected U.S. States Washington State New Jersey New Mexico SUMMARY, EVALUATION AND IMPLICATIONS OF REGULATORY APPROACHES FOR THE METAL-GROUNDWATER PATHWAY Overview of regulatory methods of soil-water metal partition coefficient determination Evaluation of CSST soil-water partitioning coefficients Chromium (VI) Arsenic (III) Zinc Cadmium Copper Lead Limitations to current regulatory approaches Discussion and Recommendations Implications REFERENCES...39
204 July 2005 Appendix I - ii LIST OF TABLES Table 1 Factors that affect metal sorption from pore water to soils, sorted with respect to characteristics impacting soil solids, soil solution and solutes (adapted from Langmuir et al, 2004). Table 2 Geochemical behavior of sorbent phases in natural environments. Table 3 Partition Coefficients for BCE Groundwater Model (CSST, 1996). Table 4 Default input values used in the calculation of CSST soil quality standards for the protection of groundwater (USEPA 1996a). Table 5 Summary of the constant partition coefficient model. Table 6 Summary of the Langmuir and Freundlich isotherm models. Table 7 Summary of the use of batch tests and flow through column methods to developing soil-water partition coefficients. Table 8 Adsorption models utilized in MINTEQA2 reaction code (USEPA, 1999). Table 9 Default input values used in the calculation of USEPA soil screening levels (USEPA 1996a). Table 10 Geochemical parameters used in SSL MINTEQ2A modeling effort (USEPA, 1999). Table 11 Background porewater chemistry assumed for SSL MINTEQA2 modeling efforts (USEPA, 1999). Table 12 Partition Coefficients for USEPA Soil Screening Level Guidance (USEPA, 1996b). Table 13 Properties of Wisconsin Sand material used to generate empirical isotherms for As, Cr(VI), Se and Tl for USEPA SSL model (as reported in Loux et al, 1989). Table 14 Empirical ph-dependent adsorption relationships derived by Loux et al, 1990 (USEPA, 1996c). Table 15 Master variables used to calculate non-linear adsorption isotherms for 3MRA. Table 16 Washington State recommended methods for deriving soil concentrations for the protection of groundwater under WAC Table 17 Default input values used in the calculation of Washington State soil screening levels (WAC, 2001). Table 18 Metal partition coefficients recommended for use under W AC (WAC, 2001). Table 19 Summary of leaching procedures recommended for the derivation of soil concentration levels in Washington State. Table 20 Default input values for the calculation of New Jersey soil screening levels (New Jersey, 2005). Table 21 Default input values used in the calculation of New Mexico soil screening levels (NMED, 2000). Table 22 Comparison of Kd values reported in literature to CSST, USEPA and 3MRA Kd values (adapted from USEPA 1996b). Table 23 Comparison of soil screening levels calculated with CSST (1996) and USEPA (1996b) recommended soil-water metal partitioning coefficents.
205 July 2005 Appendix I - iii LIST OF FIGURES Figure 1 Metal partitioning isotherms developed by CSST (1996). Figure 2 Adsorption of metal cations and oxyanions by ferrihydrite as a function of ph. (Metal concentrations = 5 x 10⁻⁷ M, ΣFe[III] = 10-3 M, ionic strength = 0.1 mol/kg, 2.4 x10⁻⁴ M ferrihydrite reactive sites). From Stumm and Morgan, Figure 3 Empirical ph-dependent K d isotherms developed by the USEPA (1996b). Figure 4 Metal partitioning isotherms developed by USEPA (1996b). Figure 5 Chromium (VI) K d as a function of ph. Figure 6 Variation with ph and HFO for 3MRA K d isotherms calculated with low LOM and medium POM concentrations in the vadose zone - Chromium (VI). Figure 7 Variation with ph and POM for 3MRA K d isotherms calculated with low LOM and medium HFO concentrations in the vadose zone - Chromium (VI). Figure 8 Arsenic (III) K d as a function of ph. Figure 9 Variation with ph and HFO for 3MRA isotherms calculated with low LOM and medium POM concentrations - Arsenic (III). Figure 10 Zinc K d as a function of ph. Figure 11 Variation with ph and HFO for 3MRA K d isotherms calculated with low LOM and medium POM concentrations in the vadose zone - Zinc. Figure 12 Variation with ph and POM for 3MRA K d isotherms calculated with low LOM and medium HFO concentrations in the vadose zone - Zinc. Figure 13 Cadmium K d as a function of ph. Figure 14 Lead K d as a function of ph. Figure 15 Variation with ph and HFO for 3MRA K d isotherms calculated with low LOM and medium POM concentrations in the vadose zone - Lead. Figure 16 Variation with ph and POM for 3MRA K d isotherms calculated with low LOM and medium HFO concentrations in the vadose zone. LIST OF APPENDICES Appendix A Extended list of partition coefficients for USEPA Soil Screening Level Guidance (USEPA, 1996b) Appendix B Exhibit: Comparison of literature reported Kd values and USEPA Soil Screening Guidance K d values (from USEPA, 1996b) Appendix C Exhibit: Use of Synthetic Precipitation Leaching Procedure results to develop site specific soil screening levels, as recommended by the State of New Jersey (from New Jersey, 2005) Appendix D Comparison of methods of isotherm development for the purpose of soil screening level calculation
206 July 2005 Appendix I INTRODUCTION The purpose of this Appendix is to provide an overview of the current approach used by the Province of British Columbia for evaluating metal partitioning in the vadose zone. Soil-water metal partitioning is considered in the context of contaminant fate and transport for the purpose of soil matrix standard calculation. In the vadose zone, the primary means of metal attenuation is adsorption from pore-water to the solid phase. In the Province of British Columbia, soil matrix standards are calculated according the Contaminated Sites Soil Task Group (CSST) protocol (CSST, 1996). The objectives of this appendix are: 1. To summarize regulatory approaches to development of the soil-water partition coefficient for the purpose of soil screening level generation; 2. To identify limitations of the current method of determination of soil-water partitioning coefficients; and, 3. To identify transparent, conservative methods more appropriate to the development of conservative soil-water metal partitioning coefficients for the use of calculation of soil matrix standards. 2.0 FATE AND TRANSPORT OF METALS The CSST protocol utilizes the results of geochemical models for the purpose of deriving soil matrix standards in the context of metals fate and transport. An understanding of fate and transport principles is important when evaluating the results of geochemical models. Therefore, mechanisms controlling the interaction of metals between the aqueous and solid phases are reviewed below. Consideration of metal fate and transport encompasses physical and chemical processes along a groundwater migration pathway in both the unsaturated and saturated zones. Fate processes describe contaminant persistence, whereas transport processes address contaminant mobility. Transport in the subsurface is a function of several processes, including advection, dispersion, molecular diffusion and retardation. Advection and dispersion are mechanical processes that are independent of solute character, and the effect of diffusion is generally negligible. The key processes that define the mobility of metals in the subsurface are sorption and precipitation, which result in retardation of metal species during groundwater transport relative to chemicals that do not interact with aquifer materials. Migration of metals from soil to groundwater is dictated by the mechanism of release of the contaminant from soil and transport of the contaminant in groundwater to a receptor (USEPA, 1996). According to Langmuir et al. (2004), while metals can undergo a
207 July 2005 Appendix I variety of inter-media transfers in the groundwater environment, they are indefinitely persistent and conservative in the environment. 2.1 Metal mobility The complex environmental chemistry of trace metals makes it difficult to predict mobility in the groundwater environment. Adsorption and precipitation are the key processes that retard trace metal transport in groundwater (Freeze and Cherry, 1979). Chemical characteristics affecting the subsurface behavior of metals include: Metal complex formation; Reduction / oxidation (redox) state of the system; Metal solubility controls; and, Solid-water metal partitioning (adsorption). These processes are described in detail in the following sections. The ph generally is the dominant factor governing metal sorption, but other factors control sorption as well. Several variables may influence metal sorption at the soil-water interface (Table 1). Table 1: Factors mediating metal sorption from pore water to soils, sorted with respect to characteristics impacting soil solids, soil solution and solutes (adapted from Langmuir et al., 2004). Soil Solids Soil Solution Solutes Soil mineral composition ph Character of chemical solute Specific surface areas of metal sorbing sites Eh Complexation chemistry Surface site density or cation exchange capacity of metal sorbing solids Aeration status Microbial type, activity, and population Organic matter content and character Temperature Dissolved oxygen Solute composition and concentrations (activities) Ionic strength Temperature Solubility Precipitation chemistry Redox chemistry Vapor pressure
208 July 2005 Appendix I Metal complex formation Laboratory analyses of metals in solution are generally reported as total metal concentrations. However, in natural waters, metals form hydrolyzed and complexed species by combining with inorganic anions such as HCO 3 -, SO 4 2-, NO 3 -, and less commonly Cl - and F - (Freeze and Cherry, 1979), as well as organic chelates. This total analytical concentration of an unfiltered sample is therefore equal to the sum of the free ions and metal complexes formed by that ion in solution (Equation 1). [ΣM] = [M + ] + [MI i,j,...n ] + [MO i,j, n ] + [M(suspended solids)] Where: [M + ]: Concentration of free metal ions I i,j,...n : Inorganic ligands O i,j, n : Organic ligands (Equation 1) Metal speciation, as introduced in Equation 1, can be calculated using geochemical equilibrium modeling programs such as MINTEQA2 (Allison et al, 1991) or PHREEQC (Parkhurst and Appelo, 1999) (see Section 4.3). Metal complexes are an indirect control on metal fate in the environment as they influence metal sorption and metal solubility, as discussed in Sections and 2.1.4, respectively Reduction / oxidation condition The reduction / oxidation (redox) state of the system influences the behavior of dissolved metals in the unsaturated and saturated groundwater zones (Freeze and Cherry, 1979). Some examples of impacts of redox conditions on metal fate and transport are presented below: Change in metal oxidation state can influence its capability to form complexes in solution, which holds solubility implications; Solid phases may dissolve, or precipitation of dissolved metals may occur, as a result of changing redox conditions; and, Metals may encounter solubility constraints based on redox state. For example, sulfide phases have very low solubility in anaerobic groundwater, and coprecipitation of metals with sulfide phases lowers the dissolved metal concentrations (Freeze and Cherry, 1979).
209 July 2005 Appendix I Metal adsorption Sorption is the process of formation of a layer of metals on mineral particles and organic matter due to chemical interactions between dissolved metals and charged functional groups at the solid surface. (Langmuir, 1997). A discussion of metal adsorption in the context of solid-water metal partitioning is provided in Section 4. Metal adsorption is impacted by a number of independent system variables, including the character of sorbate phases in soil, surface charge on the solid sorbate phase, the concentration of metal in solution, metal complexation, and ph and redox state of the system. Organic matter, Fe- and Mn-oxyhydroxides and clay minerals are important sorbent phases, as outlined in Table 2 (Langmuir et al., 2004). Table 2: Geochemical behavior of sorbent phases in natural environments. Sorbent phase Organic matter Fe- and Mnoxyhydroxides Clays Geochemical behavior in natural environments Surface charge controlled by system ph, where surface charge is positive in low ph conditions, and negative in high ph conditions; Surface charge controlled by defects in mineral structure. Examples of sorption edges, defined as plots of percent metal sorbed versus ph, illustrate the ph dependence of metal sorption for cationic and anionic species (Figure 1). Figure 1 shows that sorption of cationic species generally becomes more effective with increasing ph, whereas the opposite behavior is observed for anionic species.
210 July 2005 Appendix I Figure 1: Adsorption of metal cations and oxyanions by ferrihydrite as a function of ph. (Metal concentrations = 5 x 10⁻⁷ M, ΣFe[III] = 10-3 M, ionic strength = 0.1 mol/kg, 2.4 x10⁻⁴ M ferrihydrite reactive sites). From Stumm and Morgan, Metal solubility controls Mineral precipitation and dissolution can exert a significant control on dissolved metals concentrations. In general, mineral solubility increases with increasing ionic strength due to formation of aqueous complexes. Mineral solubility also depends on temperature, with most minerals becoming more soluble as temperature increases. Kinetic impediments may hinder the dissolution or formation of minerals. In addition, biological mediation may affect mineral solubility. Therefore, metal concentrations in natural waters may deviate from those expected based on equilibrium solubility considerations.
211 July 2005 Appendix I Summary It is important to recognize that, while relatively simple models are used for the purpose of soil standard development, the behavior of metals in the soil-water system is highly complex and dependent on site specific conditions. Relatively slight variations in geochemical conditions can result in large variations in metals sorption behavior. Since geochemical conditions tend to vary along a groundwater migration pathway, the mobility of metals will vary spatially as well. Therefore, a thorough understanding of geochemical processes affecting metals transport is vital. 3.0 CSST PROTOCOL FOR DETERMINATION OF SOIL MATRIX STANDARDS The Contaminated Sites Soil Task Group (CSST) protocol for determining soil matrix standards for inorganic and organic contaminants was developed in 1996 (CSST, 1996). Matrix soil standards for the protection of groundwater receptors were derived using a model developed by BC Environment and approved by the CSST (henceforth referred to as the CSST groundwater model ). The model simulates the movement of contaminants from soil to groundwater, and groundwater to receptor in four components: 1. Contaminant partitioning between soil, soil pore air and soil pore water; 2. Contaminant leachate movement and attenuation through the unsaturated soil zone; 3. Contaminant leachate mixing with groundwater; and, 4. Contaminant movement and attenuation through the saturated zone to a receptor (CSST, 1996). The four-component model assumes one-dimensional groundwater flow, and considers major groundwater and attenuation processes that affect contaminant movement (CSST, 1996). The framework used to develop the CSST groundwater model was the draft Soil Screening Guidance, 1994 (CSST, 1996; USEPA, 1994). In the 1996 CSST model, metal attenuation is addressed through the following processes: Partitioning between sorbed and pore-water phases in the unsaturated zone ( leaching ); Dilution through mixing between leachate and groundwater; and, Dispersion.
212 July 2005 Appendix I Dilution and dispersion are physical properties that are independent of the chemical characteristics of the contaminant. Adsorption is a function of the character of the contaminant (solute), and the soil (sorbent). The CSST considered the extent of soilwater partitioning in terms of the soil-water partition coefficient (K d ). The CSST provides partition coefficients for six parameters: arsenic, cadmium, chromium (VI), copper (II), lead and Zn (II) (Table 3, Figure 1). There is limited documentation in the CSST literature referring to the derivation of the isotherms presented in Table 3. According to CSST (1996), K d values were determined by considering the ph of the system, and an idealized soil with assigned physical and chemical parameters. The K d values for arsenic and chromium (VI) appear to be the same as values presented in USEPA (1996b), where values were determined using an empirical relationship between K d and solution ph. There is no detailed reference describing the development of the CSST K d values for cadmium, copper, lead or zinc. The values of K d for cadmium and zinc in Table 3 are higher than those recommended by the USEPA (1996b). A comparison of USEPA isotherms and CSST isotherms is provided in Section 6. Soil matrix standards were calculated by CSST considering partitioning between solids and groundwater. According to the 1996 CSST guidelines, soil concentrations at the source are calculated using Equation 2: C L{K d + (n u + H' na)} C s = ρb Where: C s : Soil concentration at source (mg/kg) C L : Leachate concentrations at source (mg/l) K d : Partition coefficient for a chemical (cm 3 /g) n u : Water-filled porosity H : Henry s law constant (where H = H*42.3) n a : Air-filled porosity ρ b : Dry bulk density of soil (g/cm 3 ) (Equation 2) Equation 2 is based on the soil screening level partitioning equation for migration to groundwater presented in EPA (1996a). The Henry s Law constant (H ) is typically not included in the calculation of inorganic soil matrix concentrations, as most inorganics (with the exception of mercury) do not readily volatilize. Default input values for Equation 2 are listed in Table 4.
213 July 2005 Appendix I Table 4: Default input values used in the calculation of CSST soil quality standards for the protection of groundwater (USEPA 1996a). Parameter Units Default C s Soil concentration at source mg/kg Calculated C L Leachate concentration at source mg/l K d Soil-water partition coefficient L/kg Chemical specific, as listed in Table 1 n u Water-filled soil porosity L water /L soil 0.1 n a Air-filled soil porosity L air /L soil n-n u ; 0.2 ρ b Dry soil bulk density kg/l 1.75; based on Fraser River sand characteristics H' Dimensionless Henry's law constant Chemical-specific, 0 for all elements except mercury 4.0 METHODS FOR PREDICTING METALS PARTITIONING The current CSST protocol relies on the use of soil-water metal partition coefficients for the calculation of site-specific soil screening levels. Therefore, a thorough understanding of the theory supporting metal partitioning is necessary. Empirical, parametric and mechanistic methods used to develop metal partitioning isotherms are summarized. This section also considers the use of the chemical reaction code MINTEQA2 to generate metal K d values. 4.1 Empirical models Empirical models of predicting metal partitioning include the constant partition coefficient model (K d ), the Langmuir isotherm model and the Freundlich isotherm model. Empirical models are based on use of experimental data to develop sorption isotherms (USEPA, 1999). The empirical isotherm is specific to the conditions under which the experiment is performed (e.g., ph and chemical concentration), and does not take into consideration sorbent properties and metal speciation. Since empirical partition coefficients are sensitive to changes in the above properties, they are approximate, and may under- or over-estimate actual partitioning in natural soils Theoretical background Constant partition coefficient model (K d ) The thermodynamic basis of the measurement of the constant partition coefficient (K d ) is based on equilibrium sorption of a contaminant onto a solid phase, as outlined in Table 5 (USEPA, 1999). Sorption is defined as the ratio of the quantity of aqueous contaminant adsorbed per unit mass of solid phase adsorbent to the total concentration of the
214 July 2005 Appendix I contaminant phase in solution at equilibrium. The resultant parameter is the K d, with units of ml/g. Table 5: Summary of the constant partition coefficient model. Model Assumptions Formula Limitations Constant partition coefficient 1. Reaction is at equilibrium; 2. {A i } is in excess with respect to {C i }; 3. {A} is equal to 1; and, 4. The reaction is reversible, and independent of the aqueous concentration of the contaminant in groundwater. A + C i A i K d = {A i} {C i} Where: A: Unoccupied sorption sites on solid material C i : Total dissolved contaminant in solution at equilibrium A i : Concentration of contaminant adsorbed to surface sites on solid material K d : Partition coefficient Model assumes linear evolution of K d. The thermodynamic constant partition coefficient model assumes that sorption sites are unlimited. According to this model, with increasing contaminant concentration in solution, the concentration of contaminant sorbed on the solid will increase linearly. This behavior rarely occurs in natural systems: natural soils have limited sorption sites, and more than one sorbent phase competes for the available sorption sites. As the sorption sites reach saturation, a linear model of adsorption cannot be maintained (USEPA, 1999). Isotherm adsorption models More complex methods of empirical isotherm determination include the Langmuir or Freundlich models. These models utilize the results of a suite of experiments to evaluate the effect of contaminant concentration on adsorption, where some reaction components are held constant. Isotherm models account for deviation from linear sorption in natural soils (USEPA, 1999). A summary of the Langmuir and Freundlich models, and their potential limitations is provided in Table 6. It is important to note that these isotherm models also do not consider several soil and solution parameters that can influence adsorption, such as bulk solution chemistry, redox conditions, temperature, or heterogeneity of sorbent surfaces (USEPA, 1999).
215 July 2005 Appendix I Table 6: Summary of the Langmuir and Freundlich isotherm models. Model Assumptions Formula Limitations Langmuir 1. Constant energy of adsorption; and, 2. Finite number of binding sites. Freundlich 1. Low contaminant concentration. KLAmCi Ai = 1+ KLCi Where: A i : Concentration of contaminant adsorbed per unit mass solid K L : Langmuir adsorption constant A m : Maximum sorption sites on per unit mass solid C i : Equilibrium concentration of contaminant in solution A i = K F C i N Where: A i : Concentration of contaminant adsorbed per unit mass solid K F : Freundlich adsorption constant C i : Equilibrium concentration of contaminant in solution N: Empirical constant Model was derived to describe adsorption of gas molecules onto homogenous, crystalline material with one type of adsorption site. These conditions are rarely maintained in natural soils. Does not account for finite adsorption capacity at high contaminant concentrations Measurement of K d values The partition coefficient can be determined experimentally by a number of methods, including batch methods, flow-through methods, and modeling of field data. Only batch and flow-through methods are considered below. Batch methods Batch tests are the most common method of deriving a contaminant partition coefficient from a bulk soil sample (USEPA, 1999). A known volume of a well-characterized soil is reacted with a known volume (and concentration) of contaminant solution in a sealed beaker. The soil-solution mixture is allowed to equilibrate until sorption is assumed to be complete. Methodology, advantages and disadvantages of simple batch tests are listed in Table 7.
216 July 2005 Appendix I Flow-through column methods Flow-through column tests are a less common method of K d determination (USEPA, 1999). Flow-through column methods are not as straightforward as batch tests. A solution of known contaminant concentration is introduced to a column of packed soil of known bulk density and porosity. A conservative chemical tracer is added to the solution to measure the pore-water velocity. The concentration of the effluent solution is measured as a function of time, and the results are plotted as a breakthrough curve (Figure 1). The breakthrough curve is used to determine contaminant velocity versus solution velocity. Based on the breakthrough curve, a retardation factor (R f ) is established as the ratio of the pore water velocity to the contaminant velocity (Equation 3). Equations describing the derivation of the partition coefficient using the retardation factor are provided in Table 7. Figure 2: A typical setup for flow-through column experiments (from USEPA 1999). R f = v v p c (Equation 3) Where: R f : Retardation factor v p : Pore-water velocity v c : Contaminant velocity A key advantage of K d values calculated from flow-through columns versus batch experiments is that use of a flow-through K d in transport models requires fewer assumptions.
217 July 2005 Appendix I Parametric models of Kd prediction Parametric models generate K d values based on empirically-determined relationships between aqueous and solid phase independent parameters including ph, solution chemistry, soil texture, and redox state. A wide range of independent input parameters are varied simultaneously to generate multiple K d values. From these results, predictor equations are generated using statistical methods. Parametric models are capable of determining K d values for multiple sets of environmental conditions, and are therefore more robust than strictly empirical models (USEPA, 1999). The product of a parametric model is a parametric K d equation, which is limited for use to the range of independent variables (ph, solution chemistry) used to generate the equation. A key restriction is that this statistical relationship provides no means of defining the mechanism of contaminant removal from solution, whether by adsorption, absorption or precipitation, whereas detailed geochemical characterization of solids following adsorption experiments can be used to elucidate the actual removal mechanisms. The parametric K d adds complexity to transport models, as the selected model code must be updated to track independent and dependent variables in the system. Thus, the parametric approach has not been widely used to determine partitioning in natural systems (USEPA, 1999). 4.3 Mechanistic models of Kd prediction Mechanistic models account for the dependency of K d values on contaminant concentration, competing ion concentration, variation in surface charge on the sorbent phase, and solute speciation. These models are based on the thermodynamic concepts of mass action and mass balance. Mechanistic models are more complicated than the empirical models, but they contribute to the understanding of chemistry at the solid / solution interface. Input requirements include adjustable system parameters, which compromises the universal application of K d values. Because of the heterogeneity of microcrystalline structures, amorphous coatings, and natural organic matter comprising natural soils, definition of average conditions is difficult at best. Rigorous data collection is more costly than empirical models. Therefore, mechanistic models are rarely applied to natural soils. 4.4 Metal partitioning coefficient definition using the chemical reaction model MINTEQA2 A chemical reaction model consists of a combination of mathematical expressions describing theoretical concepts and thermodynamic relationships for aqueous speciation, oxidation/reduction, precipitation/dissolution and adsorption/desorption of metals in a soil-water system.
218 July 2005 Appendix I MINTEQA2 is a well-documented, technically defensible tool for the interpretation of the geochemical behavior of metals in well-defined soil-water systems (USEPA, 1999). A brief description of the capabilities of MINTEQA2 with respect to modeling of adsorption in geochemical systems is provided below (from USEPA, 1999). The MINTEQA2 code utilizes a mechanistic approach, where chemical equilibria among aqueous species, gases and solids in a well-defined system are calculated in conjunction with a thermodynamic database. MINTEQA2 employs four sub-models: aqueous speciation; solubility; precipitation / dissolution; and adsorption. The sub-models are capable of calculating aqueous speciation and complexation, redox state, gas phase equilibrium, solubility and saturation state of aqueous phases, precipitation and dissolution of solids, and adsorption of aqueous phase components to solid phases. Mass action and mass balance expressions are also incorporated as part of the MINTEQ2A code (USEPA, 1999). An understanding of the speciation, solubility and precipitation components is key to the adsorption sub-model: Speciation sub-model: Calculates activities of aqueous species and complexes; Solubility sub-model: Reports the saturation state of mineral species. Knowledge of the solubility of a contaminant-bearing solid phase allows for interpretation of the effect of precipitation on contaminant retardation; and, Precipitation sub-model: The predicted mass of solid that may dissolve or precipitate is calculated. If solubility limits are reached during the experiment, the K d value reflects both attenuation and precipitation effects, and is an overestimation of contaminant attenuation due to sorption. Surface adsorption reactions are included as part of the equilibrium speciation calculations performed by MINTEQA2 (USEPA 1996c). Metal adsorption occurs at surface reactive sites; several metal-complexing solution ligands may be in competition for surface sorption sites. At a given metal concentration in solution, equilibrium partitioning between sorbed and solvent phases depends on the affinity between the surface sorption sites and the metal in solution. MINTEQA2 contains extensive options for modeling adsorption of dissolved constituents onto the surfaces of solid phases chosen by the code user. The seven model options are listed in Table 8.
219 July 2005 Appendix I Table 8: Adsorption models utilized in MINTEQA2 reaction code (USEPA, 1999). Non-electrostatic adsorption Activity partition coefficient (K act d ) model Activity Langmuir model Activity Freundlich model Ion exchange model Electrostatic adsorption Constant capacitance model Diffuse layer model Triple layer model A detailed description of MINTEQA2 adsorption modeling capabilities is provided in Allison et al. (1991). K d act, Langmuir, and Freundlich adsorption models are the simplest approaches to determining metal sorption in solution. These non-electrostatic models are formulated with respect to species activity, rather than the total concentration. The total concentration of a contaminant phase is equal to the sum of all dissolved species of that phase in solution. If a total concentration approach is utilized, then it is assumed that all species of that phase adsorb with the same strength. However, experimental evidence proves this is not the case in natural systems. Therefore, MINTEQA2 is programmed to allow adsorption of specific aqueous species of each metal (USEPA, 1999). Reaction models such as MINTEQA2 do not predict K d values as part of the data output, but rather K d is calculated from MINTEQA2 output as the ratio of equilibrium concentration of the metal sorbed to the solid phase to the dissolved metal in solution (USEPA, 1996c). MINTEQA2 calculates the mass of the contaminant phase that dissolves / adsorbs in user-defined reaction conditions (ph, redox state, temperature). The user provides surface reactions and equilibrium components expected to be utilized in the experimental system as part of the input data set. MINTEQA2 requires the consideration of sorption onto one specific mineral phase, such as ferrihydrite [Fe(OH) 3 ], rather than a heterogeneous soil mixture. Therefore, the user must also define a solid phase for sorption based on the average characteristics of the system. Since geochemical conditions, reactions and sorbents must all be defined, the determination of K d values via MINTEQA2 relies heavily on user input and interpretation. A key limitation in calculating K d values using MINTEQA2 is that sorption is defined for one aqueous contaminant phase to one solid mineral phase. This approach is conservative with respect to the fact that natural soils are mineralogically complex, and rarely consist of a single sorbent phase (USEPA, 1999). Therefore, the user is responsible for supporting the application of these results to heterogeneous soils.
220 July 2005 Appendix I APPROACHES AND PROTOCOLS FOLLOWED BY OTHER REGULATORY JURISDICTIONS 5.1 USEPA Soil Screening Guidance The USEPA soil screening guidance is outlined in Soil Screening Guidance: Technical Background Document (USEPA, 1996b). A preliminary version of this guidance was published in 1994 (USEPA, 1994). According to CSST (1996), this draft guide was the framework for the CSST matrix soil standards for the protection of groundwater. As part of USEPA (1994 and 1996b), Soil Screening Levels (SSLs) were developed to assess the ingestion of contaminated groundwater caused by migration of contaminants through soil to an underlying potable aquifer. Soil screening levels were developed for a select number of priority pollutants at waste disposal sites. The 1994 draft considered five metals (arsenic, cadmium, chromium (VI), mercury and nickel). As discussed below, the 1996 Technical Document considers 15 metals. USEPA considers soil to groundwater migration as a two-stage fate and transport process, where: 1. The contaminant is released to the soil leachate; and, 2. The contaminant is transported through the underlying soil and aquifer to a receptor well. Contaminant release in leachate is estimated using a linear equation for equilibrium partitioning between sorbed and aqueous phases, which is considered in detail in this section. The attenuation between the soil leachate concentration, and groundwater concentration at a receptor well is characterized by considering dilution of leachate in an aquifer, using a water-balance equation, and attenuation in groundwater as contaminants are transported away from the contamination source zone. A dilution factor, or dilution attenuation factor (DAF) is often used to quantify the ratio of the soil leachate concentration to the groundwater concentration at the receptor. Calculation of USEPA Soil Screening Levels The SSL is back-calculated from an acceptable groundwater concentration, which may be a maximum contaminant level (MCL) or site-specific target concentration. A DAF of 20 was selected as the default value to estimate the target soil leachate concentration. For metals, the SSL is calculated using a chemical-specific K d (Equation 4). Default values for input into Equation 4 are presented in Table 9.
221 July 2005 Appendix I (θ w + θ ah' ) SSL = C w[k d + ] ρ b Where: SSL: Soil Screening Level (mg/kg) C w : Target soil leachate concentration (L/kg) K d : Partition coefficient for a chemical (cm 3 /g) θ w : Water filled soil porosity (L water /L soil ) θ a : Air filled soil porosity (L air /L soil ) H : Henry s law constant (where H = H*42.3) ρ b : soil particle density (kg/l) (Equation 4) Table 9: Default input values used in the calculation of USEPA soil screening levels (USEPA 1996a). Parameter Units Default C w Target soil leachate concentration mg/l Chemical specific based on acceptable groundwater concentration and DAF K d Soil-water partition coefficient L/kg Chemical specific θ w Water-filled soil porosity L water /L soil 0.3 θ a Air-filled soil porosity L air /L soil n-θ w ρ b Dry soil bulk density kg/l 1.5 n Soil porosity L pore /L soil 1-(ρ b /ρ s ) ρ s Soil particle density kg/l 2.65 H' Dimensionless Henry's law constant Chemical-specific, 0 for all elements except mercury The use of Equation 4 to calculate soil screening levels requires the assumption of an infinite source of the contaminant (USEPA 1996a). This assumption is required for the calculation of K d, as discussed below. USEPA Soil-water partitioning coefficients USEPA initially considered the use of single-value soil-water partitioning coefficients calculated with the Freundlich Equation (Equation 5). K d = C s (C w n ) -1 Where: K d : Freundlich soil/water partition coefficient (L/kg) C s : Concentration sorbed on soil (mg/kg) C w : Solution concentration (mg/l) n: Freundlich exponent (dimensionless), 1 for linear adsorption (Equation 5)
222 July 2005 Appendix I In this approach, the Freundlich exponent was considered equal to 1, and C w was equivalent to the target soil leachate concentration. USEPA concluded that the determination of a generic, single-value K d value for each metal under consideration was inappropriate because it would not capture the range of conditions at a site. The decision to calculate metal specific isotherms as part of the derivation of SSLs was largely based on the dependence of sorption on the system ph, presence of clay, organic matter and iron oxides, redox conditions, major ion chemistry, and chemical speciation of the metal. This was supported by a literature review conducted by the USEPA, which identified that metal specific K d values varied by up to 7 orders of-magnitude, depending on system conditions. MINTEQ2A was utilized to estimate metal-specific isotherms due to the inherent difficulties in determining a generic K d value. A general discussion of the use of the MINTEQA2 reaction code to predict contaminant sorption is provided in Section 4; detailed discussions are provided in Alison et al. (1991) and USEPA (1999). Several assumptions were made by USEPA in creating the sorption isotherms discussed below: System equilibrium was assumed. This is a conservative estimate because of the kinetic dependence of desorption in natural systems; The redox state of the system was not considered because of the lack of reliable data when the isotherms were modeled; Sorbent surfaces were limited to iron oxide and soil organic matter. This assumption could under-predict sorption for soils with significant clay sorption sites, resulting in over-prediction of leachate concentrations; and, Metal competition was not considered. Sorption isotherms modeled by MINTEQA2 were generated for three ph values: 4.9, 6.8 and 8.0. These ph values correspond to the 7.5 th, 50 th and 92.5 th percentiles of 24,921 field measured values in the EPA STORET database. Iron oxide contents were varied based on the analysis of six aquifer samples from a wide geographic area. The lowest iron oxide content measured was considered as the low value, the average the medium value, and the highest the high value. These variable geochemical parameters are listed in Table 10.
223 July 2005 Appendix I Table 10: Geochemical parameters considered in USEPA SSL modeling effort (USEPA, 1999). Values in bold italics were used to develop parametric, metal specific isotherms. Value ph (s.u.) Iron oxide content (wt.%) Low Medium High Organic matter content (wt.%) 0.2 Parametric isotherms were generated for a number of priority pollutant metals found at hazardous waste sites. Extensive MINTEQA2 modeling conducted by the USEPA indicated that metal mobility was most affected by changes in ph. Iron oxide content is not normally measured as part of site characterization programs. Therefore, parametric isotherms were developed over a range of ph (4.9 to 8.0) under constant iron oxide (0.31 wt%) and organic matter (0.2 wt%) concentrations (USEPA 1996b). The background pore-water chemistry input into MINTEQ2A was defined based on 13 chemical constituents that commonly occur in groundwater (Table 11). A single total ion concentration was input for each chemical constituent, and pore-water chemistry was assumed to be constant. The value assigned to each pore-water constituent is a median value from a probability distribution obtained from the USEPA STORET database (USEPA, 1999). Table 11: Background porewater chemistry assumed for SSL MINTEQA2 modeling efforts (USEPA, 1999). Parameter Concentration (mg/l) Aluminum 0.2 Bromine 0.3 Calcium 48 Carbonate 187 Chlorine 15 Iron (+3) 0.2 Magnesium 14 Manganese (+2) 0.04 Nitrate 1 Phosphate 0.09 Potassium 2.9 Sodium 22 Sulphate 25
224 July 2005 Appendix I USEPA isotherms are presented in Table 12, and in Figures 3 and 4. Arsenic (III), chromium (VI), selenium and thallium isotherms are based on laboratory derived, phdependent sorption relationships. Isotherms for all other variables were estimated using MINTEQ2A. Extended isotherms used for plots and comparisons are provided in Appendix A. Table 12: Partition Coefficients for USEPA Soil Screening Level Guidance (USEPA, 1996b). Estimated K d Metal ph 4.9 ph 6.8 ph 8.0 Antimony 45 Arsenic (+3) Barium Beryllium Cadmium Chromium (+3) Chromium (+6) Cyanide 9.9 Mercury (+2) Nickel Selenium Silver Thallium Vanadium 1000 Zinc Isotherm generated using an empirical ph relationship ph-dependent values not available; data taken from Superfund Chemical Data Matrix Experimental isotherms for arsenic (III), chromium (VI), selenium and thallium were reported in Loux et al. (1991), and are based on work published in Loux et al. (1989) (Loux, Pers. Comm, March 3, 2005). This work focused on competitive cation partitioning in Wisconsin sand aquifer material (Loux, Pers. Comm.). The physical properties of Wisconsin Sand are listed in Table 13. Empirical ph-dependent adsorption relationships are reported in Table 14.
225 July 2005 Appendix I Table 13: Properties of Wisconsin Sand material used to generate empirical isotherms for As (III), Cr(VI), Se and Tl for USEPA SSL model (as reported in Loux et al. (1989)). Property Unit Measured value Porosity Wet density g/cm Dry density g/cm Specific surface area m 2 /g Total carbon content % 0.34 Inorganic carbon content % 0.17 Organic carbon content % 0.17 Amorphous iron content % Amorphous manganese content % Cation exchange capacity cmol/kg 7.1 Table 14: Empirical ph-dependent adsorption relationships derived by Loux et al. (1990) (USEPA, 1996c). Metal Species K d (L/kg) As(III) 10 (0.0322pH+1.24) Cr(VI) (-0.117pH ) 10 Sb(V) (-2.07pH ) 10 Se(VI) (-2.96pH ) 10 Tl (0.110pH ) 10 A discussion of the relation between USEPA-derived K d values in 1996 and literature reported K d values was provided in USEPA (1996b). This summary is provided as an exhibit in Appendix B MRA The USEPA developed the 3MRA system (Multimedia, Multipathway and Multireceptor Risk Assessment) in response to the 1995 Hazardous Waste Identification Rule (HWIR). The 3MRA system is a series of models for screening-level assessment of human and ecological health risks resulting from chronic exposure to contaminants. The 3MRA system consists of several components integrated into a single framework. A description of the function of the 3MRA model is beyond the scope of this document; detail is provided in USEPA (2003).
226 July 2005 Appendix I Soil matrix-water partitioning is considered within the Vadose zone and aquifer models of the 3MRA system. The soil-water partition coefficients are used to predict partitioning from contamination in soil to leachate in the unsaturated zone, and to estimate retardation due to sorption as groundwater migrates from a source zone. The approach to soil-water partitioning adopted for 3MRA was established in EPACMTP, a fate and transport model developed under the HWIR (EPA 1996c). A complete description of the use of partition coefficients in the context of the 3MRA model is provided in USEPA (2003). Non-linear soil-water partition isotherms were generated using the MINTEQA2 reaction code. The purpose of modeling with MINTEQA2 was to capture the variability of K d resulting from heterogeneity in natural systems. In order to represent the variability of geochemical conditions, concentration-dependent partition coefficients were developed for various combinations of four key parameters known to affect metal sorption (master variables). The MINTEQA2 master variables are ph, hydrous ferric oxide (HFO), particulate organic matter (POM) and labile organic matter (LOM). Representative values for master variables were calculated for conditions representing the saturated and unsaturated zones. Table 15 summarizes these values. Table 15: Master variables used to calculate non-linear adsorption isotherms for 3MRA. Unsaturated zone ph HFO POM LOM* s.u Fe wt% wt% wt% Low Medium High Saturated zone ph HFO POM LOM* s.u Fe wt% wt% wt% Low Medium High * LOM held constant at low concentration for all model iterations. Background water chemistry is considered a secondary input value. The background water chemistry was the same as that utilized in the USEPA SSL modeling effort (see Table 11). The ionic strength of the solution was held constant at moles for all MINTEQA2 model runs. Single-value partition coefficients (K d ) were determined using the MINTEQA2 data output, where the ratio of the concentration of metal sorbed to the solid phase to the concentration of the dissolved metal at equilibrium was normalized to the mass of soil with which 1 L of solution is equilibrated (USEPA, 2003). Partition coefficients were calculated for sixteen metals, including: arsenic (III), arsenic (V), cadmium, chromium
227 July 2005 Appendix I (III), chromium (VI), lead, zinc, thallium, selenium, vanadium, silver, barium, beryllium, mercury, nickel and antimony. Isotherms were generated for each respective metal by MINTEQA2. Partition coefficients were calculated for a series of total metal concentrations ranging from mg/l to 10,000 mg/l, in a range of user-defined ph, iron oxide and organic matter conditions. For example, for each model run, the organic matter, ph, and iron oxide conditions were each assigned a respective input parameter of high, medium or low; 44 K d values were generated for metal concentrations ranging from to 10,000 mg/l based on these primary geochemical input parameters. Two sets of isotherms were developed for each definition of geochemical parameters: one representative of vadose zone (unsaturated) conditions and the other of aquifer (saturated) conditions. Rather than using the K d values generated by MINTEQA2 as input for the calculation of a soil screening level (as in sections 3.0 and ), 3MRA utilizes data from the isotherms to develop risk assessment predictions. First, non-linear partition coefficient isotherms are plotted as K d versus contaminant concentration. If the model is considering vadose zone conditions, a number of K d values are averaged to generate a single K d value based on the range of metal concentrations expected to be encountered. The aquifer model considers a single K d value selected from an isotherm that corresponds to the geochemical conditions expected in the aquifer, and the maximum metal concentration encountered below the water table. The approach for modeling partition coefficients adopted for 3MRA is considered by USEPA (2005) to be an improvement relative to the 1996 USEPA SSL and EPACMTP approaches, as outlined below: Thermodynamic data were appended to and updated within the MINTEQA2 thermodynamic database, making it possible to model the behavior of several additional metals, including arsenic(iii), arsenic(v), antimony, beryllium, chromium (VI), cobalt, selenium and vanadium (The USEPA (1996b) modeling approach was restricted to empirical an empirical ph dependent relationship, as discussed in Section ); The database of hydrous ferric oxide sorption reactions was expanded to include sorption reactions for arsenic, antimony, beryllium, chromium (VI), cobalt, selenium and vanadium; The database of metal-organic matter reactions was updated and expanded; The hydrous ferric oxide content was decreased by a factor of 10. This reduction was warranted based on comparisons of MINTEQA2 estimates of K d with literature values;
228 July 2005 Appendix I The ionic strength was held constant at moles for all MINTEQA2 simulations; and, Precipitation of trace metal solid phases was not permitted; only solid phases of major ions, such as iron and aluminum oxyhydroxides were allowed to precipitate during MINTEQA2 model runs. 5.2 Selected U.S. States Washington State In Washington State, soil concentrations protective of groundwater are defined by the Washington State Model Toxics Control Act (MTCA) Cleanup regulations, Chapter Washington State has worked to establish soil concentrations that will not cause contamination of groundwater at levels that exceed state groundwater cleanup levels. Under Washington Administrative Code (WAC) , several methods are permitted for derivation of soil concentrations. The reason for providing several methods is to tailor the method to the hazardous substance or site. Methods recommended by Washington State for deriving soil concentrations are outlined in Table 16. Table 16: Washington State recommended methods for deriving soil concentrations for the protection of groundwater under WAC Method Fixed parameter three-phase partitioning model Variable parameter three-phase partitioning model Four-phase partitioning model Purpose To establish soil concentration for any substance. To establish soil concentration for any substance. Use at sites contaminated with petroleum hydrocarbons, where hazardous substances are present in soil as non-aqueous phase liquids (NAPLs) Site specific data/material required No Yes Yes 4 Leaching tests To establish soil concentrations for metals. Yes 5 6 Alternative fate and transport models Empirical demonstration Fate and transport models other than the three/four phase partitioning model. To prove that measured soil concentrations will not cause an exceedance of the groundwater cleanup levels. Yes Yes
229 July 2005 Appendix I Methods 1, 2, 4, 5 and 6 are applicable to metals. Only methods 1, 2 and 4 are considered in detail below; for further detail on legislation in Washington State, refer to WAC Methods 1 and 2 (fixed and variable parameter three-phase partitioning model) take an approach similar to that proposed by the USEPA for the derivation of soil concentrations. The fixed approach considers input values to Equation 6 that are considered to be protective under most circumstances. The variable approach considers site-specific input parameters. Equation 6 is used to calculate protective soil concentrations. Table 17 lists input parameters used for Method 1. Cs = Cw ( UCF ) DF θw + θahcc Kd ρb (Equation 6) Where: C s : Soil concentration (mg/kg); C w : Groundwater cleanup level established under WAC (µg/l); DF: Dilution factor (dimensionless); K d : Metal partition coefficient; Θ w : Water-filled soil porosity (ml water/ml soil; Θ a : Air-filled soil porosity (ml air/ml soil); H cc : Henry s Law constant (dimensionless) ρ b : Dry bulk soil density (kg/l) Table 17: Default input values used in the calculation of Washington State soil screening levels (WAC, 2001). Parameter Units Default C w Target soil leachate concentration mg/l Groundwater cleanup level established under WAC K d Soil-water partition coefficient L/kg Chemical specific θ w Water-filled soil porosity L water /L s 0.3 θ a Air-filled soil porosity L air /L soil 0.13 ρ b Dry soil bulk density kg/l 1.5 H' Dimensionless Henry's law constant oil Chemical-specific, 0 for all elements except mercury
230 July 2005 Appendix I The variable approach considers site-specific conditions, and therefore the values listed in Table 17 are not utilized in the soil concentration calculations. Metal partition coefficients are provided by WAC 2001 (Table 18). For metals not listed in Table 18, K d values may be developed from site data, batch tests or taken from the scientific literature. Calculating a K d from site data considers the ratio of the concentration of metal in soil to the concentration of metal in pore water. This approach may not be conservative for all metals or all hazardous sites. The derivation of K d values using batch tests is reviewed in Section Table 18: Metal partition coefficients recommended for use under WAC (WAC, 2001). Metal * K d Arsenic 29 Cadmium 6.7 Chromium (total) 1000 Chromium (VI) 19 Copper 22 Mercury 52 Nickel 65 Lead Selenium 5 Zinc 62 * Metal K d values compiled by Washington State Department of Ecology from multiple sources. An alternative to using the three-phase partitioning model to determine K d values for metals listed in Table 18 is to utilize leaching tests to derive soil concentrations. Two leaching tests are recommended by Washington State: the Synthetic Precipitation Leaching Procedure (SPLP USEPA Method 1312) and the Toxicity Characteristic Leaching Procedure (TCLP USEPA Method 1311) (Table 19).
231 July 2005 Appendix I Table 19: Summary of leaching procedures recommended for the derivation of soil concentration levels in Washington State. Method Procedure Overview Limitations Synthetic Precipitation Leaching Procedure Toxicity Characteristic Leaching Procedure SPLP TCLP USEPA Method 1312 USEPA Method 1311 Soil leached with water with a ph representative of acid rain in the western US (ph 5) Soil leached with water with a ph representative of organic acids generated by biological degradation (ph 4.93). May underestimate groundwater impacts under acidic conditions (ph < 6) Intended to represent acidic conditions due to biological degradation in landfills. May underestimate groundwater impacts in alkaline conditions (ph 8) Under WAC , it is stated that the analytical method used for the soil leachate must be sensitive enough to quantify hazardous substances at concentrations at the groundwater cleanup level: For cadmium, lead and zinc, the effluent concentration must be less than or equal to 10 times the applicable groundwater cleanup level; For arsenic, total chromium, chromium (VI), copper, mercury, nickel and selenium, the leaching test effluent concentration must be less than or equal to the applicable groundwater cleanup level. Further information describing the approach adopted by Washington State for the determination of soil cleanup levels is listed in Chapter of WAC New Jersey Soil remediation standards protective of groundwater for mobile contaminants were developed in New Jersey in response to the Brownfield and Contaminated Site Remediation Act N.J.S.A. 58:10B-12c(1). Subsurface Soil Cleanup Standards for the Soil-to-Groundwater pathway adopted by the State of New Jersey are outlined in New Jersey Department of Environmental Protection (NJDEP)(2005), and references therein. The NJDEP, in part, adopted the USEPA Soil Screening Level approach to develop soil cleanup standards (Equation 7). Because the Brownfield and Contaminated Site Remediation Act requires the department to avoid the use of unrealistic or conservative assumptions when determining generic remediation standards, a balance of conservative and typical values was chosen for input parameters.
232 July 2005 Appendix I Conservative values are protective of groundwater and are reflective of conditions that actually occur in the state; and, Typical values reflect common conditions, or conditions that are between extremes observed in New Jersey. As outlined in Section 5.1, the USEPA SSL Equation considers equilibrium partitioning between sorbed (solid), water and air phases. Equation 7 calculates the total amount of contaminant remaining in soil such that the aqueous phase concentration will not exceed the groundwater criteria. A dilution-attenuation factor (DAF) is included to account for soil water dilution upon mixing with groundwater. IGWSRS = C DAF = 1 + gw Kid IL θ w + θah' K d + DAF ρb Where: IGWSRS: Impact to groundwater soil remediation standard (mg/kg) C gw : Health-based New Jersey groundwater quality criteria (mg/l) K d : Soil water partition coefficient (L/kg) Θ w : Water-filled soil porosity (L water/l soil) Θ a : Air filled soil porosity (L air/l soil) H cc : Henry s Law constant (dimensionless) ρ b : Dry bulk soil density (kg/l) DAF: Dilution-attenuation factor i: gradient (m/m) d: mixing zone depth (m) I: Infiltration rate (m/year) L: Length of area of concern parallel to groundwater flow (m) K: aquifer hydraulic conductivity (m/year) (Equation 7) Default values for use in Equation 7 are listed in Table 20. For parameters that do not follow region-specific trends, such as chemical properties, USEPA default values were adopted. For properties such as soil parameters, values specific to New Jersey conditions were assumed.
233 July 2005 Appendix I Table 20: Default input values for the calculation of New Jersey soil screening levels (New Jersey, 2005). Parameter Units Default C gw Groundwater criteria mg/l Groundwater quality criteria K d Soil-water partition coefficient L/kg Chemical specific H' Dimensionless Henry's law constant Chemical-specific, 0 for all elements except mercury ph Soil ph s.u. 4.9 or 6.8 Soil texture sandy loam N Soil porosity v/v 0.41 Foc Fraction organic carbon kg/kg θ w Water-filled soil porosity L water /L soil 0.23 θ a Air-filled soil porosity L air /L soil 0.18 ρ b Dry soil bulk density kg/l 1.5 DAF Dilution and attenuation factor 12 K*i Aquifer hydraulic conductivity*gradient m/year 30 d Mixing zone depth m 3.05 I Infiltration rate m/year 0.28 L Length parallel to groundwater flow m 30.5 The K d values were adopted from values in the USEPA SSL guidance (see Section 5.1, and Table 12). The K d values for inorganic contaminants are only considered for ph values of 4.9 and 6.8 (whichever value yields the lowest K d value, which is conservative). This ph range was selected because the ph of soil in New Jersey ranges from ph 4 to 6.5. Where K d values were not available as part of the USEPA SSL guidance, partition coefficients were adopted from the Superfund Chemical Data Matrix (New Jersey, 2005). A complete list of K d values is provided in NJDEP (2005). The Brownfield and Contaminated Site Remediation Act authorizes the use of Impact to Groundwater Alternative Remediation Standards (IGWARS). The purpose of utilizing IGWARS instead of IGWSRS is to generate site-specific characteristics that produce more accurate remediation values. Site-specific remediation standards recommended in NJDEP (2005) include: a. Modification of input parameters to Equation 7 to reflect site-specific data (including ph, soil organic carbon and the DAF) in order to calculate a site specific remediation standard; b. Determination if the contaminant of concern is on the Department s list of immobile chemicals; immobile chemicals may not require remediation as they generally do not result in exceedances of groundwater quality criteria;
234 July 2005 Appendix I c. Perform the Synthetic Precipitation Leaching Procedure (SPLP) to determine the sitespecific leaching potential for metals. SPLP measures desorption, rather than adsorption, accounting for irreversible adsorption of contaminants to soil. A complete description of how New Jersey utilizes the results of SPLP tests for soil screening level determination is provided as an exhibit in Appendix C; d. Conduct transport modeling to calculate a site-specific remediation standard; e. Conduct vadose zone and groundwater modeling to calculate a soil remediation standard; f. Evaluate site specific groundwater, soil analytical results and water table conditions; if no groundwater impacts are observed, site remediation may not be required. A complete description of the recommended use of the six alternative strategies for deriving soil standards is provided in NJDEP (2005) New Mexico The New Mexico Environment Department (NMED) adopted two approaches to develop soil screening levels: a generic model, and a site-specific model (NMED, 2000). Both models use the same set of equations to calculate SSLs based on scenarios that are protective of groundwater. The generic model calculates SSLs using default parameter conditions representative of those expected in New Mexico. The site-specific model utilizes site specific meteorological, soil and hydrological data to calculate SSLs. Soil leachate SSLs are developed by defining a DAF that accounts for leachate mixing in the aquifer. A leachate concentration protective of groundwater is calculated by multiplying the groundwater standard concentration by the DAF (Equation 8). This leachate concentration is used to calculate a SSL protective of groundwater using an equilibrium partition coefficient (K d ). New Mexico utilizes the approach developed by USEPA (1996b) to derive soil-water partition coefficients for input to the leaching to groundwater pathway (Equation 9, Table 21). Further detail related to the development of New Mexico soil screening guidelines is provided in NMED (2000). C w = WQCC * DAF (Equation 8) Where: Cw: Target soil leachate concentrations; mg/l WQCC: Water quality control concentration (water quality standard); mg/l DAF: Dilution attenuation factor
235 July 2005 Appendix I (θ w + θ ah' ) SSL = C w[k d + ] ρ b Where: SSL: Soil Screening Level (mg/kg) C w : Target soil leachate concentration (L/kg) K d : Partition coefficient for a chemical (cm 3 /g) θ w : Water-filled soil porosity (L water /L soil ) θ a : Air-filled soil porosity (L air /L soil ) H : Henry s law constant (where H = H*42.3) ρ b : soil particle density (kg/l) (Equation 9) Table 21: Default input values used in the calculation of New Mexico soil screening levels (NMED, 2000). Parameter Units Default C w Target soil leachate concentration mg/l Chemical specific maximum contaminant level K d Soil-water partition coefficient L/kg Chemical specific θ w Water-filled soil porosity L water /L soil 0.26 θ a Air-filled soil porosity L air /L soil n-θ w ρ b Dry soil bulk density kg/l 1.5 n Soil porosity L pore /L soil 1-(ρ b /ρ s ) ρ s Soil particle density kg/l 2.65 H' Dimensionless Henry's law constant Chemical-specific, 0 for all elements except mercury 6.0 SUMMARY, EVALUATION AND IMPLICATIONS OF REGULATORY APPROACHES FOR THE METAL-GROUNDWATER PATHWAY The purpose of this section is to summarize and compare methods for estimating soilmetal partition coefficients used to derive soil screening levels. The intent is to evaluate the current CSST protocol in light of scientifically-defensible methods utilized in other jurisdictions. The implications of adopting similar approaches to determine soil-water partition coefficients are considered and recommendations are provided. 6.1 Overview of regulatory methods of soil-water metal partition coefficient determination Soil screening levels are calculated based on unsaturated zone partitioning of metals from soil to pore-water. Appendix D presents a comparison of three regulatory approaches of deriving soil-water partitioning coefficients. The province of British Columbia utilized
236 July 2005 Appendix I the Contaminated Sites Soil Task group (CSST) protocol to generate soil screening levels for six metals. The CSST protocol is based on draft USEPA Soil Screening guidance published in 1994 (CSST 1996). In 1996, USEPA published a protocol for derivation of soil screening standards for 15 metals based on soil-water partitioning coefficients calculated for standard geochemical conditions (USEPA, 1996b). This effort utilized MINTEQA2 to develop soil-water partitioning coefficients based on surface complexation of metals to charged iron oxide surfaces. The USEPA developed K d values for three specific ph conditions: 4.9, 6.8 and 8.0. The CSST (1996) / USEPA (1996b) approach was developed with the intent of developing standard site/soil independent metal partitioning coefficients for soil screening level prediction. A downfall of the USEPA / CSST approach is that metal Kd results were parameterized only for ph under a set of standard iron oxide and organic matter input representative of average conditions in the United States. Sorbtive substrates including clay minerals, Mn-oxides and carbonate minerals were not considered. The 3MRA approach of deriving K d values is the most transparent of all methods reviewed (USEPA 1996c, USEPA 2003). Soil-water metal partition coefficients are utilized in 3MRA for multi-pathway risk assessment. The 3MRA model utilized MINTEQA2 to calculate partitioning coefficients for metal concentrations ranging from to 10,000 mg/l. The results were further parameterized according to hydrous ferric oxide (HFO), particulate organic matter (POM) and labile organic matter (LOM) content. The advantage of the 3MRA approach is that the results are parameterized for a variety of site conditions, and all modeling was completed with MINTEQA2 to generate non-linear isotherms. Regulatory jurisdictions within the United States, including Washington State, New Jersey, and New Mexico have adopted parts of the USEPA SSL method of soil screening level prediction. All three jurisdictions use variations of Equation 4 to generate soil screening levels. The approach to metal partitioning for the purpose of generic soil screening levels is approximately the same in all jurisdictions: New Jersey uses a combination of USEPA SSL and Superfund Chemical Data Matrix partition coefficients, New Mexico has adopted the USEPA SSL partition coefficients and Washington State provides a set of non-parameterized partition coefficients developed by the Washington Department of Ecology. In addition, New Jersey and Washington State provide a number of options for developing site-specific soil screening levels. Site-specific soil screening levels may be generated by utilizing site specific data in the USEPA soil screening level equation, or by conducting chemical tests on site soils to generate partitioning coefficients or estimates of chemical mobility. Site-specific soil screening levels are
237 July 2005 Appendix I based on the behavior of a given metal under specific physical and chemical conditions, therefore this method is limited by the fact that values cannot be used to generate generic soil screening levels. A comparison of partitioning coefficients utilized by CSST (1996), USEPA (1996b), 3MRA (2003) and standard literature values is presented in Table 22. It should be noted that the literature values presented in Table 22 were generated for a wide variety of site conditions, using various testing methods. 6.2 Evaluation of CSST soil-water partitioning coefficients Chromium (VI) Metal-water partitioning coefficients for chromium (VI) presented in CSST (1996) and USEPA (1996b) are fundamentally similar, as they were developed based on results of empirical ph-k d relationships (Figure 5). This isotherm was developed in an empirical system that contained 0.34 % total carbon (0.17 wt% total organic carbon), and wt% amorphous iron oxide (Loux, Pers. Comm., March 3, 2005). In summary: CSST and USEPA isotherms show very little variation with ph. The Cr(VI) K d varies from 31.4 to 13.6 L/kg over a ph range from 4.9 to 8. Literature K d values for chromium (VI) are orders of magnitude higher than those reported in CSST / USEPA (Table 22). This reflects the variability of soil-water partitioning in response to site-specific conditions. Chromium (VI) isotherms generated as part of 3MRA are presented in Figures 6 and 7. The USEPA input assumptions correspond roughly to medium particulate organic matter and high hydrous ferric oxide conditions simulated in 3MRA. The purpose of these plots is to demonstrate the dependence of Cr (VI) sorption on site-specific parameters. Chromium (VI) sorption is complex and appears to be affected by both iron oxide and POM concentrations. In summary: 3MRA K d values decrease with increasing ph. 3MRA K d s are less than the CSST isotherms in circumneutral to weakly alkaline ph conditions with 0.05 wt% Fe This relationship is outlined in Table 22. 3MRA Kd values are less than CSST values under the range of modeled ph conditions where the iron oxide concentration equals wt% Arsenic (III) Metal-water partitioning coefficients for arsenic (III) were also developed based on results of empirical ph-k d relationships (Figure 8). As for Cr(VI), the isotherm was developed in an empirical system that contained 0.34 % total carbon (0.17 wt% total
238 July 2005 Appendix I organic carbon), and wt% amorphous iron oxide (Loux, Pers. Comm., March 3, 2005). In summary: The arsenic (III) K d varies from 25 to 31.4 L/kg over a ph range from 4.9 to 8. Literature K d values for arsenic (III) may be up to 25 times greater than those recommended in CSST / USEPA guidance (Table 22). Arsenic (III) isotherms generated as part of 3MRA are presented in Figure 9. The USEPA input assumptions correspond roughly to medium particulate organic matter and high hydrous ferric oxide conditions simulated in 3MRA. Arsenic (III) sorption appears to be controlled primarily by the iron oxide content, and secondarily by the ph of the system; POM has little impact on arsenic sorption. In summary: 3MRA Kd values are lower than the CSST / USEPA isotherms where the iron oxide concentration equals wt%. 3MRA K d values are greater than the CSST isotherms in circumneutral to weakly alkaline ph conditions with 0.02 to 0.05 wt% Fe, as outlined in Table Zinc Figure 10 compares the CSST-recommended isotherms for zinc to the USEPA (1996b) isotherm. Generally, at ph less than 6, USEPA K d values are higher than CSST, and are less conservative. In higher ph conditions, CSST isotherms are slightly less conservative than USEPA (1996b) recommended values. In summary: The wide range of partitioning coefficients adopted by CSST (1.6 to L/kg) corresponds well with the range presented in literature (Table 22). Zinc was further analyzed to summarize the impact of conservative input estimates for metal K d generation. Figures 11 and 12 present isotherms developed for a number of iron oxide, particulate and ph conditions in the vadose zone. As demonstrated in Figures 12 and 13, zinc sorption behavior varies as a function of iron oxide and particulate organic matter concentrations, and ph. General comparisons of zinc isotherms as developed using ph as the sole variable parameter, and POM / HFO / ph as variable parameters are provided below. In summary: Zinc soil-water partitioning coefficients generated by USEPA (1996b)/3MRA are generally lower than the CSST values in circumneutral to weakly alkaline ph conditions, and are therefore more conservative. In low ph conditions (ph 4.8), the 3MRA and USEPA K d values are generally greater than the CSST values.
239 July 2005 Appendix I Cadmium Figure 13 compares the CSST-recommended isotherms for cadmium to the USEPA (1996b) isotherms. Generally, at ph less than 6.6, USEPA K d values are higher than CSST, and are less conservative. CSST isotherms are slightly less conservative than USEPA(1996b) recommended values where the ph is greater than 6.6. In summary: Cadmium partitioning coefficients reported by CSST for a ph range of 4.9 to 8.0 range from 0.6 to 4597 L/kg, which agrees well with USEPA values ranging from 0.61 to 4467 L/kg. However, CSST (1996) reports a cadmium K d of L/kg for ph 8.1, which does not correlate with either the trend reported by CSST or the USEPA (1996b) values Copper Copper isotherms were not generated as part of the USEPA SSL or 3MRA efforts. USEPA SSLs were intended for use in modeling fate and transport at waste disposal facilities where copper was not considered a priority pollutant (Jerry Allison, Pers. Comm.). There is no background information describing the derivation of CSST copper partitioning coefficients. CSST copper Kd values range from 39.8 L/kg (ph 4.9) to L/kg (ph 8). Further, CSST recommends the use of copper isotherms as surrogates for lead K d values. Copper is generally more mobile than lead in aqueous systems Lead Lead isotherms were not generated as part of the USEPA SSL effort. However, 3MRA considered lead soil-water partitioning. Results of 3MRA modeling are presented as part of Figures 14 through 16. Lead has the highest K d values of all metals modeled as part of the 3MRA (Jerry Allison, Pers. Comm). 3MRA lead partition coefficients presented in Table 23 are generally less conservative than CSST isotherms. Therefore, the use of copper K d values as surrogates for lead partitioning is not defensible or conservative. The CSST recommended lead K d values range from 39.8 to L/kg. As outlined in Figure 14, 3MRA lead partition coefficients are generally higher than those predicted by CSST. In comparison to the parameterized results generated by 3MRA, CSST lead partition coefficients are overly conservative (ie. Lower K d values) in circumneutral to weakly alkaline ph (6.8 to 8), medium to high iron oxide concentration (0.02 to 0.05 wt %) systems (Figures 15, 16). 3MRA K d values are generally greater than those proposed by CSST.
240 July 2005 Appendix I Limitations to current regulatory approaches Several limitations exist with respect to the use of empirical and MINTEQA2-derived soil-water partition coefficients: The result of the USEPA (1996b) modeling effort has been the creation of a generic partition coefficient look-up table, parameterized for ph assuming constant geochemical conditions. Not taking into account the diversity in site conditions may result in under- or over-estimation of actual partition coefficients in natural soils. The result of the 3MRA modeling effort (USEPA 2003) was a more transparent, parametric approach to Kd determination, conducted for a large dataset of metals, where the effect of varying different master geochemical parameters was evaluated. The 3MRA assumptions may not necessarily be suited for site conditions in British Columbia. In many cases, the Kd values generated using average HFO and POM concentrations during the USEPA SSL effort vary over orders-of-magnitude from those predicted using parameterized HFO and POM in the 3MRA effort. This highlights the difficulty in predicting metal mobility based on certain default geochemical conditions and input parameters. Neither the USEPA or 3MRA approaches account for metal sorption on clays, manganese oxides or carbonate minerals. Therefore, these models may under-predict sorption with respect to natural conditions. As illustrated in Table 22, the natural variability of empirical K d values is quite large for each metal. The USEPA (1996b) and 3MRA MINTEQA-2 isotherms are both higher and lower than the empirical values. This highlights the uncertainty in defining a standard K d parameter set. Varying K d parametrically with respect to ph (as in CSST, 1996 and USEPA 1996b) in some cases fails to produce results with a range comparable to literature values. However, this does not necessarily indicate a failure on the part of the CSST / USEPA approach, as literature values may also be biased towards conditions that may not be representative of typical sites. 6.4 Discussion and Recommendations The USEPA (1996b) partition coefficients were developed following an in-depth review of methods for predicting metals partitioning and comparison to empirical data, although the database of test data used to estimate the mean HFO (six samples) was limited. There are significant limitations associated with the USEPA approach, as described above; however, for the purposes of deriving generic soil standards, there does not appear to be a
241 July 2005 Appendix I better approach that would be practical for use in British Columbia. This is reflected in guidance from several other regulatory jurisdictions, which essentially have adopted the USEPA ph-dependent isotherms. Discussions with the experts (Jerry Allison, Allison Geoscience; Robert Truesdale, RTI International) who were instrumental in developing the USEPA and 3MRA guidance over the past decade also indicate for generic standard purposes, it would be difficult to improve upon the USEPA approach, in the absence of site specific data for key geochemical parameters. The 3MRA isotherms provide additional flexibility through a parameterized approach based on site-specific ph, pore-water metal concentration, iron oxide concentration, and organic matter concentrations. While use of the 3MRA approach could be useful for sitespecific development of standards, it is not considered practical for development of generic soil standards since parameters such as iron oxide and organic matter content are not measured in typical site investigations in British Columbia. Also, it is noted that the 3MRA iron oxide contents are considerably lower than those presented in literature (Battelle, 1989) and in previous models (USEPA, 1996b). These lower iron oxide contents may be overly conservative with respect to natural conditions in British Columbia. The 3MRA isotherms are useful in a general sense in terms of providing information that could be used to benchmark the USEPA isotherms. In approximate terms, the 3MRA isotherms are similar the USEPA isotherms for similar input values and low concentration ranges. Neither USEPA or 3MRA include isotherms for copper. CSST recommends an isotherm for copper, however it s genesis is not documented. It is not suggested that the current CSST isotherm be adopted for further modeling efforts. Rather, it is recommended that a suitable isotherm be developed for copper partitioning using the MINTEQA2 thermodynamic database (1996b). Iron oxide and organic matter concentrations should be based on average concentrations detected in B.C. soils. The CSST protocol assumed that the K d isotherm for copper could be used as a surrogate for lead partitioning. This is not considered scientifically defensible, as copper and lead behave quite differently in natural environments. Copper is considerably more mobile than lead and therefore, the lead isotherms recommended by CSST are not conservative. There is no USEPA isotherm for lead; therefore, it is recommended that a suitable isotherm be developed for lead partitioning using the MINTEQA2 thermodynamic database. Iron oxide and organic matter concentrations should be based on average concentrations detected in B.C. soils. An alternative approach is to adopt a multi-tiered system of site investigation, such as those in place in Washington State and New Jersey. In these jurisdictions, regulations
242 July 2005 Appendix I provide the option of using a generic set of soil screening levels (USEPA SSLs in New Jersey, or single value K d s recommended by the Department of Ecology in Washington State). However, several other site-specific methods of developing soil screening levels are provided for use, including the option of using site-specific geochemical parameters to develop partitioning coefficients, or the use of leach tests to develop soil screening levels or partitioning coefficients. A similar protocol involving leaching tests to evaluate metals partitioning has been developed by the Science Advisory Board (SAB) of British Columbia. However, this type of framework can not be easily used to develop generic soil standards. Recommendations Adopt the partition coefficients recommended by USEPA (1996b) for the following metals: antimony; arsenic(iii); barium; beryllium; cadmium; chromium(iii); chromium (VI); cyanide; mercury (II); nickel; selenium; silver; thallium; vanadium; and, zinc (Tables 22a and 22b). Develop an isotherm for lead using the MINTEQA2 thermodynamic database, assuming iron oxide and organic matter input values representative of conditions encountered at contaminated sites in British Columbia. An interim K d isotherm was derived using 3MRA isotherms for mid-range iron oxide and high range organic matter conditions, with an iron oxide concentration of 0.05 wt% and organic matter concentration of 0.33 wt%. Develop an isotherm for copper partitioning using MINTEQA2 thermodynamic database, assuming conditions representative of iron oxide and organic matter concentrations at contaminated sites in British Columbia. 6.5 Implications The implications of the above recommendations are evaluated through comparison of example soil standards for protection of aquatic life pathway, calculated using the CSSTrecommended metal partitioning coefficients and USEPA Soil Screening Level partitioning coefficients (Table 23). The soil standards in Table 23 are developed for ph ranges recommended in the CSR matrix standards (Schedule 5). The soil standard was back-calculated using Equation 11, using a dilution attenuation factor (DAF) of 3.29, which was the factor using for the CSST derivation of soil standards. The comparison in Table 23 present both the CSST and USEPA K d s used as input (Columns 6 and 10), and the calculated soil standards (Columns 7 and 11). The soil standards are equal to the sum of the soil-based standard and the background soil concentration.
243 July 2005 Appendix I C s n u = C L * DAF * K d + ( ) ρ b Where: C s : Calculated toxicity based soil standard (Columns 6 and 10) C L : Receptor groundwater concentration DAF: Dilution attenuation factor (3.29) K d : Soil-water metal partition coefficient (L/kg) (Columns 5 and 9) n u : Water filled porosity (0.1) ρ b : Dry bulk density of soil (g/cm 3 ) (1.75) (Equation 11) For metals that were considered by both CSST and USEPA (1996b), the comparison indicates: 1. The example soil standards for arsenic (III) and chromium (VI) are virtually identical within a ph range of 5 to The example soil standards for cadmium and chromium (III), calculated using the USEPA K d values, are higher than the CSST derived standards. 3. The example lead soil standards, calculated using 3MRA isotherms based on an iron concentration of 0.05 wt% and an organic matter concentration of 0.33 wt%, are lower than the CSST derived standards. 4. The example zinc soil standard, calculated using the USEPA K d values, is slightly greater than the CSST derived standard at ph less than 6.0, but are less than the CSST standards above ph of 6.0. USEPA K d values and example soil standards for chromium (III), mercury and nickel, which are not included in the CSST (1996) protocol, are provided in Table 23.
244 July 2005 Appendix I REFERENCES AECL (Atomic Energy of Canada Limited) A critical compilation and review of default soil solid/liquid partition coefficients, Kd, for use in environmental assessments. By DH Thibault, MI Sheppard, and PA Smith, Whiteshell Nuclear Research Establishment, Pinawa, Manitoba. Allison, J.D., Brown, D.S. and Novo-Gradic, K.H MINTEQA2/PRODEFA2. A chemical assessment model for environmental systems: Version 4.0 User s Manual. EPA/600/3-91/021. U.S. Environmental Protection Agency, Athens, GA. Baes, C.F. (III), and Sharp, R.D A proposal for estimation of soil leaching and leaching constants for use in assessment models. Journal of Environmental Quality Baes, C.F (III), Sharp, R.D., Sjoreen, A.L. and Shor, R.W A review and analysis of parameters for assessing transport of environmentally released radionuclides through agriculture. Oak Ridge National Laboratory report ORLN ORNL, Oak Ridge, TN. Battelle Memorial Institute Chemical databases for the multimedia environmental pollutant assessment system (MEPAS): Version I. Prepared for the US Department of Energy under Contract DE-AC06-76RKI 1830 by Pacific Northwest Laboratory, operated by Battelle Memorial Institute. Coughtry, P., Jackson, D and Thorne, M Radionuclide distribution and transporting terrestrial and aquatic ecosystems: a compendium of data. AA Balkam, Netherlands, Vol. 6. Freeze, R.A. and Cherry, J.A Groundwater. New Jersey: Prentice-Hall Inc. 604 p. Langmuir, D Aqueous Environmental Geochemistry. New Jersey: Prentice-Hall Inc. 600 p. Langmuir, D., Chrostowski, P, Vigneault, B. and Chaney, R Issue paper on the environmental chemistry of metals. EPA 68-C U.S. Environmental Protection Agency, Washington, D.C.
245 July 2005 Appendix I Loux, N.T., Brown, D.S., Chafin, C.R., Allison, J.D., and Hassan, S.M., "Chemical speciation and competitive cationic partitioning on a sandy aquifer material", Journal of Chemical Speciation and Bioavailability, 1 (3) Loux, N.T., Chafin, C.R., and Hassan, S.M. Statistics of Aquifer Material Properties and Empirical, ph-dependent Partitioning Relationships for As(III), As(V), Ba(II), Be(II), Cd(II), Cr(VI), Cu(II), Hg(II), Ni(II), Pb(II), Sb(V), Se(IV), Se(VI), Tl(I), and Zn(II). Internal report submitted to the EPA Office of Solid Waste, February, [NJDEP] NJDEP SRWM Regulations: Soil remediation strategies. February 15, < < Accessed March 10, NMED Technical background document for development of soil screening levels. New Mexico Environment Department Hazardous Waste Bureau and Groundwater Quality Bureau Voluntary remediation program. USEPA DRAFT Soil Screening Guidance. Office of Solid Waste and Emergency Response. U.S. Environmental Protection Agency. Washington, D.C USEPA. 1996a. Soil Screening Guidance: User s Guide, April Office of Solid Waste and Emergency Response. EPA/540/R-96/018. Washington, D.C. USEPA. 1996b. Soil Screening Guidance: Technical Background Document, May Office of Emergency Response. EPA/540/R-95/128 PB Washington, D.C. USEPA. 1996c. EPA s Composite model for leachate migration with transformation products Background document for EPACMTP. U.S. Environmental Protection Agency, Office of Solid Waste, Washington, D.C. USEPA Understanding variation in partition coefficient, Kd, values. EPA 402-R A&B. USEPA Multimedia, Multipathway and Multireceptor Risk Assessment (3MRA) Modeling System. U.S. Environmental Protection Agency, Office of Solid Waste, Washington, D.C. EPA 530-D a.
246 July 2005 Appendix I USEPA Changes to MINTEQA2 modeling procedure for estimating metal partition coefficients in groundwater for HWIR99. Office of solid waste. Washington, D.C. Washington Administrative Code, Model Toxics Control Act, Cleanup Regulation, Chapter WAC. Publication No Amended February 12, 2001.
247 3/30/2005 Table 3 Partition Coefficients for BCE Groundwater Model (CSST, 1996). U ph K d ** K d K d ** K d K d * K d As(+3) Cd Cr(+6) Cu(+2) Pb Zn (+2) * * * * * * * * * * * * * * * * * * * * * * * * * * * * * * * * * Pb values assumed to be the same as those presented for copper. ** Derived based on empirical Kd-pH relationship. Kd values equal to those presented in USEPA 1996b. Kd values less than USEPA 1996b. Kd values greater than USEPA 1996b. metals app TABLES App A App D FINAL GOLDER ASSOCIATES
248 3/30/2005 Table 7 Summary of the use of batch tests and flow through column methods to developing soil-water partition coefficients (adopted from USEPA, 1999). U Model Assumptions Formula Advantages Disadvantages Batch tests 1. The rate of adsorption is assumed to equal the rate of Vw(C o C i) - Inexpensive, fast, and simple methodology. desorption; Kd = M - Procedure is easily varied to address the system in sedci 2. Only one type of adsorption site, and one type of question dissolved contaminant exists; 3. The activity of the solid is equal to 1; 4. Equilibrium is maintained during the mixing period; 5. No adsorption on suspended colloids occurs; and, - If a number of batch tests are performed using a variable input concentration, an isotherm can be generated which can be input to the Langmuir or Freundlich models. 6. No precipitation of the contaminant phase occurs. Where: K d : Partition coefficient V w : Solution volume C o : Initial concentration of contaminant in solution C i : Final concentration of contaminant in solution M sed : Mass of soil sample - No distinction of how the sorbate is associated with the soil (adsorption, absorption or precipitation). - Equilibrium and reaction reversibility, are rarely maintained when adsorption is measured in the lab. - Physical variations such as particle size distribution, method of solute addition, solid-solution separation methods, and temperature can result in large variability in results. - Mixing is rarely achieved. - Desorption is the dominant process in contaminant transport, and desorption processes are much slower than adsorption. Therefore, the measurement of adsorption in solution may result in overly conservative estimates of K d. - The speciation of the inorganic phase in solution may impact it s sorption tendency in natural systems. Flow through 1. There is a relationship between Kd and the retardation columns factor (Rf); and, 2. Water flow and contaminant dispersion in the system are constant. n n R f = + e R f = 1+ Kdρ ne Kdρb n e Kdρb Rf = 1 + n Kdρb Rf = 1 + θ Where: R f : Retardation factor K d : Partition coefficient n: Total porosity n e : Effective porosity θ: Volumetric water content in vadose zone ρ b : Bulk density b - Sorption can be measured under the simulation of field conditions, hydrodynamic effects (dispersion) and chemical phenomena (multiple species and reaction reversibility). - Flow through systems are rarely at equilibrium therefore results are specific to the flow conditions the experiment was performed under. - It is known that measured Kd varies with flow velocity and column dimensions. - Equipment is expensive, and experiments are complicated and time consuming (USEPA, 1999). metals app TABLES App A App D FINAL GOLDER ASSOCIATES
249 3/30/2005 Table 22 Comparison of K d values reported in literature to CSST, USEPA and 3MRA K d values (adapted from USEPA 1996b). U Metal AECL Baes and Sharp (1983) or Coughtrey et al Batelle CSST* USEPA* (1990) a (1985) c (1989) d 3MRA** Baes et al (1984) b (1996) (1996b) Range Geometric mean Range Range Range Range Range Range Antimony f Arsenic e f Arsenic (+3) g i Arsenic (+5) g Barium f Beryllium f Cadmium h Chromium f Chromium (+2) g Chromium (+3) Chromium (+6) g i Copper Lead j Mercury e f Nickel f -- ~ Selenium f -- < Silver h Thallium f Vanadium f Zinc h >/= j a The Atomic Energy of Canada, Limited (AECL, 1990) presents the distribution of Kd values according to four major soil types-sand, silt, clay, and organic material. Their data were obtained from available literature. b Baes et al. (1984) present Kd values for approximately 220 agricultural soils in the ph range of 4.5 to 9. Their data were derived from available literature and represent a diverse mixture of soils, extracting solutions, and laboratory techniques. c Coughtrey et al. (1985) report best estimates and ranges of measured soil Kd values for a limited number of metals. d Battelle Memorial Institute (Battelle, 1989) reports a range in Kd values as a function of ph (5 to 9 ) and sorbent content (a combination of clay, aluminum and iron oxyhydroxides, and organic matter content). The sorbent content ranges were <10 percent, 10 to 30 percent, and >30 percent sorbent. Their data were based on available literature. e The valence of these metals is not reported in the documents. f Estimated based on the correlation between Kd and soil-to-plant concentration factor (Bv). g Average value reported by Baes and Sharp (1983). h Represents the median of the logarithms of the observed values. * CSST and USEPA isotherms reported for a ph range of 4.5 to 8.5 and 4 to 9, respectively. ** 3MRA isotherms only presented for 4 metals for the purpose of comparison. Note that isotherms are available for 16 metals as part of 3MRA database. i HFO to 0.05 wt%, POM 0.11 wt%, ph j HFO to 0.05 wt%, POM 0.03 to 0.33 wt%, ph metals app TABLES App A App D FINAL GOLDER ASSOCIATES
250 Table 23 Comparison of soil screening levels calculated with CSST- and USEPA-recommended soil-water partition coefficients CSR Standards CSST Inputs (Transient Model) USEPA SSL 1996 (Steady State Model) Receptor Background ph for CSR ph CSST DAF DAF Calc. Tox Calculated ph USEPA Calc. Tox Calculated Groundwater Soil Matrix Matrix for Kd based Soil CSST Input USEPA SSL based Soil USEPA Input Metal Concentration 1 Concentration 2 Standard Standard 3 Table B K d years years Standard 5 Standard 6 SSL 7 K d Standard Standard 8 (mg/l) (mg/kg) (mg/kg) (L/kg) (mg/kg) (mg/kg) (L/kg) (mg/kg) (mg/kg) Arsenic N/A III N/A N/A N/A Cadmium < to < E to Out of range >= Out of range Chromium N/A 65 N/A N/A N/A N/A N/A N/A III N/A 65 N/A N/A N/A N/A N/A N/A N/A 65 N/A N/A N/A N/A N/A N/A N/A 65 N/A N/A N/A N/A N/A N/A Chromium N/A VI N/A N/A N/A Copper < N/A N/A N/A N/A to N/A N/A N/A N/A to N/A N/A N/A N/A to < Out of range N/A N/A N/A N/A >= Out of range N/A N/A N/A N/A Nickel 1.1 N/A N/A 100 to 500 N/A N/A N/A N/A N/A N/A N/A N/A 100 to 500 N/A N/A N/A N/A N/A N/A N/A N/A 100 to 500 N/A N/A N/A N/A N/A N/A N/A N/A 100 to 500 N/A N/A N/A N/A N/A N/A Lead < to to < Out of range >= Out of range Zinc < to < >6.5 to < >= Out of range Notes: 1. Receptor groundwater concentration is CSR AW freshwater standard (Schedule 6), unless otherwise noted. 2. Background soil concentration is that referenced in CSR matrix soil standard (Schedule 4). 3. CSR Schedule 5, freshwater standard 4. Table B-2 Overview of CSST Procedures for the Derivation of Soil Quality Matrix Standards for Contaminated Sites. 5. Tox Based Soil Standard = C g * DAF * (K d * θ u/ρ b) where C g is groundwater concentration, DAF = dilution attenuation factor (3.29), θ u is water-filled porosity (0.1), ρ b = bulk dry density (1.75) 6. Calc. CSST Input Standard = Tox. Based Standard + Background Soil Conc. (freshwater standard) 7. USEPA Soil Screening Guidance (USEPA, 1996) cadmium, chromium III, zinc, mercury, nickel (Figure 11), Arsenic (III), chromium (VI) (Figure 10). For lead the approximate interpolated values obtained from 3MRA isotherms using a using a mid-range HFO (0.05 % wt) and mid-range POM (0.11% wt) for a dissolved lead concentration of 0.06 mg/l were used. 8. Calc. USEPA Input Standard = Tox. Based Standard + Background Soil Conc. (freshwater standard) 9. Based on correspondance from George Szefer, April 8, Based on hardness equal H>200, default value in SSS model, March 2005 version 11. Based on hardness equal H>200<300, default value in SSS model, March 2005 version 12. Based on hardness equal H>100<200, based on footnote 7 in Schedule 5 for zinc.
251 Kd (L/kg) Arsenic (III) - empirical Cadmium Chromium (VI) - empirical Copper Zinc Source: CSST 1996 ph (s.u.) Note: Cu K d values used as surrogate for Pb K d values. TITLE Metal partitioning isotherms developed by CSST (1996). Review of B.C. CSST Protocol DRAWN CHECKED REVIEWED KS RV RV DATE SCALE FILE NO. March 2005 metals appendix.xls JOB NO. DWG. NO. FIGURE NO. U
252 2.5 2 log Kd Thallium Arsenic (III) Chromium (VI) Selenium * Data Source: USEPA 1996 TITLE ph Empirical ph-dependant K d i isotherms developed by the USEPA (1996b) Review of B.C. CSST Protocol DRAWN CHECKED REVIEWED KS RV RV DATE SCALE FILE NO. March 2005 metals appendix.xls JOB NO. DWG. NO. FIGURE NO. U
253 8 7 6 log Kd (L/kg) Nickel Cadmium Beryllium Chromium (III) ph (s.u.) Source: USEPA 1996b * Isotherms calculated as a function of ph with 0.31 wt% iron oxide, and organic matter of 0.2%. TITLE Metal partitioning isotherms developed by USEPA (1996b). Review of B.C. CSST Protocol DRAWN CHECKED REVIEWED KS RV RV DATE SCALE FILE NO. March 2005 metals appendix.xls JOB NO. DWG. NO. FIGURE NO. U
254 Chromium (VI) CSST Chromium (VI) USEPA SSL Chromium (VI) 3MRA (1) Chromium (VI) 3MRA (2) Chromium (VI) 3MRA (3) Kd (L/kg) ph (s.u.) TITLE Chromium (VI) K d as a function of ph Review of B.C. CSST Protocol DRAWN CHECKED REVIEWED KS RV RV DATE SCALE FILE NO. March 2005 metals appendix.xls JOB NO. DWG. NO. FIGURE NO. U
255 Kd (L/kg) Low HFO, ph 4.9 Low HFO, ph 6.8 Low HFO, ph 8.0 Medium HFO, ph 4.9 Medium HFO, ph 6.8 Medium HFO, ph 8.0 High HFO, ph 4.9 High HFO, ph 6.8 High HFO, ph Cr (VI) (mg/l) TITLE Variation with ph and HFO for 3MRA K d isotherms calculated with low LOM and medium POM concentrations in the vadose zone - Chromium (VI). Review of B.C. CSST Protocol DRAWN CHECKED REVIEWED KS RV RV DATE SCALE FILE NO. x.xls March 2005 JOB NO. DWG. NO. FIGURE NO. U
256 Kd (L/kg) Low POM, ph 4.9 Low POM, ph 6.8 Low POM, ph 8.0 Medium POM, ph 4.9 Medium POM, ph 6.8 Medium POM, ph 8.0 High POM, ph 4.9 High POM, ph 6.8 High POM, ph Cr (VI) (mg/l) Review of B.C. CSST Protocol TITLE Variation with ph and HFO for 3MRA K d isotherms calculated with low LOM and medium POM concentrations in the vadose zone - Chromium (VI). KS RV DATE SCALE March 2005 JOB NO. DWG. NO. U RV FILE NO. x.xls FIGURE NO. 7 DRAWN CHECKED REVIEWED
257 Kd (L/kg) 10 1 Arsenic (III) CSST Arsenic (III) USEPA SSL Arsenic (III) 3MRA (1) Arsenic (III) 3MRA (2) Arsenic (III) 3MRA (3) ph (s.u.) TITLE Arsenic (III) K d as a function of ph Review of B.C. CSST Protocol DRAWN CHECKED REVIEWED KS RV RV DATE SCALE FILE NO. March 2005 metals appendix.xls JOB NO. DWG. NO. FIGURE NO. U
258 Kd (L/kg) 10 1 Low HFO, ph 4.9 Low HFO, ph 6.8 Low HFO, ph 8.0 Medium HFO, ph 4.9 Medium HFO, ph 6.8 Medium HFO, ph 8.0 High HFO, ph 4.9 High HFO, ph 6.8 High HFO, ph As (III) mg/l Review of B.C. CSST Protocol TITLE Variation with ph and HFO for 3MRA K d isotherms calculated with low LOM and medium POM concentrations - Arsenic (III) KS RV DATE SCALE March 2005 JOB NO. DWG. NO. U RV FILE NO. x.xls FIGURE NO. 9 DRAWN CHECKED REVIEWED
259 Kd (L/kg) Zinc CSST Zinc USEPA SSL Zinc 3MRA (1) Zinc 3MRA (2) Zinc 3MRA (3) Zinc 3MRA (4) Zinc 3MRA (5) ph (s.u.) TITLE Zinc K d as a function of ph Review of B.C. CSST Protocol DRAWN CHECKED REVIEWED KS RV RV DATE SCALE FILE NO. March 2005 metals appendix.xls JOB NO. DWG. NO. FIGURE NO. U
260 Kd (L/kg) Low HFO, ph 4.9 Low HFO, ph 6.8 Low HFO, ph 8.0 Medium HFO, ph 4.9 Medium HFO, ph 6.8 Medium HFO, ph 8.0 High HFO, ph 4.9 High HFO, ph 6.8 High HFO, ph Zn (mg/l) Review of B.C. CSST Protocol TITLE Variation with ph and HFO for 3MRA K d isotherms calculated with low LOM and medium POM concentrations in the vadose zone - Zinc. KS RV DATE SCALE March 2005 JOB NO. DWG. NO. U RV FILE NO. x.xls FIGURE NO. 11 DRAWN CHECKED REVIEWED
261 Kd (L/kg) Low POM, ph 4.9 Low POM, ph 6.8 Low POM, ph 8.0 Medium POM, ph 4.9 Medium POM, ph 6.8 Medium POM, ph 8.0 High POM, ph 4.9 High POM, ph 6.8 High POM, ph Zn (mg/l) Review of B.C. CSST Protocol TITLE Variation with ph and POM for 3MRA K d isotherms calculated with low LOM and medium HFO concentrations in the vadose zone - Zinc. KS RV DATE SCALE March 2005 JOB NO. DWG. NO. U RV FILE NO. x.xls FIGURE NO. 13 DRAWN CHECKED REVIEWED
262 Kd (L/kg) 100 Cadmium CSST Cadmium USEPA SSL ph (s.u.) Source: USEPA 1996b * Isotherms calculated as a function of ph with 0.31 wt% iron oxide, and organic matter of 0.2%. TITLE Cadmium K d as a function of ph Review of B.C. CSST Protocol DRAWN CHECKED REVIEWED KS RV RV DATE SCALE FILE NO. March 2005 metals appendix.xls JOB NO. DWG. NO. FIGURE NO. U
263 Kd (L/kg) Lead CSST Lead 3MRA (1) Lead 3MRA (2) Lead 3MRA (3) Lead 3MRA (4) Lead 3MRA (5) ph (s.u.) TITLE Lead K d as a function of ph Review of B.C. CSST Protocol DRAWN CHECKED REVIEWED KS RV RV DATE SCALE FILE NO. March 2005 metals appendix.xls JOB NO. DWG. NO. FIGURE NO. U
264 Kd (L/kg) Low HFO, ph 4.9 Low HFO, ph 6.8 Low HFO, ph 8.0 Medium HFO, ph 4.9 Medium HFO, ph 6.8 Medium HFO, ph 8.0 High HFO, ph 4.9 High HFO, ph 6.8 High HFO, ph Pb (mg/l) Review of B.C. CSST Protocol TITLE Variation with ph and HFO for 3MRA K d isotherms calculated with low LOM and medium POM concentrations in the vadose zone - Lead. KS RV DATE SCALE March 2005 JOB NO. DWG. NO. U RV FILE NO. x.xls FIGURE NO. 15 DRAWN CHECKED REVIEWED
265 Kd (L/kg) Low POM, ph 4.9 Low POM, ph 6.8 Low POM, ph 8.0 Medium POM, ph 4.9 Medium POM, ph 6.8 Medium POM, ph 8.0 High POM, ph 4.9 High POM, ph 6.8 High POM, Pb (mg/l) Review of B.C. CSST Protocol TITLE Variation with ph and POM for 3MRA K d isotherms calculated with low LOM and medium HFO concentrations in the vadose zone. KS RV DATE SCALE March 2005 JOB NO. DWG. NO. U RV FILE NO. x.xls FIGURE NO. 16 DRAWN CHECKED REVIEWED
266 APPENDIX A EXTENDED LIST OF PARTITION COEFFICIENTS FOR USEPA SOIL SCREENING LEVEL GUIDANCE (USEPA, 1996B)
267 3/30/2005 Appendix A Extended list of partition coefficients for USEPA Soil Screening Level Guidance (USEPA, 1996b). U K d K d K d K d K d K d K d K d K d K d K d K d ph Ni Cd Be Cr(III) Tl* As(III)* Cr(VI)* Se* Zn Hg Ag Ba al isotherms presented in USEPA 1996b d-ph relationship of Loux et al, 1991 metals app TABLES App A App D FINAL GOLDER ASSOCIATES
268 APPENDIX B EXHIBIT: COMPARISON OF LITERATURE REPORTED KD VALUES AND USEPA SOIL SCREENING GUIDANCE K D VALUES (FROM USEPA, 1996B)
269 March 2005 Appendix B Exhibit Comparison of literature reported Kd values and USEPA Soil Screening Guidance K d values (from USEPA, 1996b) Results and Discussion. MINTEQ model results indicate that metal mobility is most affected by changes in ph. Based on this observation and because iron oxide content is not routinely measured in site characterization efforts, ph-dependent Kds for metals were developed for SSL application by fixing iron oxide at its medium value and fraction organic carbon at For arsenic (+3), chromium (+6), selenium, and thallium, the empirical ph-dependent Kds were used. Table 46 shows the SSL Kd values at high, medium, and low subsurface ph conditions. Figure 11 plots MINTEQ-derived metal Kd values over this ph range. Figure 10 shows the same for the empirically derived metal Kds. These results are discussed below by metal and compared with measured values. See RTI (1994) for more information. ph-dependent values are not available for antimony, cyanide, and vanadium. The estimated Kd values shown in Table 46 for antimony and vanadium are reported by Baes et al. (1984) and the Kd value for cyanide is obtained from SCDM. Arsenic. Values developed using the empirical equation for arsenic (+3) range from 25 to 31 L/kg for ph values of 4.9 to 8.0, respectively. These values correlate fairly well with the range of measured values reported by Battelle (1989)-5.86 to 19.4 L/kg. They are slightly above the range reported by Baes and Sharp (1983) for arsenic (+3) ( ). The estimated _ values for arsenic (+3) do not correlate well with the value of 200 L/kg presented by Baes et al. (1984). Oxidation state is not specified in Baes et al. (1984), and the difference between the empirical-derived Kd values presented here and the value presented by Baes et al. (1984) may reflect differences in oxidation states (arsenic (+3) is the most mobile species). Barium. For ground water ph conditions, MINTEQ-estimated Kd values for barium range from 11 to 52 L/kg. This range correlates well with the value of 60 L/kg reported by Baes et ai. (1984). Battelle (1989) reports a range in Kd values from 530 to 16,000 L/kg for a ph range of 5 to 9. The model-predicted Kd values for barium are several orders of magnitude less than the measured values, possibly due to the lower sorptive potential of iron oxide, used as the modeled sorbent, relative to clay, a sorbent present in the experimental systems reported by Battelle (1989). Beryllium. The Kd values estimated for beryllium range from 23 to 100,000 L/kg for the conditions studied. AECL (1990) reports medians of observed values for Kd ranging from 250 L/kg for sand to 3,000 L/kg for organic matter. Baes et ai. (1984) report a value of 650 L/kg. Battelle (1989) reports a range of Kd values from 70 L/kg for sand to 8,000 L/kg for clay. MINTEQ results for medium ground water ph (i.e., a value of 6.8) yields a Kd value of 790 L/kg. Hence, there is reasonable agreement between the MINTEQpredicted Kd values and values reported in the literature. Cadmium. For the three ph conditions, MINTEQ Kd values for cadmium range from 15 to 4000 L/kg, with a value of 75 at a ph of 6.8. The range in experimentally determined Kd values for cadmium is as follows: 1.26 to 26.8 L/kg (Baes et ai., 1983), 32 to 50 L/kg (Coughtrey et ai., 1985), 14.9 to 567 L/kg (Battelle, 1989), and 2.7 to 17,000 L/kg (AECL, 1990). Thus the MINTEQ estimates are generally within the range of measured values. Chromium (+3). MINTEQ-estimated Kd values for chromium (+3) range from 1000 to 4,300,000 L/kg. Battelle (1989) reports a range of Kd values of 168 to 3,600 L/kg, orders of magnitude lower than the MINTEQ values. This difference may reflect the measurements of mixed systems comprised of both chromium (+3) and (+6). The incorporation of chromium (+6) would tend to lower the Kd. Because the model-predicted values may overpredict sorption, the user should exercise care in the use of these values. Values for chromium (+6) should be used where speciation is mixed or uncertain.
270 March 2005 Appendix B Chromium (+6). Chromium (+6) Kd values estimated using the empirical ph-dependent adsorption relationship range from 31 to 14 L/kg for ph values of 4.9 to 8.0. Battelle (1989) reports a range of 16.8 to 360 L/kg for chromium (+6) and Baes and Sharp (1983) report a range of 1.2 to 1,800. The predicted chromium (+6) _ values thus generally agree with the lower end of the range of measured values and the average measured values (37) reported by Baes and Sharp (1983). These values represent conservative estimates of mobility the more toxic of the chromium species. Mercury (+2). MINTEQ-estimated values for mercury (+2) range from 0.04 to 200 L/kg. These modelpredicted estimates are less than the measured range of 322 to 5,280 L/kg reported by Battelle (1989). This difference may reflect the limited thermodynamic database with respect to mercury and/or that only the divalent oxidation state is considered in the simulation. Allison (1993) reviewed the model results in comparison to the measured values reported by Battelle (1989) and found reasonable agreement between the two sets of data, given the uncertainty associated with laboratory measurements and model precision. Nickel. MINTEQ-estimated Kd values for nickel range from 16 to 1,900 L/kg. These values agree well with measured values of approximately 20 L/kg (mean) and 12.2 to 650 L/kg, reported by Coughtrey et ai. (1985) and Battelle (1989), respectively. These values also agree well with the value of 150 L/kg reported by Baes et ai. (1984). However, the predicted values are at the low end of the range reported by the AECL (1990) - 60 to 4,700 L/kg. Selenium. Empirically derived Kd values for selenium range from 2.2 to 18 L/kg for ph values of 8.0 to 4.9. The range in experimentally determined values for selenium is as follows: less than 9 L/kg (Coughtrey et ai., 1985), 5.9 to 14.9 L/kg (Battelle, 1989), and 150 to 1,800 L/kg (AECL, 1990). Baes et ai. (1984) reported a value of 300 L/kg. Although they are significantly below the values presented by the AECL (1990) and Baes et ai. (1984), the MINTEQ-predicted Kd values correlate well with the values reported by Coughtrey et ai. (1985) and Battelle (1989). Silver. The Kd values estimated for silver range from 0.10 to 110 L/kg for the conditions studied. The range in experimentally determined Kd values for silver is as follows: 2.7 to 33,000 L/kg (AECL, 1990), 10 to 1,000 L/kg (Baes et ai., 1984), 50 L/kg (Coughtrey et ai., 1985), and 0.4 to 40 L/kg (Battelle, 1989). The model-predicted Kd values agree well with the values reported by Coughtrey et ai. (1985) and Battelle (1989) but are at the lower end of the ranges reported by AECL (1990) and Baes et ai. (1984). Thallium. Empirically derived Kd values for thallium range from 44 to 96 L/kg for ph values of 4.9 to 8.0. Generally, these values are about an order of magnitude greater than those reported by Battelle (1989)-0.0 to 0.8 L/kg - but are well below the value predicted by Baes et ai. (1984). Zinc. MINTEQ-estimated values for zinc range from 16 to 530 L/kg. These estimated Kd values are within the range of measured values reported by the AECL (1990) (0.1 to 100,000 L/kg) and Baes et ai. (1984) (0.1 to 8,000 L/kg). Coughtrey et ai. (1985) reported a value for zinc of greater than or equal to 20 L/kg.
271 APPENDIX C EXHIBIT: USE OF SYNTHETIC PRECIPITATION LEACHING PROCEDURE RESULTS TO DEVELOP SITE SPECIFIC SOIL SCREENING LEVELS, AS RECOMMENDED BY THE STATE OF NEW JERSEY (FROM NEW JERSEY, 2005)
272 3/11/05 Appendix C EXHIBIT (New Jersey 2005) U Option C. Synthetic Precipitation Leaching Procedure Introduction The Synthetic Precipitation Leaching Procedure (SPLP) is an EPA SW-846 analytical method (Method 1312) that can be used to determine the concentration of contaminant that will leach from soil (USEPA, 1998). The results of this procedure can be used directly to determine an AOC specific impact to ground water standard, or may be used indirectly to determine an AOC specific adsorption constant (K d ). This K d value may then be substituted into the simple partitioning equation to calculate a sample-specific impact to ground water remediation standard. SPLP offers a quick and inexpensive method to develop site-specific alternative remediation standards for inorganic, semi-volatile and pesticide contaminants that will be protective of ground water. A particularly useful aspect of the SPLP procedure is that it measures desorption, rather than adsorption, of contaminants from soil. It is well known that adsorption of many chemicals to soil increases as contact time increases (Loehr and Webster, 1996; Alexander, 1995; Pavlostathis and Mathavan, 1992). This is particularly true for less mobile contaminants. In some cases, contaminants may become irreversibly adsorbed to soil and therefore immobile. Soil adsorption coefficients (and K oc values) used in the USEPA SSL partitioning equation do not consider these processes. While the USEPA partitioning equation could be used with desorption, rather than adsorption coefficients, values for desorption coefficients are not generally available and if they are available they are likely to be site-specific. Therefore, generic standards are determined using adsorption coefficients and are therefore often conservative. Because the SPLP procedure uses the soil on site, it addresses species-specific issues regarding inorganic contaminants, particularly metals. The USEPA s simple partitioning equation assumes the most mobile form of an inorganic contaminant to estimate an adsorption coefficient for use in the partitioning equation (USEPA, 1996b). Because the actual species (redox state, salt, or complex) of an inorganic contaminant at a discharge site is typically not known after the site investigation phase, this assumption is necessary for generic analysis in order to be adequately protective of all situations that may occur. The SPLP procedure, on the other hand, measures the leaching potential of the actual species of the contaminant present at the discharge site. Different 34 of 88
273 3/11/05 Appendix C EXHIBIT (New Jersey 2005) U species of metals can have widely varying mobility. Speciation is generally not known because standard analytical methods usually measure total metals only. The SPLP test will measure the actual mobility, regardless of species. While a detailed assessment of the results of this test may be complex when mixtures of different species of the same metal are present, the procedure nonetheless provides a much-improved estimate of leaching tendency relative to the generic level assumptions. The conditions of the SPLP test simulate actual environmental precipitation, in that the leaching solution is a simulation of mid-atlantic rainfall (ph 4.2). Thus, the test more realistically estimates the leaching potential of contaminants that may occur under field conditions in New Jersey (Brown et al., 1996; Lackovic et al., 1997). Because the leaching test is conducted with actual soil samples taken from the site, remediation standards developed using this test are expected to be much more representative of site conditions than standards determined via other methods. The utility of SPLP for case processing can be significant. SPLP can be easily and quickly conducted on samples during the site investigation in a time and cost efficient manner. For all of the reasons above, it is recommended that the SPLP ARS option be used during the site investigation (SI) for cases involving semi-volatile chemical, pesticide and inorganic contaminants. The processing of these cases is likely to be considerably accelerated when SPLP results are available. The limitations of the SPLP test are as follows. First, because leachate is filtered through a µm filter, the concentration of colloidal metals above this pore size may be underestimated. Second, because the oxidation/reduction potential of the sample is not preserved when the test is conducted, the interconversion of metal species with multiple oxidation states may occur. Third, at this time the Department is not allowing the use of the SPLP procedure to determine the leaching potential of volatile organic compounds. The Department requires that volatile organic soil samples be collected using either methanol preservation or the Encore sampler. Methanol cannot be added to an SPLP sample because it affects contaminant desorption. The Encore 35 of 88
274 3/11/05 Appendix C EXHIBIT (New Jersey 2005) U sampler comes in 5 or 25 gram sizes, which would require the collection of several samples to achieve the required sample size for the SPLP test and total soil analysis. These separate samples would need to be composited, which is difficult without loss of volatiles. Furthermore, volatiles are weakly adsorbed to soil, so the use of the SPLP test will usually not significantly increase the calculated standard. The IGWARS generated by this option may result in no further action, thus would not require monitoring, deed notices or other restrictions. Sampling procedures required for SPLP When using SPLP during the investigation of an AOC, the number of samples collected should be determined by the size of the area initially being investigated pursuant to the Department s Technical Requirements for Site Remediation, N.J.A.C. 7:26E. At a minimum, three samples must be taken per AOC. Ideally, the samples must be chosen to target the highest concentrations of the chemicals. Furthermore, the samples should be representative of the variation in soil conditions over the area of concern, including variation with soil depth. Samples taken for SPLP analysis must be split, because the calculation of a site-specific remediation standard, or a site-specific K d value requires knowledge of the total contaminant concentration in the soil sample. One sample must be analyzed for total contaminant concentration, and the other for SPLP analysis. When reporting SPLP results, the total contaminant concentration in the soil, the leachate concentration, and the ph of leachate must be reported. The following situations (not inclusive) may require that additional soil samples be collected for SPLP testing to refine an AOC specific IGWARS: 1. Contamination extends to a depth not investigated during Site Investigation. Because soil properties often vary with depth, subsurface soil samples should be included if the contamination extends below the surface soil. 36 of 88
275 3/11/05 Appendix C EXHIBIT (New Jersey 2005) U Contaminant concentrations measured during the Remedial Investigation are found to be higher than those measured during the Site Investigation. Using SPLP Results 1. Pass/Fail This option was developed for cases where all SPLP leachate results are below a Target Ground Water Concentration or the Practical Quantitation Limit (PQL), as specified in the Department s GWQS N.J.A.C. 7:9-6. The target ground water concentration, (TGWC) is the Ground Water Quality Criterion pursuant to N.J.A.C. 7:9-6 et seq. multiplied by the generic DAF of 12. Therefore, if all SPLP samples taken from an area of concern yield leachate concentrations that are below the higher of the TGWC or the PQL, no remediation of the soil is necessary for the impact to ground water exposure pathway for that specific AOC. See examples below: To determine if further remediation is needed, compare SPLP results with the PQL and the TGWC, which is the Ground Water Quality Criterion that has been multiplied by the generic DAF of 12. If all SPLP results are lower than the PQL and the GWQC x 12 then no further remediation of the soil is necessary for the impact to ground water exposure pathway. This analysis should be done for each AOC. See examples below: Chemical GWQC TGWC PQL (GWQC*DAF) Lead 5 µg/l 60 µg/l 10 µg/l Toxaphene 0.03 µg/l 0.36 µg/l 3 µg/l Target Ground Water Concentration (TGWC) = the Ground Water Quality Criteria (GWQC) unadjusted for PQLs x the DAF GWQC = Ground Water Quality Criterion from N.J.A.C. 7:9-6 DAF = Dilution-attenuation factor (default DAF=12) PQL = Practical Quantitation Levels from N.J.A.C. 7: of 88
276 3/11/05 Appendix C EXHIBIT (New Jersey 2005) U For the chemical lead, the TGWC is 60 ug/l (GWQC of 5 µg/l multiplied by the generic DAF,12). According to the Department s Ground Water Quality Standards, the PQL for lead is 10 µg/l. The calculated TGWC is higher than the PQL; therefore, if the leachate concentrations from the SPLP tests are less than the TGWC of 60 µg/l, soil remediation for lead is not necessary for this exposure pathway. For the chemical toxaphene, the TGWC is 0.36 µg/l. According to the Department s Ground Water Quality Standards, the PQL for toxaphene is 3 µg/l. The calculated TGWC is lower than the PQL; therefore, if the leachate concentrations from the SPLP tests are less than the PQL of 3 µg/l, soil remediation for toxaphene is not necessary for this exposure pathway. If some or all samples yield leachate concentrations above the TGWC or PQL, continue to Option 2 or 3 below. NOTE: In cases where contaminants are weakly adsorbed to soil, an adjustment to the SPLP leachate concentration may be necessary (see section Adjustment of leachate concentration for weakly adsorbed chemicals below). 2. Procedure when SPLP results vary by more than an order of magnitude, or when SPLP results are above the TGWC/PQL This option allows the user to develop an IGWARS by identifying the highest soil concentration at which all leachate concentrations when divided by the DAF are at or below the GWQC. The SPLP leachate results represent the concentration of contaminant in soil pore water before dilution by the saturated zone. Therefore, the SPLP leachate concentration is divided by the DAF (12) to represent the instantaneous dilution of contamination as it enters the saturated zone. The soil concentration may be used as an IGWARS. C L DAF GWQC 38 of 88
277 3/11/05 Appendix C EXHIBIT (New Jersey 2005) U To develop an IGWARS using this option divide all SPLP leachate concentrations by the DAF (12) and compare the resulting numbers to the GWQC. The examples below illustrate this approach: Example 1. where: C T (mg/kg) C L (µg/l) C L /DAF GWQC (µg/l) C L = Concentration of contaminant in the SPLP leachate (µg/l) DAF = Dilution attenuation factor (default DAF=12) GWQC = the Ground Water Quality Criterion, N.J.A.C. 7:9-6 C T = the total concentration of the contaminant in the SPLP soil sample (mg/kg) In the example above, the GWQC for the chemical of concern is 200 µg/l, the IGWARS would be 50 mg/kg because it is the highest soil concentration at which all leachate concentrations when divided by the DAF are at or below the GWQC. Example 2. C T (mg/kg) C L (µg/l) C L /DAF GWQC (µg/l) where: C L = the concentration of contaminant in the SPLP leachate (µg/l) DAF = the dilution attenuation factor (default DAF=12) GWQC = the Ground Water Quality Criterion, N.J.A.C. 7:9-6 C T = the total concentration of the contaminant in the SPLP soil sample (mg/kg) 39 of 88
278 3/11/05 Appendix C EXHIBIT (New Jersey 2005) U In the example above, the GWQC for the chemical of concern is 150 µg/l, the acceptable IGWARS would be 10 ppm. Although the sample with a total concentration of 50 mg/kg yields an acceptable leachate result, the 30 ppm sample does not, and the IGWARS would default to the highest soil concentration at which all leachate concentrations when divided by the DAF are at or below the GWQC, in this case 10 mg/kg. NOTE: In cases where contaminants are weakly adsorbed to soil, an adjustment to the SPLP leachate concentration may be necessary (see section Adjustment of leachate concentration for weakly adsorbed chemicals below). 3. Calculate Sample-Specific Alternative Remediation Standard A sample-specific IGWARS may be calculated using the total contaminant concentration in a soil sample (C T ), and the SPLP leachate concentration (C L ). These results and other sample specific data are used to calculate a sample-specific soil-water partition coefficient (K d ), which is then substituted into the USEPA simple partitioning equation. See below: Step 1. Calculate Sample Specific K d For each sample where the SPLP leachate concentration is above the Minimum Detection Limit (MDL), calculate a K d value using the formula below: Kd = ( C M C V ) T S C L L L / M The equation is derived in Appendix H, where: S Equation (6) K d = soil water partition coefficient (L/kg) C T = the total concentration of the contaminant in the SPLP soil sample (mg/kg) M S = the total weight of the soil sample submitted for SPLP analysis (kg) C L = the concentration of contaminant in the SPLP leachate (mg/l) V L = the volume of the SPLP leachate (L) If the K d values vary by less than an order of magnitude, the results may be averaged and this average substituted into the simple partitioning equation. 40 of 88
279 3/11/05 Appendix C EXHIBIT (New Jersey 2005) U If the K d values vary by more than an order of magnitude, they may not be averaged. In this case, the lowest calculated K d value may be used in the simple partitioning equation. Step 2. Substitute Sample Specific K d values in the Simple Partitioning Equation Calculate the IGWARS for the impact to ground water pathway using the following equation: Simple Partitioning Equation: where: θ + θ H ' ARS = C gw d ρ b ARS = alternative remediation standard (mg/kg) w a [ K ] + DAF K d = is the average, or lowest, calculated sample specific soil-water partition coefficient (L/kg) θ w = the volume fraction of water in the original soil sample (v/v, assume generic value of 0.23 unless sitespecific data indicates otherwise) θ a = the volume fraction of air in the original water sample (v/v, assume generic value of 0.18 unless sitespecific data indicates otherwise) H = the dimensionless Henry s law constant for the contaminant of interest ρ b = the dry bulk density of the soil (1.5 kg/l) DAF = the dilution-attenuation factor (default DAF = 12) C gw = the ground water criteria for the contaminant (mg/l) 4. Use of Regression analysis to calculate IGWARS using results from the Synthetic Precipitation Leaching Procedure If an adequate linear correlation is observed between observed leachate concentrations and their corresponding total soil concentrations, a linear regression technique may be used to determine the acceptable total soil concentration. 1. Plot the leachate concentration versus total soil concentration for all samples where both concentrations are above the detection limit. The x-axis (independent variable) is the total soil concentration and the y-axis (dependent variable) is the leachate concentration. 41 of 88
280 3/11/05 Appendix C EXHIBIT (New Jersey 2005) U At least half of the points must lie at or above the midpoint of the range of total soil concentrations, and the Target Ground Water Concentration (TGWC) must lie within the range of measured leachate concentrations. 3. Do a linear least-squares regression analysis of the plotted points. If the R-square value is 0.8 or higher, the calculated linear regression line may be used to determine the acceptable total soil concentration. 4. Calculate the acceptable total soil concentration: TGWC b IGWARS = m where IGWARS is the impact-to-ground water alternative remediation standard, TGWC is the target ground water concentration, and m and b are the slope and intercept of the best fit line obtained via linear regression. NOTE: For cases where contaminants are weakly adsorbed to soil, an adjustment to the SPLP leachate concentration may be necessary (see below). Example Linear Regression and Calculations Total soil concentration (mg/kg) Leachate concentration (µg/l) Concentration in leachate (µg/l) Regression of SPLP results Total soil concentration (mg/kg) EXCEL REGRESSION OUTPUT Regression Statistics Multiple R R Square Acceptable Adjusted R Square Standard Error Observations 6 ANOVA df SS MS F Significance F Regression Residual Total Coefficients Standard Error t Stat P-value Lower 95% Upper 95% Lower 95.0% Upper 95.0% Intercept (b) X Variable 1(m) If Target Groundwater Concentration (TGWC) is 10µg/L, then IGWARS = (10µg/L µg/L)/0.176(µg/L)/(mg/kg) = 46 mg/kg 42 of 88
281 3/11/05 Appendix C EXHIBIT (New Jersey 2005) U Adjustment of leachate concentration for weakly adsorbed chemicals Normally, contaminants subjected to the SPLP tests are highly adsorbed to the soil. For hazardous waste sites that have existed for many years, contaminants that are weakly adsorbed have already migrated away from the site. In cases where discharges are recent or very large in size, contaminants may still be relatively mobile (i.e., weakly adsorbed to soil) at the time of the Site Investigation. In these situations, the leachate concentration determined using the SPLP test may underestimate concentrations that would be observed under natural conditions because the large amount of extracting solution used dilutes the contaminant. The ratio of extracting solution weight to the soil weight employed in the SPLP test is 20 to 1. In contrast, a representative soil water to soil solids ratio in saturated sandy loam soil in New Jersey (the field conditions under which leaching would occur) is approximately 0.41 ml moisture to 1.5 grams of soil. The dilution error in the SPLP test becomes significant when approximately 25% of the contaminant is found in the leachate solution, or when the K d is less than or equal to 50 L/kg: Leachate concentration (mg/l) as a function of leaching volume Kd (L/kg) Natural conditions 0.41mL water per 1.5gram of soil SPLP conditions (20mL extractant per gram of soil) % of contaminant in leachate Total contaminant concentration (dry soil basis):13.3mg/kg 43 of 88
282 3/11/05 Appendix C EXHIBIT (New Jersey 2005) U Note that when K d is less than 50 L/kg, the difference between the SPLP concentration and the natural field leachate concentration becomes significant. For this reason, when using Options 1, 2, and 4, the total mass of contaminant in the leachate should be compared to the total mass of contaminant in the soil sample. When the mass of contaminant in the leachate exceeds 25% of the total mass, an adjustment of the leachate concentration is necessary. Equation to check % of contaminant in the leachate: (C L x V L )/(C T x M S ) x 100 This should be less than 25. Where V L is the volume of leachate in liters (often 2 L), M S is the mass of the soil sample in kilograms (often 0.1 kg), and C L and C T are the leachate concentration (mg/l) and the total soil concentration (mg/kg), respectively. When a leachate concentration adjustment is necessary, a K d is first calculated for the chemical for each sample using Equation (6) under Option 3: Kd = ( C M C V ) T S C L L L / M S where: K d = is the soil water partition coefficient (L/kg) C T = the total concentration of the contaminant in the SPLP soil sample (mg/kg) M S = the total weight of the soil sample submitted for SPLP analysis (kg) C L = the concentration of contaminant in the SPLP leachate (mg/l) 44 of 88
283 3/11/05 Appendix C EXHIBIT (New Jersey 2005) U V L = the volume of the SPLP leachate (L) This K d value is then substituted in the following equation, which is a simple rearrangement of the USEPA simple partitioning equation (no air phase): C adj = C T [ρ b /(K d x ρ b x θ w )] Where ρ b is the bulk density of the soil (1.5 kg/l), and θ w is the soil moisture (0.23), and C adj is the adjusted leachate concentration (mg/l). 45 of 88
284 APPENDIX D COMPARISON OF METHODS OF ISOTHERM DEVELOPMENT FOR THE PURPOSE OF SOIL SCREENING LEVEL CALCULATION
285 3/30/2005 Appendix D Comparison of methods of isotherm development for the purpose of soil screening level calculation. U CSST USEPA 3MRA Primary reference CSST, 1996 USEPA, 1996a, b USEPA 1996c, 2003 Number of metals considered Method of isotherm Empirical ph-kd relationships (As (III) and Cr Empirical ph-kd relationships (As (III), Cr (VI), MINTEQA2 development (VI)), and MINTEQA2 (?) Se, Tl, Sb, V), and MINTEQA2 Level of transparency Low Moderate to High High Master input values ph 4.9, 6.8, 8 4.9, 6.8, 8 4.9, 6.8, 8 Organic matter Unknown 0.2 wt% to wt% Iron oxide Unknown 0.31 wt% Fe to 0.05 wt% Fe Metal input concentration Unknown Unknown to mg/l Advantages Current method utilized to develop soil screening levels in British Columbia. Soil-water partitioning isotherms are currently used in a number of jurisdictions in the United States. Scientific approach is well documented and easy to use. Well documented isotherms are parameterized under a variety of geochemical conditions. All metals modeled with MINTEQA2 to generate non-linear isotherms over a range of concentrations. Disadvantages - Poor documentation of isotherm generation. - Generic isotherms may not be representative - Isotherms are generic, and don't consider a of the actual geochemical conditions at a site, number of metals of environmental concern. and K d values may be overly conservative. - Linear, empirical ph-kd relationships - Linear, empirical ph-kd relationships developed for As(III) and Cr(VI) may not be developed for As(III), Cr(VI), Se and Tl may not representative of site conditions. be representative of site conditions. - Assumptions regarding iron oxide content, and neglect of sorption onto clays, Mn-oxides and carbonates are conservative. - Isotherms are complicated to use, and require knowledge site specific geochemical conditions whose measurement is not required in routine site evaluations. - Even with parameterized results, some sites may not be well represented. metals app TABLES App A App D FINAL GOLDER ASSOCIATES
286 APPENDIX II OVERVIEW OF CSST PROCEDURES FOR THE DERIVATION OF SOIL QUALITY MATRIX STANDARDS FOR CONTAMINATED SITES
287
288
289
290
291
292
293
294
295
296
297
298
299
300
301
302
303
304
305
306
307
308
309
310
311
312
313
314
315
316
317
318
319
320
321
322
323
324
325
326
327
328
329
330
331
332
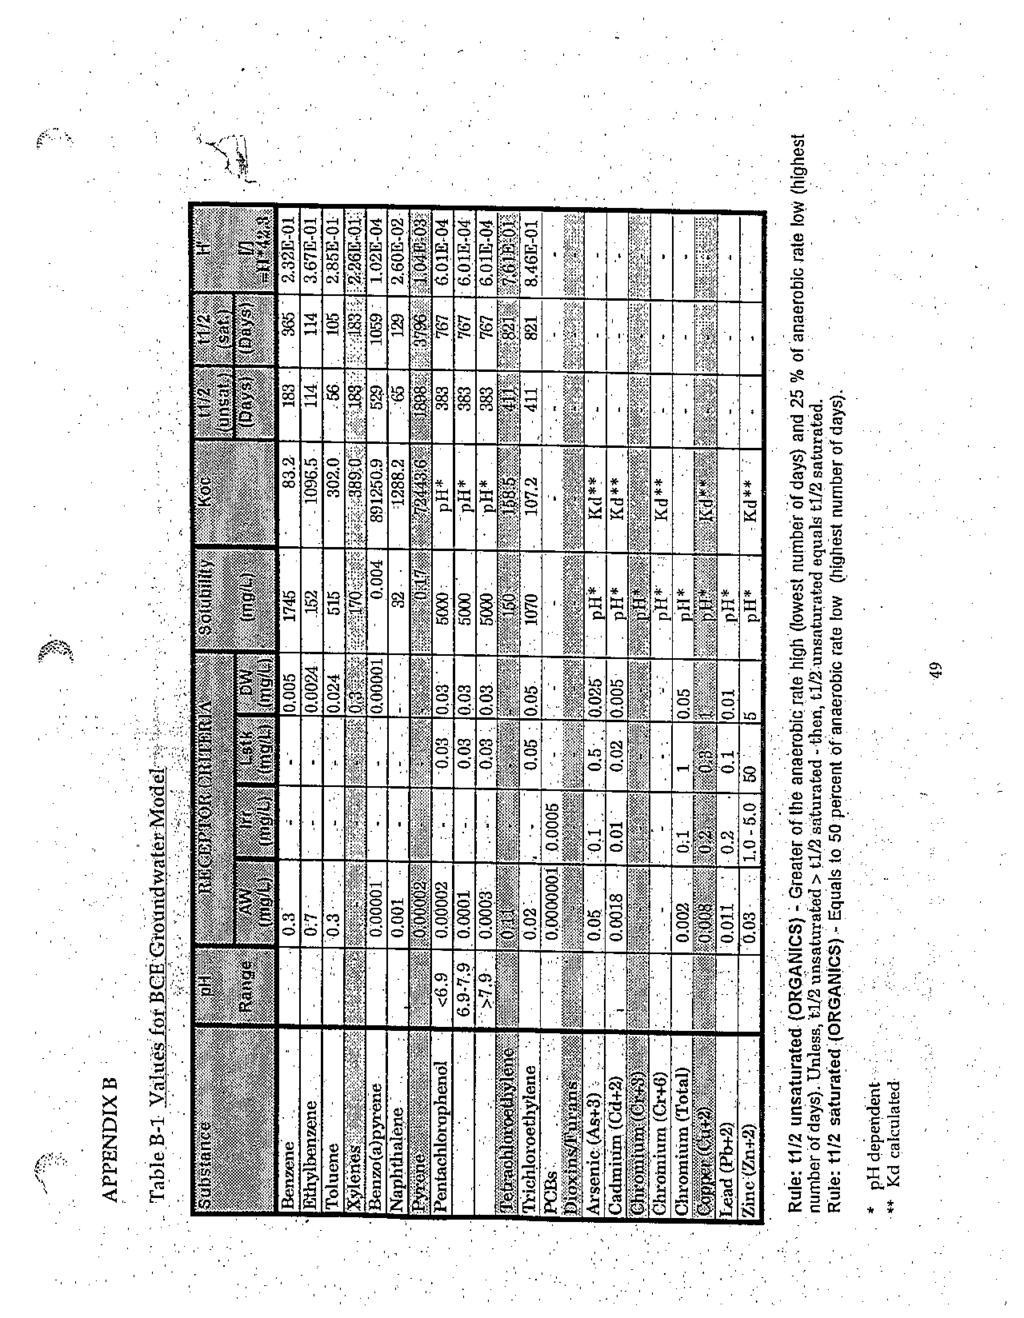
333

334
Methodology for Establishing Cleanup Levels for Contaminated Sites
 Methodology for Establishing Cleanup Levels for Introduction: In Oklahoma, appropriate cleanup levels for a specific site are provided by the Department of Environmental Quality (DEQ). Achieving these
CSAP PD Webinar. SLRA and Groundwater Models - Nov.10th, 2016
 CSAP PD Webinar SLRA and Groundwater Models - Nov.10th, 2016 1 WEBINAR FORMAT: The Webinar consists of a Adobe Connect website portal which was supplied to you as a link and where the presentations can
Site-Specific Numerical Soil Standards. Version 2.1. Prepared pursuant to Section 64 of the Environmental Management Act
 PROTOCOL 2 FOR CONTAMINATED SITES Site-Specific Numerical Soil Standards Version 2.1 Prepared pursuant to Section 64 of the Environmental Management Act Approved: Cameron Lewis November 1, 2017 Director
2005 Review of Canada-Wide Standards for Petroleum Hydrocarbons in Soil: Report of the Model Parameter Advisory (MPA) Sub Group
 Sub Group") 2005 Review of Canada-Wide Standards for Petroleum Hydrocarbons in Soil: Report of the Model Parameter Advisory (MPA) Sub Group March 2006 1 Acknowledgement We would like to thank all the members of the
2005 Review of Canada-Wide Standards for Petroleum Hydrocarbons in Soil: Report of the Model Parameter Advisory (MPA) Sub Group March 2006 1 Acknowledgement We would like to thank all the members of the
TECHNICAL GUIDANCE. Groundwater Protection Model ON CONTAMINATED SITES
 Groundwater Protection Model 13 TECHNICAL GUIDANCE ON CONTAMINATED SITES Version 2.0 November 1, 2017 This document provides guidance to qualified professionals on using the ministry s Groundwater Protection
REPORT ON APPROACHES AND METHODS FOR EVALUATION VERTICAL TRANSPORT IN GROUNDWATER HYDROGEOLOGICAL ASSESSMENT TOOLS PROJECT.
 Ltd. 500 4260 Still Creek Drive Burnaby, British Columbia, Canada V5C 6C6 Telephone (604) 296-4200 Fax (604) 298-5253 REPORT ON APPROACHES AND METHODS FOR EVALUATION VERTICAL TRANSPORT IN GROUNDWATER HYDROGEOLOGICAL
SCREENING LEVEL RISK ASSESSMENT (SLRA) UPDATE CSR STAGE 11 AMENDMENT WEBINAR #6 DECEMBER 5, 2017
 UPDATE CSR STAGE 11 AMENDMENT WEBINAR #6 DECEMBER 5, 2017") SCREENING LEVEL RISK ASSESSMENT (SLRA) UPDATE CSR STAGE 11 AMENDMENT WEBINAR #6 DECEMBER 5, 2017 GEORGE SZEFER Senior Contaminated Sites Officer This PowerPoint presentation and a recording of the audio
SCREENING LEVEL RISK ASSESSMENT (SLRA) UPDATE CSR STAGE 11 AMENDMENT WEBINAR #6 DECEMBER 5, 2017 GEORGE SZEFER Senior Contaminated Sites Officer This PowerPoint presentation and a recording of the audio
CSR OMNIBUS UPDATING: Proposed Amendments to Schedule 5 Environmental Protection Standards
 Draft Discussion Document: For Stakeholder Consultation Comment Period Closes: Aug. 28, 2015 CSR OMNIBUS UPDATING: Proposed Amendments to Schedule 5 Environmental Protection Standards Author: Remi Odense/Glyn
Finalization of Proposed 2007 Final Draft Matrix Soil Standards for Sodium (Na + ) and Chloride (Cl )
 and Chloride (Cl )") Finalization of Proposed 2007 Final Draft Matrix Soil Standards for Sodium (Na + ) and Chloride (Cl ) Glyn R. Fox Environmental Management Branch Environmental Protection Division October 1, 2007 Victoria,
Finalization of Proposed 2007 Final Draft Matrix Soil Standards for Sodium (Na + ) and Chloride (Cl ) Glyn R. Fox Environmental Management Branch Environmental Protection Division October 1, 2007 Victoria,
Groundwater Risk Assessment
 Groundwater Risk Assessment ELQF - 6 November 2012 Katy Baker Technical Director ARCADIS (UK) Limited Imagine the result Problem definition The importance of the CSM 2 The definition of the problem: 3
23 February 2017 Reference No L-Rev1-8500
 23 February 2017 Reference No. David Williams Contaminated Sites Approved Professional Society (CSAP) 744 W. Hastings Street Vancouver, BC V6C 1A5 UPDATED REVIEW OF LATERAL VAPOUR ATTENUATION FACTORS FOR
PROPOSED CHANGES TO REVISE WATER STANDARDS IN SCHEDULE 6 OF CSR. Heather Osachoff, MSc, PhD, RPBio Risk Assessment Officer May 20, 2015
 PROPOSED CHANGES TO REVISE WATER STANDARDS IN SCHEDULE 6 OF CSR Heather Osachoff, MSc, PhD, RPBio Risk Assessment Officer May 20, 2015 WHAT IS HAPPENING? Contaminated Sites Regulation (CSR): Contains standards
A PROTOCOL FOR THE DERIVATION OF GROUNDWATER QUALITY GUIDELINES FOR USE AT CONTAMINATED SITES PN 1533 ISBN PDF
 A PROTOCOL FOR THE DERIVATION OF GROUNDWATER QUALITY GUIDELINES FOR USE AT CONTAMINATED SITES PN 1533 ISBN 978-1-77202-015-1 PDF Canadian Council of Ministers of the Environment, 2015 The Canadian Council
Risk Assessment Methodologies in Ranking Decontamination Actions on National and Local Level. a Hungarian Experience
 Risk Assessment Methodologies in Ranking Decontamination Actions on National and Local Level a Hungarian Experience a workshop on Contaminated Lands in Accession Countries: Benchmarking Historical Heritage
Groundwater Modeling Guidance
 Groundwater Modeling Guidance Richard J. Mandle Groundwater Modeling Program Michigan Department of Environmental Quality Draft 1.0 10/16/02 Executive Summary The use of groundwater models is prevalent
Protocol 13 Screening Level Risk Assessment May 2018
 The SLRA process occupies a current niche mode in the contaminated sites system and can be issued under numeric instruments. The use of SLRA in many cases requires a specific skill set normally defined
Document No L-Rev0
 March 19, 2015 Document No. British Columbia Ministry of Environment Acting Manager, Risk Assessment and Remediation Land Remediation Section Suite 200-10470 152 Street Surrey, BC V3R 1E1 SUMMARY PAPER
Endpoint Selection Standard. Saskatchewan Environmental Code
 Endpoint Selection Standard Saskatchewan Environmental Code November 15, 2012 Endpoint Selection Standard A PRELIMINARY MATTERS Objective (1) This standard sets the manner in which the appropriate endpoints
RemTech Remediation Technologies Symposium
 RemTech 2011 2011 Remediation Technologies Symposium Petroleum Hydrocarbon Tier 2 Remediation Guideline Calculation Software Presented by Sunita Ranganathan M.Sc. Anthony L. Knafla M.Sc., DABT Oct 20,
Guidelines for Assessing and Managing Petroleum Hydrocarbon Contaminated Sites in New Zealand (Revised 2011)
") Guidelines for Assessing and Managing Petroleum Hydrocarbon Contaminated Sites in New Zealand (Revised 2011) MODULE 5 Tier 1 groundwater acceptance criteria August 1999 Contents 5 TIER 1 GROUNDWATER ACCEPTANCE
Guidelines for Assessing and Managing Petroleum Hydrocarbon Contaminated Sites in New Zealand (Revised 2011) MODULE 5 Tier 1 groundwater acceptance criteria August 1999 Contents 5 TIER 1 GROUNDWATER ACCEPTANCE
REPORT ON: Recommended Procedures for Identification of High Priority Contaminated Sites in British Columbia
 REPORT ON: Recommended Procedures for Identification of High Priority Contaminated Sites in British Columbia Submitted to: The Ministry of Environment May 2006 Submitted by: Science Advisory Board For
M. Jillian Mitton, P. Eng Golder Associates Ltd., Calgary, Alberta Darrell Jones, P. Eng - NOVA Chemicals Corporation, Joffre, Alberta ABSTRACT
 THE DEVELOPMENT OF SITE SPECIFIC RISK-BASED SOIL QUALITY GUIDELINES AS PART OF A SOIL AND GROUNDWATER MANAGEMENT AND REMEDIATION PLAN AT A PETROCHEMICAL FACILITY IN ALBERTA M. Jillian Mitton, P. Eng Golder
Technical Guidance 7: Supplemental Guidance for Risk Assessments May 2018
 The reviewers request that this text (i.e. paragraph on sensitive receptors) be removed. The evaluation of these groups is difficult due to lack of recommended TRVs /exposure assumptions; this is likely
APPENDIX I A SITE-SPECIFIC RECAP EVALUATION FOR TYPICAL UST SITES
 APPENDIX I A SITE-SPECIFIC RECAP EVALUATION FOR TYPICAL UST SITES LDEQ RECAP 2003 TABLE OF CONTENTS List of Figures List of Tables List of Worksheets Page... i... i... ii I1.0 APPENDIX I UNDERGROUND STORAGE
Initial Review. CCME Canada Wide Standards for Petroleum Hydrocarbons. Prepared for. Eric Partridge, Director Environmental Management Branch
 Initial Review CCME Canada Wide Standards for Petroleum Hydrocarbons Prepared for Eric Partridge, Director Environmental Management Branch Prepared by Science Advisory Board for Contaminated Sites November
Demonstrating Stormwater Infiltration to UICs is Protective of Groundwater Quality
 Demonstrating Stormwater Infiltration to UICs is Protective of Groundwater Quality GWPC Presentation September 28, 2010 Heidi Blischke, GSI Water Solutions, Inc. Barb Adkins, City of Portland, Oregon Rod
Federal Contaminated Sites Action Plan (FCSAP)
") Federal Contaminated Sites Action Plan (FCSAP) Overview of FCSAP Guidance for Ecological Risk Assessments at Federal Contaminated Sites Real Property Institute of Canada Federal Contaminated Sites National
Federal Contaminated Sites Action Plan (FCSAP) Overview of FCSAP Guidance for Ecological Risk Assessments at Federal Contaminated Sites Real Property Institute of Canada Federal Contaminated Sites National
White Paper for Discussion Aesthetic Drinking Water Standards
 White Paper for Discussion Aesthetic Drinking Water Standards Version Date: July 8, 2009 Contributors: Audrey Wagenaar, Lavinia Zanini Issue Definition New drinking water (DW) guidance will focus on future
MISSOURI DEPARTMENT OF NATURAL RESOURCES. Monitored Natural Attenuation of Groundwater Contamination at Voluntary Cleanup Program Sites
 MISSOURI DEPARTMENT OF NATURAL RESOURCES Monitored Natural Attenuation of Groundwater Contamination at Voluntary Cleanup Program Sites Technical Bulletin 1/2002 Hazardous Waste Program The chemical, physical
CSR OMNIBUS UPDATING: Proposed Amendments to Schedule 11
 Draft Discussion Document: For Stakeholder Consultation Comment Period Closes: Aug. 28, 2015 CSR OMNIBUS UPDATING: Proposed Amendments to Schedule 11 Author: Peter Kickham Date: June, 2015 Summary of Proposed
Groundwater Models and Modeling Considerations
 Groundwater Models and Modeling Considerations MPCA Industrial Landfill Guidance Workgroup April 30, 2009 Terry Johnson, P.G. Waste Management Inc., The Three Legs of the Stool 1. Engineering design and
Using Fate and Transport Models to Evaluate Cleanup Levels
 Fact Sheet # 25 Voluntary Remediation Program (VRP) (307) 777-7752 http://deq.state.wy.us/volremedi/index.asp Using Fate and Transport Models to Evaluate Cleanup Levels In its 2000 session, the Wyoming
DRAFT Tier 2 Framework for Adjusting Eco-Contact Soil Criteria. ESAA Remediation Technologies Symposium October, 2007 Presented by: Craig Harris
 DRAFT Tier 2 Framework for Adjusting Eco-Contact Soil Criteria ESAA Remediation Technologies Symposium October, 2007 Presented by: Craig Harris Tier 2 Eco-Contact Adjustments: Outline of Presentation Tier
SCREENING RISK ASSESSMENT LEVEL 1 (SRA1) FOR ABC CANNED FOODS BIG HARBOUR BRITISH COLUMBIA
 FOR ABC CANNED FOODS BIG HARBOUR BRITISH COLUMBIA") CASE STUDY 1: SCREENING RISK ASSESSMENT LEVEL 1 (SRA1) FOR ABC CANNED FOODS BIG HARBOUR BRITISH COLUMBIA 1 INTRODUCTION This report presents the findings of a Screening Risk Assessment Level 1 (SRA1) prepared
CASE STUDY 1: SCREENING RISK ASSESSMENT LEVEL 1 (SRA1) FOR ABC CANNED FOODS BIG HARBOUR BRITISH COLUMBIA 1 INTRODUCTION This report presents the findings of a Screening Risk Assessment Level 1 (SRA1) prepared
Development of Remediation Targets for Contaminated Land
 Development of Remediation Targets for Contaminated Land Dr Trevor Jones Managing Consultant Remediation on Nuclear Sites The Decision Making Process Birmingham, 7 October 2009 Overview Framework for managing
New supplementary guidance for ecological risk assessments at contaminated sites under the Federal Contaminated Sites Action Plan
 New supplementary guidance for ecological risk assessments at contaminated sites under the Federal Contaminated Sites Action Plan RemTech Workshop October 20, 2010 Banff, Alberta Jennifer Froese Environment
RemTech 2011: BC Perspectives. Vapour Intrusion in High Density Development Mark Adamson, P.GEO, CSAP
 RemTech 2011: BC Perspectives Vapour Intrusion in High Density Development Mark Adamson, P.GEO, CSAP Who is Mark? Introduction Mark Adamson Geoscientist by training (C.Geol UK, P.Geo) Environmental consultant
Chemical Constituents in Coal Combustion Residues: Risks and Toxicological Updates
 2011 World of Coal Ash (WOCA) Conference May 9-12, 2011 in Denver, CO, USA http://www.flyash.info/ Chemical Constituents in Coal Combustion Residues: Risks and Toxicological Updates Ari Lewis Gradient,
EXECUTIVE SUMMARY. 2. The effect of remediation on the distribution and mobility of both the LNAPL and water within the zone of interest.
 EXECUTIVE SUMMARY For many decades, the oil production industry has recognized that significant limitations exist to complete extraction of oil from geologic formations. Attempts to recover fuels and crude
IN-SITU BIOREMEDIATION EVALUATION USING THE WATERLOO EMITTER
 IN-SITU BIOREMEDIATION EVALUATION USING THE WATERLOO EMITTER Douglas A. Sweeney, M.Sc., P.Eng. and Ian Mitchell, M.Sc., P.Geo. October 2004 PRESENTATION OUTLINE Introduction Case Study Waterloo Emitter
SITE RISK CLASSIFICATION REPORT
 SITE RISK CLASSIFICATION REPORT Land Remediation Section PO Box 9342 Stn Prov Govt Victoria B.C. V8W 9M1 Telephone: (250) 387-4441 Fax: (250) 387-8897 E-mail: site@gov.bc.ca Instructions You must complete
(,,,) = ( )exp ( + C(x,y,z,t) = the concentration of the contaminant at location x, y, z from the source at time t.
 = ( )exp ( + C(x,y,z,t) = the concentration of the contaminant at location x, y, z from the source at time t.") INTRODUCTION Quick Domenico.xls (QD) is a Microsoft Excel spreadsheet application of An Analytical Model For Multidimensional Transport of a Decaying Contaminant Species, by P.A. Domenico, Journal of Hydrology,
INTRODUCTION Quick Domenico.xls (QD) is a Microsoft Excel spreadsheet application of An Analytical Model For Multidimensional Transport of a Decaying Contaminant Species, by P.A. Domenico, Journal of Hydrology,
Site Specific Remediation Objectives for Soil Vapour in Alberta (Draft) Norman Sawatsky
 Norman Sawatsky") Site Specific Remediation Objectives for Soil Vapour in Alberta (Draft) Norman Sawatsky Outline Contaminated Site Management Policy General Principles of Risk Assessment Tiered Risk Assessment Framework
Site Specific Remediation Objectives for Soil Vapour in Alberta (Draft) Norman Sawatsky Outline Contaminated Site Management Policy General Principles of Risk Assessment Tiered Risk Assessment Framework
Case Studies in Risk Management Methods as a Component of the Remedial Process
 Case Studies in Risk Management Methods as a Component of the Remedial Process Cecile Willert, P.Eng., QP RA January/February 2013 Agenda Issues Summary Case Study # 1 RA of DNAPL site (combined with remediation)
British Columbia s New Guidance for Groundwater Site Characterization
 Guy C. Patrick Victoria, BC October 29, 2010 British Columbia s New Guidance for Groundwater Site Characterization Better Investigations for Better Decision Making BC Ministry of Environment, 2010. Technical
Tier 1 Remedial Criteria Development. Alberta
 Tier 1 Remedial Criteria Development in Alberta Prepared for ESAA Remediation Technologies Symposium 2002 Banff, Alberta October, 2002 Prepared by: Craig S. Harris, M.Sc., P.Geol., P. Biol. and R. Ian
Ambient Water Quality Criteria for Polychlorinated Biphenyls (PCBs)
") Water Quality Ambient Water Quality Criteria for Polychlorinated Biphenyls (PCBs) Overview Report Prepared pursuant to Section 2(e) of the Environment Management Act, 1981 Original signed by J. O'Riordan
Water Quality Ambient Water Quality Criteria for Polychlorinated Biphenyls (PCBs) Overview Report Prepared pursuant to Section 2(e) of the Environment Management Act, 1981 Original signed by J. O'Riordan
4.4 MODEL CODE DESCRIPTION 4.5 WATER SOURCES AND SINKS 4.6 MODEL DOMAIN AND BOUNDARIES. SLR South Africa
 Page 4-18 The developed model should therefore be seen as an initial site model which should be refined and recalibrated once more groundwater monitoring and other data become available. 4.4 MODEL CODE
ATLANTIC RBCA (Risk-Based Corrective Action) Ecological Screening Protocol for Petroleum Impacted Sites in Atlantic Canada
 Ecological Screening Protocol for Petroleum Impacted Sites in Atlantic Canada") ATLANTIC RBCA (Risk-Based Corrective Action) Version 3 Ecological Screening Protocol for Petroleum Impacted Sites in Atlantic Canada Scientific Rationale Scientific Rationale to support the Adoption/Development
ATLANTIC RBCA (Risk-Based Corrective Action) Version 3 Ecological Screening Protocol for Petroleum Impacted Sites in Atlantic Canada Scientific Rationale Scientific Rationale to support the Adoption/Development
Connecticut Remediation Criteria: Technical Support Document Proposed Revisions to the Connecticut Remediation Standard Regulations
 Connecticut Remediation Criteria: Technical Support Document 2008 Proposed Revisions to the Connecticut Remediation Standard Regulations Connecticut Department of Environmental Protection Bureau of Water
DEVELOPING A GOOD CONCEPTUAL MODEL FOR FEDERAL CONTAMINATED SITES COMMON SHORTFALLS AND DATA NEEDS. Presented by: Pierre Maheux, M.Sc., P.Geo.
 DEVELOPING A GOOD CONCEPTUAL MODEL FOR FEDERAL CONTAMINATED SITES COMMON SHORTFALLS AND DATA NEEDS Presented by: Pierre Maheux, M.Sc., P.Geo. Technical contributors: Francois Lauzon, M.Eng., P.Eng., David
Risk-Based Decision Making for Site Cleanup
 Risk-Based Decision Making for Site Cleanup The Oklahoma Department of Environmental Quality (DEQ) has adopted a risk-based decision-making process to provide a framework for determining cleanup requirements
Objective. Technical Approach
 Computational and Experimental Investigation of Contaminant Plume Response to DNAPL Source Zone Architecture and Depletion in Porous and Fractured Media (ER-1610) Objective Dense non-aqueous phase liquid
Executive Summary performance assessment
 Executive Summary In the United States, low-level radioactive waste is defined as any radioactive waste arising from operations of the nuclear fuel cycle that is not classified as high-level waste (including
Total Concentration Limits
 4 Total Concentration Limits Total Concentration Limits 4.1 Introduction This section discusses issues related to the use of total as threshold concentrations for LWAC and mass loading of constituents.
Vadose Zone Profiling to Better Understand Processes
 Vapor Intrusion 2010 Sept. 29-30 Chicago Vadose Zone Profiling to Better Understand Processes Related to Vapor Intrusion Daniel B. Carr, P.E., P.G., Laurent C. Levy, Ph.D., P.E., Allan H. Horneman, D.E.S.
Protocol Standards Derivation Methods Chapter 4. Derivation of Soil to Groundwater Protection Matrix Soil Quality Standards
 Protocol 28 2016 Standards Derivation Methods Chapter 4. Derivation of Soil to Groundwater Protection Matrix Soil Quality Standards 4.1 Definitions The following words, acronyms and expressions used in
Wellsite Salt Remediation: Subsoil Salinity Tool vs. Site- Specific Salt Risk Assessment? Erik J. Martin, Ph.D., DABT
 Wellsite Salt Remediation: Subsoil Salinity Tool vs. Site- Specific Salt Risk Assessment? Erik J. Martin, Ph.D., DABT October 2011 Co-Authors David Alberti, M.Sc., P.Geol. Stantec David.Alberti@stantec.com
SoBRA Generic Assessment Criteria for Assessing Vapour Inhalation Risks from Groundwater Sources
 SoBRA Generic Assessment Criteria for Assessing Vapour Inhalation Risks from Groundwater Sources Eleanor Walker, Atkins Introduction Introduction to SoBRA Groundwater vapour sub-group work - objectives
DERIVATION OF HYDROCARBON SOIL ACCEPTANCE CRITERIA FOR THE PROTECTION OF SURFACE WATER QUALITY. Stephen Thomson URS New Zealand Limited
 DERIVATION OF HYDROCARBON SOIL ACCEPTANCE CRITERIA FOR THE PROTECTION OF SURFACE WATER QUALITY Stephen Thomson URS New Zealand Limited Players Born in Another Country (importers) 16 15 14 12 10 8 12 11
Evaluation of Alternative Approaches for Managing Risks of Salt Releases at Wetland Sites
 Evaluation of Alternative Approaches for Managing Risks of Salt Releases at Wetland Sites Presentation Title Doug Bright, Ph.D., Practice Lead Environmental Risk Assessment By: Don Authors Wood, Director,
SEMI-QUANTITATIVE RISK ASSESSMENT FOR SMALL CLOSED LANDFILLS
 SEMI-QUANTITATIVE RISK ASSESSMENT FOR SMALL CLOSED LANDFILLS Abstract Phil Lindsay (email: plindsay@golder.co.nz) Golder Associates Ltd Level 1, 79 Cambridge Terrace Christchurch Margaret Leonard Current
Ambient Water Quality Criteria for Ammonia to Protect Marine Aquatic Life
 Water Quality Ambient Water Quality Criteria for Ammonia to Protect Marine Aquatic Life Overview Report Prepared pursuant to Section 2(e) of the Environment Management Act, 1981 R. N. Nordin Ph.D. Resource
Reference Guideline #1. Hydrogeological Impact Assessment
 Reference Guideline #1 Hydrogeological Impact Assessment Reference Guideline #1 Hydrogeological Impact Assessment Hydrogeological assessments are required for some subdivision applications when triggered
APPENDIX 19A-10. Biological Uptake Factors
 APPENDIX 19A-10 Biological Uptake Factors Table of Contents 1.0 EXPOSURE ASSESSMENT... 3 1.1 Biological Uptake Factors... 3 1.1.1 Soil to Terrestrial Invertebrates UP SI... 4 1.1.1.1 Organics... 4 1.1.1.2
Section 5 Relative Effects of Manure Spreading and Confined Feeding Operations on Groundwater Quality
 Section 5 Relative Effects of Manure Spreading and Confined Feeding Operations on Groundwater Quality 5.1 Introduction The third objective of the Livestock Manure Impacts on Groundwater Quality in Alberta
November 8, 2016 International Petroleum Environmental Conference. Tim Nickels Pastor, Behling & Wheeler, LLC
 November 8, 2016 International Petroleum Environmental Conference Tim Nickels Pastor, Behling & Wheeler, LLC Long term, non-voluntary constant inhalation exposure to toxic compounds Non-voluntarily inhale
7.0 GROUNDWATER AND STABILIZER TRANSPORT MODELING
 7.0 GROUNDWATER AND STABILIZER TRANSPORT MODELING 7.1 Introduction The concept of passive site remediation is the slow injection of stabilizing materials at the up gradient edge of a site and delivery
Application of Human-health Risk Assessment in Italy: Regulatory aspects and technical guidelines
 Application of Human-health Risk Assessment in Italy: Regulatory aspects and technical guidelines L. D'Aprile, M. Falconi, A. Vecchio ISPRA - National Institute for Environmental Protection and Research
Stage 10 Amendments to the Contaminated Sites Regulations
 Stage 10 Amendments to the Contaminated Sites Regulations BCIA Peace River Branch Annual General Meeting January 20, 2017 Adrian Renneberg, M.Sc., P.Ag. CSAP Introduction Quick Overview of Environmental
Technical Guidance 8 Environmental Management Act Applications
 Technical Guidance 8 Environmental Management Act Applications A Framework for the Development and Use of Freshwater Science-Based Environmental Benchmarks for Aquatic Life in Environmental Management
Canadian Soil Quality Guidelines for the Protection of Environmental and Human Health
 Canadian Soil Quality Guidelines for the Protection of Environmental and Human Health 2017 (CH3OH; CAS 67-56-1) is a colourless, polar organic solvent with a molecular mass of 32.04 and a soil adsorption
Petroleum Hydrocarbon Sediment Quality Guidelines
 Petroleum Hydrocarbon Sediment Quality Guidelines Rita Mroz, Environment Canada Ulysses Klee, Stantec Rob Willis, Dillon Consulting Real Property Institute of Canada Federal Contaminated Sites National
Can Analytical Methods Predict Bioavailability? Chris Swyngedouw Oct. 21, 2005 Remtech 2005
 Can Analytical Methods Predict Bioavailability? Chris Swyngedouw Oct. 21, 2005 Remtech 2005 Outline Contaminant Bioavailability Current in vitro methods Mobility/bioaccessibility Results Conclusions 2
MINNESOTA POLLUTION CONTROL AGENCY SITE REMEDIATION SECTION
 MINNESOTA POLLUTION CONTROL AGENCY SITE REMEDIATION SECTION GROUND WATER POLICY DOCUMENT WORKING DRAFT, August, 1998 Fax (651) 296-9707 NOTICE THIS DOCUMENT IS AN. The of MPCA is developing guidelines
(RISK) MANAGEMENT OF EMERGING POLLUTANTS IN SOIL
 MANAGEMENT OF EMERGING POLLUTANTS IN SOIL") (RISK) MANAGEMENT OF EMERGING POLLUTANTS IN SOIL Claudio Carlon, European Commission Joint Research Centre IES, RWER NICOLE Workshop 16-17 June 2005 1 Presentation index: Risk based management of contaminants
(RISK) MANAGEMENT OF EMERGING POLLUTANTS IN SOIL Claudio Carlon, European Commission Joint Research Centre IES, RWER NICOLE Workshop 16-17 June 2005 1 Presentation index: Risk based management of contaminants
API SOIL & GROUNDWATER RESEARCH BULLETIN
 American Petroleum Institute API SOIL & GROUNDWATER RESEARC BULLETIN A summary of research results from APIÕs Soil and Groundwater Technical Task Force. August 998 No. 7 DAFfy Graphs An Innovative Approach
August Vapor Intrusion Guidance FAQs
 August 2017 2017 Vapor Intrusion Guidance FAQs Topics: A. General B. Effect of New Guidance on In-Process Sites C. Future Use of Site D. Modeling E. Off-Site Properties F. Preferential Pathways G. Proximity
Evaluating Impoundment Closure Scenarios using Fate and Transport Modeling
 2017 World of Coal Ash (WOCA) Conference in Lexington, KY - May 9-11, 2017 http://www.flyash.info/ Evaluating Impoundment Closure Scenarios using Fate and Transport Modeling Jacob J. Walczak 1, Meng Wang
Occurrence of Polar Organic Compounds in Groundwater Resulting from Biodegradation Implications for Petroleum Site Investigations and Remediation
 Occurrence of Polar Organic Compounds in Groundwater Resulting from Biodegradation Implications for Petroleum Site Investigations and Remediation Remediation Technologies Symposium 2011, Banff, Alberta
Water Quality. Ambient Water Quality Criteria for Chlorine. Overview Report. Summary
 Water Quality Ambient Water Quality Criteria for Chlorine Overview Report Prepared pursuant to Section 2(e) of the Environment Management Act, 1981 H. J. Singleton B.Sc. RPBio. Resource Quality Section
FINAL FACILITATED STAKEHOLDER CSR OMNIBUS INFORMATION SESSION GLYN R. FOX HEAD, SCIENCE & STANDARDS
 FINAL FACILITATED STAKEHOLDER CSR OMNIBUS INFORMATION SESSION GLYN R. FOX HEAD, SCIENCE & STANDARDS Final Omnibus Stakeholder Information Session - Vancouver March 7, 2016 FINAL INFORMATION SESSION Presentation
Protection of Groundwater and Surface Water at a Bulk Explosives Facility Using Calculated Risk-based Soil Guidelines
 Protection of Groundwater and Surface Water at a Bulk Explosives Facility Using Calculated Risk-based Soil Guidelines Presented to: Water Technologies Symposium 2012 Presented by: Liza Flemming, P.Geol.
U.S. EPA s Vapor Intrusion Database: Preliminary Evaluation of Attenuation Factors
 March 4, 2008 U.S. EPA s Vapor Intrusion Database: Preliminary Evaluation of Attenuation Factors Office of Solid Waste U.S. Environmental Protection Agency Washington, DC 20460 [This page intentionally
ATLANTIC RBCA (Risk-Based Corrective Action) For Petroleum Impacted Sites in Atlantic Canada
 For Petroleum Impacted Sites in Atlantic Canada") ATLANTIC RBCA (Risk-Based Corrective Action) Version 2.0 For Petroleum Impacted Sites in Atlantic Canada User Guidance Guidance for Soil Vapour and Indoor Air Monitoring Assessments July 2006 ERRATA (JULY
ATLANTIC RBCA (Risk-Based Corrective Action) Version 2.0 For Petroleum Impacted Sites in Atlantic Canada User Guidance Guidance for Soil Vapour and Indoor Air Monitoring Assessments July 2006 ERRATA (JULY
Variation of NEPM Schedule B1
 Variation of NEPM Schedule B1 CRC CARE s Role Prashant Srivastava Outline q The NEPM Review and recommendations q CRC CARE and its petroleum program q Health Screening Levels (HSLs) Project q NEPM variation
Appendix F. Report: Development of Clean-Up Criteria for Petroleum Hydrocarbons for Silver Bear, Contact Lake and El Bonanza Sites
 Appendix F Report: Development of Clean-Up Criteria for Petroleum Hydrocarbons for Silver Bear, Contact Lake and El Bonanza Sites Final Report: DEVELOPMENT OF CLEANUP CRITERIA FOR PETROLEUM HYDROCARBONS
Bio 430: Chemicals in the environment. Jeffrey Jenkins Department of Environmental and Molecular Toxicology Oregon State University
 Bio 430: Chemicals in the environment Jeffrey Jenkins Department of Environmental and Molecular Toxicology Chemical fate: transformation and transport within and between Soil-Air-Water-Biota Source: U.S.
GROUNDWATER POLICY UPDATE DRAFT PROTOCOL 5
 GROUNDWATER POLICY UPDATE DRAFT PROTOCOL 5 Annette Pia Mortensen Steve Dankevy Peggy Evans Ministry of Environment, Land Remediation Section BEST 2015, May 20, 2015 GROUNDWATER POLICY UPDATE New groundwater
Designing Monitoring Programs to Effectively Evaluate the Performance of Natural Attenuation
 9 Designing Monitoring Programs to Effectively Evaluate the Performance of Natural Attenuation Todd H. Wiedemeier, Michael J. Barden, Patrick E. Haas, and W. Zachary Dickson CONTENTS Introduction......
Q&As Stage 10 (Omnibus) Amendment to the Contaminated Sites Regulation (CSR)
 Amendment to the Contaminated Sites Regulation (CSR)") Q&As Stage 10 (Omnibus) Amendment to the Contaminated Sites Regulation (CSR) This document provides the Ministry responses to stakeholder questions sent to site@gov.bc.ca following the release of the Omnibus
Q&As Stage 10 (Omnibus) Amendment to the Contaminated Sites Regulation (CSR) This document provides the Ministry responses to stakeholder questions sent to site@gov.bc.ca following the release of the Omnibus
Steve Mailath, M.Sc., P.Geol. April 10, 2014 WATER NATURAL RESOURCES ENVIRONMENT INFRASTRUCTURE ENERGY
 IN-SITU REMEDIATION OF HYDROCARBON IMPACTED GROUNDWATER IN PERMAFROST TERRAIN AT A REMOTE SITE. TIBBITT TO CONTWOYTO WINTER ROAD, NORTHWEST TERRITORIES Steve Mailath, M.Sc., P.Geol. April 10, 2014 WATER
Guidance for the Determination of the Dilution-Attenuation Factor for the Impact to Ground Water Pathway. June 2, 2008
 Guidance for the Determination of the Dilution-Attenuation Factor for the Impact to Ground Water Pathway June 2, 2008 1 Introduction When infiltrating soil water reaches the water table, it is mixed with
SOUTHWEST DIVISION Comparing Air Measurements and Modeling Results at a Residential Site Overlying a TCE Plume October 18, 2004
 SOUTHWEST DIVISION Comparing Air Measurements and Modeling Results at a Residential Site Overlying a TCE Plume October 18, 2004 Presented by: Wilson Doctor, Remedial Project Manager Ronald J. Marnicio,
6. Organic Compounds: Hydrocarbons. General Comments Borden, Canada, tracer test Laurens, SC, gasoline spill Bemidji, MN, crude oil spill
 6. Organic Compounds: Hydrocarbons General Comments Borden, Canada, tracer test Laurens, SC, gasoline spill Bemidji, MN, crude oil spill In the subsurface, biogeochemical processes that control contaminant
Guidance on Developing a Monitored Natural Attenuation Remedial Proposal for Chlorinated Organics in Ground Water
 Guidance on Developing a Monitored Natural Attenuation Remedial Proposal for Chlorinated Organics in Ground Water North Carolina Division of Waste Management Hazardous Waste Section Final Draft October
Determining Background Soil Quality. Prepared pursuant to Section 64 of the Environmental Management Act
 PROTOCOL 4 FOR CONTAMINATED SITES Determining Background Soil Quality Prepared pursuant to Section 64 of the Environmental Management Act Approved: J.E. Hofweber October 12, 2010 Director of Waste Management
Guidance for Selecting Toxicity Reference Values for Alberta Tier 1 and Tier 2 Soil and Groundwater Remediation Guidelines
 Guidance for Selecting Toxicity Reference Values for Alberta Tier 1 and Tier 2 Soil and Groundwater Remediation Guidelines October 20, 2017 Title: Guidance for Selecting Toxicity Reference Values for Alberta
APPLICATION OF SUBSURFACE VAPOUR ASSESSMENT AT HYDROCARBON IMPACTED SITES
 APPLICATION OF SUBSURFACE VAPOUR ASSESSMENT AT HYDROCARBON IMPACTED SITES Mitch Kenaschuk, P.Eng. Peter Olmsted, M.Sc.,P.Eng. October 2004 OUTLINE Introduction Regulatory Framework and Methodology Vapour
Ecological Investigation Levels and Ecological Screening Levels Naomi Cooper (Ecotoxicologist) and Antti Mikkonen
 and Antti Mikkonen") Ecological Investigation Levels and Ecological Screening Levels Naomi Cooper (Ecotoxicologist) and Antti Mikkonen 17 June 2014 1 What we will run through EILs and ESLs definitions What has changed? When
Ecological Investigation Levels and Ecological Screening Levels Naomi Cooper (Ecotoxicologist) and Antti Mikkonen 17 June 2014 1 What we will run through EILs and ESLs definitions What has changed? When