Chapter 4: Foundations for inference. OpenIntro Statistics, 2nd Edition
|
|
|
- Melina Hall
- 5 years ago
- Views:
Transcription
1 Chapter 4: Foundations for inference OpenIntro Statistics, 2nd Edition
2 Variability in estimates 1 Variability in estimates Application exercise Sampling distributions - via CLT 2 Confidence intervals 3 Hypothesis testing 4 Examining the Central Limit Theorem 5 Inference for other estimators 6 Sample size and power 7 Statistical vs. practical significance OpenIntro Statistics, 2nd Edition

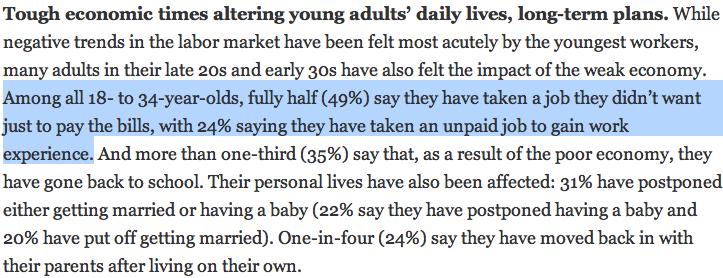
3 Variability in estimates pewresearch.org/ pubs/ 2191/ young-adults-workers-labor-market-pay-careers-advancement-recession OpenIntro Statistics, 2nd Edition Chp 4: Foundations for inference 2 / 69

4 Variability in estimates Margin of error 41% ± 2.9%: We are 95% confident that 38.1% to 43.9% of the public believe young adults, rather than middle-aged or older adults, are having the toughest time in today s economy. 49% ± 4.4%: We are 95% confident that 44.6% to 53.4% of years olds have taken a job they didn t want just to pay the bills. OpenIntro Statistics, 2nd Edition Chp 4: Foundations for inference 3 / 69
5 Variability in estimates Parameter estimation We are often interested in population parameters. Since complete populations are difficult (or impossible) to collect data on, we use sample statistics as point estimates for the unknown population parameters of interest. Sample statistics vary from sample to sample. Quantifying how sample statistics vary provides a way to estimate the margin of error associated with our point estimate. But before we get to quantifying the variability among samples, let s try to understand how and why point estimates vary from sample to sample. Suppose we randomly sample 1,000 adults from each state in the US. Would you expect the sample means of their heights to be the same, somewhat different, or very different? OpenIntro Statistics, 2nd Edition Chp 4: Foundations for inference 4 / 69
6 Variability in estimates Parameter estimation We are often interested in population parameters. Since complete populations are difficult (or impossible) to collect data on, we use sample statistics as point estimates for the unknown population parameters of interest. Sample statistics vary from sample to sample. Quantifying how sample statistics vary provides a way to estimate the margin of error associated with our point estimate. But before we get to quantifying the variability among samples, let s try to understand how and why point estimates vary from sample to sample. Suppose we randomly sample 1,000 adults from each state in the US. Would you expect the sample means of their heights to be the same, somewhat different, or very different? Not the same, but only somewhat different. OpenIntro Statistics, 2nd Edition Chp 4: Foundations for inference 4 / 69
7 Variability in estimates Application exercise The following histogram shows the distribution of number of drinks it takes a group of college students to get drunk. We will assume that this is our population of interest. If we randomly select observations from this data set, which values are most likely to be selected, which are least likely? Number of drinks to get drunk OpenIntro Statistics, 2nd Edition Chp 4: Foundations for inference 5 / 69
8 Variability in estimates Application exercise Suppose that you don t have access to the population data. In order to estimate the average number of drinks it takes these college students to get drunk, you might sample from the population and use your sample mean as the best guess for the unknown population mean. Sample, with replacement, ten students from the population, and record the number of drinks it takes them to get drunk. Find the sample mean. Plot the distribution of the sample averages obtained by members of the class OpenIntro Statistics, 2nd Edition Chp 4: Foundations for inference 6 / 69
9 Variability in estimates Application exercise Example: List of random numbers: 59, 121, 88, 46, 58, 72, 82, 81, 5, OpenIntro Statistics, 2nd Edition Chp 4: Foundations for inference 7 / 69
10 Variability in estimates Application exercise Example: List of random numbers: 59, 121, 88, 46, 58, 72, 82, 81, 5, Sample mean: ( ) / 10 = 5.9 OpenIntro Statistics, 2nd Edition Chp 4: Foundations for inference 7 / 69
11 Variability in estimates Application exercise Sampling distribution What you just constructed is called a sampling distribution. OpenIntro Statistics, 2nd Edition Chp 4: Foundations for inference 8 / 69
12 Variability in estimates Application exercise Sampling distribution What you just constructed is called a sampling distribution. What is the shape and center of this distribution? Based on this distribution, what do you think is the true population average? OpenIntro Statistics, 2nd Edition Chp 4: Foundations for inference 8 / 69
13 Variability in estimates Application exercise Sampling distribution What you just constructed is called a sampling distribution. What is the shape and center of this distribution? Based on this distribution, what do you think is the true population average? Approximately 5.39, the true population mean. OpenIntro Statistics, 2nd Edition Chp 4: Foundations for inference 8 / 69
14 Variability in estimates Sampling distributions - via CLT Central limit theorem Central limit theorem The distribution of the sample mean is well approximated by a normal model: x N (mean = µ, SE = n σ ), where SE is represents standard error, which is defined as the standard deviation of the sampling distribution. If σ is unknown, use s. It wasn t a coincidence that the sampling distribution we saw earlier was symmetric, and centered at the true population mean. We won t go through a detailed proof of why SE = σ n, but note that as n increases SE decreases. As the sample size increases we would expect samples to yield more consistent sample means, hence the variability among the sample means would be lower. OpenIntro Statistics, 2nd Edition Chp 4: Foundations for inference 9 / 69
15 Variability in estimates Sampling distributions - via CLT CLT - conditions Certain conditions must be met for the CLT to apply: 1. Independence: Sampled observations must be independent. This is difficult to verify, but is more likely if random sampling/assignment is used, and if sampling without replacement, n < 10% of the population. OpenIntro Statistics, 2nd Edition Chp 4: Foundations for inference 10 / 69
16 Variability in estimates Sampling distributions - via CLT CLT - conditions Certain conditions must be met for the CLT to apply: 1. Independence: Sampled observations must be independent. This is difficult to verify, but is more likely if random sampling/assignment is used, and if sampling without replacement, n < 10% of the population. 2. Sample size/skew: Either the population distribution is normal, or if the population distribution is skewed, the sample size is large. the more skewed the population distribution, the larger sample size we need for the CLT to apply for moderately skewed distributions n > 30 is a widely used rule of thumb This is also difficult to verify for the population, but we can check it using the sample data, and assume that the sample mirrors the population. OpenIntro Statistics, 2nd Edition Chp 4: Foundations for inference 10 / 69
17 Confidence intervals 1 Variability in estimates 2 Confidence intervals Why do we report confidence intervals? Constructing a confidence interval A more accurate interval Capturing the population parameter Changing the confidence level 3 Hypothesis testing 4 Examining the Central Limit Theorem 5 Inference for other estimators 6 Sample size and power 7 Statistical vs. practical significance OpenIntro Statistics, 2nd Edition


18 Confidence intervals Why do we report confidence intervals? Confidence intervals A plausible range of values for the population parameter is called a confidence interval. Using only a sample statistic to estimate a parameter is like fishing in a murky lake with a spear, and using a confidence interval is like fishing with a net. We can throw a spear where we saw a fish but we will probably miss. If we toss a net in that area, we have a good chance of catching the fish. If we report a point estimate, we probably won t hit the exact population parameter. If we report a range of plausible values we have a good shot at capturing the parameter. Photos by Mark Fischer ( and Chris Penny ( on Flickr. OpenIntro Statistics, 2nd Edition Chp 4: Foundations for inference 11 / 69
19 Confidence intervals Constructing a confidence interval Average number of exclusive relationships A random sample of 50 college students were asked how many exclusive relationships they have been in so far. This sample yielded a mean of 3.2 and a standard deviation of Estimate the true average number of exclusive relationships using this sample. OpenIntro Statistics, 2nd Edition Chp 4: Foundations for inference 12 / 69
20 Confidence intervals Constructing a confidence interval Average number of exclusive relationships A random sample of 50 college students were asked how many exclusive relationships they have been in so far. This sample yielded a mean of 3.2 and a standard deviation of Estimate the true average number of exclusive relationships using this sample. x = 3.2 s = 1.74 OpenIntro Statistics, 2nd Edition Chp 4: Foundations for inference 12 / 69
21 Confidence intervals Constructing a confidence interval Average number of exclusive relationships A random sample of 50 college students were asked how many exclusive relationships they have been in so far. This sample yielded a mean of 3.2 and a standard deviation of Estimate the true average number of exclusive relationships using this sample. x = 3.2 s = 1.74 The approximate 95% confidence interval is defined as point estimate ± 2 SE OpenIntro Statistics, 2nd Edition Chp 4: Foundations for inference 12 / 69
22 Confidence intervals Constructing a confidence interval Average number of exclusive relationships A random sample of 50 college students were asked how many exclusive relationships they have been in so far. This sample yielded a mean of 3.2 and a standard deviation of Estimate the true average number of exclusive relationships using this sample. x = 3.2 s = 1.74 The approximate 95% confidence interval is defined as point estimate ± 2 SE SE = s n = OpenIntro Statistics, 2nd Edition Chp 4: Foundations for inference 12 / 69
23 Confidence intervals Constructing a confidence interval Average number of exclusive relationships A random sample of 50 college students were asked how many exclusive relationships they have been in so far. This sample yielded a mean of 3.2 and a standard deviation of Estimate the true average number of exclusive relationships using this sample. x = 3.2 s = 1.74 The approximate 95% confidence interval is defined as point estimate ± 2 SE SE = s n = x ± 2 SE = 3.2 ± OpenIntro Statistics, 2nd Edition Chp 4: Foundations for inference 12 / 69
24 Confidence intervals Constructing a confidence interval Average number of exclusive relationships A random sample of 50 college students were asked how many exclusive relationships they have been in so far. This sample yielded a mean of 3.2 and a standard deviation of Estimate the true average number of exclusive relationships using this sample. x = 3.2 s = 1.74 The approximate 95% confidence interval is defined as point estimate ± 2 SE SE = s n = x ± 2 SE = 3.2 ± = ( , ) OpenIntro Statistics, 2nd Edition Chp 4: Foundations for inference 12 / 69
25 Confidence intervals Constructing a confidence interval Average number of exclusive relationships A random sample of 50 college students were asked how many exclusive relationships they have been in so far. This sample yielded a mean of 3.2 and a standard deviation of Estimate the true average number of exclusive relationships using this sample. x = 3.2 s = 1.74 The approximate 95% confidence interval is defined as point estimate ± 2 SE SE = s n = x ± 2 SE = 3.2 ± = ( , ) = (2.7, 3.7) OpenIntro Statistics, 2nd Edition Chp 4: Foundations for inference 12 / 69
26 Confidence intervals Constructing a confidence interval Which of the following is the correct interpretation of this confidence interval? We are 95% confident that (a) the average number of exclusive relationships college students in this sample have been in is between 2.7 and 3.7. (b) college students on average have been in between 2.7 and 3.7 exclusive relationships. (c) a randomly chosen college student has been in 2.7 to 3.7 exclusive relationships. (d) 95% of college students have been in 2.7 to 3.7 exclusive relationships. OpenIntro Statistics, 2nd Edition Chp 4: Foundations for inference 13 / 69
27 Confidence intervals Constructing a confidence interval Which of the following is the correct interpretation of this confidence interval? We are 95% confident that (a) the average number of exclusive relationships college students in this sample have been in is between 2.7 and 3.7. (b) college students on average have been in between 2.7 and 3.7 exclusive relationships. (c) a randomly chosen college student has been in 2.7 to 3.7 exclusive relationships. (d) 95% of college students have been in 2.7 to 3.7 exclusive relationships. OpenIntro Statistics, 2nd Edition Chp 4: Foundations for inference 13 / 69
28 Confidence intervals A more accurate interval A more accurate interval Confidence interval, a general formula point estimate ± z SE OpenIntro Statistics, 2nd Edition Chp 4: Foundations for inference 14 / 69
29 Confidence intervals A more accurate interval A more accurate interval Confidence interval, a general formula point estimate ± z SE Conditions when the point estimate = x: 1. Independence: Observations in the sample must be independent random sample/assignment if sampling without replacement, n < 10% of population 2. Sample size / skew: n 30 and population distribution should not be extremely skewed OpenIntro Statistics, 2nd Edition Chp 4: Foundations for inference 14 / 69
30 Confidence intervals A more accurate interval A more accurate interval Confidence interval, a general formula point estimate ± z SE Conditions when the point estimate = x: 1. Independence: Observations in the sample must be independent random sample/assignment if sampling without replacement, n < 10% of population 2. Sample size / skew: n 30 and population distribution should not be extremely skewed Note: We will discuss working with samples where n < 30 in the next chapter. OpenIntro Statistics, 2nd Edition Chp 4: Foundations for inference 14 / 69
31 Confidence intervals Capturing the population parameter What does 95% confident mean? Suppose we took many samples and built a confidence interval from each sample using the equation point estimate ± 2 SE. Then about 95% of those intervals would contain the true population mean (µ). The figure shows this process with 25 samples, where 24 of the resulting confidence intervals contain the true average number of exclusive relationships, and one does not. OpenIntro Statistics, 2nd Edition Chp 4: Foundations for inference 15 / 69
32 Confidence intervals Capturing the population parameter Width of an interval If we want to be more certain that we capture the population parameter, i.e. increase our confidence level, should we use a wider interval or a smaller interval? OpenIntro Statistics, 2nd Edition Chp 4: Foundations for inference 16 / 69
33 Confidence intervals Capturing the population parameter Width of an interval If we want to be more certain that we capture the population parameter, i.e. increase our confidence level, should we use a wider interval or a smaller interval? A wider interval. OpenIntro Statistics, 2nd Edition Chp 4: Foundations for inference 16 / 69
34 Confidence intervals Capturing the population parameter Width of an interval If we want to be more certain that we capture the population parameter, i.e. increase our confidence level, should we use a wider interval or a smaller interval? A wider interval. Can you see any drawbacks to using a wider interval? OpenIntro Statistics, 2nd Edition Chp 4: Foundations for inference 16 / 69

35 Confidence intervals Capturing the population parameter Width of an interval If we want to be more certain that we capture the population parameter, i.e. increase our confidence level, should we use a wider interval or a smaller interval? A wider interval. Can you see any drawbacks to using a wider interval? If the interval is too wide it may not be very informative. OpenIntro Statistics, 2nd Edition Chp 4: Foundations for inference 16 / 69
36 Confidence intervals Changing the confidence level OpenIntro Statistics, 2nd Edition Chp 4: Foundations for inference 17 / 69
37 Confidence intervals Changing the confidence level Image source: weather.gif Changing the confidence level point estimate ± z SE In a confidence interval, z SE is called the margin of error, and for a given sample, the margin of error changes as the confidence level changes. In order to change the confidence level we need to adjust z in the above formula. Commonly used confidence levels in practice are 90%, 95%, 98%, and 99%. For a 95% confidence interval, z = However, using the standard normal (z) distribution, it is possible to find the appropriate z for any confidence level. OpenIntro Statistics, 2nd Edition Chp 4: Foundations for inference 17 / 69
38 Confidence intervals Changing the confidence level Which of the below Z scores is the appropriate z when calculating a 98% confidence interval? (a) Z = 2.05 (b) Z = 1.96 (c) Z = 2.33 (d) Z = 2.33 (e) Z = 1.65 OpenIntro Statistics, 2nd Edition Chp 4: Foundations for inference 18 / 69
39 Confidence intervals Changing the confidence level Which of the below Z scores is the appropriate z when calculating a 98% confidence interval? (a) Z = 2.05 (b) Z = 1.96 (c) Z = 2.33 (d) Z = 2.33 (e) Z = z = 2.33 z = OpenIntro Statistics, 2nd Edition Chp 4: Foundations for inference 18 / 69
40 Hypothesis testing 1 Variability in estimates 2 Confidence intervals 3 Hypothesis testing Hypothesis testing framework Testing hypotheses using confidence intervals Conditions for inference Formal testing using p-values Two-sided hypothesis testing with p-values Decision errors Choosing a significance level Recap 4 Examining the Central Limit Theorem 5 Inference for other estimators 6 Sample size and power 7 Statistical vs. practical significance OpenIntro Statistics, 2nd Edition
41 Hypothesis testing Hypothesis testing framework Remember when... Gender discrimination experiment: Promotion Promoted Not Promoted Total Male Gender Female Total OpenIntro Statistics, 2nd Edition Chp 4: Foundations for inference 19 / 69
42 Hypothesis testing Hypothesis testing framework Remember when... Gender discrimination experiment: Promotion Promoted Not Promoted Total Male Gender Female Total ˆp males = 21/ ˆp females = 14/ OpenIntro Statistics, 2nd Edition Chp 4: Foundations for inference 19 / 69
43 Hypothesis testing Hypothesis testing framework Remember when... Gender discrimination experiment: Promotion Promoted Not Promoted Total Male Gender Female Total ˆp males = 21/ ˆp females = 14/ Possible explanations: Promotion and gender are independent, no gender discrimination, observed difference in proportions is simply due to chance. null - (nothing is going on) Promotion and gender are dependent, there is gender discrimination, observed difference in proportions is not due to chance. alternative - (something is going on) OpenIntro Statistics, 2nd Edition Chp 4: Foundations for inference 19 / 69
44 Hypothesis testing Hypothesis testing framework Result Difference in promotion rates OpenIntro Statistics, 2nd Edition Chp 4: Foundations for inference 20 / 69
45 Hypothesis testing Hypothesis testing framework Result Difference in promotion rates Since it was quite unlikely to obtain results like the actual data or something more extreme in the simulations (male promotions being 30% or more higher than female promotions), we decided to reject the null hypothesis in favor of the alternative. OpenIntro Statistics, 2nd Edition Chp 4: Foundations for inference 20 / 69
46 Hypothesis testing Hypothesis testing framework Recap: hypothesis testing framework We start with a null hypothesis (H 0 ) that represents the status quo. OpenIntro Statistics, 2nd Edition Chp 4: Foundations for inference 21 / 69
47 Hypothesis testing Hypothesis testing framework Recap: hypothesis testing framework We start with a null hypothesis (H 0 ) that represents the status quo. We also have an alternative hypothesis (H A ) that represents our research question, i.e. what we re testing for. OpenIntro Statistics, 2nd Edition Chp 4: Foundations for inference 21 / 69
48 Hypothesis testing Hypothesis testing framework Recap: hypothesis testing framework We start with a null hypothesis (H 0 ) that represents the status quo. We also have an alternative hypothesis (H A ) that represents our research question, i.e. what we re testing for. We conduct a hypothesis test under the assumption that the null hypothesis is true, either via simulation or traditional methods based on the central limit theorem (coming up next...). OpenIntro Statistics, 2nd Edition Chp 4: Foundations for inference 21 / 69
49 Hypothesis testing Hypothesis testing framework Recap: hypothesis testing framework We start with a null hypothesis (H 0 ) that represents the status quo. We also have an alternative hypothesis (H A ) that represents our research question, i.e. what we re testing for. We conduct a hypothesis test under the assumption that the null hypothesis is true, either via simulation or traditional methods based on the central limit theorem (coming up next...). If the test results suggest that the data do not provide convincing evidence for the alternative hypothesis, we stick with the null hypothesis. If they do, then we reject the null hypothesis in favor of the alternative. OpenIntro Statistics, 2nd Edition Chp 4: Foundations for inference 21 / 69
50 Hypothesis testing Hypothesis testing framework Recap: hypothesis testing framework We start with a null hypothesis (H 0 ) that represents the status quo. We also have an alternative hypothesis (H A ) that represents our research question, i.e. what we re testing for. We conduct a hypothesis test under the assumption that the null hypothesis is true, either via simulation or traditional methods based on the central limit theorem (coming up next...). If the test results suggest that the data do not provide convincing evidence for the alternative hypothesis, we stick with the null hypothesis. If they do, then we reject the null hypothesis in favor of the alternative. We ll formally introduce the hypothesis testing framework using an example on testing a claim about a population mean. OpenIntro Statistics, 2nd Edition Chp 4: Foundations for inference 21 / 69
51 Hypothesis testing Testing hypotheses using confidence intervals Testing hypotheses using confidence intervals Earlier we calculated a 95% confidence interval for the average number of exclusive relationships college students have been in to be (2.7, 3.7). Based on this confidence interval, do these data support the hypothesis that college students on average have been in more than 3 exclusive relationships. OpenIntro Statistics, 2nd Edition Chp 4: Foundations for inference 22 / 69
52 Hypothesis testing Testing hypotheses using confidence intervals Testing hypotheses using confidence intervals Earlier we calculated a 95% confidence interval for the average number of exclusive relationships college students have been in to be (2.7, 3.7). Based on this confidence interval, do these data support the hypothesis that college students on average have been in more than 3 exclusive relationships. The associated hypotheses are: H 0 : µ = 3: College students have been in 3 exclusive relationships, on average H A : µ > 3: College students have been in more than 3 exclusive relationships, on average OpenIntro Statistics, 2nd Edition Chp 4: Foundations for inference 22 / 69
53 Hypothesis testing Testing hypotheses using confidence intervals Testing hypotheses using confidence intervals Earlier we calculated a 95% confidence interval for the average number of exclusive relationships college students have been in to be (2.7, 3.7). Based on this confidence interval, do these data support the hypothesis that college students on average have been in more than 3 exclusive relationships. The associated hypotheses are: H 0 : µ = 3: College students have been in 3 exclusive relationships, on average H A : µ > 3: College students have been in more than 3 exclusive relationships, on average Since the null value is included in the interval, we do not reject the null hypothesis in favor of the alternative. OpenIntro Statistics, 2nd Edition Chp 4: Foundations for inference 22 / 69
54 Hypothesis testing Testing hypotheses using confidence intervals Testing hypotheses using confidence intervals Earlier we calculated a 95% confidence interval for the average number of exclusive relationships college students have been in to be (2.7, 3.7). Based on this confidence interval, do these data support the hypothesis that college students on average have been in more than 3 exclusive relationships. The associated hypotheses are: H 0 : µ = 3: College students have been in 3 exclusive relationships, on average H A : µ > 3: College students have been in more than 3 exclusive relationships, on average Since the null value is included in the interval, we do not reject the null hypothesis in favor of the alternative. This is a quick-and-dirty approach for hypothesis testing. However it doesn t tell us the likelihood of certain outcomes under the null hypothesis, i.e. the p-value, based on which we can make a decision on the hypotheses. OpenIntro Statistics, 2nd Edition Chp 4: Foundations for inference 22 / 69
55 Hypothesis testing Testing hypotheses using confidence intervals Number of college applications A similar survey asked how many colleges students applied to, and 206 students responded to this question. This sample yielded an average of 9.7 college applications with a standard deviation of 7. College Board website states that counselors recommend students apply to roughly 8 colleges. Do these data provide convincing evidence that the average number of colleges all Duke students apply to is higher than recommended? student/ apply/ the-application/ html OpenIntro Statistics, 2nd Edition Chp 4: Foundations for inference 23 / 69
56 Hypothesis testing Testing hypotheses using confidence intervals Setting the hypotheses The parameter of interest is the average number of schools applied to by all Duke students. OpenIntro Statistics, 2nd Edition Chp 4: Foundations for inference 24 / 69
57 Hypothesis testing Testing hypotheses using confidence intervals Setting the hypotheses The parameter of interest is the average number of schools applied to by all Duke students. There may be two explanations why our sample mean is higher than the recommended 8 schools. The true population mean is different. The true population mean is 8, and the difference between the true population mean and the sample mean is simply due to natural sampling variability. OpenIntro Statistics, 2nd Edition Chp 4: Foundations for inference 24 / 69
58 Hypothesis testing Testing hypotheses using confidence intervals Setting the hypotheses The parameter of interest is the average number of schools applied to by all Duke students. There may be two explanations why our sample mean is higher than the recommended 8 schools. The true population mean is different. The true population mean is 8, and the difference between the true population mean and the sample mean is simply due to natural sampling variability. We start with the assumption the average number of colleges Duke students apply to is 8 (as recommended) H 0 : µ = 8 OpenIntro Statistics, 2nd Edition Chp 4: Foundations for inference 24 / 69
59 Hypothesis testing Testing hypotheses using confidence intervals Setting the hypotheses The parameter of interest is the average number of schools applied to by all Duke students. There may be two explanations why our sample mean is higher than the recommended 8 schools. The true population mean is different. The true population mean is 8, and the difference between the true population mean and the sample mean is simply due to natural sampling variability. We start with the assumption the average number of colleges Duke students apply to is 8 (as recommended) H 0 : µ = 8 We test the claim that the average number of colleges Duke students apply to is greater than 8 H A : µ > 8 OpenIntro Statistics, 2nd Edition Chp 4: Foundations for inference 24 / 69
60 Hypothesis testing Conditions for inference Number of college applications - conditions Which of the following is not a condition that needs to be met to proceed with this hypothesis test? (a) Students in the sample should be independent of each other with respect to how many colleges they applied to. (b) Sampling should have been done randomly. (c) The sample size should be less than 10% of the population of all Duke students. (d) There should be at least 10 successes and 10 failures in the sample. (e) The distribution of the number of colleges students apply to should not be extremely skewed. OpenIntro Statistics, 2nd Edition Chp 4: Foundations for inference 25 / 69
61 Hypothesis testing Conditions for inference Number of college applications - conditions Which of the following is not a condition that needs to be met to proceed with this hypothesis test? (a) Students in the sample should be independent of each other with respect to how many colleges they applied to. (b) Sampling should have been done randomly. (c) The sample size should be less than 10% of the population of all Duke students. (d) There should be at least 10 successes and 10 failures in the sample. (e) The distribution of the number of colleges students apply to should not be extremely skewed. OpenIntro Statistics, 2nd Edition Chp 4: Foundations for inference 25 / 69
62 Hypothesis testing Formal testing using p-values Test statistic In order to evaluate if the observed sample mean is unusual for the hypothesized sampling distribution, we determine how many standard errors away from the null it is, which is also called the test statistic. OpenIntro Statistics, 2nd Edition Chp 4: Foundations for inference 26 / 69
63 Hypothesis testing Formal testing using p-values Test statistic In order to evaluate if the observed sample mean is unusual for the hypothesized sampling distribution, we determine how many standard errors away from the null it is, which is also called the test statistic. µ = 8 x = 9.7 OpenIntro Statistics, 2nd Edition Chp 4: Foundations for inference 26 / 69
64 Hypothesis testing Formal testing using p-values Test statistic In order to evaluate if the observed sample mean is unusual for the hypothesized sampling distribution, we determine how many standard errors away from the null it is, which is also called the test statistic. ( x N µ = 8, SE = µ = 8 x = = 0.5 ) OpenIntro Statistics, 2nd Edition Chp 4: Foundations for inference 26 / 69
65 Hypothesis testing Formal testing using p-values Test statistic In order to evaluate if the observed sample mean is unusual for the hypothesized sampling distribution, we determine how many standard errors away from the null it is, which is also called the test statistic. ( x N µ = 8, SE = µ = 8 x = = 0.5 ) Z = = 3.4 OpenIntro Statistics, 2nd Edition Chp 4: Foundations for inference 26 / 69
66 Hypothesis testing Formal testing using p-values Test statistic In order to evaluate if the observed sample mean is unusual for the hypothesized sampling distribution, we determine how many standard errors away from the null it is, which is also called the test statistic. ( x N µ = 8, SE = µ = 8 x = = 0.5 ) The sample mean is 3.4 standard errors away from the hypothesized value. Is this considered unusually high? That is, is the result statistically significant? Z = = 3.4 OpenIntro Statistics, 2nd Edition Chp 4: Foundations for inference 26 / 69
67 Hypothesis testing Formal testing using p-values Test statistic In order to evaluate if the observed sample mean is unusual for the hypothesized sampling distribution, we determine how many standard errors away from the null it is, which is also called the test statistic. ( x N µ = 8, SE = Z = µ = 8 x = = 0.5 = 3.4 ) The sample mean is 3.4 standard errors away from the hypothesized value. Is this considered unusually high? That is, is the result statistically significant? Yes, and we can quantify how unusual it is using a p-value. OpenIntro Statistics, 2nd Edition Chp 4: Foundations for inference 26 / 69
68 Hypothesis testing Formal testing using p-values p-values We then use this test statistic to calculate the p-value, the probability of observing data at least as favorable to the alternative hypothesis as our current data set, if the null hypothesis were true. OpenIntro Statistics, 2nd Edition Chp 4: Foundations for inference 27 / 69
69 Hypothesis testing Formal testing using p-values p-values We then use this test statistic to calculate the p-value, the probability of observing data at least as favorable to the alternative hypothesis as our current data set, if the null hypothesis were true. If the p-value is low (lower than the significance level, α, which is usually 5%) we say that it would be very unlikely to observe the data if the null hypothesis were true, and hence reject H 0. OpenIntro Statistics, 2nd Edition Chp 4: Foundations for inference 27 / 69
70 Hypothesis testing Formal testing using p-values p-values We then use this test statistic to calculate the p-value, the probability of observing data at least as favorable to the alternative hypothesis as our current data set, if the null hypothesis were true. If the p-value is low (lower than the significance level, α, which is usually 5%) we say that it would be very unlikely to observe the data if the null hypothesis were true, and hence reject H 0. If the p-value is high (higher than α) we say that it is likely to observe the data even if the null hypothesis were true, and hence do not reject H 0. OpenIntro Statistics, 2nd Edition Chp 4: Foundations for inference 27 / 69
71 Hypothesis testing Formal testing using p-values Number of college applications - p-value p-value: probability of observing data at least as favorable to H A as our current data set (a sample mean greater than 9.7), if in fact H 0 were true (the true population mean was 8). µ = 8 x = 9.7 OpenIntro Statistics, 2nd Edition Chp 4: Foundations for inference 28 / 69
72 Hypothesis testing Formal testing using p-values Number of college applications - p-value p-value: probability of observing data at least as favorable to H A as our current data set (a sample mean greater than 9.7), if in fact H 0 were true (the true population mean was 8). µ = 8 x = 9.7 P( x > 9.7 µ = 8) = P(Z > 3.4) = OpenIntro Statistics, 2nd Edition Chp 4: Foundations for inference 28 / 69
73 Hypothesis testing Formal testing using p-values Number of college applications - Making a decision p-value = OpenIntro Statistics, 2nd Edition Chp 4: Foundations for inference 29 / 69
74 Hypothesis testing Formal testing using p-values Number of college applications - Making a decision p-value = If the true average of the number of colleges Duke students applied to is 8, there is only 0.03% chance of observing a random sample of 206 Duke students who on average apply to 9.7 or more schools. OpenIntro Statistics, 2nd Edition Chp 4: Foundations for inference 29 / 69
75 Hypothesis testing Formal testing using p-values Number of college applications - Making a decision p-value = If the true average of the number of colleges Duke students applied to is 8, there is only 0.03% chance of observing a random sample of 206 Duke students who on average apply to 9.7 or more schools. This is a pretty low probability for us to think that a sample mean of 9.7 or more schools is likely to happen simply by chance. OpenIntro Statistics, 2nd Edition Chp 4: Foundations for inference 29 / 69
76 Hypothesis testing Formal testing using p-values Number of college applications - Making a decision p-value = If the true average of the number of colleges Duke students applied to is 8, there is only 0.03% chance of observing a random sample of 206 Duke students who on average apply to 9.7 or more schools. This is a pretty low probability for us to think that a sample mean of 9.7 or more schools is likely to happen simply by chance. Since p-value is low (lower than 5%) we reject H 0. OpenIntro Statistics, 2nd Edition Chp 4: Foundations for inference 29 / 69
77 Hypothesis testing Formal testing using p-values Number of college applications - Making a decision p-value = If the true average of the number of colleges Duke students applied to is 8, there is only 0.03% chance of observing a random sample of 206 Duke students who on average apply to 9.7 or more schools. This is a pretty low probability for us to think that a sample mean of 9.7 or more schools is likely to happen simply by chance. Since p-value is low (lower than 5%) we reject H 0. The data provide convincing evidence that Duke students apply to more than 8 schools on average. OpenIntro Statistics, 2nd Edition Chp 4: Foundations for inference 29 / 69
78 Hypothesis testing Formal testing using p-values Number of college applications - Making a decision p-value = If the true average of the number of colleges Duke students applied to is 8, there is only 0.03% chance of observing a random sample of 206 Duke students who on average apply to 9.7 or more schools. This is a pretty low probability for us to think that a sample mean of 9.7 or more schools is likely to happen simply by chance. Since p-value is low (lower than 5%) we reject H 0. The data provide convincing evidence that Duke students apply to more than 8 schools on average. The difference between the null value of 8 schools and observed sample mean of 9.7 schools is not due to chance or sampling variability. OpenIntro Statistics, 2nd Edition Chp 4: Foundations for inference 29 / 69
79 Hypothesis testing Formal testing using p-values A poll by the National Sleep Foundation found that college students average about 7 hours of sleep per night. A sample of 169 college students taking an introductory statistics class yielded an average of 6.88 hours, with a standard deviation of 0.94 hours. Assuming that this is a random sample representative of all college students (bit of a leap of faith?), a hypothesis test was conducted to evaluate if college students on average sleep less than 7 hours per night. The p-value for this hypothesis test is Which of the following is correct? (a) Fail to reject H 0, the data provide convincing evidence that college students sleep less than 7 hours on average. (b) Reject H 0, the data provide convincing evidence that college students sleep less than 7 hours on average. (c) Reject H 0, the data prove that college students sleep more than 7 hours on average. (d) Fail to reject H 0, the data do not provide convincing evidence that college students sleep less than 7 hours on average. (e) Reject H 0, the data provide convincing evidence that college students in this sample sleep less than 7 hours on average. OpenIntro Statistics, 2nd Edition Chp 4: Foundations for inference 30 / 69
80 Hypothesis testing Formal testing using p-values A poll by the National Sleep Foundation found that college students average about 7 hours of sleep per night. A sample of 169 college students taking an introductory statistics class yielded an average of 6.88 hours, with a standard deviation of 0.94 hours. Assuming that this is a random sample representative of all college students (bit of a leap of faith?), a hypothesis test was conducted to evaluate if college students on average sleep less than 7 hours per night. The p-value for this hypothesis test is Which of the following is correct? (a) Fail to reject H 0, the data provide convincing evidence that college students sleep less than 7 hours on average. (b) Reject H 0, the data provide convincing evidence that college students sleep less than 7 hours on average. (c) Reject H 0, the data prove that college students sleep more than 7 hours on average. (d) Fail to reject H 0, the data do not provide convincing evidence that college students sleep less than 7 hours on average. (e) Reject H 0, the data provide convincing evidence that college students in this sample sleep less than 7 hours on average. OpenIntro Statistics, 2nd Edition Chp 4: Foundations for inference 30 / 69
81 Hypothesis testing Two-sided hypothesis testing with p-values Two-sided hypothesis testing with p-values If the research question was Do the data provide convincing evidence that the average amount of sleep college students get per night is different than the national average?, the alternative hypothesis would be different. H 0 : µ = 7 H A : µ 7 OpenIntro Statistics, 2nd Edition Chp 4: Foundations for inference 31 / 69
82 Hypothesis testing Two-sided hypothesis testing with p-values Two-sided hypothesis testing with p-values If the research question was Do the data provide convincing evidence that the average amount of sleep college students get per night is different than the national average?, the alternative hypothesis would be different. H 0 : µ = 7 H A : µ 7 Hence the p-value would change as well: p-value = = x= 6.88 µ= OpenIntro Statistics, 2nd Edition Chp 4: Foundations for inference 31 / 69
83 Hypothesis testing Decision errors Decision errors Hypothesis tests are not flawless. In the court system innocent people are sometimes wrongly convicted and the guilty sometimes walk free. Similarly, we can make a wrong decision in statistical hypothesis tests as well. The difference is that we have the tools necessary to quantify how often we make errors in statistics. OpenIntro Statistics, 2nd Edition Chp 4: Foundations for inference 32 / 69
84 Hypothesis testing Decision errors Decision errors (cont.) There are two competing hypotheses: the null and the alternative. In a hypothesis test, we make a decision about which might be true, but our choice might be incorrect. OpenIntro Statistics, 2nd Edition Chp 4: Foundations for inference 33 / 69
85 Hypothesis testing Decision errors Decision errors (cont.) There are two competing hypotheses: the null and the alternative. In a hypothesis test, we make a decision about which might be true, but our choice might be incorrect. Truth H 0 true HA true Decision fail to reject H 0 reject H 0 OpenIntro Statistics, 2nd Edition Chp 4: Foundations for inference 33 / 69
86 Hypothesis testing Decision errors Decision errors (cont.) There are two competing hypotheses: the null and the alternative. In a hypothesis test, we make a decision about which might be true, but our choice might be incorrect. Truth H 0 true HA true Decision fail to reject H 0 reject H 0 OpenIntro Statistics, 2nd Edition Chp 4: Foundations for inference 33 / 69
87 Hypothesis testing Decision errors Decision errors (cont.) There are two competing hypotheses: the null and the alternative. In a hypothesis test, we make a decision about which might be true, but our choice might be incorrect. Decision fail to reject H 0 reject H 0 H 0 true Truth HA true OpenIntro Statistics, 2nd Edition Chp 4: Foundations for inference 33 / 69
88 Hypothesis testing Decision errors Decision errors (cont.) There are two competing hypotheses: the null and the alternative. In a hypothesis test, we make a decision about which might be true, but our choice might be incorrect. Decision fail to reject H 0 reject H 0 H 0 true Type 1 Error Truth HA true A Type 1 Error is rejecting the null hypothesis when H 0 is true. OpenIntro Statistics, 2nd Edition Chp 4: Foundations for inference 33 / 69
89 Hypothesis testing Decision errors Decision errors (cont.) There are two competing hypotheses: the null and the alternative. In a hypothesis test, we make a decision about which might be true, but our choice might be incorrect. Decision fail to reject H 0 reject H 0 H 0 true Type 1 Error Truth HA true Type 2 Error A Type 1 Error is rejecting the null hypothesis when H 0 is true. A Type 2 Error is failing to reject the null hypothesis when H A is true. OpenIntro Statistics, 2nd Edition Chp 4: Foundations for inference 33 / 69
90 Hypothesis testing Decision errors Decision errors (cont.) There are two competing hypotheses: the null and the alternative. In a hypothesis test, we make a decision about which might be true, but our choice might be incorrect. Decision fail to reject H 0 reject H 0 H 0 true Type 1 Error Truth HA true Type 2 Error A Type 1 Error is rejecting the null hypothesis when H 0 is true. A Type 2 Error is failing to reject the null hypothesis when H A is true. We (almost) never know if H 0 or H A is true, but we need to consider all possibilities. OpenIntro Statistics, 2nd Edition Chp 4: Foundations for inference 33 / 69
91 Hypothesis testing Decision errors Hypothesis Test as a trial If we again think of a hypothesis test as a criminal trial then it makes sense to frame the verdict in terms of the null and alternative hypotheses: H 0 : Defendant is innocent H A : Defendant is guilty Which type of error is being committed in the following cirumstances? Declaring the defendant innocent when they are actually guilty Declaring the defendant guilty when they are actually innocent OpenIntro Statistics, 2nd Edition Chp 4: Foundations for inference 34 / 69
92 Hypothesis testing Decision errors Hypothesis Test as a trial If we again think of a hypothesis test as a criminal trial then it makes sense to frame the verdict in terms of the null and alternative hypotheses: H 0 : Defendant is innocent H A : Defendant is guilty Which type of error is being committed in the following cirumstances? Declaring the defendant innocent when they are actually guilty Type 2 error Declaring the defendant guilty when they are actually innocent OpenIntro Statistics, 2nd Edition Chp 4: Foundations for inference 34 / 69
93 Hypothesis testing Decision errors Hypothesis Test as a trial If we again think of a hypothesis test as a criminal trial then it makes sense to frame the verdict in terms of the null and alternative hypotheses: H 0 : Defendant is innocent H A : Defendant is guilty Which type of error is being committed in the following cirumstances? Declaring the defendant innocent when they are actually guilty Type 2 error Declaring the defendant guilty when they are actually innocent Type 1 error OpenIntro Statistics, 2nd Edition Chp 4: Foundations for inference 34 / 69
94 Hypothesis testing Decision errors Hypothesis Test as a trial If we again think of a hypothesis test as a criminal trial then it makes sense to frame the verdict in terms of the null and alternative hypotheses: H 0 : Defendant is innocent H A : Defendant is guilty Which type of error is being committed in the following cirumstances? Declaring the defendant innocent when they are actually guilty Type 2 error Declaring the defendant guilty when they are actually innocent Type 1 error Which error do you think is the worse error to make? OpenIntro Statistics, 2nd Edition Chp 4: Foundations for inference 34 / 69
Unit3: Foundationsforinference. 1. Variability in estimates and CLT. Sta Fall Lab attendance & lateness Peer evaluations
 Announcements Unit3: Foundationsforinference 1. Variability in estimates and CLT Sta 101 - Fall 2015 Duke University, Department of Statistical Science Lab attendance & lateness Peer evaluations Dr. Monod
Lecture 9 - Sampling Distributions and the CLT
 Lecture 9 - Sampling Distributions and the CLT Sta102/BME102 February 15, 2016 Colin Rundel Variability of Estimates Mean Sample mean ( X): X = 1 n (x 1 + x 2 + x 3 + + x n ) = 1 n n i=1 x i Population
Lecture 8: Introduction to sampling distributions
 Lecture 8: Introduction to sampling distributions Statistics 101 Mine Çetinkaya-Rundel February 9, 2012 Announcements Announcements Due: Quiz 3 Monday morning 8am. OH change: Monday s office hours moved
Chapter 19. Confidence Intervals for Proportions. Copyright 2012, 2008, 2005 Pearson Education, Inc.
 Chapter 19 Confidence Intervals for Proportions Copyright 2012, 2008, 2005 Pearson Education, Inc. Standard Error Both of the sampling distributions we ve looked at are Normal. For proportions For means
CHAPTER 21A. What is a Confidence Interval?
 CHAPTER 21A What is a Confidence Interval? RECALL Parameter fixed, unknown number that describes the population Statistic known value calculated from a sample a statistic is used to estimate a parameter
Confidence Intervals
 Confidence Intervals Example 1: How prevalent is sports gambling in America? 2007 Gallup poll took a random sample of 1027 adult Americans. 17% of the sampled adults had gambled on sports in the past year.
Section 7-3 Estimating a Population Mean: σ Known
 Section 7-3 Estimating a Population Mean: σ Known Created by Erin Hodgess, Houston, Texas Revised to accompany 10 th Edition, Tom Wegleitner, Centreville, VA Slide 1 Key Concept Use sample data to find
Lab 9: Sampling Distributions
 Lab 9: Sampling Distributions Sampling from Ames, Iowa In this lab, we will investigate the ways in which the estimates that we make based on a random sample of data can inform us about what the population
Hypothesis Testing Chapter 21. HO = innocent. innocent HO true. True accept (1 α) innocent jury: innocent
 innocent jury: innocent") Hypothesis Testing Chapter 21 HO = innocent innocent HO true not innocent HO False Test says Accept HO True accept (1 α) innocent jury: innocent False accept "Type II error" β not innocent jury: innocent
Hypothesis Testing Chapter 21 HO = innocent innocent HO true not innocent HO False Test says Accept HO True accept (1 α) innocent jury: innocent False accept "Type II error" β not innocent jury: innocent
AP Stats ~ Lesson 8A: Confidence Intervals OBJECTIVES:
 AP Stats ~ Lesson 8A: Confidence Intervals OBJECTIVES: DETERMINE the point estimate and margin of error from a confidence interval. INTERPRET a confidence interval in context. INTERPRET a confidence level
Chapter 7: Sampling Distributions
 + Chapter 7: Sampling Distributions Section 7.3 The Practice of Statistics, 4 th edition For AP* STARNES, YATES, MOORE + Chapter 7 Sampling Distributions 7.1 What is a Sampling Distribution? 7.2 Sample
Chapter 7: Sampling Distributions
 + Chapter 7: Sampling Distributions Section 7.3 The Practice of Statistics, 4 th edition For AP* STARNES, YATES, MOORE + Chapter 7 Sampling Distributions 7.1 What is a Sampling Distribution? 7.2 Sample
Chapter 3: Distributions of Random Variables
 Chapter 3: Distributions of Random Variables OpenIntro Statistics, 2nd Edition Slides developed by Mine Çetinkaya-Rundel of OpenIntro The slides may be copied, edited, and/or shared via the CC BY-SA license
provided that the population is at least 10 times as large as the sample (10% condition).
.") 8.2.1 Conditions for Estimating p As always, inference is based on the sampling distribution of a statistic. We described the sampling distribution of a sample proportion p-hat in section 7.2. Here is
8.2.1 Conditions for Estimating p As always, inference is based on the sampling distribution of a statistic. We described the sampling distribution of a sample proportion p-hat in section 7.2. Here is
3) Confidence interval is an interval estimate of the population mean (µ)
 Confidence interval is an interval estimate of the population mean (µ)") Test 3 Review Math 1342 1) A point estimate of the population mean (µ) is a sample mean. For given set of data, x sample mean = 67.7 Thus, point estimate of population mean ( ) is 67.7 2) A point estimate
Test 3 Review Math 1342 1) A point estimate of the population mean (µ) is a sample mean. For given set of data, x sample mean = 67.7 Thus, point estimate of population mean ( ) is 67.7 2) A point estimate
Suppose we wanted to use a sample of 25 students to estimate the average GPA of all students. Now suppose we choose our sample by random sampling and
 Margin of Error When a sample is used to draw inferences about a larger population, there is always a possibility that the sample is non-representative, i.e. does not reflect the true attributes of the
Day 1: Confidence Intervals, Center and Spread (CLT, Variability of Sample Mean) Day 2: Regression, Regression Inference, Classification
 Day 2: Regression, Regression Inference, Classification") Data 8, Final Review Review schedule: - Day 1: Confidence Intervals, Center and Spread (CLT, Variability of Sample Mean) Day 2: Regression, Regression Inference, Classification Your friendly reviewers
Data 8, Final Review Review schedule: - Day 1: Confidence Intervals, Center and Spread (CLT, Variability of Sample Mean) Day 2: Regression, Regression Inference, Classification Your friendly reviewers
Biostatistics for Public Health Practice
 Biostatistics for Public Health Practice Week 03 3 Concepts of Statistical Inference Associate Professor Theo Niyonsenga HLTH 5187: Biostatistics for MPHP 1 Statistical Inference Statistics Survey Sampling
Sawtooth Software. Sample Size Issues for Conjoint Analysis Studies RESEARCH PAPER SERIES. Bryan Orme, Sawtooth Software, Inc.
 Sawtooth Software RESEARCH PAPER SERIES Sample Size Issues for Conjoint Analysis Studies Bryan Orme, Sawtooth Software, Inc. 1998 Copyright 1998-2001, Sawtooth Software, Inc. 530 W. Fir St. Sequim, WA
BOOTSTRAPPING AND CONFIDENCE INTERVALS
 BOOTSTRAPPING AND CONFIDENCE INTERVALS Fill out your reading report on Learning Suite MPA 630: Data Science for Public Management November 8, 2018 PLAN FOR TODAY Why are we even doing this? Confidence
Chapter 8: Estimating with Confidence. Section 8.2 Estimating a Population Proportion
 Chapter 8: Estimating with Confidence Section 8.2 Activity: The Beads Your teacher has a container full of different colored beads. Your goal is to estimate the actual proportion of red beads in the container.
Chapter 7: Sampling Distributions
 Chapter 7: Sampling Distributions Section 7.3 The Practice of Statistics, 4 th edition For AP* STARNES, YATES, MOORE Chapter 7 Sampling Distributions 7.1 What is a Sampling Distribution? 7.2 Sample Proportions
Lecture (chapter 7): Estimation procedures
: Estimation procedures") Lecture (chapter 7): Estimation procedures Ernesto F. L. Amaral February 19 21, 2018 Advanced Methods of Social Research (SOCI 420) Source: Healey, Joseph F. 2015. Statistics: A Tool for Social Research.
Lecture (chapter 7): Estimation procedures Ernesto F. L. Amaral February 19 21, 2018 Advanced Methods of Social Research (SOCI 420) Source: Healey, Joseph F. 2015. Statistics: A Tool for Social Research.
6. The probability that you win at least $1 both time is (a) 1/2 (b) 4/36 (c) 1/36 (d) 1/4 (e) 3/4
 1/2 (b) 4/36 (c) 1/36 (d) 1/4 (e) 3/4") AP Statistics ~ Unit 3 Practice Test ANSWERS MULTIPLE CHOICE PRACTICE 1. An assignment of probability must obey which of the following? (a) The probability of any event must be a number between 0 and 1,
AP Statistics ~ Unit 3 Practice Test ANSWERS MULTIPLE CHOICE PRACTICE 1. An assignment of probability must obey which of the following? (a) The probability of any event must be a number between 0 and 1,
Section 8.2 Estimating a Population Proportion. ACTIVITY The beads. Conditions for Estimating p
 Section 8.2 Estimating a Population Proportion ACTIVITY The beads Conditions for Estimating p Suppose one SRS of beads resulted in 107 red beads and 144 beads of another color. The point estimate for the
Understanding Inference: Confidence Intervals II. Questions about the Assignment. Summary (From Last Class) The Problem
 The Problem") Questions about the Assignment Part I The z-score is not the same as the percentile (eg, a z-score of 98 does not equal the 98 th percentile) The z-score is the number of standard deviations the value
Questions about the Assignment Part I The z-score is not the same as the percentile (eg, a z-score of 98 does not equal the 98 th percentile) The z-score is the number of standard deviations the value
Secondary Math Margin of Error
 Secondary Math 3 1-4 Margin of Error What you will learn: How to use data from a sample survey to estimate a population mean or proportion. How to develop a margin of error through the use of simulation
155S9.4_3 Inferences from Dependent Samples. April 11, Key Concept. Chapter 9 Inferences from Two Samples. Key Concept
 MAT 155 Statistical Analysis Dr. Claude Moore Cape Fear Community College Chapter 9 Inferences from Two Samples 9 1 Review and Preview 9 2 Inferences About Two Proportions 9 3 Inferences About Two Means:
Capability on Aggregate Processes
 Capability on Aggregate Processes CVJ Systems AWD Systems Trans Axle Solutions edrive Systems The Problem Fixture 1 Fixture 2 Horizontal Mach With one machine and a couple of fixtures, it s a pretty easy
LECTURE 17: MULTIVARIABLE REGRESSIONS I
 David Youngberg BSAD 210 Montgomery College LECTURE 17: MULTIVARIABLE REGRESSIONS I I. What Determines a House s Price? a. Open Data Set 6 to help us answer this question. You ll see pricing data for homes
The Dummy s Guide to Data Analysis Using SPSS
 The Dummy s Guide to Data Analysis Using SPSS Univariate Statistics Scripps College Amy Gamble April, 2001 Amy Gamble 4/30/01 All Rights Rerserved Table of Contents PAGE Creating a Data File...3 1. Creating
Hypothesis Testing. Topics of the Day
 Hypothesis Testing LIR 832 Lecture #3 Sept, 2008 Topics of the Day A. Our Fundamental Problem Again: Learning About Populations from Samples B. Basic Hypothesis Testing: One Tailed Tests Using a Z Statistic
From the Data at Hand to the World at Large
 From the Data at Hand to the World at Large PART V Chapter 18 Sampling Distribution Models Chapter 19 Confidence Intervals for Proportions Chapter 2 Testing Hypotheses About Proportions Chapter 21 More
WINDOWS, MINITAB, AND INFERENCE
 DEPARTMENT OF POLITICAL SCIENCE AND INTERNATIONAL RELATIONS Posc/Uapp 816 WINDOWS, MINITAB, AND INFERENCE I. AGENDA: A. An example with a simple (but) real data set to illustrate 1. Windows 2. The importance
Engineering Statistics ECIV 2305 Chapter 8 Inferences on a Population Mean. Section 8.1. Confidence Intervals
 Engineering Statistics ECIV 2305 Chapter 8 Inferences on a Population Mean Section 8.1 Confidence Intervals Parameter vs. Statistic A parameter is a property of a population or a probability distribution
CS 147: Computer Systems Performance Analysis
 CS 147: Computer Systems Performance Analysis Approaching Performance Projects CS 147: Computer Systems Performance Analysis Approaching Performance Projects 1 / 35 Overview Overview Overview Planning
Chapter 2: Probability. OpenIntro Statistics, 2nd Edition
 Chapter 2: Probability OpenIntro Statistics, 2nd Edition Defining probability 1 Defining probability Probability Defining probability Disjoint or mutually exclusive outcomes Probabilities when events are
How Likely Are the Possible Values of a Statistic? The Sampling Distribution
 Section 6.4 How Likely Are the Possible Values of a Statistic? The Sampling Distribution Agresti/Franklin Statistics, 1e, 1of 21 Parameter and Statistic Parameter: A numerical summary of a population,
Correlation and Simple. Linear Regression. Scenario. Defining Correlation
 Linear Regression Scenario Let s imagine that we work in a real estate business and we re attempting to understand whether there s any association between the square footage of a house and it s final selling
Confidence Intervals for Large Sample Means
 Confidence Intervals for Large Sample Means Dr Tom Ilvento Department of Food and Resource Economics Overview Let s continue the discussion of Confidence Intervals (C.I.) And I will shift to the C.I. for
80 = 300 ± 1.96(10) = 300 ±
 = 300 ±") SOLUTIONS: STATISTICAL INFERENCE One-Sample Z-test and Two-sided Confidence Interval Estimators Using Z PROBLEM 1: A company wishes to determine if the average salary of its clerks is really $340. The
SOLUTIONS: STATISTICAL INFERENCE One-Sample Z-test and Two-sided Confidence Interval Estimators Using Z PROBLEM 1: A company wishes to determine if the average salary of its clerks is really $340. The
THE NORMAL CURVE AND SAMPLES:
 -69- &KDSWHU THE NORMAL CURVE AND SAMPLES: SAMPLING DISTRIBUTIONS A picture of an ideal normal distribution is shown below. The horizontal axis is calibrated in z-scores in terms of standard deviation
Online Student Guide Types of Control Charts
 Online Student Guide Types of Control Charts OpusWorks 2016, All Rights Reserved 1 Table of Contents LEARNING OBJECTIVES... 4 INTRODUCTION... 4 DETECTION VS. PREVENTION... 5 CONTROL CHART UTILIZATION...
Estimation: Confidence Intervals
 STAT 101 Dr. Kari Lock Morgan Estimation: SECTION 3.2 (3.2) Exam Regrades Submit regrade requests to me for Exam 1 by class on Friday Include a cover page stating what you believe was graded incorrectly
How to Use Excel for Regression Analysis MtRoyal Version 2016RevA *
 OpenStax-CNX module: m63578 1 How to Use Excel for Regression Analysis MtRoyal Version 2016RevA * Lyryx Learning Based on How to Use Excel for Regression Analysis BSTA 200 Humber College Version 2016RevA
Stat 411/511 MORE ON THE RANDOM SAMPLING MODEL. Charlotte Wickham. stat511.cwick.co.nz. Sep
 Stat 411/511 MORE ON THE RANDOM SAMPLING MODEL Sep 29 2015 Charlotte Wickham stat511.cwick.co.nz Announcements My office hours: Mondays 11am 255 Weniger Thursdays 3-5pm 3003 Cordley Help with Statistics
Statistics Summary Exercises
 1. A marketing firm wants to determine the typical amount spent during a visit to the grocery store. Each day for one week, they record the amount spent by the first 25 shoppers at a major grocery store.
Confidence Interval Estimation
 Confidence Interval Estimation Prof. dr. Siswanto Agus Wilopo, M.Sc., Sc.D. Department of Biostatistics, Epidemiology and Population Health Faculty of Medicine Universitas Gadjah Mada Biostatistics I:
Chapter 10 Regression Analysis
 Chapter 10 Regression Analysis Goal: To become familiar with how to use Excel 2007/2010 for Correlation and Regression. Instructions: You will be using CORREL, FORECAST and Regression. CORREL and FORECAST
Gush vs. Bore: A Look at the Statistics of Sampling
 Gush vs. Bore: A Look at the Statistics of Sampling Open the Fathom file Random_Samples.ftm. Imagine that in a nation somewhere nearby, a presidential election will soon be held with two candidates named
Chapter 7-3. For one of the simulated sets of data (from last time): n = 1000, ˆp Estimating a population mean, known Requires
: n = 1000, ˆp Estimating a population mean, known Requires") For one of the simulated sets of data (from last time): n = 1000, ˆp 0.50 0.50.498 SE pˆ 0.0158 1000 Fixed sample size, increasing CI 1001 z Interval 80%.0.10 1.85.48,.5 90%.10.05 1.645.476,.58 95%.05.05
For one of the simulated sets of data (from last time): n = 1000, ˆp 0.50 0.50.498 SE pˆ 0.0158 1000 Fixed sample size, increasing CI 1001 z Interval 80%.0.10 1.85.48,.5 90%.10.05 1.645.476,.58 95%.05.05
Two Way ANOVA. Turkheimer PSYC 771. Page 1 Two-Way ANOVA
 Page 1 Two Way ANOVA Two way ANOVA is conceptually like multiple regression, in that we are trying to simulateously assess the effects of more than one X variable on Y. But just as in One Way ANOVA, the
Multiple Choice Questions Sampling Distributions
 Multiple Choice Questions Sampling Distributions 1. The Gallup Poll has decided to increase the size of its random sample of Canadian voters from about 1500 people to about 4000 people. The effect of this
Statistics 201 Spring 2018 Exam 2 Practice Exam (from Fall 2016)
") Statistics 201 Spring 2018 Exam 2 Practice Exam (from Fall 2016) Disclaimer: This practice exam is provided solely for the purpose of familiarizing you with the format and style of the Stat 201 exams.
Statistics 201 Spring 2018 Exam 2 Practice Exam (from Fall 2016) Disclaimer: This practice exam is provided solely for the purpose of familiarizing you with the format and style of the Stat 201 exams.
Distinguish between different types of numerical data and different data collection processes.
 Level: Diploma in Business Learning Outcomes 1.1 1.3 Distinguish between different types of numerical data and different data collection processes. Introduce the course by defining statistics and explaining
CHAPTER 7: Central Limit Theorem: CLT for Averages (Means)
") = the number obtained when rolling one six sided die once. If we roll a six sided die once, the mean of the probability distribution is P( = x) Simulation: We simulated rolling a six sided die times using
= the number obtained when rolling one six sided die once. If we roll a six sided die once, the mean of the probability distribution is P( = x) Simulation: We simulated rolling a six sided die times using
+? Mean +? No change -? Mean -? No Change. *? Mean *? Std *? Transformations & Data Cleaning. Transformations
 Transformations Transformations & Data Cleaning Linear & non-linear transformations 2-kinds of Z-scores Identifying Outliers & Influential Cases Univariate Outlier Analyses -- trimming vs. Winsorizing
Chapter 18: Sampling Distribution Models
 Chapter 18: Sampling Distribution Models Key Vocabulary: parameter statistic proportion sampling distribution model Central Limit Theorem Standard error 1. Explain the difference between a parameter and
2015 AP Statistics Exam NAME
 2015 AP Statistics Exam NAME (b) Suppose both corporations offered you a job for $36,000 a year as an entry-level accountant. (i) Based on the boxplots, give one reason why you might choose to accept the
Chapter 8 Script. Welcome to Chapter 8, Are Your Curves Normal? Probability and Why It Counts.
 Chapter 8 Script Slide 1 Are Your Curves Normal? Probability and Why It Counts Hi Jed Utsinger again. Welcome to Chapter 8, Are Your Curves Normal? Probability and Why It Counts. Now, I don t want any
AP Statistics Cumulative Practice Test 3 (Ch 1 Ch 13) Section I: Multiple Choice Choose the best answer.
 Section I: Multiple Choice Choose the best answer.") AP Statistics Cumulative Practice Test 3 (Ch 1 Ch 13) Section I: Multiple Choice Choose the best answer. 1. Suppose the probability that a softball player gets a hit in any single at- bat is.300. Assuming
AP Statistics Cumulative Practice Test 3 (Ch 1 Ch 13) Section I: Multiple Choice Choose the best answer. 1. Suppose the probability that a softball player gets a hit in any single at- bat is.300. Assuming
1. Contingency Table (Cross Tabulation Table)
") II. Descriptive Statistics C. Bivariate Data In this section Contingency Table (Cross Tabulation Table) Box and Whisker Plot Line Graph Scatter Plot 1. Contingency Table (Cross Tabulation Table) Bivariate
II. Descriptive Statistics C. Bivariate Data In this section Contingency Table (Cross Tabulation Table) Box and Whisker Plot Line Graph Scatter Plot 1. Contingency Table (Cross Tabulation Table) Bivariate
A is used to answer questions about the quantity of what is being measured. A quantitative variable is comprised of numeric values.
 Stats: Modeling the World Chapter 2 Chapter 2: Data What are data? In order to determine the context of data, consider the W s Who What (and in what units) When Where Why How There are two major ways to
Introduction to Labour Economics. Professor H.J. Schuetze Economics 370. What is Labour Economics?
 Introduction to Labour Economics Professor H.J. Schuetze Economics 370 What is Labour Economics? Let s begin by looking at what economics is in general Study of interactions between decision makers, which
Contact: Version: 2.0 Date: March 2018
 Survey Sampling Contact: andrew.ballingall@fife.gov.uk Version: 2.0 Date: March 2018 Sampling allows you to draw conclusions about a particular population by examining a part of it. When carrying out a
Thinking About Chance & Probability Models
 Thinking About Chance & Probability Models Chapters 17 and 18 November 14, 2012 Chance Processes Randomness and Probability Probability Models Probability Rules Using Probability Models for Inference How
The following pages contain some summary statistics and graphics about the dataset.
 Thirty magazines were divided by educational level of their readers into three groups. Three magazines were randomly selected from each of the three groups. Six advertisements were randomly selected from
Yes, there is going to be some math (but not much) STATISTICAL APPROACH TO MEDICAL DEVICE VERIFICATION AND VALIDATION
 STATISTICAL APPROACH TO MEDICAL DEVICE VERIFICATION AND VALIDATION") Yes, there is going to be some math (but not much) STATISTICAL APPROACH TO MEDICAL DEVICE VERIFICATION AND VALIDATION Medical Device Verification and Validation In the medical device world, verification
Yes, there is going to be some math (but not much) STATISTICAL APPROACH TO MEDICAL DEVICE VERIFICATION AND VALIDATION Medical Device Verification and Validation In the medical device world, verification
Chapter 3. Displaying and Summarizing Quantitative Data. 1 of 66 05/21/ :00 AM
 Chapter 3 Displaying and Summarizing Quantitative Data D. Raffle 5/19/2015 1 of 66 05/21/2015 11:00 AM Intro In this chapter, we will discuss summarizing the distribution of numeric or quantitative variables.
If you are using a survey: who will participate in your survey? Why did you decide on that? Explain
 Journal 11/13/18 If you are using a survey: who will participate in your survey? Why did you decide on that? Explain If you are not using a survey: Where will you look for information? Why did you decide
Conducting Meaningful On-Farm Research and Demonstrations
 Conducting Meaningful On-Farm Research and Demonstrations Joe Lauer, Corn Agronomist University of Wisconsin-Madison Presented at the Wisconsin Crop Management Conference Madison, WI January 14, 2009 1
INVENTORY CURRENT VALUE
 INVENTORY CURRENT VALUE It should be easy to calculate the Inventory Current Value. You take how many units you have left in stock and multiply them by how much they cost, and that s how much your inventory
Chapter 12 Module 3. AMIS 310 Foundations of Accounting
 Chapter 12, Module 3 AMIS 310: Foundations of Accounting Slide 1 CHAPTER 1 MODULE 1 AMIS 310 Foundations of Accounting Professor Marc Smith Hi everyone, welcome back. Let s continue our discussion on cost
1-Sample t Confidence Intervals for Means
 1-Sample t Confidence Intervals for Means Requirements for complete responses to free response questions that require 1-sample t confidence intervals for means: 1. Identify the population parameter of
+? Mean +? No change -? Mean -? No Change. *? Mean *? Std *? Transformations & Data Cleaning. Transformations
 Transformations Transformations & Data Cleaning Linear & non-linear transformations 2-kinds of Z-scores Identifying Outliers & Influential Cases Univariate Outlier Analyses -- trimming vs. Winsorizing
LECTURE 10: CONFIDENCE INTERVALS II
 David Youngberg BSAD 210 Montgomery College LECTURE 10: CONFIDENCE INTERVALS II I. Calculating the Margin of Error with Unknown σ a. We often don t know σ. This requires us to rely on the sample s standard
Section 7.3b Sample Means The Central Limit Theorem
 We have seen in the previous investigation that even though the distribution of the population of the ages of the 1000 pennies was skewed to the right, the distribution of the sample means appeared to
Applying the central limit theorem
 Patrick Breheny March 11 Patrick Breheny Introduction to Biostatistics (171:161) 1/21 Introduction It is relatively easy to think about the distribution of data heights or weights or blood pressures: we
Semester 2, 2015/2016
 ECN 3202 APPLIED ECONOMETRICS 3. MULTIPLE REGRESSION B Mr. Sydney Armstrong Lecturer 1 The University of Guyana 1 Semester 2, 2015/2016 MODEL SPECIFICATION What happens if we omit a relevant variable?
Exercise Confidence Intervals
 Exercise Confidence Intervals (Fall 2015) Sources (adapted with permission)- T. P. Cronan, Jeff Mullins, Ron Freeze, and David E. Douglas Course and Classroom Notes Enterprise Systems, Sam M. Walton College
Equipment and preparation required for one group (2-4 students) to complete the workshop
 to complete the workshop") Your career today is a Pharmaceutical Statistician Leaders notes Do not give to the students Red text in italics denotes comments for leaders and example answers Equipment and preparation required for
Your career today is a Pharmaceutical Statistician Leaders notes Do not give to the students Red text in italics denotes comments for leaders and example answers Equipment and preparation required for
EconS Asymmetric Information
 cons 425 - Asymmetric Information ric Dunaway Washington State University eric.dunaway@wsu.edu Industrial Organization ric Dunaway (WSU) cons 425 Industrial Organization 1 / 45 Introduction Today, we are
Math 1 Variable Manipulation Part 8 Working with Data
 Name: Math 1 Variable Manipulation Part 8 Working with Data Date: 1 INTERPRETING DATA USING NUMBER LINE PLOTS Data can be represented in various visual forms including dot plots, histograms, and box plots.
Math 1 Variable Manipulation Part 8 Working with Data
 Math 1 Variable Manipulation Part 8 Working with Data 1 INTERPRETING DATA USING NUMBER LINE PLOTS Data can be represented in various visual forms including dot plots, histograms, and box plots. Suppose
JMP TIP SHEET FOR BUSINESS STATISTICS CENGAGE LEARNING
 JMP TIP SHEET FOR BUSINESS STATISTICS CENGAGE LEARNING INTRODUCTION JMP software provides introductory statistics in a package designed to let students visually explore data in an interactive way with
Forecasting Introduction Version 1.7
 Forecasting Introduction Version 1.7 Dr. Ron Tibben-Lembke Sept. 3, 2006 This introduction will cover basic forecasting methods, how to set the parameters of those methods, and how to measure forecast
HIMSS ME-PI Community. Quick Tour. Sigma Score Calculation Worksheet INSTRUCTIONS
 HIMSS ME-PI Community Sigma Score Calculation Worksheet INSTRUCTIONS Quick Tour Let s start with a quick tour of the Excel spreadsheet. There are six worksheets in the spreadsheet. Sigma Score (Snapshot)
Midterm Review Summer 2009 Chapters 1 7 Stat 111
 Midterm Review Summer 2009 Chapters 1 7 Stat 111 Name FORM A Directions: Read each question carefully and answer as clearly as possible. 1. A book store wants to estimate the proportion of its customers
Descriptive Statistics Tutorial
 Descriptive Statistics Tutorial Measures of central tendency Mean, Median, and Mode Statistics is an important aspect of most fields of science and toxicology is certainly no exception. The rationale behind
MATHEMATICAL MODELLING
 334 MATHEMATICS MATHEMATICAL MODELLING A2 A2.1 Introduction An adult human body contains approximately 1,50,000 km of arteries and veins that carry blood. The human heart pumps 5 to 6 litres of blood in
Glossary of Standardized Testing Terms https://www.ets.org/understanding_testing/glossary/
 Glossary of Standardized Testing Terms https://www.ets.org/understanding_testing/glossary/ a parameter In item response theory (IRT), the a parameter is a number that indicates the discrimination of a
AP Statistics - Chapter 6,7 Quiz
 Name: Class: _ Date: _ AP Statistics - Chapter 6,7 Quiz Short Answer Scenario 6-1 The probability distribution below is for the random variable X = number of mice caught in traps during a single night
Population parameters, unlike RVs, are fixed, usually unknown, characteristics of the population.
 8. Sampling Distribution of the Mean Recall our goal of making inference about a population of interest (see diagram at beginning of chapters 6 and 7 notes). Given that we can safely assume (model) our
AGAINST ALL ODDS EPISODE 28 INFERENCE FOR PROPORTIONS TRANSCRIPT
 AGAINST ALL ODDS EPISODE 28 INFERENCE FOR PROPORTIONS TRANSCRIPT 1 FUNDER CREDITS Funding for this program is provided by Annenberg Learner. 2 INTRO Hello, I m and this is Against All Odds, where we make
Chapter 1 Introduction: The Role of Statistics in Engineering
 1 Chapter 1 Introduction: The Role of Statistics in Engineering Example: The manufacturer of a medical laser used in ophthalmic surgery wants to be able to quote quality characteristics of the laser to
WHY LOCALIZATION MATTERS:
 WHY LOCALIZATION MATTERS: A Look at the Statistics Behind App Store Features A PUBLICATION OF 1 WHAT S INSIDE? INTRODUCTION: Why we re doing this QUESTION 1: What is the impact of localization in getting
Statistics 201 Summary of Tools and Techniques
 Statistics 201 Summary of Tools and Techniques This document summarizes the many tools and techniques that you will be exposed to in STAT 201. The details of how to do these procedures is intentionally
Week 1 Tuesday Hr 2 (Review 1) - Samples and Populations - Descriptive and Inferential Statistics - Normal and T distributions
 - Samples and Populations - Descriptive and Inferential Statistics - Normal and T distributions") Week 1 Tuesday Hr 2 (Review 1) - Samples and Populations - Descriptive and Inferential Statistics - Normal and T distributions One of the primary goals of statistics is to make statistical inferences on
Week 1 Tuesday Hr 2 (Review 1) - Samples and Populations - Descriptive and Inferential Statistics - Normal and T distributions One of the primary goals of statistics is to make statistical inferences on
Problem Set "Normal Distribution - Chapter Review (Practice Test)" id:[14354]
![Problem Set Normal Distribution - Chapter Review (Practice Test) id:[14354]](/thumbs/78/76793030.jpg "Problem Set Normal Distribution - Chapter Review (Practice Test) id:[14354]") Problem Set "Normal Distribution - Chapter Review (Practice Test)" id:[14354] 1) Assistment #114000 "114000 - Normal Distribution - Chapter Review" A) One of the side effects of flooding a lake in northern
Problem Set "Normal Distribution - Chapter Review (Practice Test)" id:[14354] 1) Assistment #114000 "114000 - Normal Distribution - Chapter Review" A) One of the side effects of flooding a lake in northern
Introduction Activity
 Introduction Activity Westvaco Discrimination Case Welcome to AP Statistics! Before we begin our formal study, we will spend a couple days exploring the thinking and concepts we will encounter throughout