2014 Annual Report to the Oregon Public Utility Commission & Energy Trust Board of Directors
|
|
|
- Daniella Hardy
- 5 years ago
- Views:
Transcription
1 2014 Annual Report to the Oregon Public Utility Commission & Energy Trust Board of Directors ENERGY TRUST OF OREGON APRIL 15, 2015 UPDATED OCTOBER 15, 2015 Energy Trust of Oregon 421 SW Oak St., Suite 300, Portland, OR fax energytrust.org
2 TABLE OF CONTENTS FROM THE EXECUTIVE DIRECTOR: 2014 IN REVIEW 3 I 2014 RESULTS AT A GLANCE 5 II EXECUTIVE SUMMARY OF RESULTS AND ACTIVITY 7 III BACKGROUND, MISSION AND GOALS 11 IV PROGRAM AND OPERATIONS ACTIVITY AND DETAIL 13 V 2014 PROGRESS TO OPUC PERFORMANCE MEASURES 26 VI REVENUE AND EXPENDITURES TABLES 28 VII SAVINGS AND GENERATION TABLES 29 APPENDIX 1: GEOGRAPHIC DISTRIBUTION OF SITES SERVED 34 APPENDIX 2: 2014 CUSTOMER SERVICE AND SATISFACTION RESULTS 35 APPENDIX 3: BENEFITS TO UTILITY CUSTOMERS 37 FROM STAFFING ADJUSTMENTS APPENDIX 4: RENEWABLE RESOURCE DEVELOPMENT TARGETS 40 APPENDIX 5: NW NATURAL INDUSTRIAL DEMAND-SIDE 46 MANAGEMENT ACTIVITIES APPENDIX 6: ENERGY TRUST PROGRAM DESCRIPTIONS 47 APPENDIX 7: 2014 ENERGY TRUST BOARD OF DIRECTORS; 49 BOARD DEVELOPMENT GUIDELINES; 2014 ADVISORY COUNCIL MEMBERS AND MEETINGS APPENDIX 8: ENERGY TRUST 2014 ANNUAL REPORT 56 ON ACTIVITIES FOR NW NATURAL IN WASHINGTON APPENDIX 9: QUARTER FOUR RESULTS TABLES 66 APPENDIX 10: 2014 ELECTRIC EFFICIENCY RESULTS FOR SB 1149 AND SB 838 FUNDS 75 Energy Trust 2014 audited financial statement Attachment 2014 Annual Report to OPUC & Board of Directors Page 2 of 75 April 15, 2015
3 FROM THE EXECUTIVE DIRECTOR: 2014 IN REVIEW I am pleased to submit this report to the Oregon Public Utility Commission and Energy Trust Board of Directors about Energy Trust s strong 2014 accomplishments and detailing how clean energy results benefit Oregon utility customers was one of our highest-savings years on record, despite dynamic market conditions, continued low natural gas prices and shifting state and federal tax credits. While continuing to keep administrative costs low, we provided tailored program offerings to achieve savings and generate energy from a mix of renewable resources. We increased targeted outreach efforts to reach and serve a broader set of customers, and focused on bringing new strategies and technologies to market to achieve long-lasting savings. In every region of the state, more residential, commercial and industrial customers participated in our programs than ever before, from the net-zero Klamath Falls campus at Oregon Tech to the finely tuned school heating systems in Morrow County. Whether customers chose simpler solutions like an Energy Saver Kit, made capital upgrades or invested in customized renewable resources, we were there to help them step forward on the path to cheaper, cleaner energy. Once again, we created, tested and refined our strategies to anticipate and meet customer needs, expanding our diverse and comprehensive solutions. This broad portfolio of offerings provided the necessary flexibility to achieve savings even during challenging market conditions, enabling us to exceed annual electric efficiency savings goals, nearly meet our natural gas savings goal and exceed the minimum savings required for each utility in Just a few examples of the many effective services and offerings featured in the report include: Residential customers installed nearly 4 million efficient light bulbs, almost one-third of which were LEDs. Packaged savings opportunities for small- and medium-sized commercial and industrial customers made decision-making and investments easier and faster. New behavioral strategies led to low-cost electric and natural gas savings for commercial and industrial participants in Strategic Energy Management, supporting common-sense approaches and best practices that require no capital investment. New tools and approaches served robust residential and rebounding commercial solar markets, including an online solar assessment tool that provides customers with customized costs and generation estimates and generates leads for solar trade allies. Energy-saving opportunities acquired from a thriving new commercial construction market even though historically low costs of natural gas made retrofits less appealing for some customers. These and other investments align with opportunities defined in our newly adopted Strategic Plan. Having exceeded efficiency goals in our Strategic Plan, we expect the market to be different in the next five years. After several years of rapid savings growth, we are focused on the best ways to capture the next generation of savings and generation. We know that will result from a combination of strategies, including: 2014 Annual Report to OPUC & Board of Directors Page 3 of 75 April 15, 2015
4 A focus on acquiring more and deeper energy savings per project Faster introduction and testing of new technologies Expansion of market transformation activities to include natural gas Attracting and serving new, small, remote and more diverse customers Leveraging partnerships and pursuing projects that yield additional benefits such as water savings With insights from a Management Review conducted by an independent third party, we are committed to pursuing new tools and tactics that emphasize and optimize internal operations and result in even more efficiency gains. We are ready for the challenges ahead and appreciate new opportunities to deliver clean, low-cost energy for the many thousands of customers we serve. I m confident that by working with Portland General Electric, Pacific Power, NW Natural, Cascade Natural Gas, the Northwest Energy Efficiency Alliance, the Oregon Department of Energy and our nearly 2,700 contractors and allied professionals around the state, we will continue to provide great benefits to Oregonians. Sincerely, Margie Harris Executive Director 2014 Annual Report to OPUC & Board of Directors Page 4 of 75 April 15, 2015


5 I 2014 RESULTS AT A GLANCE Savings Percent of savings by sector 2014 Annual Report to OPUC & Board of Directors Page 5 of 75 April 15, 2014

")


6 Total generation 1 Expenditures Progress toward 2014 Strategic Plan Goals 2 ( ) 1 The renewable energy sector reached 53 percent of its generation goal due to the delay of six large projects and the cancellation of one project. Four of the six delayed projects are on track to complete in Totals include 22 amw of savings from self-direct customers Annual Report to OPUC & Board of Directors Page 6 of 75 April 15, 2014
7 II EXECUTIVE SUMMARY OF RESULTS AND ACTIVITY A. Annual results 3,4 In 2014, Energy Trust achieved one of its highest-savings years on record with electric and gas savings goals slightly higher than 2013 goals. o Electric efficiency projects completed in 2014 saved 58.0 amw of electricity, more than 1 percent over the 2014 goal, at a levelized cost 5 of 2.6 cents per kwh. This is equivalent to powering 44,977 Oregon homes for a year. Energy Trust delivered nearly 2 percent more electric savings in 2014 than in 2013, at roughly the same levelized cost (2.4 cents in 2013). o Gas efficiency projects completed in 2014 saved nearly 5.7 million annual therms of natural gas 6, 2 percent below the 2014 goal, at a levelized cost of 33 cents per therm. This is equivalent to heating 11,162 Oregon homes for a year. Gas savings for 2014 are nearly 7 percent greater than 2013 gas savings, and were delivered at roughly the same levelized cost. o Energy Trust exceeded or approached three of four utility-specific Integrated Resource Plan targets. Energy Trust reached 89 percent of IRP target for Cascade Natural Gas, where a relatively small annual budget and associated savings was significantly impacted when a few large commercial and industrial projects were canceled or delayed to subsequent years. Renewable energy projects achieved 2.4 amw in new generation in 2014, at a levelized cost of 5.3 cents per kwh, including 0.72 amw in PGE territory and 1.67 amw in Pacific Power territory. This is equivalent to powering 1,850 Oregon homes for a year. Overall generation was 47 percent below the annual goal, impacted by the cancellation of one project and the delay of six large projects four of which are on track to complete in o Solar electric projects generated 1.1 amw, 157 percent of the OPUC performance Benchmark for standard solar generation. Energy Trust met every OPUC performance measure in 2014, including: o Maintained low administrative and program support costs at 4.6 percent of revenue compared to 4 percent of total revenue in 2013 well below the OPUC performance measure of 9 percent. o Obtained an unmodified financial audit opinion. o Received the highest ever customer satisfaction ratings of 96 percent overall and 98 percent for interaction with program representatives. 3 This document reports net savings, which are adjusted gross savings based on results of current and past evaluations. 4 This report includes the best available energy savings data as of the date of submission. Energy savings reported here for periods prior to January 1, 2014, may be different than previously reported as a result of applying updated evaluation factors to Energy Trust funded program savings and generation in Oregon through the annual true up process. The full True Up 2014 Report is available online at 5 Levelized cost is Energy Trust s total cost to save or generate each unit of energy over the life of the measure (which ranges from two to 20 years or more). 6 The gas savings do not include results for NW Natural in Washington. These results are reported in Appendix Annual Report to OPUC & Board of Directors Page 7 of 75 April 15, 2014
8 B. Market and program trends A diverse portfolio of programs and savings strategies is a strength that helps the organization adjust to variable market conditions and make progress to overall goals. Achievements in 2014 were largely led by New Homes and Products, New Buildings, Multifamily lighting upgrades and commercial and industrial Strategic Energy Management activities. These successes balanced other programs impacted by low natural gas costs that made it more challenging to attract and complete energy-efficiency projects, and a less favorable market for some renewable energy projects. Lighting, especially LEDs, contributed significant savings in As the technology improved, market awareness grew and prices declined, demand for LEDs increased from residential, commercial and industrial customers. Residential customers installed nearly 4 million efficient light bulbs, almost one-third of which were LEDs. Lighting upgrades also contributed more than 30 percent of savings from all businesses. For the first time, Energy Trust began installing LEDs instead of CFLs in multifamily dwelling units and distributing LEDs to sixth grade students statewide through LivingWise Kits. The volume of business projects increased dramatically while fewer average energy savings resulted per project. More and smaller businesses completed energy-efficiency projects, with roughly 20 percent more commercial projects and 10 percent more industrial projects completed in 2014 than compared to As economic recovery reached much of Oregon, new construction increased for businesses, homes and multifamily housing across the state. The New Buildings program enrolled more projects than ever before, continuing its multi-year trend of breaking enrollment records. One-half of all New Buildings enrollments were for projects outside of the Portland Metro area, with several new multifamily projects in the Willamette Valley, Central Oregon and Eastern Oregon. New homes rated with EPS TM, an energy performance score, reached 34 percent of market share in Energy Trust territory, compared to 21 percent of market share in Demand for residential and commercial solar incentives was higher than ever in 2014, with reservations made for 1,623 projects representing 2.19 amw of new generation. Homeowners installed larger solar systems as residential system prices declined. Participation grew in all areas of the state compared to 2013, with 42 percent more sites served in Eastern Oregon and 25 percent more sites served in Southern Oregon. Activity was spurred by targeted investments and enhanced outreach to customers, stakeholders and trade allies. As planned, the number of community and cultural events and trainings increased, and that visibility attracted more small and rural customers. Learn more about Energy Trust s extensive outreach efforts on p.23 and about the geographic distribution of sites served on p.34. Additional detailed market activity information is provided in the program and operations activity and detail section of this report beginning on p.13. C. Notable achievements The board of directors approved Energy Trust s Strategic Plan, following extensive outreach and promotion of the document in a variety of public forums. Staff presented the draft plan to advisory councils and affiliated utilities, and promoted the plan to utility customers, community and business leaders and the general public during 13 presentations 2014 Annual Report to OPUC & Board of Directors Page 8 of 75 April 15, 2015
9 throughout the state. Pacific Power was instrumental in co-hosting strategic plan outreach events that also doubled as forums for business customers, resulting in leads for programs. Energy Trust completed an independent Management Review report submitted to the OPUC, applauding Energy Trust s performance and practices when compared to similar organizations and identifying specific follow-up actions in response to report recommendations. Conducted every five years, Management Reviews provide third-party evaluation and insights about the effectiveness of Energy Trust operations and are required by the grant agreement with the OPUC. A report on cost-effectiveness exceptions for gas programs and measures was submitted to the OPUC in response to Docket UM 1622, Order After the commission decision on the docket instructed Energy Trust to remove or modify some measures, staff developed an implementation plan to discontinue some measures in spring 2015 that did not receive costeffectiveness exceptions. The nation s first regional natural gas market transformation initiative was launched in collaboration with Northwest Energy Efficiency Alliance, NW Natural, Cascade Natural Gas and other regional entities. Beginning in 2015, natural gas market transformation activities will leverage NEEA's success in electric market transformation to advance market adoption of energy-efficient natural gas products, such as residential gas heat pump water heaters, combined space and water heating equipment, hearths and dryers. In 2014, Energy Trust was recognized as one of the 100 Best Nonprofits to Work for in Oregon by Oregon Business Magazine, ranking third on the list of large organizations. In addition, Energy Trust received a 2014 State Leadership in Clean Energy Award from the Clean Energy States Alliance for its work with the City of Gresham Wastewater Treatment Plant. Energy Trust completed transitions to a new Products Program Management Contractor in the New Homes and Products program, and to two new Program Delivery Contractors for the commercial Strategic Energy Management offering. These new contractors were selected through competitive processes that ensure delivery of effective services and value for customers. The organization pursued strategies to further strengthen and quantify benefits of operational systems, including projects to expedite processing times, streamline work and keep administrative and support costs low. A few examples include developing online application forms, transitioning to paperless project files, using tablet devices in the field and other software changes to improve the efficiency and accuracy of tracking project and site details. See more examples in Appendix 3. D. Revenue and expenditure results Overall revenue totaled $162.3 million for 2014, approximately on target with what was budgeted expenditures totaled $153.0 million, of which $84.6 million or 55 percent was for incentives, compared to 52 percent last year renewable energy expenditures were 20 percent below budget due to project completions shifting into later years. Efficiency expenditures were also below budget in 2014, by 10 percent for electric expenditures and 21 percent for gas expenditures. Efficiency underspending reflected a high proportion of savings acquired at very low costs, especially from large commercial and industrial customers Annual Report to OPUC & Board of Directors Page 9 of 75 April 15, 2015
10 Energy Trust implemented improvements to the 2015 budget development process following consistent monitoring of forecasted and completed efficiency and renewable energy projects and corresponding expenditures. New forecasting methods were implemented across the organization, including more tools for budget managers to use when estimating costs. In addition, by shifting budget coordination meetings with utilities from July to October, more time was allowed to refine year-end expenditure forecasts and prepare accurate cost estimates for the upcoming year. It is planned and anticipated that existing reserve levels will be drawn down in future years. Energy Trust initiated an opportunity to reduce revenue collections as a result of achieving a higher volume of lower-cost savings than budgeted over the past few years and implementing a new approach to annual budgeting. During the fall budget season, agreement was reached with three of four utilities and approved by the OPUC to collect less revenue next year and to reduce reserve accounts over the next three years. E. Total impact and benefits over time Energy Trust well exceeded Strategic Plan goals for electric and gas savings, and approached goal for renewable energy generation. o Since 2002, annual savings total 492 amw of electricity 7 and 39.1 million therms of natural gas, equal to 103 percent of Strategic Plan electric goal and 113 percent of the Strategic Plan gas goal. o Since 2002, annual generation equals 115 amw of renewable energy, approximately 93 percent of the Strategic Plan goal of 124 amw. Total annual electric savings and generation since 2002 represent energy savings equivalent to building an energy-efficiency power plant or enough clean energy to power more than 470,705 Oregon homes. Total annual gas savings since 2003 represent enough fuel to heat more than 77,194 Oregon homes with natural gas for a year. The net economic benefits of Energy Trust expenditures, energy savings and renewable energy generation added $3.9 billion to the local economy, including $1.2 billion in wages, $223 million in small business income and employment equivalent to 3,200 full-time jobs lasting a decade. 8 Since 2003, Energy Trust has invested more than $9.5 million in energy-efficiency projects at nearly 1,100 public and private K-12 Oregon schools. The organization also provided more than $2.1 million in funding for solar electric and wind energy systems at nearly 50 schools. Air quality improvements stemming from Energy Trust investments have kept more than 14.6 million tons of carbon dioxide out of the atmosphere, the equivalent of removing more than 2.5 million cars from Oregon roads for one year. 7 Savings from self-directed efficiency projects count toward the goal of achieving 479 amw of electric savings by To date, 22 amw of savings have been achieved by large commercial and industrial customers via self-directed funding. Electric savings also include transmission and distribution savings. 8 The net economic benefit of Energy Trust expenditures, savings and generation is calculated from an independent analysis by Pinnacle Economics completed in Annual Report to OPUC & Board of Directors Page 10 of 75 April 15, 2015
11 III BACKGROUND, MISSION AND GOALS A. Background Since March 2002, Energy Trust has been entrusted to invest public purpose funds from utility customers and deliver benefits from energy-efficiency improvements and renewable energy generation. Our mission is to help customers and utilities meet their energy needs with the cheapest and cleanest energy available. We serve customers in coordination with utilities, community and industry organizations, government agencies and two other electric public purpose fund administrators Oregon Housing and Community Services and the Oregon Department of Energy. This critical work benefits our state by building a more sustainable and brighter energy future, and contributing to our local and state economy in positive ways. Energy Trust is an independent 501(c)(3) nonprofit organization funded by and serving Oregon customers of Portland General Electric, Pacific Power, NW Natural and Cascade Natural Gas, and NW Natural customers in Washington. We offer energy efficiency and renewable energy programs and services to every type of customer, including those who own, rent or lease their home or building, product manufacturers, small and large businesses and industries, nonprofit and public organizations, farmers and ranchers. New offers and effective collaboration enable us to provide clean energy solutions for a growing number of consumers, businesses, communities and schools. Our programs provide information, technical expertise and financial assistance to motivate people to modify their energy usage habits, choose high-efficiency products, invest in energy-efficient construction and install renewable energy projects. Through these actions, participating customers derive a range of benefits lower energy bills, greater comfort, better indoor air quality, improved productivity and lower carbon emissions. As a steward of utility customer dollars, we consistently maintain low administrative and program support costs, and ensure the majority of public purpose funds flow back to customers as incentives, services and education. Our residential and commercial energy-efficiency programs are competitively bid and managed by contractors, assuring the best prices for the services provided. The Production Efficiency program for industrial and agricultural customers and all renewable energy programs are internally managed by our staff. For most programs, Energy Trust leverages specialized local businesses many of whom employ 20 or fewer staff already serving customers in the marketplace. We support and leverage this network of trade ally contractors, allied professionals and participating retailers throughout the state who are familiar with Energy Trust incentives and connect customers directly to them. This approach keeps Energy Trust costs low, supports our region s energy services sector and sustains opportunities in the areas we serve. Our work is shaped by advice from two advisory councils comprised of stakeholders and led by an independent, diverse board of directors whose members volunteer their time and expertise. We strive to be inclusive and transparent by holding open meetings and publishing meeting agendas, notes, independent third-party evaluations of programs, draft and final budgets and action plans, reports and audited financial statements on our website. We comply with legal requirements and minimum performance measures set forth in our contract with the Oregon Public Utility Commission. In addition, annual goals for electric and natural gas energy savings and renewable energy generation are developed in consultation with PGE, Pacific Power, NW Natural and Cascade Natural Gas and built from each utility s Integrated Resource Plan. This collaboration 2014 Annual Report to OPUC & Board of Directors Page 11 of 75 April 15, 2015
12 enables Energy Trust to focus on and be accountable for delivering the lowest-cost energy available to meet the needs of every utility customer. B. Purpose statement Energy Trust provides comprehensive, sustainable energy efficiency, conservation and renewable energy solutions to those we serve. C. Vision statement Energy Trust envisions a high quality of life, a vibrant economy and a healthy environment and climate for generations to come, built with renewable energy, efficient energy use and conservation. D Strategic Plan goals 1. Save 479 average megawatts of electricity 2. Save 34.7 million annual therms of natural gas 3. Produce 124 average megawatts of electricity from new renewable generation E. Five-year activities Accelerate energy-efficiency investments 2. Support a variety of renewable energy technologies 3. Encourage innovative technologies 4. Support industry and business infrastructure to deliver energy efficiency and renewable energy 5. Provide excellent customer service 6. Consider overall balance and equity among programs and initiatives 7. Communicate the value of energy savings and renewable resource generation 8. Maintain an efficient, effective and transparent organization F. Planning for the future In 2014, Energy Trust worked with utilities, OPUC, customers, other stakeholders, the board and staff to identify new goals and strategies for the next five years. Additional information and a copy of our Strategic Plan are available at Cumulative results for the plan period are provided on pp. 6 and 10 of this report Annual Report to OPUC & Board of Directors Page 12 of 75 April 15, 2015
13 IV PROGRAM AND OPERATIONS ACTIVITY AND DETAIL 2014 residential activity New homes and major remodels 2,287 New homes constructed 2,179 New manufactured homes 108 Weatherization retrofits 6,746 Single-family site-built 5,424 Existing manufactured homes 1,322 Home Energy Reviews 1 1,680 Total Sites 10,713 Heating systems 4,372 Water heaters 735 Solar 35 High-efficiency products 16,940 Washing machines 14,022 Refrigerators & freezers 2,918 High-efficiency lighting 2 3,565,257 Refrigerators, freezers recycled 12,471 Energy Saver Kits sent 35,057 Total Other Activity 69,575 1 Includes in-home reviews only; Home Energy Reviews are also available online and by phone 2 Lighting excluded from totals 2014 commercial activity New Buildings sites served Whole building approaches 46 Packaged solutions for market segments 78 Standard/system-based approaches 342 Existing Buildings sites served 1 2, industrial/agricultural activity Projects 1,124 Streamlined industrial Lighting 297 Custom Strategic Energy Management 3 38 SEM projects in progress 38 Incentive offers made The streamlined track delivers savings from irrigation measures, small compressed air, variable frequency drives and other prescriptive and calculated measures 2 Such as compressed air system and process upgrades 3 Savings from no-cost or low-cost operational improvements 4 Incentive offers made to and accepted by customers, with two years to install upgrades and receive incentives 2014 renewable energy activity Solar electric installations 1,292 Residential 1,238 Commercial 54 Other Renewable projects 3 Biopower projects 0 Wind projects 1 Hydropower projects 1 Geothermal projects 1 Total 1,295 Other Renewable projects in process trade ally activity Regional trade ally roundtable meetings Attendance Building Operator Certification 12 Trainings provided 105 Allies added to network 284 Custom Trade allies 231 Real estate allies 33 Lighting 1,592 Design allies 20 Prescriptive/standard Trade allies accessing business development funds 370 SEM projects 33 Completed operations activity In progress 30 Projects completed in IT systems 98,642 Existing multifamily sites served 2,260 Calls received 26,607 Website visits 904,733 Solar water heating sites served 5 info@energytrust.org inquiries 1,747 Sites receiving technical assistance New Buildings and Existing Buildings total sites served may Complaints 23 include sites that participated in more than one program track 2 The most common custom improvements are building News stories in print, broadcast 355 controls and HVAC New efficiency measures The most common prescriptive/standard improvements are foodservice and grocery equipment Market evaluations and studies Annual Report to OPUC & Board of Directors Page 13 of 75 April 15,
14 A. Commercial sector highlights The commercial sector, comprising Existing Buildings, New Buildings and Multifamily, exceeded goals in Pacific Power and NW Natural territories, and fell short of goals in PGE and Cascade Natural Gas territories. The shortfalls were largely due to difficulty in closing Existing Buildings projects and limited savings achieved through commercial Strategic Energy Management. Approximately 5,571 commercial sites were served during 2014, representing a wide variety of business types and widely dispersed locations throughout Energy Trust territory. The first office building installed energy upgrades through a Pay for Performance pilot, located in downtown Portland, and contracts for a second office building selected through a request for proposals will be negotiated in The pilot effort will determine if paying incentives for capital and operations and maintenance improvements over a multiyear period will help contractors achieve additional energy savings from more comprehensive projects. The sector completed 21 deep retrofit projects 9 out of 143 projects identified as renovations. The 21 projects completed upgrades to at least two major building systems. Savings from NEEA activities comprised approximately 5 percent and 7 percent of the sector s results for PGE and Pacific Power territories. Commercial sector market transformation savings were driven primarily by improvements to commercial building code, efficient computer equipment and Building Operator Certifications. Existing Buildings Lighting provided the biggest share of electric savings in 2014, followed by custom, prescriptive and SEM projects. Gas savings were roughly split between custom, prescriptive and SEM projects. Natural gas savings were realized from foodservice equipment, prescriptive projects, commercial SEM and Building Operator Certifications, though a lack of large custom projects impacted gas savings. Of the program s record high lighting savings, 68 percent came from LEDs, including indoor fixtures, street lighting, exterior fixtures and lamps. Lighting projects were supported by increased lighting incentives and expanded incentives paid directly to distributors that reduce upfront costs for small customers. The program launched a pilot project to help small commercial customers install efficient lighting, covering 80 percent of lighting installation costs and providing zero-interest financing and a 5 percent discount for customers who pay up front. Bonuses for prescriptive upgrades, such as HVAC equipment, helped the program achieve electric and natural gas savings at year-end, both from small and large customers. In 2014, 33 companies participated in the commercial SEM offering, saving 64 percent more electricity and 22 percent more gas savings than in Existing Buildings also launched an 9 Based on a working definition of commercial deep retrofits developed for the purpose of OPUC reporting, deep retrofit projects typically achieve approximate savings of 40 percent beyond market average by following a number of pathways. A project must be a major renovation of an existing commercial building and receive incentives for one of the following: Market solutions package, Leadership in Energy and Environmental Design achieving a 25 percent reduction for Energy and Atmosphere credit 1 points, Path to Net Zero or upgrades to at least two major building systems (such as HVAC, lighting or shell measures). The building can be large or small and the project can be simple or complex, applying multiple system-level upgrades or more holistic, customized energy-efficiency strategies Annual Report to OPUC & Board of Directors Page 14 of 75 April 15, 2015
15 SEM Continuation opportunity a one- or two-year offering to enable customers to continue and expand SEM efforts after completing the first year of SEM engagement resulting in 100 percent enrollment of 2013 participants. In Q4, Existing Buildings selected two firms to deliver the SEM offering through a competitive bid process. The program completed more small- to medium-sized projects in 2014 than in 2013, building on the success of having served many large Existing Buildings customers in the past 10 years. To reach more small- and medium-sized businesses in 2014, the program expanded outreach and walk-through surveys. A new Small School District Outreach initiative helped small and rural school districts leverage the Oregon Department of Energy schools program. Multifamily The Multifamily initiative installed energy-saving products in 28,310 dwelling units a nearly 60 percent increase over 2013 including apartments, campus living facilities, assisted living facilities and affordable housing. Direct installation of these light bulbs, showerheads and faucet aerators comprised the majority of multifamily electric and gas savings in Commonarea lighting projects contributed additional electric savings, and prescriptive projects also provided gas and electric savings. In Q4, Multifamily began installing LEDs instead of CFLs, providing more savings per bulb, appealing to customers and increasing the number of bulbs installed per unit. Year-end bonuses supported equipment savings for packaged terminal heat pumps, ductless heat pumps, water heaters and boilers. Multifamily increased service to rural and remote customers through business development efforts and outreach to increase the Trade Ally Network in Southern and Eastern Oregon. To support customer decision-making, a new Energy Savings Action Plan report was provided to customers. The report aggregates and ranks savings opportunities by return on investment, the cost of delaying upgrades and non-energy benefits. The first eight projects completed participation in MPower Oregon, a pilot using a utility onbill repayment mechanism to help people who live in affordable housing developments benefit from energy-efficiency upgrades and resulting energy and cost savings. An additional 24 projects are anticipated to close by July New Buildings New Buildings enrolled a record 565 projects in 2014, 34 percent more than in 2013, including the 2,000th project. With a growing new construction market statewide, one-half of all new projects enrolled were outside the Portland Metro area. Installation of system-based measures accounted for nearly one-half of electric savings and more than two-thirds of gas savings. System-based upgrades apply to full systems, such as a lighting system with controls. With more savings per project on average, data centers, market solutions projects and projects using a whole-building model to estimate savings contributed the remaining savings. New Buildings enrolled the 100th market solutions project since the launch of the offering in late 2012, and closed 50 such projects in 2014 alone more than three times the number closed in Market solutions provides customers with pre-packaged incentives designed to 2014 Annual Report to OPUC & Board of Directors Page 15 of 75 April 15, 2015
16 help achieve deeper energy savings in construction of small restaurant, grocery, multifamily, office, school and retail buildings less than 70,000 square feet. In 2014, 14 large electric and four large gas projects supported the program s savings, including projects saving more than 500,000 kwh or 20,000 therms. Given long construction timelines typically spanning from two to four years for large projects, New Buildings anticipates fewer large projects in 2015 and more large projects in Completion of two data centers contributed substantial electric savings in 2014, with completion of a third data center delayed to Though difficult to predict and plan for, data centers continue to be an important source of savings for the program. Construction of new multifamily buildings delivered significant savings in 2014, and new multifamily construction is expected to grow through New Buildings launched Path to Net Zero as a full program offering, with 15 projects enrolled in Path to Net Zero offers early design assistance, technical support and cash incentives for projects that offset energy consumption with energy efficiency and renewable energy generated onsite. A four-fold increase over 2013, 12 projects completed a solar-ready assessment in 2014 following the program s solar and solar-ready outreach efforts. In coordination with the Solar program, New Buildings offers technical and financial support to architects, engineers and builders who incorporate solar into new commercial building designs. Building solar ready enables less costly future solar installations. Strong statewide customer and ally engagement continued with 160 presentations and three Allies for Efficiency trainings attended by 420 participants in Portland and at satellite training locations in remote areas of the state. The focus on engaging remote allies resulted in a 23 percent increase in the number trade allies participating outside of the Portland Metro area. B. Industry and agriculture sector highlights The industry and agriculture sector exceeded goals in electric utility territories. Electric savings were derived from targeted incentive increases and a new comprehensive outreach approach in which Program Delivery Contractors promoted offerings to all sizes of customers based on geographic territories. The sector fell short of goals in gas utility territories, attributed to the delay of several large projects and low gas savings from industrial Strategic Energy Management efforts. A year-end bonus and targeted outreach stimulated a number of projects in Cascade Natural Gas territory for Savings from NEEA activities comprised approximately 1 percent of the sector s results in both PGE and Pacific Power territories. Sales of efficient electric motors driven by federal standards were the primary source of savings. Production Efficiency The program completed a record 1,124 projects in Bolstered by a year-end bonus, custom projects made up roughly one-half of electric savings, followed by industrial SEM at nearly a quarter of electric savings. After an incentive increase in Q1, savings from lighting projects increased significantly over 2013 to comprise Annual Report to OPUC & Board of Directors Page 16 of 75 April 15, 2015
17 percent of total electric savings. Other streamlined projects, including trade-ally delivered projects at small and large industrial sites, contributed the remainder of electric savings. More than 60 percent of gas savings came from heat recovery, boiler and other custom projects, and 35 percent came from streamlined projects, primarily greenhouse upgrades. A record 36 customers completed SEM participation in 2014, half of which were small- to medium-sized customers. Production Efficiency launched the first SEM cohorts in the Willamette Valley, Central Oregon and Southern Oregon, with strong participation in each region. LEDs comprised approximately 60 percent of Production Efficiency lighting savings in 2014, compared with under 20 percent in The new Performance+ offering, formerly the Comprehensive Lighting Pilot, accounted for 18 percent of the program s lighting savings in Performance+ provides enhanced incentives for comprehensive lighting retrofits that incorporate sophisticated lighting design strategies with controls technologies. Completion of a megaproject generated more savings than expected, and Production Efficiency received Energy Trust board approval to pursue an even larger project expected to begin in A megaproject is a large energy-saving project receiving more than $500,000 in incentives. Two successful pilots completed in The second year of the CORE pilot, an SEM offering for small- to medium-sized industrial customers, resulted in participants saving 7.5 percent of annual energy use on average. In addition, Scientific Irrigation Scheduling will continue as a regular program offering, following analysis of a two-year pilot. Scientific Irrigation Scheduling supports agricultural customers and also contributes to water savings. Production Efficiency connected with customers at events statewide, including the Oregon Women for Agriculture annual meeting that resulted in three project leads, outreach events in Salem and Medford with 39 companies in attendance, six Pacific Power business customer breakfasts, a Sustainable Brewers networking event and the first-ever breakfast events for commercial and industrial customers in Ontario and Hermiston. C. Residential sector highlights The residential sector, comprised of Existing Homes and New Homes and Products programs, exceeded goal in Cascade Natural Gas territory and approached goals in PGE, Pacific Power and NW Natural territories. Lighting, new EPS homes and ducted and ductless heat pumps drove savings for the sector. More than 77,000 new and existing homes received Energy Trust services in Savings from NEEA activities comprised approximately 22 percent of the sector s savings in both PGE and Pacific Power territories. Sales of energy-efficient televisions and improvements in residential building code contributed the majority of savings, with the rest from ductless heat pump and heat pump water heater sales and a state standard for efficient battery chargers. Existing Homes Existing Homes promoted energy-saving products to help mitigate reduced demand for Home Performance upgrades. These light bulbs, showerheads and faucet aerators provided savings for many first-time Energy Trust customers especially in remote and rural regions, comprising about 70 percent of the program s electric savings and 60 percent of gas savings in 2014 Annual Report to OPUC & Board of Directors Page 17 of 75 April 15, 2015
18 2014. The program s remaining electric and gas savings came primarily from HVAC equipment and weatherization. Weatherization projects were impacted by low prices of natural gas and an OPUC decision to modify or discontinue some gas-saving measures that did not meet the cost-effectiveness requirement. To increase cost-effectiveness of air sealing and ceiling insulation measures, the program launched a pilot to determine if combining air sealing with ceiling insulation could reduce installation costs. Results are expected in Though fewer than expected, Energy Trust completed 903 residential deep retrofits 10 in 2014, including Home Performance with ENERGY STAR and Clean Energy Works projects. Clean Energy Works, representing the largest share of deep retrofit projects at 593, offers access to financing for whole-home energy-efficiency improvement projects using standard Energy Trust incentives for measures installed by Home Performance trade allies. For the first time, Existing Homes included LEDs in LivingWise Kits, promoting public awareness about this new energy-saving technology. Approximately 19,000 LivingWise kits were delivered to sixth-grade students and their families through Oregon schools, including in rural and remote areas of the state. Fall bonuses and targeted direct marketing bolstered sales for heat pumps, heat pump water heaters, gas fireplaces and energy-efficient windows. Existing Homes also selected eight contractors across the state to offer ductless heat pumps at a reduced cost to residents of manufactured homes and introduced a gas furnace incentive for single-family rental homes. Energy Trust completed two Opower efforts, which generated fewer savings than expected: a study to determine how long savings persist after a portion of PGE and NW Natural customers received reports for two years and a new effort targeting high energy users in Pacific Power territory. Overall savings related to Opower efforts were lower than expected due to fewer Pacific Power customers receiving reports than scheduled and preliminary results showing 1 percent average savings, compared to typical average Opower savings of 1.5 to 2 percent. The program will explore alternate residential behavioral savings approaches in The program allowed select 3-star trade allies to offer instant incentives for HVAC and water heating equipment, enabling customers to receive discounted equipment at time of purchase. This shifted the responsibility for submitting incentive applications from customers to trade allies, resulting in a higher rate of completed and qualifying applications, expediting incentive processing and reducing program delivery costs per unit. Existing Homes launched a new Savings Within Reach on-bill financing repayment offering with enhanced incentives for moderate-income residents, reducing upfront costs as a barrier to installing energy-efficient upgrades. With 51 applications received in 2014, the offering attracted participation from moderate-income residents, especially in Southern Oregon and the Portland Metro area. 10 Energy Trust defines residential deep retrofits as achieving a 20 percent or greater reduction in heating load through two or more weatherization or heating improvements installed at the same time. Many additional customers achieve whole-home savings through installing a series of single upgrades over a period of months or years Annual Report to OPUC & Board of Directors Page 18 of 75 April 15, 2015
19 New Homes and Products New Homes and Products installed a record number of energy-efficient light bulbs in 2014, more than 30 percent of which were LEDs. Lighting accounted for more than three-quarters of the program s electric savings, with general purpose CFLs representing 41 percent, LED bulbs representing 18 percent and specialty CFLs representing 15 percent. Refrigerator recycling and EPS homes contributed modest savings. Market transformation accounted for nearly one-half of gas savings in 2014, followed by EPS homes at 25 percent and showerheads at 22 percent. Market transformation includes Energy Trust s influence on both the 2008 and 2011 state building codes, guiding builders who do not work directly with Energy Trust to incorporate energy-efficient building techniques for the benefit of customers. The program rated the 6,000th EPS home and achieved 34 percent market share for EPS in Energy Trust service territory, up from 21 percent in 2013 and well above the program s goal of 25 percent. EPS helps homebuyers understand and compare the energy consumption of similarly sized homes. In 2014, 63 EPS-rated homes were featured in six home tours around the state. Savings per EPS-rated home increased in 2014 as builders exceeded code specifications, with 84 percent of builders following Energy Trust s most stringent pathway to achieve savings in new home construction. New Homes and Products launched an incentive for real estate brokers to upload EPS information to RMLS listings, helping educate homebuyers about the value of energy-efficient homes. A new outreach strategy to provide energy-saving products to rural customers through mobile, pop-up retail booths will expand statewide in 2015, following successful test efforts in the Portland Metro area in Fewer energy-efficient appliances were purchased than expected, likely due to limited incentives, a change in ENERGY STAR specification for refrigerators that led to a supply shortage and a nationwide trend of flat appliance sales. To boost savings, the program launched new instant incentives for efficient appliances at select Sears stores around the state, improving the customer experience and streamlining incentive processing. New Homes and Products recycled its 100,000th refrigerator or freezer since 2008, following an extended Oregon Food Bank coordination effort resulting in more than $48,000 in donated refrigerator incentives. Refrigerator recycling remained a major source of energy savings even with the introduction of two-tiered incentives, with customers receiving $20 or $40 based on the age of their unit. The program provided energy-saving products for moderate-income and rural customers in collaboration with the City of Portland, targeted stores and community action agencies around the state. Savings from new manufactured homes were bolstered by favorable economic conditions for many buyers Annual Report to OPUC & Board of Directors Page 19 of 75 April 15, 2015
20 D. Renewable energy sector highlights The renewable energy sector, comprised of Solar Electric and Other Renewables programs, reached 53 percent of its generation goal due to the delay of six large projects and the cancellation of one project. Four of the six delayed projects are on track to complete in The remaining two delayed projects are in contract negotiations with construction timelines yet to be finalized. Delays for these complex projects are typical and result from slower-than-expected bidding and contracting, and parts delivery and permitting delays. The one cancelled project was caused by low wholesale electricity rates and uncertain federal tax credits. Thriving residential and rebounding commercial solar markets contributed to renewable energy generation in 2014, along with completion of a geothermal, a mid-scale wind and a hydropower project. The sector met all OPUC performance measures for the year. Other Renewables and Biopower programs were combined into a single Other Renewables program in 2014, providing flexibility to shift funding between the technologies and target strategic opportunities. Solar In 2014, 1,292 solar projects were installed and contributed 1.1 amw of new generation, 43 percent of the Solar program s generation goal. The program met 164 percent of its OPUC performance benchmark for standard, net-metered generation through these solar installations. This OPUC performance benchmark excludes generation from large custom solar projects. The program supported a record 1,238 residential systems and 0.85 amw of generation installed, a 58 percent increase over 2013 generation, due to a rising tide of customer interest in solar and reductions in solar costs. In addition, the program installed the 6,000th residential solar system since Homeowners installed larger solar systems as residential system prices declined in The average residential solar system installed in 2014 was 5.8 kw, up from 5.6 kw in 2013 and 5.2 kw in Strong growth occurred in both customer-owned and third party-owned systems, with customer-owned systems representing more than 40 percent of the market. Energy Trust supported 54 commercial, industrial, nonprofit and public solar systems in 2014, compared to 42 in To date, 850 non-residential installations have been installed with a total capacity of 24 MW. The commercial solar market is regaining momentum, closing out 2014 with the largest commercial solar pipeline since the expiration of Oregon Business Energy Tax Credits. In 2014, 44 percent of solar capacity installed was outside of the Portland Metro area. In addition, staff provided marketing and outreach support for Solarize programs in the Columbia Gorge, Wallowa County and Rogue Valley. The 3-MW Steel Bridge solar project was chosen through a competitive request for proposals for custom solar projects in PGE territory and is expected to complete in Three large, custom solar projects were delayed in 2014, limiting generation for the renewables sector. One of these projects is expected to complete in 2015, and the two remaining projects are in contract negotiations with construction timelines yet to be determined. The Solar program initiated efforts to reduce the non-hardware or soft costs of installing solar systems including labor, marketing and permitting work which can represent a majority of installation costs. Efforts included: 2014 Annual Report to OPUC & Board of Directors Page 20 of 75 April 15, 2015
21 o o o A test offering of Mapdwell: Solar System for Washington County customers, an online solar assessment tool that estimates solar energy potential and installation costs for homes and buildings in a given community. If effective at generating customer leads for trade allies and therefore reducing marketing costs, Energy Trust will consider expanding the Mapdwell offering to the full service territory. Along with Boston and Washington D.C., these Oregon cities are the first in the country to have access to this tool. A survey to benchmark current soft costs, in collaboration with the National Renewable Energy Lab and Lewis & Clark College s Green Energy Institute. Survey results will provide metrics against which to evaluate soft cost reduction efforts. A customer referral program that generates leads for trade allies from Energy Trust s website, reducing the cost to trade allies of acquiring new customers. Other Renewables Three Other Renewables projects reached commercial operation in 2014: o 1.75-MW geothermal facility at Oregon Tech in Klamath Falls, the first university in North America to generate all of its electricity onsite o 700-kW hydropower project at Three Sisters Irrigation District in Sisters that also includes the non-energy benefits of water conservation and stream restoration o 50-kW wind turbine installed by the Confederated Tribes of the Umatilla Indian Reservation near Pendleton, the only wind turbine on a Native American reservation in the Pacific Northwest Delay of two custom projects and cancellation of one project limited generation in The Gresham Wastewater Treatment Plant biogas project was slowed until early 2015 due to construction delays and additional required metering. A small hydropower project in Astoria was also delayed because of lags in contracting and electrical code inspections. Finally, a biogas project at a dairy was cancelled due to poor market conditions. The pipeline for upcoming large renewable energy projects grew. Other Renewables targeted support for projects with additional non-energy benefits and projects that can net-meter, primarily hydropower projects with irrigation districts and biopower projects at wastewater treatment plants. The program approved two large project development assistance awards for geothermal projects, resulting from two competitive solicitations in The program provided more than $500,000 for a range of development assistance to biopower, hydropower, geothermal and wind technologies in 2014, exceeding the amount provided in See Appendix 4 for full details. Staff reached out to wastewater treatment plants, food processors, irrigation districts and other agricultural water supply stakeholders in These outreach efforts focused on identifying potential new projects that recognize multiple benefits such as water conservation that may attract additional funding sources. Farmers Conservation Alliance was selected to manage an irrigation hydropower initiative starting in 2015 that leverages external funding resources for projects at irrigation districts that have benefits in addition to electricity generation Annual Report to OPUC & Board of Directors Page 21 of 75 April 15, 2015
22 E. Highlights of internal operations Communications Received 904,733 website visits in 2014, a 21 percent increase over the 745,244 website visits received in A marketing campaign designed to drive customer awareness and engagement in Energy Trust programs contributed significantly to the increase in web visits, aided by marketing promotions for residential lighting, residential weatherization bonuses and Energy Saver Kits. Generated 18,000 visits to the Energy Trust website through our first-ever holistic marketing campaign promoting services and incentives to customers of all residential and commercial programs. Enhanced the website with more visible renewable energy program information, including an automated intake form for customers seeking proposals for solar projects. Distributed 34 press releases in 2014, featuring completed energy-efficiency and renewable energy projects around the state, new board members, Energy Trust offers, bonus incentives, program promotions, results and customer benefits. Garnered 355 news stories about Energy Trust in print and broadcast with a media value of $330,000 what it would have cost to purchase the equivalent advertising space and air time as a result of media outreach and responses to reporter inquiries. Customer service Received 26,607 calls to the main hotline in 2014, 3 percent fewer than the 27,413 calls received in Call volumes have decreased since 2009 as Energy Trust has expanded webbased customer services and added online forms. Received and responded to 1,747 inquiries via info@energytrust.org, 8 percent more than the 1,612 s received in The most common requests were for information about Existing Homes offerings. Received and addressed 23 complaints, compared to 18 received in This represents 0.08 percent of all calls and inquiries. Enhanced strategies to manage, resolve and prevent complaints, such as updating the complaint tracking system and reports, enhancing call monitoring and feedback to representatives, creating a complaint resolution team and identifying complaint trends. Evaluation received in 2014 led to program process improvements, new training materials and protocols for call center staff. Improved and provided customer experience training for new and existing internal and Program Management Contractor staff, ensuring consistent understanding of the organization s background, customer service values and customer channels. Trade and program allies Met with 470 trade allies at roundtables in Baker City, Bend, Eugene, Hermiston, Medford, Ontario, Pendleton and Portland. Quarterly trade ally roundtables included program updates, marketing guidance, presentations from product distributors and program and lending allies, networking opportunities and a new approach to roundtable breakout sessions based on trade ally feedback Annual Report to OPUC & Board of Directors Page 22 of 75 April 15, 2015
23 Provided ongoing support for trade allies through webinars and training opportunities, individual meetings and regular communication through a monthly e-newsletter, Insider. Energy Trust strategy relies increasingly on trade allies to communicate about and deliver Energy Trust offerings to customers. Identified changes to insurance tracking processes, reducing administrative work by approximately 20 hours per quarter while maintaining trade ally compliance with insurance requirements. To boost awareness of opportunities for minority- and women-owned businesses, hosted tables at the 2014 Governor s Marketplace Conference and Oregon Association of Minority Entrepreneurs trade show, reaching approximately 100 interested companies. To help trade allies make the case for energy-efficient upgrades, sponsored a training for the Energy Efficiency Funding Group s Efficiency Sales Professional certification program. Pursued funding from the U.S. Department of Agriculture s Energy Efficiency Conservation Loan Program for a potential initiative to replace inefficient, old and unsafe manufactured homes in rural Oregon. Helped develop a Multnomah County Commercial Property Assessed Clean Energy program, in collaboration with the Portland Development Commission and the county, to provide funding for commercial property owners who complete comprehensive energy efficiency and renewable energy projects. With the long-term loans repaid through energy savings or electricity production, the PACE lending model supports projects with 100 percent funding and no upfront costs. Outreach Hired a southern Oregon outreach manager and senior community relations manager, expanding Energy Trust s ability to reach and engage with customers, communities and stakeholders across Energy Trust service territory. Facilitated collaboration with the Hermiston School District s Columbia Basin Homes Building program to help student builders learn about energy-efficient construction and complete construction of an EPS-rated home in Hermiston. Staffed tables and engaged with customers at a broad range of events statewide, including Hermiston Farm Fair, SolWest Energy Fair in Eastern Oregon, Native American Youth and Family Center Pathways to Homeownership and Rogue Valley s Green and Solar Tour. General event outreach like this enables program outreach to be more targeted. To reach industrial and commercial customers in Wallowa, Umatilla and Malheur counties, coordinated with local economic development agencies, utilities and USDA. Collaborated with utilities through 14 joint presentations to help clarify for utility customers the relationship between Energy Trust and their utility, and promote participation opportunities and benefits. Engaged more than 200 public sector staff and elected officials to increase awareness of Energy Trust offerings and leverage public resources through coordination. Facilitated 34 visits to regional stakeholders, customers and contractors and delivered 37 presentations to local governments, elected officials, civic leaders and tribes. As a result, established relationships with Klamath Falls, Beaverton and Hillsboro mayors, Lakeview city manager, Multnomah County commissioners and members of the Pendleton Progress Board Annual Report to OPUC & Board of Directors Page 23 of 75 April 15, 2015
24 Established new stakeholder relationships through local economic development groups, including membership on the Oregon Rural Development Council s Executive Committee, attendance at Business Oregon Economic Forums and collaboration with the Lake County Resource Initiative, Strategic Economic Development Corporation, Real Estate CEO Roundtables and Greater Portland Inc. Engaged in community initiatives to expand customer participation, including the Georgetown Energy Prize in Corvallis and Bend, Rogue Valley s Rogue Energy Initiative, Umpqua Climate Group, Solarize Wallowa County and Washington County Air Quality Group. IT Provided critical and ongoing support for all Energy Trust program delivery, including Business Intelligence system for reporting and evaluation data, Customer Relationship Management systems, energy and incentive project tracking and accounting, and secure remote connectivity and functionality for internal and PMC staff. Continued investment in foundational IT system improvements to help anticipate program needs and reduce future costs, including: o Conducted work to transition Energy Trust s measure and project tracking system from FastTrack to the CRM system. Included new components developed by staff to support program management efficiency and customer service. Project completion expected in the first half of o Upgraded to a new, easier-to-use version of CRM, with capability to track new information about and relationships between customers and trade allies and support enhanced customer service. o Migrated to a new reporting platform using Microsoft Business Intelligence tools, improving Energy Trust s reporting capabilities and reducing ongoing licensing costs. o Upgraded to new version of Microsoft Great Plains financial software. Keeping up-to-date on software allows staff to maintain ongoing support for critical systems, as older versions are no longer supported. o Upgraded to a new version of Microsoft SharePoint, which serves as intranet for Energy Trust and also houses Energy Trust electronic record retention. The new version features an improved user interface and simplified functionality to facilitate employee workflows, save time and reduce employee training and support needs. Developed a new web portal to give Existing Homes trade allies access to real-time information about participant projects, allowing trade allies self-service options that reduce reliance on internal and PMC staff to provide information about project status and incentive payments. Pilot use with select trade allies began in 2014, with a full launch to approximately 300 trade allies expected in early Launched a web-based data entry form allowing customers to apply for all Existing Homes incentives online, eliminating the need for data entry, data validation and paper documentation. This improvement is expected to deliver savings of more than $200,000 annually. Created and executed a protocol for use of sensitive utility data for marketing efforts, ensuring data integrity and security through workflow documentation and maintenance of customer do not contact requests Annual Report to OPUC & Board of Directors Page 24 of 75 April 15, 2015
25 Processed 98,642 customer projects in Energy Trust systems, including 64,758 submitted through web applications. Responded to 5,095 help desk tickets submitted to IT by internal and PMC staff. Planning and evaluation Created 286 new energy-efficiency measures and revised 1,277 measures in Completed and posted 29 evaluations and market studies on the Energy Trust website. Supported a regional business plan for NEEA gas market transformation efforts to launch in 2015, and secured Energy Trust board approval for funding the plan. Provided analysis requested by the OPUC for incentive cap recommendation to potentially allow limited incentives for certain non-cost-effective measures, proposed in the gas costeffectiveness docket report. Responded to NW Natural Integrated Resource Plan data requests related to efficiency, including running a special scenario to determine if a delivery capacity expansion project in the Salem area could be deferred cost-effectively with additional targeted efficiency Annual Report to OPUC & Board of Directors Page 25 of 75 April 15, 2015
26 V 2014 PROGRESS TO OPUC PERFORMANCE MEASURES Each year, the Oregon Public Utility Commission establishes minimum performance measures for Energy Trust in a variety of categories. Minimum savings and generation figures for energy-efficiency programs and renewable energy programs are set at an aggregated level rather than at an individual program or sector level. This allows Energy Trust to pursue different program strategies in the residential, commercial and industrial sectors as market forces and technologies change. Electric and gas efficiency performance targets are set at 85 percent of Energy Trust goals as defined in annual budgets. The following OPUC minimum performance measures apply to Energy Trust 2014 results. Electric Efficiency Performance Targets in Portland General Electric Territory Electricity savings of at least 32.0 amw Result: Exceeded, with 36.7 amw saved in 2014 Levelized life-cycle cost should not exceed 3.2 cents/kwh Result: Well within requirement, with 2014 average levelized life-cycle cost at 2.5 cents per kwh Electric Efficiency Performance Targets in Pacific Power Territory Electricity savings of at least 17.1 amw Result: Exceeded, with 21.3 amw saved in 2014 Levelized life-cycle cost should not exceed 3.7 cents/kwh Result: Well within requirement, with 2014 average levelized life-cycle cost at 2.7 cents per kwh Natural Gas Efficiency Performance Targets in NW Natural Territory Natural gas efficiency savings of at least 4.53 million annual therms in 2014 Result: Exceeded, with 5.24 million annual therms saved in 2014 Average levelized life-cycle cost should not exceed 45.3 cents per therm Result: Well within requirement, with 2014 average levelized life-cycle cost at 32.6 cents per therm Natural Gas Efficiency Performance Targets in Cascade Natural Gas Territory Natural gas efficiency savings of at least 0.40 million annual therms in 2014 Result: Exceeded, with 0.42 million annual therms saved in 2014 Average levelized life-cycle cost should not exceed 52 cents per therm Result: Well within requirement, with 2014 average levelized life-cycle cost at 38.9 cents per therm Renewable Resource Development Targets For project and market development assistance, report annual results, including number of projects supported, milestones met and documentation of results from market and technology perspective Result: Full compliance, paid and committed $513,853 in project development assistance to 18 projects, including 11 hydropower, four geothermal, two biopower and one wind. Details on the results of the 2014 project development assistance are in Appendix 4. Obtain at least 0.70 amw in installed generation of standard, net-metered projects, including solar and small wind Result: Exceeded, with 1.15 amw of installed generation from standard solar projects. For non-solar custom projects, the three-year rolling average incentive is not to exceed $29 per allocated MWh 2014 Annual Report to OPUC & Board of Directors Page 26 of 75 April 15, 2015
27 Result: Well within requirement, with a three-year rolling average incentive per allocated MWh for of $ Additional detail is in Appendix 4. For innovative and custom solar projects, report sources of funding for projects and selection criteria Result: Full compliance, dedicated funding to two solar projects in PGE territory. Funding came from a portion of the Solar program budget that had been allocated for a streamlined competitive process for larger projects and from an RFP for non-solar projects that had unallocated funds. Projects were selected based on incentive amount requested, ability to complete the project by the deadline specified and the quality of the project s business plan. Financial Integrity Receive an unmodified financial opinion from an independent auditor on annual financial statements Result: Full compliance, with an unmodified financial audit opinion for 2014 Administrative and Program Support Costs Keep administrative and program support costs 11 below 9 percent of annual revenues Result: Well within requirement, with 2014 administrative and program support costs at 4.6 percent of annual revenues Customer Satisfaction Demonstrate greater than 85 percent satisfaction rates for: 1. Interaction with program representatives 2. Overall satisfaction Result: Achieved, with a 98 percent satisfaction rate for interaction with program representatives and a 96 percent overall satisfaction rate. Customer satisfaction rates were calculated from telephone surveys of participants soon after project completion. Results for major programs are averaged to determine satisfaction rates. See Appendix 2. Benefit/Cost Ratios Report benefit/cost ratios for larger conservation acquisition programs for both utility system and total resource perspective 2014 Utility Cost and Total Resource Cost by Program Program Combined Utility Cost Test benefit cost ratio Combined Total Resource Cost Test benefit cost ratio New Homes and Products Existing Homes Existing Buildings, including Multifamily New Buildings Production Efficiency Program delivery efficiency is defined as all program costs except the following direct program costs: program management, program delivery, program incentives, program payroll and related expenses, outsourced services, planning and evaluation services, customer service management and Trade Ally Network management Annual Report to OPUC & Board of Directors Page 27 of 75 April 15, 2015
28 VI REVENUE AND EXPENDITURES TABLES12, 13 A. Revenues Source Annual actual revenues Annual budgeted revenues Portland General Electric $ 37,173,014 $ 34,223,172 PGE Incremental $ 48,928,367 $ 51,072,562 Pacific Power $ 27,253,456 $ 26,358,594 Pacific Power Incremental $ 25,585,812 $ 26,047,016 Cascade Natural Gas $ 2,455,200 $ 1,913,709 NW Natural $ 17,880,127 $ 18,276,959 NW Natural Industrial DSM $ 3,073,052 $ 3,773,634 Total $ 162,349,027 $ 161,665,646 Incremental revenues are those authorized under SB 838 to support capturing additional cost-effective electric efficiency savings above the amount supported by funding through SB 1149 B. Expenditures Type Actual annual expenditures Annual budgeted expenditures Energy Efficiency Programs $ 134,796,967 $ 152,000,378 Renewable Energy Programs $ 13,094,590 $ 16,310,538 Administration $ 5,098,190 $ 6,357,007 Total $ 152,989,746 $ 174,667,923 Source Actual annual expenditures Annual budgeted expenditures Portland General Electric $ 81,072,821 $ 90,432,277 Pacific Power $ 50,165,497 $ 56,816,779 Cascade Natural Gas $ 1,956,561 $ 2,458,891 NW Natural $ 16,946,502 $ 21,530,689 NW Natural Industrial DSM $ 2,848,366 $ 3,429,288 Total $ 152,989,746 $ 174,667,923 C. Incentives paid Energy efficiency Quarter PGE Pacific Power NW Natural Cascade Natural Gas Renewable energy PGE Pacific Power Total Q1 $ 3,333,343 $ 1,744,478 $ 1,076,423 $ 85,089 $ 664,033 $ 261,721 $ 7,165,087 Q2 $ 8,016,188 $ 4,361,563 $ 2,353,929 $ 229,014 $ 1,112,130 $ 731,143 $ 16,803,966 Q3 $ 6,258,657 $ 3,923,119 $ 1,763,691 $ 189,920 $ 1,026,857 $ 1,711,530 $ 14,873,774 Q4 $ 22,607,035 $ 11,944,408 $ 5,291,019 $ 428,923 $ 2,635,322 $ 2,816,095 $ 45,722,803 Total $ 40,215,222 $ 21,973,568 $ 10,485,062 $ 932,946 $ 5,438,342 $ 5,520,489 $ 84,565, Columns may not total due to rounding. 13 The gas expenditures do not include NW Natural in Washington. These results are reported in Appendix Annual Report to OPUC & Board of Directors Page 28 of 75 April 15, 2015
29 VII SAVINGS AND GENERATION TABLES14, 15, 16 A. Progress toward annual efficiency and generation goals Expenditures Savings/ generation Levelized cost Energy Trust annual goal Goal % Achieved Electric savings $117,692, amw amw 101% Natural gas savings $21,751,429 5,658,998 therms ,802,048 therms 98% Electric generation $13,545, amw amw 53% B. Progress toward annual efficiency goals by utility Energy Trust 2014 annual goal Annual IRP target Annual expenditures Annual savings Levelized cost Goal % Achieved Goal % Achieved Portland General Electric Pacific Pow er NW Natural Cascade Natural Gas $74,337,061 $43,355,263 $19,794,868 $1,956, % amw Per kwh amw amw % amw Per kwh amw amw 5,238, ,331,487 5,331,487 98% therms Per therm therms therms 420, , ,561 89% therms Per therm therms therms 101% 112% 98% 89% C. Electric efficiency savings and expenditures 2014 electric efficiency savings PGE amw Pacific Power amw Total Savings amw Expenses Levelized cost/kwh Commercial $ 50,585, Industrial $ 29,520, Residential $ 37,586, Total electric efficiency programs $ 117,692, Columns may not total due to rounding. 15 Electric savings also include transmission and distribution savings. 16 The gas savings do not include results for NW Natural in Washington. These results are reported in Appendix Annual Report to OPUC & Board of Directors Page 29 of 75 April 15, 2015
30 D. Gas efficiency savings and expenditures 2014 gas efficiency savings NW Natural therms Cascade Natural Gas therms Total savings therms Expenses Levelized cost/therm Commercial 2,255, ,549 2,491,532 $ 7,473, Industrial 975,908 39,548 1,015,456 $ 2,462, Residential 2,006, ,416 2,152,009 $ 11,815, Total gas efficiency programs 5,238, ,513 5,658,998 $ 21,751, E. Renewable energy generation and expenditures 2014 renewable energy generation PGE amw Pacific Power amw Total Generation amw Expenses Levelized cost/kwh Other Renewable program $ 4,864, Solar Electric program $ 8,681, Total renewable programs $ 13,545, F Energy efficiency savings and expenditures by program 17,18 1. Total energy efficiency savings and expenditures Energy Trust Annual savings annual goal Percent achieved Levelized cost Electric 58.0 amw 57.7 amw 101% 2.6 per kwh Gas 5,658,998 therms 5,802,048 therms 98% 33 per therm Annual expenditures Variance from annual budget Electric $ 117,692,324 $ 12,570, % Gas $ 21,751,429 $ 5,667, % Total $ 139,443,754 $ 18,238, % 2. Existing Buildings savings and expenditures Energy Trust Annual savings annual goal Percent achieved Levelized cost Electric 15.4 amw 15.9 amw 97% 2.8 per kwh Gas 1,815,593 therms 1,781,978 therms 102% 33 per therm Annual expenditures Variance from annual budget Electric $ 35,848,259 $ 7,701, % Gas $ 5,763,469 $ 2,229, % Total $ 41,611,728 $ 9,931, % 17 Levelized cost is Energy Trust s total cost to save or generate each unit of energy over the life of the measure (which ranges from two to 20 years or more). 18 Variance is expressed in total dollars below budget or (total dollars) above budget Annual Report to OPUC & Board of Directors Page 30 of 75 April 15, 2015
31 3. New Buildings savings and expenditures Energy Trust Annual savings annual goal Percent achieved Levelized cost Electric 5.3 amw 5.0 amw 105% 2.5 per kwh Gas 675,940 therms 560,707 therms 121% 21 per therm Annual expenditures Variance from annual budget Electric $ 12,085,607 $ 1,281, % Gas $ 1,629,155 $ (154,935) -10.5% Total $ 13,714,763 $ 1,126, % 4. Production Efficiency savings and expenditures Energy Trust Annual savings annual goal Percent achieved Levelized cost Electric 18.5 amw 17.5 amw 106% 2.0 per kwh Gas 1,015,456 therms 1,196,420 therms 85% 23 per therm Annual expenditures Variance from annual budget Electric $ 28,536,721 $ 2,285, % Gas $ 2,462,545 $ 786, % Total $ 30,999,266 $ 3,071, % 5. Existing Homes savings and expenditures Energy Trust Annual savings annual goal Percent achieved Levelized cost Electric 5.1 amw 5.2 amw 98% 3.1 per kwh Gas 1,085,454 therms 1,223,707 therms 89% 55 per therm Annual expenditures Variance from annual budget Electric $ 13,464,824 $ 3,192, % Gas $ 7,072,283 $ 2,574, % Total $ 20,537,107 $ 5,766, % 6. New Homes and Products savings and expenditures Energy Trust Annual savings annual goal Percent achieved Levelized cost Electric 8.5 amw 8.1 amw 105% 3.5 per kwh Gas 1,066,555 therms 1,039,236 therms 103% 30 per therm Includes gas market transformation savings associated with the 2008 and 2011 residential code changes. Annual expenditures Variance from annual budget Electric $ 19,412,163 $ (2,349,664) -13.8% Gas $ 4,663,075 $ 262, % Total $ 24,075,238 $ (2,087,252) -9.5% 2014 Annual Report to OPUC & Board of Directors Page 31 of 75 April 15, 2015
32 7. Northwest Energy Efficiency Alliance savings and expenditures 19 Annual savings Annual energy target Percent achieved Levelized cost Commercial 1.3 amw 1.0 amw 122% 3.2 per kwh Industrial 0.2 amw 0.2 amw 87% 9.0 per kwh Residential 3.9 amw 4.8 amw 81% 1.7 per kwh Total 5.3 amw 6.0 amw 88% 2.2 per kwh Annual expenditures Variance from annual budget Commercial $ 2,732,136 $ 142, % Industrial $ 983,797 $ 462, % Residential $ 4,789,719 $ (175,279) -3.8% Total $ 8,505,652 $ 429, % G Renewable energy generation and expenditures by program Total renewable energy generation and expenditures Energy Trust Annual generation annual goal Percent achieved Levelized cost Electric 2.4 amw 4.5 amw 53% 5.3 per kwh Annual expenditures Variance from annual budget Electric $ 13,545,993 $ 3,440, % 2. Solar generation and expenditures Energy Trust Annual generation annual goal Percent achieved Levelized cost Electric 1.1 amw 2.7 amw 43% 7.0 per kwh Annual expenditures Variance from annual budget Electric $ 8,681,858 $ 1,659, % 3. Other Renewables generation and expenditures Energy Trust Annual generation annual goal Percent achieved Levelized cost Electric 1.2 amw 1.8 amw 67% 3.7 per kwh Annual expenditures Variance from annual budget Electric $ 4,864,135 $ 1,780, % 19 For the first time in 2014, Energy Trust has allocated budget to NEEA for gas market transformation activities. While there were no associated savings in the year, savings are expected in subsequent years. 20 Variance is expressed in total dollars below budget or (total dollars) above budget Annual Report to OPUC & Board of Directors Page 32 of 75 April 15, 2015
33 H Electric efficiency results for SB 1149 and SB 838 funds Energy Trust will complete an analysis of the allocation of 2014 savings and related costs to SB 1149 versus SB 838 funding sources, along with the summary of SB 838 expenditures by utility, in fall An addendum will be issued to the 2014 Annual Report with three SB 1149 and SB 838 tables: SB 1149 savings and costs (total and by sector) SB 838 savings and costs (total and by sector) SB 838 utility expenditures (total and by utility) As in past years, Energy Trust has engaged a third party to review energy consumption data provided by utilities and determine whether a project should be funded by SB 1149 (all sites using electricity from PGE or Pacific Power are eligible) or SB 838 (limited to sites using less than one amw annually). See Appendix 10 for the 2014 electric efficiency results for SB 1149 and SB 838 funds. Information appended to the report October 15, Annual Report to OPUC & Board of Directors Page 33 of 75 April 15, 2015
34 APPENDIX 1: GEOGRAPHIC DISTRIBUTION OF SITES SERVED Energy Trust sites served by region in 2014 Commercial sector Industrial sector Residential sector Renewable energy sector Total Percent increase over sites served in 2013 Central Oregon , ,628 10% Eastern Oregon % North Coast , ,590 44% Portland Metro & Hood River 3, , ,017 15% Southern Oregon , ,454 25% Willamette Valley , ,389 22% Total 5, ,994 1,301 79,016 18% 2014 Annual Report to OPUC & Board of Directors Page 34 of 75 April 15, 2015
35 APPENDIX 2: 2014 CUSTOMER SERVICE AND SATISFACTION RESULTS Call and volumes Energy Trust s call center received 26,607 calls in 2014, a 3 percent decrease from 27,413 calls in Call volumes have been decreasing since 2009 as Energy Trust released more online forms and enhanced web-based customer services, and customers increasingly contacted programs directly rather than through the main call center. During 2014, call center staff responded to 1,747 inquiries via info@energytrust.org, most from residential customers, an increase of 8 percent from the 1,612 inquiries in Complaint report Energy Trust received 23 level four customer complaints in 2014, an increase of five complaints compared to Complaints included contractor and Allied Technical Assistance Contractor participation concerns, contractor complaints about incentive changes and customer complaints about contractors that are not Energy Trust trade allies. Website visits Energy Trust s website, received 904,733 visits in 2014, a 21 percent increase over the 745,244 website visits in Traffic continued to increase year-over-year across all online content, reflecting Energy Trust s increasing use of online applications and forms, newsletters, online advertising and social media. Also in the past five years, Energy Trust observed increased online use in areas outside of the Portland metro area, with web traffic doubling or tripling in Canby, Pendleton, Roseburg and Salem. Traffic to the annual report website doubled in 2014 following efforts to engage customers. Customer satisfaction Energy Trust calculated customer satisfaction from short telephone surveys conducted with randomly selected participants soon after they completed projects. The survey asked participants about overall satisfaction with Energy Trust. Participants in the Existing Buildings, Production Efficiency and commercial Solar programs were also asked about satisfaction with program representatives. In 2014, the average rate of overall satisfaction with Energy Trust was 96 percent, and the rate of satisfaction with Energy Trust program representatives was 98 percent. New Buildings projects often involve numerous market actors (architects, engineers, developers and owners) at different project stages, so it is difficult to reach a project representative who is able to respond to questions about satisfaction. Satisfaction with the New Buildings program is obtained from interviews with program participants as part of annual program process evaluations. In the 2014 process evaluation, conducted in early 2015, 37 New Buildings project owners or representatives were surveyed about their overall program satisfaction and satisfaction with communications with program representatives. Of participants surveyed, 97 percent were satisfied with their overall program experience. Satisfaction with program representatives was 100 percent Annual Report to OPUC & Board of Directors Page 35 of 75 April 15, 2015
36 Table 1: 2014 overall satisfaction 2014 overall satisfaction Existing Buildings, including Multifamily 99% New Homes and Products 21 94% Existing Homes 91% New Buildings 97% Production Efficiency 96% Solar 22 98% Unweighted average 96% Table 2: 2014 satisfaction with program representatives 2014 satisfaction with program representatives Existing Buildings, including multifamily 97% New Buildings 100% Production Efficiency 96% Commercial Solar 4 of 4 23 Unweighted average 98% Note: Energy Trust s customer feedback survey does not ask residential participants about satisfaction with program representatives. Residential participants interact with Energy Trust representatives to a varying degree some have in-home energy reviews, some call the call center and others may not interact with a program representative. In general, commercial and industrial participants have more interaction with Energy Trust representatives. 21 Only Products customers were surveyed. Energy Trust does not track purchasers of new homes. 22 Customers that installed solar using a third party are not surveyed. 23 Only commercial solar customers are surveyed about satisfaction with program representatives. Four commercial solar customers were surveyed due to low project volume in Annual Report to OPUC & Board of Directors Page 36 of 75 April 15, 2015
37 APPENDIX 3: BENEFITS TO UTILITY CUSTOMERS FROM STAFFING ADJUSTMENTS Each year, Energy Trust assesses staffing needs as part of its budget and action planning process. This assessment takes into account work that has been or can be eliminated and reduced through process efficiencies, positions that can be reassigned or changed to fulfill existing and new business needs, and benefits to utility customers associated with the work of proposed new positions. In 2014, staffing priorities were driven by systems and web development needs, and expanded opportunities for outreach and marketing. As Energy Trust serves a more mature market, the organization is focused on serving smaller customers and harder-to-reach market segments. Staff are also managing costs by developing capabilities and systems to support targeted marketing and online transactions. The 5.5 full-time equivalent staff added in 2014 were devoted to these specific new focus areas. In its comments on Energy Trust s Draft 2014 Annual Budget and Action Plan, the Oregon Public Utility Commission requested Energy Trust include information in its 2014 Annual Report related to human resources changes made in Specifically, the OPUC asked for documentation of staff reassignments, workload reductions and benefits associated with new staff positions. Table 1: Staff reassignments and associated benefits to utility customers Changes to existing positions Benefits Finance Administrative Assistant modified to Human Resources Assistant Industrial Program Coordinator modified to Industrial Project Manager Residential Program Coordinator modified to Residential Project Manager Residential Project Manager modified to Senior Project Manager Existing Buildings Senior Project Manager modified to Program Manager Industrial Program Manager modified to Industrial Senior Program Manager Trade Ally Coordinator modified to Trade Ally Operations Project Manager Timely recruitment and retention of highly skilled employees for Energy Trust program and operations management Expanded Strategic Energy Management offerings for industrial and agricultural customers Supported competitive selection process for New Homes and Products PMC, ensuring sustained value for ratepayers, and subsequent transition Supported development of on-bill financing and EPS customer offerings, displacing these functions from a PMC at lower cost; streamlined coordination with utilities and financial institutions Expanded program offerings and support for multifamily property owners and tenants, including MPower offer for affordable multifamily housing Program delivery management for more industrial customers through custom program offerings; continued accountability for program serving growing volume of customers Improved services for customers and contractors through development of online tools for contractor enrollment, complaint resolution management systems and improved systems and processes for trade ally contractor communications 2014 Annual Report to OPUC & Board of Directors Page 37 of 75 April 15, 2015
38 Online and Interactive Communications Manager modified to Senior Web Manager Senior Business Systems Analyst modified to Business Intelligence Architect Increased management for systems development to support online customer and contractor transactions; planning for online customer services and digital strategies; more website enhancements to help reduce program delivery costs; website user experience leadership Continued public accountability and increased operational efficiency through improved reporting systems to support growing complexity and volume of program activities Workload reductions and associated benefits to utility customers Energy Trust maintains a focus on continuous improvement of internal operations. However, overall workload has increased due to a higher volume of program transactions, a growing number of measures and evaluations needed to support diversification of program offerings, more utility coordination, expanded outreach and marketing to reach customers, and systems improvements. The following are examples of process improvements accomplished in 2014 and their associated benefits for utility customers. In some cases these improvements enabled staff to speed processing, save on program management costs or provide better customer service. In other cases, staff resources were reallocated to other work. Table 2: Workload reductions and associated benefits to utility customers Improvement Benefit Evaluated incentive applications to make them easier and faster for customers and trade allies to complete, including removing serial numbers from residential Products applications Enhanced systems for Existing Homes incentive application processing, including automated notification for trade allies when a form is missing information, new instant incentives functionality and new web forms Began allowing select 3-star Existing Homes trade allies to offer instant incentives for some equipment, enabling customers to receive discounted equipment at time of purchase Streamlined reporting data intake processes through development of consistent intake templates for program and operations staff systems In 2013, serial numbers were missing in 28 percent of incomplete Products applications; the modified form improves the efficiency of delivering incentive checks and maintains appropriate controls to protect ratepayer dollars Reduced data processing work, enhanced data accuracy Shifted the responsibility for submitting incentive applications from customers to trade allies, resulting in more complete applications, faster incentive processing and lower program delivery costs Reduced staff time spent on reporting work while maintaining high-quality reports 2014 Annual Report to OPUC & Board of Directors Page 38 of 75 April 15, 2015
39 Transitioned to paperless Production Efficiency project files Enabled Program Delivery Contractors to upload project forecasts electronically to Energy Trust systems Introduced an online platform that automatically uploads New Homes and Products information entered by verifiers in the field into Energy Trust systems for incentive processing Began using tablet devices in the field to automate uploading of Existing Buildings and Multifamily data Streamlined the New Buildings project review process by eliminating review for projects identified as having low risk of error Enhanced web incentive applications, enabled customers to apply for all Existing Homes incentives online Improved project processing times Reduced data processing work, enhanced data accuracy Reduced data processing work, enhanced data accuracy Reduced data processing work, enhanced data accuracy Enabled processing of 20 percent more projects in 2014 compared to 2013 without sacrificing data quality Reduced data processing work, enhanced data accuracy, provided faster incentive checks to customers Table 3: Additional staff positions added and benefits to utility customers Position Added Benefits to utility customers Web Project Manager (0.5 FTE) Increased access to Energy Trust program information and incentives through enhanced newsletter and blog offerings, including launching two new commercial customer newsletters Senior Project Manager (1.0 FTE) Supported replacement of FastTrack with CRM to track new information about and relationships between customers and trade allies and support enhanced customer service Southern Oregon Outreach Manager (1.0 FTE) Sr. Community Relations Manager (1.0 FTE) Marketing Coordinator Business Sectors (1.0 FTE) Marketing Coordinator Residential Sector (1.0 FTE) Connected Southern Oregon customers and trade allies with Energy Trust offerings; represented Energy Trust at regional and local events Strengthened Energy Trust s ability to reach and serve customers statewide through relationships with local businesses and community leaders; increased awareness and identified strategies to increase participation and collaboration Increased access to Energy Trust program information and incentives through development of two new commercial customer newsletters; supported marketing and public relations activities targeted to commercial and industrial customers Supported customer tools and increased access to Energy Trust programs and incentives through development of the Energy Payback Estimator web tool and enhanced marketing and public relations activities 2014 Annual Report to OPUC & Board of Directors Page 39 of 75 April 15, 2015
40 APPENDIX 4: RENEWABLE RESOURCE DEVELOPMENT TARGETS Project development assistance activity in 2014 The primary goal of Energy Trust s project development assistance is to expand distributed renewable energy generation in Oregon by minimizing early stage development barriers. Funds for project development assistance in 2014 helped lower the costs of resource characterization through studies to support permit applications, scoping studies, early stage engineering and a comparison of electricity and transportation fuel as uses for biogas. By providing project development assistance, the renewable energy sector is able to help build a pipeline of projects that are moving through the steps of development and are able to apply for installation incentives, expand understanding of the market for various renewable energy technologies, and meet a need in the renewable industry for early stage project support that will help secure longer-term financing. A project development assistance results In 2014 Energy Trust supported 18 projects with project development assistance. The organization committed a total of $513,853 for a range of development assistance to biopower, hydropower, geothermal and wind technologies (see Tables 1, 2 and 3). Projects completing project development assistance activities in 2014 Of the 18 projects in progress in 2014, 12 completed the development assistance activities in 2014 and received a total of $151,152. These projects included eight hydropower projects, two geothermal projects and two biopower projects. Two of the projects receiving support were in PGE service territory and 10 were in Pacific Power territory. Table 1: Results for completed development assistance for hydropower projects Project Development assistance Outcome Utility Incentive Four innovative low-head hydropower projects in two irrigation districts Hydropower project at a residential netmetered site Turbine near the site of an existing project at a small ranch Design and permitting assistance Completed some preliminary civil design work for all four projects Project team decided to defer additional project development activities while completing construction of another project Scoping study Determined that the resource is too small for a project to make financial sense for the property owner Permitting and engineering assistance Assisted with a water rights application, mapping and some preliminary engineering Prepared the property owner to apply for a project installation incentive in late 2015 or 2016 Pacific Power Pacific Power Pacific Power $2,052 each for three projects; $138 for the fourth $500 $1, Annual Report to OPUC & Board of Directors Page 40 of 75 April 15, 2015
41 Irrigation district Mediation assessment report Prepared a mediation assessment for an irrigation district working on a project that involves replacing a canal with a buried pipe to increase generation at its existing hydropower facility Pacific Power $6,416 A group of landowners that live adjacent to the canal have pursued land-use proceedings to block the project The report characterized readiness to mediate and whether mediation would be helpful Microhydropower project at a residential property Scoping-level feasibility study Determined that the project is not viable because of environmental issues that would lead to high permitting costs PGE $1,000 Table 2: Results for completed development assistance for geothermal projects Project Development Outcome Utility Incentive assistance Geothermal project Pacific Power $75,000 Initial resource characterization, including gathering temperature and flow data from existing wells, analysis of soil chemistry information and seismic testing Produced a set of two- and threedimensional images of the faults at 5,000-foot depth, characterized the type of rock in the area and suggested two potential sites for drilling The work provided the site owner with initial information that would be helpful in seeking a professional developer partner The site owner is considering options for moving forward Geothermal project Resource characterization to determine if there is enough potential to warrant more extensive feasibility and analysis Completed temperature recording at an existing well on two separate occasions; testing indicated temperatures too low to support geothermal electricity production Plans for an economic feasibility report were cancelled because of the low temperatures Pacific Power $6, Annual Report to OPUC & Board of Directors Page 41 of 75 April 15, 2015
42 Table 3: Results for completed development assistance for biopower projects Project Co-generation project using biogas at a wastewater treatment plant Wastewater treatment plant examining options for using its biogas Development assistance Feasibility analysis Study comparing the financial advantages and disadvantages of using biogas for electricity production vs. production of transportation fuel Outcome Utility Incentive Found that the project does not meet the city s financial requirements primarily due to the limited amount of biogas currently produced by the plant Determined that using the gas for transportation fuel appeared to be the better financial option, but carried more risks including finding enough purchasers of the fuel and managing transaction costs The facility is re-examining the study because of recent decreases in gasoline prices Pacific Power $45,971 PGE $7,468 New development assistance commitments in 2014 Six projects began development assistance activities in 2014 that will complete in 2015 or later. Technologies represented by these contracts included three hydropower projects, two geothermal projects and one wind project. Total funds committed to these new projects was $362,700. Table 4: New development assistance commitments in 2014 for hydropower projects Project Development assistance Outcome Utility Incentive Hydropower Initial work shows project has PGE $26,489 project potential, but more study is needed Feasibility report including measurement of head loss through a dam, equipment recommendations and financial modeling The next step is a fish study that will include input from a natural resource agency If the project looks viable after the additional study, the developer may pursue the necessary steps to permit and license the project, a process that will likely last up to five years City-owned, small hydropower project Feasibility work Work included a site visit, review of mapping, water rights research and financial analysis Pacific Power $20, Annual Report to OPUC & Board of Directors Page 42 of 75 April 15, 2015
43 Analysis showed a variety of project pathways The next steps are for the city to review options and work with stakeholders to determine whether additional study is needed before a decision about pursuing a project can be made Hydropower project Surveying related to establishment of a wilderness boundary; environmental studies Survey was completed and accepted by the U.S. Forest Service The next steps include completing and submitting environmental studies to agencies as part of the permitting process Pacific Power $30,025 Table 5: New development assistance commitments in 2014 for geothermal projects Project Development Outcome Utility Incentive assistance Geothermal project Pacific Power $164,466 Geothermal project Initial resource characterization and feasibility analysis Initial resource characterization and feasibility analysis Seismic data collection that helps characterize the area s fault structure is complete; site surveying is partially complete Results indicate that the site shows promise for a project The next steps are to complete sitesurveying and move forward with engineering for a well permit, full feasibility study, flow-testing and interconnection studies Seismic data collection is complete The next steps are to complete a site survey and move forward with engineering for a well permit PGE $112,874 Table 6: New development assistance commitments in 2014 for wind projects Project Development Outcome Utility Incentive assistance 10-MW community-scale wind project Pacific Power $7,887 Assistance with professional services to support signing a power purchase agreement Legal consultation and advice related to the review and drafting of the power purchase agreement, meteorological services related to estimating the wind resource and engineering consulting Project is in the process of securing financing 2014 Annual Report to OPUC & Board of Directors Page 43 of 75 April 15, 2015
44 B. Barriers to project development Energy Trust s project development assistance is designed to address the main barriers to renewable energy project development. Those barriers in 2014 remained similar to those in Helping projects overcome these barriers builds a pipeline of projects that can apply for incentives, complete construction and generate renewable energy. It is difficult to find capital to support early stage work. The most risky time to invest money in a renewable energy project is at the beginning. Investors are reluctant to put funds into a project with unclear potential. Without early stage funding, a project cannot advance to the point where the risk is reduced. By providing early stage funds, Energy Trust builds a pipeline and helps move projects forward, enabling them to attract additional financing and eventually construct a project. In addition, Energy Trust s support demonstrates confidence that can help projects successfully secure other sources of funds. In some cases, projects at this early stage learn they are not feasible. Energy Trust helps project owners reach that point with limited exposure. Less sophisticated developers whose primary business is not energy encounter difficulties navigating the stages of developing a project. Energy Trust works with many project developers that are not professional developers. Moving through the steps of resource characterization, feasibility, permitting and interconnection can be lengthy and difficult. Project development assistance both financial and technical helps developers navigate these steps in less time and for less cost, and learn industry best practices and how to avoid mistakes. Market conditions for distributed renewable generation in Oregon continue to be challenging. At all stages of the development process, project owners face poor market fundamentals, including low avoided cost rates and diminished state and federal incentives. Project development assistance is a tool to continue to attract investment in projects in Oregon, and to maintain development capacity in the state Annual Report to OPUC & Board of Directors Page 44 of 75 April 15, 2015
45 Table 7: Non-solar project cost and generation Project name QF vs NM Date operational MWh per year Contract term in years Energy Trust allocated MWh (total MWh) REC % to Energy Trust Energy Trust incentive Total RECs Revolution Energy Solutions Oak Lea Dairy (biopower) QF , , $441,660 13,500 $32.72 Klamath Irrigation C-Drop (hydropower) QF , , $490,000 58,700 $8.35 City of Portland Vernon (hydropower) QF , $65,000 1,150 $56.52 City of Medford (biopower) NM , , $450,000 48,200 $9.34 City of Pendleton (biopower) NM , , $450,000 8,300 $54.22 Wallowa Resources Integrated Biomass Energy Campus (biopower) QF , $70,000 5,775 $12.12 Revolution Energy Solutions Forest Glen Oaks Dairy (biopower) QF , , $441,660 25,200 $17.53 Farmers Irrigation District Low Line Canal (hydropower) QF , $95,000 2,380 $39.92 Farm Power Misty Meadows dairy (biopower) QF , , $1,000,000 52,650 $18.99 JC-Biomethane (biopower) QF , , $2,000, ,400 $14.88 Three Sisters Irrigation District Main Canal (hydropower) QF , , $1,000,000 42,780 $23.38 Confederated Tribes of the Umatilla Indian Reservation (small-scale wind) NM , $170,992 1,419 $ Oregon Tech Phase 2 (geothermal) NM , , $1,550, ,260 $10.67 Total $8,224, ,714 $15.24 Note: QF stands for qualifying facility; NM stands for net metered; REC stands for renewable energy certificate $/REC 2014 Annual Report to OPUC & Board of Directors Page 45 of 75 April 15, 2015
46 APPENDIX 5: NW NATURAL INDUSTRIAL DEMAND-SIDE MANAGEMENT ACTIVITIES Since 2009, Energy Trust has provided service to NW Natural s Schedule 31 and 32 non-transport customers, funded through a special rate adjustment mechanism rather than through the public purpose charge. Program costs and therm savings for these customers in 2014 are included in the body of this annual report as a portion of NW Natural savings and reported separately below annual therms 2014 levelized cost / Program/customer type saved 2014 expenditures therm Production Efficiency 684,480 $ 1,537, Existing Buildings 491,821 $ 1,089, New Buildings 114,867 $ 221, Total 1,291,168 $ 2,848, Annual Report to OPUC & Board of Directors Page 46 of 75 April 15, 2015
47 APPENDIX 6: ENERGY TRUST PROGRAM DESCRIPTIONS Existing Buildings. Energy Trust Existing Buildings offers technical assistance and cash incentives for installation of qualified energy-efficient equipment to help commercial businesses of all types and sizes reduce energy use and lower operating costs. Existing Buildings offers incentives for improvements including lighting, HVAC, foodservice or insulation, as well as customized solutions and operations and maintenance improvements. Existing Buildings technical staff helps customers identify and evaluate energy-saving opportunities with technical energy studies, contractor referrals and other technical services. Portions of the program are offered to NW Natural customers in Washington. Existing Buildings began in 2003 and was implemented in 2014 by Program Management Contractor ICF International with additional technical services for Strategic Energy Management provided by SEG, Triple Point and Enernoc. Multifamily. Multifamily services all existing multifamily structures with two or more units, including affordable housing facilities, assisted living facilities, condos and townhomes, campus living and market rate apartments. Multifamily property managers have a menu of offerings for financial and service incentives for both in-unit and common-area improvements. Technical services include direct installation of energy-efficient light bulbs and faucet aerators in the tenant spaces, energy surveys and custom incentive solutions, as well as cash incentives for common-area lighting, appliances, insulation, windows and HVAC systems. Multifamily moved to the commercial sector in 2010 and was implemented in 2014 by Lockheed Martin Services, Inc. New Buildings. This program provides incentives for energy-efficient design and equipment to support construction of high-performance commercial new buildings and major renovations of all sizes and building types. Participants can leverage a comprehensive set of services and incentives, such as early design and energy modeling assistance, a wide array of standard and customized equipment incentives, including modeled savings incentives for whole-building approaches and incentives for integrating solar designs. Since late 2012, the market solutions offering helps small businesses under 70,000 square feet achieve deeper energy savings through standard tiered incentives packages for restaurants, groceries, multifamily buildings, office buildings, schools and retail buildings. Incentives are offered for projects that achieve Leadership in Energy and Environmental Design, LEED, certification or save energy in excess of the 2010 Oregon Energy Efficiency Specialty Code requirements. Post construction, Energy Trust can help cover costs of earning ENERGY STAR certification. New Buildings began in 2003 and was implemented in 2014 by CLEAResult Consulting, Inc, formerly Portland Energy Conservation, Inc. Production Efficiency. Industrial and agricultural businesses of all types and sizes look to Production Efficiency for technical services and cash incentives to help them identify and implement electric and natural gas efficiency projects and practices. Energy Trust engages highly skilled industrial energy experts to advise Oregon businesses on reducing energy-related operating costs while improving productivity, product quality and environmental performance. The program works closely and consultatively with industries long-term, helping these businesses employ best practices and continuously improve their energy performance. Production Efficiency began in 2003 and is managed internally. Existing Homes. Homeowners and renters can take advantage of energy-saving recommendations, referrals to qualified trade ally contractors and cash incentives for qualified improvements including weatherization, heating equipment and water heaters. Existing Homes offers specialized services including free weatherization services for manufactured homes, increased cash incentives and on-bill financing for moderate-income homeowners through Savings Within Reach, market-based Home Performance with ENERGY STAR and diagnostic-based whole-home retrofit projects conducted by Building Performance Institute-certified contractors offered through Clean Energy Works. The program 2014 Annual Report to OPUC & Board of Directors Page 47 of 75 April 15, 2015
48 offers a web-based Home Energy Profile and phone-based support for customers. Customized Energy Saver Kits with no-cost energy-energy light bulbs and water savings devices may be ordered online, and LivingWise Kits are distributed through schools. The program leverages market actors, including distributors, retailers and community partners, to drive savings throughout the state. The program is testing behavior change strategies through a pilot sending quarterly Personal Energy Reports to a sample of customers. Portions of the program are offered to NW Natural customers in Washington. Existing Homes has been offered since 2003 and was implemented in 2014 by CLEAResult Consulting, Inc. New Homes and Products. New Homes seeks to expand the market share of energy-efficient homes in Oregon by creating homebuyer demand and training contractors. Energy Trust provides qualified homes with EPS, an energy performance score used to assess the energy consumption and carbon emissions of a home. New Homes provides builders with performance-based incentives tied to increased energyefficiency, as well as incentives for integrating solar into new homes. In addition to builders, the program works with subcontractors and real estate professionals, and encourages the sale of energy-efficient manufactured homes by local retailers. The program offers cash incentives for purchase of ENERGY STAR-qualified clothes washers, refrigerators, freezers, lighting and showerheads, and for recycling old refrigerators and freezers. The program also provides energy-saving kits to food pantries to deliver to their clients, and distributes showerheads through water bureaus and districts throughout the state. Portions of the program are offered to NW Natural customers in Washington. New Homes and Products began in 2004 and was implemented in 2014 by Portland Energy Conservation, Inc and Ecova. Solar Electric. The program helps homeowners, businesses and public agencies supplement their electricity needs with on-site solar generation. The program provides cash incentives for net-metered solar electric installations, educates consumers about solar purchasing and financing options and ensures high-quality installations through design review and verification. When additional funds are available, the program also supports custom, large-scale solar projects. The program envisions solar as a significant part of Oregon s energy mix and makes strategic investments in projects, infrastructure and ` local industry that will give rise to a healthy, stable market for solar in the long-term. The Solar program began in 2003 and is managed internally. Other Renewables. The program provides support for renewable energy projects that generate electricity using biopower, wind, hydropower and geothermal technologies. The goal of the program is to expand Energy Trust s renewable energy portfolio across a range of technologies and to improve market conditions. The program provides custom incentives for projects with generating capacities of up to 20 MW. The program provides incentives for Project Development Assistance, which can include incentives to pay a portion of the costs of feasibility studies, technical assistance or other activities to help projects move from concept to construction. Project installation incentives are calculated on a custom basis during a thorough technical and financial review of a project s application. All incentives are paid upon successful project installation or activity completion. Other Renewables started in 2003 and is managed internally. Northwest Energy Efficiency Alliance. NEEA is a nonprofit organization working to maximize energy efficiency to meet our future energy needs. In 2014, Margie Harris, Energy Trust executive director, served as board secretary of the NEEA Board of Directors, member of the executive committee, executive director review committee and strategic planning committee. NEEA is supported by and works in partnership with Bonneville Power Administration, Energy Trust and more than 100 Northwest utilities for the benefit of more than 12 million energy consumers. NEEA uses the market power of the region to accelerate innovation and adoption of energy-efficient products, services and practices. NEEA has delivered market transformation savings under contract to Energy Trust since Annual Report to OPUC & Board of Directors Page 48 of 75 April 15, 2015
49 APPENDIX 7: 2014 ENERGY TRUST BOARD OF DIRECTORS; BOARD DEVELOPMENT GUIDELINES; 2014 ADVISORY COUNCIL MEMBERS AND MEETINGS PRESIDENT Debbie Kitchin, Portland, is the co-owner of InterWorks LLC, a construction company engaged in commercial tenant improvement and renovation and residential remodeling services. InterWorks is an award-winning contractor specializing in sustainable building practices. Prior to joining the family business in 1996, she served as senior economist for the Northwest Power and Conservation Council for 15 years and was a regional economist for the Bonneville Power Administration for three years. Debbie is treasurer of the Portland Business Alliance, vice president of the Central Eastside Industrial Council and a board member of the Portland Building Owners and Managers Association. She is a past president of the Portland Commercial Real Estate Women. Debbie has served as president since February VICE PRESIDENT Ken Canon, Myrtle Creek, founded in 1981 the Industrial Customers of Northwest Utilities, a regional trade association focused on electric energy issues. Since retiring from that role in 2005, he chaired a committee that examined the performance of the Northwest Energy Efficiency Alliance and also managed the Northwest Energy Efficiency Task Force. Earlier in his career, while working for Associated Oregon Industries, he drafted and helped enact Oregon s Business Energy Tax Credit. Later, he helped implement a comprehensive energy-efficiency program at an International Paper mill. He has a long history of organizing, managing and advising nonprofit organizations. Applying his expertise to his residence, Ken built the first ENERGY STAR home in Douglas County. Ken, a life-long Oregonian, was born and raised in Medford and graduated from Southern Oregon University and Willamette University College of Law. Ken has served as vice president since February SECRETARY Alan Meyer, Salem, recently retired as director of energy management for Weyerhaeuser Company, a diversified forest products manufacturing company. In that role, he was responsible for coordinating energy management activities at numerous manufacturing facilities throughout North America. Prior to joining Weyerhaeuser, he was director of energy for Willamette Industries, holding similar responsibilities. He also worked for PacifiCorp as the Oregon large industrial accounts manager. He previously served on the board of directors of Industrial Customers of Northwest Utilities, a nonprofit advocacy organization focused on energy policies. He has also served for more than 20 years on the City of Salem Morningside Neighborhood Association board. Alan has served as secretary since February TREASURER Dan Enloe, Portland, is supply chain manager at Intel Corporation in Hillsboro, where he has worked in varying capacities since Prior to 1984, he was on active duty in the U.S. Navy and served as a nuclear submarine officer. Since leaving active duty, he served with the Naval Reserve, completed six reserve command tours and retired as a captain in He is a member of the Naval Reserve Association, the American Legion and the Navy League. A graduate of the U.S. Naval Academy with a degree in electrical engineering, he holds two patents. Dan has served as treasurer since November Annual Report to OPUC & Board of Directors Page 49 of 75 April 15, 2015
50 Rick Applegate, Portland, is the principal at Applegate Consulting, specializing in natural resource policy, environmental banking and restoration, strategic planning and facilitation. During the 10 years he served as Portland Harbor Superfund administrator for the City of Portland, he was responsible for coordinating the city s work on the lower Willamette River clean up. He served as administrative assistant and in senior legislative positions in the U.S. Senate and House of Representatives. Since then he has worked for more than 30 years on energy and environmental issues, principally as an advocate for salmon and their watersheds. He was the fish and wildlife director for the Northwest Power and Conservation Council, West Coast conservation director for Trout Unlimited, assistant regional administrator of the Habitat Conservation Division and senior policy advisor at the National Oceanic and Atmospheric Administration s National Marine Fisheries Service. He was the chair of the U.S. Southern Stakeholders Pacific Salmon Treaty Negotiations and a member of the Pacific Northwest Comprehensive Energy Review. Rick resigned from the board in October Susan Brodahl, Portland, is a vice president in the Portland office of Heffernan Insurance Brokers as well as an owner of Heffernan Group. Heffernan Group has more than 400 employees, and is ranked in the top tier of all privately held brokerages in the country. Susan believes in a creative approach to insurance using a risk funding model. Her philosophy is clients for life. Susan is a frequent featured speaker at regional and national conventions as well as published in various trade and mainstream journals. She has been awarded the Lifetime Achievement Award from the Painting and Decorating Contractors of America, and has an economics degree from Willamette University. Susan was elected to the board in February Melissa Cribbins, Coos Bay, is a Coos County commissioner and an attorney. Prior to her election in 2012, she worked for the Coquille Indian Tribe as in-house counsel for six years. Before Melissa became an attorney, she worked for the City of Spokane and Eugene Water and Electric Board in the field of water quality. She is a member of the Oregon State Bar and the Washington State Bar, and is active in many organizations both in Coos County and statewide. Melissa is a graduate of Portland State University and Gonzaga University. Melissa was elected to the board in February Heather Beusse Eberhardt, Portland, is a six-year veteran in the renewable energy field. She is the director of Technology Evaluation and Implementation-Solar at EDF Renewable Energy in Portland, where she previously served as structured finance manager and project finance manager. Prior to her roles at EDF, Heather acted as director of Partnership Development at GLOBIO and worked at Intel in Corporate Finance where she led the Intel Employee Sustainability Network. Heather currently serves on the board of Burke E. Porter Machinery and volunteers as a member of Social Venture Partners. Her efforts outside of renewable energy have included education as a middle school math instructor for Teach For America. Heather graduated from Colby College with a degree in Economics and has a Masters of International Management from Thunderbird School of Global Management. Heather was elected to the board in December Roger Hamilton, Eugene, is a consultant with Western Grid Group, an organization that promotes transmission access for renewable energy projects across the West. He also consults with The Resource Innovation Group on climate change adaptation and mitigation. He owns and operates a cattle and hay ranch in south-central Oregon. He has spent many years in public service as a Klamath County commissioner, an advisor on energy and watersheds to Governor John Kitzhaber and an Oregon Public 2014 Annual Report to OPUC & Board of Directors Page 50 of 75 April 15, 2015
51 Utility Commissioner. He has also served on the Oregon State Parks Commission and the National Association of Public Utility Commissioners. He currently serves on the board of directors of the Regulatory Assistance Project. John Reynolds, Eugene, is a professor of architecture emeritus at the University of Oregon and a fellow of the American Institute of Architects. He has been involved in energy issues in Oregon since 1972, when he was elected to the Eugene Water and Electric Board. Since then, he has served as chair of the American Solar Energy Society, president of Solar Energy Association of Oregon and member of the board of the International Solar Energy Society. He has served on the Oregon Alternate Energy Commission and the Energy Committee of the Building Codes Structures Board. Anne Haworth Root, Medford, is co-owner and general manager of EdenVale Winery and Eden Valley Orchards, a destination winery, historic pear orchard and events center in southeast Medford. A second tasting room called Enoteca is located in Ashland. An award-winning entrepreneur, she developed the concept and helped found the Oregon Wine and Farm Tour, an agritourism coalition of Southern Oregon wineries, historic farms and specialty food and cheese companies. She is a graduate of Southern Oregon University, where she was student body president and chair of the Oregon Student Lobby. She pursued postgraduate studies in the Master of Commerce program at Wollongong University in Australia. Mark Kendall, Salem, has more than 33 years of experience in energy management and renewable resource development in Oregon. Prior to founding his own consultancy, Kendall Energy, in 2009, he spent 19 years with the Oregon Department of Energy working in commercial and industrial energy management policy, including serving as the governor s appointee to the Northwest Energy Efficiency Alliance board from Before working for the state, he spent 11 years with the Eugene Water and Electric Board. He also served on the Oregon Low Carbon Fuel Standard Advisory Committee, and facilitated the 2009 Industrial Greenhouse Gas Reduction subcommittee of the Oregon Global Warming Commission. He received his bachelor s degree from Linfield College with an emphasis in communications and energy management, and his master s degree in organizational development from the Leadership Institute of Seattle City University. Kenneth Mitchell-Phillips, Multnomah County, is an attorney and president of Easy Legal Northwest, Inc., which specializes in providing high quality, personalized and low-cost legal services throughout Oregon and Washington. He recently served as general counsel, vice president of human resources and chief compliance officer and corporate secretary at Portland-based NxSystems, Inc. NxSystems is a provider of global electronic payment solutions with offices in Canada, Ireland and the U.K. Prior to joining NxSystems, he specialized in corporate law as an associate attorney at Davis Wright Tremaine LLP. He also established Mitchell-Phillips Law, P.C. where he provided legal services to businesses throughout the Pacific Northwest. In addition to practicing law, he teaches business law courses at Portland Community College and has served as a member of the Oregon State Bar Board of Governors. He received a J.D. from Lewis and Clark Law School in 2006, a Master of Science degree in Business from Troy State University in 1996 and a Bachelor of Arts degree in English from University of Maryland Eastern Shore in He is currently admitted to the Oregon State Bar and the United States District Court for the District of Oregon. His Washington State Bar license is pending. Kenneth resigned from the board in July Annual Report to OPUC & Board of Directors Page 51 of 75 April 15, 2015
52 Edmund Patrick Sherman, Portland, is a principal with Against the Current Consulting Group and works with clients interested in improving the quality of life in Native American communities. Eddie is a member of the Navajo and Omaha Nations and grew up on the Navajo Nation Reservation. In Navajo tradition, it is customary to identify someone s clan upon introduction: Ya at eeh, Shi ei Eddie Sherman. Nat oh Dine e Tachii nii nishlii doo [Tapa] Omaha Deer Clan ei bashishchiin. Bit ahnii nii ei dashicheii, nana [Tapa] Omaha Deer Clan ei dashinali. Todineeshzhee dee ei naasha. This translates to: Hello, my name is Eddie Sherman. I am Tobacco People, born for the [Tapa] Omaha Deer Clan. My maternal Grandfather's clan is Folded Arms people and my paternal Grandfather's clan is [Tapa] Omaha Deer Clan. I am from Kayenta, AZ. Prior to Against the Current Consulting Group, he was the communications and development manager for ONABEN, a nonprofit founded by four Oregon tribes to encourage private sector development on reservations. He currently serves on the board of the Native American Youth and Family Center, NAYA, co-chairs the Steering Committee for JustPortland and served on the Portland Human Rights Commission. Eddie received his bachelor s degree in International Political Economy from Colorado College. Eddie was elected to the board in November Dave Slavensky, Bend, is the Operations Manager at EarthCruiser USA, building adventure vehicles to travel the globe. Prior to joining EarthCruiser, he was chief operating officer for Structus Building Technologies, a Bend manufacturing company specializing in construction products. He has worked as a manufacturing consultant with Oregon Manufacturing Extension Partnership, as vice president of operations at KVP in Sacramento and as a consultant with the California Manufacturing Technology Center. He also spent five years working for Aircon Energy, Inc., an energy management and HVAC service company founded by his father. In 2007 he co-founded the High Desert Enterprise Consortium, a group of companies in Central Oregon committed to employing Lean Manufacturing principles to improve their businesses. He has conducted professional seminars in numerous process improvement techniques including Lean, Kaizen and Just-in-Time. He has been a member of the Bend Economic Development Advisory Board since 2009, and was the president of the Cascades Mountaineers in Bend from ex-officio John Savage, Salem, is one of three Oregon Public Utility Commissioners. He joined the staff of the Commission in 2002 as Director of its Utility Program, after serving as Director of the Oregon Department of Energy from He was Administrator of the Department of Energy's Policy and Planning division from He received a master s degree in natural resource economics from Oregon State University in 1979 and a Bachelor of Science degree from Oregon State University in Oregon Department of Energy Special Board Advisor Lisa Schwartz, Salem, was appointed the Oregon Department of Energy director. Lisa has more than 25 years of experience in energy policy, regulation and education. She began state service in 1987 as assistant administrator of the Oregon State University Extension Energy Program. Joining the Oregon Department of Energy for the first time in 1995, she helped establish oversight mechanisms for the state s new third-party administrator for energy efficiency and renewable energy Energy Trust. At the OPUC from 2002 through early 2009, she directed analysis of electric utility resource plans and competitive bidding processes, and helped develop the state s Renewable Portfolio Standard. Before re-joining the 2014 Annual Report to OPUC & Board of Directors Page 52 of 75 April 15, 2015
53 Oregon Department of Energy, she was senior associate at the Regulatory Assistance Project and recently served on the Western Electricity Coordinating Council s Transmission Expansion Policy Committee. Lisa left the Oregon Department of Energy in May Warren Cook, Salem, is the manager of Energy Efficiency and Conservation at the Oregon Department of Energy. In this role, Warren develops and implements programs and services for the public sector, schools, and industrial and agricultural facilities. With more than 30 years of experience in energy efficiency, Warren has worked in residential and commercial program design and development, and provided technical training to trade allies and technical schools. Warren started his career as a weatherization contractor in eastern Washington during the initial launch of energy-efficiency programs in the region. As a U.S. Department of Energy trained Residential Conservation Service auditor and trainer, he performed more than 2,000 residential audits and developed early software for energy retrofit assessments. Warren supported the development of the Northwest Energy Code and Washington State Energy Code. He is a corresponding member of the Northwest Power and Conservation Council s Regional Technical Forum, an Associate at the American Society of Heating, Refrigerating and Air- Conditioning Engineers, and holds certification in Information Technology from Willamette University. Warren began serving on the board in May Board Development Guidelines Energy Trust s board of directors is a non-stakeholder, volunteer board. The board oversees Energy Trust management, provides strategic and policy direction and approves the organization s budget and major expenditures. The board carries out its oversight role collectively and through several committees. The board s bylaws ensure that Energy Trust board meetings and other processes are clear, open and accessible to the public. The Oregon Public Utility Commission grant agreement with Energy Trust calls for the Energy Trust board to include the skills, broad representation and diversity necessary to achieve the nonprofit s mission. The initial board of directors included nine members from a variety of energy and business backgrounds, and one non-voting ex-officio member from the OPUC. As board openings arise, the board consults advisory councils, individuals and collaborating organizations to identify candidates with appropriate experience from throughout the state. To allow further diversity, the board expanded its size to 13 voting members. The 2014 board included voting members with background in business (agriculture, industry/ manufacturing, construction/remodeling, restaurant), private consulting, nonprofit and higher education. Members come from Bend, Coos Bay, Eugene, Medford, Myrtle Creek, Salem and the Portland area. Of the 13 voting members at the end of the year, five were women. The board s OPUC ex-officio member is Commissioner John Savage. The board created an additional non-voting position for an appointee of the Oregon Department of Energy. Lisa Schwartz, Oregon Department of Energy director, occupied this special advisor position through April Warren Cook, Oregon Department of Energy energy conservation manager, occupied this special advisor position beginning in May Annual Report to OPUC & Board of Directors Page 53 of 75 April 15, 2015
54 All new members participate in an orientation session and are provided handbooks containing historical information, policies, plans, budgets and program descriptions. The majority of board members also attend advisory councils and participate on board committees. All regular board and advisory council meetings and background information are public. Advisory council and board meetings are well attended, and public comment is included in every meeting. All regular board members complete and sign disclosure of economic interest forms each year. The OPUC ex-officio board member and the special advisor from the Oregon Department of Energy do not receive confidential information. Once each year, board and staff members participate in a planning session to review progress and discuss Energy Trust s strategic direction. Board development is a part of this public planning session, if warranted Advisory Council Members and Meetings Conservation Advisory Council Jim Abrahamson, Cascade Natural Gas Brent Barclay, Bonneville Power Administration Jeff Bissonnette, Fair and Clean Energy Coalition Warren Cook, Oregon Department of Energy Bruce Dobbs, Building Owners and Managers Association Joe Esmonde, International Brotherhood of Electrical Workers Wendy Gerlitz, Northwest Energy Coalition Charlie Grist, NW Power and Conservation Council Garrett Harris, Portland General Electric Karen Horkitz, Northwest Energy Efficiency Alliance Scott Inman, Oregon Remodelers Association Andria Jacob, City of Portland Bureau of Planning and Sustainability Juliet Johnson, Oregon Public Utility Commission Don Jones, Jr., PacifiCorp Don MacOdrum, Home Performance Guild of Oregon Holly Meyer, NW Natural Stan Price, Northwest Energy Efficiency Council 2014 Meeting Dates Major Discussion Topics February preliminary annual results; deemed savings calculator; initial discussion of draft Strategic Plan March 12 Northwest Energy Efficiency Alliance; electric avoided costs; gas costeffectiveness docket, UM results and sector trends; preview of draft Strategic Plan; SB April funding limitations for large customers; residential windows market study; gas cost-effectiveness docket, UM 1622 June 18 Pilots and initiatives; 2013 economic impacts report; resource assessment study 2014 Annual Report to OPUC & Board of Directors Page 54 of 75 April 15, 2015
55 July 23 September 3 October 22 November 19 Results through quarter two; 2015 budget concepts; SB 838 funding limitations for large customers; presentation of board-approved draft Strategic Plan; market study for hearths; residential HVAC market study Commercial lighting strategy for 2015; 2015 measure and incentive changes; 2014 true up report Results through quarter three; 2015 annual budget and two-year action plan; 2015 measure and incentive changes Final proposed 2015 annual budget and two-year action plan; SB 838 funding limitations for large customers Renewable Energy Advisory Council Diane Broad, Oregon Department of Energy Jason Busch, Oregon Wave Energy Trust Kari Greer, Pacific Power Robert Grott, Northwest Environmental Business Council Cindy Dolezel, Oregon Public Utility Commission Suzanne Leta-Liou, Atkins Matt Mylet, One Pacific Coast Bank Michael O Brien, Renewable Northwest Elizabeth McNannay, Oregon Solar Energy Industry Association Frank Vignola, Solar Monitoring, University of Oregon Dick Wanderscheid, Bonneville Environmental Foundation Peter Weisberg, The Climate Trust 2014 Meeting Dates Major Discussion Topics February 5 March 12 April 23 July 23 September 3 October 22 November preliminary annual results; 2014 plans by technology; draft Strategic Plan Draft Strategic Plan Draft Strategic Plan; MapDwell: Solar System solar mapping tool; Solar request for proposals; 2013 Project Development Assistance results Results through quarter two; draft Strategic Plan; Solar competitive solicitation for large projects; Old Mill Solar project 2015 budget concepts; hydropower strategic plan Results through quarter three; 2015 annual budget and two-year action plan; EPA 111d 2015 annual budget and two-year action plan; solar competitive solicitation project proposal; solar strategic plan 2014 Annual Report to OPUC & Board of Directors Page 55 of 75 April 15, 2015
56 APPENDIX 8: ENERGY TRUST 2014 ANNUAL REPORT ON ACTIVITIES FOR NW NATURAL IN WASHINGTON I INTRODUCTION, BACKGROUND, OVERSIGHT AND GOALS A. Introduction This report covers 2014, the fifth full year that Energy Trust of Oregon provided services and incentives to residential and commercial customers of NW Natural in Washington. It addresses progress toward annual goals, information on revenues and expenditures, number of completed measures and incentives paid during the year and highlights of program activity. B. Background At the request of NW Natural and following approval granted by the Washington Utilities and Transportation Commission, WUTC, Energy Trust began administering NW Natural s demand-side management programs in southwest Washington on October 1, The first year was viewed as a pilot. Satisfied with results from the pilot year, in 2011 the WUTC approved Energy Trust s continued administration of conservation programs for NW Natural in Washington. C. Oversight The Energy Efficiency Advisory Group, EEAG, was created, at the direction of the WUTC, to provide advice and oversight for NW Natural and Energy Trust energy-efficiency offerings in Washington. The advisory group is comprised of representatives from NW Natural, Energy Trust, WUTC, Washington Public Counsel, Northwest Industrial Gas Users and the Northwest Energy Coalition. D. Goals NW Natural, in collaboration with the EEAG, established performance metrics for This report presents Energy Trust s performance against those goals Annual Report to OPUC & Board of Directors Page 56 of 75 April 15, 2015
57 II. ANNUAL REPORT HIGHLIGHTS A. Summary Gas efficiency measures installed in 2014 by NW Natural s Washington customers saved 253,988 annual therms of natural gas including 152,676 annual therms in Existing Buildings, 45,200 annual therms in Existing Homes and 56,112 annual therms in New Homes. Total 2014 savings were approximately 115 percent of the 2014 conservative goal of 220,868 therms and 98 percent of the 2014 stretch goal of 259,845 therms, as detailed in NW Natural s 2014 Energy Efficiency Plan. In total, savings achieved in 2014 were 15 percent higher than 2013 savings, due to strong results across programs. Engagement with restaurants to promote energy-efficient foodservice equipment bolstered Existing Buildings savings. The Existing Homes program also contributed savings from promotions of furnaces and gas hearths. The rebounding construction market contributed to an increase in New Homes savings. The program spent less than budgeted, largely due to achieving lower-cost savings than expected in the Existing Buildings program Annual Report to OPUC & Board of Directors Page 57 of 75 April 15, 2015
58 B. Washington Utilities and Transportation Commission performance metrics The table below compares 2014 annual results to 2014 goals, as established in NW Natural s Energy Efficiency Plan for Washington (updated December 2013) results compared to goals Metrics Goal 2014 total Q1 Results Q2 Results Q3 Results Q4 Results Therms Saved 220, , ,988 34,786 31,534 36, ,069 Total Program Costs Average Levelized Cost Per Measure Dollars Spent Per Therm Saved $1,298,699 $1,527,881 $1,310,180 $214,349 $230,116 $291,301 $574,415 Less than $0.65 $0.42 $0.527 $0.577 $0.673 $0.311 Less than $6.50 $5.16 $6.16 $7.30 $7.96 $3.80 Total Resource Cost and Utility Costs at Portfolio Level Greater than and 1.1 Reported annually Reported annually Reported annually Reported annually 2014 Utility Cost and Total Resource Cost benefit cost ratios by program Program Utility Cost Test benefit cost ratio Total Resource Cost Test Benefit cost ratio Existing Buildings Existing Homes New Homes Total NW Natural Washington portfolio Total Utility Cost and Total Resource Cost benefit cost ratios Program Utility Cost Test benefit cost ratio Total Resource Cost Test Benefit cost ratio NW Natural Washington Portfolio NW Natural Washington Low Income Total Annual Report to OPUC & Board of Directors Page 58 of 75 April 15, 2015
59 C. Commercial sector highlights Existing Buildings Existing Buildings saved 152,676 annual therms, 2 percent over the stretch goal of 150,000 annual therms in In 2014, Existing Buildings saw strong savings from more than 1,000 efficient showerheads delivered to assisted living facilities, saving 15,000 annual therms and leading to larger custom projects with these facilities. Energy-saving showerheads are left with facility managers when performing energy-efficiency assessments, enabling the program to engage with facility owners to discuss other efficiency opportunities and potential future projects. A small number of custom studies contributed considerable savings in 2014, with approximately one-half of all Existing Buildings savings derived from custom projects. Nine custom projects completed in 2014, saving 72,607 annual therms of natural gas. Bonus incentives for boilers, insulation, custom projects and foodservice equipment supported savings at year-end. Foodservice equipment installed in restaurants provided substantial savings. Existing Buildings created an outreach team to target small- to medium-sized businesses in Washington, resulting in increased savings from these businesses. Existing Buildings coordinated with Clark Public Utilities to ensure customers, contractors and stakeholders were informed of all available energy-saving offerings. The program launched a marketing campaign promoting Existing Buildings as a technical resource for large and small businesses. The campaign promoted availability of support resources through various channels including walk-through audits, website content and Trade Ally Network expertise. The program developed new gas measures to be added in 2015 for multifamily customers and greenhouses. D. Residential sector highlights The residential sector saved 101,312 annual therms in 2014, 15 percent more than savings achieved in Existing Homes Existing Homes saved 45,200 annual therms, 7 percent below the conservative goal of 48,607 annual therms in Successful promotions of heating systems, water heating systems and weatherization upgrades provided long-term energy savings for Washington customers. Spring and fall bonuses for gas fireplaces and furnaces bolstered installations in 2014, with 58 percent more gas fireplaces and 15 percent more gas furnaces installed in 2014 than in The fall gas fireplace bonus was extended through early 2015 and expanded to include higher-tier gas fireplaces with annual fuel utilization efficiency of 95 percent or more. The program instituted incentives for sales staff at Vancouver-area distributors to increase gas furnace sales Annual Report to OPUC & Board of Directors Page 59 of 75 April 15, 2015
60 Instant incentives were paid directly to contractors for water heating and HVAC equipment, enabling customers to receive discounted equipment at time of purchase. This changed shifted the responsibility for submitting incentive applications from customers to trade allies, resulting in a higher rate of completed and qualifying applications, expediting incentive processing and reducing program delivery costs per unit. Existing Homes continued to provide instant rebates for energy-efficient showerheads and clothes washers purchased in stores, in collaboration with Clark Public Utilities and Simple Steps Smart Savings. Instant rebates reduce upfront costs for customers and support a positive customer experience. Existing Homes provided energy- and water-saving products to families at Clark County food banks during the holiday season, in collaboration with Clark Public Utilities. Existing Homes developed an on-bill repayment financing offering to launch in January 2015, in collaboration with NW Natural and Craft3. New Homes New Homes saved 56,112 annual therms, 7 percent more than the stretch goal of 52,660 annual therms in The program provided consultation and outreach to help builders incorporate new Washington State energy code requirements in building designs. To allow builders to receive incentives for energy-efficient new homes that do not receive ENERGY STAR New Home Certification, New Homes designed an alternate method for builders to achieve incentives by building Earth Advantage -certified homes. The program helped verifiers and builders transition from the prescriptive Builder Option Package, BOP, path for achieving ENERGY STAR New Home Certification to the new modeled performance path methodology for achieving ENERGY STAR New Home Certification. A total of 75 projects were submitted and received incentives using the new modeled performance path methodology, representing 30 percent of all New Homes projects. The program evaluated the potential for gas fireplace incentives to influence builders to install more efficient models in new homes. Final data will influence 2015 program strategies. E. Trade Ally Network highlights By year-end, 175 trade allies served Washington, including 74 based in Washington. Energy Trust enrolled 35 new trade allies serving Washington in Though the pool is smaller in 2014, the network is a stronger resource for customers as they can easily find more engaged and active trade allies. Networking events exclusively for Washington trade allies were held for Existing Buildings trade allies in April and for Existing Homes and Existing Buildings trade allies in November. Attendance and engagement at these networking events continued to grow in Annual Report to OPUC & Board of Directors Page 60 of 75 April 15, 2015
61 III. ANNUAL RESULTS A. Activity highlights sites served Q1 Q2 Q3 Q4 Total Existing Commercial School/college retrofits Other commercial retrofits Studies Existing Homes Weatherization (insulation, air and duct sealing and windows) Gas hearths Gas furnaces Water heaters Home Energy Reviews New Homes Builder Option Packages Clothes washers B. Revenues Source Actual annual revenue Budgeted annual revenue NW Natural $ 1,054,355 $ 1,291,102 C. Expenditures Commercial programs Residential programs Administration Total Actual annual expenditures Budgeted annual expenditures Variance Existing Buildings $ 528,358 $ 660,829 $ 132,471 Subtotal $ 528,358 $ 660,829 $ 132,471 Existing Homes $ 387,297 $ 433,675 $ 46,379 New Homes $ 350,865 $ 372,086 $ 21,220 Subtotal $ 738,162 $ 805,761 $ 67,599 $ 43,660 $ 61,491 $ 17,831 $ 1,310,180 $ 1,528,082 $ 217, Annual Report to OPUC & Board of Directors Page 61 of 75 April 15, 2015
62 D. Incentives paid Commercial programs Residential programs Total Actual annual incentives Existing Buildings $ 270,931 Subtotal $ 270,931 Existing Homes $ 145,593 New Homes $ 195,089 Subtotal $ 340,682 $ 611,613 Incentives paid account for just under 55 percent of year-to-date program expense, when total program expense is adjusted down by 15 percent to account for costs that a utility-delivered program would recover through rates. E. Savings Commercial programs Residential programs Total Annual therms saved Annual goal (conservative) Percent achieved $/therm Levelized cost/therm Existing Buildings 152, , % $ Subtotal 152, , % $ Existing Homes 45,200 48,607 93% $ New Homes 56,112 44, % $ Subtotal 101,312 93, % $ , , % $ Annual Report to OPUC & Board of Directors Page 62 of 75 April 15, 2015
63 NW NATURAL APPENDIX 1: 2014 ENERGY EFFICIENCY MEASURE COUNTS AND SAVINGS Table 1: Residential sector measures Category Air sealing Home Energy Reviews Shell insulation Space heating Measure Measures installed Total therms saved Air sealing Blower Door tests 2 0 Air sealing total Home Energy Reviews total 33 0 Ceiling insulation 23 1,856 Floor insulation Wall insulation Duct insulation total 5 62 Shell insulation total 56 3,317 Boilers 1 44 Custom thermostats Furnaces ,730 Gas fireplaces ,872 Space heating total ,968 Tank water heaters Water heating Showerheads 313 3,870 Showerwands Faucet aerators 549 2,610 Water heating total 893 7,267 Windows Windows total 120 4,427 ENERGY STAR new homes ,436 Tankless water heaters New Homes Low-income Energy Saver Kits 82 1,205 Showerheads sold at retail 3,199 27,579 High-efficiency clothes washers 653 2,566 New Homes total 4,191 56,112 Other Other total 1 42 Grand total 5, , Annual Report to OPUC & Board of Directors Page 63 of 75 April 15, 2015
64 Table 2: Commercial sector measures Category Measure Measures installed Total therms saved Foodservice equipment Gas fryers 57 32,433 Convection ovens 5 1,510 Foodservice equipment total 62 33,943 Shell insulation Ceiling insulation 2 5,850 Shell insulation total 2 5,850 Space heating Boilers 4 23,536 Space heating total 4 23,536 Water heating Conventional condensing tanks Showerheads 1,023 15,834 Water heating total 1,025 16,740 Motors Custom variable frequency drive 1 16,579 Motors total 1 16,579 Studies 8 -- Custom Custom building controls 5 38,235 Misc. custom measures 9 17,793 Custom total 22 56,028 Grand total 1, , Annual Report to OPUC & Board of Directors Page 64 of 75 April 15, 2015
65 NW NATURAL APPENDIX 2: CUSTOMER SATISFACTION In 2014, Energy Trust conducted short phone surveys of NW Natural customers in Washington to determine satisfaction with their participation in Energy Trust programs. Results from 100 residential customers and seven commercial customers indicate a generally high level of customer satisfaction. Table 1: NW Natural Washington residential customer satisfaction 2014 Residential (n=100) Dissatisfied Neutral Satisfied Overall satisfaction 1% 10% 88% Incentive application form 3% 8% 89% Turnaround time to receive incentive 8% 12% 81% Energy Trust interviewed seven commercial customers in Most respondents were satisfied with their overall program experience, incentive amount, ease of applying for the incentive and interaction with program representatives. Table 2: NW Natural Washington commercial customer satisfaction 2014 Commercial (n=7) Dissatisfied Neutral Satisfied Overall satisfaction Incentive amount Ease of applying for incentive Interaction with program representative Performance of equipment or system installed 24 Turnaround time to receive incentive Customer satisfaction ratings do not add to seven because one customer responded not applicable 2014 Annual Report to OPUC & Board of Directors Page 65 of 75 April 15, 2015


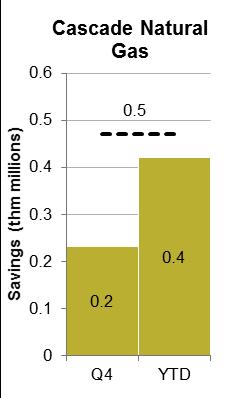


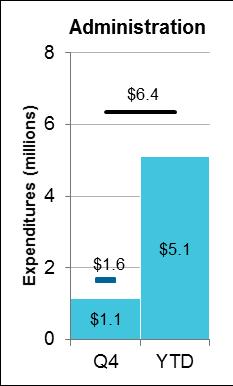

66 APPENDIX 9: QUARTER FOUR RESULTS TABLES I. Q ACTIVITY AT A GLANCE Savings and generation Expenditures 2014 Annual Report to OPUC & Board of Directors Page 66 of 75 April 15, 2015
NEW OPPORTUNITIES AND LASTING BENEFITS
 ANNUAL REPORT 2013 NEW OPPORTUNITIES AND LASTING BENEFITS Serving customers with diverse energy solutions Each year, Energy Trust of Oregon brings the value of energy savings and renewable generation to
Energy Trust of Oregon Strategic Plan
 Energy Trust of Oregon 2015-2019 Strategic Plan October 1, 2014 Introduction Who We Are Energy Trust of Oregon is an independent nonprofit organization dedicated to helping 1.5 million customers of four
ITEM NO. 1 Page/1. August 15, Oregon Public Utility Commission Attn: Kay Barnes and Mark Brown P.O. Box 1088 Salem, OR
 Page/1 August 15, 2014 Oregon Public Utility Commission Attn: Kay Barnes and Mark Brown P.O. Box 1088 Salem, OR 97308-1088 421 SW Oak St., Suite 300 Portland, OR 97204 1.866.368.7878 503.546.6862 fax energytrust.org
ITEM NO. 3 Page/1. November 14, Oregon Public Utility Commission Attn: Kay Barnes and Mark Brown P.O. Box 1088 Salem, OR
 Page/1 November 14, 2014 Oregon Public Utility Commission Attn: Kay Barnes and Mark Brown P.O. Box 1088 Salem, OR 97308-1088 421 SW Oak St., Suite 300 Portland, OR 97204 1.866.368.7878 503.546.6862 fax
2016 Annual Report to the Oregon Public Utility Commission & Energy Trust Board of Directors
 2016 Annual Report to the Oregon Public Utility Commission & Energy Trust Board of Directors ENERGY TRUST OF OREGON APRIL 14, 2017 UPDATED DECEMBER 15, 2017 Page 1 of 73 TABLE OF CONTENTS From the executive
Energy Trust of Oregon comments addressing the Senate Bill 978 process July 10, 2018
 Energy Trust of Oregon comments addressing the Senate Bill 978 process July 10, 2018 Energy Trust participated in the SB 978 process and is pleased to provide informational comments to the Commission.
2015 Third Quarter Colorado DSM Roundtable Update
 ` 2015 Third Quarter Colorado DSM Roundtable Update November 4, 2015 Public Service Company of Colorado ( Public Service or the Company ) provides the following update regarding product status including
2015 Second Quarter Colorado DSM Roundtable Update
 ` 2015 Second Quarter Colorado DSM Roundtable Update August 17, 2015 Public Service Company of Colorado ( Public Service or the Company ) provides the following update regarding product status including
Quarter Three 2018 Report to the Oregon Public Utility Commission & Energy Trust Board of Directors
 Quarter Three 2018 Report to the Oregon Public Utility Commission & Energy Trust Board of Directors ENERGY TRUST OF OREGON NOVEMBER 15, 2018 TABLE OF CONTENTS I Results at a glance 2 II Executive summary
CITY OF ALBANY CITY COUNCIL AGENDA STAFF REPORT. Discussion of Community Choice Aggregation and Recommendation to Join the Marin Energy Authority
 CITY OF ALBANY CITY COUNCIL AGENDA STAFF REPORT Agenda Date: November 18, 2013 Reviewed by: Pat O SUBJECT: REPORT BY: Discussion of Community Choice Aggregation and Recommendation to Join the Marin Energy
Clean Energy Partnership Q3 Board Meeting July 27, 2018
 Clean Energy Partnership Q3 Board Meeting July 27, 2018 1 Agenda 1. Welcome and Introductions 2. Review and Approve Agenda and Q2 Minutes 3. Quarterly Update from EVAC Co-Chairs 4. 2017 Annual Report 5.
Customer Energy Efficiency Solutions
 Customer Energy Efficiency Solutions Our Approach At Xcel Energy, we are empowering customers with energy solutions that give them more control over their energy use and their monthly energy bills. Our
CenterPoint Energy Arkansas Energy Efficiency Program Portfolio Annual Report 2016 Program Year
 CenterPoint Energy Arkansas Energy Efficiency Program Portfolio Annual Report 2016 Program Year Filed: May 1, 2017 2016 ANNUAL REPORT CENTERPOINT ARKANSAS, DOCKET NO. 07-081-TF Contents 1.0 Executive Summary...
Energy Efficiency Solutions for Multifamily Housing. Clark Energy Group LLC
 Energy Efficiency Solutions for Multifamily Housing Clark Energy Group LLC 1 Agenda About Clark Energy Group Energy Service Company (ESCO) Overview ESCO Services Utility Rate Forecasts Making the Decision
Actual Expenditures, Last Three Budgets, include funding sources:
 Actual Expenditures, Last Three Budgets, include funding sources: Actual Expenditures: 2011-13: $597,987 2013-15: $652,815 2015-17 (projected): $725,099 Funding Sources: Energy Supplier Assessment & US
Energy Trust of Oregon Testimony before the Oregon Legislature Joint Committee on Tax Credits
 June 2, 2017 Energy Trust of Oregon Testimony before the Oregon Legislature Joint Committee on Tax Credits 421 SW Oak St., Suite 300 Portland, OR 97204 1.866.368.7878 503.546.6862 fax energytrust.org Good
PacifiCorp Annual Review of DSM Programs California
 PacifiCorp 2009 Annual Review of DSM Programs California PacifiCorp Demand Side Management Team 3/15/2010 Table of Contents Introduction... 2 2009 Performance and Activity... 3 Stakeholder Meetings, Communications
Quarterly Performance Report» Q4 2017
 Quarterly Performance Report» Q4 2017 A Note from the Executive Director The fourth quarter of 2017 concluded a busy and productive year for the alliance. Highlights from 2017 include strong market progress
2016 Second Quarter Colorado DSM Roundtable Update
 2016 Second Quarter Colorado DSM Roundtable Update August 17, 2016 Public Service Company of Colorado ( Public Service or the Company ) provides the following update regarding product status including
EFFICIENCY MAINE TRUST
 EFFICIENCY MAINE TRUST CLICK TO EDIT MASTER TITLE STYLE DELIVERING MAINE S LOWEST COST ENERGY RESOURCE MICHAEL STODDARD, EXECUTIVE DIRECTOR DANA FISCHER, RESIDENTIAL PROGRAM MANAGER THE ISLAND INSTITUTE
2017 True Up Report Corrections of Savings and Generation
 2017 True Up Report Corrections of 2002-2016 Savings and Generation Introduction True up is the annual process used to adjust and correct previous years energy savings and renewable generation to reflect
Exhibit A Program Descriptions, Historical Changes and Proposed Changes
 Exhibit A Program Descriptions, Historical Changes and Proposed Changes Exhibit A Program Descriptions, Historical Changes and Changes Reflected in Forecasts Home Energy Savings The Home Energy Savings
Rebecca Blanton, Senior Market Analyst, Puget Sound Energy; Bob Stolarski, Director Customer Energy Manager, Puget Sound Energy;
 Memorandum April 5, 2017 TO: FROM: CC: SUBJECT: Rebecca Blanton, Senior Market Analyst, Puget Sound Energy; Bob Stolarski, Director Customer Energy Manager, Puget Sound Energy; Christina Steinhoff, Planning
Strategic Plan Dashboard Year 3
 2015-2019 Strategic Plan Dashboard Year 3 May 17-18, 2018 This dashboard provides highlights and progress indicators on achievement to the 2015-2019 Strategic Plan goals and strategies. This is not a complete
Solar Photovoltaic Volumetric Incentive Program 2015 Report to the Legislative Assembly
 Solar Photovoltaic Volumetric Incentive Program 2015 Report to the Legislative Assembly Prepared by: Oregon Public Utility Commission January 1, 2015 Table of Contents Executive Summary... 2 Background...
Colorado PUC E-Filings System. Demand-Side Management Annual Status Report Electric and Natural Gas Public Service Company of Colorado
 Colorado PUC E-Filings System Demand-Side Management Annual Status Report Electric and Natural Gas Public Service Company of Colorado March 31, 2017 / Proceeding No. 14A-1057EG 2016 xcelenergy.com 2017
Energy Trust of Oregon Energy Efficiency Resource Assessment Overview and Considerations for Improvements September 22, 2017
 Energy Trust of Oregon Energy Efficiency Resource Assessment Overview and Considerations for Improvements September 22, 2017 Agenda Purpose and background Modeling Process Considerations for improvements
Re: UM 1622: Report to Commission Staff regarding to Energy Trust of Oregon Request for Approval of Exceptions to Cost-Effectiveness Guidelines
 July 1, 2014 Via Electronic Mail Oregon Public Utility Commission Attn: Filing Center 3930 Fairview Industrial Drive SE PO Box 1088 Salem, Oregon 97308 421 SW Oak St., Suite 300 Portland, OR 97204 1.866.368.7878
Quarterly Performance Report» Q2 2018
 Quarterly Performance Report» Q2 2018 A Note from the Executive Director The second quarter of 2018 saw the addition of a new program to the alliance s portfolio and a great deal of effort by both staff
Ameren Illinois Energy Efficiency Programs and Incentives. Helping public sector buildings and communities save energy and money.
 Ameren Illinois Energy Efficiency Programs and Incentives Helping public sector buildings and communities save energy and money. 1 Why Energy Efficiency? Save money Reduce environmental impact Increase
2018 Operations Plan. Electric and Natural Gas
 2018 Operations Plan Electric and Natural Gas Table of Contents Executive Overview....pg. 3 Electric Operations Plan...pg. 10 Electric Financials...pg. 35 Natural Gas Operations Plan...pg. 44 Natural Gas
CenterPoint Energy Energy Efficiency Program Portfolio Annual Report 2014 Program Year
 CenterPoint Energy Energy Efficiency Program Portfolio Annual Report 2014 Program Year Filed: March 31, 2015 2014 ANNUAL REPORT CENTERPOINT ARKANSAS, DOCKET NO. 07-081-TF APSC FILED Time: 3/31/2015 9:17:40
NEEC Member Industry Webinar Series
 NEEC Member Industry Webinar Series Welcome the webinar will begin momentarily A Conversation with Margie Harris Margie Harris, Executive Director Energy Trust of Oregon Webinar audio: 877-594-8353 pass
Energy Trust Electric and Gas Avoided Cost Update for Oregon for 2018 Measure and Program Planning
 Energy Trust Electric and Gas Avoided Cost Update for Oregon for 2018 Measure and Program Planning August 8, 2017 Energy Trust s estimates of future electric and gas avoided costs are critical assumptions
CenterPoint Oklahoma Demand Programs Annual Report 2016
 CenterPoint Oklahoma Demand Programs Annual Report 2016 March 31, 2017 Executive Summary... 1 165:45-23-7(c)(1): Demand Programs by Category... 5 165:45-23-7(c)(2): Programs and Date Started... 6 165:45-23-7(c)(3):
Spring Trade Ally Forums April 2018
 Spring Trade Ally Forums April 2018 Energy Trust Highlights Spring Trade Ally Forums April 2018 2017 Accomplishments: Statewide 64.3 amw saved Most savings to date 6.8 million annual therms saved Ties
March 31, Brian Hitson Integrated Demand Side Management Pacific Gas and Electric Company
 PG&E s Energy Efficiency Programs March 31, 2011 Brian Hitson Integrated Demand Side Management Pacific Gas and Electric Company Cost-Effective Energy Efficiency is the Lowest- Cost Resource Cost-effective
2011 Annual Report on Conservation Acquisition - Washington
 Pacific Power 2011 Annual Report on Conservation Acquisition - Washington Revised 9/18/12 1 Table of Contents Introduction... 4 Advisory Group Meetings and Communications... 5 Demand-side Management Filings...
CenterPoint Energy Energy Efficiency Program Portfolio Annual Report 2013 Program Year
 CenterPoint Energy Energy Efficiency Program Portfolio Annual Report 2013 Program Year Filed: April 1, 2014 2013 ANNUAL REPORT CENTERPOINT ARKANSAS, DOCKET NO. 07-081-TF APSC FILED Time: 4/1/2014 8:52:35
Discover building efficiency solutions
 Projects & Incentives Projects we serve: Commercial new construction Renovations Tenant build-outs Building additions LEED ENERGY STAR What we offer: Incentives for the design and construction of energy-efficient
Portfolios in a Maturing Energy
 Designing and Evaluating DSM Portfolios in a Maturing Energy Efficiency i Market Valerie Richardson January 28, 2009 1 Introduction The growing interest in climate change and saving energy has accelerated
Electric Association Annual Conference January 25, 2018
 Electric Association Annual Conference January 25, 2018 Teri Lewand CEM, LEED AP ComEd, Business Programs Mgr. C O N F I D E N T I A L Origin of Energy Efficiency Programs Illinois energy legislation passed
PacifiCorp s Planned Changes to Home Energy Savings Program in Washington Effective for
 PacifiCorp s Planned Changes to Home Energy Savings Program in Washington Effective for 2016-2017 PacifiCorp (Company) is planning to make modifications to the Washington Home Energy Savings program (Program),
Multifamily Energy Program. Program Orientation
 OREGON HOUSING & COMMUNITY SERVICES Multifamily Energy Program Program Orientation Date: January 10, 2018 Presenter: Stephanie Berkland USING GOTOWEBINAR Open and close your control panel Choose audio
Evaluating Costs of Energy Efficiency Programs
 Evaluating Costs of Energy Efficiency Programs South-Central Partnership for Energy Efficiency as a Resource Phil Mihlmester, ICF International August 4, 2014 Outline Introduction to ICF Energy efficiency
Trade Ally Forum January 19-22, 2016
 Trade Ally Forum January 19-22, 2016 2015 Year in Review; Kicking Off 2016 Margie Harris Executive Director Today s presentation 2015 year in review and a look into 2016 Trade ally success and benefits
Oregon ACWA summer meeting
 Oregon ACWA summer meeting Bend, July 24-27 Municipalities and Clean Energy Solutions About us Independent nonprofit Serving 1.6 million customers of Portland General Electric, Pacific Power, NW Natural,
Dan Johnson, Director of Energy Efficiency, Avista Utilities; Ryan Finesilver, DSM Analyst/Planning and Analytics, Avista Utilities
 Memorandum March 30, 2018 TO: FROM: CC: SUBJECT: Dan Johnson, Director of Energy Efficiency, Avista Utilities; Ryan Finesilver, DSM Analyst/Planning and Analytics, Avista Utilities Christina Steinhoff,
Using DSM to Help Meet Clean Air Act Requirements: A Case Study
 Using DSM to Help Meet Clean Air Act Requirements: A Case Study Christopher J. Holmes and Kevin Neal, PSI Energy Steve Nadel, ACEEE Under the Clean Air Act Amendments (CAAA) of 1990, utilities must substantially
Cost-Effectiveness Board Learning Paper
 Cost-Effectiveness Board Learning Paper Prepared by Fred Gordon April 2018 Preface This paper is part of a series that describes a variety of topics identified by the Energy Trust of Oregon s Board of
Energy Policy 2012 Annual Update
 Energy Policy 2012 Annual Update May 2013 Energy Policy 2012 Annual Update May 2013 1.0 Energy Policy Update This report provides an update of 2012 activities and results related to the City of Fort Collins
Stephanie Rider, Senior Manager, NEEA Planning; Susan Hermenet, Director, NEEA Planning, Evaluation & Technology
 Memorandum March 31, 2018 TO: Allegra Hodges, Bonneville Power Administration Energy Efficiency Evaluation Program Manager Brent Barclay, Bonneville Power Administration Energy Efficiency Programs Manager;
Table 10.1 DRAFT IRP Action Plan
 Table 10.1 DRAFT IRP Plan Item 1. Renewable Resource s 1a. Wind Integration Update the wind integration study for the 2015 IRP. The updated wind integration study will consider the implications of an energy
Executive Summary of the 2015 Resource Management Plan Results:
 To: From: Board of Commissioners Jenna Smith, Resource Conservation Manager Date: November 21, 2016 Re: and Resolution 5548 to approve the implementation of the 2017-2021 Environmental Sustainability Plan
Energy Efficient, Green Building Incentives and Rebates
 2009 Energy Efficient, Green Building Incentives and Rebates Offering an outline to potential savings through rebates and incentives for new, energy efficient homes built 2009 in Western Washington AIKI
WE ENVISION A HIGH QUALITY OF LIFE, A VIBRANT ECONOMY AND A HEALTHY ENVIRONMENT FOR GENERATIONS TO COME, BUILT WITH RENEWABLE ENERGY, EFFICIENT
 2015 ANNUAL REPORT WE ENVISION A HIGH QUALITY OF LIFE, A VIBRANT ECONOMY AND A HEALTHY ENVIRONMENT FOR GENERATIONS TO COME, BUILT WITH RENEWABLE ENERGY, EFFICIENT ENERGY USE AND CONSERVATION. As I wrap
Demand-Side Management Annual Status Report Electric and Natural Gas Public Service Company of Colorado. March 30, 2016/ Proceeding No.
 Demand-Side Management Annual Status Report Electric and Natural Gas Public Service Company of Colorado March 30, 2016/ Proceeding No. 14A-1057EG 2015 xcelenergy.com 2016 Xcel Energy Inc. Xcel Energy is
Getting to Net Zero Energy and Water Use and Beyond In Existing Multifamily Buildings
 Building Bridges to Net Zero Getting to Net Zero Energy and Water Use and Beyond In Existing Multifamily Buildings Amy Dryden October 29, 2015 1 1 Agenda Framework for Thinking about ZNE, ZNW, ZNC Amy
Massachusetts Residential Multi-Family Retrofit Program Affordable Comfort October 7, 2010
 Massachusetts Residential Multi-Family Retrofit Program Affordable Comfort October 7, 2010 Beth Lonergan, National Grid Kara Gray, Columbia Gas of Massachusetts Vin Graziano, RISE Engineering Objectives
Brendan O Donnell, Seattle City Light, Energy Planning Analyst; Michael Little, Seattle City Light, Energy Planning Supervisor
 Memorandum March 31, 2018 TO: CC: FROM: Brendan O Donnell, Seattle City Light, Energy Planning Analyst; Michael Little, Seattle City Light, Energy Planning Supervisor Stephanie Rider, Senior Manager, NEEA
Second Quarter 2013 Performance
 Second Quarter 2013 Performance Presentation to the EEAC by the PAs August 22, 2013 Quantitative Review Second Quarter Statewide Overview Electric and gas annual savings are at 25% and 26% of goal, respectively
Strategic Plan and Proposed FY18 Program Changes
 Strategic Plan and Proposed FY18 Program Changes EE Committee Meeting April 11, 2017 Presented by TRC Team 1 2 Themes from Strategic Plan Stakeholder Process Make it easier to participate Provide more
Your Path to Energy Savings. New Residential Construction
 Your Path to Energy Savings New Residential Construction Maggie Dimitrova March 1 st, 2011 Agenda PG&E s Integrated Approach California Energy Efficiency Standards Energy Efficiency Incentive Programs
The Future Energy Jobs Act. Will Baker Midwest Energy Efficiency Alliance
 The Future Energy Jobs Act Will Baker Midwest Energy Efficiency Alliance MEEA The Trusted Source on Energy Efficiency We are a nonprofit membership organization with 160+ members, including:»utilities»research
Integrated Resource Plan NOVEMBER EXECUTIVE SUMMARY
 Integrated Resource Plan NOVEMBER 2016 - EXECUTIVE SUMMARY Our goal is to be our customers trusted energy partner, meeting their need for safe, reliable, affordable electricity at home and in their businesses
GreenStep Cities Workshop Xcel Energy Rebates: Commercial Program Overview
 GreenStep Cities Workshop Xcel Energy Rebates: Commercial Program Overview Mike Meyers, Xcel Energy Commitment from Leadership Our energy conservation programs are especially valuable because they give
Energy Efficiency Resource Assessment Report
 Energy Efficiency Resource Assessment Report Prepared for: Energy Trust of Oregon Prepared by: Surya Swamy Angie Lee James Milford Mahima Gupta Cory Welch Floyd Keneipp Navigant Consulting, Inc. 1375 Walnut
Also attached is a spreadsheet providing additional detail about NEEA s savings calculations.
 Memorandum March 31, 2018 TO: CC: FROM: Nicole Moreland, Snohomish County PUD, Manager of Business Operations; Daniel Liska, Snohomish County PUD, Senior Utility Analyst; Michael Coe, Snohomish County
Financing Clean Energy in Your City: The Potential for Urban Green Banks in the U.S.
 Financing Clean Energy in Your City: The Potential for Urban Green Banks in the U.S. January 17, 2018 Welcome! - Overwhelming response! - Thank you for your time and interest - A few tips on how to maximize
Final Report 2011 Energy Trust Trade Ally Survey
 Final Report 2011 Energy Trust Trade Ally Survey Prepared For: Energy Trust of Oregon Prepared By: Jane S. Peters, Ph.D. Ryan E. Bliss, Nathaniel Albers, Hale Forster Research Into Action, Inc. 8 June
2012 New Buildings Program Impact Evaluation
 2012 New Buildings Program Impact Evaluation April 26, 2015 Energy Trust of Oregon 421 SW Oak Street, Suite 300 Portland, OR 97204 This page left blank. Prepared by: Brad Jones Jennifer Huckett, Ph.D.
July 7, Charlie Grist, Tom Eckman, Tina Jayaweera, Kevin Smit. SUBJECT: Model Conservation Standards for the Seventh Power Plan
 Phil Rockefeller Chair Washington Tom Karier Washington Henry Lorenzen Oregon Bill Bradbury Oregon W. Bill Booth Vice Chair Idaho James Yost Idaho Pat Smith Montana Jennifer Anders Montana July 7, 2015
UM, Idaho Power Company s Request for Cost-Effective Exceptions for Specific Demand-Side Management Electric Measures and Programs
 Lisa D. Nordstrom Lead Counsel lnordstrom@idahopower.com November 4, 2014 Attention: Filing Center Public Utility Commission of Oregon 550 Capitol Street NE, Suite 215 P. O. Box 2148 Salem, OR 97308-2148
PUCO STAFF KRISTIN BRAUN
 Energy Efficiency i Overview October, 2012 PUCO STAFF KRISTIN BRAUN (KRISTIN.BRAUN@PUC.STATE.OH.US) Disclaimer These comments are on behalf of Staff and These comments are on behalf of Staff and should
Conservation Ordinance. Mayors Innovation Project Conference Washington, DC January 25, 2008
 Berkeley s Residential Energy Conservation Ordinance Mayors Innovation Project Conference Washington, DC January 25, 2008 Purpose RECO Basics Improve the efficiency of housing stock at the point of sale
2017 Goal. 1) Multifamily Water Use: Gallons/ Person/Day (GPD) 46.6 GPD 46.2 GPD 101% 4) Solar energy capacity: Kilowatts (kw) kw 99.
 Multifamily Water Use: Gallons/ Person/Day (GPD) 46.6 GPD 46.2 GPD 101% 4) Solar energy capacity: Kilowatts (kw) kw 99.") To: From: Board of Commissioners Jenna Smith, Resource Conservation Manager Date: September 18, 2018 Re: - 2017 Results 2017 marked the completion of the first year of the (ESP), adopted by the Board on
To: From: Board of Commissioners Jenna Smith, Resource Conservation Manager Date: September 18, 2018 Re: - 2017 Results 2017 marked the completion of the first year of the (ESP), adopted by the Board on
Bringing Energy Efficiency to Customers
 Bringing Energy Efficiency to Customers 1 Today s Presentation History and purpose of supplemental funding Cycle of implementation How we coordinate 2016 Savings PGE activities Pacific Power activities
Oregon Businesses Saving Energy
 Oregon Businesses Saving Energy ODOE tax credit programs support Oregon businesses, public agencies, and nonprofits. The s incentives program offers tax credits to Oregon businesses, public agencies, and
CURRENT ENERGY EFFICIENCY MARKET CONDITIONS AND THE POTENTIAL FOR TRANSFORMATION
 CURRENT ENERGY EFFICIENCY MARKET CONDITIONS AND THE POTENTIAL FOR TRANSFORMATION SUMMARY OF PROGRAM LOGIC, CURRENT MARKET CONDITION/TRENDS AND OPPORTUNITIES FOR PROGRAM ENHANCEMENT MAY 25, 2016 1 LADWP
Fall Trade Ally Forums October 2018
 Fall Trade Ally Forums October 2018 Breakout Topics & Locations Breakout Session A: 9:40 10:40 Fireside Room Energy Code Options: Making it Simple Howard Asch will provide training that gives an overview
Submitted to: Pennsylvania Public Utility Commission
 PECO Exhibit No. 1 PECO PROGRAM YEARS 2016-2020 ACT 129 - PHASE III ENERGY EFFICIENCY AND CONSERVATION PLAN Submitted to: Pennsylvania Public Utility Commission Submitted by: November 30, 2015 Table of
Methodology for Estimating Energy Efficiency Savings in the Northwest
 Methodology for Estimating Energy Efficiency Savings in the Northwest Draft White Paper for Public Comment August 2018 Council Document #2018-11 1 Executive Summary Every five years the Northwest Power
ES. EXECUTIVE SUMMARY FOR RESIDENTIAL MULTI-FAMILY PROGRAM AREA (R5)
") ES. EXECUTIVE SUMMARY FOR RESIDENTIAL MULTI-FAMILY PROGRAM AREA (R5) ES.1 INTRODUCTION This volume presents results of a comparative analysis of residential multi-family comprehensive programs included
ES. EXECUTIVE SUMMARY FOR RESIDENTIAL MULTI-FAMILY PROGRAM AREA (R5) ES.1 INTRODUCTION This volume presents results of a comparative analysis of residential multi-family comprehensive programs included
Quarter Four 2009 Report to the Oregon Public Utility Commission October 1, 2009, through December 31, 2009
 Quarter Four 2009 Report to the Oregon Public Utility Commission October 1, 2009, through December 31, 2009 This Energy Trust of Oregon quarterly report covers the period 10/1/09 through 12/31/09, the
Energy Trust Board of Directors Strategic Planning Workshop May 17 18, 2018
 Energy Trust Board of Directors Strategic Planning Workshop May 17 18, 2018 421 SW Oak Street, Suite 300 Portland, OR 97204 1.866.368.7878 503.546.6862 fax energytrust.org Agenda Annual Board Strategic
Energy Efficiency Committee Meeting May 18, NJCleanEnergy.com
 Energy Efficiency Committee Meeting May 18, 2018 Proposed FY19 Program Changes TWO-PART FILING Part 1 Changes to existing suite of programs Part 2 Roll-out of new program designs PART 1 Changes to programs
Strategic Plan. Renewable Energy. July 23, 2014
 Strategic Plan Renewable Energy July 23, 2014 What we re going to do Quick background Goals Strategies Feedback and comments from you Long-term renewable energy goal Accelerate the pace at which new, small
Inland Power & Light. Conservation Potential Assessment. Final Report. November 14, Prepared by:
 Inland Power & Light Conservation Potential Assessment Final Report November 14, 2017 Prepared by: 570 Kirkland Way, Suite 100 Kirkland, Washington 98033 A registered professional engineering corporation
EXECUTIVE SUMMARY NEEA 2018 OPERATIONS PLAN 2018 ELECTRIC OPERATIONS PLAN SUMMARY
 NEEA 2018 OPERATIONS PLAN EXECUTIVE SUMMARY This is an executive summary of NEEA s 2018 Electric and Natural Gas Operations Plans. NEEA would like to thank members of its advisory committees and the NEEA
5.2 Commercial and Industrial Prescriptive Program
 5.2 Commercial and Industrial Prescriptive Program 5.2.1 Overview The C&I Prescriptive Program provides C&I customers access to financial incentives and technical support for the installation of energy-efficient
THE PATH TO A. decarbonized energy economy
 THE PATH TO A decarbonized energy economy Today, carbon dioxide and other greenhouse gases (GHGs) are causing global temperatures to rise, leading to potentially devastating effects for the entire planet.
PECO Smart Ideas for Your Business
 PECO Smart Ideas for Your Business Agenda PA Act 129 Phase III Overview PECO Smart Ideas for Your Business Commercial & Industrial Solutions PECO Smart Ideas Trade Allies PA Act 129, Phase III PA Act 129
DEMAND-SIDE MANAGEMENT Annual Report
 DEMAND-SIDE MANAGEMENT 2017 Annual Report MARCH 15 2018 SAFE HARBOR STATEMENT This document may contain forward-looking statements, and it is important to note that the future results could differ materially
Energy Trust of Oregon
 Energy Trust of Oregon Diversity, Equity and Inclusion Operations Plan Updated December 14, 2018 Energy Trust is dedicated to helping utility customers in Oregon and Southwest Washington save energy and
Appendix 1 Idaho Cost Effectiveness
 Appendix 1 Idaho Cost Effectiveness 1 Table of Contents Portfolio and Sector Level Cost Effectiveness... 3 Program Level Cost Effectiveness... 8 Home Energy Savers Program... 8 Refrigerator Recycling (See
Implementing Pennsylvania Act 129 A Rebirth of Energy Efficiency at PECO
 Implementing Pennsylvania Act 129 A Rebirth of Energy Efficiency at PECO Frank Jiruska, PECO Greg Wikler, Global Energy Partners ACEEE 5 th National Conference on Energy Efficiency as a Resource Chicago,
APPENDIX N: DIRECT USE OF NATURAL GAS
 Seventh Northwest Conservation and Electric Power Plan APPENDIX N: DIRECT USE OF NATURAL GAS Contents Economic Fuel Choices from Consumer s Perspective... 2 Background... 2 Findings from the Sixth Plan
APPENDIX N: DIRECT USE OF NATURAL GAS
 Seventh Northwest Conservation and Electric Power Plan APPENDIX N: DIRECT USE OF NATURAL GAS Contents Economic Fuel Choices from Consumer s Perspective... 2 Background... 2 Findings from the Sixth Plan
Working Together: Electric and Gas Utilities Partner for Efficiency
 Working Together: Electric and Gas Utilities Partner for Efficiency Sheri Borrelli The United Illuminating Company September 24, 2013 Presented at the 2013 ACEEE National Conference on Energy Efficiency
2009 Power Smart Plan
 2009 Power Smart Plan July 2009 *Manitoba Hydro is a licensee of the Official Mark Executive Summary The 2009 Power Smart Plan forecasts Manitoba Hydro s costs and savings to the benchmark year of 2024/25