Mercury Study Report to Congress
|
|
|
- Clinton Johnson
- 6 years ago
- Views:
Transcription
1 United States Environmental Protection Agency EPA-452/R December 1997 Air Mercury Study Report to Congress Volume VI: An Ecological Assessment for Anthropogenic Mercury Emissions in the United States Office of Air Quality Planning & Standards and Office of Research and Development c7o
2 MERCURY STUDY REPORT TO CONGRESS VOLUME VI: AN ECOLOGICAL ASSESSMENT FOR ANTHROPOGENIC MERCURY EMISSIONS IN THE UNITED STATES December 1997 Office of Air Quality Planning and Standards and Office of Research and Development U.S. Environmental Protection Agency
3 TABLE OF CONTENTS Page U.S. EPA AUTHORS...iv SCIENTIFIC PEER REVIEWERS... v WORK GROUP AND U.S. EPA/ORD REVIEWERS...viii LIST OF TABLES...ix LIST OF FIGURES... x LIST OF SYMBOLS, UNITS AND ACRONYMS...xi EXECUTIVE SUMMARY... ES-1 1. INTRODUCTION PROBLEM FORMULATION Stressor Characteristics: Mercury Speciation and Cycling Mercury in Air Mercury in Surface Water Mercury in Soil Potential Exposure Pathways Exposure Pathways in Aquatic Systems Exposure Pathways in Terrestrial Systems Summary of Aquatic and Terrestrial Exposure Pathways Ecological Effects Bioaccumulation of Mercury Individual Effects Population Effects Communities and Ecosystems Conclusions Ecosystems Potentially at Risk Highly Exposed Areas Lakes and Streams Impacted by Acid Deposition Dissolved Organic Carbon Factors in Addition to ph and DOC that Contribute to Increased Bioaccumulation of Mercury in Aquatic Biota Sensitive Species Endpoint Selection Conceptual Model for Mercury Fate and Effects in the Environment Analysis Plan EXPOSURE OF PISCIVOROUS AVIAN AND MAMMALIAN WILDLIFE TO AIRBORNE MERCURY Objectives and Approach Description of Computer Models Current Exposure of Piscivorous Wildlife to Mercury Regional-Scale Exposure Estimates Predicted Current Mercury Exposure Across the Continental U.S i
4 3.4.2 Locations of Socially Valued Environmental Resources Airborne Deposition Overlay with Threatened and Endangered Plants Regions of High Mercury Deposition Regions of High Mercury Deposition Overlay with the Distribution of Acid Surface Waters Regions of High Mercury Deposition Overlays with Wildlife Species Distribution Maps Modeling Exposures Near Mercury Emissions Sources Estimates of Background Mercury Hypothetical Wildlife Exposure Scenarios Predicted Mercury Exposure Around Emissions Sources Results of Hypothetical Exposure Scenarios Issues Related to Combining Models to Assess Environmental Fate of Mercury and Exposures to Wildlife EFFECTS OF MERCURY ON AVIAN AND MAMMALIAN WILDLIFE Mechanism of Toxicity Toxicity Tests with Avian Wildlife Species Toxicity Tests with Mammalian Wildlife Species Tissue Mercury Residues Corresponding to Adverse Effects Factors Relevant to the Interpretation and Use of Mercury Toxicity Data Combined Effects of Mercury and Other Chemical Stressors ASSESSMENT OF THE RISK POSED BY AIRBORNE MERCURY EMISSIONS TO PISCIVOROUS AVIAN AND MAMMALIAN WILDLIFE Scope of the Assessment Summary of Relevant Risk Assessment Methodologies Review of Published Efforts to Estimate the Risk of Mercury to Wildlife Risk of Mercury to Bald Eagles in the Great Lakes Region Risk of Mercury to Bald Eagles in Michigan Risk of Mercury to Loons in Central Ontario Risk of Mercury to Mink in Georgia, North Carolina, and South Carolina Risk of Mercury to Mink in Michigan Risk of Mercury to Great Egrets in south Florida Calculation of a Criterion Value for Protection of Piscivorous Wildlife Procedure Used to Develop Criterion Values for Wildlife in the Water Quality Guidance for the Great Lakes System Bioaccumulation Factors (BAFs) for Magnification of Methylmercury in Aquatic Food Chains Exposure Parameters Summary of Health Endpoints for Avian and Mammalian Wildlife Calculation of Wildlife Criterion Values Calculation of Mercury Residues in Fish Corresponding to the Wildlife Criterion Value Calculation of the Wildlife Criterion Value for Total Mercury in Water Calculation of a Wildlife Criterion for the Florida Panther Comparison of GLWQI Criteria with WC Derived in this Report Uncertainty Analysis ii
5 Sensitivity Analysis Uncertainties Associated with the Wildlife Criteria Methodology Risk of Mercury from Airborne Emissions to Piscivorous Avian and Mammalian Wildlife Lines of Evidence Risk Statements CONCLUSIONS RESEARCH NEEDS Process-based Research Wildlife Toxicity Data Improved Analytical Methods Complexity of Aquatic Food Webs Accumulation in Trophic Levels 1 and Field Residue Data Natural History Data REFERENCES iii
6 U.S. EPA AUTHORS Principal Author: John W. Nichols, Ph.D. Mid-Continent Ecology Division Office of Research and Development Duluth, MN Contributing Authors: Robert B. Ambrose, Jr., P.E. Ecosystems Research Division National Exposure Research Laboratory Athens, GA Chris Cubbison, Ph.D. National Center for Environmental Assessment- Cincinnati Office of Research and Development Cincinnati, OH Anne Fairbrother, Ph.D., D.V.M. Environmental Research Laboratory-Corvallis Corvallis, OR Rita Schoeny, Ph.D. National Center for Environmental Assessment- Cincinnati Office of Research and Development Cincinnati, OH currently with: Ecological Planning and Toxicology, Inc S.W. Hout St. Corvallis, OR Martha H. Keating Office of Air Quality Planning and Standards Research Triangle Park, NC Kathryn R. Mahaffey, Ph.D. National Center for Environmental Assessment- Cincinnati Office of Research and Development Cincinnati, OH Debdas Mukerjee, Ph.D. National Center for Environmental Assessment- Cincinnati Office of Research and Development Cincinnati, OH Glenn E. Rice National Center for Environmental Assessment- Cincinnati Office of Research and Development Cincinnati, OH David J. Reisman National Center for Environmental Assessment- Cincinnati Office of Research and Development Cincinnati, OH Jeff Swartout National Center for Environmental Assessment- Cincinnati Office of Research and Development Cincinnati, OH Michael Troyer Office of Science, Planning and Regulatory Evaluation Cincinnati, OH iv
7 SCIENTIFIC PEER REVIEWERS Dr. William J. Adams* Kennecott Utah Corporation Dr. Brian J. Allee Harza Northwest, Incorporated Dr. Thomas D. Atkeson Florida Department of Environmental Protection Dr. Donald G. Barnes* U.S. EPA Science Advisory Board Dr. Steven M. Bartell SENES Oak Ridge, Inc. Dr. David Bellinger* Children s Hospital, Boston Dr. Nicolas Bloom* Frontier Geosciences, Inc. Dr. Mike Bolger U.S. Food and Drug Administration Dr. Peter Botros U.S. Department of Energy Federal Energy Technology Center Thomas D. Brown U.S. Department of Energy Federal Energy Technology Center Dr. Dallas Burtraw* Resources for the Future Dr. Thomas Burbacher* University of Washington Seattle Dr. James P. Butler University of Chicago Argonne National Laboratory Elizabeth Campbell U.S. Department of Energy Policy Office, Washington D.C. Dr. Rick Canady Agency for Toxic Substances and Disease Registry Dr. Rufus Chaney U.S. Department of Agriculture Dr. Joan Daisey* Lawrence Berkeley National Laboratory Dr. John A. Dellinger* Medical College of Wisconsin Dr. Kim N. Dietrich* University of Cincinnati Dr. Tim Eder Great Lakes Natural Resource Center National Wildlife Federation for the States of Michigan and Ohio Dr. Katherine Flegal National Center for Health Statitistics Dr. Lawrence J. Fischer* Michigan State University Dr. William F. Fitzgerald University of Connecticut Avery Point A. Robert Flaak* U.S. EPA Science Advisory Board Dr. Bruce A. Fowler* University of Maryland at Baltimore Dr. Steven G. Gilbert* Biosupport, Inc. v
8 SCIENTIFIC PEER REVIEWERS (continued) Dr. Cynthia C. Gilmour* The Academy of Natural Sciences Dr. Robert Goyer National Institute of Environmental Health Sciences Dr. George Gray Harvard School of Public Health Dr. Terry Haines National Biological Service Dr. Gary Heinz* Patuxent Wildlife Research Center Joann L. Held New Jersey Department of Environmental Protection & Energy Dr. Robert E. Hueter* Mote Marine Laboratory Dr. Harold E. B. Humphrey* Michigan Department of Community Health Dr. James P. Hurley* University of Wisconsin Madison Dr. Joseph L. Jacobson* Wayne State University Dr. Gerald J. Keeler University of Michigan Ann Arbor Dr. Ronald J. Kendall* Clemson University Dr. Lynda P. Knobeloch* Wisconsin Division of Health Dr. Leonard Levin Electric Power Research Institute Dr. Steven E. Lindberg* Oak Ridge National Laboratory Dr. Genevieve M. Matanoski* The Johns Hopkins University Dr. Thomas McKone* University of California Berkeley Dr. Malcolm Meaburn National Oceanic and Atmospheric Administration U.S. Department of Commerce Dr. Michael W. Meyer* Wisconsin Department of Natural Resources Dr. Maria Morandi* University of Texas Science Center at Houston Dr. Paul Mushak PB Associates Harvey Ness U.S. Department of Energy Federal Energy Technology Center Dr. Christopher Newland* Auburn University Dr. Jerome O. Nriagu* The University of Michigan Ann Arbor William O Dowd U.S. Department of Energy Federal Energy Technology Center Dr. W. Steven Otwell* University of Florida Gainesville Dr. Jozef M. Pacyna Norwegian Institute for Air Research vi
9 SCIENTIFIC PEER REVIEWERS (continued) Dr. Ruth Patterson Cancer Prevention Research Program Fred Gutchinson Cancer Research Center Dr. Donald Porcella Electric Power Research Institute Dr. Deborah C. Rice* Toxicology Research Center Samuel R. Rondberg* U.S. EPA Science Advisory Board Charles Schmidt U.S. Department of Energy Dr. Pamela Shubat Minnesota Department of Health Dr. Ellen K. Silbergeld* University of Maryland Baltimore Dr. Howard A. Simonin* NYSDEC Aquatic Toxicant Research Unit Dennis Smith U.S. Department of Energy Federal Energy Technology Center Dr. Ann Spacie* Purdue University Dr. Alan H. Stern New Jersey Department of Environmental Protection & Energy Dr. David G. Strimaitis* Earth Tech Dr. Edward B. Swain Minnesota Pollution Control Agency Dr. Valerie Thomas* Princeton University Dr. M. Anthony Verity University of California Los Angeles *With EPA s Science Advisory Board, Mercury Review Subcommitte vii
10 WORK GROUP AND U.S. EPA/ORD REVIEWERS Core Work Group Reviewers: Dan Axelrad, U.S. EPA Office of Policy, Planning and Evaluation Angela Bandemehr, U.S. EPA Region 5 Jim Darr, U.S. EPA Office of Pollution Prevention and Toxic Substances Thomas Gentile, State of New York Department of Environmental Conservation Arnie Kuzmack, U.S. EPA Office of Water David Layland, U.S. EPA Office of Solid Waste and Emergency Response Karen Levy, U.S. EPA Office of Policy Analysis and Review Steve Levy, U.S. EPA Office of Solid Waste and Emergency Response U.S. EPA/ORD Reviewers: Robert Beliles, Ph.D., D.A.B.T. National Center for Environmental Assessment Washington, DC Eletha Brady-Roberts National Center for Environmental Assessment Cincinnati, OH Annie M. Jarabek National Center for Environmental Assessment Research Triangle Park, NC Matthew Lorber National Center for Environmental Assessment Washington, DC Susan Braen Norton National Center for Environmental Assessment Washington, DC Terry Harvey, D.V.M. National Center for Environmental Assessment Cincinnati, OH Lorraine Randecker, U.S. EPA Office of Pollution Prevention and Toxic Substances Joy Taylor, State of Michigan Department of Natural Resources viii
11 LIST OF TABLES ES-1 Percent of Species Range Overlapping with Regions of High Mercury Deposition... ES-3 ES-2 Percentiles of the Methylmercury Bioaccumulation Factor... ES-5 ES-3 Wildlife Criteria for Mercury... ES Examples of Effects of Contaminants on Ecosystem Components Nationwide Average of Mercury Residues in Fish Mercury Residues in Tissues of Piscivorous Birds Mercury Residues in Tissues of Piscivorous Mammals Toxicity Values for Aquatic Plants Mercury Toxicity Increases With Temperature Toxicity Values for Fish and Aquatic Invertebrates Examples of Assessment and Measurement Endpoints Models Used to Predict Mercury Air Concentrations, Deposition Fluxes and Environmental Concentrations Percentiles of the Methylmercury Bioaccumulation Factor Exposure Parameters for Mink, Otter, Kingfisher, Osprey, and Eagle Summary of Sample Calculations of Wildlife Species Methylmercury Exposure from Fish Ingestion, Based on Average Fish Residue Values Inputs to IEM-2M Model for the Two Time Periods Modeled Process Parameters for the Model Plants Considered in the Local Impact Analysis Predicted MHg Exposure to Ecological Receptors for the Eastern Site Predicted MHg Exposure to Ecological Receptors for the Western Site Summary of Methylmercury Bioaccumulation Factors for Trophic Levels 3 and Exposure Parameters for Mink, Otter, Kingfisher, Osprey, and Eagle Species-specific Wildlife Criteria Calculated in the Great Lakes Water Quality Initiative and in the Mercury Study Report to Congress Analysis of LOAEL-to-NOAEL Uncertainty Factor Page ix
12 LIST OF FIGURES 2-1 Cycling of Mercury in Freshwater Lakes Possible Routes of Exposure to Mercury Distribution of Mercury in a Water Body Example Aquatic Food Web Example Terrestrial Food Web Total Anthropogenic Mercury Deposition Major Rivers and Lakes National Resource Lands Threatened and Endangered Plant Species and Anthropogenic Mercury Deposition Regions of High Mercury Deposition Regions of High Mercury Deposition and the Distribution of Acid Surface Waters Kingfisher Range and Regions of High Mercury Deposition Bald Eagle Range and Regions of High Mercury Deposition Osprey Range and Regions of High Mercury Deposition Common Loon Range and Regions of High Mercury Deposition Florida Panther Range and Regions of High Mercury Deposition Mink Range and Regions of High Mercury Deposition River Otter Range and Regions of High Mercury Deposition Configuration of Hypothetical Water Body and Wastershed Relative to Local Source LOAEL-to-NOAEL Ratio Distribution Page x
13 LIST OF SYMBOLS, UNITS AND ACRONYMS BAF Bioaccumulation factor BAF3 Aquatic life bioaccumulation factor for trophic level 3 BAF4 Aquatic life bioaccumulation factor for trophic level 4 BCF Bioconcentration factor BSAF Biota-sediment accumulation factor BMF Biomagnification factor bw Body weight CAA Clean Air Act as Amended in 1990 d Day DDE p,p-dichlorodiphenyldichloroethylene DDT 4,4-Dichlorodiphenyltrichloroethane DOC Dissolved organic carbon F Average daily amount of food consumed A FCM Food chain multiplier FD3 Fraction of the diet derived from trophic level 3 FD4 Fraction of the diet derived from trophic level 4 GAS-ISC3 Short range air dispersion model for mercury GLWQI ha 0 Hg 2+ Hg2 2+ Hg IEM-2M IJC kg L LC50 LD50 LCUB LOAEL m 3 m MCM MDNR mg MHg MWC MWI ng nm NCBP NOAEL PCBs pg ph PPF Great Lakes Water Quality Initiative Hectare Elemental mercury Mercurous ion Mercury II Indirect exposure model for mercury International Joint Commission Kilogram Liter Lethal concentration (for fifty percent of population) Lethal dose (for fifty percent of population) Large coal-fired utility boiler Lowest-observed-adverse-effect level Meter Cubic meter Mercury cycling model Michigan Department of Natural Resources Milligram Methlymercury Municipal waste combustor Medical waste incinerator Nanogram Nanomole National Contaminant Biomonitoring Program No-observed-adverse-effect level Polychlorinated biphenyls Picogram Logarithm of the reciprocal of the hydrogen ion concentration. A measure of acidity Predator-prey factor xi
14 LIST OF SYMBOLS, UNITS AND ACRONYMS (continued) PPF 4 ppm RELMAP SAB sp. UFA UFS UFL U.S. EPA g M W A WC WCf WCi WCs Wt A The observed ratio of the concentration at trophic level 4, divided by the concentration at trophic level 3 parts per million Regional Lagrangian Model of Air Pollution Science Advisory Board Species Uncertainty factor for species extrapolation Uncertainty factor for use of less than lifetime study Uncertainty factor for use of a lowest adverse effect level U.S. Environmental Protection Agency Microgram Micromole Average daily volume of water consumed Wildlife criterion level Final wildlife criterion level Intermediate wildlife criterion level Species-specific wildlife criterion level Average species weight xii
15 EXECUTIVE SUMMARY Section 112(n)(1)(B) of the Clean Air Act (CAA), as amended in 1990, directs the U.S. Environmental Protection Agency (U.S. EPA) to submit to Congress a comprehensive study on emissions of mercury to the air. Volume VI, which addresses the ecological exposure and effects assessment for mercury and mercury compounds, is part of an eight-volume report developed by U.S. EPA in response to this directive. Volume VI is an ecological risk assessment for anthropogenic mercury emissions. It follows the format of the U.S. EPA Framework for Ecological Risk Assessment (U.S. EPA, 1992a), with minor changes as suggested in the draft Proposed Guidelines for Ecological Risk Assessment (U.S. EPA, 1996). The first step in the Framework is the problem formulation phase, wherein the potential ecological impacts of mercury are reviewed. This is followed by the presentation of a conceptual model describing how airborne mercury accumulates in aquatic biota, biomagnifies in aquatic food chains and is consumed by wildlife that eat contaminated fish. Subsequent steps in the assessment include exposure and effects assessments. Exposure and effects information are then considered together in an effort to develop qualitative statements about the risk of airborne mercury emissions to piscivorous avian and mammalian wildlife. An outcome of this effort is a recalculation of the wildlife criterion (WC) value for mercury in aquatic systems. A characterization of the risks to wildlife from anthropogenic mercury emissions is provided in Volume VII of this Report to Congress. Scope of the Assessment The scope of this assessment was limited solely to anthropogenic mercury that is emitted directly to the atmosphere. The origins and extent of these emissions are reviewed in Volume II of this Report. This analysis did not address mercury originating from direct wastewater discharge to water bodies, mining waste or the application of mercurial pesticides. In a number of instances, these and other "point" sources have been related to unacceptably high mercury levels in fish, triggering site-specific fish consumption advisories. Clearly, where such point sources exist, there is a need to address the combined impacts of mercury originating from all sources, including air emissions. Mercury in the Environment Wet deposition is thought to be the primary mechanism by which mercury emitted to the atmosphere is transported to surface waters and land, although dry deposition may also contribute substantially. Once deposited, mercury enters aquatic and terrestrial food chains. Mercury concentrations increase at successively higher trophic levels as a result of bioconcentration, bioaccumulation and biomagnification. Of the various forms of mercury in the environment, methylmercury has the highest potential for bioaccumulation and biomagnification. Predators at the top of these food chains are potentially at risk from consumption of methylmercury in contaminated prey. Based on a review of available information, it was concluded that piscivorous (fish-eating) birds and mammals are particularly at risk from mercury emissions. This risk is likely to be greatest in areas that receive high levels of mercury deposition, although local and regional factors can substantially impact the amount of total mercury that is translocated from watersheds to waterbodies and undergoes chemical transformation to the methylated species. ES-1
16 The assessment endpoint for this ecological risk assessment is the maintenance of self-sustaining wildlife populations. Measurement endpoints include the growth and survival of individual animals, reproductive success, and behavior. Exposure of Piscivorous Wildlife to Mercury Exposure was characterized in a progressive manner, with varying reliance on computer models for mercury deposition and fate. The objective of this analysis was to characterize the extent to which piscivorous wildlife are exposed to mercury originating from airborne emissions. Details on exposure assessment inputs, methods and results can be found in Volumes III and IV of this Report. Three general approaches were used, which are described as follows. 1. Estimation of current average exposure to piscivorous wildlife on a nationwide basis. The first analysis was conducted without computer models. Estimates of current mercury exposure to selected piscivorous wildlife species were calculated as the product of the fish consumption rate and measured mercury concentrations in fish. This analysis was not intended to be a site-specific analysis, but rather to provide national exposure estimates for piscivorous wildlife. This analysis used mean total mercury measurements from two nationwide studies of fish residues and published fish consumption data for the selected wildlife species. The relative ranking of exposure in g/kg bw/d of selected wildlife species was as follows: kingfisher > river otter > loon =osprey = mink > bald eagle. 2. Estimation of mercury deposition on a regional scale (40 km grid) and comparison of these deposition data with species distribution information. The second type of analysis was carried out on a regional scale. A long-range atmospheric transport model (RELMAP) was used in conjunction with the mercury emissions inventory provided in Volume II of this Report to generate predictions of mercury deposition across the continental U.S. Ecosystems subject to high levels of mercury deposition will be more exposed to mercury than ecosystems with lower levels of mercury deposition. The pattern of mercury deposition nationwide, therefore, will influence which ecoregions and ecosystems might be exposed to hazardous levels of mercury. Thus, predictions of mercury deposition were compared with the locations of major lakes and rivers, national resource lands, threatened and endangered plant species and the distributions of selected piscivorous wildlife species. Additionally, mercury deposition data were superimposed onto a map of surface waters impacted by acid deposition, because it has been shown that low ph values are often correlated with high levels of mercury in fish. The extent of overlap of selected species distributions 2 with areas receiving high rates of deposition (>5 µg/m ) was characterized. Avian wildlife considered in this analysis included species that are widely distributed (kingfishers) and narrowly distributed (bald eagles, ospreys, and loons). All the birds selected were piscivores that feed at or near the top of aquatic food chains and are therefore at risk from biomagnified mercury. Two of the mammals selected for this analysis (mink and river otters) are piscivorous and widely distributed. The other mammal selected, the Florida panther, is not widely distributed but is listed as an endangered species. The Florida panther lives in an environment known to be contaminated with mercury and preys upon small mammals (such as raccoons), which may contain high tissue burdens of mercury. Results for each avian and mammalian species are summarized in Table ES-1. ES-2
17 Approximately 29% of the kingfisher's range occurs within regions of high mercury deposition. On a nationwide basis, mercury does not appear to be a threat to this species. However, kingfishers consume more mercury on a body weight basis than any other wildlife species examined. Table ES-1 Percent of Species Range Overlapping with Regions of High Mercury Deposition Species Percent of Range Impacted Although a recovery in the Kingfisher 29% population of bald eagles has resulted in a status upgrade from "endangered" to Bald Eagle 34% "threatened" in five states (Michigan, Osprey 20% Minnesota, Oregon, Washington and Wisconsin), bald eagle populations are Common Loon 40% still depleted throughout much of their Florida Panther 100% historical range. Bald eagles can be found seasonally in large numbers in Mink 35% several geographic locations, but most River Otter 38% of these individuals are transient, and the overall population is still small. Historically, eagle populations in the lower 48 states have been adversely impacted by the effects of bioaccumulative contaminants (primarily DDT and perhaps also PCBs). Approximately 34% of the bald eagle's range overlaps regions of high mercury deposition. Areas of particular concern include the Great Lakes region, the northeastern Atlantic states and south Florida. Nationwide, approximately 20% of the osprey's total range overlaps regions of high mercury deposition; however, a much larger fraction of the osprey's eastern population occurs within these regions. The osprey diet consists almost exclusively of fish. Osprey populations underwent severe declines during the 1950s through the 1970s due to widespread use of DDT and related compounds. Nearly 40% of the loon's range is located in regions of high mercury deposition. Limited data from a study of a mercury point source showed that loon reproductive success was negatively correlated with exposure to mercury in a significant dose-response relationship. In some cases, mercury residues in fish collected from lakes used as loon breeding areas may exceed levels that, on the basis of this point source study, are associated with reproductive impairment. Loons frequently breed in areas that have been adversely impacted by acid deposition. An assessment of mercury s effects on loon populations is complicated by the fact that decreases in surface water ph have been associated with both increased mercury residues in fish and declines in the available forage base. All (100%) of the panther s range falls within an area of high mercury deposition. Mercury levels found in tissues obtained from dead panthers are similar to levels that have been associated with frank toxic effects in other feline species. The State of Florida has taken measures to reduce the risk to panthers posed by mercury. Existing plans include measures to increase the number of deer available as prey in order to reduce the reliance of panthers on raccoons. Raccoons frequently feed at or near the top of aquatic food webs and can accumulate substantial tissue burdens of mercury. An evaluation of the risk posed by mercury to the Florida panther is complicated by the possible impacts of other chemical stressors, habitat loss, and inbreeding. ES-3
18 Approximately 35% of the range of mink habitat coincides with regions of high mercury deposition nationwide. Mink occupy a large geographic area and are common throughout the U.S. Given the opportunity, mink will prey on small mammals and birds. Many subpopulations, however, prey almost exclusively on fish and other aquatic biota. Due to allometric considerations, mink may be exposed to more mercury on a body weight basis than larger piscivorous mammals feeding at higher trophic levels. In several cases, mercury residues in wild-caught mink have been shown to be equal to or greater than levels associated with toxic effects in the laboratory. River otter habitat overlaps regions of high mercury deposition for about 14% of the range for this species. River otters occupy large areas of the U.S., but their population numbers are thought to be declining in both the midwestern and southeastern states. The river otter's diet is almost exclusively of aquatic origins and includes fish (primarily), crayfish, amphibians and aquatic insects. The consumption of large, piscivorous fish puts the river otter at risk from bioaccumulative contaminants including mercury. Like the mink, mercury residues in some wild-caught otters have been shown to be close to, and in some cases greater than, concentrations associated with frank toxic effects. 3. Estimation of mercury exposure on a local scale in areas near emissions point sources. A final analysis was conducted using a local-scale atmospheric fate model (GAS-ISC3), in addition to the long-range transport data and an indirect exposure methodology, to predict mercury concentrations in water and fish under a variety of hypothetical emissions scenarios. GAS-ISC3 simulated mercury deposition originating from model plants representing a range of mercury emissions source classes. The four source categories were selected based on their estimated annual mercury emissions or their potential to be localized point sources of concern. The categories selected were these: municipal waste combustors (MWCs), medical waste incinerators (MWIs), utility boilers, and chloralkali plants. To account for the long-range transport of emitted mercury, the 50th percentile RELMAP atmospheric concentrations and deposition rates were included in the estimates from the local air dispersion model. To account for other sources of mercury, estimates of background concentrations of mercury were also included in this exposure assessment. These data were used to estimate the contributions of different emission source types to mercury exposure of selected wildlife species. It was concluded from this analysis that local emissions sources have the potential to increase significantly the exposure of piscivorous birds and mammals to mercury. Important factors related to local source impacts include quantity of mercury emitted by the source, species and physical form of mercury emitted, and effective stack height. The extent of this local contribution also depends upon watershed characteristics, facility type, local meteorology, and terrain. The exposure of a given wildlife species is also highly dependent upon the fish bioaccumulation factor, the trophic level(s) at which it feeds and the amount of fish consumed per day. Although the accumulation of methylmercury in fish tissues appears to be highly variable across bodies of water, field data were determined to be sufficient to calculate representative means for different trophic levels. The variability can be seen in the distribution of the methylmercury bioaccumulation factors (BAF) for fish in trophic levels 3 and 4. These values, summarized in Table ES-2, are believed to be better estimates of mercury bioaccumulation in natural systems than values derived from laboratory studies. ES-4
19 Table ES-2 Percentiles of the Methylmercury Bioaccumulation Factor Parameter Percentile of Distribution 5th 25th 50th 75th 95th Trophic 3 BAF 4.6 x x x x10 5.4x Trophic 4 BAF 3.3x10 5.0x10 6.8x10 9.2x10 1.4x 10 Effects Assessment for Mercury Due to the broad range and extent of mercury emissions throughout the United States, many potential ecological effects could have been considered. Neither the available data nor existing methodology supported evaluation of all possible effects. The ecosystem effects of mercury are incompletely understood. No applicable studies of the effects of mercury on intact ecosystems were found. The ecological risk assessment for mercury did not, therefore, address effects of mercury on ecosystems, plant and animal communities or species diversity. Effects of methylmercury on fish and other aquatic biota were also not characterized, although there is evidence of adverse impacts on these organisms following point source releases of mercury and in aquatic environments affected by urban runoff. Data on methylmercury effects in wildlife suitable for dose-response assessment are limited to what are termed "individual effects" in the U.S. EPA Framework for Ecological Risk Assessment (U.S. EPA, 1992a). A reference dose (RfD), defined as the chronic NOAEL, was derived for avian species from studies by Heinz (1975, 1976a,b, 1979) in which three generations of mallard ducks (Anas platyrhychos) were dosed with methylmercury dicyandiamide. The lowest dose, 0.5 ppm (78 µg/kg bw/d), resulted in adverse effects on reproduction and behavior and was designated as a chronic LOAEL. A chronic NOAEL was estimated by dividing the chronic LOAEL by a LOAEL-to-NOAEL uncertainty factor of 3. Calculated in this manner, the RfD for avian wildlife species is 26 µg/kg bw/d. The RfD for mammalian species was derived from studies involving subchronic exposures with mink (Wobeser, 1973, 1976a,b), in which animals were dosed with mercury in the form of mercurycontaminated fish. The dose of 0.33 ppm (55 µg/kg bw/d) was selected as the NOAEL for subchronic exposure. As this was less than a lifetime exposure, the subchronic NOAEL was divided by a subchronic-to-chronic uncertainty factor of 3. Calculated in this manner, the RfD for mammalian wildlife species is 18 µg/kg bw/d. Risk Assessment for Mercury Ecological risk assessment methods relevant to chemical effects on wildlife are reviewed. The data needs of these methods vary widely and dictate, to a considerable degree, which methods can be applied to a given situation. Guidance is provided on the risk assessment methods that may be most applicable to airborne mercury emissions, given the nature and extent of currently existing information. Additional guidance is provided by reviewing published assessments for piscivorous species living in the ES-5
20 Great Lakes region, south Florida, central Ontario, and coastal regions of Georgia, South Carolina and North Carolina. The scope of the present Report was intended to be national in scale. It was determined, therefore, that any effort to assess the risk of mercury to a given species living in a defined location would be inappropriate. Instead, an effort was made to compare mercury exposure and effects in a general way using data collected from throughout the country and, in so doing, to develop qualitative statements about risk. Consistent with this broader-scale approach, an effort was made to derive a wildlife criterion (WC) value for mercury that is protective of piscivorous wildlife. This WC is defined as the concentration of mercury in water that, if not exceeded, protects avian and mammalian wildlife populations from adverse effects resulting from ingestion of surface waters and from ingestion of aquatic life taken from these surface waters. The health of wildlife populations may, therefore, be considered the assessment endpoint of concern. Although not generally derived for the purpose of ecological risk assessment, WC values incorporate the same type of exposure and effects information used in more standard approaches. Such calculations also provide for a simple assessment of risk in any given situation; that is, by determining whether the concentration of mercury in water exceeds the criterion value. The principal factors used to select wildlife species for WC development were: (1) exposure to bioaccumulative contaminants; (2) species distributions; (3) availability of information with which to calculate criterion values; and (4) evidence for bioaccumulation and/or adverse effects. All of the species selected feed on or near the top of aquatic food webs. The avian species selected were the bald eagle (Haliaeetus leucocephalus), osprey (Pandion haliaetus), common loon (Gavia immer) and belted kingfisher (Ceryle alcyon). The mammalian species selected were the mink (Mustela vison) and river otter (Lutra canadensis). Because this assessment depends to a large extent on the assignment of BAFs for mercury in fish at trophic levels 3 and 4, an effort was made to review published field data from which these BAFs could be estimated. A Monte Carlo analysis was then performed to characterize the variability around these estimates. The results of this effort are reported in Appendix D of Volume III and are summarized in Table ES-2. A WC value for mercury was estimated as the ratio of an RfD, defined as the chronic NOAEL (in µg/kg bw/d), to an estimated mercury consumption rate, referenced to water concentration using a BAF. Individual wildlife criteria are provided in Table ES-3. This approach is similar to that used in noncancer human health risk assessment and was employed previously to estimate a WC for mercury in the Water Quality Guidance for the Great Lakes System (GLWQI). The present effort differs, however, from that of the GLWQI in that the entire analysis was conducted on a methylmercury basis. Additional differences resulted from the availability of new data, including measured residue levels in fish and water, and a re-evaluation of the toxicity data from which RfD estimates were derived. In this Report, a more sensitive endpoint was selected for mammalian species, with the goal of assessing the full range of effects of mercury. These changes reflect the amount of discretion allowed under Agency Risk Assessment Guidelines. Species-specific WC values for methylmercury were estimated for selected avian and mammalian wildlife (identified above). A final WC was then calculated as the lowest mean of WC ES-6
21 values for each of the two taxonomic classes (birds and mammals). The final WC for methylmercury was based on Table ES-3 Wildlife Criteria for Methylmercury Organism Wildlife Criterion (pg/l) Mink 57 River otter 42 Kingfisher 33 Loon 82 Osprey 82 Bald eagle 100 individual WC values calculated for mammalian species, and was estimated to be 50 picograms (pg) methylmercury/l water. The WC for methylmercury can be expressed as a corresponding mercury residue in fish though the use of appropriate BAFs. Using the BAFs presented in Table ES-2 (50th percentile), a WC of 50 pg/l corresponds to methylmercury concentrations in fish of µg/g and µg/g for trophic levels 3 and 4, respectively. In addition, a WC for total mercury can be calculated using an estimate of methylmercury as a proportion of total mercury in water. Based upon a survey of speciation data, the best current estimate of dissolved methylmercury as a proportion of total dissolved mercury was determined to be Using this value, a methylmercury WC of 50 pg/l corresponds to a total dissolved mercury WC of 641 pg/l. An additional correction is needed if the WC is to be expressed as the amount of total mercury in unfiltered water. The available data, although highly variable, suggest that on average total dissolved mercury comprises about 70 percent of that contained in unfiltered water. Making this final correction results in a WC of 910 pg/l (unfiltered, total mercury), which is approximately 70 percent of the value published previously in the GLWQI. Conclusions The following conclusions are presented in approximate order of degree of certainty in the conclusion, based on the quality of the underlying database. The conclusions progress from those with greater certainty to those with lesser certainty. Mercury emitted to the atmosphere deposits on watersheds and is translocated to waterbodies. A variable proportion of this mercury is transformed by abiotic and biotic chemical reactions to organic derivatives, including methylmercury. Methylmercury bioaccumulates in individual organisms, biomagnifies in aquatic food chains and is the most toxic form of mercury to which wildlife are exposed. ES-7
22 The proportion of total mercury in aquatic biota that exists as methylmercury tends to increase with trophic level. Greater than 90% of the mercury contained in freshwater fish exists as methylmercury. Methylmercury accumulates in fish throughout their lifetime, although changes in concentration as a function of time may be complicated by growth dilution and changing dietary habits. Piscivorous avian and mammalian wildlife are exposed to mercury primarily through consumption of contaminated fish and accumulate mercury to levels above those in prey items. Toxic effects on piscivorous avian and mammalian wildlife due to the consumption of contaminated fish have been observed in association with point source releases of mercury to the environment. Concentrations of mercury in the tissues of wildlife species have been reported at levels associated with adverse health effects in laboratory studies with the same species. Piscivorous birds and mammals receive a greater exposure to mercury than any other known receptors. BAFs for mercury in fish vary widely; however, field data are sufficient to calculate representative means for different trophic levels. These means are believed to be better estimates of mercury bioaccumulation in natural systems than values derived from laboratory studies. The recommended methylmercury BAFs for tropic levels 3 and 4 are 1,600,000 and 6,800,000, respectively (dissolved basis). Based upon knowledge of mercury bioaccumulation in fish, and of feeding rates and the identity of prey items consumed by piscivorous wildlife, it is possible to rank the relative exposure of different piscivorous wildlife species. Of the six wildlife species selected for detailed analysis, the relative ranking of exposure to mercury is this: kingfisher > otter > loon = osprey = mink > bald eagle. Existing data are insufficient to estimate the exposure of the Florida panther relative to that of the selected species. Local emissions sources (<50 km from receptors) have the potential to increase the exposure of piscivorous wildlife well above that due to sources located more than 50 km from the receptors (i.e., "remote" sources). Field data are insufficient to conclude whether the mink, otter or other piscivorous mammals have suffered adverse effects due to airborne mercury emissions. Field data are insufficient to conclude whether the loon, wood stork, great egret, or other piscivorous wading birds have suffered adverse effects due to airborne mercury emissions. Field data are suggestive of adverse toxicological effects in the Florida panther due to mercury. Unfortunately, the interpretation of these data is complicated by the co-occurrence of several other potentially toxic compounds, habitat degradation, and loss of genetic diversity. Field data suggest that bald eagles have not suffered adverse toxic effects due to airborne mercury emissions. ES-8
23 Reference doses (RfDs) for methylmercury, defined as chronic NOAELs, were determined for avian and mammalian wildlife. Each RfD was calculated as the toxic dose (TD) from laboratory toxicity studies, divided by appropriate uncertainty factors. The RfD for avian species is 21 µg/kg bw/d (mercury basis). The RfD for mammalian wildlife is 18 µg/kg bw/d (mercury basis). Based upon knowledge of mercury exposure to wildlife and its toxicity in long-term feeding studies, WC values can be calculated for the protection of piscivorous avian and mammalian wildlife. A WC value is defined as the concentration of total mercury in water which, if not exceeded, protects avian and mammalian wildlife populations from adverse effects resulting from ingestion of surface waters and from ingestion of aquatic life taken from these surface waters. The methylmercury WC for protection of piscivorous avian wildlife is 61 pg/l (mercury basis). The methylmercury criterion for protection of piscivorous mammalian wildlife is 50 pg/l (mercury basis). The final methylmercury criterion for protection of piscivorous wildlife species is 50 pg/l. This value corresponds to a total mercury concentration in the water column of 641 pg/l, and methylmercury concentrations in fish of ppm (trophic level 3) and ppm (trophic level 4). Modeled estimates of mercury concentration in fish around hypothetical mercury emissions sources predict exposures within a factor of two of the WC. The WC, like the human RfD, is predicted to be a safe dose over a lifetime. It should be noted, however, that the wildlife effects used as the basis for the WC are gross clinical manifestations. Expression of subtle adverse effects at these doses cannot be excluded. The adverse effect level (population impacts on piscivorous wildlife) for methylmercury in fish that occupy trophic level 3 lies between and 0.3 ppm. A comparison of this range of values with published residue levels in fish suggests that it is probable that individuals of some highly exposed wildlife subpopulations are experiencing adverse toxic effects due to airborne mercury emissions. There are many uncertainties associated with this analysis, due to an incomplete understanding of the biogeochemistry and toxicity of mercury and mercury compounds. The sources of uncertainty include the following: Variability in the calculated BAFs is a source of uncertainty. BAFs given in this Report relate methylmercury in fish to dissolved methylmercury levels in the water column. Methods for the speciation of mercury in environmental samples are rapidly improving but remain difficult to perform. Questions also remain concerning the bioavailability of methylmercury associated with suspended particulates and dissolved organic material. Local biogeochemical factors that determine net methylation rates are not fully understood. The food webs through which mercury moves are poorly defined in many ecosystems and may not be adequately represented by a fourtiered food chain model. The representativeness of field data used in establishing the BAFs is a source of uncertainty. The degree to which the analysis is skewed by the existing data set is unknown. A ES-9
24 disproportionate amount of data is from north-central and northeastern lakes. The uncertainty associated with applying these data to a national-scale assessment is unknown. Limitations of the toxicity database present a source of uncertainty. Few controlled studies of quantifiable effects of mercury exposure in wildlife are available. These are characterized by limited numbers of dosage levels, making it difficult to establish NOAEL and LOAEL values. The toxic endpoints reported in most studies can be considered severe, raising questions as to the degree of protection against subtle effects offered by RfD and WC values. Use of less than lifetime studies for prediction of effects from lifetime exposure is also a source of uncertainty. Concerns exist regarding the possibility of toxic effects in species other than the piscivorous birds and mammals evaluated in this Report. Uncertainty is associated with mercury effects in birds and mammals that prey upon aquatic invertebrates and with possible effects on amphibians and aquatic reptiles. Uncertainty is also associated with mercury effects in fish. Toxicity to terrestrial ecosystems, in particular soil communities, is another source of uncertainty. Lack of knowledge of wildlife feeding habits is a source of uncertainty. Existing information frequently is anecdotal or confined to evaluations of a particular locality; the extent to which this information can be generalized is open to question. In some instances, the feeding habits are relatively well characterized (e.g., Florida panther), whereas the extent of mercury contamination of prey is poorly known (e.g., in raccoons). While the methods used to assess toxicity focus on individual-level effects, the stated goal of the assessment is to characterize the potential for adverse effects in wildlife populations. Factors that contribute to uncertainty in population-based assessments include: variability in the relationship between individuals and populations; lack of data on carrying capacity; and relationships of one population, of the same or different species, to another population. A focus on populations may not always be appropriate. This could be true for endangered species, which may be highly dependent for the survival of the species on the health of a few individuals. This may also be true for some regional or local populations of widespread species; the local population may be "endangered" and, thus, dependent on the survival of individuals. Multiple stressor interactions involving chemical effects are, in general, poorly known. Even less well known are the possible impacts of land and water use practices on water quality and large-scale ecosystem attributes (e.g., community structure and biodiversity). ES-10
25 1. INTRODUCTION Section 112(n)(1)(B) of the Clean Air Act (CAA), as amended in 1990, requires the U.S. Environmental Protection Agency (U.S. EPA) to submit a study on atmospheric mercury emissions to Congress. The sources of emissions that must be studied include electric utility steam generating units, municipal waste combustion units and other sources, including area sources. Congress directed that the Mercury Study evaluate the rate and mass of mercury emissions, health and environmental effects, technologies to control such emissions and the costs of such controls. In response to this mandate, U.S. EPA has prepared an eight-volume Mercury Study Report to Congress. The eight volumes are as follows: I. Executive Summary II. An Inventory of Anthropogenic Mercury Emissions in the United States III. Fate and Transport of Mercury in the Environment IV. An Assessment of Exposure to Mercury in the United States V. Health Effects of Mercury and Mercury Compounds VI. An Ecological Assessment for Anthropogenic Mercury Emissions in the United States VII. Characterization of Human Health and Wildlife Risks from Mercury Exposure in the United States VIII. An Evaluation of Mercury Control Technologies and Costs This volume (Volume VI) is an ecological assessment of airborne mercury emissions. It provides an overview of the ecological effects of mercury, uses published data on fish residues as well as modeling predictions from Volume III to assess potential ecological exposures, and reviews available toxicity and bioaccumulation data for the purpose of developing qualitative statements about the risk of airborne mercury emissions to piscivorous avian and mammalian wildlife. In addition, these data are used to calculate a criterion value for the protection of piscivorous wildlife species, using the same general methodology employed in the Great Lakes Water Quality Initiative (U.S. EPA 1993b, 1993c, 1995b). Volume VI is organized according to the format provided by U.S. EPA's Framework for Ecological Risk Assessment (U.S. EPA, 1992a). Chapter 2 corresponds to the problem formulation phase of the assessment and reviews the potential ecological impacts of mercury. Based upon this information, it is concluded that piscivorous avian and mammalian wildlife are potentially at risk due to airborne mercury emissions. A conceptual model is presented to describe how airborne mercury becomes concentrated in aquatic biota, which serve as the primary food source for piscivorous wildlife. An exposure analysis is presented in Chapter 3, and effects are analyzed in Chapter 4. Effects and exposure information are considered together in Chapter 5 as a means of assessing the risk of airborne mercury emissions to piscivorous avian and mammalian wildlife. Chapter 6 lists the main conclusions of this report, while Chapter 7 presents a list of critical research needs. References are provided at the end of this Volume in Chapter 8. An ecological risk characterization for mercury is presented separately in Volume VII of this Report. The scope of this assessment is limited to consideration of only mercury that is emitted directly to the atmosphere. The origins and extent of these emissions are reviewed in Volume II of this Report. This analysis does not address mercury originating from mine leachate, the manufacturing and disposal of batteries, dental amalgam (in municipal wastewater), or the application of mercurial pesticides. In a number of instances, these and other "point" sources have been related to unacceptably high mercury 1-1
26 levels in fish, triggering site-specific fish consumption advisories. Clearly, where such point sources exist, there is a need to address the combined impacts of mercury originating from all sources, including air emissions. The exposure analysis for piscivorous wildlife was designed to address the following questions: What is the current degree of exposure of piscivorous avian and mammalian wildlife? In what broad geographical areas of the continental United States is there a high probability for co-occurrence of high mercury deposition rates and wildlife species of concern? What is the relative increase in exposure that can be anticipated for wildlife species that live in proximity to mercury emissions sources? The first of these questions was addressed by defining what piscivorous wildlife eat and then characterizing the mercury content of these food items. The second question was addressed by superimposing the results of a long-range transport analysis onto wildlife distribution information. The last question was addressed by using the results of a local-scale air dispersion model, combined with an indirect exposure methodology, to generate hypothetical exposure scenarios for wildlife. This shortrange analysis is similar to that used in the human health exposure assessment (Volume IV). Descriptions of the long- and short-range air dispersion models and the indirect exposure methodology are provided in Volume III. The primary goal of the effects analysis was to identify and review toxicity studies with wildlife species that could be used to estimate chronic NOAEL values for avian and mammalian wildlife. In addition, field data were reviewed as a means of comparing mercury residues in wild animals with those shown to associated with toxic effects in laboratory or other studies. Finally, exposure and effects information are reviewed in an effort to develop qualitative statements about the risk of mercury emissions to piscivorous avian and mammalian wildlife. This assessment includes a review of previously published efforts to assess the risk of mercury to several wildlife species living in restricted geographical locals. Exposure and effects information are also used to calculate a water-based wildlife criterion value for mercury, which, if not exceeded, would be protective of piscivorous avian and mammalian wildlife. The general method used to calculate this criterion value is similar to that used previously to estimate criterion values for mercury in the Great Lakes Water Quality Initiative (U.S. EPA 1993b, 1993c, 1995b). An effort was made to calculate fish residue concentrations corresponding to this criterion value. These residue values were then compared with measured values obtained in environmental sampling efforts. Owing to its importance for both the ecological and human health assessments, published data for fish and other aquatic biota were evaluated to calculate bioaccumulation factors (BAFs) for methylmercury and to characterize the uncertainties associated with these estimates. The data and methods used to derive these BAFs are presented in Appendix D of Volume III. A summary of this material is provided in Chapter 5 of the present Volume. 1-2
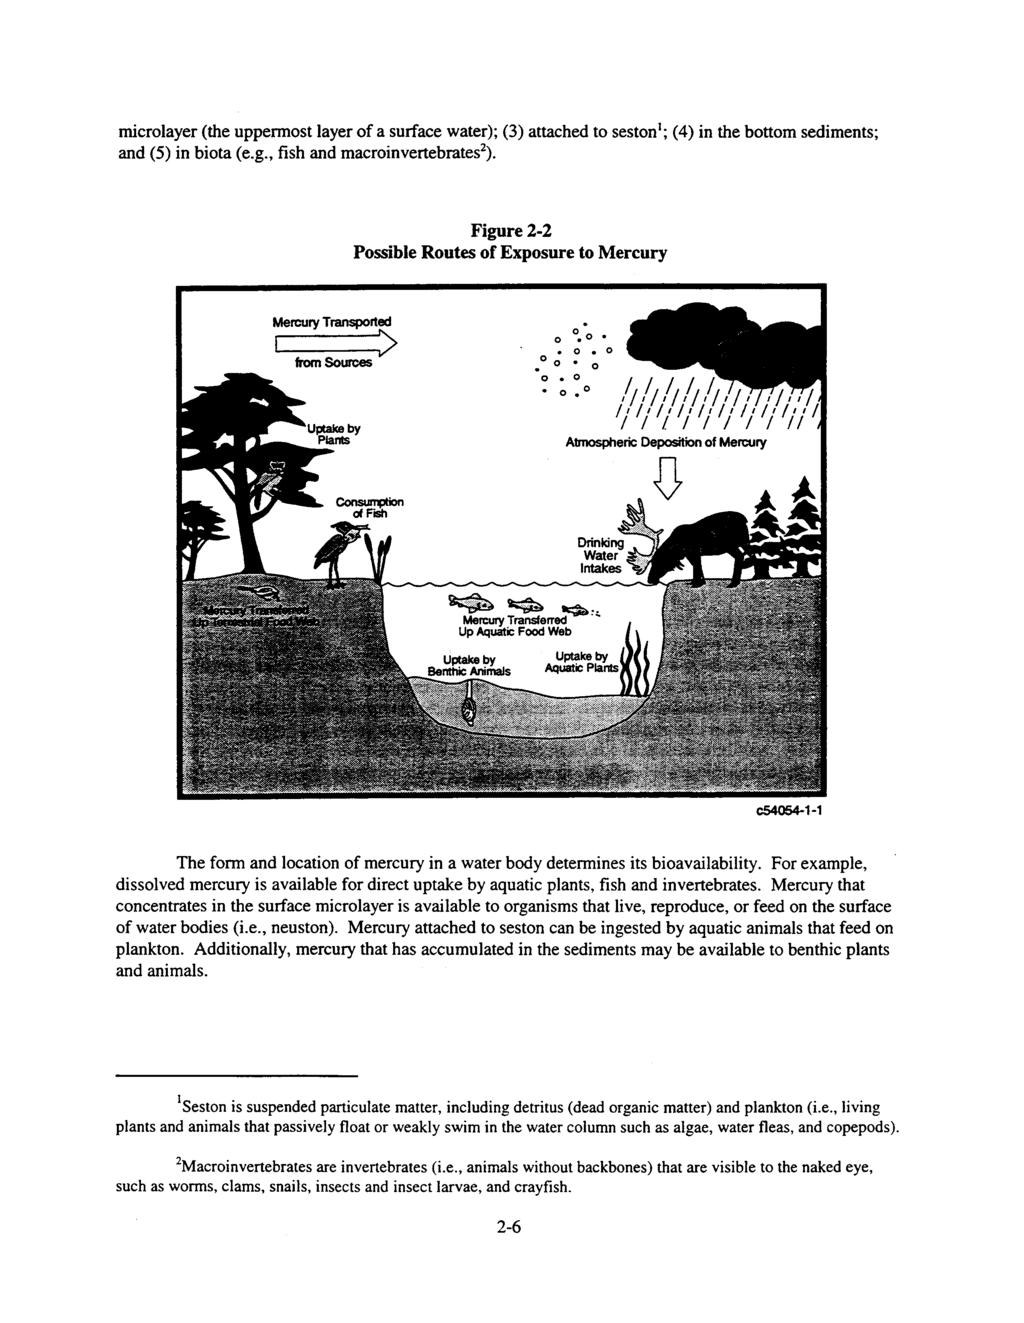
27 2. PROBLEM FORMULATION U.S. EPA defines ecological risk assessment as "a process that evaluates the likelihood that adverse ecological effects may occur or are occurring as a result of exposure to one or more stressors" (U.S. EPA, 1992a, 1996). A "stressor" is defined as any chemical, biological, or physical entity that can induce an adverse response of ecological components, i.e., individuals, populations, communities, or ecosystems. Although ecological risk assessment follows the same basic risk paradigm as human health risk assessment, there are three key differences between the two types. Ecological risk assessment can consider effects on populations, communities and ecosystems in addition to effects on individuals of a single species. No single set of ecological values to be protected is applicable in all cases; instead, they must be selected for each assessment based on both scientific and societal merit. Nonchemical stressors (e.g., physical disturbances) often need to be evaluated as well as chemical stressors. The problem formulation phase of an environmental risk assessment consists of four main components: (1) integrating available information on the stressors, potential exposure pathways, ecosystems potentially at risk, and ecological effects; (2) selecting assessment endpoints (the ecological values to be protected); (3) developing a conceptual model of the problem; and (4) formulating an analysis plan for the exposure and effects characterization phases of the assessment. Section 2.1 reviews the characteristics of mercury in the environment, including its various chemical forms (speciation), chemical transformations and movement within and between the air, surface water, and soil compartments of the environment (cycling). Section 2.2 identifies the pathways by which plants and animals can be exposed to mercury in both aquatic and terrestrial ecosystems. Section 2.3 provides an overview of what is known about the effects of mercury on organisms, populations, communities and ecosystems. Section 2.4 identifies ecosystems and ecosystem components that are thought to be most at risk from mercury in the environment. Section 2.5 describes the selection of assessment and measurement endpoints for the ecological risk assessment. A conceptual model of mercury fate and effects in the environment is presented in Section 2.6. An analysis plan for the exposure and effects characterizations is provided in Section 2.7. It should be noted that this review of mercury fate and effects is limited to consideration of only terrestrial and freshwater aquatic ecosystems. It is recognized that mercury that deposits in coastal areas can be translocated to estuarine environments, and that biota which inhabit these and nearby marine systems have the potential to be adversely impacted. Presently, however, uncertainties regarding mercury deposition, cycling, and effects in such environments are so great as to preclude even a qualitative risk assessment. 2.1 Stressor Characteristics: Mercury Speciation and Cycling Mercury in the environment can occur in various physical and chemical forms. Physically, mercury may exist as a gas or liquid, or it may be associated with solid particulates. Chemically, mercury can exist in three oxidation states: 0 (1) Hg elemental mercury, also called metallic mercury; 2-1

28
29 FOCUS ON METHYLMERCURY Methylmercury is the form of mercury of particular concern in ecosystems for three reasons. (1) All forms of mercury can be converted to methylmercury by natural processes in the environment. (2) Methylmercury bioaccumulates and biomagnifies in aquatic food webs. (3) Methylmercury is the most toxic form of mercury. In the 1960s, researchers found methylmercury in fish in Swedish lakes, although no discharge of methylmercury had occurred in those lakes (Bakir et al., 1973). Later research determined that the methylation of mercury in sediments by anaerobic sulfur-reducing bacteria was a major source of methylmercury in many aquatic environments (Gilmour and Henry, 1991; Zillioux et al., 1993). Aerobic bacteria and fungi, including yeasts that grow best in acid conditions, also can methylate mercury (Eisler, 1987; Yannai et al., 1991; Fischer et al., 1995). In addition, fulvic and humic material may abiotically methylate mercury (Nagase et al., 1984; Lee et al., 1985; Weber, 1993). The major site of methylation in aquatic systems is the sediment, but methylation also occurs in the water column (Wright and Hamilton, 1982; Xun et al., 1987; Parks et al., 1989; Bloom and Effler, 1990; Winfrey and Rudd, 1990; Bloom et al., 1991; Gilmour and Henry, 1991; Miskimmin et al., 1992). Wetlands may be particularly active sites of methylation (St. Louis et al., 1994; Hurley et al., 1995). The rate of mercury methylation varies with microbial activity, mercury loadings, suspended sediment load, DOC, nutrient content, ph, redox conditions, temperature, and other variables. Demethylation occurs via biotic and abiotic mechanisms, including photodegradation (Sellers et al., 1996). The net rate of mercury methylation is determined by competing rates of methylation and demethylation. Methylmercury bioaccumulates and biomagnifies in aquatic food webs at higher rates and to a greater extent than any other form of mercury (Watras and Bloom, 1992). "Bioaccumulation" refers to the net uptake of a contaminant from the environment into biological tissue via all pathways. It includes the accumulation that may occur by direct contact of skin or gills with mercury-contaminated water as well as ingestion of mercury-contaminated food. "Biomagnification" refers to the increase in chemical concentration in organisms at successively higher trophic levels in a food chain as a result of the ingestion of contaminated organisms at lower trophic levels. Methylmercury can comprise from 10 percent to over 90 percent of the total mercury in phytoplankton and zooplankton (trophic levels 1 and 2) (May et al., 1987; Watras and Bloom, 1992), but generally comprises over 90 percent of the total mercury in fish (trophic levels 3 and 4) (Huckabee et al., 1979; Grieb et al., 1990; Bloom, 1992; Watras and Bloom, 1992). Fish absorb methylmercury efficiently from dietary sources and store this material in organs and tissues. The biological half-life of methylmercury in fish is difficult to determine but is generally thought to range from months to years. Methylmercury is the most toxic form of mercury to birds, mammals, and aquatic organisms due to its strong affinity for sulfur-containing organic compounds (e.g., proteins). Biological membranes, including the blood-brain barrier and the placenta, that tend to discriminate against other forms of mercury allow relatively easy passage of methylmercury and dissolved mercury vapor (Eisler, 1987). Methylmercury can cause death, neurological disorders, organ damage, impaired immune response, impaired growth and development and reduced reproductive success (Klaassen, 1986). In mammals, fetuses are particularly sensitive to mercury, experiencing deleterious developmental effects when the mothers appear to be unaffected (Clarkson, 1990) Mercury in Air o In the atmosphere, most mercury (95 to over 99 percent) exists as gaseous Hg ; the remainder 2+ generally is comprised of gaseous divalent (Hg ) mercury and mercury associated with particulates (Lindqvist, 1991; MDNR, 1993). Gaseous methylmercury may also may exist in air at measurable concentrations, especially near mercury emissions sources. Mercury associated with particulates in air 2+ includes Hg, which is thought to occur primarily as mercuric chloride (MDNR, 1993). The form of mercury in air affects both the rate and mechanism by which it deposits to earth. o Oxidized and particulate mercury are more likely to be deposited than Hg because they are more soluble in water and are scavenged by precipitation more easily. They are also thought to be dry deposited more easily. As a result, oxidized and particulate forms of mercury are thought to comprise the majority of 2-3
30 deposited mercury, even though they comprise only a few percent of the total amount of mercury in the atmosphere (Lindqvist, 1991). Wet deposition is thought to be the primary mechanism for transporting mercury from the atmosphere to surface waters and land (Lindqvist, 1991). In the Great Lakes area, for example, wet 2+ deposition is believed to account for 60 to 70 percent of total mercury deposition. Hg is the predominant form in precipitation (MDNR, 1993) Mercury in Surface Water o 2+ Mercury can enter surface water as Hg, Hg, or methylmercury. Once in aquatic systems, mercury can exist in dissolved or particulate forms and can undergo the following transformations (see Figure 2-1) (Lindqvist et al., 1991; Winfrey and Rudd, 1990). o 2+ Hg in surface waters can be oxidized to Hg or volatilized to the atmosphere. 2+ Hg can be methylated in sediments and the water column to form methylmercury. Methylmercury can be alkylated to form dimethylmercury. 2+ Hg and methylmercury can form organic and inorganic complexes with sediment and suspended particulate matter. Each of these reactions can also occur in the reverse direction. The net rate of production of each mercury species is determined by the balance between forward and reverse reactions. Estimates of the percent of total mercury in surface waters that exists as methylmercury vary. Generally, methylmercury makes up less than 20 percent of the total mercury in the water column (Kudo et al., 1982; Parks et al., 1989; Bloom and Effler, 1990; Watras et al., 1995a). In lakes without point source discharges, methylmercury frequently comprises ten percent or less of total mercury in the water column (Lee and Hultberg, 1990; Lindqvist, 1991; Porcella et al., 1991; Watras and Bloom, 1992; Driscoll et al., 1994, 1995; Watras et al., 1995b). A review of speciation data collected to date suggests that methylmercury as a percent of total averages just under 8 percent (see Volume III, Appendix D of this Report). Contaminated sediments can serve as an important mercury reservoir, with sediment-bound mercury recycling back into the aquatic ecosystem for decades or longer. Biological processes affect this recycling process. For example, sulfate-reducing bacteria may mediate mercury methylation (Gilmour and Henry, 1991). Benthic invertebrates may take up mercury from sediments, making it available to other aquatic animals through the food chain and to vertebrates that consume emergent aquatic insects (Hildebrand et al., 1980; Wren and Stephenson, 1991; Dukerschein et al., 1992; Saouter et al., 1993; Tremblay et al., 1996; Suchanek et al., 1997). Chemical factors, such as reduced ph, may stimulate methylmercury production at the sediment/water interface and thus may accelerate the rate of mercury methylation resulting in increased accumulation by aquatic organisms (Winfrey and Rudd, 1990). Attributes of the sediment, including organic carbon and sulfur content, can influence mercury bioavailability (Tremblay et al., 1995). DOC appears to be important in the transport of mercury to lake systems but, at high concentrations, may limit bioavailability (Driscoll et al., 1994, 1995). 2-4
31 2.1.3 Mercury in Soil Mercury deposited from the air forms stable complexes with soil particles of high organic or sulfur content and with humic and fulvic acids (Andersson, 1979; WHO, 1989; Johansson et al., 1991; Yin et al., 1996). These chemical bonds limit mercury's mobility in soils and its availability for uptake by living organisms. In general, the distribution of mercury in soil is likely to follow the distribution of organic matter. Mercury has a long retention time in soils. As a result, mercury that has accumulated in soils may continue to be released to surface waters for long periods of time, possibly hundreds of years (Johansson et al., 1991) 2+ Hg in soils can be transformed to other mercury species. Bacteria and organic substances can 2+ o reduce Hg to Hg, releasing volatile elemental mercury to the atmosphere. Alternatively, bacteria and organic substances can methylate mercury, and subsequently demethylate it, depending on environmental conditions (Allard and Arsenie, 1991; Gilmour and Henry, 1991). Recent measurements of volatile exchange between air and soil indicate that soil emissions could be similar in magnitude to atmospheric deposition, suggesting that the total sink capacity of soils is less than previously thought (Kim et al., 1995). Similarly, measurements of canopy emissions indicate that forest ecosystems may not act as efficient sinks for atmospheric mercury (Lindberg, 1996). It is uncertain at present how much these loss processes affect the retention of mercury in upper level soils. 2.2 Potential Exposure Pathways Plants and animals can be exposed to mercury by direct contact with contaminated environmental media or ingestion of mercury-contaminated water and food (see Figure 2-2). Mercury deposited in soil can be a source of direct exposure from physical contact (e.g., earthworms and terrestrial plants). Animals also can ingest mercury in soil, either purposefully (e.g., earthworms) or incidentally (e.g., grazers). Mercury in the air can be taken up directly by terrestrial or aquatic emergent plants or inhaled by terrestrial animals. Mercury in water can be a source of direct exposure to aquatic plants (e.g., algae and seagrasses) and animals (e.g., zooplankton and fish) and can be ingested by terrestrial animals in drinking water. Finally, both aquatic and terrestrial animals can be exposed to mercury in contaminated food sources. Not all of these potential exposure pathways are equally important, however. The remainder of this section evaluates the likely importance of different routes of exposure consequent to mercury release to air. Section discusses the fate and bioavailability of mercury in aquatic systems and the pathways by which aquatic plants and animals can be exposed to mercury directly in contaminated water or indirectly through aquatic food webs. Section provides information on the fate and bioavailability of mercury in terrestrial ecosystems and the pathways by which terrestrial plants and animals can be exposed. Bioaccumulation of mercury in aquatic and terrestrial organisms is discussed further in Section Exposure Pathways in Aquatic Systems Figure 2-3 illustrates the potential distribution of mercury in a water body. As shown, mercury can be present in surface waters in various forms: (1) dissolved in the water; (2) concentrated in the surface 2-5
32
33
34
35 invertebrates tend to feed on algae and detritus. Thus, mercury can be transferred and accumulated through three or four trophic levels to reach the prey of piscivorous wildlife species. Studies with lake trout suggest that differences in food web structure can substantially impact mercury accumulation by large predatory fish (Cabana and Rasmussen, 1994; Cabana et al., 1994; Futter, 1994) Exposure Pathways in Terrestrial Systems Several exposure pathways are possible for both plants and animals in terrestrial systems. The two main pathways by which terrestrial plants can be exposed to mercury are uptake from soils into the roots and absorption directly from the air. Potential exposure routes for terrestrial animals include the following: (1) ingestion of mercury-contaminated food; (2) direct contact with contaminated soil; (3) ingestion of mercury-contaminated drinking water; and (4) inhalation. Food ingestion is of primary concern for vertebrate carnivores (including humans). Once mercury enters a terrestrial food web, like that shown in Figure 2-5, it can be transferred in increasing concentrations to higher trophic levels (Talmage and Walton, 1993). A special case exists when terrestrial carnivores consume prey that have accumulated mercury originating from aquatic sources. Perhaps the best known example is that of the Florida panther, which consumes raccoons that have accumulated mercury through consumption of contaminated fish and shellfish (Roelke et al., 1991) Terrestrial Plants Uptake by plants plays a major role in the entry of metals to terrestrial food webs. Mercury 4 uptake by terrestrial vascular plants can occur through the roots or through the leaves, by way of 5 stomata (Mosbaek et al., 1988; Crowder, 1991; Maserti and Ferrara, 1991). A vascular plant's uptake of mercury from the soil depends on soil type, with uptake decreasing as organic matter, which binds mercury, increases (WHO, 1989). Uptake of mercury through leaves is considered to be a negligible source of mercury for beech and spruce (Schmidt, 1987) but is an important route for pines and herbaceous plants (Mosbaek et al., 1988; Maserti and Ferrara, 1991). Bryophytes and lichens have no roots and take up metals only from air or water (WHO, 1989; Crowder, 1991). Some species of bryophytes and lichens can bioconcentrate mercury to relatively high levels (e.g., up to 1200 g/g in Sphagnum sp.) (Siegal et al., 1985). Some woody plants (e.g., Pinus sp.) also bioconcentrate mercury (Siegal et al., 1987) Terrestrial Animals Dietary exposure is the primary route of mercury uptake for vertebrate members of terrestrial food webs. Figure 2-5 illustrates a terrestrial food web. Plants are eaten by a wide diversity of herbivorous animals (e.g., grasshoppers, caterpillars, mice, voles, rabbits, and deer). Insects, earthworms and other soil macroinvertebrates can accumulate mercury to levels well above those of the soil in which they reside (Siegel et al., 1975; Helmke et al., 1979; Beyer et al., 1985), and are themselves consumed by many species of birds, shrews, snakes, and amphibians. Small mammals, birds, reptiles and amphibians are consumed by larger predators, such as owls, hawks, eagles, mink, and wolves. Thus, mercury can be transferred and accumulated through two or three trophic levels to reach the prey of top carnivores in terrestrial systems. 4 Plants with roots, stems, and leaves, such as ferns and seed plants. 5 Stomata (plural of stoma) are the minute openings in the epidermis of leaves, stems, or other plant organs that allow gas to diffuse in and out. 2-9
36
37 invertebrates small forage fish larger piscivorous fish. Piscivorous birds and mammals would represent the fifth step in the chain. In some cases a sixth step exists, as when a bald eagle consumes a piscivorous herring gull. A typical food chain in terrestrial systems might be: plants small herbivorous mammals predatory birds and mammals. Another typical terrestrial food chain would be: plants herbivorous insects small birds birds of prey. In these examples, the top predators represent the third and fourth step in the chain (although additional steps are possible), instead of the fifth or sixth level as can be the case for aquatic systems. 2.3 Ecological Effects This section provides an overview of potential effects of mercury on ecosystems and components of ecosystems. Contaminants such as mercury can affect individual organisms, populations, communities, or ecosystems (see Table 2-1). Effects on individuals can be lethal or sublethal, including behavioral, reproductive and developmental effects. Additionally, effects can be immediate, due to acute (short-term) exposures or may be manifested only after chronic (long-term) exposures. In animals, toxic effects caused by mercury exposure vary depending on a number of factors, including but not limited to these: delivered dose (i.e., amount and duration of exposure); the form of mercury to which an organism is exposed; physical and chemical parameters of the environment (e.g., ph, temperature, and DOC); the extent to which an organism is exposed to other chemical or non-chemical stressors; the life stage, age, sex, species, and physiological condition of the exposed organism; and the extent to which the organism can detoxify or eliminate absorbed mercury. The remainder of this section provides an overview of potential adverse ecological effects of mercury. Section discusses the bioaccumulation and biomagnification of mercury in food chains, Section reviews individual-level effects, Section reviews population-level effects, and Section reviews effects on communities and ecosystems Bioaccumulation of Mercury As discussed previously, plants and animals may absorb mercury from direct exposure to contaminated media. In addition, animals can acquire mercury through ingestion of mercurycontaminated food. These pathways determine how much mercury an organism is exposed to from outside sources. An additional factor that determines the effect of mercury on ecological systems is how much mercury is accumulated by organisms. Mercury accumulation can result in concentrations in exposed plants and animals that are higher than those in surrounding media or in ingested food. This section outlines the basic processes by which mercury accumulates and introduces the different ways that chemical accumulation in biological systems is measured and expressed. 2-11
38 Table 2-1 Examples of Effects of Contaminants on Ecosystem Components Component Examples of Effects Individual Change in respiration Change in behavior (e.g., migration, predator-prey interactions) Inhibition or induction of enzymes Increased susceptibility to pathogens Decreased growth Decreased reproduction Death Population Decreased genotypic and phenotypic diversity Decreased biomass Increased mortality rate Decreased fecundity rate Decreased recruitment of juveniles Increased frequency of disease Decreased yield Change in age/size class structure Extinction Community Decreased species diversity Change in species composition Decreased food web diversity Decreased productivity Increased algal blooms Ecosystem Decreased diversity of communities Altered nutrient cycling Decreased resilience Three terms are commonly used to describe the mechanism by which a contaminant accumulates in living tissues. The term "bioconcentration" refers to the accumulation of a chemical that occurs as a result of direct contact of an organism with its surrounding medium (e.g., uptake by a fish from water through the gills and epithelial tissue or uptake by earthworms from soil through the skin) and does not include the ingestion of contaminated food. The term "bioaccumulation" refers to the net uptake of a contaminant from all possible pathways and includes the accumulation that may occur by direct exposure to contaminated media as well as uptake from food. The term "biomagnification" refers to the increase in chemical concentration in organisms at successively higher trophic levels as a result of the ingestion of contaminated organisms at lower trophic levels. Mercury is known to bioconcentrate, bioaccumulate and biomagnify. In fact, mercury is one of the few metals that is known to biomagnify in aquatic food webs. Different numerical factors are used to estimate the extent to which a contaminant bioconcentrates, bioaccumulates and biomagnifies. 2-12
39 The bioconcentration factor (BCF) is the ratio of a substance's concentration in tissues (generally expressed on a whole-body basis) to its concentration in the surrounding medium (e.g., water or soil) in situations where an organism is exposed through direct contact with the medium. The bioaccumulation factor (BAF) is the ratio of a substance's concentration in tissue to its concentration in the surrounding medium (e.g., water or soil) in situations where the organism is exposed both directly and through dietary sources. The biota-sediment accumulation factor (BSAF) is a specialized form of the BAF that refers to the chemical concentration in an aquatic organism divided by that in surficial (aquatic) sediments. To date it has been applied only to bioaccumulative organic compounds, but in principal it could be applied to mercury also. When applied to organic compounds, chemical concentrations in tissues and sediment are generally normalized for lipid content and organic carbon content, respectively. The predator-prey factor (PPF, also known as the biomagnification factor, or BMF) is the factor by which a substance's concentration in the organisms at one trophic level exceeds the concentration in the next lower trophic level. For example, the PPF for mercury at trophic level 4 equals the observed mercury concentration in trophic level 4 organisms divided by mercury concentration in trophic level 3 organisms. The food chain multiplier (FCM) is the factor by which the BAF of a substance at trophic level 2 or higher exceeds the BCF at trophic level 1. Implied by this definition is the assumption that organisms at trophic level 1 are at or near chemical equilibrium with their environment. Although generally developed for individual organisms, BAF, BSAF, PPF and FCM values can also be viewed as trophic-level specific. Depending on environmental levels of mercury, sufficient mercury may accumulate in organisms at one or more trophic levels to produce adverse effects at the individual, population, community or ecosystem level. Mercury accumulates in an organism when the rate of uptake exceeds the rate of elimination. All forms of mercury can accumulate to some degree; however, methylmercury generally accumulates to a greater extent than other forms. Methylmercury is absorbed into tissues quickly and becomes sequestered due to covalent reactions with sulfhydryl groups in proteins and other macromolecules (see Section 4 of this Volume for more detail). Inorganic mercury can also be absorbed but is usually taken up at a slower rate and with lower efficiency than methylmercury. Elimination of methylmercury takes place very slowly resulting in tissue half-lives (the time required for half of the mercury in the tissue to be eliminated) ranging from months to years (Westermark et al., 1975). Elimination of methylmercury from fish is so slow that long-term reductions of mercury concentrations in fish are often due mainly to growth of the fish. In comparison, other mercury compounds are eliminated relatively quickly, resulting in reduced levels of accumulation (Eisler, 1987). Methylmercury and total mercury concentrations both tend to increase in aquatic organisms as the trophic level in aquatic food webs increases. In addition, the proportion of total mercury that exists as methylmercury generally increases with trophic level (May et al., 1987; Watras and Bloom, 1992; Becker and Bigham, 1995; Hill et al., 1996; Tremblay et al., 1996; Mason and Sullivan, 1997). 2-13
40 Accordingly, mercury exposure and accumulation is of particular concern for animals at the highest trophic levels in aquatic food webs and for animals that feed on these organisms Field-derived BAFs, BSAFs, and PPFs In this section, BCFs for organisms that occupy the base of aquatic food chains are reviewed, along with BSAFs for fish and PPFs for avian and mammalian piscivores. BSAFs for earthworms and benthic invertebrates are also presented because both represent possible vectors for mobilization of sediment-associated mercury and subsequent translocation to wildlife. Median BAFs for fish occupying trophic levels 3 and 4 are derived in Volume III, Appendix D. A summary of these calculations is presented in Chapter 5 of this Volume. Recent studies with marine phytoplankton suggest that mercury accumulation at the lowest levels of aquatic food webs is controlled largely by the availability of neutral mercury complexes (primarily HgCl 2and CH3HgCl) (Mason et al., 1996). Factors that can alter the concentration of these neutral species include ph, chloride concentration, and the amount of dissolved organic material. Additionally, it was found that most (63%) of the methylmercury that diffuses into phytoplankton becomes localized in the cytoplasm. Copepods assimilated almost all of this cytoplasmic mercury when they were fed contaminated phytoplankton. In contrast, inorganic mercury was concentrated predominantly (91%) in cell membranes and was poorly (15%) assimilated. Research on a Lake Michigan food web suggests that similar mechanisms may be responsible for controlling mercury uptake by freshwater phytoplankton (Mason and Sullivan, 1997). Such studies are extremely important, since mercury uptake at the lowest trophic levels is likely to be the single most important determinant of levels achieved by fish and piscivorous wildlife. Data published by Becker and Bigham (1995) can be used to calculate a methylmercury BCF of 107,000 for phytoplankton in Onondaga Lake. Corrected for the (assumed) percentage of methylmercury in lake water (8%) and phytoplankton (24%), these data give a total mercury BCF of approximately 36,000. Using total mercury data reported by Mason and Sullivan (1997), and assuming that dry weight is 10% of wet weight, a BCF of about 7,000 can be calculated for phytoplankton in Lake Michigan. 2+ BCFs (total mercury basis, approximated from Hg data) ranging from about 2,000 to 40,000 were reported for periphyton collected from two streams in eastern Tennessee (Hill et al., 1996). A total mercury BCF of approximately 20,000 was reported for phytoplankton in a northern Wisconsin lake (reference basin; Watras and Bloom, 1992). Expressed on a methylmercury basis, the BCF for phytoplankton in the same Wisconsin lake was approximately 90,000. BAFs for zooplankton, expressed as ratios of total mercury, can be calculated from data presented by Sorenson et al. (1990), Lindqvist (1991) and Mason and Sullivan (1997). Respectively, the calculated values are 35,600, 285,000, and 3,100. A BAF of approximately 56,200 was reported for zooplankton by Watras and Bloom (1992; reference basin). Expressed on a methylmercury basis, the BAF measured by Watras and Bloom (1992) was about 1,000,000. Total mercury BAFs estimated for zooplankton in 12 northern Wisconsin lakes ranged from about 4,800 to 270,000 (Back and Watras, 1995). BAFs expressed on a methylmercury basis for the same 12 lakes ranged from about 11,000 to 12,600,000. Much of this variability appeared to be correlated (inversely) with lakewater DOC content. Work conducted by Slotten et al. (1995) and Suchanek et al. (1997) suggests that mercury bioaccumulation by zooplankton may vary seasonally, although in both of these studies data interpretation was complicated by the presence of mercury point sources. Becker and Bigham (1995) reported a methylmercury BAF of approximately 87,000 for zooplankton in Onondaga Lake, which has also received substantial mercury inputs from local point sources. 2-14
41 To date, BSAFs for mercury in aquatic biota have been estimated by only a few authors (e.g., Tremblay et al., 1996); however, a substantial amount of data exists that allows such calculations to be made. Hildebrand et al. (1980) observed a linear relationship between total mercury in sediment and that in benthic invertebrates. A BSAF of approximately 0.4 is obtained from the slope of this relationship (after expressing benthos data on a dry weight basis). The relationship between total mercury in fish (rock bass and hog suckers) and that in sediments was reported by Hildebrand et al. (1980) to be logarithmic. Taking as an average a fish tissue value of 4.0 g/g (dry weight; converted from 1.0 g/g wet weight) and solving for the sediment concentration yields a value of 2.78 g/g. The BSAF is equal to the ratio of fish and sediment values, or approximately 1.4. Total mercury data presented by Sorenson et al. (1990) yield BSAFs (dry weight basis) of approximately 2.0 and 10.1 for zooplankton and northern pike, respectively. Data presented by Wren and MacCrimmon (1986) allow BSAFs to be calculated for two Ontario lakes that differed considerably with respect to total mercury residues in biota. In both lakes BSAFs (dry weight basis) were very similar, ranging from approximately 5.1 (clams) to 24.0 (northern pike) in the less contaminated of the two lakes, and 3.4 (clams) to 27.1 (pike) in the other system. Using the mid-range of values reported by Lindqvist (1991), BSAFs (dry weight basis) of approximately 2.2, 17.2, 17.7, and 45.7 are obtained for zooplankton, macroinvertebrates, yellow perch (small and large), and northern pike (large and small), respectively. Boyer (1982) reported total mercury concentrations in fish and sediments from several locations on the upper Mississippi River. Expressed on a dry weight basis, these data yield BSAFs ranging from 2.5 to greater than 50. Using "canal median" total mercury data from Stober et al. (1995), a BSAF (wet weight basis) of about 0.6 can be calculated for mosquitofish in the Florida Everglades region. This value would increase somewhat if expressed on a dry weight basis. Saouter et al. (1993) exposed mayflies for 10 days to methylmercury in sediment and obtained a BSAF (wet weight basis) of 4.0. A BSAF for zooplankton of about 1.4 (dry weight basis) can be calculated from mean total mercury data obtained in a survey of 73 Canadian lakes (Tremblay et al., 1995). Tremblay et al. (1996) reported the BSAF (dry weight basis) for aquatic insects to be about 3.0 when calculated using total mercury data, and from 6.0 to 22.0 when expressed on a methylmercury basis. In summary, BSAFs calculated for total mercury in aquatic biota ranged from 0.4 to about 50 and, within a given system, appeared to increase with trophic level. In terms of both magnitude and the increase with trophic level, BSAFs for mercury are similar to BSAFs reported for hydrophobic organic compounds (lipid/carbon normalized). It could be hypothesized, therefore, that similar processes are at work. This is unlikely, however, since bioaccumulation of organic compounds is largely a partitioning process, while for mercury the chemical interactions tend to more specific, often involving the formation of covalent bonds. Because mercury does not partition into lipid, normalization for lipid content makes little sense. The existence of strong relationships between mercury and organic carbon content (see for example Wiener et al., 1982; Lindqvist, 1991) suggests, however, that some type of sediment carbon normalization may be appropriate. A single study by Tremblay et al. (1996) suggests that within a given system BSAFs expressed on a methylmercury basis will exceed values calculated using total mercury data. While likely at higher trophic levels, additional data at lower trophic levels are needed to determine the extent to which this observation may be generalized. Limited data are available that allow calculation of BSAFs for earthworms. The concentration of mercury in earthworms collected from an uncontaminated field site was 27.1 times that of soil and 6.9 times that of decaying vegetation (dry weight basis) (Siegel et al., 1975). In a 12 week laboratory exposure, earthworms accumulated an average of 21.3 times the mercury concentration of the soil to which they were exposed (including control and treatment groups) (Beyer et al., 1985). 2-15
42 PPFs for piscivorous birds and mammals are difficult to determine accurately because residue data cannot be attributed with any specificity to residues in a particular prey item; feeding observations for the species in question are rarely reported in these studies. Where possible, PPFs were estimated by constructing rough averages of residue values in prey items occupying similar trophic levels. For this analysis, mink, mergansers, and loons were assumed to feed exclusively at trophic level 3. River otters were assumed to feed at trophic levels 3 (80%) and 4 (20%). PPFs calculated for piscivorous birds from breast muscle mercury levels ranged from 1.7 for the hooded merganser (Vermeer et al., 1973) to 7.7 for the herring gull (Wren et al., 1983). Intermediate values were calculated for the common merganser (2.5) (Vermeer et al., 1973) and loon (6.8) (Wren et al., 1983). Data collected by Wren et al. (1996) from Muskota, Ontario, permit PPFs to be calculated for mink and otter. Calculated from liver residues, these data yield PPFs of 6.2 and 4.7, respectively. Muscle tissue data reported in the same study yield PPFs of 8.1 and 1.7 for mink and otter, respectively. A PPF of 3.0 (muscle tissue basis) can be calculated for otters from Tadenac Lake, Ontario (Wren et al., 1993). Averaged across sampling locations and assuming consumption of the fish species analyzed, PPFs of 2.7 (muscle basis) and 5.7 (liver basis) may be estimated for otters in Georgia (Halbrook et al., 1994). In a study designed specifically to assess the degree of mercury biomagnification in piscivorous mammals, liver residues were paired by location with residue levels in fish (Foley et al., 1988). These data yield PPFs of 3.9 and 3.4 for mink and otter, respectively. Kucera (1983) reported that the ratio of mercury concentrations in mink and otter to that in predatory fish in the same region was about 10. A similar conclusion was reached by Francis and Bennett (1994) for otters in northern Michigan, based upon an analysis of liver tissues. Thus, it can be shown that mercury biomagnifies in piscivorous wildlife, although the extent of this biomagnification is less than that typically reported for persistent organic compounds. For example, data reported by Braune and Norstrom (1989) suggest that the PPF for PCBs in piscivorous birds can approach 100. These observations have led to the suggestion that mercury is eliminated by piscivorous wildlife in feathers and fur, and perhaps also via a demethylation pathway (Wren et al., 1986); however, extensive elimination would be expected to result in PPFs of 1 or less Mercury Residues in Fish Consistent with a need to characterize the exposure of piscivorous avian and mammalian wildlife to mercury, an effort was made to estimate "national average" values for mercury in fish at trophic levels 3 and 4. The calculation of true "national average" values would require the collection of a large number of samples from randomly selected lakes and rivers. Instead, the published literature contains a number of papers in which mercury concentrations are given for relatively small numbers of fish from restricted geographical regions. Many of these studies were initiated due to known or suspected problems with mercury in the region of interest. Thus, a sample developed from a compilation of these data could be biased toward the high-end of the distribution of mercury concentrations nationwide. A survey of the literature revealed only three nationwide fish collection efforts that used consistent sampling and mercury measurement techniques. In a study conducted by U.S. EPA, samples were obtained from 374 sites across the U.S. (U.S. EPA, 1992b; Bahnick et al., 1994). Site selection was based partly on proximity to suspected point and non-point pollution sources, and a majority of sites were located on streams and rivers. Additionally, fish were collected from 35 "remote" sites that were thought to provide background pollutant concentrations in fish. Whole-body mercury levels were determined for bottom feeders, and mercury levels in fillets were analyzed for game fish. The maximum mercury level detected was 1.80 g/g wet weight, and the mean across all fish and sites was 0.26 g/g (see Table 2-2). 2-16
43 The highest values were detected in piscivorous game fish (trophic level 4), including walleye, bass and northern pike. Lower levels were found in herbivores (e.g., carp and sucker), omnivores (e.g., catfish), and species that prey extensively on insects (e.g., trout and crappie). In general, this sampling effort did not address fish that occupy trophic level 3 (forage fish). Table 2-2 Nationwide Average of Mercury Residues in Fish Fish Species Mercury Concentration Averaged Across Sampling Sites (g/g wet weight) Carp 0.11 Sucker (White, Redhorse and Spotted) 0.17 Catfish (Channel and Flathead) 0.16 Bass (Largemouth, Smallmouth and White) 0.38 Walleye pike 0.52 Northern pike 0.31 Crappie 0.22 Brown Trout 0.14 Mean of All Fish Sampled 0.26 Source: Bahnick et. al., Mercury levels in fish were measured at over 100 sites as part of the National Contaminant Biomonitoring Program (NCBP) administered by the U.S. Fish and Wildlife Service. Two compilations of NCBP mercury data have been published. The first summarizes data collected from (Lowe et al., 1985). The second reports on data collected from and draws comparisons with the results of the earlier study (Schmitt and Brumbaugh, 1990). As with the Bahnick et al. (1994) study, most of the sampling sites were located on streams and rivers, many of which receive municipal and other waste. In addition, similar species were collected, with an emphasis on large piscivores, herbivores and omnivores. A review of these data suggests that piscivores accumulate more mercury than other fish species. Thus, lake trout (mean concentration of 0.17 µg/g) and largemouth bass (0.14 µg/g) contained more mercury than co-collected non-piscivorous species (0.07 and 0.09 µg/g, respectively). The maximum mercury concentration reported was 1.09 µg/g, and the mean across all fish and sites was 0.11 µg/g. Of importance for calculating a "national average" mercury concentration in fish, Schmitt and Brumbaugh (1990) reported that mercury levels in fish did not change between 1976 and Attention was focused, therefore, on the Lowe et al. (1985) study because it comprised a larger number of individual samples and because fish length and weight were also reported. 2-17
44 An average mercury concentration in piscivorous fish analyzed by Bahnick et al. (1994) was calculated from data presented by these authors (Table 3 in their report). For this Report, the following species were classified as trophic level 4 piscivores: largemouth bass, smallmouth bass, walleye, brown trout, white bass, and northern pike. The mean (± SD) of concentration data presented for these six species is 0.35 ± 0.13 µg/g. An average value for piscivores analyzed by Lowe et al. (1985) was estimated using data presented by these authors (Appendix A in their report). Each value reported for a site and species represented a composite of three to five fish. The criteria established for using a reported value were: (1) the species is a recognized piscivore; (2) the average size of specimens comprising a sample was > 0.5 kg; and (3) the sampling site was located in the contiguous 48 states. For this Report, the species identified as trophic level 4 piscivores were: largemouth bass, smallmouth bass, striped bass, white bass, rock bass, northern pike, walleye, sauger, lake trout, brown trout, rainbow trout, and northern squawfish. The mean (± SD) of all data presented for these twelve species was 0.18 ± 0.19 µg/g (N = 119), or just over one-half the concentration calculated using the Bahnick et al. (1994) data. A "national average" mercury concentration for trophic level 4 fish was estimated as the average of mean values calculated using data from Bahnick et al. (1994) and Lowe et al. (1985). This value is 0.26 µg/g. As indicated above, neither of these nationwide sampling efforts adequately characterized mercury concentrations in fish at trophic level 3. A "national average" for trophic level 3 was therefore estimated by dividing the average mercury concentration in piscivorous fish by an appropriate predator-prey factor (PPF). A PPF for trophic level 4 (PPF ) can be estimated from existing field data. This calculation was made in Appendix D, Volume III of this 4 Report, resulting in a mean PPF of 4.9. Dividing this value into the average residue for trophic level 4 fish 4 yields a value for trophic level 3 of g/g. The extent to which these "national average" estimates reflect the true population means at each trophic level is unknown. A comparison of these values with published residues from a large number of studies suggests, however, that they are "reasonable" and can be used in exposure assessments for piscivorous avian and mammalian wildlife Mercury Residues in Avian and Mammalian Wildlife A large volume of mercury residue data exists for both avian and mammalian wildlife that cannot be directly related to mercury concentrations in water or sediment. Nevertheless, these data are of considerable value because they indicate the range of mercury concentrations that can be expected in animals inhabiting both contaminated and uncontaminated environments. A comparison of these residues with those obtained from laboratory dose-response studies provides additional information, including the extent of difference between "natural background" residues and those that are associated with toxic effects. Emphasis is placed on piscivorous birds and mammals living in association with freshwater ecosystems. Data are also provided for the tree swallow due to its link to aquatic sediments through consumption of emergent insects. Mercury residues in tissues from birds are given in Table 2-3. The birds represented in this table include animals taken from polluted environments and individuals collected from environments for which there were no known point sources. This table is not intended to be an exhaustive compilation of measured residues, but instead illustrates the range of values encountered in environmental sampling efforts. Residues that, in the opinion of the cited author, were associated with toxic effects are noted. Factors contributing to the accumulation of mercury in wild birds are reviewed by Scheuhammer (1987, 1991). The interpretation of residue data is complicated by the likelihood that mercury distribution in tissues varies among species, and perhaps also among individuals of a single species, depending upon age, sex, diet, and other factors. Nevertheless, several generalizations can be attempted. Mercury levels in feathers of birds experimentally dosed with methylmercury generally exceed levels in muscle, liver and kidney by a factor of four or more (Heinz, 1976a; Stickel et al., 1977; Finley and Stendell, 1978), and it has been suggested that in freeliving birds greater than 50% of the total body burden of mercury may be 2-18
45 Table 2-3 Mercury Residues in Tissues of Piscivorous Birds Species Mercury Tissue Sampling Location Comments Reference (µg/g fresh weight) Bald eagle feathers Great Lakes region adults 1 Bald eagle feathers Great Lakes region nestlings 1 Bald eagle feathers N. Central Florida adults 2 Bald eagle feathers N. Central Florida nestlings 2 Common loon 8.7 feathers Minnesota lakes adults 3 Common loon 2.7 feathers Minnesota lakes juveniles 3 Common loon feathers Wisconsin lakes adults 4 Common loon feathers Wisconsin lakes juveniles 4 Wood stork 1.9 feathers South Florida juveniles 5 Bald eagle eggs British Columbia 6 Bald eagle eggs 15 States (USA) 7 Common loon eggs Wisconsin lakes 4 Common loon eggs Northwestern Ontario polluted by point 8 source; LOAEL - reproduction Common tern 3.6 eggs Northwestern Ontario polluted by point 9 source; LOAEL - reproduction Herring gull eggs Clay Lake, Ontario polluted by point 10 source, no adverse effects 2-19
46 Table 2-3 (continued) Mercury Residues in Tissues of Piscivorous Birds Species Mercury Tissue Sampling Location Comments Reference (µg/g fresh weight) Wood stork 0.7 eggs South Florida 11 Tree swallow eggs Lower Great Lakes consume emergent 12 aquatic insects Common loon liver Northwestern Ontario LOAEL - 8 reproduction Common loon liver Wisconsin lakes adults found dead 4 Common loon 5.6 liver Minnesota lakes adults found injured 3 Great White Heron liver South Florida mixed age birds 13 found dead Great Blue Heron liver South Florida nestlings 14 Great Blue Heron liver South Florida fledglings/young 14 adults Common loon breast muscle Northwestern Ontario polluted by point 8 source Common goldeneye breast muscle Clay Lake, Ontario polluted by point 10 source Common merganser breast muscle Clay Lake, Ontario polluted by point 10 source Hooded merganser breast muscle Clay Lake, Ontario polluted by point 10 source Herring gull breast muscle Tadenac Lake, Ontario
47 Table 2-3 (continued) Mercury Residues in Tissues of Piscivorous Birds Species Mercury Tissue Sampling Location Comments Reference (µg/g fresh weight) Common loon 1.5 breast muscle Tadenac Lake, Ontario 15 References: 1. Bowerman et al., 1994; range of means across sampling locations. 2. Wood et al., 1996; range of contour feathers recovered at nest sites. Means for nestlings and adults were 3.2 and 6.0, respectively. 3. Ensor et al., 1992; mean of birds caught by nightlighting. 4. Belant and Anderson, 1990; range of individual values. Means for feathers (adult and juvenile), eggs and liver were 14.8, 4.0, 0.64 and 40.9, respectively. 5. Burger et al., 1993; mean value. 6. Elliott et al., 1996; range of means across sampling locations 7. Wiemeyer et al., 1993; range of means across sampling locations (collected after failure to hatch). 8. Barr, 1986; range of individual values. Means for liver and muscle were 13.0 and 2.3, respectively. 9. Fimreite, Vermeer et al., 1973; range of individual values. Means for goldeneye, common merganser and hooded merganser were 7.8, 6.8 and 12.3, respectively. 11. Fleming et al., 1984; mean value. 12. Bishop et al., 1995; range of individual values, mean = Spalding et al., 1994; range of individual values. Means for birds that died of acute and chronic causes were 1.8 and 9.8, respectively. 14. Sundlof et al., 1994; range of individual values. Means for small nestlings, large nestlings and adults were 0.3, 1.5 and 6.6, respectively. 15. Wren et al., 1983; gull data are reported as the range of individual values, mean =
48 present in the plumage (Braune and Gaskin, 1987). Natural background levels of mercury in feathers of nonpiscivorous raptorial birds are thought to range from 1-5 g/g (dry weight); however, this may vary within and among species depending upon the type of feather sampled, molting frequency and time to last molt. Changes in feather mercury levels that accompany growth and development suggest that in seabirds molting may be an efficient means of eliminating mercury (Becker et al., 1994; Burger et al., 1994). Comparable studies have not yet been conducted with birds that live in freshwater ecosystems. Tissue levels of mercury associated with toxic effects in birds appear to exceed those in birds inhabiting relatively uncontaminated environments by a factor of ten or less (see Sections and for additional details). This observation is consistent with data for other environmental media (e.g., water, sediments, and fish), which evidence similar differences between natural "background" levels of mercury and those which cause significant environmental damage. Owing to their ease of collection, the analysis of bird feathers and eggs has been suggested as a means of identifying species that are at risk due to mercury. This suggestion has particular merit in view of the natural variation in mercury levels in the fish upon which these animals prey. Mercury residues in tissues also tend to integrate variations in mercury uptake and elimination due to changes in dietary habits, migration, egg production, etc. The abundance of mercury residue information for mammals reflects the availability of specimens as a byproduct of commercial trapping. Thus, residue data are available for wild muskrat, beaver, fox, weasel, bobcat, marten, fisher, wolf, raccoon, opossum, mink and river otter. Data are also available for a number of game species, including squirrels, rabbits, caribou, moose, deer, elk, mountain goat and bear. An extensive compilation of these data is provided by Wren (1986), along with a review of tissue levels in both wild and laboratory animals that have been associated with toxic effects. Some of the data from this compilation are presented in Table 2-4, as well as more recent information. Emphasis was placed on piscivorous species due to the exposure of these animals from consumption of contaminated fish. Data from beaver and muskrat have also been included, both to provide a general comparison of aquatic-based species and because, in several studies, data were available for piscivores and herbivores from the same waterbody. Emphasis was also placed on residues in fur and liver. This was done for two reasons: (1) high residues have been found in the liver and kidney; however, there are more reported values for liver and (2) fur, like feathers, has been suggested as a way of non-invasively determining the residue status of wild animals and of identifying areas where animals may be at risk due to mercury intoxication. Finally, data from raccoons are included in Table 2-4 because they are suspected of contributing to mercury exposure in the Florida panther. In general, the rank order of mercury residues in tissues from wild mink and otter is: liver = kidney > muscle > brain. Levels in fur relative to those in other tissues are variable but, in most cases, are higher than those in liver. Comparisons between residues in wild animals with those in animals experimentally dosed with mercury appear to be complicated by kinetics-based differences in disposition. Thus, Wobeser et al. (1976b) reported that mercury levels in the fur of experimentally dosed mink were low (1.5 g/g) relative to concentrations in liver (24.3 g/g), kidney (23.1 g/g), muscle (16.0 g/g) or brain (11.9 g/g). A similar pattern of distribution was reported for mink by Aulerich et al. (1974). In contrast, mercury levels in the fur of an individual mink found dying of mercury poisoning were higher than concentrations in any other tissue (see Table 2-4) (Wobeser and Swift, 1976). Apparently, the length of time over which a dose is obtained dictates its distribution, with redistribution from well-perfused organs (liver and kidney) to storage tissues (fur and muscle) slowly taking place during lifetime exposures. These observations suggest that comparisons between mercury residues in wild and experimental animals should be limited to consideration of well-perfused tissues. More valid comparisons can be made between apparently unaffected wild animals and wild animals that have died from mercury poisoning. 2-22
49 Table 2-4 Mercury Residues in Tissues of Piscivorous Mammals Species Mercury Tissue Sampling Location Comments Reference (µg/g fresh weight) Otter 6.5 (max. = 63.2) fur Wisconsin 1 Otter 47.0 fur Clay Lake, Ontario polluted by point 2 source; death due to poisoning Otter fur Georgia 3 Mink 10.7 (max. = 17.3) fur Georgia 4 Mink 7.6 (max. = 41.2) fur Wisconsin 1 Mink 34.9 fur Saskatchewan polluted by point 5 source; death due to poisoning Raccoon 4.4 fur S. Florida 6 Muskrat 0.06 fur Wisconsin 1 Beaver 0.03 fur Wisconsin 1 Otter liver Georgia 3 Otter liver Manitoba males and females 7 Otter liver Winnipeg R. males and females; 7 polluted by point source Otter liver Louisiana 8 Otter liver Ontario residues correlated 9 with acidity 2-23
50 Table 2-4 (continued) Mercury Residues in Tissues of Piscivorous Mammals Species Mercury Tissue Sampling Location Comments Reference (µg/g fresh weight) Otter liver N. Michigan 10 Otter liver New York 11 Otter 96.0 liver Clay Lake, Ontario polluted by point 5 source; death due to poisoning Otter 3.3 (max. = 23.6) liver Wisconsin 1 Mink liver Manitoba 7 Mink 2.1 (max. = 17.4) liver Wisconsin 1 Mink liver Ontario residues correlated 9 with acidity Mink 58.2 liver Saskatchewan polluted by point 5 source; death due to poisoning Mink liver New York 11 Raccoon 2.0 liver Wisconsin 1 Raccoon liver S. Florida 12 Muskrat < 0.02 liver Wisconsin 1 Beaver 0.04 liver Wisconsin 1 References: 1. Sheffy and St. Amant, 1982; mean value. 2. Wren, 1985; one individual. 3. Halbrook et al., 1994; range of means across sampling locations. 2-24
51 Table 2-4 (continued) Mercury Residues in Tissues of Piscivorous Mammals 4. Cumbie, 1975; mean value. 5. Wobeser and Swift, 1976; one individual. 6. Bigler et al., 1975; mean value. 7. Kucera, 1983; Manitoba data are reported as the range of means across sampling locations. Data from the Winnipeg river are reported as a mean value. 8. Beck, 1977; range of means across sampling locations. 9. Wren et al., 1986; range of means across sampling locations. 10. Francis and Bennett, 1994; range of individual values. 11. Foley et al., 1988; range of means across sampling locations. 12. Roelke et al., 1991; range of means across sampling locations. 2-25
52 An examination of Table 2-4 suggests that mercury residues in tissues from mink and otters from Wisconsin (Sheffy and St. Amant, 1982) approached, and in several cases even exceeded, those of the "naturally" poisoned animals. High mercury residues in fur were also reported for river otters trapped in several locations across Georgia (Halbrook, 1994). The livers of raccoons captured in South Florida are also notably high in mercury content (Roelke et al., 1991) Individual Effects Exposure to mercury can cause adverse effects in a wide variety of organisms, including plants, fish, aquatic invertebrates, birds and mammals. In this section, we review information on exposure levels that can cause adverse effects in these groups Individual Effects on Plants Effects of mercury on aquatic plants include death and sublethal effects. Sublethal effects include plant senescence, growth inhibition, decreased chlorophyll content, decreased protein and RNA content, inhibited catalase and protease activities, inhibited and abnormal mitotic activity, increased free amino acid content, discoloration of floating leaves, and leaf and root necrosis (Boney, 1971; Stanley, 1974; Muramoto and Oki, 1984; Mhatre and Chaphekar, 1985; Sarkar and Jana, 1986). The level of mercury that results in toxic effects varies greatly among aquatic plants, as illustrated in Table 2-5. Table 2-5 Toxicity Values for Aquatic Plants Water Type Fresh Water 2+ Hg (HgCl or HgNO 3) (g/l) Methylmercury (g/l) Low End High End Low End High End 53 (alga) 3,400 (submerged 0.8 (alga) 6.0 (alga) aquatic vegetation) Salt Water 10 (alga) 160 (seaweed) Not available Not available Source: U.S. EPA, Mercury can also cause death and sublethal effects in terrestrial plants. Sublethal effects on terrestrial plants include decreased growth, leaf injury, root damage, inhibited root growth and function, hampered nutrient uptake, chlorophyll decline and reduced photosynthesis (Schlegel et al., 1987; Lindqvist, 1991; Godbold, 1991). Methylmercury is more toxic to terrestrial plants than Hg. One to ten nm (nanomolar) mercuric 2+ chloride or methyl mercuric chloride (provided in a nutrient solution) can inhibit root elongation in spruce seedlings. However, methyl mercuric chloride has a greater effect than mercuric chloride at the same concentration (Godbold, 1991). Sublethal effects, including decreased transpiration, decreased chlorophyll concentration, partial stomatal closure, and reduced photosynthesis, occurred at nutrient solution concentrations of 10 nm methyl mercuric chloride (Schlegel et al., 1987). 2-26
53 Individual Effects on Fish and Aquatic Invertebrates The toxicity of mercury to fish has been reviewed by Eisler (1987) and more recently by Wiener and Spry (1995). The highest mercury concentrations in fish generally occur in the blood, spleen, kidney and liver, and may exceed those in muscle by a factor of 2-10 (McKim et al., 1976; Olson et al., 1978; Ribeyre and Boudou, 1984; Boudou and Ribeyre, 1985; Harrison et al., 1990; Niimi and Kissoon, 1994). Owing to the size of these organs relative to that of other tissues, however, most of the mercury contained in a fish at any given time is associated with muscle tissue. The toxicity of mercury varies, depending on the fish's characteristics (e.g., species, life stage, age, and size), environmental factors (e.g., temperature, salinity, dissolved oxygen content, hardness, and the presence of other chemicals), and the form of mercury available. In particular, early life stages (especially of salmonids) 2+ exhibit greater sensitivity to elevated metal concentrations than later life stages. The toxicity of Hg compounds to salmonids and catfish tends to increase with temperature (see Table 2-6). Organomercury compounds, such as 2+ methylmercury, generally are much more acutely toxic than Hg to aquatic organisms. Table 2-6 Mercury Toxicity Increases With Temperature Temperature (C) LC (g/l) 50 Rainbow Trout with HgCl Juvenile Catfish with Phenylmercuric Acetate 10 1, , Source: U.S. EPA, Effects of mercury on fish include death, reduced reproduction, impaired growth and development, behavioral abnormalities, altered blood chemistry, impaired osmoregulation, reduced feeding rates and predatory success, and effects on oxygen exchange. LC 50 values for fish range from 30 g/l for guppies to 1,000 g/l for the Mozambique tilapia (U.S. EPA, 1985). Symptoms of acute mercury poisoning in fish include increased secretion of mucous, flaring of gill opercula, increased respiration rate, loss of equilibrium and sluggishness. Signs of chronic poisoning include emaciation, brain lesions, cataracts, inability to capture food, abnormal motor coordination and various erratic behaviors (e.g., altered feeding behavior) (Weis and Weis, 1989, 1995). It is generally thought that toxic effects are unlikely to occur in fish in the environment, except in the case of point source pollution discharges. An accumulating body of evidence, however, suggests that histological changes and effects on behavior, reproduction, and development can occur at water concentrations as low as
54 g/l (Wiener and Spry, 1995), or about two orders of magnitude higher than those generally associated with unpolluted systems. In a recent study, juvenile walleye were exposed to methylmercury in the diet at concentrations of 0.1 and 1.0 µg/g (Friedmann et al., 1996). Growth, development and hormonal status were impacted at the high dose level. No effects were seen at the lower dose level or in controls. The high dose level used in this study is within a factor of 10 of values reported for macroinvertebrates and forage fish from mercuryimpacted "pristine" lakes (i.e., no known point source) in both Canada and the U.S. (Allard and Stokes, 1989; Sorenson et al., 1990; Watras and Bloom, 1992). 2+ Levels of mercury that induce toxic effects in aquatic invertebrate species vary. For Hg, acute values (LC 50) for invertebrates range from 2.2 g/l for the cladoceran Daphnia pulex to 2,000 g/l for the larval forms of three insects (U.S. EPA, 1985). Examples of some specific toxicity values for fish and aquatic invertebrates are provided in Table Individual Effects on Birds Methylmercury has been shown to be more toxic to birds than inorganic mercury. Mercury poisoning in birds is characterized by muscular incoordination, falling, slowness, fluffed feathers, calmness, withdrawal, hyperactivity, hypoactivity and eyelid drooping (reviewed by Eisler, 1987; Fimreite, 1979; Scheuhammer, 1987, 1991). Acute oral toxicity studies using methylmercury yielded LD 50 values ranging from 2.2 to 23.5 g/g for mallards (Anas platyrhynchos), 11.0 to 27.0 g/g for quail (Coturnix) and 28.3 g/g for northern bobwhite (Colinus virginianus). Some bird kills have occurred, generally due to ingestion of mercury-based fungicides applied to grain. Whole-body residues of mercury in acutely poisoned birds usually exceed 20 g/g fresh weight and have been found up to 126 g/g. Mercury levels observed in such cases are generally highest in the brain, followed by the liver, kidney, muscle and carcass. Sublethal effects of mercury on birds include liver damage, kidney damage, neurobehavioral effects, reduced food consumption, weight loss, spinal cord damage, effects on enzyme systems, reduced cardiovascular function, impaired immune response, reduced muscular coordination, impaired growth and development, altered blood and serum chemistry, and reproductive effects (Eisler, 1987; Scheuhammer, 1987, 1991; MDNR, 1993). Reproductive and behavioral effects are the primary concern, however, and can occur at dietary concentrations well below those that cause overt toxicity. Scheuhammer (1991) concluded that on the basis of laboratory dose-response studies (Heinz, 1976a; Finley and Stendell, 1978), piscivorous birds consuming diets containing >1 g/g (dry weight) methylmercury in their diet (approximately 0.25 g/g wet weight) will accumulate >20 g/g (dry weight) in their feathers. Similar levels in both spiked diets (Heinz, 1974, 1976a,b, 1979) and natural prey sources (Barr, 1986) have been shown to be toxic to birds. Thus, it appears that mercury levels in feathers exceeding 20 g/g should be interpreted as evidence for possible toxic effects. Eisler (1987) recommended that 5.0 g/g fresh weight in feathers be used as a criterion for the protection of birds. Tissue mercury concentrations that are associated with toxicity in birds are remarkably similar despite differences in species, dietary exposure level and length of time necessary to produce the effect (Scheuhammer, 1991). Frank neurological signs are generally associated with brain mercury concentrations of 15 g/g (wet weight) or higher and 30 g/g or more in liver and kidney. Liver mercury concentrations of 2-12 g/g (wet weight) were associated with reproductive impairment in adult pheasants and mallard ducks (Fimreite, 1971; Heinz, 1976a,b). Mortality was observed in newly hatched ducklings 2-28
55 Table 2-7 Toxicity Values for Fish and Aquatic Invertebrates 2+ Organism Hg (HgCl or HgNO 3) (g/l) Methylmercury (g/l) A C U T E (LC ) 50 Fresh water 2.2 (cladoceran) to 2,000 (insect larvae) Not available invertebrates Fresh water fish 30 (guppy) to 1,000 (tilapia) Not available Rainbow trout 155 to to 84 Fresh water AWQC a 2.4 (total mercury) Salt water b 3.5 (mysid) to 400 (soft clam) Not available invertebrates c Salt water fish 36 (juvenile spot) to 1,678 (flounder) 51.1 (mummichog) Salt water AWQC a 2.1 (total mercury) C H R O N I C Fresh water 0.96 (cladoceran) to (cladoceran) < 0.04 (cladoceran) invertebrates Fresh water fish < 0.23 (minnow) to < 0.26 (minnow) 0.29 (brook trout) to 0.93 (brook trout) Fresh water AWQC a (total mercury) Salt water (mysid) Not available invertebrates Salt water AWQC a (total mercury) a AWQCs are designed to be protective of the aquatic community as a whole. b As cited in U.S. EPA, 1985, LC 50s of 10,000 and 8,700 g/l for Atlantic clams (Rangia cuneata) were reported by Olson and Harrell (1973), but Dillon (1977) reported LC 50 values of 58 and 122 g/l for the same clam species. c As cited in U.S. EPA, 1985, an LC 50 of 2,000 g/l for mummichogs was reported by Klaunig et al. (1975), but Dorfman (1977) and Eisler and Hennekey (1977) reported LC 50 values of 800 g/l or less for the same fish species. Source: U.S. EPA, 1985 except where otherwise noted. with brain mercury concentrations of 3-7 g/g (wet weight), while levels four times these values are required to cause mortality in adults (Stoewsand et al., 1974; Finley et al., 1979; Scheuhammer, 1988). Reproductive impairment has been observed in laboratory studies when mercury concentrations in eggs exceed 0.5 g/g (Fimreite, 1971; Heinz, 1974, 1976a,b, 1979). Field studies tend to confirm these results. Reproductive impairment in the loon was associated with mercury levels in eggs ranging from 2-3 g/g (Barr, 1986). Adverse effects on hatching and fledging were observed when mercury concentrations in the eggs of common terns exceeded 3.6 g/g (Fimreite, 1974). Mercury appeared to be a contributing factor to reduced reproductive success in raptors at some locations (Odsjö, 1982; Evans, 1986). In one study, however, hatching in herring gulls appeared to be unaffected, despite the fact that eggs contained upwards of 10 g/g of mercury 2-29
56 (Vermeer et al., 1973). Lowest-observed-adverse-effect level (LOAEL) and no-observed-adverse-effect level (NOAEL) values for effects of methylmercury on avian wildlife are derived in Section of this Volume. Possible effects on populations of selected avian species are discussed in Section of this Volume Individual Effects on Mammals Extensive research on the toxicity of mercury to mammals indicates that effects vary depending on the form of mercury ingested or inhaled. Inorganic mercury is corrosive, and acute exposure to humans and other mammals may cause burning, irritation, salivation, vomiting, bloody diarrhea, upper gastrointestinal tract edema, abdominal pain, and hemorrhaging (Goyer, 1993). Ingestion of mercurial salts in large doses may cause kidney damage (Zalups and Lash, 1994). The main toxic effects due to ingestion of organic mercurials are neurological effects such as paresthesia, visual disturbances, mental disturbances, hallucinations, ataxia, hearing defects, and stupor (Clarkson et al., 1972). Differences between the toxicity of different forms of mercury were demonstrated in a study by Aulerich et al.(1974) using mink (Mustela vison) fed either 5 ppm methylmercury or 10 ppm mercuric chloride. Mink treated with methylmercury died within 30 days, while those treated with mercuric chloride suffered no ill effects. Methylmercury attacks the central nervous systems in mammalian wildlife as well as in humans. The nervous system of the developing fetus may be particularly vulnerable (Bakir et al., 1973), and concern for these effects tends to drive human health risk assessments for mercury (Clarkson, 1990; reviewed in Volume V of this Report). Methylmercury ingestion can also cause reduced food intake, weight loss, muscular atrophy and damage to an animal's heart, lungs, liver, kidneys and stomach (Goyer, 1993; MDNR, 1993). Levels of exposure that induce mercury poisoning in mammals vary among species. Death occurs in sensitive mammal species at g/g bw/d, or g/g in the diet. Smaller animals (e.g., minks and monkeys) are generally more susceptible to mercury poisoning than are larger animals (e.g., mule deer and harp seals), perhaps because of differences in elimination rates. Also, smaller mammals eat more per unit body weight than larger mammals and, thus, may be exposed to larger amounts of mercury on a body weight basis. LOAEL and NOAEL values for effects of methylmercury on mammalian wildlife are derived in Section 4 of this Volume Population Effects Mercury contamination has been documented in endangered species, such as the Florida panther and the wood stork, as well as in populations of loons, eagles and furbearers such as mink and otters. These species experience high exposures because they either are piscivores or eat piscivores Loon Populations It has been suggested by several researchers that loons are at risk from mercury contamination in aquatic food chains. Loons are primarily piscivorous but also consume benthic macroinvertebrates, such as crayfish (Barr, 1973). Mercury levels in crayfish approach and may even exceed those of forage fish from the same lakes (Barr, 1986; Allard and Stokes, 1989). Much of the loon s summer breeding range receives substantial mercury inputs from airborne deposition. In addition, many of these areas are known to be susceptible to acid deposition. As noted previously, a negative correlation often exists between lake water ph and mercury concentrations in fish. 2-30
57 A comprehensive study of mercury toxicity in wild loons was conducted by Barr (1986). Loons were collected from three habitats within the Wabigoon River watershed (Ontario, Canada) both above and below a chlor-alkali plant that discharged mercury into the river. The first habitat (designated C1) consisted of the lakes and river directly downstream of the plant. Habitat C2 did not receive mercury discharges but was accessible to mercury-contaminated fish that originated in C1. Habitat C3 was upstream from the chlor-alkali plant and received no appreciable mercury from other sources. Contaminated fish were prevented from entering C3 by a waterfall. A nearby habitat (C4), not connected to the other three habitats, received no mercury contamination and served as a control. Human disturbances in all habitats were determined to be minimal, and concentrations of organochlorine contaminants were low (less than 0.02 ppm total for all pesticides, including all DDT metabolites, and 0.04 ppm for PCBs). Barr (1986) found a strong negative correlation between mercury levels in water and reproductive success in loons as far as 160 km downstream from the mercury source. Mercury in prey fish and invertebrates declined with increasing distance from the mercury source, but contaminated fish were able to migrate into the uncontaminated C2 habitat. Mercury levels in loon tissues (eggs, liver, muscle and brain in both adults and chicks) were highest in the C1 habitat but were also elevated in the C2 habitat, presumably because loons were feeding on contaminated prey which migrated from C1. Mercury levels in loons from habitat C3 (upstream from mercury source and inaccessible to contaminated fish) were comparable with levels from the uncontaminated control habitat, C4. Most of the mercury in loon tissues, with the exception of the liver, was in the form of methylmercury. Mercury in the liver appeared to be inorganic, suggesting the existence of a demethylation pathway. Dose-response relationships appeared to exist between mercury in prey and reproductive success as well as mercury in various tissues and reproductive success. For example, reductions in egg laying and in nest site and territorial fidelity were associated with prey containing mean mercury concentrations in the range of g/g. Reproductive success was also reduced in loons with brain or egg levels of 2-3 g/g and in loons with liver residues above 13 g/g. No loons reproduced successfully where prey species contained mercury at levels greater than 0.4 g/g. Ensor et al. (1992) captured 93 loons and collected 128 dead or dying loons from 18 northern and central counties in Minnesota. Feathers were collected from live loons. Feathers and liver tissue were collected from the dead loons. In 22 percent of the liver samples, mercury concentrations exceeded 13 g/g, the level associated with impaired reproduction by Barr (1986). Adult loons contained greater concentrations of mercury than juvenile loons in feathers (8.7 vs. 2.7 g/g wet weight) and in the liver (6.6 vs. 1.1 g/g wet weight), as expected for a contaminant which bioaccumulates. The mercury in the juvenile loons was considered to be representative of local mercury contamination since all of their food would have been obtained from lakes within Minnesota. Mercury in adult loons was thought to represent contributions from both the summering grounds (Minnesota) and wintering grounds (Gulf of Mexico). Ensor et al. (1992) concluded that juvenile loons that died of disease had significantly higher mercury levels in feathers than juvenile loons that died from injury or were caught alive. Emaciated loons also had significant (significance level not reported) elevations of mercury in both feathers and liver. It was not clear whether elevated mercury in emaciated loons resulted from concentration of existing mercury stores while body fat and protein were catabolized or whether mercury contributed to the emaciation. The authors concluded that the evidence of adverse impacts on the Minnesota loon population was sufficient to recommend monitoring mercury levels in loon populations. 2-31
58 Working in north central Wisconsin, Belant and Anderson (1990) collected both live and dead loons and addled eggs from abandoned nests. Residues of mercury and 14 organochlorine pesticides were measured in feathers (live and dead loons) and brain, muscle, and liver (dead loons). The conclusions reported in this study were similar to those reached by Ensor et al. (1992). Pesticide concentrations in dead loons were relatively low. In contrast, mercury levels in liver (mean concentration of 40.9 g/kg wet weight) exceeded those associated with reproductive dysfunction as reported by Barr (1986). Scheuhammer and Blancher (1994) reported on mercury levels in fish sampled from lakes throughout Ontario, Canada in areas without known point sources of mercury. Up to 30% of the lakes contained fish with mercury levels that exceeded 0.3 g/kg (wet weight), the level associated with reproductive impairment in loons as reported by Barr (1986). The lack of any identified point source of mercury contamination was considered by the authors to be indirect evidence of airborne deposition of mercury over large portions of Ontario. Preliminary results from an ongoing study of loons in northern Wisconsin were reported by Meyer et al. (1996). A significant negative correlation was found between mercury levels in blood from chicks and lake ph. Chick mortality was also greater on low ph lakes. It was not clear; however, whether these effects can be attributed to mercury or to a general reduction in the prey base of acidic lakes. Previously, it had been shown that mercury levels in blood and feathers of adult loons were negatively correlated with lake ph (Meyer et al., 1995). The viability of loon populations within their traditional habitats in the United States is unclear. None of the studies reviewed was able to demonstrate clear population declines on a regional or national basis. Several studies have found that substantial numbers of loons contain mercury at or above levels associated with reduced reproductive success as reported by Barr (1986). It has also been suggested (but not clearly demonstrated) that sublethal effects of mercury exposure may produce greater susceptibility to environmental stresses, including other contaminants. Mercury also may make loons more susceptible to secondary infections, especially during stressful activities such as molting and migration. Investigations in response to a die-off of over 2,500 loons in the Gulf of Mexico in 1983 found that elevated levels of mercury were associated with abnormally high infestations of parasites (Barr, 1986) Eagle Populations Bald eagles are distributed throughout the United States. Many migrate into the lower forty-eight states only during the winter months; others are resident throughout the year. Bald eagles, like several other avian species, were adversely impacted by DDT and its metabolites during the 1950s, 60s, and 70s. Due to their status as a federally listed "threatened" species, the potential threat of mercury exposure to eagle survival and recovery is a concern. Researchers have measured mercury residues in bald eagle feathers (U.S. FWS, 1993; Welch, 1994; Bowerman, 1994; Wood et al., 1996), eggs (Grier, 1974; Wiemeyer et al., 1984, 1993; Grubb et al., 1990; Anthony et al., 1993; Elliott et al., 1996) and blood (Anthony et al., 1993; U.S. FWS, 1993; Welch, 1994; Wood et al., 1996). Several of these studies have also reported on levels of other contaminants that might threaten eagle reproduction. Wiemeyer et al. (1984) sampled bald eagle eggs that had failed to hatch from nests located in 14 states between 1969 and 1979; eggs were tested for organochlorine residues and mercury. The highest levels of mercury were detected in eggs from Maine. Eight organic contaminants were negatively correlated with eggshell 2-32
59 thinning, a trait often linked with reproductive failure in birds. When mercury levels were compared with the mean 5-year production rate for eagle nests, a weak negative correlation was found, suggesting an adverse effect of mercury. The analysis was confounded, however, by the co-occurrence of DDE in many of the eggs with the highest mercury levels. The authors concluded that mercury contamination appears to have the potential for adverse effects on eagle production in only a few of the breeding areas sampled, primarily in Maine. Continuing the work begun earlier, Wiemeyer et al. (1993) collected eggs that had failed to hatch from nests in 15 states between 1980 and 1984 and analyzed them for organochlorine pesticides, polychlorinated biphenyls (PCBs) and mercury. These data were then combined with the data collected previously (Wiemeyer et al., 1984). As before, DDE was the contaminant most significantly (negatively) correlated with eggshell thinning, with DDD, DDT and PCBs significantly, but less strongly, correlated. The highest levels of DDE, PCBs and mercury occurred in eggs collected in Maine. Mercury levels in eagle eggs, at or above 0.28 g/g (wet weight), were significantly correlated with a reduction in mean 5-year production rate for eagle nests. This value is comparable to the negative effect value of 0.5 g/g derived earlier (Wiemeyer et al., 1984). The authors noted, however, that only three egg samples (all from Maine) contained mercury levels greater than 0.5 g/g and that these eggs also contained levels of DDE known to reduce eagle productivity (>6 g/g). Wiemeyer et al. (1993) concluded that recent data provide even less evidence than previously indicated (Wiemeyer et al., 1984) that contaminants other that DDE are adversely impacting bald eagle productivity. Grubb et al. (1990), Grier (1974), and Anthony et al. (1993) reached similar conclusions on the lack of evidence for an association between mercury levels and reproductive failure in bald eagles. Bowerman and co-workers (Bowerman, 1993; Bowerman et al. 1994) examined the productivity of bald eagles in six geographic regions, including Lakes Superior, Michigan, Huron, and Erie and the states of Michigan and Minnesota. Significant negative correlations existed between plasma levels of PCB and p,p'-dde and reproductive success. Mercury levels in feathers ranged from 9.0 to 23.4 g/g but were not correlated with reproductive success. Welch (1994) sampled eggs, blood and feathers from Maine bald eagles and analyzed them for organochlorine pesticides, PCBs, TCDD equivalents (TCDD-eq), and mercury. Mercury levels in inland eagles were higher than concentrations in eagles inhabiting the coastline. In general, these elevated mercury levels appeared to be related to mercury residues in fish from the two areas. Productivity was also lower for inland eagle nests; however, the correlation of mercury levels in blood and feathers with mean productivity (5 and 15 years) was not significant. Mercury concentrations in eagle eggs from British Columbia approached and in some instances exceeded the level (0.28 g/g) associated with long-term declines in eagle populations as reported by Wiemeyer et al. (1993). However, populations in this region appeared at the time of the study to be increasing. Mercury residues in feathers, blood and livers from eagles in central Florida were lower than those determined for most other wild eagle populations (Wood et al., 1996). One of the difficulties in evaluating the effect of mercury on the bald eagle is the co-occurrence of organochlorine compounds such as PCBs, DDE and TCDDs at levels that may have adverse effects on reproduction. Bowerman (1993) hypothesized that the effect of the organochlorine contaminants may be masking the effect of mercury. The U.S. Fish and Wildlife Service (1993) also suggested that, while mercury was not found in Florida bald eagles at lethal levels, sublethal levels may be adversely affecting eagle reproduction. Historical data suggest that eagle populations in the Great Lakes Basin are still well below the 2-33
60 region s carrying capacity. In contrast, eagle populations on many inland waters appear to be doing well (Colborn, 1991; Bowerman, 1993; Bowerman et al., 1994) Wood Stork Populations Mercury has been detected in feathers of the endangered wood stork, although the levels found apparently have not caused toxic effects. Young wood storks in Florida had mercury levels of 1.87 g/g dry weight; higher mercury levels would be expected for adults from the same area (Burger et al., 1993). Fleming et al. (1984) reported mercury levels of 0.66 g/g wet weight in wood stork eggs, which is somewhat less than Eisler's (1987) recommended criterion of < g/g wet weight in eggs Other Wading Birds The wading bird population in Florida has declined substantially since the 1940's (Ogden, 1994). While a variety of factors have been implicated, cause-and-effect relationships remain difficult to establish. The possible effect of mercury on wading birds was investigated by Spalding et al. (1994) and Sundlof et al. (1994). In general, there is a positive relationship between mercury residues in wading birds and the trophic level at which they feed (Sundlof et al., 1994). Mercury levels in livers of birds that feed on fish (e.g., Great Blue Heron, Great White Heron, and Great Egret) exceeded, in several instances, those associated by other authors with neurologic signs in birds (30 g/g wet weight) (Scheuhammer, 1991) Furbearer Populations In one Ontario incident, an eagle was found scavenging on a mercury-poisoned dead otter at Clay Lake (Wren, 1985). Mercury levels in the otter (liver - 96 g/g; kidneys - 58 g/g; brain - 30 g/g) were well above those known to be toxic to otters in laboratory exposures. The primary source of the mercury was a chlor-alkali plant that discharged mercury directly into the river. In a separate incident, a mink exhibiting unnatural behavior was collected near the mercury-contaminated Saskatchewan River (Wobeser and Swift, 1976). Subsequent determination of mercury levels in the liver (58 g/g), kidney (32.9 g/g), muscle (15.2 g/g), brain (13.4 g/g) and fur (34.9 g/g), combined with clinical and pathologic findings, were deemed sufficient by the authors to conclude that the animal had been poisoned by mercury. Residue levels found in this animal exceeded those determined in laboratory studies to be associated with toxicity. The origins of mercury in this case could not be determined; however, it was observed that fish from the Saskatchewan River contain mercury at concentrations higher than those known to cause toxicity to mink in laboratory studies. In a study of furbearers obtained from trappers in the Wisconsin River watershed ( ), otters contained the highest tissue mercury levels, followed by minks, raccoons, foxes, muskrats and beavers (Sheffy and St. Amant, 1982). Liver mercury concentrations reported by Halbrook et al. (1994) for otters collected from the coastal plain of Georgia ( g/g) were approximately one-third the levels reported for otters and mink that died in experimental dosing studies (Aulerich et al., 1974; Wobeser et al., 1976; O Conner and Nielson, 1981), and it was speculated by these authors that sublethal behavioral and reproductive impacts could result in population level effects. 2-34
61 Mink populations, like those of the otter, have declined substantially in the Southeastern coastal states, particularly in the coastal plain. Mercury concentrations in mink from the coastal plain were found to be higher than those in mink from inland areas, and were in the range (3.5 g/g in kidney) of those known to be associated with reproductive and behavioral effects in laboratory studies (Osowski et al., 1995). Liver PCB levels were also found to be significantly elevated. In this regard, it is of interest to note studies with mink which suggest that mercury and PCBs can act synergistically to reduce reproductive success (Wren et al., 1987). Giesy et al. (1994) determined that PCBs and mercury do not pose a threat to mink on three Michigan rivers. As with most assessments of this type, however, combined impacts were not considered Florida Panther Populations Mercury is suspected of contributing to the death of one and possibly more endangered Florida panthers. The Florida Panther Interagency Committee (FPIC) reported that approximately 100 ppm of mercury was detected in the liver and 130 ppm in the hair of a 4-year-old female panther (FPIC, 1989). The panther, No. 27, had been radio-instrumented since 1988 and was found dead in the eastern part of the Florida Everglades National Park (FPIC, 1989). Relatively high levels of mercury ( ppm) were detected in archived liver samples from six dead panthers, and levels ranging from ppm have been measured in the hair samples from ten live individuals. The FPIC concluded that panther No. 27 died of mercury poisoning; however, the cause of death of the six archived animals was not mentioned in their report. The most probable source of mercury contamination in Florida panthers is via the food chain. The diet of the Florida panther includes both raccoons and white-tailed deer but varies greatly depending on prey availability. Mercury contamination in raccoons has been found to occur in a distributional pattern that coincides with the species range of Florida panthers (Roelke et al., 1991). The accumulation of mercury in raccoons is due to consumption of contaminated aquatic life, including invertebrates, fish and amphibians. The panthers most at risk, therefore, appear to be those that consume mercury-contaminated raccoons. Panthers that prey on deer are less exposed to mercury because deer are herbivores and accumulate less mercury. Based upon the findings of the FPIC, habitat modifications have been implemented in the Florida Everglades to increase local deer herds. In addition to mortality, mercury contamination could decrease reproductive success in the Florida panther. Methylmercury ingested by a pregnant mammal passes through the placenta to the developing fetus, potentially causing abortions, stillbirths, congenital defects and behavioral modifications that result in the death of neonates. Roelke et al. (1991) found a significant inverse correlation between mercury concentrations in mother panthers and survivorship of the young. Because so few Florida panthers remain (only 30 to 50 in the wild) (Jordan, 1990), the possibility exists that mercury contamination could contribute to the extinction of this endangered species (Roelke et al., 1991). However, mercury is but one of several stressors that may be affecting the panther. Habitat fragmentation, inbreeding (Roelke et al., 1993), and feminization by endocrine disrupting compounds (Facemire et al., 1995) have all been implicated as causative factors in the decline of this species. 2-35
62 2.3.4 Communities and Ecosystems Aquatic Communities and Ecosystems Effects of contaminants on aquatic communities have been investigated by examining functional and structural responses of natural assemblages in laboratory settings to toxic substances added singly or in combination. The species diversity of freshwater and brackish-water microbial communities was reduced by exposure to 40 g/l of mercuric chloride (Singleton and Guthrie, 1977). Carbon fixation was reduced by 50 percent in freshwater phytoplankton communities exposed to 0.4 g/l of mercuric chloride, but this effect was mitigated by the presence of humus or sediment (Hongve et al., 1980). Mercuric chloride (0.5 g/l) administered to a marine aquatic community inhibited phytoplankton growth, killed or retarded development in copepods, and increased the number of viable bacteria (Kuiper, 1981). The species composition of the phytoplankton also changed, possibly due to selective reduction of predation by the copepods. Bacterial populations may have increased due to increased food supply in the form of dead phytoplankton (Kuiper, 1981). +2 In general, mercury concentrations (as Hg ) required to elicit toxic effects on natural aquatic communities exceed those commonly measured in surface waters by two or more orders of magnitude (low ng/l in waters not impacted by point source discharge) (Spry and Wiener, 1991; Wiener and Spry, 1995). Studies of the effects of methylmercury on aquatic assemblages were not found, however, and it can be reasonably anticipated that the toxicity of methylmercury to these communities would exceed that of mercuric chloride. Effects of mercury or any other substance at this level of biological organization could potentially have farreaching impacts on the entire food chain by changing both nutrient and energy fluxes. Field studies of mercury occurrence and effects at the community level are not available. Moreover, interpreting field studies can be difficult because more than one stressor is often present. Elevated concentrations of mercury have been found in several species of piscivorous wildlife that have experienced reproductive failure in the Great Lakes region (e.g., Caspian terns, herring gulls, double-crested cormorants, and mink) (Peakall, 1988; Colborn, 1991; Environment Canada, 1991; Gilbertson et al., 1991). However, other bioaccumulative contaminants, such as PCBs, dioxins and DDT/DDE, have been implicated as the most likely causative agents (Colborn, 1991; Gilbertson et al., 1991) Terrestrial Communities and Ecosystems As noted previously, atmospherically deposited heavy metals such as mercury tend to accumulate in top soils. This results in particularly high exposures in decomposer communities, which play a crucial role within the natural nutrient cycles of terrestrial ecosystems. Mercury forms stable complexes with organic substances of high molecular weight (humic acids) and exhibits limited mobility within soils. Processes that may be affected by heavy metals in top soil include litter decomposition, carbon mineralization, nitrogen transformation and enzyme activity. Mercury effects on soil microorganisms vary depending on soil type (Zelles et al., 1986). Mercury generally inhibits heat production, respiration and iron reduction by soil microorganisms in sandy soils and, to a lesser extent, in clay. At some intermediate concentrations, however, mercury may stimulate microbial activity in peat (Zelles et al., 1986). It is difficult to estimate specific toxic levels for microbial-mediated processes in decomposer communities due to widely differing soil properties and methodological discrepancies in the literature. In a report on mercury in the Swedish environment, Lindqvist (1991) cites a study in which soil microbial activity was significantly reduced at mercury concentrations ranging from g/g dry weight of humus. The 2-36
63 concentration of mercury in forest soils in Sweden is in the range g/g. In a second cited study, however, the mercury concentration in soil required to reduce soil microbial activity was 50 g/g. A common effect of metal contamination on soil animal groups is a decrease in species diversity. In some species, susceptibility to metals may be a secondary effect due to differences in food availability rather than metal toxicity per se Conclusions Of the pathways by which ecosystems and components of ecosystems might be exposed to atmospheric mercury, exposure of high trophic level wildlife to mercury in food is particularly important. The trophic level and feeding habits of an animal influence the degree to which it is exposed to mercury. Mercury biomagnifies in aquatic food chains resulting in increasing tissue concentrations of mercury as trophic level increases. Predatory animals primarily associated with aquatic food chains accumulate more mercury than those associated with terrestrial food chains. Thus, piscivores and other carnivores that prey on piscivores generally have the highest exposure to mercury. In a study of furbearing mammals in Wisconsin, the species with the highest tissue levels of mercury were otter and mink, which are top mammalian predators on aquatic food chains (Sheffy and St. Amant, 1982). Top avian predators of aquatic-based food chains include raptors, such as the osprey and bald eagle. Smaller birds feeding at lower levels in aquatic food chains also may be exposed to substantial amounts of mercury due to their high food consumption rate (consumption/kg bw/d) relative to larger birds. Although clear causal links have not been established, mercury originating from airborne deposition may be a contributing factor to population effects on several wading birds, loons, river otters, mink, and the Florida panther. Effects of mercury originating from point sources on restricted wildlife populations have been conclusively demonstrated and provide a tissue residue basis for evaluation of risk to other populations. Based upon reviews of both laboratory and field data, mercury levels that exceed the following values (in g/g fresh weight) have been suggested as evidence for possible adverse impacts on avian populations: feathers - 20 g/g (Scheuhammer, 1991); eggs g/g (after conversion from dry weight) (Scheuhammer, 1991); liver - 5 g/g (Zillioux et al., 1993). Such criteria must be used with caution, however, as residue thresholds both above and below these values have been reported. Field data for mammals are not as extensive as those for birds. Mercury residues in mink and otter that were thought to have been poisoned by mercury originating from a point source exceeded those seen in dead laboratory animals by a factor of two or more (see Section ) (Wren, 1991). The reason for this variation is presently unknown. Additional information is needed before tissue-residue-based criteria for piscivorous mammals can be developed. Criterion values for fish and water that are designed to be protective of piscivorous wildlife are calculated in Section 5 of this Volume. 2.4 Ecosystems Potentially at Risk The information presented in Sections 2.1 through 2.3 suggests that the ecosystems most at risk from mercury releases to air exhibit one or more of the following characteristics: they are located in areas that experience high levels of atmospheric deposition; they include surface waters already impacted by acid deposition; they possess characteristics other than low ph that result in high levels of mercury bioaccumulation in aquatic biota; 2-37
64 they include species that experience high levels of exposure (e.g., piscivorous birds and mammals) Highly Exposed Areas Ecosystems subjected to high levels of mercury deposition (e.g., near sources of mercury emissions or in areas with high deposition rates) will be more exposed to mercury than ecosystems with lower levels of mercury deposition. The pattern of mercury deposition nationwide, therefore, will influence which ecoregions and ecosystems might be exposed to hazardous levels of mercury Lakes and Streams Impacted by Acid Deposition In many aquatic systems, the tendency for mercury to bioaccumulate in fish is inversely correlated with ph and alkalinity (or acid neutralizing capacity) (reviewed by Spry and Wiener, 1991). Thus, fish in acidic lakes (ph 6.0 to 6.5 or less) often have higher body or tissue burdens of mercury than fish in nearby lakes with higher ph. This relationship has been found for a variety of fish species and water bodies, including the following: various fish species in 14 lakes and 31 streams in Florida (FDER, 1990); yellow perch from lakes in the Upper Michigan peninsula (Grieb et al., 1990); yellow perch from seepage lakes in Northern Wisconsin (Cope et al., 1990); yellow perch from an experimentally acidified lake in Northern Wisconsin (Wiener et al., 1990); yellow perch from Southern Ontario lakes (Suns and Hitchin, 1990); yellow perch from 12 Adirondack lakes (Simonin et al., 1994); walleyes from Wisconsin lakes (Lathrop et al., 1991); largemouth bass from 53 lakes in Florida (Lange et al., 1993); northern pike from 80 Minnesota lakes (Sorensen et al., 1990); and smallmouth bass from Ontario lakes (McMurtry et al., 1989). The increased accumulation of mercury in low ph lakes appears to be due largely to increased microbial production of methylmercury (Xun et al, 1987; Bloom et al., 1991; Miskimmin et al., 1992), although biogeochemical processes that release mercury from sediments have also been implicated (Rada et al., 1993). The bioavailability of methylmercury is probably also enhanced by decreased levels of calcium, as is typical of such lakes. There are, however, exceptions to the general relationship between ph and bioaccumulation of mercury (Fjeld and Rognerud, 1993), and it has been suggested that clear correlations between ph and mercury bioaccumulation are likely to occur only when mercury deposits onto seepage lakes (Richardson et al., 1995). 2-38
65 2.4.3 Dissolved Organic Carbon DOC appears to be an important determinant of mercury translocation from watersheds to waterbodies and, in many systems, may be a better predictor of fish mercury residues than ph (McMurtry et al., 1989; Nilsson and Hakanson, 1992; Fjeld and Rognerud, 1993; Driscoll et al., 1994,1995; Watras et al., 1995b,c). However, high concentrations of DOC may also complex methylmercury, diminishing its bioavailability (Driscoll et al., 1994,1995; Hintelmann et al., 1995). Methylmercury uptake across the gills of the Sacramento blackfish was measured directly by Choi et al. (1997). The addition of moderate amounts of DOC to the exposure water dramatically reduced this uptake. DOC has been shown to reduce the bioavailability of neutral organic compounds to freshwater invertebrates (Landrum et al., 1985). Studies of this type have not yet been conducted with mercury Factors in Addition to ph and DOC that Contribute to Increased Bioaccumulation of Mercury in Aquatic Biota Numerous factors in addition to ph and DOC can influence the bioaccumulation of mercury in aquatic biota. These include the length of the aquatic food chain (Cabana and Rasmussen, 1994; Cabana et al., 1994; Futter, 1994) and water temperature (Bodaly et al., 1993). Physical and chemical characteristics of a watershed affect the amount of mercury that is translocated from soils to water bodies (McMurtry et al., 1989, Johnston et al., 1991; St. Louis et al., 1994; Joslin, 1994; Hurley et al., 1995). Interrelationships between these factors are poorly understood, however, and there is no single factor that has been correlated with mercury bioaccumulation in all cases examined Sensitive Species For the purposes of this discussion, sensitive species are defined as those species that are more likely than others to experience adverse effects due to mercury contamination. Such species may or may not be inherently more sensitive on an absorbed dose basis. Sensitive species also may be at risk because they receive high methylmercury exposures due to their position in the food chain or because their populations are already stressed. In the first category are top-level predators of aquatic-based food webs exposed to high concentrations of mercury in their prey. Examples include piscivorous raptors (e.g., bald eagles and ospreys), waterbirds (e.g., herons, gulls, kingfishers, and cormorants), and mammals (e.g., mink and otter). The second category includes threatened and endangered species, which are species that have already experienced severe population declines and are at risk of further population declines or extinction (e.g., Florida panther). 2.5 Endpoint Selection U.S. EPA distinguishes two types of endpoints for ecological risk assessment purposes: assessment endpoints and measurement endpoints (see text box). Assessment endpoints are explicit expressions of the actual environmental value that is to be protected. Often, the assessment endpoint cannot be measured directly, so a risk assessor selects one or more measurement endpoints that can be related, either quantitatively or qualitatively, to the assessment endpoint (U.S. EPA, 1992a). In its draft guidance on risk assessment procedures, U.S. EPA (1996) suggested that the term "measurement endpoint" be replaced by the term "measure of effect." It was deemed prudent for this Report, however, to utilize established terminology until the draft guidelines are finalized. 2-39
66 A goal of the problem formulation phase in an assessment is to select assessment endpoints that are relevant to decisions to be made. Factors relevant to the selection of these endpoints include: (1) ecological relevance; (2) susceptibility to known or potential stressors; and (3) representation of management goals (U.S. EPA, 1992a, 1996). Endpoints for Ecological Risk Assessment Assessment endpoint - an explicit expression of the environmental value that is to be protected (U.S. EPA, 1992a). Measurement endpoint - a measurable ecological characteristic that is related to the valued characteristic chosen as the assessment endpoint. (U.S. EPA, 1992a). Table 2-8 provides examples of ecological assessment and measurement endpoints at various levels of biological organization. In current practice, the most tractable endpoints are at the individual or population level and include mortality, growth, development and reproduction. Based on the information provided in Sections 2.1 through 2.4, the ecological components that appear to be most at risk from atmospheric mercury are piscivorous mammals and birds that feed at or near the top of aquatic food chains. This is particularly true of threatened or endangered species that already have suffered population declines due to one or more causes. An appropriate assessment endpoint, therefore, would be maintenance of self-sustaining populations of these species. Appropriate measurement endpoints for exposed wildlife species would include growth and survival of adults or other life-stages, reproductive success, and behavioral impacts. Alternatively, when such data are difficult to collect, it may be necessary to infer adverse effects on wildlife from laboratory toxicity studies. 2.6 Conceptual Model for Mercury Fate and Effects in the Environment An important product of the problem formulation phase in ecological risk assessment is a conceptual model of how the stressor may affect ecological components of the natural environment (U.S. EPA, 1992a,1996). The conceptual model identifies the ecosystem(s) potentially at risk, exposure pathways between sources and receptors, and the relationship(s) between measurement and assessment endpoints. A preliminary analysis of the ecosystem, stressor characteristics, and ecological effects helps to define possible exposure scenarios (i.e., qualitative descriptions of how the stressors co-occur with or contact the various ecological components). A conceptual model of the ecological effects of airborne mercury emissions can be visualized using Figures 2-1 through 2-5. Mercury is emitted to the atmosphere primarily as the elemental form or as an inorganic ion. Inorganic mercury returns to earth in wet deposition due to its relatively high solubility in water and because it adsorbs to airborne particulates. Elemental mercury has a long half-life in the atmosphere and tends to stay aloft but may react with other chemicals to form inorganic mercury species. Wet deposition containing mercury falls onto watersheds or directly on water bodies. Mercury deposited onto watersheds is rapidly bound to organic matter and tends to accumulate over time. A portion of this mercury is released, however, and is transported in runoff and groundwater to receiving waters such as lakes, streams and wetlands. Biotic and abiotic chemical reactions transform mercury in water and associated sediments to organic derivatives (primarily methylmercury). Organomercurial compounds then accumulate in aquatic food chains due both to their tendency to become sequestered in tissues and to the efficiency with which they are transferred from one trophic level to another. Eventually, mercury in fish is consumed by piscivorous wildlife, with the resulting potential for adverse toxicological effects. Uptake 2-40
67 Table 2-8 Examples of Assessment and Measurement Endpoints Level of Organization Assessment Endpoints Measurement Endpoints Biodiversity Habitat area a Ecoregion Regional production Regional production Landscape aesthetics Other landscape descriptors Ecosystem Productive capability Nutrient balance Soil balance Habitat area Biomass Productivity Nutrient export Recreational quality Species number Change to less useful/desired type Species evenness Community Market/sport value Species diversity Market/sport value Saprobic index Extinction Occurrence Abundance Numbers/density Yield/production Age structure Population Frequent gross morbidity Fecundity Massive mortality Yield/production Range Frequency of gross morbidity Mortality rate Survival Longevity Growth and development Growth and development Individual Reproduction Fecundity Good physical condition Overt symptomology Biomarkers Abiotic Habitat quality Temperature Water flow Soil characteristics Sediment characteristics a An ecoregion is an area (region) of relative homogeneity in ecological systems (based on elevation, soils, latitude, precipitation). Source: Adapted from U.S. EPA, pathways other than consumption of contaminated prey (e.g., inhalation and drinking of contaminated water) are considered to be of little consequence for piscivorous birds and mammals. 2.7 Analysis Plan The final goal of the problem formulation phase of an assessment is to develop a plan for subsequent analyses of exposure and effect (U.S. EPA, 1996). In Chapter 3 of this Volume, an attempt is made to 2-41
68 characterize the exposure of piscivorous avian and mammalian wildlife to airborne mercury and to link these exposures with information pertaining to specific emissions categories. A stepwise approach was taken, with each step representing an increased level of complexity and uncertainty. Field residue data were used to the maximum extent possible for characterization of mercury bioaccumulation and biomagnification in fish. These data are believed to be better suited for this purpose than laboratory bioconcentration and bioaccumulation data. Using a previously derived "national average" mercury concentration in fish, exposures to selected wildlife species were estimated using published exposure factors. Air dispersion models were employed in this analysis, progressing from the use of a long-range transport model to estimate mercury deposition on a regional basis to the combined use of both local-scale and long-range models. Mercury deposition estimates on a regional scale were compared with the distributions of sensitive wildlife species. Finally, an effort was made to determine whether wildlife living in close proximity to a mercury emissions source experience particularly high exposures leading potentially to adverse impacts within relatively small geographical regions. An effects assessment is conducted in Chapter 4 of this Volume by reviewing pertinent toxicology testing data, with priority given to long-term dietary exposures with wildlife species. A review of data on mercury elimination suggested the need to evaluate species differences in mercury toxicokinetics and the ameliorative effects of selenium supplementation. The primary goals of this assessment were: (1) to estimate toxic dose levels for piscivorous wildlife and (2) to provide guidance on the rational use of uncertainty factors for subsequent analyses of risk and the development of protective exposure criteria. 2-42
69 3. EXPOSURE OF PISCIVOROUS AVIAN AND MAMMALIAN WILDLIFE TO AIRBORNE MERCURY 3.1 Objectives and Approach The objective of this analysis was to characterize the extent to which piscivorous wildlife are exposed to mercury originating from airborne emissions. Three general approaches were used, which may be described as follows. 1. Estimation of current average exposure to piscivorous wildlife on a nationwide basis (Section 3.2). Estimates of current mercury exposure to selected piscivorous wildlife species were calculated as the product of the fish consumption rate and measured mercury concentrations in fish. This was not intended to be a site-specific analysis, but was instead intended to provide national exposure estimates for piscivorous wildlife based on typical mercury concentrations in fish. This analysis utilized mean total mercury measurements from two nationwide studies of fish residues and published fish consumption data for the selected wildlife species. 2. Estimation of mercury deposition on a regional scale (40 km grid) and comparison of these data with species distribution information (Section 3.3). A long-range atmospheric transport model (RELMAP) was used in conjunction with a mercury emissions inventory to generate predictions of mercury deposition across the continental U.S. This information was then compared with wildlife species distributions to characterize the potential for co-occurrence of high mercury deposition rates and the presence of wildlife species of concern. 3. Estimation of mercury deposition on a local scale in areas near emissions point sources (Section 3.4). A local-scale atmospheric transport model (GAS-ISC3) was used to simulate mercury deposition originating from four different mercury emissions source classes. The analysis was conducted for two hypothetical lakes located in the western and eastern U.S. The proximity of these lakes to the source was varied to examine the effect of this parameter on model predictions. To account for the long-range transport of emitted mercury, the 50th percentile RELMAP atmospheric concentrations and deposition rates were included in the estimates from the local air dispersion model. To account for other sources of mercury, estimates of background concentrations of mercury were also included in this exposure assessment. 3.2 Description of Computer Models The models used for the wildlife exposure assessment are identical to those used for the human exposure assessment (see Volume IV of this Report) and are described in detail in Volume III of this Report. Atmospheric transport models were used to simulate the deposition of mercury at two different geographical scales (see Table 3-1). A regional-scale analysis was conducted using the Regional Lagrangian Model of Air Pollution (RELMAP). RELMAP calculates annual mean air concentrations and annual mean deposition rates for each cell in a 40 km grid. This analysis covered the 48 contiguous states and was based upon a recent inventory of mercury emissions sources (see Volume II of this Report). 3-1
70 Table 3-1 Models Used to Predict Mercury Air Concentrations, Deposition Fluxes and Environmental Concentrations Model RELMAP GAS-ISC3 IEM-2M Description Predicts average annual atmospheric mercury concentration and wet and dry 2 deposition flux for each 40 km grid in the U.S. due to all anthropocentric sources of mercury in the U.S. and a natural background atmospheric mercury concentration. Predicts average concentration and deposition fluxes within 50 km of emission source. Predicts environmental concentrations based on air concentrations and deposition rates to watershed and water body. The local-scale exposure analysis was conducted using both RELMAP and a local air transport model, GAS-ISC3, to generate hypothetical exposure scenarios for four mercury emission source classes. GAS-ISC3 uses hourly meteorological data to estimate hourly air concentrations and deposition fluxes within 50 km of a point source. For each hour, general plume characteristics are estimated based on the source parameters (gas exit velocity, temperature, stack diameter, stack height, wind speed at stack top, and atmospheric stability conditions) for that hour. GAS-ISC3 was run using one year of actual meteorological data (1989, the same meteorologic year as was utilized in the RELMAP modeling). The average annual predicted values for air concentration and deposition rates were then used as inputs to the IEM-2M model. Finally, the IEM-2M model was used to simulate the result of deposition over a 30 year period, which is the assumed typical lifetime of a facility. The IEM-2M model was used to translate both regional and local-scale mercury deposition estimates into mercury levels in soil, water and biota. Mercury levels in fish were calculated from average water concentrations using estimated BAFs for fish occupying trophic levels 3 and 4. It was assumed throughout the wildlife exposure analysis that 100% of mercury contained in fish exists as methylmercury. IEM-2M is composed of two integrated modules that simulate mercury fate using mass balance equations describing watershed soils and a shallow lake. IEM-2M simulates three chemical components -- elemental 0 2+ mercury (Hg ), divalent mercury (Hg ), and methylmercury (MHg). The mass balances are performed for each 0 2+ mercury component, with internal transformation rates linking Hg, Hg, and MHg. Sources include wetfall and dryfall loadings of each component to watershed soils and to the water body. An additional source is diffusion of 0 atmospheric Hg vapor to watershed soils and the water body. Sinks include leaching of each component from 0 watershed soils, burial of each component in lake sediments, volatilization of Hg and MHg from the soil and water column, and advection of each component out of the lake. At the core of IEM-2M are nine differential equations describing the mass balance of each mercury component in the surficial soil layer, in the water column, and in the surficial benthic sediments. The equations are solved for a specified interval of time, and predicted concentrations output at fixed intervals. For each calculational time step, IEM-2M first performs a terrestrial mass balance to obtain mercury concentrations in watershed soils. Soil concentrations are used along with vapor concentrations and deposition rates to calculate concentrations in various food plants. These are used, in turn, to calculate concentrations in animals. IEM-2M simultaneously performs an aquatic mass balance driven by direct atmospheric deposition along with runoff and 3-2
71 erosion loads from watershed soils. MHg concentrations in fish are derived from dissolved MHg water concentrations using bioaccumulation factors (BAFs). Mercury residues in fish were estimated by making the simplifying assumption that aquatic food chains can be adequately represented using four trophic levels. Respectively, these trophic levels are the following: level 1 - phytoplankton (algal producers); level 2 - zooplankton (primary herbivorous consumers); level 3 - small forage fish (secondary consumers); and level 4 - larger, piscivorous fish (tertiary consumers). This type of food chain typifies the pelagic assemblages found in large freshwater lakes and has been used extensively to model bioaccumulation of hydrophobic organic compounds (see for example Thomann, 1989; Clark, 1990; and Gobas, 1993). It is recognized, however, that food chain structure can vary considerably among aquatic systems resulting in large differences in bioaccumulation in a given species of fish (Futter, 1994; Cabana et al., 1994a,b). In addition, this simplified structure ignores several important groupings of organisms, including benthic detritivores, macroinvertebrates, and herbivorous fishes. The second simplifying assumption utilized in this effort was that methylmercury concentrations in fish are directly proportional to dissolved methylmercury concentrations in the water column. It is recognized that this relationship can vary widely among both physically similar and dissimilar water bodies. Methylmercury concentrations in fish were derived from predicted water column concentrations of dissolved methylmercury by using BAFs for trophic levels 3 and 4 (see Table 3-2). The BAFs selected for these calculations were estimated from existing field data. Respectively, these BAFs (dissolved methylmercury basis) 6 6 are 6.8 x 10 and 1.6 x 10. Methylmercury was estimated to constitute 7.8% of the total dissolved mercury in the water column. The technical basis for these estimates is presented in Volume III, Appendix D. The variability around these predicted fish residue values is highlighted in Table 3-2. Percentile information for the BAF estimates developed in Appendix D of Volume III are presented. This table demonstrates the large variability in fish residues that may occur at a given methylmercury water concentration. This variability is largely due to the variability in field-derived BAF values. Table 3-2 Percentiles of the Methylmercury Bioaccumulation Factor Parameter Percentile of Distribution 5th 25th 50th 75th 95th Trophic 3 BAF 4.6 x x x x10 5.4x Trophic 4 BAF 3.3x10 5.0x10 6.8x10 9.2x10 1.4x Current Exposure of Piscivorous Wildlife to Mercury Four avian species (eagle, common loon, kingfisher and osprey) and two mammalian species (otter and mink) were assumed to be exposed to methylmercury through the ingestion of contaminated fish. Fish consumption is thought to be the dominant mercury exposure pathway for piscivores (see Chapter 2 of this Volume). Consequently, an analysis of these ecological receptors' methylmercury contact rate based on the daily ingestion rate of fish is reasonable and appropriate. 3-3
72 The piscivorous bird's or mammal's methylmercury contact rate from fish consumption can be estimated as the product of methylmercury levels in the fish and the daily amount of fish eaten. The trophic level at which piscivores feed significantly impacts their exposure to methylmercury. Those piscivores consuming a diet primarily consisting of trophic level 3 fish are expected to ingest approximately five times less methylmercury per gram of fish eaten than those eating trophic level 4 fish from the same site. Animals consuming a mixture of trophic level 3 and 4 fish would experience (on a per gram of fish basis) an intermediate level of exposure. Finally, many top level predators consume a mixture of both aquatic and terrestrially-derived prey. In general, mercury levels in the tissues of terrestrial animals are much lower than those of fish. A special case exists, however, when a terrestrial animal (e.g., a raccoon) feeds on aquatic biota and is itself preyed upon by a larger terrestrial animal (e.g., the Florida panther). A similar situation exists when a piscivorous bird (e.g., the herring gull) is consumed by a larger bird (e.g., the bald eagle). In these situations, the potential exists for the top predator to obtain a higher mercury dose than it would otherwise receive from a strictly fish-based diet. The extent of this increase depends, in turn, upon the proportion of the diet composed of these mammalian and avian prey items and the extent to which the prey items accumulate mercury in excess of levels found at trophic levels 3 and 4. Exposure factors for the present analysis were obtained from two recent compilations of wildlife dietary habits (U.S. EPA, 1993a, 1995a) and are shown in Table 3-3. Bald eagles were assumed to eat fish derived from trophic levels 3 and 4, as well as prey derived from other sources. Expressed as percentages, these prey items were assumed to contribute 74, 18 and 8% of the daily dietary intake. For this Report, dietary items other than fish were assumed to contain no mercury. Eagles are, therefore, expected to experience a greater methylmercury exposure per gram of fish consumed than ospreys, loons, and kingfishers, which were assumed to consume only trophic level 3 fish. Part of this increase, however, is offset by the contribution of uncontaminated prey consumed by eagles. Among the mammals, otters, which were assumed to consume an 80/20 mix of trophic level 3 and 4 fish, are expected to have a greater methylmercury exposure per gram of fish consumed than mink, which were assumed to eat only trophic level 3 fish. In addition, 10% of the mink diet was assumed to consist of uncontaminated prey items. Table 3-3 Exposure Parameters for Mink, Otter, Kingfisher, Loon, Osprey, and Eagle Body Wt. Ingestion Rate Drinking Rate Trophic Level of Species (Wt A) (F A) (W A) Wildlife Food kg kg/d L/d Source % Diet at Each Trophic Level Mink Otter ,4 80,20 Kingfisher Loon Osprey Eagle ,4 74,18,8 3-4
73 The ratio of grams fish consumed per day to piscivore body weight is also significant in estimating mercury exposure on a µg/kg bw/d basis. The greater this ratio, the higher the resulting mercury exposure, assuming that methylmercury concentrations in fish remain constant. For example, osprey, loons, and kingfishers each consume trophic level 3 fish only. Kingfishers consume an amount of fish equivalent to about 50% of their body weight each day, while osprey and loons consume roughly 20% of their body weights in fish per day. The resulting average daily intake of methylmercury in g/kg body weight will, therefore, be higher in kingfishers. Residue data used to calculate national averages for mercury concentration in fish were obtained from two studies. The first, entitled "A National Study of Chemical Residues in Fish," was conducted by U.S. EPA (1992b) and also reported in Bahnick et al. (1994). The second study, entitled "National Contaminant Biomonitoring Program: Concentrations of Seven Elements in Freshwater Fish, ," was published by Lowe et al. (1985). These data are described in Section of this Volume. Based upon these values, national average methylmercury concentrations in fish tissue were determined to be µg/g and 0.26 µg/g for fish occupying trophic levels 3 and 4, respectively. Eagles consume approximately 500 g of food per day (U.S. EPA, 1993a, 1995a), 74% of which (370 g/d) consists of trophic level 3 fish, and 18% of which (90 g/d) consists of trophic level 4 fish. Multiplying these consumption rates by the methylmercury concentrations at trophic levels 3 and 4 and dividing by the average weight of an adult eagle (4.6 kg) (U.S. EPA, 1993a, 1995a) yields an average daily exposure of approximately 14 g methylmercury/kg bw/d. Similar calculations were made for other piscivores in this hypothetical exposure scenario allowing comparisons to be made among species (see Table 3-4). From a modeling standpoint, methylmercury levels in trophic level 3 fish and the mercury concentration in water are irrelevant to a ranking of predator exposure; only the relationship between the methylmercury concentrations in trophic levels 3 and 4 is critical. As noted previously, fish consumption rate expressed per gram of body weight has a large effect on these exposure calculations. Thus, despite consuming a comparatively small amount of the trophic level 3 fish, the kingfisher ranks well above any other birds (or mammals) in this estimated amount of mercury ingested per kg/bw. 3.4 Regional-Scale Exposure Estimates Table 3-4 Summary of Sample Calculations of Wildlife Species Methylmercury Exposure From Fish Ingestion, Based on Average Fish Residue Values Species Sample Estimated Methylmercury Exposure from Fish Ingestion (g/kg bw/d) Kingfisher 25 Otter 15 There are many stationary, anthropogenic mercury sources in the U.S., and the impact of these Loon 10 emissions may not be limited to the local area around the Osprey 10 facility. To account for impacts of mercury emitted from these non-local sources, the long-range transport of Mink 10 mercury was simulated using the RELMAP model. The RELMAP model was used to predict the average annual Eagle 9 atmospheric mercury concentration and the wet and dry 2 deposition flux for each 40 km grid in the continental U.S. The emission, transport and fate of airborne mercury over the continental U.S. were modeled using meteorologic data for the year of This year was assumed to be a typical year from an atmospheric dispersion perspective. Inputs to the RELMAP model were obtained from the mercury emissions inventory presented as Volume II of this Report. In all, over 10,000 mercury emitting cells within the U.S. were addressed. A detailed description of the RELMAP model is provided in Section 4 of Volume III. 3-5
74 3.4.1 Predicted Current Mercury Exposure Across the Continental U.S. In the first stage of analysis, estimated total mercury deposition data were used with ARC/INFO cartography software to generate U.S. map overlays. The overlays can be applied to similar scale maps of natural resources and species distributions or combined with additional data, such as acid deposition or ph of surface waters. Figure 3-1 shows RELMAP projections for total (including wet and dry) anthropogenic mercury deposition. Nearly all the land area east of the Mississippi River is projected to receive mercury deposition 2 greater than 5 g/m. Highly industrialized northeastern states and south Florida are projected to receive more 2 than 20 g/m. RELMAP results are projections that may differ quantitatively from actual sampling data for a given locale. It is anticipated, however, that additional sampling data will confirm the prediction that mercury is deposited in significant quantities over large geographic areas. Limitations on data precluded a quantitative, nation-wide analysis of the exposure of piscivorous wildlife to mercury. Existing data are sufficient, however, to permit a qualitative analysis. In the case of plant life, the analysis was limited to plotting the location of federally threatened or endangered species, thereby indicating where threatened populations coincide with estimated high mercury deposition. Avian wildlife selected for this analysis included species that are widely distributed (kingfishers) and narrowly distributed (bald eagles, ospreys, and loons). All the birds selected were piscivores that feed at or near the top of aquatic food chains and are therefore at risk from biomagnified mercury. Two of the mammals selected for this analysis (mink and river otters) are piscivorous and widely distributed. The other mammal selected, the Florida panther, is not widely distributed but is listed as an endangered species. The Florida panther lives in an environment known to be contaminated with mercury and preys upon small mammals (e.g., raccoons) that may contain high tissue burdens of mercury. The maps and map overlays that follow were used to examine in a qualitative fashion the potential for anthropogenic mercury to impact representative piscivorous species in a variety of ecosystems. Animal distribution information was obtained from the Nature Conservancy (1994) Locations of Socially Valued Environmental Resources Major freshwater lakes and river systems potentially affected by high levels of atmospheric mercury deposition are illustrated in Figure 3-2. Most of the freshwater located in the lower 48 states occurs in areas where mercury deposition is predicted to be high. Because mercury accumulates in sediments, it is anticipated that significant mercury inputs to surface waters will continue for a long period of time even if atmospheric deposition is substantially reduced. The Great Lakes are particularly vulnerable due to the length of time necessary to replenish contaminated freshwater with clean freshwater. Figure 3-3 shows the location of national resource lands, which include national parks and monuments, national forests, wildlife refuges and Native American reservation lands. The area of national resource lands that are predicted to have high mercury deposition is relatively small when compared with the total area of national resource lands, most of which are located in the western states. The small size of eastern resources makes them especially vulnerable to the effects of mercury because depleted wildlife populations cannot easily be repopulated from less-impacted adjoining regions. Increasingly, natural areas 3-6
75

76
77
78 may become "islands" surrounded by development. The loss of biodiversity is an important problem that could be exacerbated by the added stress of mercury toxicity Airborne Deposition Overlay with Threatened and Endangered Plants Figure 3-4 shows the geographic locations of populations of threatened and endangered plant species overlaid with RELMAP's predicted mercury deposition. Large concentrations of endangered plant populations exposed to high levels of deposition occur in central and southern Florida, along the northeastern coastal region, and scattered throughout the midwest Regions of High Mercury Deposition Predicted mercury deposition rates in excess of 5 µg/m2 are shown in Figure 3-5. These data are used below to estimate the extent of overlap of wildlife species ranges with regions receiving high levels of mercury deposition. It should not be inferred from this analysis that wildlife living in areas that receive relatively low levels of mercury deposition are not at risk. For example, much of northern Wisconsin receives only moderate amounts of mercury, yet the occurrence of high mercury levels in fish is a well-documented problem. Nevertheless, it is of interest to define deposition patterns on a broad geographical scale. These data can then be interpreted in the context of regional and watershed-specific factors that contribute to mercury translocation, methylation, and bioaccumulation Regions of High Mercury Deposition Overlay with the Distribution of Acid Surface Waters Figure 3-6 shows the co-occurrence of acidified surface waters (NAPAP, 1990) and regions receiving high levels of mercury deposition. While it is recognized that a variety of factors impact the methylation of mercury and its subsequent accumulation in aquatic biota (see Chapter 2 of this Volume), mercury residues in fish have been positively correlated with low ph in ecosystems of widely varying type, including both northern oligotrophic lakes and the lakes and wetlands of central Florida. Poorly buffered surface waters receiving high levels of mercury deposition are located in central Florida, throughout the Chesapeake Bay region, and in the northeastern U.S., including the Adirondack region of New York Regions of High Mercury Deposition Overlays with Wildlife Species Distribution Maps Figure 3-7 shows the range of kingfisher habitat and areas where this habitat overlaps with regions of high mercury deposition. Kingfishers consume fish primarily from trophic level 3. Approximately 29% of the kingfisher's range overlaps with areas of high mercury deposition. On a nationwide basis, mercury does not appear to be a threat to the species. However, as indicated by the exposure assessment in Section 3.3, kingfishers consume more mercury on a body weight basis than any of the other wildlife species examined. Figure 3-8 overlays the range of bald eagle habitat onto regions that receive high levels of mercury deposition. Although a recovery in the population of bald eagles in the lower 48 states has resulted in a status upgrade from "endangered" to "threatened," bald eagle populations are still depleted throughout much of their historical range. Bald eagles can be found seasonally in large numbers in several geographic locations, but most of these individuals are transient, and the overall population is still small. Historically, eagle populations in the lower 48 states have been adversely impacted by the effects of bioaccumulative contaminants (primarily DDT and perhaps also PCBs). Approximately 34% of the bald eagle's range overlaps with regions of high mercury deposition. Areas of particular concern include the Great Lakes region, the northeastern Atlantic states, and south Florida. 3-10
79
80
81

82
EXCERPT FROM MERCURY STUDY REPORT TO CONGRESS VOLUME VI: AN ECOLOGICAL ASSESSMENT FOR ANTHROPOGENIC MERCURY EMISSIONS IN THE UNITED STATES
 EXCERPT FROM MERCURY STUDY REPORT TO CONGRESS VOLUME VI: AN ECOLOGICAL ASSESSMENT FOR ANTHROPOGENIC MERCURY EMISSIONS IN THE UNITED STATES December 1997 Office of Air Quality Planning and Standards and
EXCERPT FROM MERCURY STUDY REPORT TO CONGRESS VOLUME VII:
 EXCERPT FROM MERCURY STUDY REPORT TO CONGRESS VOLUME VII: CHARACTERIZATION OF HUMAN HEALTH AND WILDLIFE RISKS FROM MERCURY EXPOSURE IN THE UNITED STATES December 1997 Office of Air Quality Planning and
Methodology for the development of wildlife criteria for the lake Erie drainage basin.
 3745-1-43 Methodology for the development of wildlife criteria for the lake Erie drainage basin. [Comment: For dates of non-regulatory government publications, publications of recognized organizations
Chapter 3 - ATMOSPHERIC TRANSPORT AND MERCURY DEPOSITION
 Chapter 3 - ATMOSPHERIC TRANSPORT AND MERCURY DEPOSITION A. Introduction Mercury is an especially dynamic pollutant because of its unique physical, chemical, and bioaccumulative properties. The volatility
Derivation of New Jersey-Specific Wildlife Values as Surface Water Quality Criteria for: PCBs DDT Mercury
 Derivation of New Jersey-Specific Wildlife Values as Surface Water Quality Criteria for: PCBs DDT Mercury A cooperative effort between the: U.S. Fish & Wildlife Service U.S. Environmental Protection Agency
Canadian Mercury Science Assessment Executive Summary
 Canadian Mercury Science Assessment Executive Summary Cat. No.: En84-130/1-2016E-PDF ISSN 978-0-660-03315-0 Unless otherwise specified, you may not reproduce materials in this publication, in whole or
A Probabilistic Fate and Effects Model for Pharmaceuticals and Personal Care Products
 A Probabilistic Fate and Effects Model for Pharmaceuticals and Personal Care Products Miranda Henning, Jennifer Lyndall, Michael J. Bock, Timothy Barber, Darrel Lauren Water Dependencies in New England:
Trends and Perspectives of Ecological Risk Assessments for Dioxin-Like Compounds in the Great Lakes Basin. Wisla, Poland
 Trends and Perspectives of Ecological Risk Assessments for Dioxin-Like Compounds in the Great Lakes Basin Efficacy of Predicted vs. Measured Exposure and Effects Assessments International Conference on
Western North America Mercury Synthesis (WNAMS)
") Western North America Mercury Synthesis (WNAMS) A Multi-disciplinary, tri-national assessment of the climate, landscape, and land use controls on mercury risk to ecological and human health across western
Western North America Mercury Synthesis (WNAMS) A Multi-disciplinary, tri-national assessment of the climate, landscape, and land use controls on mercury risk to ecological and human health across western
Effects of bis(2,4,6-tribromophenoxy)ethane (BTBPE) in Mink (Mustela vison)
ethane (BTBPE) in Mink (Mustela vison)") Effects of bis(2,4,6-tribromophenoxy)ethane (BTBPE) in Mink (Mustela vison) J. Newsted 1,2, S. Smith-Edwards 2, P. Martin 3, J. Link 2, R.J. Letcher 4, S. Bursian 2 1 Natural Resource Technology, and OBG
Effects of bis(2,4,6-tribromophenoxy)ethane (BTBPE) in Mink (Mustela vison) J. Newsted 1,2, S. Smith-Edwards 2, P. Martin 3, J. Link 2, R.J. Letcher 4, S. Bursian 2 1 Natural Resource Technology, and OBG
Linking Fish and Wildlife Tissue Residues to Contaminant Concentrations in Water and Sediment
 Linking Fish and Wildlife Tissue Residues to Contaminant Concentrations in Water and Sediment Perspectives on Regulatory Criteria and Screening Levels Based on Wildlife Tissue Residues SETAC Hudson/Delaware
Chapter 6 Risk Characterization
 hapter 6 Risk haracterization What s overed in hapter 6: g g g Risk Estimation Risk Description Uncertainty and Limitations of the Screening Level Risk Assessment Risk characterization includes risk estimation
6.3.2 Exposure Assessment
 6.3.2 Exposure Assessment A key component of conducting a risk-based screening evaluation is identification of potential exposures. An exposure assessment includes an evaluation of potential human and
Environmental Toxicology and exploring ATSDR toxicological profiles
 Environmental Toxicology and exploring ATSDR toxicological profiles MSC-210 Marine Environmental Sampling & Analysis Lecture 8 Toxicology Definitions Environmental Toxicology: The study of the fate and
Module 12: Oceanography Topic 6 Content: Ocean Pollution Notes. Ocean Pollution
 Ocean Pollution 1 Ocean pollution is an important modern-day environmental issue. Pollution occurs when chemical, physical, and/or biological agents are introduced into an environment and cause undesirable
Ecotoxicology of agrochemicals. U n i v e r s i t y o f G i r o n a
 Ecotoxicology of agrochemicals U n i v e r s i t y o f G i r o n a Program 1. Introduction 2. Agrochemicals typology and activity 3. Environmental behavior of agrochemicals 4. Bioavailability and biotransformation
Modeling the Biogeochemical Cycle of Mercury in Lakes: The Mercury Cycling Model (MCM) and Its Application to the MTL Study Lakes
 and Its Application to the MTL Study Lakes") ~- -.,, OLO ('''"' ~...,;;,, FEB 11 2004 Chapter V.1 Modeling the Biogeochemical Cycle of Mercury in Lakes: The Mercury Cycling Model (MCM) and Its Application to the MTL Study Lakes CONTENTS Robert J.
~- -.,, OLO ('''"' ~...,;;,, FEB 11 2004 Chapter V.1 Modeling the Biogeochemical Cycle of Mercury in Lakes: The Mercury Cycling Model (MCM) and Its Application to the MTL Study Lakes CONTENTS Robert J.
STAR REPORT MERCURY TRANSPORT AND FATE IN WATERSHEDS. U.S. EPA Office of Research. and Development s Science. To Achieve Results (STAR)
") STAR REPORT Vol. 4 Issue 1 October 2000 U.S. EPA Office of Research 10 and Development s Science To Achieve Results (STAR) Research in Progress A product of the National Center for Environmental Research
STAR REPORT Vol. 4 Issue 1 October 2000 U.S. EPA Office of Research 10 and Development s Science To Achieve Results (STAR) Research in Progress A product of the National Center for Environmental Research
USEPA s National Fish and Wildlife Contamination Program
 USEPA s National Fish and Wildlife Contamination Program Joel Hansel, Regional Fish Advisory Coordinator Water Quality Protection Branch Water Protection Division United States Environmental Protection
Watershed retention of atmospherically-deposited mercury in Michigan. Implications for recovery of lakes from mercury pollution
 Watershed retention of atmospherically-deposited mercury in Michigan Implications for recovery of lakes from mercury pollution Paul Drevnick, University of Michigan Defining the problem: methylmercury
Ecological Risk Assessment and the Tittabawassee River, Why, How and Who Cares
 Ecological Risk Assessment and the Tittabawassee River, Why, How and Who Cares Chippewa Nature Center, April 13 2006 Matthew Zwiernik, PhD Professor Zoology/Vet Med. Michigan State University Special Thanks
Local Impacts of Mercury from Coal-Fired Power Plants
 Local Impacts of Mercury from Coal-Fired Power Plants Prepared by Clean Air Task Force, March 2003 Effects of Coal Type and Air Pollution Control Device on Mercury Emissions, Atmospheric Transport and
Synthetic organic compounds
 14.4.5 Synthetic organic compounds Synthetic, or human-made, compounds can enter the water supply either from industrial point sources where they are manufactured or from nonpoint sources when they are
Characteristics of Mercury and other Metals
 Characteristics of Mercury and other Metals Ben Hodges Physical Transport Lynn Katz Surface/Water Chemistry Howard Liljestrand- Air/Water Chemistry The University of Texas at Austin 8 February 2002 Metals
Final Total Maximum Daily Load for the Monongahela River, Greene County PCBs and Chlordane
 Final Total Maximum Daily Load for the Monongahela River, Greene County PCBs and Chlordane Point Marion Lock and Dam to Grays Landing Lock and Dam March 1, 1999 Table of Contents Introduction Background
Atmospheric Mercury Deposition And Impacts In The Pacific Northwest
 Atmospheric Mercury Deposition And Impacts In The Pacific Northwest Bob Brunette and David Gay National Atmospheric Deposition Program Mercury Deposition Network DGay@illinois.edu RobertBrunette@EurofinsUS.com
Summary of Public Comments received on PFOA, its Salts and its Precursors.
 Summary of Public Comments received on PFOA, its Salts and its Precursors. Comments on the draft screening assessment report for Perfluorooctanoic acid (PFOA), its Salts and its Precursors were provided
Assessment of Mercury Contamination and Bioaccumulation in Sarasota Bay
 Assessment of Mercury Contamination and Bioaccumulation in Sarasota Bay EMECS 9 August 29 th 2011 Yongseok Hong 1,2, Erik Rifkin 2, Randall S. Wells 3,4 Peter Hull 4, Edward J. Bouwer 1 1 Geography and
Guidance for the derivation of environmental risk limits Part 11. Variables and default values used in the ERL guidance documents. version 1.
 Guidance for the derivation of environmental risk limits Part 11. Variables and default values used in the ERL guidance documents version 1.0 Colophon RIVM 2015 Parts of this publication may be reproduced,
International Mercury Assessment
 United Nations Environment Programme 1 International Mercury Assessment Hg Table of Contents Introduction, Purpose & Scope Issue 1: Institutional Form for Future Action Issue 2: Atmospheric Emissions Issue
Ecological Screening-Level Risk Assessment of the Lower Ottawa River
 Final Report Ecological Screening-Level Risk Assessment of the Lower Ottawa River Prepared for Limno-Tech, Inc. 501 Avis Drive Ann Arbor, Michigan 48108 Prepared by Parametrix 5808 Lake Washington Blvd.
Combined Use of AERMOD, ArcGIS, and Risk Analyst for Human Health Risk Assessment. Paper No Prepared By:
 Combined Use of AERMOD, ArcGIS, and Risk Analyst for Human Health Risk Assessment Paper No. 33578 Prepared By: Aubrey Jones Senior Consultant/ Meteorologist Abhishek Bhat, PhD, EPI Senior Consultant Tiffany
Dispersion Modeling of Mercury Emissions from Coal-Fired Power Plants at Coshocton and Manchester, Ohio
 65 Dispersion Modeling of Mercury Emissions from Coal-Fired Power Plants at Coshocton and Manchester, Ohio Sang-Sup lee and tim c. keener 1, department of civil and environmental engineering, university
Bio 430: Chemicals in the environment. Jeffrey Jenkins Department of Environmental and Molecular Toxicology Oregon State University
 Bio 430: Chemicals in the environment Jeffrey Jenkins Department of Environmental and Molecular Toxicology Chemical fate: transformation and transport within and between Soil-Air-Water-Biota Source: U.S.
The Impacts of Mercury Emissions from Coal Fired Power Plants on Local Deposition and Human Health Risk
 The Impacts of Mercury Emissions from Coal Fired Power Plants on Local Deposition and Human Health Risk Terry Sullivan Brookhaven National Laboratory Presented at the Pennsylvania Mercury Rule Workgroup
LOWER PASSAIC RIVER RESTORATION PROJECT DRAFT FOCUSED FEASIBILITY STUDY RISK EVALUATION. Remedial Options Work Group Meeting June 27, 2007
 LOWER PASSAIC RIVER RESTORATION PROJECT DRAFT FOCUSED FEASIBILITY STUDY RISK EVALUATION Remedial Options Work Group Meeting June 27, 2007 Human Health and Ecological Risk Evaluation Objective: Assesses
6-3 Biodiversity Slide 1 of 35
 1 of 35 The Value of Biodiversity The Value of Biodiversity Biological diversity, or biodiversity, is the sum total of the genetically based variety of all organisms in the biosphere. Ecosystem diversity
Risk Assessment Program Progress Report October 9, 2013
 Risk Assessment Program Progress Report October 9, 2013 Risk assessment team Dr. Kim K. Ayre water quality endpoints Annie F. Johns toxicity re evaluation and remediation analysis Carlie Herring temperature
Overview of Dredged Material Testing and Evaluation
 Overview of Dredged Material Testing and Evaluation Jeffery Steevens US Army Corps of Engineers Engineer Research and Development Center 23 July 2012 Guidance Documents for Management of Dredged Material
Technical Document EPA s Draft Report on the Environment Chapter 1 - Cleaner Air 1.2 Acid Deposition 1-25
 Technical Document EPA s Draft Report on the Environment 3 1. Acid Deposition Sulfur dioxide and NO X emissions in the atmosphere react with water, oxygen, and oxidants to form acidic components, also
Outline of Risk Assessment Training and Experience (RATE): Basic Understanding and Application of Risk Assessments
: Basic Understanding and Application of Risk Assessments") Outline of Risk Assessment Training and Experience (RATE): Basic Understanding and Application of Risk Assessments Summary: Environmental risk Assessment 1 plays a unique role in serving the needs of various
Outline of Risk Assessment Training and Experience (RATE): Basic Understanding and Application of Risk Assessments Summary: Environmental risk Assessment 1 plays a unique role in serving the needs of various
The collapse of the World Trade Center on September 11, 2001 produced a dust
 Introduction The collapse of the World Trade Center on September 11, 2001 produced a dust cloud of immense proportions which settled all over lower Manhattan and inside lower Manhattan buildings. Fluorescent
Environmental Risk Assessments of Coal Ash Impoundments
 2017 World of Coal Ash (WOCA) Conference in Lexington, KY - May 9-11, 2017 http://www.flyash.info/ Environmental Risk Assessments of Coal Ash Impoundments George M. Huddleston III, Kathy W. Webb, Heather
Recent Findings from Human Health and Ecological Risk Assessments of Waste to Energy Technologies
 Recent Findings from Human Health and Ecological Risk Assessments of Waste to Energy Technologies Society for Risk Analysis Annual Meeting Baltimore, Maryland December 8-11, 2013 Paul C. Chrostowski Sarah
DEVELOPING TMDLs FOR ORGANOCHLORINE PESTICIDES AND PCBs 1
 DEVELOPING TMDLs FOR ORGANOCHLORINE PESTICIDES AND PCBs 1 G. Fred Lee, PhD, PE, DEE and Anne Jones-Lee, PhD G. Fred Lee & Associates, El Macero, California Email: gfredlee@aol.com Website: www.gfredlee.com
Where Do All the Toxins Go? (External View)
") Toxic Chemicals in the Great Lakes 2 of Two Activities Where Do All the Toxins Go? (External View) Bioaccumulation is the build-up of chemicals in an organism s body the longer an organism lives, the more
Toxic Chemicals in the Great Lakes 2 of Two Activities Where Do All the Toxins Go? (External View) Bioaccumulation is the build-up of chemicals in an organism s body the longer an organism lives, the more
Food Chains, Food Webs, and Bioaccumulation Background
 Food Chains, Food Webs, and Bioaccumulation Background Introduction Every living organism needs energy to sustain life. Organisms within a community depend on one another for food to create energy. This
Final Report. Use of the HPVIS to identify Chemicals that may pose a Threat to the Great Lakes Fishery
 Final Report Use of the HPVIS to identify Chemicals that may pose a Threat to the Great Lakes Fishery Researchers: Lynda Knobeloch and Henry Anderson, Wisconsin Department of Health and Family Services
Lesson 7: Biomagnification
 Lesson 7: Biomagnification ESTIMATED TIME: Three 1 hour class periods MATERIALS: For the teacher Biomagnification Transparency 12 circles cut with a hole punch (small confetti) Overhead projector Per group
A Procedure for Developing Ecosystem Loading Limits (TMDLs) for Selenium in Watersheds Affected by Gold Mining in Northern Argentina
 for Selenium in Watersheds Affected by Gold Mining in Northern Argentina") A Procedure for Developing Ecosystem Loading Limits (TMDLs) for Selenium in Watersheds Affected by Gold Mining in Northern Argentina A. Dennis Lemly, Ph.D. United States Forest Service Southern Research
A Procedure for Developing Ecosystem Loading Limits (TMDLs) for Selenium in Watersheds Affected by Gold Mining in Northern Argentina A. Dennis Lemly, Ph.D. United States Forest Service Southern Research
Estimation of Mercury Bioavailability in Wastewater Treatment Plant Effluents. Robert P. Mason J. David Dean
 Estimation of Mercury Bioavailability in Wastewater Treatment Plant Effluents Robert P. Mason J. David Dean Feb 5, 2009, SFEI Meeting, Oakland, CA ESTIMATION OF MERCURY BIOACCUMULATION POTENTIAL FROM WASTEWATER
UNITED STATES ENVIRONMENTAL PROTECTION AGENCY REGION BROADWAY NEW YORK, NEW YORK 10007
 EXHIBIT 13 "E UNITED STATES ENVIRONMENTAL PROTECTION AGENCY REGION 2 290 BROADWAY NEW YORK, NEW YORK 10007 MEMORANDUM DATE: January 18, 2001 SUBJECT: FROM: TO: National Remedy Review Board Recommendations
Dear Commissioner Pelosi:
 UNITED STATES ENVIRONMENTAL PROTECTION AGENCY Region 1 1 Congress Street, Suite 1100 BOSTON, MA 02114-2023 December 20, 2007 Laura Pelosi, Commissioner Vermont Department of Environmental Conservation
Proposed Revisions to Florida s Human Health-Based Water Quality Criteria. Treasure Coast Regional Planning Council Meeting June 17, 2015
 Proposed Revisions to Florida s Human Health-Based Water Quality Criteria Treasure Coast Regional Planning Council Meeting June 17, 2015 Background A Human Health Ambient Water Quality Criterion (HHC)
Keith R. Cooper, Ph.D. Dean of Research & Graduate Programs Liberty Science Center August 4, 2005
 Keith R. Cooper, Ph.D. Dean of Research & Graduate Programs Liberty Science Center August 4, 2005 cooper@aesop.rutgers.edu What is Toxicology? The study of adverse effects that result from exposure to
Overview of NJDEP s Use of Fish and Wildlife Tissue Residues in Regulatory & Advisory Programs
 Overview of NJDEP s Use of Fish and Wildlife Tissue Residues in Regulatory & Advisory Programs Gary A. Buchanan, Ph.D., and Division of Science, Research & Technology Nancy Hamill, Site Remediation Program
Technical Report on Toxic Contaminants in the Chesapeake Bay and its Watershed: Extent and Severity of Occurrence and Potential Biological Effects
 Technical Report on Toxic Contaminants in the Chesapeake Bay and its Watershed: Extent and Severity of Occurrence and Potential Biological Effects U.S. Environmental Protection Agency Region III Chesapeake
Chapter 8 Interpreting Uncertainty for Human Health Risk Assessment
 What s Covered in Chapter 8: Chapter 8 Interpreting Uncertainty for Human Health Risk Assessment 8.1 Uncertainty and Limitations of the Risk Assessment Process 8.2 Types of Uncertainty 8.3 Qualitative
Problem Formulation and Conceptual Model Development for Aquatic Placement
 Problem Formulation and Conceptual Model Development for Aquatic Placement Burton Suedel, Ph.D. burton.suedel@usace.army.mil DMAM Seminar Day 1 15 Sept 2009 Objectives Overview of problem formulation Overview
Mercury MACT Under the Clean Air Act: An Assessment of the Mercury Emissions Outcomes of Stakeholder Group Recommendations NESCAUM May 8, 2003
 1.0 Background Mercury MACT Under the Clean Air Act: An Assessment of the Mercury Emissions Outcomes of Stakeholder Group Recommendations NESCAUM May 8, 2003 Mercury is a persistent, bioaccumulative, neurotoxic
Summary of selected Minnesota Pollution Control Agency and Office of Environmental Assistance mercury-reduction programs
 Summary of selected Minnesota Pollution Control Agency and Office of Environmental Assistance mercury-reduction programs Summary of selected Minnesota Pollution Control Agency and Office of Environmental
Ecological/Watershed Modeling. Cindy Ryals Taylor Carroll
 Ecological/Watershed Modeling Cindy Ryals Taylor Carroll Defining Models Defining the problem the question Conceptual Model a set of ideas Verbal Model translate into words Mathematical Model translate
Final Total Maximum Daily Load for the Susquehanna River, PCBs
 Final Total Maximum Daily Load for the Susquehanna River, PCBs PA Route 92 bridge at Falls to confluence with West Branch Susquehanna River March 12, 1999 Table of Contents Introduction Background TMDL
CRC CARE PFAS Guidance
 PFAS Guidance Background information on the derivation of screening levels for PFAS Table 1 Summary of information utilised in the derivation of criteria adopted in guidance, and peer-review General note:
Ambient Water Quality Criteria for Polychlorinated Biphenyls (PCBs)
") Water Quality Ambient Water Quality Criteria for Polychlorinated Biphenyls (PCBs) Overview Report Prepared pursuant to Section 2(e) of the Environment Management Act, 1981 Original signed by J. O'Riordan
Water Quality Ambient Water Quality Criteria for Polychlorinated Biphenyls (PCBs) Overview Report Prepared pursuant to Section 2(e) of the Environment Management Act, 1981 Original signed by J. O'Riordan
Merganser Model. MERcury Geo-spatial. For the New England Region
 Merganser Model MERcury Geo-spatial AssessmeNtS For the New England Region David Evers, John Graham, Eric Miller, Neil Kamman, Keith Robinson, Jamie Shanley, Alison Simcox, Richard Smith, Jeri Weiss 1
Chemical contaminants can enter surface waters or be deposited on beaches from
 CHAPTER 10 Chemical and physical agents Chemical contaminants can enter surface waters or be deposited on beaches from both natural and anthropogenic sources. These may be either point sources, such as
Mercury Contamination from Metal Scrap Processing Facilities A Study by Ohio EPA
 Mercury Contamination from Metal Scrap Processing Facilities A Study by Ohio EPA Paper #: 947 Radhica Sastry Ohio Environmental Protection Agency Lazarus Government Center P.O. Box 1049 Columbus, OH-43216
Aquifer Storage and Recovery Regional Study
 Aquifer Storage and Recovery Regional Study ASR Regional Study Ecological Risk Assessment Mark Shafer, P.E., USACE US Army Corps of Engineers 2 Presentation Outline Critical Issues (identified in 1999-2002)
2009 Mercury Science and Policy Conference
 Preparing a Mercury Reduction Plan for use as an Implementation Plan for a Mercury TMDL 2009 Mercury Science and Policy Conference November 18, 2009 Robin Heston Solid & Hazardous Waste Management Program
Health and Economic Consequences of Mercury Pollution in America
 Health and Economic Consequences of Mercury Pollution in America Leonardo Trasande, MD, MPP Philip J. Landrigan, MD, MSc Center for Children s Health and the Environment Mount Sinai School of Medicine
Mercury Monitoring on the Fond du Lac Reservation
 Mercury Monitoring on the Fond du Lac Reservation Joy Wiecks, Air Quality Technician Fond du Lac Band of Lake Superior Chippewa December 15, 2005 WRAP Board Meeting FDL Mercury Monitoring Program Reservation
Linda Cooper, Eno River State Park, Durham, NC
 Linda Cooper, Eno River State Park, Durham, NC 2 Rivers and Streams All 50 states, 2 interstate river commissions, American Samoa, Guam, Puerto Rico, the District of Columbia (collectively referred to
Final Total Maximum Daily Load Allegheny River, Allegheny County PCBs
 Final Total Maximum Daily Load Allegheny River, Allegheny County PCBs Lock and Dam 3 to mouth March 1, 1999 Revised March 12, 1999 Table of Contents Introduction Background TMDL Development TMDL Implementation
Methylmercury Bioavailability and Dynamics in the Streams of Piasa Creek Watershed: New Methods 1 of Sam
 Methylmercury Bioavailability and Dynamics in the Streams of Piasa Creek Watershed: New Methods of Sampling and Analysis Basic Information Title: Project Number: 2007IL161B Start Date: 3/1/2007 End Date:
Appendix I. Results of Sensitivity Modeling Analyses Relating to Fish
 Appendix I Results of Sensitivity Modeling Analyses Relating to Fish Revised Corrective Measures Study Report Appendix I APPENDIX I Results of Sensitivity Modeling Analyses Relating to Fish In EPA s September
February 9, As discussed in my August 27 comments,
 Comments on Notice of Tentative Waste Discharge Requirements for United States Army Corps of Engineers, Department of Water Resources and the Port of Stockton Stockton Deep Water Ship Channel Maintenance
Presented at American Chemical Society national meeting, Geochemistry Division poster session, San Francisco, CA April (1997)
") Chromium Speciation: Key to Reliable Control of Chromium Toxicity to Aquatic Life G. Fred Lee PhD, PE, DEE, and Anne Jones-Lee, PhD G. Fred Lee & Associates El Macero, CA Presented at American Chemical
Chromium Speciation: Key to Reliable Control of Chromium Toxicity to Aquatic Life G. Fred Lee PhD, PE, DEE, and Anne Jones-Lee, PhD G. Fred Lee & Associates El Macero, CA Presented at American Chemical
Emissions. Global Sources of Mercury Primary (smokestacks and mining) Secondary (historical deposition and re emission)
 Secondary (historical deposition and re emission)") Investigations on the Cycling of Mercury from the Ocean to Fog and Deposition to Land in Coastal California Peter Weiss Penzias, Ph.D. Department of Microbiology and Environmental Toxicology, UC Santa
Investigations on the Cycling of Mercury from the Ocean to Fog and Deposition to Land in Coastal California Peter Weiss Penzias, Ph.D. Department of Microbiology and Environmental Toxicology, UC Santa
GEF BENEFITS INDEX FOR BIODIVERSITY (GBI BIO ) Background and Context
 Background and Context") Background and Context GEF BENEFITS INDEX FOR BIODIVERSITY (GBI BIO ) 1. The GEF Benefits Index for Biodiversity (GBI BIO ) provides a relative ranking of countries for meeting the biodiversity objectives
Background and Context GEF BENEFITS INDEX FOR BIODIVERSITY (GBI BIO ) 1. The GEF Benefits Index for Biodiversity (GBI BIO ) provides a relative ranking of countries for meeting the biodiversity objectives
MERCURY CONNECTIONS. The extent and effects of mercury pollution in northeastern North America
 MERCURY CONNECTIONS The extent and effects of mercury pollution in northeastern North America Mercury Connections is a summary of the major findings reported in a series of 21 papers. These papers are
ACVM - REGISTRATION STANDARD FOR TOXICOLOGY AND ENVIRONMENTAL TOXICOLOGY
 ACVMS 9.1 Ministry of Agriculture and Forestry Post Office Box 2526 WELLINGTON, NEW ZEALAND ACVM - REGISTRATION STANDARD FOR TOXICOLOGY AND ENVIRONMENTAL TOXICOLOGY This document may be altered at any
FOCUSED FEASIBILITY STUDY FOR PASSAIC RIVER SEDIMENTS: IDENTIFYING OPPORTUNITIES FOR EARLY ACTION
 FOCUSED FEASIBILITY STUDY FOR PASSAIC RIVER SEDIMENTS: IDENTIFYING OPPORTUNITIES FOR EARLY ACTION Liam Bossi 1, Scott E. Thompson, PE 2, R. Bruce Fidler, PE 3, Daria Navon, PE 4, and Thalia Loor 5 ABSTRACT
SITE-SPECIFIC APPROACH FOR SETTING WATER QUALITY CRITERIA FOR SELENIUM: DIFFERENCES BETWEEN LOTIC AND LENTIC SYSTEMS
 SITE-SPECIFIC APPROACH FOR SETTING WATER QUALITY CRITERIA FOR SELENIUM: DIFFERENCES BETWEEN LOTIC AND LENTIC SYSTEMS W.J. Adams, 1 J.E. Toll, 2 K.V. Brix, 2 L.M. Tear, 2 D.K. DeForest, 2 1 Kennecott Utah
Urban Toxic Contaminants: Removal by Urban Stormwater BMPs TOM SCHUELER CHESAPEAKE STORMWATER NETWORK
 Urban Toxic Contaminants: Removal by Urban Stormwater BMPs TOM SCHUELER CHESAPEAKE STORMWATER NETWORK WWW.CHESAPEAKESTORMWATER.NET Urban Toxic Contaminants (UTC) 1. Why Worry About Toxics? 2. The Dirty
Anacostia River Sediment Project Current Status. September 28, 2017
 Anacostia River Sediment Project Current Status September 28, 2017 2 Topics Introduction Conceptual Site Model (CSM) Phase 2 RI Data Human Health Risk Assessment Draft Summary Ecological Risk Assessment
Risk assessment to salmon from an oil spill on BC s north and central coast
 (The risk analysis in this document was submitted by RCF as evidence to the JRP in 2011) Risk assessment to salmon from an oil spill on BC s north and central coast Background The proposed Enbridge Northern
EVE 491/591 Toxicology. Pollutants and Their Fate 2/19/2018
 EVE 491/591 Toxicology Lecture #5 1. Fate of Environmental Pollutants 2. Case study Part IV Pollutants and Their Fate Fate: Once emitted, what does pollutant do? Nothing Adversely impact human health Adversely
Assessment Summary 2006
 Hudson River Natural Resource Damages Assessment Summary 2006 New York State Department of Environmental Conservation United States Department of the Interior National Oceanic & Atmospheric Administration
Proposed Addition to ATTACHMENT E, LIST OF TOTAL MAXIMUM DAILY LOADS (TMDLs) APPLICABLE TO INDUSTRIAL STORM WATER DISCHARGERS
 APPLICABLE TO INDUSTRIAL STORM WATER DISCHARGERS") Proposed Addition to ATTACHMENT E, LIST OF TOTAL MAXIMUM DAILY LOADS (TMDLs) APPLICABLE TO INDUSTRIAL STORM WATER DISCHARGERS Oxnard Drain No. 3 Total Maximum Daily Load (TMDL) for Pesticides, PCBs, and
Proposed Addition to ATTACHMENT E, LIST OF TOTAL MAXIMUM DAILY LOADS (TMDLs) APPLICABLE TO INDUSTRIAL STORM WATER DISCHARGERS Oxnard Drain No. 3 Total Maximum Daily Load (TMDL) for Pesticides, PCBs, and
Components of Estuarine and Marine Ecological Risk Assessment
 Components of Estuarine and Marine Ecological Risk Assessment Denise M. Klimas Donald A. MacDonald Assessment and Restoration Division Office of Response and Restoration DTSC Ecological Risk Assessment
Revised PCB Water Quality Criterion for Zones 2-6 and Enhanced Implementation for the Stage 2 PCB TMDLs for the Delaware Estuary
 Revised PCB Water Quality Criterion for Zones 2-6 and Enhanced Implementation for the Stage 2 PCB TMDLs for the Delaware Estuary Commission Meeting December 4, 2013 Thomas J. Fikslin, Ph.D. Presentation
IMPLEMENTING OREGON S HUMAN HEALTH WATER QUALITY CRITERIA
 IMPLEMENTING OREGON S HUMAN HEALTH WATER QUALITY CRITERIA Michael Campbell Stoel Rives LLP 2015 Northwest Toxics Reduction & Water Quality Conference Seattle, Washington Oregon s More Stringent Human Health
SPARROW Estimated Equation
 MERGANSER: A Model for Predicting Mercury Levels in Wildlife in New England Alison C. Simcox, PhD 2009 Mercury Science & Policy Conference Great Lakes & NE Regions November 18, 2009 Acknowledgments EPA:
Connecticut Remediation Criteria: Technical Support Document Proposed Revisions to the Connecticut Remediation Standard Regulations
 Connecticut Remediation Criteria: Technical Support Document 2008 Proposed Revisions to the Connecticut Remediation Standard Regulations Connecticut Department of Environmental Protection Bureau of Water
I. Introduction. II. General Agreements for Pesticide Consultation Process
 Interim Approaches for National-Level Pesticide Endangered Species Act Assessments Based on the Recommendations of the National Academy of Sciences April 2013 Report I. Introduction In September 2010,
US Environmental Protection Agency. Hazardous Substance Research Centers
 US Environmental Protection Agency Hazardous Substance Research Centers HSRC Mission Short- and long-term research on manufacture, disposal, clean-up, and management of hazardous substances. Dissemination
Effects of Bioaccumulation on Ecosystems
 Effects of Bioaccumulation on Ecosystems Textbook pages 92 103 Section 2.3 Summary Before You Read Everyday activities, such as driving or heating your home, often pollute ecosystems. In your opinion,
The Hoosier- Shawnee Ecological Assessment
 United States Department of Agriculture Forest Service North Central General Technical Report NC-244 The Hoosier- Shawnee Ecological Assessment Frank R. Thompson, III, Editor Thompson, Frank R., III, ed
MARINE POLLUTION DEGRADATION MITIGATION MANAGEMENT IS ESSENTIAL FOR IMPROVING MARINE ENVIRONMENT
 MARINE POLLUTION DEGRADATION MITIGATION MANAGEMENT IS ESSENTIAL FOR IMPROVING MARINE ENVIRONMENT The health of the world s oceans and marine life is degrading rapidly as a result of excess human activities.