EXCERPT FROM MERCURY STUDY REPORT TO CONGRESS VOLUME VI: AN ECOLOGICAL ASSESSMENT FOR ANTHROPOGENIC MERCURY EMISSIONS IN THE UNITED STATES
|
|
|
- Virgil Patrick
- 6 years ago
- Views:
Transcription
1 EXCERPT FROM MERCURY STUDY REPORT TO CONGRESS VOLUME VI: AN ECOLOGICAL ASSESSMENT FOR ANTHROPOGENIC MERCURY EMISSIONS IN THE UNITED STATES December 1997 Office of Air Quality Planning and Standards and Office of Research and Development U.S. Environmental Protection Agency
2 EXECUTIVE SUMMARY Section 112(n)(1)(B) of the Clean Air Act (CAA), as amended in 1990, directs the U.S. Environmental Protection Agency (U.S. EPA) to submit to Congress a comprehensive study on emissions of mercury to the air. Volume VI, which addresses the ecological exposure and effects assessment for mercury and mercury compounds, is part of an eight-volume report developed by U.S. EPA in response to this directive. Volume VI is an ecological risk assessment for anthropogenic mercury emissions. It follows the format of the U.S. EPA Framework for Ecological Risk Assessment (U.S. EPA, 1992a), with minor changes as suggested in the draft Proposed Guidelines for Ecological Risk Assessment (U.S. EPA, 1996). The first step in the Framework is the problem formulation phase, wherein the potential ecological impacts of mercury are reviewed. This is followed by the presentation of a conceptual model describing how airborne mercury accumulates in aquatic biota, biomagnifies in aquatic food chains and is consumed by wildlife that eat contaminated fish. Subsequent steps in the assessment include exposure and effects assessments. Exposure and effects information are then considered together in an effort to develop qualitative statements about the risk of airborne mercury emissions to piscivorous avian and mammalian wildlife. An outcome of this effort is a recalculation of the wildlife criterion (WC) value for mercury in aquatic systems. A characterization of the risks to wildlife from anthropogenic mercury emissions is provided in Volume VII of this Report to Congress. Scope of the Assessment The scope of this assessment was limited solely to anthropogenic mercury that is emitted directly to the atmosphere. The origins and extent of these emissions are reviewed in Volume II of this Report. This analysis did not address mercury originating from direct wastewater discharge to water bodies, mining waste or the application of mercurial pesticides. In a number of instances, these and other "point" sources have been related to unacceptably high mercury levels in fish, triggering site-specific fish consumption advisories. Clearly, where such point sources exist, there is a need to address the combined impacts of mercury originating from all sources, including air emissions. Mercury in the Environment Wet deposition is thought to be the primary mechanism by which mercury emitted to the atmosphere is transported to surface waters and land, although dry deposition may also contribute substantially. Once deposited, mercury enters aquatic and terrestrial food chains. Mercury concentrations increase at successively higher trophic levels as a result of bioconcentration, bioaccumulation and biomagnification. Of the various forms of mercury in the environment, methylmercury has the highest potential for bioaccumulation and biomagnification. Predators at the top of these food chains are potentially at risk from consumption of methylmercury in contaminated prey. Based on a review of available information, it was concluded that piscivorous (fish-eating) birds and mammals are particularly at risk from mercury emissions. This risk is likely to be greatest in areas that receive high levels of mercury deposition, although local and regional factors can substantially impact the amount of total mercury that is translocated from watersheds to waterbodies and undergoes chemical transformation to the methylated species. ES-1
3 The assessment endpoint for this ecological risk assessment is the maintenance of self-sustaining wildlife populations. Measurement endpoints include the growth and survival of individual animals, reproductive success, and behavior. Exposure of Piscivorous Wildlife to Mercury Exposure was characterized in a progressive manner, with varying reliance on computer models for mercury deposition and fate. The objective of this analysis was to characterize the extent to which piscivorous wildlife are exposed to mercury originating from airborne emissions. Details on exposure assessment inputs, methods and results can be found in Volumes III and IV of this Report. Three general approaches were used, which are described as follows. 1. Estimation of current average exposure to piscivorous wildlife on a nationwide basis. The first analysis was conducted without computer models. Estimates of current mercury exposure to selected piscivorous wildlife species were calculated as the product of the fish consumption rate and measured mercury concentrations in fish. This analysis was not intended to be a site-specific analysis, but rather to provide national exposure estimates for piscivorous wildlife. This analysis used mean total mercury measurements from two nationwide studies of fish residues and published fish consumption data for the selected wildlife species. The relative ranking of exposure in g/kg bw/d of selected wildlife species was as follows: kingfisher > river otter > loon =osprey = mink > bald eagle. 2. Estimation of mercury deposition on a regional scale (40 km grid) and comparison of these deposition data with species distribution information. The second type of analysis was carried out on a regional scale. A long-range atmospheric transport model (RELMAP) was used in conjunction with the mercury emissions inventory provided in Volume II of this Report to generate predictions of mercury deposition across the continental U.S. Ecosystems subject to high levels of mercury deposition will be more exposed to mercury than ecosystems with lower levels of mercury deposition. The pattern of mercury deposition nationwide, therefore, will influence which ecoregions and ecosystems might be exposed to hazardous levels of mercury. Thus, predictions of mercury deposition were compared with the locations of major lakes and rivers, national resource lands, threatened and endangered plant species and the distributions of selected piscivorous wildlife species. Additionally, mercury deposition data were superimposed onto a map of surface waters impacted by acid deposition, because it has been shown that low ph values are often correlated with high levels of mercury in fish. The extent of overlap of selected species distributions 2 with areas receiving high rates of deposition (>5 µg/m ) was characterized. Avian wildlife considered in this analysis included species that are widely distributed (kingfishers) and narrowly distributed (bald eagles, ospreys, and loons). All the birds selected were piscivores that feed at or near the top of aquatic food chains and are therefore at risk from biomagnified mercury. Two of the mammals selected for this analysis (mink and river otters) are piscivorous and widely distributed. The other mammal selected, the Florida panther, is not widely distributed but is listed as an endangered species. The Florida panther lives in an environment known to be contaminated with mercury and preys upon small mammals (such as raccoons), which may contain high tissue burdens of mercury. Results for each avian and mammalian species are summarized in Table ES-1. ES-2
4 Approximately 29% of the kingfisher's range occurs within regions of high mercury deposition. On a nationwide basis, mercury does not appear to be a threat to this species. However, kingfishers consume more mercury on a body weight basis than any other wildlife species examined. Table ES-1 Percent of Species Range Overlapping with Regions of High Mercury Deposition Species Percent of Range Impacted Although a recovery in the Kingfisher 29% population of bald eagles has resulted in a status upgrade from "endangered" to Bald Eagle 34% "threatened" in five states (Michigan, Osprey 20% Minnesota, Oregon, Washington and Wisconsin), bald eagle populations are Common Loon 40% still depleted throughout much of their Florida Panther 100% historical range. Bald eagles can be found seasonally in large numbers in Mink 35% several geographic locations, but most River Otter 38% of these individuals are transient, and the overall population is still small. Historically, eagle populations in the lower 48 states have been adversely impacted by the effects of bioaccumulative contaminants (primarily DDT and perhaps also PCBs). Approximately 34% of the bald eagle's range overlaps regions of high mercury deposition. Areas of particular concern include the Great Lakes region, the northeastern Atlantic states and south Florida. Nationwide, approximately 20% of the osprey's total range overlaps regions of high mercury deposition; however, a much larger fraction of the osprey's eastern population occurs within these regions. The osprey diet consists almost exclusively of fish. Osprey populations underwent severe declines during the 1950s through the 1970s due to widespread use of DDT and related compounds. Nearly 40% of the loon's range is located in regions of high mercury deposition. Limited data from a study of a mercury point source showed that loon reproductive success was negatively correlated with exposure to mercury in a significant dose-response relationship. In some cases, mercury residues in fish collected from lakes used as loon breeding areas may exceed levels that, on the basis of this point source study, are associated with reproductive impairment. Loons frequently breed in areas that have been adversely impacted by acid deposition. An assessment of mercury s effects on loon populations is complicated by the fact that decreases in surface water ph have been associated with both increased mercury residues in fish and declines in the available forage base. All (100%) of the panther s range falls within an area of high mercury deposition. Mercury levels found in tissues obtained from dead panthers are similar to levels that have been associated with frank toxic effects in other feline species. The State of Florida has taken measures to reduce the risk to panthers posed by mercury. Existing plans include measures to increase the number of deer available as prey in order to reduce the reliance of panthers on raccoons. Raccoons frequently feed at or near the top of aquatic food webs and can accumulate substantial tissue burdens of mercury. An evaluation of the risk posed by mercury to the Florida panther is complicated by the possible impacts of other chemical stressors, habitat loss, and inbreeding. ES-3
5 Approximately 35% of the range of mink habitat coincides with regions of high mercury deposition nationwide. Mink occupy a large geographic area and are common throughout the U.S. Given the opportunity, mink will prey on small mammals and birds. Many subpopulations, however, prey almost exclusively on fish and other aquatic biota. Due to allometric considerations, mink may be exposed to more mercury on a body weight basis than larger piscivorous mammals feeding at higher trophic levels. In several cases, mercury residues in wild-caught mink have been shown to be equal to or greater than levels associated with toxic effects in the laboratory. River otter habitat overlaps regions of high mercury deposition for about 14% of the range for this species. River otters occupy large areas of the U.S., but their population numbers are thought to be declining in both the midwestern and southeastern states. The river otter's diet is almost exclusively of aquatic origins and includes fish (primarily), crayfish, amphibians and aquatic insects. The consumption of large, piscivorous fish puts the river otter at risk from bioaccumulative contaminants including mercury. Like the mink, mercury residues in some wild-caught otters have been shown to be close to, and in some cases greater than, concentrations associated with frank toxic effects. 3. Estimation of mercury exposure on a local scale in areas near emissions point sources. A final analysis was conducted using a local-scale atmospheric fate model (GAS-ISC3), in addition to the long-range transport data and an indirect exposure methodology, to predict mercury concentrations in water and fish under a variety of hypothetical emissions scenarios. GAS-ISC3 simulated mercury deposition originating from model plants representing a range of mercury emissions source classes. The four source categories were selected based on their estimated annual mercury emissions or their potential to be localized point sources of concern. The categories selected were these: municipal waste combustors (MWCs), medical waste incinerators (MWIs), utility boilers, and chloralkali plants. To account for the long-range transport of emitted mercury, the 50th percentile RELMAP atmospheric concentrations and deposition rates were included in the estimates from the local air dispersion model. To account for other sources of mercury, estimates of background concentrations of mercury were also included in this exposure assessment. These data were used to estimate the contributions of different emission source types to mercury exposure of selected wildlife species. It was concluded from this analysis that local emissions sources have the potential to increase significantly the exposure of piscivorous birds and mammals to mercury. Important factors related to local source impacts include quantity of mercury emitted by the source, species and physical form of mercury emitted, and effective stack height. The extent of this local contribution also depends upon watershed characteristics, facility type, local meteorology, and terrain. The exposure of a given wildlife species is also highly dependent upon the fish bioaccumulation factor, the trophic level(s) at which it feeds and the amount of fish consumed per day. Although the accumulation of methylmercury in fish tissues appears to be highly variable across bodies of water, field data were determined to be sufficient to calculate representative means for different trophic levels. The variability can be seen in the distribution of the methylmercury bioaccumulation factors (BAF) for fish in trophic levels 3 and 4. These values, summarized in Table ES-2, are believed to be better estimates of mercury bioaccumulation in natural systems than values derived from laboratory studies. ES-4
6 Table ES-2 Percentiles of the Methylmercury Bioaccumulation Factor Parameter Percentile of Distribution 5th 25th 50th 75th 95th Trophic 3 BAF 4.6 x x x x10 5.4x Trophic 4 BAF 3.3x10 5.0x10 6.8x10 9.2x10 1.4x 10 Effects Assessment for Mercury Due to the broad range and extent of mercury emissions throughout the United States, many potential ecological effects could have been considered. Neither the available data nor existing methodology supported evaluation of all possible effects. The ecosystem effects of mercury are incompletely understood. No applicable studies of the effects of mercury on intact ecosystems were found. The ecological risk assessment for mercury did not, therefore, address effects of mercury on ecosystems, plant and animal communities or species diversity. Effects of methylmercury on fish and other aquatic biota were also not characterized, although there is evidence of adverse impacts on these organisms following point source releases of mercury and in aquatic environments affected by urban runoff. Data on methylmercury effects in wildlife suitable for dose-response assessment are limited to what are termed "individual effects" in the U.S. EPA Framework for Ecological Risk Assessment (U.S. EPA, 1992a). A reference dose (RfD), defined as the chronic NOAEL, was derived for avian species from studies by Heinz (1975, 1976a,b, 1979) in which three generations of mallard ducks (Anas platyrhychos) were dosed with methylmercury dicyandiamide. The lowest dose, 0.5 ppm (78 µg/kg bw/d), resulted in adverse effects on reproduction and behavior and was designated as a chronic LOAEL. A chronic NOAEL was estimated by dividing the chronic LOAEL by a LOAEL-to-NOAEL uncertainty factor of 3. Calculated in this manner, the RfD for avian wildlife species is 26 µg/kg bw/d. The RfD for mammalian species was derived from studies involving subchronic exposures with mink (Wobeser, 1973, 1976a,b), in which animals were dosed with mercury in the form of mercurycontaminated fish. The dose of 0.33 ppm (55 µg/kg bw/d) was selected as the NOAEL for subchronic exposure. As this was less than a lifetime exposure, the subchronic NOAEL was divided by a subchronic-to-chronic uncertainty factor of 3. Calculated in this manner, the RfD for mammalian wildlife species is 18 µg/kg bw/d. Risk Assessment for Mercury Ecological risk assessment methods relevant to chemical effects on wildlife are reviewed. The data needs of these methods vary widely and dictate, to a considerable degree, which methods can be applied to a given situation. Guidance is provided on the risk assessment methods that may be most applicable to airborne mercury emissions, given the nature and extent of currently existing information. Additional guidance is provided by reviewing published assessments for piscivorous species living in the ES-5
7 Great Lakes region, south Florida, central Ontario, and coastal regions of Georgia, South Carolina and North Carolina. The scope of the present Report was intended to be national in scale. It was determined, therefore, that any effort to assess the risk of mercury to a given species living in a defined location would be inappropriate. Instead, an effort was made to compare mercury exposure and effects in a general way using data collected from throughout the country and, in so doing, to develop qualitative statements about risk. Consistent with this broader-scale approach, an effort was made to derive a wildlife criterion (WC) value for mercury that is protective of piscivorous wildlife. This WC is defined as the concentration of mercury in water that, if not exceeded, protects avian and mammalian wildlife populations from adverse effects resulting from ingestion of surface waters and from ingestion of aquatic life taken from these surface waters. The health of wildlife populations may, therefore, be considered the assessment endpoint of concern. Although not generally derived for the purpose of ecological risk assessment, WC values incorporate the same type of exposure and effects information used in more standard approaches. Such calculations also provide for a simple assessment of risk in any given situation; that is, by determining whether the concentration of mercury in water exceeds the criterion value. The principal factors used to select wildlife species for WC development were: (1) exposure to bioaccumulative contaminants; (2) species distributions; (3) availability of information with which to calculate criterion values; and (4) evidence for bioaccumulation and/or adverse effects. All of the species selected feed on or near the top of aquatic food webs. The avian species selected were the bald eagle (Haliaeetus leucocephalus), osprey (Pandion haliaetus), common loon (Gavia immer) and belted kingfisher (Ceryle alcyon). The mammalian species selected were the mink (Mustela vison) and river otter (Lutra canadensis). Because this assessment depends to a large extent on the assignment of BAFs for mercury in fish at trophic levels 3 and 4, an effort was made to review published field data from which these BAFs could be estimated. A Monte Carlo analysis was then performed to characterize the variability around these estimates. The results of this effort are reported in Appendix D of Volume III and are summarized in Table ES-2. A WC value for mercury was estimated as the ratio of an RfD, defined as the chronic NOAEL (in µg/kg bw/d), to an estimated mercury consumption rate, referenced to water concentration using a BAF. Individual wildlife criteria are provided in Table ES-3. This approach is similar to that used in noncancer human health risk assessment and was employed previously to estimate a WC for mercury in the Water Quality Guidance for the Great Lakes System (GLWQI). The present effort differs, however, from that of the GLWQI in that the entire analysis was conducted on a methylmercury basis. Additional differences resulted from the availability of new data, including measured residue levels in fish and water, and a re-evaluation of the toxicity data from which RfD estimates were derived. In this Report, a more sensitive endpoint was selected for mammalian species, with the goal of assessing the full range of effects of mercury. These changes reflect the amount of discretion allowed under Agency Risk Assessment Guidelines. Species-specific WC values for methylmercury were estimated for selected avian and mammalian wildlife (identified above). A final WC was then calculated as the lowest mean of WC ES-6
8 values for each of the two taxonomic classes (birds and mammals). The final WC for methylmercury was based on Table ES-3 Wildlife Criteria for Methylmercury Organism Wildlife Criterion (pg/l) Mink 57 River otter 42 Kingfisher 33 Loon 82 Osprey 82 Bald eagle 100 individual WC values calculated for mammalian species, and was estimated to be 50 picograms (pg) methylmercury/l water. The WC for methylmercury can be expressed as a corresponding mercury residue in fish though the use of appropriate BAFs. Using the BAFs presented in Table ES-2 (50th percentile), a WC of 50 pg/l corresponds to methylmercury concentrations in fish of µg/g and µg/g for trophic levels 3 and 4, respectively. In addition, a WC for total mercury can be calculated using an estimate of methylmercury as a proportion of total mercury in water. Based upon a survey of speciation data, the best current estimate of dissolved methylmercury as a proportion of total dissolved mercury was determined to be Using this value, a methylmercury WC of 50 pg/l corresponds to a total dissolved mercury WC of 641 pg/l. An additional correction is needed if the WC is to be expressed as the amount of total mercury in unfiltered water. The available data, although highly variable, suggest that on average total dissolved mercury comprises about 70 percent of that contained in unfiltered water. Making this final correction results in a WC of 910 pg/l (unfiltered, total mercury), which is approximately 70 percent of the value published previously in the GLWQI. Conclusions The following conclusions are presented in approximate order of degree of certainty in the conclusion, based on the quality of the underlying database. The conclusions progress from those with greater certainty to those with lesser certainty. Mercury emitted to the atmosphere deposits on watersheds and is translocated to waterbodies. A variable proportion of this mercury is transformed by abiotic and biotic chemical reactions to organic derivatives, including methylmercury. Methylmercury bioaccumulates in individual organisms, biomagnifies in aquatic food chains and is the most toxic form of mercury to which wildlife are exposed. ES-7
9 The proportion of total mercury in aquatic biota that exists as methylmercury tends to increase with trophic level. Greater than 90% of the mercury contained in freshwater fish exists as methylmercury. Methylmercury accumulates in fish throughout their lifetime, although changes in concentration as a function of time may be complicated by growth dilution and changing dietary habits. Piscivorous avian and mammalian wildlife are exposed to mercury primarily through consumption of contaminated fish and accumulate mercury to levels above those in prey items. Toxic effects on piscivorous avian and mammalian wildlife due to the consumption of contaminated fish have been observed in association with point source releases of mercury to the environment. Concentrations of mercury in the tissues of wildlife species have been reported at levels associated with adverse health effects in laboratory studies with the same species. Piscivorous birds and mammals receive a greater exposure to mercury than any other known receptors. BAFs for mercury in fish vary widely; however, field data are sufficient to calculate representative means for different trophic levels. These means are believed to be better estimates of mercury bioaccumulation in natural systems than values derived from laboratory studies. The recommended methylmercury BAFs for tropic levels 3 and 4 are 1,600,000 and 6,800,000, respectively (dissolved basis). Based upon knowledge of mercury bioaccumulation in fish, and of feeding rates and the identity of prey items consumed by piscivorous wildlife, it is possible to rank the relative exposure of different piscivorous wildlife species. Of the six wildlife species selected for detailed analysis, the relative ranking of exposure to mercury is this: kingfisher > otter > loon = osprey = mink > bald eagle. Existing data are insufficient to estimate the exposure of the Florida panther relative to that of the selected species. Local emissions sources (<50 km from receptors) have the potential to increase the exposure of piscivorous wildlife well above that due to sources located more than 50 km from the receptors (i.e., "remote" sources). Field data are insufficient to conclude whether the mink, otter or other piscivorous mammals have suffered adverse effects due to airborne mercury emissions. Field data are insufficient to conclude whether the loon, wood stork, great egret, or other piscivorous wading birds have suffered adverse effects due to airborne mercury emissions. Field data are suggestive of adverse toxicological effects in the Florida panther due to mercury. Unfortunately, the interpretation of these data is complicated by the co-occurrence of several other potentially toxic compounds, habitat degradation, and loss of genetic diversity. Field data suggest that bald eagles have not suffered adverse toxic effects due to airborne mercury emissions. ES-8
10 Reference doses (RfDs) for methylmercury, defined as chronic NOAELs, were determined for avian and mammalian wildlife. Each RfD was calculated as the toxic dose (TD) from laboratory toxicity studies, divided by appropriate uncertainty factors. The RfD for avian species is 21 µg/kg bw/d (mercury basis). The RfD for mammalian wildlife is 18 µg/kg bw/d (mercury basis). Based upon knowledge of mercury exposure to wildlife and its toxicity in long-term feeding studies, WC values can be calculated for the protection of piscivorous avian and mammalian wildlife. A WC value is defined as the concentration of total mercury in water which, if not exceeded, protects avian and mammalian wildlife populations from adverse effects resulting from ingestion of surface waters and from ingestion of aquatic life taken from these surface waters. The methylmercury WC for protection of piscivorous avian wildlife is 61 pg/l (mercury basis). The methylmercury criterion for protection of piscivorous mammalian wildlife is 50 pg/l (mercury basis). The final methylmercury criterion for protection of piscivorous wildlife species is 50 pg/l. This value corresponds to a total mercury concentration in the water column of 641 pg/l, and methylmercury concentrations in fish of ppm (trophic level 3) and ppm (trophic level 4). Modeled estimates of mercury concentration in fish around hypothetical mercury emissions sources predict exposures within a factor of two of the WC. The WC, like the human RfD, is predicted to be a safe dose over a lifetime. It should be noted, however, that the wildlife effects used as the basis for the WC are gross clinical manifestations. Expression of subtle adverse effects at these doses cannot be excluded. The adverse effect level (population impacts on piscivorous wildlife) for methylmercury in fish that occupy trophic level 3 lies between and 0.3 ppm. A comparison of this range of values with published residue levels in fish suggests that it is probable that individuals of some highly exposed wildlife subpopulations are experiencing adverse toxic effects due to airborne mercury emissions. There are many uncertainties associated with this analysis, due to an incomplete understanding of the biogeochemistry and toxicity of mercury and mercury compounds. The sources of uncertainty include the following: Variability in the calculated BAFs is a source of uncertainty. BAFs given in this Report relate methylmercury in fish to dissolved methylmercury levels in the water column. Methods for the speciation of mercury in environmental samples are rapidly improving but remain difficult to perform. Questions also remain concerning the bioavailability of methylmercury associated with suspended particulates and dissolved organic material. Local biogeochemical factors that determine net methylation rates are not fully understood. The food webs through which mercury moves are poorly defined in many ecosystems and may not be adequately represented by a fourtiered food chain model. The representativeness of field data used in establishing the BAFs is a source of uncertainty. The degree to which the analysis is skewed by the existing data set is unknown. A ES-9
11 disproportionate amount of data is from north-central and northeastern lakes. The uncertainty associated with applying these data to a national-scale assessment is unknown. Limitations of the toxicity database present a source of uncertainty. Few controlled studies of quantifiable effects of mercury exposure in wildlife are available. These are characterized by limited numbers of dosage levels, making it difficult to establish NOAEL and LOAEL values. The toxic endpoints reported in most studies can be considered severe, raising questions as to the degree of protection against subtle effects offered by RfD and WC values. Use of less than lifetime studies for prediction of effects from lifetime exposure is also a source of uncertainty. Concerns exist regarding the possibility of toxic effects in species other than the piscivorous birds and mammals evaluated in this Report. Uncertainty is associated with mercury effects in birds and mammals that prey upon aquatic invertebrates and with possible effects on amphibians and aquatic reptiles. Uncertainty is also associated with mercury effects in fish. Toxicity to terrestrial ecosystems, in particular soil communities, is another source of uncertainty. Lack of knowledge of wildlife feeding habits is a source of uncertainty. Existing information frequently is anecdotal or confined to evaluations of a particular locality; the extent to which this information can be generalized is open to question. In some instances, the feeding habits are relatively well characterized (e.g., Florida panther), whereas the extent of mercury contamination of prey is poorly known (e.g., in raccoons). While the methods used to assess toxicity focus on individual-level effects, the stated goal of the assessment is to characterize the potential for adverse effects in wildlife populations. Factors that contribute to uncertainty in population-based assessments include: variability in the relationship between individuals and populations; lack of data on carrying capacity; and relationships of one population, of the same or different species, to another population. A focus on populations may not always be appropriate. This could be true for endangered species, which may be highly dependent for the survival of the species on the health of a few individuals. This may also be true for some regional or local populations of widespread species; the local population may be "endangered" and, thus, dependent on the survival of individuals. Multiple stressor interactions involving chemical effects are, in general, poorly known. Even less well known are the possible impacts of land and water use practices on water quality and large-scale ecosystem attributes (e.g., community structure and biodiversity). ES-10
12 1. INTRODUCTION Section 112(n)(1)(B) of the Clean Air Act (CAA), as amended in 1990, requires the U.S. Environmental Protection Agency (U.S. EPA) to submit a study on atmospheric mercury emissions to Congress. The sources of emissions that must be studied include electric utility steam generating units, municipal waste combustion units and other sources, including area sources. Congress directed that the Mercury Study evaluate the rate and mass of mercury emissions, health and environmental effects, technologies to control such emissions and the costs of such controls. In response to this mandate, U.S. EPA has prepared an eight-volume Mercury Study Report to Congress. The eight volumes are as follows: I. Executive Summary II. An Inventory of Anthropogenic Mercury Emissions in the United States III. Fate and Transport of Mercury in the Environment IV. An Assessment of Exposure to Mercury in the United States V. Health Effects of Mercury and Mercury Compounds VI. An Ecological Assessment for Anthropogenic Mercury Emissions in the United States VII. Characterization of Human Health and Wildlife Risks from Mercury Exposure in the United States VIII. An Evaluation of Mercury Control Technologies and Costs This volume (Volume VI) is an ecological assessment of airborne mercury emissions. It provides an overview of the ecological effects of mercury, uses published data on fish residues as well as modeling predictions from Volume III to assess potential ecological exposures, and reviews available toxicity and bioaccumulation data for the purpose of developing qualitative statements about the risk of airborne mercury emissions to piscivorous avian and mammalian wildlife. In addition, these data are used to calculate a criterion value for the protection of piscivorous wildlife species, using the same general methodology employed in the Great Lakes Water Quality Initiative (U.S. EPA 1993b, 1993c, 1995b). Volume VI is organized according to the format provided by U.S. EPA's Framework for Ecological Risk Assessment (U.S. EPA, 1992a). Chapter 2 corresponds to the problem formulation phase of the assessment and reviews the potential ecological impacts of mercury. Based upon this information, it is concluded that piscivorous avian and mammalian wildlife are potentially at risk due to airborne mercury emissions. A conceptual model is presented to describe how airborne mercury becomes concentrated in aquatic biota, which serve as the primary food source for piscivorous wildlife. An exposure analysis is presented in Chapter 3, and effects are analyzed in Chapter 4. Effects and exposure information are considered together in Chapter 5 as a means of assessing the risk of airborne mercury emissions to piscivorous avian and mammalian wildlife. Chapter 6 lists the main conclusions of this report, while Chapter 7 presents a list of critical research needs. References are provided at the end of this Volume in Chapter 8. An ecological risk characterization for mercury is presented separately in Volume VII of this Report. The scope of this assessment is limited to consideration of only mercury that is emitted directly to the atmosphere. The origins and extent of these emissions are reviewed in Volume II of this Report. This analysis does not address mercury originating from mine leachate, the manufacturing and disposal of batteries, dental amalgam (in municipal wastewater), or the application of mercurial pesticides. In a number of instances, these and other "point" sources have been related to unacceptably high mercury 1-1
13 levels in fish, triggering site-specific fish consumption advisories. Clearly, where such point sources exist, there is a need to address the combined impacts of mercury originating from all sources, including air emissions. The exposure analysis for piscivorous wildlife was designed to address the following questions: What is the current degree of exposure of piscivorous avian and mammalian wildlife? In what broad geographical areas of the continental United States is there a high probability for co-occurrence of high mercury deposition rates and wildlife species of concern? What is the relative increase in exposure that can be anticipated for wildlife species that live in proximity to mercury emissions sources? The first of these questions was addressed by defining what piscivorous wildlife eat and then characterizing the mercury content of these food items. The second question was addressed by superimposing the results of a long-range transport analysis onto wildlife distribution information. The last question was addressed by using the results of a local-scale air dispersion model, combined with an indirect exposure methodology, to generate hypothetical exposure scenarios for wildlife. This shortrange analysis is similar to that used in the human health exposure assessment (Volume IV). Descriptions of the long- and short-range air dispersion models and the indirect exposure methodology are provided in Volume III. The primary goal of the effects analysis was to identify and review toxicity studies with wildlife species that could be used to estimate chronic NOAEL values for avian and mammalian wildlife. In addition, field data were reviewed as a means of comparing mercury residues in wild animals with those shown to associated with toxic effects in laboratory or other studies. Finally, exposure and effects information are reviewed in an effort to develop qualitative statements about the risk of mercury emissions to piscivorous avian and mammalian wildlife. This assessment includes a review of previously published efforts to assess the risk of mercury to several wildlife species living in restricted geographical locals. Exposure and effects information are also used to calculate a water-based wildlife criterion value for mercury, which, if not exceeded, would be protective of piscivorous avian and mammalian wildlife. The general method used to calculate this criterion value is similar to that used previously to estimate criterion values for mercury in the Great Lakes Water Quality Initiative (U.S. EPA 1993b, 1993c, 1995b). An effort was made to calculate fish residue concentrations corresponding to this criterion value. These residue values were then compared with measured values obtained in environmental sampling efforts. Owing to its importance for both the ecological and human health assessments, published data for fish and other aquatic biota were evaluated to calculate bioaccumulation factors (BAFs) for methylmercury and to characterize the uncertainties associated with these estimates. The data and methods used to derive these BAFs are presented in Appendix D of Volume III. A summary of this material is provided in Chapter 5 of the present Volume. 1-2
14 2. PROBLEM FORMULATION U.S. EPA defines ecological risk assessment as "a process that evaluates the likelihood that adverse ecological effects may occur or are occurring as a result of exposure to one or more stressors" (U.S. EPA, 1992a, 1996). A "stressor" is defined as any chemical, biological, or physical entity that can induce an adverse response of ecological components, i.e., individuals, populations, communities, or ecosystems. Although ecological risk assessment follows the same basic risk paradigm as human health risk assessment, there are three key differences between the two types. Ecological risk assessment can consider effects on populations, communities and ecosystems in addition to effects on individuals of a single species. No single set of ecological values to be protected is applicable in all cases; instead, they must be selected for each assessment based on both scientific and societal merit. Nonchemical stressors (e.g., physical disturbances) often need to be evaluated as well as chemical stressors. The problem formulation phase of an environmental risk assessment consists of four main components: (1) integrating available information on the stressors, potential exposure pathways, ecosystems potentially at risk, and ecological effects; (2) selecting assessment endpoints (the ecological values to be protected); (3) developing a conceptual model of the problem; and (4) formulating an analysis plan for the exposure and effects characterization phases of the assessment. Section 2.1 reviews the characteristics of mercury in the environment, including its various chemical forms (speciation), chemical transformations and movement within and between the air, surface water, and soil compartments of the environment (cycling). Section 2.2 identifies the pathways by which plants and animals can be exposed to mercury in both aquatic and terrestrial ecosystems. Section 2.3 provides an overview of what is known about the effects of mercury on organisms, populations, communities and ecosystems. Section 2.4 identifies ecosystems and ecosystem components that are thought to be most at risk from mercury in the environment. Section 2.5 describes the selection of assessment and measurement endpoints for the ecological risk assessment. A conceptual model of mercury fate and effects in the environment is presented in Section 2.6. An analysis plan for the exposure and effects characterizations is provided in Section 2.7. It should be noted that this review of mercury fate and effects is limited to consideration of only terrestrial and freshwater aquatic ecosystems. It is recognized that mercury that deposits in coastal areas can be translocated to estuarine environments, and that biota which inhabit these and nearby marine systems have the potential to be adversely impacted. Presently, however, uncertainties regarding mercury deposition, cycling, and effects in such environments are so great as to preclude even a qualitative risk assessment. 2.1 Stressor Characteristics: Mercury Speciation and Cycling Mercury in the environment can occur in various physical and chemical forms. Physically, mercury may exist as a gas or liquid, or it may be associated with solid particulates. Chemically, mercury can exist in three oxidation states: 0 (1) Hg elemental mercury, also called metallic mercury; 2-1
15
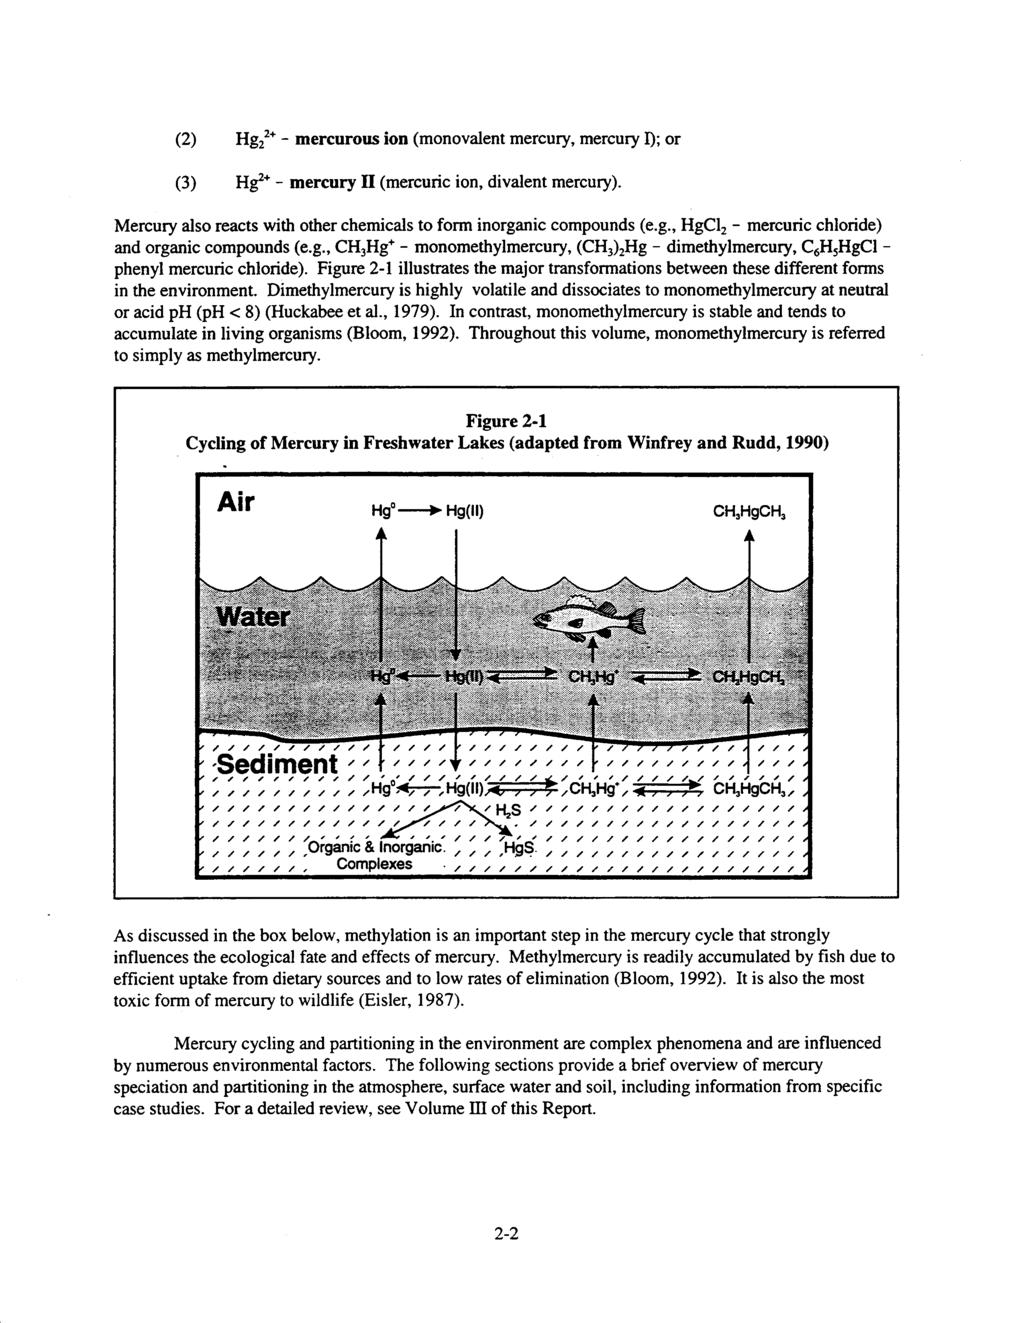
16 FOCUS ON METHYLMERCURY Methylmercury is the form of mercury of particular concern in ecosystems for three reasons. (1) All forms of mercury can be converted to methylmercury by natural processes in the environment. (2) Methylmercury bioaccumulates and biomagnifies in aquatic food webs. (3) Methylmercury is the most toxic form of mercury. In the 1960s, researchers found methylmercury in fish in Swedish lakes, although no discharge of methylmercury had occurred in those lakes (Bakir et al., 1973). Later research determined that the methylation of mercury in sediments by anaerobic sulfur-reducing bacteria was a major source of methylmercury in many aquatic environments (Gilmour and Henry, 1991; Zillioux et al., 1993). Aerobic bacteria and fungi, including yeasts that grow best in acid conditions, also can methylate mercury (Eisler, 1987; Yannai et al., 1991; Fischer et al., 1995). In addition, fulvic and humic material may abiotically methylate mercury (Nagase et al., 1984; Lee et al., 1985; Weber, 1993). The major site of methylation in aquatic systems is the sediment, but methylation also occurs in the water column (Wright and Hamilton, 1982; Xun et al., 1987; Parks et al., 1989; Bloom and Effler, 1990; Winfrey and Rudd, 1990; Bloom et al., 1991; Gilmour and Henry, 1991; Miskimmin et al., 1992). Wetlands may be particularly active sites of methylation (St. Louis et al., 1994; Hurley et al., 1995). The rate of mercury methylation varies with microbial activity, mercury loadings, suspended sediment load, DOC, nutrient content, ph, redox conditions, temperature, and other variables. Demethylation occurs via biotic and abiotic mechanisms, including photodegradation (Sellers et al., 1996). The net rate of mercury methylation is determined by competing rates of methylation and demethylation. Methylmercury bioaccumulates and biomagnifies in aquatic food webs at higher rates and to a greater extent than any other form of mercury (Watras and Bloom, 1992). "Bioaccumulation" refers to the net uptake of a contaminant from the environment into biological tissue via all pathways. It includes the accumulation that may occur by direct contact of skin or gills with mercury-contaminated water as well as ingestion of mercury-contaminated food. "Biomagnification" refers to the increase in chemical concentration in organisms at successively higher trophic levels in a food chain as a result of the ingestion of contaminated organisms at lower trophic levels. Methylmercury can comprise from 10 percent to over 90 percent of the total mercury in phytoplankton and zooplankton (trophic levels 1 and 2) (May et al., 1987; Watras and Bloom, 1992), but generally comprises over 90 percent of the total mercury in fish (trophic levels 3 and 4) (Huckabee et al., 1979; Grieb et al., 1990; Bloom, 1992; Watras and Bloom, 1992). Fish absorb methylmercury efficiently from dietary sources and store this material in organs and tissues. The biological half-life of methylmercury in fish is difficult to determine but is generally thought to range from months to years. Methylmercury is the most toxic form of mercury to birds, mammals, and aquatic organisms due to its strong affinity for sulfur-containing organic compounds (e.g., proteins). Biological membranes, including the blood-brain barrier and the placenta, that tend to discriminate against other forms of mercury allow relatively easy passage of methylmercury and dissolved mercury vapor (Eisler, 1987). Methylmercury can cause death, neurological disorders, organ damage, impaired immune response, impaired growth and development and reduced reproductive success (Klaassen, 1986). In mammals, fetuses are particularly sensitive to mercury, experiencing deleterious developmental effects when the mothers appear to be unaffected (Clarkson, 1990) Mercury in Air o In the atmosphere, most mercury (95 to over 99 percent) exists as gaseous Hg ; the remainder 2+ generally is comprised of gaseous divalent (Hg ) mercury and mercury associated with particulates (Lindqvist, 1991; MDNR, 1993). Gaseous methylmercury may also may exist in air at measurable concentrations, especially near mercury emissions sources. Mercury associated with particulates in air 2+ includes Hg, which is thought to occur primarily as mercuric chloride (MDNR, 1993). The form of mercury in air affects both the rate and mechanism by which it deposits to earth. o Oxidized and particulate mercury are more likely to be deposited than Hg because they are more soluble in water and are scavenged by precipitation more easily. They are also thought to be dry deposited more easily. As a result, oxidized and particulate forms of mercury are thought to comprise the majority of 2-3
17 deposited mercury, even though they comprise only a few percent of the total amount of mercury in the atmosphere (Lindqvist, 1991). Wet deposition is thought to be the primary mechanism for transporting mercury from the atmosphere to surface waters and land (Lindqvist, 1991). In the Great Lakes area, for example, wet 2+ deposition is believed to account for 60 to 70 percent of total mercury deposition. Hg is the predominant form in precipitation (MDNR, 1993) Mercury in Surface Water o 2+ Mercury can enter surface water as Hg, Hg, or methylmercury. Once in aquatic systems, mercury can exist in dissolved or particulate forms and can undergo the following transformations (see Figure 2-1) (Lindqvist et al., 1991; Winfrey and Rudd, 1990). o 2+ Hg in surface waters can be oxidized to Hg or volatilized to the atmosphere. 2+ Hg can be methylated in sediments and the water column to form methylmercury. Methylmercury can be alkylated to form dimethylmercury. 2+ Hg and methylmercury can form organic and inorganic complexes with sediment and suspended particulate matter. Each of these reactions can also occur in the reverse direction. The net rate of production of each mercury species is determined by the balance between forward and reverse reactions. Estimates of the percent of total mercury in surface waters that exists as methylmercury vary. Generally, methylmercury makes up less than 20 percent of the total mercury in the water column (Kudo et al., 1982; Parks et al., 1989; Bloom and Effler, 1990; Watras et al., 1995a). In lakes without point source discharges, methylmercury frequently comprises ten percent or less of total mercury in the water column (Lee and Hultberg, 1990; Lindqvist, 1991; Porcella et al., 1991; Watras and Bloom, 1992; Driscoll et al., 1994, 1995; Watras et al., 1995b). A review of speciation data collected to date suggests that methylmercury as a percent of total averages just under 8 percent (see Volume III, Appendix D of this Report). Contaminated sediments can serve as an important mercury reservoir, with sediment-bound mercury recycling back into the aquatic ecosystem for decades or longer. Biological processes affect this recycling process. For example, sulfate-reducing bacteria may mediate mercury methylation (Gilmour and Henry, 1991). Benthic invertebrates may take up mercury from sediments, making it available to other aquatic animals through the food chain and to vertebrates that consume emergent aquatic insects (Hildebrand et al., 1980; Wren and Stephenson, 1991; Dukerschein et al., 1992; Saouter et al., 1993; Tremblay et al., 1996; Suchanek et al., 1997). Chemical factors, such as reduced ph, may stimulate methylmercury production at the sediment/water interface and thus may accelerate the rate of mercury methylation resulting in increased accumulation by aquatic organisms (Winfrey and Rudd, 1990). Attributes of the sediment, including organic carbon and sulfur content, can influence mercury bioavailability (Tremblay et al., 1995). DOC appears to be important in the transport of mercury to lake systems but, at high concentrations, may limit bioavailability (Driscoll et al., 1994, 1995). 2-4
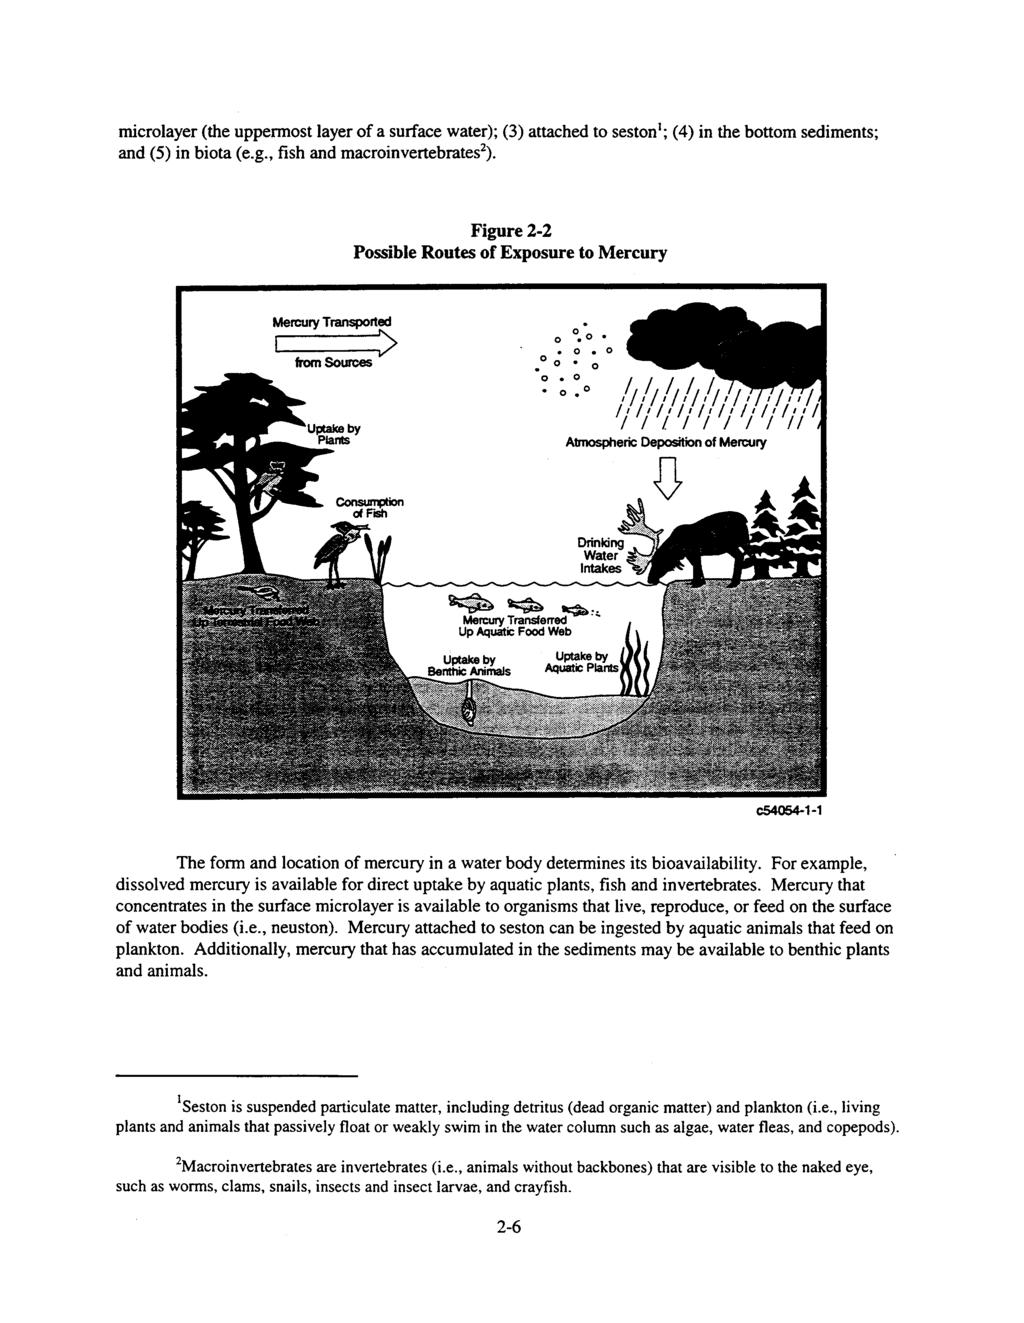
18 2.1.3 Mercury in Soil Mercury deposited from the air forms stable complexes with soil particles of high organic or sulfur content and with humic and fulvic acids (Andersson, 1979; WHO, 1989; Johansson et al., 1991; Yin et al., 1996). These chemical bonds limit mercury's mobility in soils and its availability for uptake by living organisms. In general, the distribution of mercury in soil is likely to follow the distribution of organic matter. Mercury has a long retention time in soils. As a result, mercury that has accumulated in soils may continue to be released to surface waters for long periods of time, possibly hundreds of years (Johansson et al., 1991) 2+ Hg in soils can be transformed to other mercury species. Bacteria and organic substances can 2+ o reduce Hg to Hg, releasing volatile elemental mercury to the atmosphere. Alternatively, bacteria and organic substances can methylate mercury, and subsequently demethylate it, depending on environmental conditions (Allard and Arsenie, 1991; Gilmour and Henry, 1991). Recent measurements of volatile exchange between air and soil indicate that soil emissions could be similar in magnitude to atmospheric deposition, suggesting that the total sink capacity of soils is less than previously thought (Kim et al., 1995). Similarly, measurements of canopy emissions indicate that forest ecosystems may not act as efficient sinks for atmospheric mercury (Lindberg, 1996). It is uncertain at present how much these loss processes affect the retention of mercury in upper level soils. 2.2 Potential Exposure Pathways Plants and animals can be exposed to mercury by direct contact with contaminated environmental media or ingestion of mercury-contaminated water and food (see Figure 2-2). Mercury deposited in soil can be a source of direct exposure from physical contact (e.g., earthworms and terrestrial plants). Animals also can ingest mercury in soil, either purposefully (e.g., earthworms) or incidentally (e.g., grazers). Mercury in the air can be taken up directly by terrestrial or aquatic emergent plants or inhaled by terrestrial animals. Mercury in water can be a source of direct exposure to aquatic plants (e.g., algae and seagrasses) and animals (e.g., zooplankton and fish) and can be ingested by terrestrial animals in drinking water. Finally, both aquatic and terrestrial animals can be exposed to mercury in contaminated food sources. Not all of these potential exposure pathways are equally important, however. The remainder of this section evaluates the likely importance of different routes of exposure consequent to mercury release to air. Section discusses the fate and bioavailability of mercury in aquatic systems and the pathways by which aquatic plants and animals can be exposed to mercury directly in contaminated water or indirectly through aquatic food webs. Section provides information on the fate and bioavailability of mercury in terrestrial ecosystems and the pathways by which terrestrial plants and animals can be exposed. Bioaccumulation of mercury in aquatic and terrestrial organisms is discussed further in Section Exposure Pathways in Aquatic Systems Figure 2-3 illustrates the potential distribution of mercury in a water body. As shown, mercury can be present in surface waters in various forms: (1) dissolved in the water; (2) concentrated in the surface 2-5
19
EXCERPT FROM MERCURY STUDY REPORT TO CONGRESS VOLUME VII:
 EXCERPT FROM MERCURY STUDY REPORT TO CONGRESS VOLUME VII: CHARACTERIZATION OF HUMAN HEALTH AND WILDLIFE RISKS FROM MERCURY EXPOSURE IN THE UNITED STATES December 1997 Office of Air Quality Planning and
Mercury Study Report to Congress
 United States Environmental Protection Agency EPA-452/R-97-008 December 1997 Air Mercury Study Report to Congress Volume VI: An Ecological Assessment for Anthropogenic Mercury Emissions in the United States
Methodology for the development of wildlife criteria for the lake Erie drainage basin.
 3745-1-43 Methodology for the development of wildlife criteria for the lake Erie drainage basin. [Comment: For dates of non-regulatory government publications, publications of recognized organizations
Canadian Mercury Science Assessment Executive Summary
 Canadian Mercury Science Assessment Executive Summary Cat. No.: En84-130/1-2016E-PDF ISSN 978-0-660-03315-0 Unless otherwise specified, you may not reproduce materials in this publication, in whole or
Chapter 3 - ATMOSPHERIC TRANSPORT AND MERCURY DEPOSITION
 Chapter 3 - ATMOSPHERIC TRANSPORT AND MERCURY DEPOSITION A. Introduction Mercury is an especially dynamic pollutant because of its unique physical, chemical, and bioaccumulative properties. The volatility
A Probabilistic Fate and Effects Model for Pharmaceuticals and Personal Care Products
 A Probabilistic Fate and Effects Model for Pharmaceuticals and Personal Care Products Miranda Henning, Jennifer Lyndall, Michael J. Bock, Timothy Barber, Darrel Lauren Water Dependencies in New England:
Characteristics of Mercury and other Metals
 Characteristics of Mercury and other Metals Ben Hodges Physical Transport Lynn Katz Surface/Water Chemistry Howard Liljestrand- Air/Water Chemistry The University of Texas at Austin 8 February 2002 Metals
Modeling the Biogeochemical Cycle of Mercury in Lakes: The Mercury Cycling Model (MCM) and Its Application to the MTL Study Lakes
 and Its Application to the MTL Study Lakes") ~- -.,, OLO ('''"' ~...,;;,, FEB 11 2004 Chapter V.1 Modeling the Biogeochemical Cycle of Mercury in Lakes: The Mercury Cycling Model (MCM) and Its Application to the MTL Study Lakes CONTENTS Robert J.
~- -.,, OLO ('''"' ~...,;;,, FEB 11 2004 Chapter V.1 Modeling the Biogeochemical Cycle of Mercury in Lakes: The Mercury Cycling Model (MCM) and Its Application to the MTL Study Lakes CONTENTS Robert J.
Chapter 6 Risk Characterization
 hapter 6 Risk haracterization What s overed in hapter 6: g g g Risk Estimation Risk Description Uncertainty and Limitations of the Screening Level Risk Assessment Risk characterization includes risk estimation
Linking Fish and Wildlife Tissue Residues to Contaminant Concentrations in Water and Sediment
 Linking Fish and Wildlife Tissue Residues to Contaminant Concentrations in Water and Sediment Perspectives on Regulatory Criteria and Screening Levels Based on Wildlife Tissue Residues SETAC Hudson/Delaware
STAR REPORT MERCURY TRANSPORT AND FATE IN WATERSHEDS. U.S. EPA Office of Research. and Development s Science. To Achieve Results (STAR)
") STAR REPORT Vol. 4 Issue 1 October 2000 U.S. EPA Office of Research 10 and Development s Science To Achieve Results (STAR) Research in Progress A product of the National Center for Environmental Research
STAR REPORT Vol. 4 Issue 1 October 2000 U.S. EPA Office of Research 10 and Development s Science To Achieve Results (STAR) Research in Progress A product of the National Center for Environmental Research
Local Impacts of Mercury from Coal-Fired Power Plants
 Local Impacts of Mercury from Coal-Fired Power Plants Prepared by Clean Air Task Force, March 2003 Effects of Coal Type and Air Pollution Control Device on Mercury Emissions, Atmospheric Transport and
International Mercury Assessment
 United Nations Environment Programme 1 International Mercury Assessment Hg Table of Contents Introduction, Purpose & Scope Issue 1: Institutional Form for Future Action Issue 2: Atmospheric Emissions Issue
Module 12: Oceanography Topic 6 Content: Ocean Pollution Notes. Ocean Pollution
 Ocean Pollution 1 Ocean pollution is an important modern-day environmental issue. Pollution occurs when chemical, physical, and/or biological agents are introduced into an environment and cause undesirable
Environmental Toxicology and exploring ATSDR toxicological profiles
 Environmental Toxicology and exploring ATSDR toxicological profiles MSC-210 Marine Environmental Sampling & Analysis Lecture 8 Toxicology Definitions Environmental Toxicology: The study of the fate and
Trends and Perspectives of Ecological Risk Assessments for Dioxin-Like Compounds in the Great Lakes Basin. Wisla, Poland
 Trends and Perspectives of Ecological Risk Assessments for Dioxin-Like Compounds in the Great Lakes Basin Efficacy of Predicted vs. Measured Exposure and Effects Assessments International Conference on
USEPA s National Fish and Wildlife Contamination Program
 USEPA s National Fish and Wildlife Contamination Program Joel Hansel, Regional Fish Advisory Coordinator Water Quality Protection Branch Water Protection Division United States Environmental Protection
Food Chains, Food Webs, and Bioaccumulation Background
 Food Chains, Food Webs, and Bioaccumulation Background Introduction Every living organism needs energy to sustain life. Organisms within a community depend on one another for food to create energy. This
Derivation of New Jersey-Specific Wildlife Values as Surface Water Quality Criteria for: PCBs DDT Mercury
 Derivation of New Jersey-Specific Wildlife Values as Surface Water Quality Criteria for: PCBs DDT Mercury A cooperative effort between the: U.S. Fish & Wildlife Service U.S. Environmental Protection Agency
Watershed retention of atmospherically-deposited mercury in Michigan. Implications for recovery of lakes from mercury pollution
 Watershed retention of atmospherically-deposited mercury in Michigan Implications for recovery of lakes from mercury pollution Paul Drevnick, University of Michigan Defining the problem: methylmercury
UNITED STATES ENVIRONMENTAL PROTECTION AGENCY REGION BROADWAY NEW YORK, NEW YORK 10007
 EXHIBIT 13 "E UNITED STATES ENVIRONMENTAL PROTECTION AGENCY REGION 2 290 BROADWAY NEW YORK, NEW YORK 10007 MEMORANDUM DATE: January 18, 2001 SUBJECT: FROM: TO: National Remedy Review Board Recommendations
6.3.2 Exposure Assessment
 6.3.2 Exposure Assessment A key component of conducting a risk-based screening evaluation is identification of potential exposures. An exposure assessment includes an evaluation of potential human and
Western North America Mercury Synthesis (WNAMS)
") Western North America Mercury Synthesis (WNAMS) A Multi-disciplinary, tri-national assessment of the climate, landscape, and land use controls on mercury risk to ecological and human health across western
Western North America Mercury Synthesis (WNAMS) A Multi-disciplinary, tri-national assessment of the climate, landscape, and land use controls on mercury risk to ecological and human health across western
Components of Estuarine and Marine Ecological Risk Assessment
 Components of Estuarine and Marine Ecological Risk Assessment Denise M. Klimas Donald A. MacDonald Assessment and Restoration Division Office of Response and Restoration DTSC Ecological Risk Assessment
Chemical contaminants can enter surface waters or be deposited on beaches from
 CHAPTER 10 Chemical and physical agents Chemical contaminants can enter surface waters or be deposited on beaches from both natural and anthropogenic sources. These may be either point sources, such as
Summary of Public Comments received on PFOA, its Salts and its Precursors.
 Summary of Public Comments received on PFOA, its Salts and its Precursors. Comments on the draft screening assessment report for Perfluorooctanoic acid (PFOA), its Salts and its Precursors were provided
Summary. What is mercury/methylmercury and what are its properties and potential harmful effects on the arctic.
 Summary What is mercury/methylmercury and what are its properties and potential harmful effects on the arctic. Mercury (Hg) is a toxic heavy metal that changes into various chemical forms through geochemical
Atmospheric Mercury Deposition And Impacts In The Pacific Northwest
 Atmospheric Mercury Deposition And Impacts In The Pacific Northwest Bob Brunette and David Gay National Atmospheric Deposition Program Mercury Deposition Network DGay@illinois.edu RobertBrunette@EurofinsUS.com
Merganser Model. MERcury Geo-spatial. For the New England Region
 Merganser Model MERcury Geo-spatial AssessmeNtS For the New England Region David Evers, John Graham, Eric Miller, Neil Kamman, Keith Robinson, Jamie Shanley, Alison Simcox, Richard Smith, Jeri Weiss 1
Problem Formulation and Conceptual Model Development for Aquatic Placement
 Problem Formulation and Conceptual Model Development for Aquatic Placement Burton Suedel, Ph.D. burton.suedel@usace.army.mil DMAM Seminar Day 1 15 Sept 2009 Objectives Overview of problem formulation Overview
Ecotoxicology of agrochemicals. U n i v e r s i t y o f G i r o n a
 Ecotoxicology of agrochemicals U n i v e r s i t y o f G i r o n a Program 1. Introduction 2. Agrochemicals typology and activity 3. Environmental behavior of agrochemicals 4. Bioavailability and biotransformation
Energy. Raw materials to make building blocks of life. From sun or chemicals. From food
 Energy From sun or chemicals Raw materials to make building blocks of life From food Sunlight is the main energy source for life on Earth Autotrophs will use energy from the sun to convert carbon dioxide
Chapter 24 Lecture Outline
 Chapter 24 Lecture Outline See separate PowerPoint slides for all figures and tables preinserted into PowerPoint without notes. Copyright 2016 McGraw-Hill Education. Permission required for reproduction
Mercury Biogeochemical Cycle
 Mercury Biogeochemical Cycle Hao Zhou 10/09/2017 Today s Discussion Background Compartments Anthropogenic inputs Atmosphere Arctic Soil Freshwater/wetlands Ocean 1 Liquid at room temperature Not biodegradable
Overview of Dredged Material Testing and Evaluation
 Overview of Dredged Material Testing and Evaluation Jeffery Steevens US Army Corps of Engineers Engineer Research and Development Center 23 July 2012 Guidance Documents for Management of Dredged Material
Ecological/Watershed Modeling. Cindy Ryals Taylor Carroll
 Ecological/Watershed Modeling Cindy Ryals Taylor Carroll Defining Models Defining the problem the question Conceptual Model a set of ideas Verbal Model translate into words Mathematical Model translate
Aquifer Storage and Recovery Regional Study
 Aquifer Storage and Recovery Regional Study ASR Regional Study Ecological Risk Assessment Mark Shafer, P.E., USACE US Army Corps of Engineers 2 Presentation Outline Critical Issues (identified in 1999-2002)
Combined Use of AERMOD, ArcGIS, and Risk Analyst for Human Health Risk Assessment. Paper No Prepared By:
 Combined Use of AERMOD, ArcGIS, and Risk Analyst for Human Health Risk Assessment Paper No. 33578 Prepared By: Aubrey Jones Senior Consultant/ Meteorologist Abhishek Bhat, PhD, EPI Senior Consultant Tiffany
A Procedure for Developing Ecosystem Loading Limits (TMDLs) for Selenium in Watersheds Affected by Gold Mining in Northern Argentina
 for Selenium in Watersheds Affected by Gold Mining in Northern Argentina") A Procedure for Developing Ecosystem Loading Limits (TMDLs) for Selenium in Watersheds Affected by Gold Mining in Northern Argentina A. Dennis Lemly, Ph.D. United States Forest Service Southern Research
A Procedure for Developing Ecosystem Loading Limits (TMDLs) for Selenium in Watersheds Affected by Gold Mining in Northern Argentina A. Dennis Lemly, Ph.D. United States Forest Service Southern Research
Bio 430: Chemicals in the environment. Jeffrey Jenkins Department of Environmental and Molecular Toxicology Oregon State University
 Bio 430: Chemicals in the environment Jeffrey Jenkins Department of Environmental and Molecular Toxicology Chemical fate: transformation and transport within and between Soil-Air-Water-Biota Source: U.S.
ACVM - REGISTRATION STANDARD FOR TOXICOLOGY AND ENVIRONMENTAL TOXICOLOGY
 ACVMS 9.1 Ministry of Agriculture and Forestry Post Office Box 2526 WELLINGTON, NEW ZEALAND ACVM - REGISTRATION STANDARD FOR TOXICOLOGY AND ENVIRONMENTAL TOXICOLOGY This document may be altered at any
LIMNOLOGY. Inland Water Ecosystems. JACOB KALFF McGill University. Prentice Hall. Upper Saddle River, New Jersey 07458
 LIMNOLOGY Inland Water Ecosystems JACOB KALFF McGill University Prentice Hall Prentice Hall Upper Saddle River, New Jersey 07458 Contents CHAPTER 1 Inland Waters and Their Catchments: An Introduction and
Ecological Risk Assessment and the Tittabawassee River, Why, How and Who Cares
 Ecological Risk Assessment and the Tittabawassee River, Why, How and Who Cares Chippewa Nature Center, April 13 2006 Matthew Zwiernik, PhD Professor Zoology/Vet Med. Michigan State University Special Thanks
Final Total Maximum Daily Load for the Monongahela River, Greene County PCBs and Chlordane
 Final Total Maximum Daily Load for the Monongahela River, Greene County PCBs and Chlordane Point Marion Lock and Dam to Grays Landing Lock and Dam March 1, 1999 Table of Contents Introduction Background
Effects of bis(2,4,6-tribromophenoxy)ethane (BTBPE) in Mink (Mustela vison)
ethane (BTBPE) in Mink (Mustela vison)") Effects of bis(2,4,6-tribromophenoxy)ethane (BTBPE) in Mink (Mustela vison) J. Newsted 1,2, S. Smith-Edwards 2, P. Martin 3, J. Link 2, R.J. Letcher 4, S. Bursian 2 1 Natural Resource Technology, and OBG
Effects of bis(2,4,6-tribromophenoxy)ethane (BTBPE) in Mink (Mustela vison) J. Newsted 1,2, S. Smith-Edwards 2, P. Martin 3, J. Link 2, R.J. Letcher 4, S. Bursian 2 1 Natural Resource Technology, and OBG
Where Do All the Toxins Go? (External View)
") Toxic Chemicals in the Great Lakes 2 of Two Activities Where Do All the Toxins Go? (External View) Bioaccumulation is the build-up of chemicals in an organism s body the longer an organism lives, the more
Toxic Chemicals in the Great Lakes 2 of Two Activities Where Do All the Toxins Go? (External View) Bioaccumulation is the build-up of chemicals in an organism s body the longer an organism lives, the more
Emissions. Global Sources of Mercury Primary (smokestacks and mining) Secondary (historical deposition and re emission)
 Secondary (historical deposition and re emission)") Investigations on the Cycling of Mercury from the Ocean to Fog and Deposition to Land in Coastal California Peter Weiss Penzias, Ph.D. Department of Microbiology and Environmental Toxicology, UC Santa
Investigations on the Cycling of Mercury from the Ocean to Fog and Deposition to Land in Coastal California Peter Weiss Penzias, Ph.D. Department of Microbiology and Environmental Toxicology, UC Santa
Welcome to the Anthropocene. by Dr. John L. Hough Principal Technical Advisor - Biodiversity UNDP
 Welcome to the Anthropocene by Dr. John L. Hough Principal Technical Advisor - Biodiversity UNDP The 5 th great extinction crisis Emergence of Homo sapiens The 6 th great extinction crisis 6 billion people
Keystone Biology Remediation B4: Ecology
 Keystone Biology Remediation B4: Ecology Assessment Anchors: to describe the levels of ecological organization (i.e. organism, population, community, ecosystem, biome, biosphere) (B.4.1.1) to describe
Overview of the Human Health and Environmental Effects of Power Generation: Focus on Sulfur Dioxide (SO 2 ), Nitrogen Oxides (NO X ) and Mercury (Hg)
, Nitrogen Oxides (NO X ) and Mercury (Hg)") The information presented here reflects EPA's modeling of the Clear Skies Act of 2002. The Agency is in the process of updating this information to reflect modifications included in the Clear Skies Act
The information presented here reflects EPA's modeling of the Clear Skies Act of 2002. The Agency is in the process of updating this information to reflect modifications included in the Clear Skies Act
Ecosystems Part 2. Food Chains, Food Webs, and Energy
 Ecosystems Part 2 Food Chains, Food Webs, and Energy Autotrophs Organisms that use the energy in sunlight to convert water and carbon dioxide into Glucose (food) Also called Producers because they produce
Summary Table. Appendix A Summary of Technical Advice Received at TAC Meeting 2 Final (Version: Jan 19, 2014)
") The Technical Advisory Committee (TAC) for the Elk Valley Water Quality Plan (the Plan ) held their 2 nd meeting on October 29-30, 2012. This document is a record of the technical advice received at this
The Technical Advisory Committee (TAC) for the Elk Valley Water Quality Plan (the Plan ) held their 2 nd meeting on October 29-30, 2012. This document is a record of the technical advice received at this
Classifying our Biotic Environment (Trophic Levels) Ecology. Ecology is study how things interact with other and else in the.
 Ecology. Ecology is study how things interact with other and else in the.") Ecology Ecology is study how things interact with other and else in the. Ecologists focus their attention on in order to organize their studies. Ecosystems can be very large or very small. For example:
Ecology Ecology is study how things interact with other and else in the. Ecologists focus their attention on in order to organize their studies. Ecosystems can be very large or very small. For example:
STATE OF LOUISIANA DEPARTMENT OF ENVIRONMENTAL QUALITY
 STATE OF LOUISIANA DEPARTMENT OF ENVIRONMENTAL QUALITY IN THE MATTER OF: * * PPG Industries, Inc., * AI No. 1255 * * PROCEEDINGS UNDER THE * LOUISIANA ENVIRONMENTAL * QUALITY ACT * R.S. 30:2001 ET SEQ.
Chapter 8 Interpreting Uncertainty for Human Health Risk Assessment
 What s Covered in Chapter 8: Chapter 8 Interpreting Uncertainty for Human Health Risk Assessment 8.1 Uncertainty and Limitations of the Risk Assessment Process 8.2 Types of Uncertainty 8.3 Qualitative
MERCURY CONNECTIONS. The extent and effects of mercury pollution in northeastern North America
 MERCURY CONNECTIONS The extent and effects of mercury pollution in northeastern North America Mercury Connections is a summary of the major findings reported in a series of 21 papers. These papers are
Objectives. Aquatic Toxicology of Metals 4/20/11. Why are metals different than organic chemicals? Essential vs. Non-essential metals
 Aquatic Systems & Environmental Health Aquatic Toxicology of Metals David Barber barberd@vetmed.ufl.edu 392-2243 x.5540 Objectives Understand how metals differ from organic compounds including their source
Estimation of Mercury Bioavailability in Wastewater Treatment Plant Effluents. Robert P. Mason J. David Dean
 Estimation of Mercury Bioavailability in Wastewater Treatment Plant Effluents Robert P. Mason J. David Dean Feb 5, 2009, SFEI Meeting, Oakland, CA ESTIMATION OF MERCURY BIOACCUMULATION POTENTIAL FROM WASTEWATER
Ecosystem. Ecosystems. Consumers. Simple Ecosystem Model. Trophic Levels. Food Chain marsh hawk
 Ecosystem Ecosystems Chapter 47 An association of organisms and their physical environment, interconnected by ongoing flow of energy and a cycling of materials Simple Ecosystem Model energy input from
Urban Toxic Contaminants: Removal by Urban Stormwater BMPs TOM SCHUELER CHESAPEAKE STORMWATER NETWORK
 Urban Toxic Contaminants: Removal by Urban Stormwater BMPs TOM SCHUELER CHESAPEAKE STORMWATER NETWORK WWW.CHESAPEAKESTORMWATER.NET Urban Toxic Contaminants (UTC) 1. Why Worry About Toxics? 2. The Dirty
Summary of selected Minnesota Pollution Control Agency and Office of Environmental Assistance mercury-reduction programs
 Summary of selected Minnesota Pollution Control Agency and Office of Environmental Assistance mercury-reduction programs Summary of selected Minnesota Pollution Control Agency and Office of Environmental
Contaminated Sediment Conceptual Site Models and Remediation
 Contaminated Sediment Conceptual Site Models and Remediation Presented to Best Practices Group Presented by David Keith August 28, 2008 Presentation Purpose To provide a high-level overview of site investigations
Chapter 14. Water Pollution
 Chapter 14 Water Pollution The Chesapeake Bay Chesapeake Bay largest estuary in the US Pollutants: Excess nitrogen and phosphorus From 3 major sources: Consequence of increased nutrients Sediment increase
Risk Assessment Program Progress Report October 9, 2013
 Risk Assessment Program Progress Report October 9, 2013 Risk assessment team Dr. Kim K. Ayre water quality endpoints Annie F. Johns toxicity re evaluation and remediation analysis Carlie Herring temperature
Human Health Risk Assessment (HHRA) HHRA Study Scope. HHRA Study Objectives. Human Health Risk Assessment REMASCO Gasifier Installations Kingsville ON
 HHRA Study Scope. HHRA Study Objectives. Human Health Risk Assessment REMASCO Gasifier Installations Kingsville ON") Human Health Risk Assessment (HHRA) Human health risk assessment is a scientific process that is used to estimate the likelihood that a population may experience adverse health effects as a result of exposure
Human Health Risk Assessment (HHRA) Human health risk assessment is a scientific process that is used to estimate the likelihood that a population may experience adverse health effects as a result of exposure
Biology 5868 ID Exam 3 May 10, 2007
 Ecotoxicology Name KEY Biology 5868 ID Exam 3 May 10, 2007 Be as specific as possible for all answers. Most of the questions have multiple parts; make sure to answer each part! Use diagrams, flowcharts,
Technical Document EPA s Draft Report on the Environment Chapter 1 - Cleaner Air 1.2 Acid Deposition 1-25
 Technical Document EPA s Draft Report on the Environment 3 1. Acid Deposition Sulfur dioxide and NO X emissions in the atmosphere react with water, oxygen, and oxidants to form acidic components, also
Mercury Monitoring on the Fond du Lac Reservation
 Mercury Monitoring on the Fond du Lac Reservation Joy Wiecks, Air Quality Technician Fond du Lac Band of Lake Superior Chippewa December 15, 2005 WRAP Board Meeting FDL Mercury Monitoring Program Reservation
AP Environmental Science
 AP Environmental Science Types of aquatic life zones MARINE Estuaries coral reefs mangrove swamps neritic zone pelagic zone FRESHWATER lakes and ponds streams and rivers wetlands Distribution of aquatic
SITE-SPECIFIC APPROACH FOR SETTING WATER QUALITY CRITERIA FOR SELENIUM: DIFFERENCES BETWEEN LOTIC AND LENTIC SYSTEMS
 SITE-SPECIFIC APPROACH FOR SETTING WATER QUALITY CRITERIA FOR SELENIUM: DIFFERENCES BETWEEN LOTIC AND LENTIC SYSTEMS W.J. Adams, 1 J.E. Toll, 2 K.V. Brix, 2 L.M. Tear, 2 D.K. DeForest, 2 1 Kennecott Utah
Ecological Screening-Level Risk Assessment of the Lower Ottawa River
 Final Report Ecological Screening-Level Risk Assessment of the Lower Ottawa River Prepared for Limno-Tech, Inc. 501 Avis Drive Ann Arbor, Michigan 48108 Prepared by Parametrix 5808 Lake Washington Blvd.
Nutrient Cycling in an Aquatic Ecosystem
 Nutrient Cycling in an Aquatic Ecosystem 2.1 Productivity 2.2 Oxygen 2.3 Salinity 2.4 Carbon 2.5 Nitrogen 2.6 Phosphorous 2.7 Iron 2.8 Sulphur 2.9 Silica 2.3 Salinity of Inland Waters The salinity of freshwaters
These values can be considered from the perspective of three hierarchical levels:
 Wetland Ecology Lectures 19-20 Wetland Values Wetland Values These values can be considered from the perspective of three hierarchical levels: Population Ecosystem Global Populations easiest value to identify
Mercury MACT Under the Clean Air Act: An Assessment of the Mercury Emissions Outcomes of Stakeholder Group Recommendations NESCAUM May 8, 2003
 1.0 Background Mercury MACT Under the Clean Air Act: An Assessment of the Mercury Emissions Outcomes of Stakeholder Group Recommendations NESCAUM May 8, 2003 Mercury is a persistent, bioaccumulative, neurotoxic
6-3 Biodiversity Slide 1 of 35
 1 of 35 The Value of Biodiversity The Value of Biodiversity Biological diversity, or biodiversity, is the sum total of the genetically based variety of all organisms in the biosphere. Ecosystem diversity
Bio 112 Ecology: Final Practice Exam Multiple Choice
 Final Exam Topics: 1) Basic Ecological Principles a) Biomes, ecosystems, communities and populations i) Biomes: know the major ones and where they occur ii) Ecosystem: communities and physical environment
EVE 491/591 Toxicology. Pollutants and Their Fate 2/19/2018
 EVE 491/591 Toxicology Lecture #5 1. Fate of Environmental Pollutants 2. Case study Part IV Pollutants and Their Fate Fate: Once emitted, what does pollutant do? Nothing Adversely impact human health Adversely
Assessment of Mercury Contamination and Bioaccumulation in Sarasota Bay
 Assessment of Mercury Contamination and Bioaccumulation in Sarasota Bay EMECS 9 August 29 th 2011 Yongseok Hong 1,2, Erik Rifkin 2, Randall S. Wells 3,4 Peter Hull 4, Edward J. Bouwer 1 1 Geography and
12/4/2015. Chris Moore 12/7/2015.
 Chris Moore 12/7/2015 http://www.inorganicventures.com/element/sulfur 1 Today s Discussion Background Compartments Atmosphere Arctic Anthropogenic inputs Soil Freshwater/wetlands Ocean Mercury (Hg) Hydrargyrum
Ecosystems. Trophic relationships determine the routes of energy flow and chemical cycling in ecosystems.
 AP BIOLOGY ECOLOGY ACTIVITY #5 Ecosystems NAME DATE HOUR An ecosystem consists of all the organisms living in a community as well as all the abiotic factors with which they interact. The dynamics of an
Unit 2: Ecology. Chapters 2: Principles of Ecology
 Unit 2: Ecology Chapters 2: Principles of Ecology Ecology Probe: Answer the questions and turn it in! This is a standard aquarium with a population of fish. There is no filter in this aquarium and no one
Sources and Fates of Mercury and Methylmercury in Wisconsin Lakes
 Chapter/12 Sources and Fates of Mercury and Methylmercury in Wisconsin Lakes C. J. Watn~s, N. S. Bloom, R. J. M. Hudson, S. Gherini, R. Munson, S. A. Claas, K. A. Morrison, J. Hurley, J. G. Wtener, W.
ENVIRONMENTAL ISSUES EMISSIONS, POLLUTION CONTROL, ASSESSMENT AND MANAGEMENT
 ENVIRONMENTAL ISSUES EMISSIONS, POLLUTION CONTROL, ASSESSMENT AND MANAGEMENT Introduction Base Coal has a long and rich history of use in providing a source of light, transport, and electricity for industry
Chapter 34 Nature of Ecosystems. Copyright The McGraw-Hill Companies, Inc. Permission required for reproduction or display.
 Chapter 34 Nature of Ecosystems 1 Copyright The McGraw-Hill Companies, Inc. Permission required for reproduction or display. 34.1 The Biotic Components of Ecosystems Ecosystems Abiotic components include
THE GEO. In The Arctic Region
 THE GEO In The Arctic Region BIOMAGNIFICATION OF TOXINS Biomagnification is concentration of a substance that is toxic in the tissues of an organism at successfully high levels in the food chain Did you
Chapter 3 Ecosystem Ecology. Tuesday, September 19, 17
 Chapter 3 Ecosystem Ecology Reversing Deforestation in Haiti Answers the following: Why is deforestation in Haiti so common? What the negative impacts of deforestation? Name three actions intended counteract
Lecture 2, Part 1, Conceptual Site Models for Exposure Assessment
 Lecture 2, Part 1, Conceptual Site Models for Exposure Assessment Conrad (Dan) Volz, DrPH, MPH Assistant Professor, Environmental and Occupational Health, University of Pittsburgh, Graduate School of Public
Biodiversity Chapter 5 Jeopardy! Mrs. Rogic
 Biodiversity Chapter 5 Jeopardy! Mrs. Rogic List the three types of biodiversity! Which of the following habitats has the greatest richness? Species Habitat 1 Habitat 2 Habitat 3 Fox 20 0 0 Rabbit 100
2. 2. Nutrient Cycles in Ecosystems. Before You Read. How are nutrients cycled in the biosphere? How does the carbon cycle work?
 Nutrient Cycles in Ecosystems Textbook pages 68 91 Section 2. 2 Summary Before You Read Like other organisms, your body relies on nutrients to stay healthy. Based on your current understanding, create
Ecological Organization Intro to Enviro Expo Part 1
 Ecological Organization Intro to Enviro Expo Part 1 Key Concepts From way back in Biology: interactions within and among populations nutrient cycling with energy flow through ecosystems; the effects of
GEF BENEFITS INDEX FOR BIODIVERSITY (GBI BIO ) Background and Context
 Background and Context") Background and Context GEF BENEFITS INDEX FOR BIODIVERSITY (GBI BIO ) 1. The GEF Benefits Index for Biodiversity (GBI BIO ) provides a relative ranking of countries for meeting the biodiversity objectives
Background and Context GEF BENEFITS INDEX FOR BIODIVERSITY (GBI BIO ) 1. The GEF Benefits Index for Biodiversity (GBI BIO ) provides a relative ranking of countries for meeting the biodiversity objectives
Opinion on an Annex XV dossier proposing restrictions on mercury in measuring devices
 Committee for Risk Assessment (RAC) Opinion on an Annex XV dossier proposing restrictions on mercury in measuring devices ECHA/RAC/RES-O-0000001363-81-02/F Adopted 8 June 2011 Annankatu 18 P.O. Box 400
SY 2018/ st Final Term Revision. Student s Name: Grade: 10A/B. Subject: Biology
 SY 2018/2019 1 st Final Term Revision Student s Name: Grade: 10A/B Subject: Biology Modified True/False Indicate whether the statement is true or false. If false, change the identified word or phrase to
Outline of Risk Assessment Training and Experience (RATE): Basic Understanding and Application of Risk Assessments
: Basic Understanding and Application of Risk Assessments") Outline of Risk Assessment Training and Experience (RATE): Basic Understanding and Application of Risk Assessments Summary: Environmental risk Assessment 1 plays a unique role in serving the needs of various
Outline of Risk Assessment Training and Experience (RATE): Basic Understanding and Application of Risk Assessments Summary: Environmental risk Assessment 1 plays a unique role in serving the needs of various
MARINE POLLUTION DEGRADATION MITIGATION MANAGEMENT IS ESSENTIAL FOR IMPROVING MARINE ENVIRONMENT
 MARINE POLLUTION DEGRADATION MITIGATION MANAGEMENT IS ESSENTIAL FOR IMPROVING MARINE ENVIRONMENT The health of the world s oceans and marine life is degrading rapidly as a result of excess human activities.
2.1 Energy Flow in Ecosystems Student Notes
 2.1 Energy Flow in Ecosystems Student Notes General Information Biomass is Biomass is also sometimes used to measure the mass of organic materials that are used to produce biofuels such as biogas. Biomass
Characterization of Products Containing Mercury in Municipal Solid Waste in the United States, 1970 to 2000
 United States Solid Waste and OSW# EPA530-R-92-013 Environmental Protection Emergency Response NTIS# PB92-162 569 Agency (0s-305) April 1992 Characterization of Products Containing Mercury in Municipal
Class XII Chapter 14 Ecosystem Biology
 Question 1: Fill in the blanks. (a) Plants are called as because they fix carbon dioxide. (b) In an ecosystem dominated by trees, the pyramid (of numbers) is type. (c) In aquatic ecosystems, the limiting
Guide to the City of San Francisco s Reduced Risk Pesticide List Revised February 2013
 Guide to the City of San Francisco s Reduced Risk Pesticide List Revised February 2013 Introduction The City of San Francisco Department of the Environment s (SFE) Reduced-Risk Pesticide List is the result
Linda Cooper, Eno River State Park, Durham, NC
 Linda Cooper, Eno River State Park, Durham, NC 2 Rivers and Streams All 50 states, 2 interstate river commissions, American Samoa, Guam, Puerto Rico, the District of Columbia (collectively referred to