Thermal comfort in outdoor urban spaces: the hot arid climate
|
|
|
- Ethel Stevenson
- 5 years ago
- Views:
Transcription
1 Thermal comfort in outdoor urban spaces: the hot arid climate submitted by Faisal F. Aljawabra A thesis submitted for the degree of Doctor of Philosophy University of Bath Department of Architecture and Civil Engineering June 2014 COPYRIGHT Attention is drawn to the fact that copyright of this thesis rests with the author. A copy of this thesis has been supplied on condition that anyone who consults it is understood to recognise that its copyright rests with the author and that they must not copy it or use material from it except as permitted by law or with the consent of the author. This thesis may be made available for consultation within the University Library and may be photocopied or lent to other libraries for the purposes of consultation. Signature of Author..
2 To my family and friends. i
3 Acknowledgements All praise and thanks are for Allah, the One who, by His blessing and favour, good works are accomplished. The work in this thesis was funded by the Department of Architecture and Civil Engineering at the University of Bath. I would like to thank Prof. Marialena Nikolopoulou and Prof. Pete Walker for their outstanding supervision. Prof. Harvey Bryan, Prof. Jacques Giard and Dr. Akram Roshidat, the Herberger Institute Research Center at Arizona State University (ASU), and Mr. Moloud in Marrakech for their invitation and support. I also would like to express my deep appreciation to the laboratory, IT and the department/graduate office staff in ACE for helping in make it to the end. Mentions should be made to all postgraduates in ACE with whom I have shared an office and friendship. On a personal note, I would like dedicate this thesis to my parents, my wife, my brothers Feras and Fida, my sons Omar and Ali and my beloved daughter Lynne for their countless patience and support. ii
4 List of Awards and Publications Awards: Best paper award presented by the PLEA international Technical Committee at the 26 th Conference on Passive and Low Energy Architecture, Quebec City Canada. Journal articles: Aljawabra, F. & Nikolopoulou, M Influence of hot arid climate on the use of outdoor urban spaces and thermal comfort: Do cultural and social backgrounds matter? Intelligent Buildings International, 2(3), Conference papers: Aljawabra, F. & Nikolopoulou, M Outdoor thermal comfort in the hot arid climate: The effect of socio-economic background and cultural differences. PLEA th Conference on Passive and Low Energy Architecture, Canada. iii
5 Abstract The thermal environment in outdoor spaces can significantly influence users thermal perception and thus their use of these spaces. Improving microclimatic conditions in urban spaces will most likely encourage people to spend more time outdoors, with the potential to improve their health and wellbeing, as well as boosting social cohesion. As well as enhancing the environmental quality of cities it should also eventually improve the quality of life of its citizens. This thesis is one of the first attempts to investigate the outdoor thermal comfort and the effect of cultural differences in hot arid climates. Case studies were carefully selected in two different parts of the world (Marrakech in North Africa and Phoenix-Arizona in North America) to represent a variety of users in similar climatic context. Field surveys, carried out during winter and summer, included: structured interviews with a standard questionnaire; observations of the human activities; and microclimatic monitoring. The results revealed that the solely physiological approach is insufficient to assess the outdoor thermal comfort conditions in hot arid climates. Environmental variables such as air temperature and solar radiation, could have a great impact on the use of the outdoor spaces in the hot arid climate, and may determine the number of people and activities in them. The study also shows that participants who usually spend more time outdoors due to their life style, outdoors individuals, tend to stay longer in the studied sites compared with the indoors individuals who spend more time indoors. This is probably because the outdoor individuals have better experience of the outdoor conditions and respective thermal conditions. Experience has a strong link with expectations so that according to their past experience, people prepare themselves for the expected weather by taking adaptive measures. People from different cultures in the hot arid climate are likely to evaluate their thermal conditions differently, have diverse thermal comfort requirements, and use urban public spaces differently as well. Further work needs to be done to cover more geographical areas within the hot arid climate. Such an expansion may generalise the findings of this study or explain any particularity associated with the sites of the current study. More research is also needed to investigate he thermal requirements and use of outdoor spaces by different social groups by using robust classification methods. Emphasis should be on investigating the influence of thermal comfort on the use of outdoor public spaces by young and older people, and how that may affect their health and will being in such climates. iv
6 Contents Acknowledgements... i List of Awards and Publications... iii Abstract... iv Contents... v List of figures... ix List of tables... xiii 1 Introduction Introduction Background Statement of the problem Research questions Research Aims Research objectives Research scope and limitations Thesis structure Urban open space and comfort Introduction Urban open space Activities in urban open space Types of activity Activity and quality of outdoor space Qualities of a successful urban space Social places Lively and used by everyone Duration and time of use User needs Comfort and microclimate Comfort Heat balance model Adaptive approach Physical adaptation Psychological adaptation v
7 2.6 Environmental parameters affecting thermal comfort Air temperature Solar Radiation Wind Globe temperature Humidity Factors affecting site climate Topography Ground cover Water Densities and Building fabric Conclusions Outdoor thermal comfort Introduction Urban geometry and its influence on outdoor thermal comfort Outdoor thermal comfort and street design Effect of shading on thermal comfort The effect of vegetation Microclimatic conditions and the behaviour of people The human parameter Spatial behaviour Cultural and social factors Conclusions Research Methodology Introduction Justification of methodology selection Research design Physical measurements microclimatic variables and equipment Activity level and clothing insulation Human behaviour monitoring Research Ethics The questionnaire Observations The pilot study Study area Sites in Marrakech Sites in Phoenix Research procedures vi
8 4.7.1 Preparations before the field work Data collection and sorting Data analysis Chi-square Independent-sample t-test of difference The ordinal regression: The probit analysis Concluding remarks Descriptive analysis Introduction Description of sample profile Criteria of sample selection Description of the whole sample profile Sample profile of population interviewed in Marrakech Sample profile of population interviewed in Phoenix Discussion of sample profile Microclimatic summary for both cities Microclimatic profile Marrakech Microclimatic profile Phoenix Discussion of microclimatic profile Evaluation of thermal sensation Comparing the environmental variables in the two cities Comparing the subjective thermal evaluation in the two cities The relationship between the microclimatic parameters and (ASV) The correlation analysis: ASV model for Marrakech ASV model for Phoenix Conclusions Thermal sensation and the use of public spaces Introduction Evaluating the physiological approach Thermal neutrality and thermal sensitivity Preferred temperature Behavioural and psychological adaptation Clothing as a factors affect thermal evaluation outdoors Changing place as a factor affects thermal evaluation outdoors Drinking as a factor affecting thermal evaluation outdoors Expectations and Experience The use of space: attendance, time, and activities vii
9 6.6.1 Attendance and activity analysis Time of visiting analyses Time of stay analyses The influence of environmental parameters on the use of space Conclusions Conclusions Introduction Summary of the study Addressing research questions and objectives Summary of the findings of the study The physiological approach and the thermal comfort assessment The relative contributions of the environmental parameters Factors influencing thermal sensation in Marrakech and Phoenix Cross-cultural outdoor thermal comfort evaluation Cross-cultural outdoor thermal comfort requirements Cross-cultural use of outdoor public spaces Research contribution to knowledge Recommendations for future research References Appendix A: the questionnaire form Appendix B: the observation form Appendix C: observation in Marrakech Appendix D: observation in Phoenix viii
10 List of figures Figure 1.1 Abandoned public space in Marrakech... 5 Figure 2.1 Piazza del Campo in Siena, medieval public space (by Mike Alexander is licensed under CC BY-NC-ND 2.0) Figure 2.2 St. Peter s Square in the Vatican, Renaissance public space (by Tobias Abel is licensed under CC BY-ND 2.0) Figure 2.3 Waiting for a bus, an example of a necessary activity. (by Matt Stringberd is licensed under CC BY-NC Figure 2.4 Relaxing in a public park, an example of optional activity Figure 2.5 Playing in a public park, an example of a social activity Figure 2.6 CLO unites of various items of clothing (Clark and Edholm 1985) Figure 2.7 Cooling effect in traditional clothing in hot environments(clark and Edholm 1985) Figure 2.8 Wind behaviour around tall buildings (Nikolopoulou et al. 1999) Figure 2.9 Vegetation influence on wind movement (Clark and Edholm 1985) Figure 4.1 Diagram showing the structure of this research Figure 4.2 Flow of data collection Figure 4.3 The portable weather station Figure 4.4 Metabolic rates for different activities (Goulding et al. 1986) Figure 4.5 Thermal insulation values of different combinations of clothes (Goulding et al. 1986) Figure 4.6 Case study sites in Marrakech and Phoenix Figure 4.7 Satellite view of Al Koutoubia Park and Plaza in Marrakech (Google Earth 2010) Figure 4.8 part of Al Koutoubia Park (site 1) Figure 4.9 part of Al Koutoubia Plaza (site 2) Figure 4.10 Plan of Chaparral Park showing the borders of the study area in red Figure 4.11 part of Chaparral Park (site 3) Figure 4.12 Satellite view of Tempe Beach Park (Google Earth 2010) Figure 4.13 Tempe Beach Park (site 4) Figure 4.14 Satellite view of Tempe Beach Park (Google Earth 2010) Figure 4.15 Tempe Marketplace (site 5) Figure 4.16 Obtaining neutral temperature using probit analysis Figure 5.1 Age group profile of Marrakech survey sample Figure 5.2 Reasons for being in the location in Marrakech survey Figure 5.3 Activity of participants in Marrakech for the last ten minutes before the interview Figure 5.4 Educational attainment of Marrakech survey participants ix
11 Figure 5.5 Age group profile of Phoenix survey sample Figure 5.6 Reasons for being in the location in Phoenix survey Figure 5.7 Activity of participants in Phoenix for the last ten minutes before the interview Figure 5.8 Education of Phoenix survey participants Figure 5.9 Monthly air temperature in Marrakech (WMO 2011) Figure 5.10 Monthly air temperature in Phoenix (WMO 2011) Figure 5.11 Measured air temperature in Marrakech and Phoenix in winter and summer Figure 5.12 A daily profile of air temperature as a function of time in Marrakech Figure 5.13 A daily profile of solar radiation levels as a function of time in Marrakech survey Figure 5.14 A daily profile of relative humidity levels as a function of time in Marrakech survey Figure 5.15 A daily profile of air temperature as a function of time in Phoenix survey Figure 5.16 A daily profile of solar radiation levels as a function of time in Phoenix survey Figure 5.17 A daily profile of relative humidity levels as a function of time in Phoenix survey Figure 5.18 Percentage frequency distribution of actual thermal sensation votes (ASV) in Marrakech and Phoenix. (-2=cold, +2=hot) Figure 5.19 Percentage distribution of votes on the thermal preference scale in Marrakech and in Phoenix Figure 5.20 Percentage distribution of votes on the wind sensation scale in Marrakech and in Phoenix (1=calm, 5=very windy) Figure 5.21 Percentage distribution of votes on the wind preference scale in Marrakech and in Phoenix Figure 5.22 Percentage distribution of votes on the humidity sensation scale in Marrakech and in Phoenix (-2 =Damp, +2=Dry) Figure 6.1 Percentage frequency distribution of both actual and predicted thermal sensation votes Figure 6.2 Percentage frequency distribution for PMV and ASV in Cambridge (Nikolopoulou et al. 2001) Figure 6.3 Neutral temperatures calculated using linear model Figure 6.4 Probit regression model of thermal neutral temperature (Marrakech) Figure 6.5 Probit regression model of thermal neutral temperature (Phoenix) Figure 6.6 Percentage of participants coming from indoors/outdoors just before the interview Figure 6.7 Probit regression models for thermal preferred temperature Figure 6.8 Winter clothing in Marrakech Figure 6.9 Winter clothing in Phoenix (left photo by Mike Kelley is licensed under CC BY-NC-SA 2.0) x
12 Figure 6.10 Clothing insulation as a function of air temperature (Marrakech) Figure 6.11 Clothing insulation as a function of air temperature (Phoenix) Figure 6.12 Clothing insulation values of both groups in Marrakech and Phoenix Figure 6.13 Clothing insulation values of both groups in Marrakech and Phoenix in winter and summer Figure 6.14 The use of umbrellas as a way of adaptation during summer in Phoenix Figure 6.15 Total number of people in Marrakech sites compared to the number of people in shade as a function of air temperature in Marrakech in winter Figure 6.16 Total number of in Phoenix sites compared to the number of people in shade as a function of air temperature in winter Figure 6.17 Al Koutoubia Plaza in winter. Right: local people sitting in the shade. Left: tourists sitting in sunlight Figure 6.18 Al Koutoubia Park in winter, local people sitting in the shade and a tourist in the sunlight Figure 6.19 Total number of people in Marrakech sites compared to the number of people in shade as a function of air temperature in Marrakech in summer Figure 6.20 Total number of people in Phoenix sites compared to the number of people in shade as a function of air temperature in summer Figure 6.21 Percentage of participants who were drinking cold drinks in Marrakech and Phoenix in summer Figure 6.22 Mean time (in minutes) spent in place as function of weather expectation Figure 6.23 How did you expect the weather to be like? (winter) Figure 6.24 How did you expect the weather to be like? (summer) Figure 6.25 The relationship between attendance, time and activity in public urban spaces Figure 6.26 Mean number of people in sites in both cities Figure 6.27 Mean number of activities in sites in both cities Figure 6.28 Mean time was spent in sites in both cities Figure 6.29 Mean number of people in each site in Marrakech and Phoenix Figure 6.30 Mean number of activities that occurred in sites in both cities Figure 6.31 Mean time spent in each site in Marrakech and Phoenix Figure 6.32 Fishing as an individual activity in Chaparral Park in Phoenix Figure 6.33 Low attendance in Chaparral Park in Phoenix Figure 6.34 Motion activities in Phoenix public outdoor spaces Figure 6.35 A radar chart showing the percentage distribution of social activities versus other activities xi
13 Figure 6.36 A radar chart showing the percentage distribution of number of activities verses the number of groups in the space in the middle of the day Figure 6.37 A radar chart showing the percentage distribution of thermal discomfort Figure 6.38 High attendance in Tempe Beach Park Figure 6.39 Mean number of people in the morning, noon and evening (weekdays) Figure 6.40 Mean number of people in the morning, noon and evening (weekends) Figure 6.41 The mean air temperature in Marrakech and Phoenix in winter Figure 6.42 The mean air temperature in Marrakech and Phoenix in summer Figure 6.43 Number of groups of people as function of time (solar radiation) Figure 6.44 Mean time spent in place as function of weather expectation Figure 6.45 Mean time spent in place as function of the time usually spent indoors or outdoors Figure 6.46 Solar radiation (W/m²) as function of time spent in place Figure 6.47 The effect of solar radiation on attendance: A- overcast B-sunny Figure 6.48 A radar chart showing the percentage distribution of the reason for being in the outdoor space Figure 6.49 A visitor sitting sideways on a bench to avoid direct sunlight Al Koutoubia Plaza Figure 6.50 A group of ladies trying to avoid direct sunlight while sitting on a bench in Al Koutoubia Plaza xii
14 List of tables Table 2.1 Metabolic rates of different activities (ISO ) Table 4.1 Details of the meteorological sensors Table 4.2 Dates and times of filed surveys Table 4.3 The criteria of deciding the effect size of the Chi-square test Table 4.4 The criterion for deciding the effect size of the t-test i.e. Eta squared η² according tojaccard (1990) Table 5.1 Age distribution of participants Table 5.2 Means of measured microclimatic variables in Marrakech and Phoenix Table 5.3 Summary of mean climatic variables during survey period in Marrakech in winter (w) and summer (s) Table 5.4 Summary of mean climatic variables during survey period in Phoenix Table 5.5 The t-tests of environmental variables in Marrakech and Phoenix (a) in winter and (b) in summer Table 5.6 shows dependant (DV) and independent (IV) variables were used in Chi-square test Table 5.7 Results of Chi Square test between cultural groups and actual sensation vote (ASV) Table 5.8 Results of Chi Square test between cultural groups and wind sensation Table 5.9 Results of Chi Square test between cultural groups and humidity sensation Table 5.10 Correlation analysis between ASV and other environmental and personal parameters in Marrakech Table 5.11 Correlation analysis between ASV and other environmental and personal parameters in Phoenix Table 5.12 Logistic regression statistics and best fit model to predict ASV using environmental and personal data from Marrakech sites Table 5.13 Logistic regression statistics and best fit model to predict ASV using environmental and personal data from Phoenix sites Table 6.1 Mean thermal sensation vote for each three-degree increment of Tg (cultural groups). 112 Table 6.2 Last time the participants were in an air-conditioned space Table 6.3 Neutral and Preferred temperature for both cites, Marrakech and Phoenix Table 6.4 Neutral temperatures for both Marrakech and Phoenix groups in winter and summer Table 6.5 Comparing data with and with out participants in Tempe Marketplace (TMP) xiii
15 Chapter 1 Introduction 1 Introduction Although we spend most of our time indoors, we are really outdoor animals. (Baker 2004) 1.1 Introduction This chapter introduces the subject of outdoor thermal comfort in hot arid climates. In addition to giving a brief background on the topic, it states the research problem, gaps, and articulates the research questions. In addition, this chapter defines the research aims and objectives, outlines the limitations of the study, and gives the thesis structure. 1.2 Background Throughout history, urban open spaces have been linked with people and activities, serving as a meeting space, marketplace, and connection space (Gehl and Gemzøe 2001). People of all ages participated in city life where streets and the squares were festive, sociable and jovial. These patterns were extended to the early years of the twentieth century. As the twentieth century evolved, the number of urban inhabitants rose and the use of motor cars increased. The modern movement, from mid 1920s and after, led to a radical segregation between transport, work, residents and recreation and, therefore, downgraded the importance of public spaces and changed them to be become unpleasant and undesirable. However, in the second half of the twentieth century, the concept of public space and public life emerged again and became the topic of many books, such as The life and death of great American cities by Jane Jacobs (1961). Although shopping was the main reason for people to be in public spaces, changes were taking place. Street vending and performing were back with outdoor cafés becoming popular. Pedestrian streets were introduced and old parks and squares were renewed. Recently, open urban spaces have started accommodating recreational, cultural, and sport activities. Urban spaces are used for longer hours including evenings and weekends. Attracting visitors and hosting activities are essential for the success of such outdoor spaces. Many factors in the open urban space contribute towards this success. Open urban spaces, therefore, should provide visitors with essential qualities, such as: enjoyment; opportunities for passive and active engagements, and comfort. 1
16 Chapter 1 Introduction Outdoor public spaces play a significant role in improving public health and wellbeing of people and reduce government expenditure. A recent study by Roberst-Hughes (2013) examined the relationship between the quality of public spaces and human health and wellbeing in England. The study claimed that if 75% of people across the country did meet the recommended exercise level such as walking for 20 minutes five days a week, one in eleven early deaths could be avoided and 900 million could be saved every year. Moreover, outdoor public spaces are considered to be a key aspect in improving the health and wellbeing of young people by facilitating physical activities. In a multidisciplinary study, Mahdjoubi (2007) and his team explored the effect of the design of outdoor public spaces on the decline of young people s physical activities. The study revealed that social and physical environments are two critical areas to offer better opportunities for young people to engage in outdoor physical activities. Furthermore, outdoor public spaces play a substantial part in enhancing the health and wellbeing of older people. As part of the research project I DGO (Inclusive Design for Getting Outdoors) Sugiyama and Ward Thompson (2007) aimed to comprehend the link between health, outdoor activity and the quality of environments. They concluded that the local environment may influence the health of older people in two ways. The first one is by providing opportunities to be active i.e. physical activity. The second way is through providing suitable places where people can meet outdoors i.e. social activity. The study suggested that both the quality and quantity of outdoor activities contribute to the wellbeing of older people. According to UN State of the World Population 2007 report (UNFPA 2007), the majority of the global population are living in urban areas for the first time in history. Since the number of inhabitants in urban areas increases, the physical environment of cities and human activities are expanding and affecting the environmental quality and causing increase in ambient temperatures and pollution. Therefore, the demand is greater than before for adequate outdoor public spaces that meet the social, cultural and comfort needs of people. Fulfilling this demand will encourage people to stay longer outdoors socialising, exercising and enjoying nature, hence improving their health and wellbeing. In order to achieve better outdoor spaces, people needs must be fulfilled. Carr (1992) considers comfort as one of the user needs that should exist in order for open space to be well used. Other needs can hardly be met without the existence of comfort. Whyte (1980) found that "the most popular plazas tend to have more seating than the less well-used ones". Other attractive elements of open space cannot make people come and sit if there 2
17 Chapter 1 Introduction is no place to sit. "Sitting should be physically comfortable. It is more important, however, that it be socially comfortable." This means that users should be able to choose their seating area whether in the sun or in the shade when they are in groups or alone. Bosselmann et al. (1983) considered access to the sun or having shelter from it is an important factor in the use of open space, whilegehl (1996) linked the level of activities in an urban open space with the microclimate of this space. The thermal environment in public spaces can significantly influence users thermal perception and thus their use of the space. Thus, aiming at improving microclimatic conditions in urban spaces and enhancing the thermal comfort will most likely encourage people to spend more time outdoors, with the potential to boost the social cohesion of a space and increase economic activity. This should improve the environmental quality of cities in which people live and work and should eventually improve their quality of life. Research related to thermal comfort in urban spaces can be characterised into two aspects: 1- Studying the impact of urban geometry on the environmental parameters and hence outdoor thermal comfort. 2- Studying the effect of microclimatic conditions on thermal comfort and the behaviour of people in urban open spaces through field surveys. The first aspect, the impact of the physical environment on thermal comfort in hot climates, has been the focus of many urban climatology studies (Ali-Toudert et al. 2005; Dalman et al. 2011; Krüger et al. 2010; Shashua-Bar et al. 2004; Pearlmutter et al. 2007). The main themes investigated in literature include the influence of street canyon geometry on pedestrian thermal comfort (Pearlmutter et al. 1999; Ali-Toudert and Mayer 2006), the influence of shading and trees on the microclimate (Shashua-Bar et al. 2011; Hwang et al. 2010). Simulations, measurements, and physical open air scale models have been used as methods of investigation. Simulations or numerical modelling has been described as a perfectly suited methodology to deal with the complexities and nonlinearities of urban climate studies (Arnfield 2003). In the second aspect, local microclimates influence the thermal sensation of people in urban open spaces and accordingly they affect behavioural aspects, such as attendance and activities (Zacharias et al. 2004; Dessi 2002; Zacharias et al. 2001; Nikolopoulou et al. 2001). Field surveys have been used to study the behavioural aspects of people, in relation to their thermal environment outdoors (Makaremi et al. 2012; Ng and Cheng 2012; Xi et al. 2012). Other studies have examined thermal adaptation of users, including the 3
18 Chapter 1 Introduction physical and psychological adaptation (Nikolopoulou et al. 2001; Thorsson et al. 2004b; Lin et al. 2011). In recent years, there has been an increasing interest in the association between culture and climatic characteristics that influence the thermal comfort and the use of outdoor spaces (Knez and Thorsson 2006; Thorsson et al. 2007). Field surveys in outdoor thermal comfort studies are often carried out by measuring relevant microclimatic variables or objective data. These data include air temperature, wind speed, relative humidity and solar radiation, from which thermal indices can be calculated. In addition, subjective data, such as thermal evaluation and preference, are collected from participants on site by structured interviews and questionnaires. Attendance and the activities are usually monitored by observations. However, very few studies in this category have been carried out in hot climate areas and in particularly hot arid climates. 1.3 Statement of the problem Despite the increasing interest in outdoor thermal comfort studies, little attention has been paid to the hot arid climate. Most studies in the hot arid climate have followed the urban climatology approach that was referred to in the previous section. In such research, the focal point of the research is on the interaction between the environmental elements and the physical settings of the space, with little consideration given to the human factor. The thermal effect on users was studied using standard thermal indexes. Thus, in the majority of cases, the adaptive actions as well as the influence of cultural and social variations on the perceptions of the thermal environment were given little attention. A clear understanding of such factors should provide designers with valuable information about the people who will be using the open public space. On the other hand, failed open public spaces can be a result of the lack of understanding of the adaptive opportunities a public space can offer to visitors (Figure 1.1). In addition, unsuccessful spaces might be a result of neglecting cultural and social aspects when designing outdoor public spaces. 4

19 Chapter 1 Introduction Figure 1.1 Abandoned public space in Marrakech 1.4 Research questions After stating the research problems and the gaps in the area of outdoor thermal comfort, the following questions were carefully articulated to draw the research outlines: 1. Can the outdoor thermal comfort in hot arid climates be assessed by physiological approach (i.e. the heat-balance indices alone)? 2. How do people from different cultures in the hot arid climate evaluate their actual thermal conditions? 3. What is the relative contribution of the environmental parameters to thermal perceptions of the users of urban public spaces in hot arid climates? 4. Are there any differences in the thermal comfort requirements and use of outdoor space between different cultures groups in the hot arid climate? 1.5 Research Aims The aim of this research is to extend the understanding of outdoor thermal comfort to the hot arid climates. More comprehension of the complex relationship between outdoor thermal environments and the thermal sensation of users from different backgrounds can help in making better public spaces. Public spaces with improved microclimatic conditions 5
20 Chapter 1 Introduction are hoped to encourage people to spend more time outdoors, with the potential to boost the social cohesion of a space and increase economic activity. This should refine the environmental quality of cities in which people live and work and should eventually improve their quality of life. 1.6 Research objectives To achieve the aim of this study, the following set of objectives has been developed: 1. To evaluate the physiological approach in a hot arid climate by comparing actual thermal sensation votes with predicted sensation votes which are obtained from a heat-balance model. 2. To investigate the relationship between the environmental parameters and the actual sensation vote (ASV) in different cultures, by using Chi-square (χ²) test of independence, and study the impact of this relationship on the use of the outdoor spaces. 3. To examine factors that affect thermal adaptation between cultures by studying the behaviour of people in public spaces of Phoenix and Marrakech. 4. To measure and compare neutral temperatures and preferred temperatures of the cultural groups, using the mean thermal sensation vote responses. 1.7 Research scope and limitations This study focuses on the human thermal comfort and the use of open public spaces in hot arid climates. The studied sites are located in Marrakech (Morocco) and the greater area of Phoenix, Arizona (USA). Only those who were sitting or standing in the studied spaces were considered in interviews since, according togehl (1996), these are the optional activities, as opposed to the necessary activities, that have a close relation with the quality of urban open spaces. Moreover, only local individuals were considered in interviews; tourists and temporary visitors were excluded from analysis to ensure that the sample represents the local culture of the studied area. In addition, the study does not focus on a specific age group or gender. The current investigation was limited by the number of interviews (431). A larger number would give better statistical significance to some of the results such as the relationship between expectations and the time spent by participants in the outdoor space. Another limitation of this study is that the number of female participants in the interviews was less than the number of males. However, as mentioned above, the influence of gender was not in the scope of this research. One of 6
21 Chapter 1 Introduction the selected sites in Phoenix, Tempe Market Place, is different in its features from the rest of the sites in terms of the physical nature of the space and its use. 1.8 Thesis structure This thesis has two parts: Part I: Background and theoretical study; and Part II: Experimental work. Part I includes the introduction of this study and the research conducted on the literature. Part II comprises the methodology, the findings and their discussion, and the conclusions and recommendations. The chapters are organised as follows: Part I: Background study Chapter 1 introduces the subject of outdoor thermal comfort in hot arid climates. It states the research problem, gaps, research questions, aim and objectives. The chapter also outlines the limitations of the study, and gives the thesis structure. Chapter 2 is a literature review chapter that defines urban open spaces and the influence of comfort on their users. It also summarises types of activity that occur in open spaces and how these develop when the space has the right qualities. The final section is shedding light on the thermal aspects of human comfort and its influence on users experience of urban outdoor spaces. Chapter 3 is a literature review chapter that gives a review of key studies dealing with the influence of the physical environment on thermal comfort in hot climates. It also covers main studies dedicated to the behavioural aspects of outdoor thermal comfort in other climates. Part II: Experimental work Chapter 4 explains the methodology used in this research which is based on field surveys. Field surveys enable the study of subjects in their "real world settings with the purpose of including the full complexity of conditions that subjects may experience, whereas other approaches, such as the analytical or the heat-balance, depend on laboratory or climate chamber conditions for their experiments. This chapter gives a justification for the methodology selection, the framework upon which the research was designed. In addition to that, this chapter explains how the physical data were measured and how human behaviour and activities were monitored. Locations where field surveys took place and procedures of investigations are also described. 7
22 Chapter 1 Introduction Chapter 5 is part of the results obtained from the field surveys. It contains a description of the population interviewed and the microclimatic profile of the study areas. Two cultural groups were selected from two different countries in the hot arid climate zone. The results presented in this chapter also help in understanding how the two cultural groups evaluate their actual thermal conditions. The chapter also presents the relative contribution of heatbalance parameters to thermal perception by subjects in an outdoor space in a hot arid climate. Chapter 6 presents and discusses the findings of this research, how people from different cultures, who live in similar climatic conditions, evaluate their thermal environment. For this reason, two groups, representing two different cultures living in regions with a prevailing hot arid climate were selected in Marrakech and in Phoenix, as described in Chapter 5. The results presented in this chapter help in understanding the following: 1. Whether the thermal preferences of subjects in hot arid climates can be explained by heat-balance indices alone; 2. comparing the thermal comfort requirements in the hot-arid climate of Marrakech and Phoenix including clothing, neutral temperatures, and preferred temperatures Finally, chapter 7 is devoted to bringing together the major themes covered by the thesis to make conclusions and recommend further improvements for future work. 8
23 Chapter 2 Urban open space and comfort 2 Urban open space and comfort First life, then spaces, then buildings the other way around never works. (Gehl 1996) 2.1 Introduction This is a literature review chapter that defines urban open spaces and the influence of comfort on their users. It also summarises types of activity that occur in open spaces and how these develop when the space has the right qualities. The final section is shedding light on the thermal aspects of human comfort and its influence on their experience of urban outdoor spaces. 2.2 Urban open space Urban open spaces, city spaces, or outdoor public spaces are defined as publicly accessible outdoor areas within cities such as parks, plazas, streets, community gardens, and greenways (Lynch 1972), (Carr 1992). The existence of good urban public spaces is important to cities because they play a critical role in communities, define the identity of cities, benefit them economically and environmentally, and provide a room for cultural activities (Madden and Schwartz 2000). Urban open spaces, therefore, should inspire people to visit, and activities to take place. Throughout history, urban open spaces have been linked with people and activities. Three crucial functions have been offered by such spaces: meeting place, marketplace, and connection space (Gehl and Gemzøe 2001). Therefore, social interaction occurred in city spaces, goods and services exchanged in it, and streets offered connections between all the functions of the city. This arrangement can be seen all the way through Greek and Roman cities when they first built streets for better and safer movement and agoras and forums for public life. Medieval, renaissance, baroque cities, and through the age of enlightenment to the industrial age all carried the same pattern of meeting place, market place and connection space (Figures 2.1 and 2.2). According to Gehl (2007) the patterns that consists of the three functions i.e. meeting place, market place and connection space extended to the very beginning of the twentieth century. People of all ages took part in the city life in streets and squares involving in activities that was essential to their living. In the progression of the twentieth century the function of urban open spaces was influenced by the improvement of the economic conditions of cities. This improvement led to changes in lifestyles hence rise in the number of urban inhabitants and the wide 9
24 Chapter 2 Urban open space and comfort extension of motor cars use. The CIAM Athens charter of city planning (1933) that considered the analysis of 34 cities at that time, promoted rules that led to a radical segregation between transport, work, residents and recreation. The application of Athens charter had downgraded the importance of traditional public space and changed the traditional public spaces so it looked unpleasant and undesirable. The next milestone in the history of public space took place in 1960 s. The concept of public space public life started at that time and was marked by the work of Jacobs (1961) The Death and Life of Great American Cities. Public spaces and public life were the topic of studies and books i.e. The city in history (Mumford 1961) and The making of urban America (Reps 1965). Pedestrian streets were introduced at that time by closing streets to traffic and old parks and public squares renewed. Towards the end of 1960 s through the 1970 s street vending and performing are back too with outdoor cafés become popular. At that time until 1980 s shopping was the main reason for people to be in the city. In recent decades, the city becomes a goal in itself (Gehl 2007). Urban spaces host recreational and cultural activities such as parades, exhibitions and sport activities. When weather permits, activities extended to include evening hours so people start using city spaces for longer hours, seven days a week. The most important function of the urban open space is enabling meeting between people (Gehl 2007). 10


25 Chapter 2 Urban open space and comfort Figure 2.1 Piazza del Campo in Siena, medieval public space (by Mike Alexander is licensed under CC BY-NC-ND 2.0) Figure 2.2 St. Peter s Square in the Vatican, Renaissance public space (by Tobias Abel is licensed under CC BY-ND 2.0) 11

26 Chapter 2 Urban open space and comfort 2.3 Activities in urban open space Types of activity Gehl (1996), in his famous book Life Between Buildings, divides outdoor activities into three categories: necessary, optional, and social activities. The necessary or functional activities, usually associated with walking, take place around the year under all circumstances where the participant has fewer choices such as waiting a bus (Figure 2.3). The optional or recreational activities, more related to sitting, usually happen when place and time are suitable for it to happen. A good example of an optional activity is walking for fresh air or sitting under the sun in winter (Figure 2.4). The social or resultant activities, which cover all communal activities, depend on the presence of others in the open space. Social activities occur when people meet each other in a certain place, such activities are the bottom line of the quality and length of other types of activity as Gehl (1996) has stated. Greeting, chatting between people, children playing together are examples for social activities (Figure 2.5). Figure 2.3 Waiting for a bus, an example of a necessary activity. (by Matt Stringberd is licensed under CC BY-NC

27 Chapter 2 Urban open space and comfort Figure 2.4 Relaxing in a public park, an example of optional activity Figure 2.5 Playing in a public park, an example of a social activity 13
28 Chapter 2 Urban open space and comfort Activity and quality of outdoor space There is a close relationship between the quality of the outdoor space and the outdoor activities that occur in it, in particular, optional and social activities. These will have more chance to develop when the quality of the open space is improved. The better the physical framework is the more activities grow. This development can occur by number of participants, duration, and scope. Gehl (1996) emphasised that it is not the number of people or events that indicate the success of urban open space rather than the number of minutes spent outdoors. For this reason, more people and longer stay results in high level of activities. Gehl (1996) linked the level of activities in an urban open space with the microclimate of this space. He pointed out that optional and social activities, defined above, take place only when the external conditions are good enough for stopping and strolling. Other qualities that inspire activities and motivate the use of urban open spaces is reviewed in the next section. 2.4 Qualities of a successful urban space Social places Several research projects have aimed to discover qualities that make a successful urban space. Whyte (1980) and The Street Life project used time-lapse cameras to record daily patterns in plazas. They found that the high numbers of people in groups and/or couples are an indicator of best-uses plazas and it is an index for selectivity, as they decide to go there by their own choice. The author gave an example that in best used plazas in New York, the proportion of people in groups was about 45%; hence best-used plazas are sociable places. Madden and Schwartz (2000) supported Whyte (1980) observation that the high number of groups is a sign of good use of urban space Lively and used by everyone Madden and Schwartz (2000) and Whyte (1980) also indicated that a higher than average proportion of women, people from different age groups, and variation in activities are signs of a healthy place. Therefore, it is becoming increasingly understood that good urban open space is the lively one and well-used by people (Francis 2003) Duration and time of use Time spent at a location and who is using it are other signs of success. Tibbalds (2012) suggested that such places should consist of a rich, vibrant, mixed-use environment that does not die at night or at weekends and is visually stimulating and attractive to residents and visitors alike. Gehl (1996) emphasised that it is not the number of people or events 14
29 Chapter 2 Urban open space and comfort that indicate the success of urban open space rather it is the number of minutes spent outdoors. Therefore, more people and longer stays results in high levels of activity User needs Carr (1992) assumed that a good urban open space should comply with user needs which identified as those amenities and experiences that people seek in enjoying public open spaces. Comfort, relaxation, passive engagement (enjoying the scene in open space without participating actively), active engagement (with physical participation) and discovery, are considered as major user need in urban open spaces as a result of reviewing literature by Carr (1992) who adds enjoyment as a sixth need Comfort and microclimate Carr (1992) considers comfort as one of the user needs that should exist in open space to be well used. Other needs can hardly be met without the existence of comfort. Whyte (1980) found that "the most popular plazas tend to have more seating than the less wellused ones". Other attractive elements of open space cannot make people come and sit if there is no place to sit. "Sitting should be physically comfortable. It is more important, however, that it be socially comfortable". This means users should be able to choose their seating area whether in the sun or in the shade when they are in groups or alone. Bosselmann et al. (1983) considered access to the sun or having shelter from it is an important factor in the use of open space, while Gehl (1996) linked the level of activities in an urban open space with the microclimate of this space. He pointed out that optional and social activities, defined above, take place only when the external conditions are good enough for stopping and strolling. Therefore, and within the scope of this thesis, the next section is shedding light on the thermal aspect of human comfort and its influence on their experience of urban outdoor space. 2.5 Comfort Comfort defined as the state of mind that expresses satisfaction with the surrounding environment (ASHRAE 2004). Therefore, the term comfort might be used to describe a feeling of satisfaction, a sense of relaxation, or a state of physical and mental well-being (Giridharan et al. 2008). Some theories has dealt with the physical aspect and of thermal comfort such as the heat balance model, others dealt with psychological aspect such as the adaptive approach. 15
30 Chapter 2 Urban open space and comfort Heat balance model The conventional thermal comfort theory is based on the balance between the human body and its environment so that the internal body temperature is kept closely around 37 C. The balance is maintained by a continuous exchange of heat the human body and its surroundings. The exchange may occur by conduction, convection, radiation and evaporation and these physical processes are influenced by environmental components such as air temperature, wind speed, humidity and solar radiation and personal factors, that can be controlled by individuals, such as activity and clothing (Park et al. 2012). ASHRAE Standard 55 (2004) and ISO7730 (2005) are based on a heat balanced model of the human body and are derived from extensive climate-chamber experiments in midlatitude climate regions. They are often considered to be universally applicable as a model for comfort, however they do not work as well for buildings that are naturally ventilated, or in environments that provide the opportunity for individual localised control. Neither are they fully applicable to outdoor spaces. Fanger (1970) developed the Predictive Mean Vote (PMV) which is a steady-state model that represents the heat balance between heat production and heat dissipation by the human body. The PMV is expressed by a thermal comfort equation uses air temperature, humidity; mean radiant temperature, relative air velocity, activity level and clothing insulation value. The PMV model has been used frequently to underline the effect of adaptation in outdoor settings. However, it is important to highlight that the PMV model was intended for indoor, fully conditioned buildings. According to the steady-state heatbalance theory, the human body is a passive recipient of thermal stimuli (Brager and de Dear 1998) and the PMV does not take adaptation opportunities into account. More recently, studies have been conducted to widen the applicability of the original PMV (Van Hoof 2008). For example, Fanger and Toftum (2002) introduced an extension to the PMV by proposing an expectancy factor e to explain the overestimation of thermal sensation in non-air-conditioned boiling in warm climates. Yao et al. (2009) have considered factors such as culture, climate, and social psychological and behavioural adaptations in developing the PMV model. In the outdoor settings, the PMV was compared with the actual thermal sensation vote of the visitors of urban public spaces in temperate climates, the results indicated that a purely physiological approach, which is based on heat balanced models such as PMV, cannot adequately characterise thermal comfort conditions (Nikolopoulou et al. 2001) and other socio-cultural and psychological parameters become increasingly important (Knez 16
31 Chapter 2 Urban open space and comfort and Thorsson 2006; Thorsson et al. 2004a). The PMV, however, is not yet appropriate for use outdoors. The Physiological Equivalent Temperature (PET)(Mayer and Höppe 1987) is another thermal index that gives the thermal assessment of a given environment. PET is based on the Munich Energy-balance Model for Individuals (MEMI) 1 (Höppe 1984) is defined as the air temperature at which, in a typical indoor setting (without wind and solar radiation), the heat budget of the human body is balanced with the same core and skin temperature as under the complex outdoor conditions to be assessed. On hot summer days, for example, with direct solar irradiation the PET value may be more than 20 K higher than the air temperature, on a windy day in winter up to 15 K lower Adaptive approach The adaptive approach to thermal comfort suggests that people can take actions to ease their comfort conditions by increasing or decreasing their activity levels and clothing or by interacting with the built environment (Sugawara et al. 2008). This led to the idea of adaptive opportunity, which indicates the level to which people can thermally adapt to their surrounding space. When the adaptive opportunity is inadequate, leaving thermal neutrality leads to discomfort sensation (Baker and Standeven 1996). Field surveys in the adaptive context enable the study of subjects in their "real world settings, with the purpose of including the full complexity of conditions that subjects may experience, whereas other approaches, such as the heat-balance, depend on laboratory or climate chamber conditions for their experiments. There is much interest in the adaptive approach in studies of thermal comfort for two reasons according to Nicol (2008). Firstly, there are doubts as to whether it is possible to transform results obtained under laboratory research settings to represent the complex conditions of the real world settings. Secondly, filed studies such as Brager and de Dear (1998) and Nikolopoulou et al. (2001) show that people adapt to their own climates and tend to tolerate much more variation of thermal conditions than those predicted by laboratory-based thermal models. Field survey is even more central in thermal comfort research in outdoor settings. Outdoor environmental conditions are even more complex than in side buildings. Moreover, people in outdoor spaces have less control over the surrounding environments compared with 1 MEMI: Munich Energy-balance Model for Individuals is an energy-balance model that takes into account the body heat regulation processes such as constrictions, dilation of peripheral blood vessels and sea rate. 17
32 Chapter 2 Urban open space and comfort some indoor spaces. Hence, adaptation is likely to be the only option for people to cope with the outdoor thermal conditions. An individual may adjust his temperature range by 6 C (McIntyre 1980) This involves wearing or taking off clothes or reducing the metabolic heat by 10% with the consumption of cold drinks (Baker and Standeven 1996) or changing positions Adaptive models are generally linear regression models that relate indoor design temperatures or acceptable temperature ranges to outdoor meteorological or climatological parameters (Brager and de Dear 1998). Therefore, thermal neutrality is an important term when talking about the adaptation approach. Thermal neutrality is defined as the temperature which gives a neutral thermal sensation, neither warm nor cool, in the environment (Humphreys 1975) or the thermal index value (temperature) corresponding with a maximum number of building occupants voting neutral on a thermal sensation scale (Brager 1998). Nikolopoulou et al. (1999) defined three types of adaptation: physiological, physical, and psychological. The physiological adaptation is not of fundamental importance in this context because it is caused by exposure to a stimulus, leading to a gradually declining strain from such exposure (Clark and Edholm 1985) Physical adaptation Physical adaptation is one of the three types of thermal adaptation defined by Nikolopoulou et al. (1999) and refers to the physical adjustments that a person makes to alter him/herself or to change the environment to meet his/her needs. Therefore, physical adaptation has two types: reactive and interactive. The reactive adaptation, or personal adaptation, includes subjective changes such as altering one s clothing level, or changing position or activity. The reactive adapation types will be further explained in the following sections. The interactive adaptation includes actions made by individuals to the environment to improve their thermal conditions, such as closing a blind or opening a window. This type of physical adaptation is limited in open spaces due to the nature of outdoors spaces (Nikolopoulou 2011b). i. Activity: Activity level influences energy production in human body and can considerably affect the comfort level. Activity level is expressed by mets: each met is the metabolic rate of a seated relaxed adult and equals 58 W/m 2 (Clark and Edholm 1985). Different types of activities with the relevant metabolic rates are shown in Table 2.1. Some activities such as hard physical work or sport may produce conditions that cause thermal discomfort. For example, an outdoor thermal condition that is comfortable for activity such as walking can 18
33 Chapter 2 Urban open space and comfort be uncomfortable for running. This is due to the surplus of energy added to the energy budget of the body. Therefore, one may take action such as removing some clothing. Another option is providing appropriate design for running paths which allows suitable thermal conditions for running. 19
34 Chapter 2 Urban open space and comfort Table 2.1 Metabolic rates of different activities (ISO ) Activity W/m 2 Met Reclining Seated, relaxed Sedentary activity (Office, dwelling school, laboratory) Standing, light activity (shopping, laboratory, light industry) Standing, medium activity (shop assistant, domestic work, machine work) Walk on level: 2 km/h km/h km/h km/h ii. Clothing: Clothing influences human thermal sensation by offering thermal insulation that is suitable to one s environment. It is expressed by m 2 K/W or in CLO units which equals m 2 K/W. In hot climates, clothes protect the body from solar radiation. However, it might stop the body from releasing surplus body heat. In hot climates, it is important for clothing to allow the cooling effect of air movement. For example, a western outfit has a thermal insulation value of 0.3 CLO while a North African traditional loose dress in bright colours CLO value of up to 0.5 (Clark and Edholm 1985). Figure 2.6 shows CLO value of various items. The traditional clothing in hot arid zones helps the cooling effect of air movement (Figure 2.7). Long open dresses boost ventilation between the body and the dress because of air movement from the bottom upward (Zrudlo 1988). 20
35 Chapter 6 Thermal sensation and the use of urban public spaces Figure 2.6 CLO unites of various items of clothing (Clark and Edholm 1985)
36 Chapter 2 Urban open space and comfort Figure 2.7 Cooling effect in traditional clothing in hot environments(clark and Edholm 1985) Psychological adaptation The response of people to a physical stimulus, in a certain situation, depends on the information that people have for this situation rather than on the magnitude of the stimulus. Therefore, thermal perception of a space is influenced by psychological factors (Nikolopoulou and Steemers 2003). The following factors affect psychological adaptation. i. Naturalness People tend to have more tolerance to non-artificial changes occur in their physical environments (Griffiths et al. 1987). In outdoor spaces as opposed to buildings interiors, most of changes to the physical environment take place naturally. Therefore, Nikolopoulou and Lykoudis (2006) found that people in outdoor spaces tolerate a wide range of air temperatures the changes For example, in the comfort levels are very high for a wide range of air temperatures across Europe, where all environmental changes occurs naturally. ii. Expectations and Experience People s perceptions are prominently influenced by what the environment should be like, rather than what it truly is like Nikolopoulou and Lykoudis (2006). Expectations and experience explain the difference in comfort temperature between the transitional season i.e. autumn and spring. The first one is preceded by warmer temperatures therefore 22
37 Chapter 2 Urban open space and comfort people tend to be less tolerant to cold, hence the temperature in which people feel comfortable is higher than that in spring (Zrudlo 1988). iii. Time of exposure Thermal perception of people in external spaces influences the period of their stay out i.e. how long they intend to spend in the area (Nikolopoulou and Steemers 2003). This issue is of particular importance when talking about the level of activity in outdoor public spaces because level of activity can be stimulated by both high numbers of people and by longer individual stays (Gehl 1996). People are able to tolerate thermal discomfort if they anticipate that their exposure to it will be brief. iv. Perceived control Perceived control as opposed to actual control advises available choice. It is a state of being in control over a source of discomfort and according to Evans (1984) this increases tolerance and reduces people s annoyance. Therefore, when an outdoor space offers seats in the shade and others in the sun, people are expected to stay longer than if only one option was available, regardless of whether they use the other option or not. Since actual control over thermal discomfort source is limited in outdoor spaces, perceived control is important in such places (Nikolopoulou and Steemers 2003). v. Environmental stimulation Environmental stimulation is one of the main reasons why people spend time outdoors, breaking the boredom and seeking satisfaction. When outdoor spaces offer various types of environmental stimulations, people tend to have higher tolerance to weather conditions in them. This leads to more people visiting the outdoor space and more time being spent in it. The reason is that neutrality does not necessarily lead to satisfactory; however, environmental stimulations such as sun or fresh air after being in the office for a long time on a warm day do (Nikolopoulou 2011b). 2.6 Environmental parameters affecting thermal comfort The prevailing climatic environment of a hot arid region is the product of the interaction of several meteorological components of climate, such as air temperature, solar radiation, wind, and humidity Air temperature The body exchanges heat with the surrounding air which occurs by convection. Thus, when the air temperature of a room increases, occupants become warmer and when it 23
38 Chapter 2 Urban open space and comfort decreases, they become cooler. However, in the outdoors, a particular air temperature such as 21 C could be perceived as uncomfortably cool (in a windy and shaded place) or uncomfortably warm (with no wind in sunshine and a humid place). It might be also perceived as comfortable. Thus, air temperature alone is not a sufficient indicator of human thermal comfort outdoors. Although air temperature strongly influences outdoor thermal comfort, the design of outdoor spaces has very little impact on mitigating air temperature (Yang et al. 2011). Yet a few strategies have been learnt and used in practice to increase or decrease air temperature. To increase air temperature, designers may maximise solar exposure by creating sun traps facing south and using dark materials. Minimising the flow of cold wind by providing windbreaks is another method. To decrease air temperature, vegetation can provide both shade and evaporative cooling which can also be obtained from water features Solar Radiation When solar radiation arrives from the sun at the surface of any object, it will be reflected, absorbed and/or transmitted through the object. Hence, an object in outdoor space is subject to direct solar radiation from the sun, diffused radiation from the sky, and reflected radiation from the environment. Designers of outdoor space aim at allowing maximum access to solar radiation when heating is required and provide protection from undesirable solar radiation when cooling is required. Solar radiation is an environmental component that can be modified. Some techniques are available to modify solar radiation towards acceptable thermal conditions. For example, providing deciduous trees gives shade in summer and allows solar radiation access in winter. Moreover, suitable location and orientation to outdoor spaces provides suitable shading and solar access throughout the year Wind Wind, as an environmental factor, is one of the key differences between outdoors and indoors. Wind influences the use of outdoor spaces directly by its mechanic force or indirectly by manipulating thermal conditions. Buildings can modify wind and increase or decrease its mechanical effect. For example, high buildings can change strong wind flow at the top and divert it to the ground level. This accelerating wind flow in front of the building and around its corners may take different shapes as shown in Figure 2.8. The strong wind produced at the bottom of high buildings may cause undesirable conditions for pedestrians. Vegetation has the ability to modify wind so that it decreases the wind flow and alters its direction when required Figure
39 Chapter 2 Urban open space and comfort Figure 2.8 Wind behaviour around tall buildings (Nikolopoulou et al. 1999) Figure 2.9 Vegetation influence on wind movement (Clark and Edholm 1985) 25
40 Chapter 2 Urban open space and comfort Globe temperature The globe temperature T g is the temperature measured inside a globe thermometer, typically a 40mm ball, and it is affected by the balance between the radiant gain at the surface of the globe and energy loss by convection (Erell et al. 2011). The globe temperature will lie somewhere between air and radiant temperature and has been so widely used in comfort surveys that it has almost become a basic variable. It worth considering using a globe thermometer as a temperature measuring instrument as Nicol (2008) suggested, because of its property of reacting to the environment in much the same way as a human occupant Humidity Humidity refers to the water vapour content of the atmosphere which might be gained as a result of evaporation from water surfaces, moist objects and plant transpiration (Konya 1980). The vapour pressure increases with temperature. Nevertheless, there is a limit to the amount of water that air can hold as vapour. Relative humidity is the ratio of the amount of vapour in a given volume of air to the maximum vapour capacity at that particular temperature. High levels of relative humidity may cause discomfort indirectly by affecting the environmental probability evaporation. The body responds to this by spreading sweat over the skin to increase its surface to boost evaporative cooling. The increased dampness of skin causes discomfort in some situation, when wearing formal clothes, for example. Low levels of humidity may cause discomfort directly. The excessive dryness of the air causes cracks in the lips and soreness in the throat (Clark and Edholm 1985). Under steady-state conditions and moderate air temperature (15-25 C) in temperate climates, the average relative humidity has little impact on thermal sensation. However, by moving from indoors to outdoors, the change in relative humidity can have a greater influence on thermal comfort (Nikolopoulou 2011b). Moreover, relative humidity changes have even more significant effect on thermal comfort in warm environments (>30 C) (Park et al. 2012). 2.7 Factors affecting site climate Topography Solar radiation, air temperature, and wind will be affected by the altitude, slope and exposure of the site i.e. higher altitudes have greater temperature variations (Clark and 26
41 Chapter 2 Urban open space and comfort Edholm 1985). During the night, the ground cools quickly due to heat loss by radiation to a clear sky and cool air drains down to the bottom. During the day, on the other hand, solar radiation intensity is remarkable due to the relatively short distance it has to pass through the earth s atmosphere at such altitude. The heating effect of solar radiation will differ when it falls on slopes facing different directions. This is because the variation in solar radiation will be greater on a sloping surface compared with horizontal. Wind also is affected by topography. Raised sites are exposed to more and stronger wind whereas basins are more protected from wind Ground cover The closer to the ground the more extreme the environmental conditions are. This is because the solar radiation increases the temperature of the ground during day time. At night, the temperature decreases next to ground level. This is due to evaporation and outgoing radiation. Thus, the ground cover has a major role in moderating extreme temperatures. Artificial surfaces and urban areas tend to increase temperature and reduce humidity. Such surfaces store, radiate and reflect heat to air layers close to them. On the other hand, natural cover of ground, grass for example, helps in moderating extreme temperature (Konya 1980). Therefore, using paved surfaces should be kept at minimum when designing outdoor spaces in hot climate zones. Vegetation in the urban environment affects not only the thermal environment, but also air quality and noise levels. Vegetation reduces air temperature by direct shading and moderation of solar heat gain through evapotranspiration (Dimoudi and Nikolopoulou 2003). Materials are thermally defined by their albedo (Cunningham 1998). The albedo of an object is the ratio of the diffusively reflected radiation to the incident electromagnetic radiation and it is closely related to the colour of the material. Rough and dark-coloured surfaces tend to absorb more solar radiation than smooth, light-coloured and flat surfaces. Dark-coloured surfaces are therefore warmer than light coloured surfaces. The use of cold materials can be advantageous in designing outdoor spaces and urban environments in hot climates, reducing air temperature due to heat transfer, and mitigating the urban heat island effect. 27
42 Chapter 2 Urban open space and comfort Water Water has larger specific heat capacity 2 compared to the dry land and therefore it has less daily and annual temperature variations. This moderates the thermal conditions in areas located near the sea where the on-shore breezes replace the hot air over land and cool down the land which has already heated up by solar radiation during the day. This process will be reversed at night because the land cools faster than the sea Densities and Building fabric When the urban fabric is dense, buildings provides shade to surrounding outdoor spaces, reducing the heat gain from solar radiation. The aspect ratio H/W of a street canyon is important geometric variable that indicate the density of an urban fabric. The aspect ratio of a street canyon can is the ratio of the canyon height (H) to canyon width (W). A regular canyon usually have an aspect ratio H/W=1, while a deep canyon has an aspect ratio H/W=2 or more (Vardoulakis et al. 2003). In addition to urban density, buildings and paved surfaces store heat, radiate, and reflect solar radiation thus increasing air temperature in the urban environment of hot climate zones. Therefore, in such climates, it is very important to recognise the balance between the shading that can be provided by building fabric and the influence urban fabric density on air temperature. This can be achieved by minimising the paved areas, increasing vegetation and using suitable. 2.8 Conclusions Open spaces and the influence of comfort on their users were defined and presented in this chapter, which also reviews types of activity that occur in open spaces and how these develop when the space has the right qualities. Thermal aspects of human comfort and their influence on the experience of urban outdoor spaces were observed, too. The main conclusions are: It is not the number of people alone that reflects how successful the urban space is. However, high number of groups and longer stay in an outdoor space result in high level of activities, which is a sign of a healthy place. Considering its importance, studies linked the level of activities in an urban open space with the microclimate of this space, and show that most of these take place only when the external conditions are good enough for stopping and strolling. 2 The specific heat capacity of a substance is the amount of energy needed to change the temperature of 1 kg of the substance by 1 C. 28
43 Chapter 2 Urban open space and comfort 3 Outdoor thermal comfort "The most direct way to cope with an adverse climate is simply to not be there when it gets too hot or too cold." (Heschong 1979) 3.1 Introduction This is a literature review chapter that gives a review of key studies dealing with the influence of the physical environment on thermal comfort in hot climates. It also covers main studies dedicated to the behavioural aspects of outdoor thermal comfort in other climates. 3.2 Urban geometry and its influence on outdoor thermal comfort The influence of the physical environment on thermal comfort in hot climates has been the focus of many urban microclimate studies (Krüger et al. 2010; Pearlmutter et al. 2006) The main themes investigated in literature include the influence of street canyon geometry on pedestrian thermal comfort (Ali-Toudert and Mayer 2006), and the influence of shading and trees on the microclimate (Shashua-Bar et al. 2011; Hwang et al. 2010). Simulations, measurements, and physical open air scale models have been used as methods of investigation. Simulations or numerical modelling has been described as a methodology to dealing with the complexities and nonlinearities of urban climate studies (Arnfield 2003). More details on selected urban microclimatic studies in the context of a hot climate will be given in the following paragraphs Outdoor thermal comfort and street design In a study to investigate the impact of street design on outdoor thermal comfort, Ali- Toudert and Mayer (2006) used the three-dimensional numerical model Envi-met (Bruse and Fleer 1998), developed to simulate microclimatic changes in urban environments. It has the ability to simulate hard modifications such as walls and soft modifications, such as vegetation. Calculations were run for a typical summer day in the hot climate city of Ghardaia in Algeria. Physiologically Equivalent Temperature PET (Höppe 1999) was used to assess outdoor thermal comfort. The key outcome of this study was that both solar orientation and aspect ratio of street geometry were found to have a substantial influence on thermal conditions in a street space and hence on thermal sensation. In other words, 29
44 Chapter 3 Outdoor thermal comfort wide streets in subtropical latitudes provide uncomfortable thermal conditions. It is also challenging to moderate the heat stress in an east-west oriented streets, even with a high aspect ratio 3 such as H/W=4. The authors claimed that their findings are crucial because of their influence on the design choices with regard to street usage (pedestrians or motor traffic), as well as the time of visiting/using such an urban space. In a complementary study, Ali-Toudert and Mayer (2007) demonstrated quantitatively that shading is the main approach for mitigating heat stress outdoors under hot summer conditions. They assessed the effect of street design aspects, such as asymmetrical canyon shapes, galleries and further shading devices on the façade. The outcome showed that all design aspects investigated have a moderate influence on air temperature but a strong impact on heat gained by the human body and thus on thermal comfort. The authors admit that it is difficult to interpret the meaning of PET value for thermal comfort of people precisely since discomfort is probably overestimated by this model. Thermal comfort is much more complex than described by energy models such as PET because thermal perception is influenced by past thermal history and, non-thermal factors and thermal expectations (Spagnolo and de Dear 2003). This is further explained by Nikolopoulou and Steemers (2003) who identified three levels of thermal adaptation: physical, physiological, and psychological. They suggested that the difference between the actual thermal sensation vote and the predicted one is due to thermal adaptation; this study is reviewed further below. Pearlmutter et al. (2007) launched a measurement campaign in the arid Nagev region of Israel. The study shows that significant thermal paybacks can be achieved by using dense urban fabric. Pearlmutter and his team attributed this to the solar radiation shield provided by this fabric. An open-air urban array was used to generalise the previous findings. This approach allowed them to find what they called the cool island effect in which pedestrians thermal stress can be reduced during the peak day time hours by increasing the urban density. The cool island effect occurs by increasing radiation trapping and storage of heat in such urban fabric. The cool island effect is accelerated by high diurnal fluctuations and high thermal inertia of the urban area. Nevertheless, the impact of this effect is dependent on the orientation of the street; it works best with north-south and it is almost insignificant with south-east oriented streets. The work by Johansson (2006) in Fez, Morocco is another example of studying the relationship between urban microclimate and outdoor thermal comfort in hot dry climates. The author investigated the influence of urban geometry on outdoor thermal comfort by 3 Defined in
45 Chapter 3 Outdoor thermal comfort comparing street designs within two different urban fabrics. The study used continuous field measurements during hot summer and cold winter in an area in the old town and another area in the new city to demonstrate two extremes of urban geometry. PET was also used in this study for thermal comfort assessment. Similar to the findings of Ali- Toudert and Mayer (2006), this study confirms the relationship between urban geometry and the microclimate at street level. Using the same index for thermal comfort assessment, PET, Johansson (2006) suggests that in the hot season, the shallow canyon was thermally uncomfortable whereas the thermal condition in the deep one was acceptable. The study also concluded that in hot dry climates, it is preferable to design compact urban fabrics with very deep canyons. Nevertheless, wider streets or open spaces that allow solar access should be considered in the urban design of areas with cold winters Effect of shading on thermal comfort Lin et al. (2010) discussed the effects of shading on long-term outdoor thermal comfort. Twelve field experiments were conducted on a university campus in the hot humid climate of central Taiwan. The experiments were used to validate RayMan Model (Matzarakis 2000) which was developed to calculate radiation fluxes within urban structures. Next, RayMan was used in this study to assess thermal comfort in order to predict thermal comfort based on meteorological data that covers a 10-year period. PET was also used in this study as the thermal index. The study showed that the modelled and measured mean radiant temperatures (Tmrt) were very close. The authors reported that the uncomfortable locations in summer were the less shaded locations (high sky view factor), whereas the highly shaded locations were uncomfortable in winter (low sky view factor). People take spontaneous behavioural actions to make themselves feel thermally comfortable, therefore, based on this adaptation theory, Lin et al. (2010) suggested that multiple shading types and different levels of shading are recommended so users can set or stand in areas that provide them with their preferred thermal conditions. Lin et al. (2010) finding was endorsed by further investigation by Hwang et al. (2011), using the same method in the same area and recommended applications to mitigate thermal discomfort in the street level. Hwang et al. (2011) recommended using shading devices and planting deciduous trees that provide shade in summer and allow solar access in winter The effect of vegetation Vegetation has a mitigating effect on outdoor thermal conditions and this has been investigated for decades. Field measurements have revealed that vegetation lowers the temperature of adjacent air and surfaces. This is due to the vegetation s 31
46 Chapter 3 Outdoor thermal comfort evapotranspiration effect, small heat capacity, and mitigating of solar radiation. This cooling effect of vegetation spreads to the surrounding areas mostly at night when calm wind and clear skies are available (Sugawara et al. 2008). Several field studies have investigated the thermal conditions within urban street canyons with trees on their sides (Giridharan et al. 2008; Park et al. 2012; Yang et al. 2011) Park et al. (2012), for example, have conducted quantitative measurements using an open-air scale model array of 1.5 m high cubes. The array reproduced eight urban street with distinct vegetation conditions. They found that 51% of the wind speed was reduced by the presence of four sidewalk trees inside the street canopy. Trees also help in reducing the globe temperature by decreasing the radiation flux by the shading. The authors found that the most significant thermal mitigation occurs when the sidewalk is facing a southwestern wall due to the maximum shading provided the built fabric. On the other hand, vegetation has little mitigating effect compared with sidewalk trees, since the latter provide shade in addition to its. 3.3 Microclimatic conditions and the behaviour of people Local microclimate influences the thermal sensation of people in urban open spaces and accordingly it affects attendance and activities (behavioural aspects), (Zacharias et al. 2004; Dessi 2002; Zacharias et al. 2001; Nikolopoulou et al. 2001). Field surveys have been used to study the behavioural aspects of people, in relation with their thermal environment outdoors (Makaremi et al. 2012; Ng and Cheng 2012; Xi et al. 2012). Field surveys in outdoor thermal comfort studies are often carried out by measuring relevant microclimatic variables or objective data. These data include air temperature, wind speed; relative humidity and solar radiation, from which thermal indices can be calculated. In addition to this, subjective data, such as thermal evaluation and preference, are collected from participants on site by structured interviews and questionnaires. Attendance and the activities are usually monitored by observations The human parameter In one of the pioneering studies in this area, Nikolopoulou et al. (2001) sought to further understand the microclimatic features of open spaces within cities and their influence on people s perception in using them. They emphasised the inadequate understanding of the human parameter in such spaces. Therefore, they conducted field surveys in Cambridge, UK and interviewed people in four study sites that varied in terms of use, geometry and typology. A mini-meteorological station was used to measure the objective environmental parameters (air temperature, wind speed, relative humidity and solar radiation). These 32
47 Chapter 3 Outdoor thermal comfort were later analysed in relation to the subjective responses and behaviour of the outdoor space users by using structured interviews and observations to evaluate their experienced thermal condition. Personal data, for example age, gender, and information on clothing were collected. The main finding of this study was the major discrepancy between the Actual Sensation Vote (ASV) of participants and the predicted thermal comfort condition which was calculated using the measured environmental parameters mentioned above and represented by the Predicted Mean Vote (PMV) index. Hence, solely depending on the physiological approach to evaluate thermal comfort outdoors is not sufficient. The authors also proposed the importance of understanding psychological factors such as environmental stimulation, thermal history and expectations in producing more thermally acceptable public open spaces in cities. In a subsequent paper, Nikolopoulou and Steemers (2003) identified three levels of thermal adaptation: physical, physiological, and psychological. They suggested that the difference between the actual thermal sensation vote and the predicted one, as calculated by the relevant microclimatic variables, was due to psychological adaptation. In other words, microclimatic parameters intensely influence thermal sensation, yet they accounted for half the variation of the ASV. The authors speculated that the rest of the variation might be explained by psychological factors such as: naturalness, expectations, experience, time of exposure, perceived control and environmental stimulation. However, at that stage, they were unable to provide a quantified relationship between these factors. They concluded that the relation between physical environment and psychological adaptation is complementary rather than contradictory. In a study in the northern latitude,thorsson et al. (2004a) examined the influence of thermal conditions on the behaviour of people in an urban park in the city of Gothenburg in Sweden. This field survey study incorporated conducting pre-structured interviews based on a questionnaire and measuring microclimatic data. These data were eventually used to calculate PMV to assess thermal comfort of participants. In agreement with Nikolopoulou et al. (2001), this study, likewise, revealed an evident discrepancy between PMV and ASV. They showed that people s expectations might influence their thermal evaluation of their environment. Therefore, the authors concluded that steady-state models such as PMV may not be ideal for assessing outdoor thermal comfort. The authors also concluded that the outdoor thermal conditions influence the behaviour of people using urban open spaces but this is also influenced by individuals subjective expectations; this was later supported by a similar conclusion by Katzschner (2006). Thorsson et al. (2004b) also proposed that providing diversity in microclimates in the 33
48 Chapter 3 Outdoor thermal comfort same site could improve the physical and psychological adaptation opportunities of people and therefore increase their use of the outdoor space. Nikolopoulou and Lykoudis (2006) evaluated the data collected across five different European countries in the project RUROS (Rediscovering the Urban Realm and Open Spaces) and covered nearly 10,000 interviews in 14 locations. The outcome confirms the relationship between microclimatic and comfort conditions. Moreover, it shows evidence of behavioural adaptation that was reflected in seasonal variation in clothing levels and taking actions to change the metabolic rate; as well as psychological adaptation where recent experience and expectations cause variation in neutral temperature calculated across the sites studied. Thorsson et al. (2007) conducted a similar field study but in the humid subtropical climate of Tokyo, Japan, and with using the PET as a thermal assessment index. In agreement with previous studies by Nikolopoulou et al. (2001) and Thorsson et al. (2004), the findings of this study confirmed that, in the hot humid climate, when the thermal perceptions of people falls within their acceptable thermal comfort zone, they tend to stay longer (19-21 min) in the outdoor space compare to 11 min on average when their thermal perception was outside the comfort zone. With regard to human activities, in contrast to previous studies (Zacharias et al. 2001), the relationship between total attendance and the thermal environment was insignificant since the regression analysis showed weak correlation between attendance and PET Spatial behaviour In a study conducted in seven urban plazas in Montreal, Canada, Zacharias et al. (2001) investigated the relationship between microclimatic conditions and spatial behaviour of the users of open spaces. They measured air temperature and wind speed and recorded time of the day, presence or absence of sunlight and proportion of surface area in sunlight. They also observed the use of urban space by keeping records of the total attendance count, the number in sun and in shade and type of activity i.e. standing, sitting and smoking. The study shows that a substantial portion of the attendance of people in public spaces is attributable to microclimate, with air temperature found to be the most important parameter. They used multiple regression to predict lower and upper bounds on attendance as a function of temperature. However, the variation in public attendance at the investigated spaces was not solely accounted for by microclimate, other unmeasured variables such as access, view, and the design of space may be important factors in public attendance, yet they its influence on human comfort was not approached. The authors did not study the significance of the relationship between environmental factors 34
49 Chapter 3 Outdoor thermal comfort and other factors such as presence of other users, crowding and urban design. Moreover, in terms of the human parameter, future studies should consider measuring the perception of comfort in addition to attendance and activities. In terms of the environmental parameter, measuring solar radiation to investigate the warming effect of sunlight should be considered. To confirm if the behaviour is constant throughout various microclimates, Zacharias et al. (2004) expanded their Montreal study and examined the spatial behaviour of users of seven plazas in San Francisco, USA. They found that microclimate has the same importance in spatial behaviour in the two cities where the environmental parameters were considerably different. The new study gave further evidence that air temperature and sunlight accounted for much of the variance in behaviour. Moreover, finally, the authors examined the behaviour before and after redesigning one plaza by testing the use level in relation to the amount of seating. They concluded that environmental design had minor effects in relation to microclimate. The amount of seating provided was an unimportant factor in relation to the use level. However, the position of seats was a key element as to whether they are used or not. In the Mediterranean climate, Nikolopoulou and Lykoudis (2007) also investigated the use of outdoor space in the city of Athens as part of the project RUROS. Environmental monitoring and questionnaires, together with observations, were used for field surveys. The findings further support previous studies that a significant relationship exists between microclimate and use of open spaces. Moreover, observations showed that the most central parameters influencing the use of space were air temperature and solar radiation (sun light). Hence the number of people was dropped when the air temperature notably rose. The results also showed that visitors sought different spatial settings in different seasons. For example, they preferred to sit in sunlit areas in autumn and winter while in summer, shaded areas were more in demand. In terms of the diurnal patterns of attendance, the study showed maximum attendance was recorded in the evening during summer, while the peak time shifted gradually to noon in winter. It was noted that the attendance in autumn and winter was far higher than in summer Cultural and social factors Social aspects of urban open spaces encourage and boost social interactions and provide socially safer environments and therefore enhance the quality of life (Carr 1992; Shaftoe 2008). The social outdoor space is where spontaneous activities take place and climate has a strong influence on them. Such spaces should inspire people to spend some time in communal activities, bringing their children to play, conversations, greetings and passive 35
50 Chapter 3 Outdoor thermal comfort contacts such as seeing and hearing others (Gehl 2006). Returning to the project RUROS, Nikolopoulou and Lykoudis (2007) demonstrated that open spaces played an important role in strengthening the social interaction in residential neighbourhoods and therefore improving the quality of life. They found that around 70% of people interviewed were coming from home before arriving in the open space so that their intended destination was the open space. Moreover, regular users of some of the studied areas accounted for 60% of the frequency of use. This demonstrates the importance of such spaces in the daily life of people. In the above mentioned study, Zacharias et al. (2004) attempted to reach better understanding of the relationship between physical and social factor, i.e. by inspecting the interaction between smoking and non-smoking users and by examining the behaviour of users when faced by limited choice of preferred environmental conditions. The study revealed that the presence of smokers had no significance effect on the distribution of users and activities. Moreover, users tend to accept crowding in an area that allows preferred environmental conditions. Culture can be defined as The system of information that codes the manner in which people in an organized group, society or nation interact with their social and physical environment. (Reber 1985). Therefore, Knez and Thorsson (2006) assumed in their study that different geographical/climatic zones can also be defined as different cultures. They also proposed that squares with similar environmental conditions would be differently evaluated by people living in different cultures with different environmental attitudes. Hence, the Japanese felt warmer than did Swedish participants. Therefore, the Japanese felt less thermally comfortable on the site despite the fact that PET index assessed the thermal conditions that participants in both countries were exposed to as comfortable. The authors concluded that psychological attitudes, with relation to expectations and memory, and socio-cultural processes may influence the thermal, emotional and perceptual assessments of a physical place. This is consistent with the findings of Nikolopoulou et al. (2001) and Thorsson et al. (2004b) that steady-state models such as PMV may not be ideal for assessing outdoor thermal comfort. The study suggested that more investigation is required on the social function of urban space in relation to its thermal condition. 3.4 Conclusions This chapter reviewed studies dealing with the influence of the physical environment on human thermal comfort in hot arid climates and the behavioural aspects of outdoor thermal comfort. Urban microclimate research tends to use numerical models or simulations as a method of investigation. Despite being limited to the physical 36
51 Chapter 3 Outdoor thermal comfort components of thermal comfort, this method could provide urban designers with vital data that enable them to produce urban spaces with better thermal conditions. On the other hand, field surveys, on the whole, are the preferable method for studying the relationship between the spatial behaviour of people and their thermal comfort in outdoors. However, far too little attention has been paid to conduction thermal comfort studies using field surveys as a method of investigation in hot arid climates. Therefore, Makaremi et al. (2012) and Johansson (2006) have heightened the need for more studies on thermal comfort and human behaviour to be conducted in the hot arid climate. This will assist in expanding the understanding of the thermal comfort of visitors and the aspects of their behaviour in such spaces. Studies in temperate climates, (Nikolopoulou and Lykoudis 2007; Zacharias et al. 2001, 2004), and in hot humid climates, (Lin 2009), revealed the significant relationship between microclimate and use of urban public spaces, with air temperature and solar radiation being the key meteorological parameters that influence the use of outdoor space However, in terms of the human parameter, more studies are required on the perception of comfort alongside attendance and activities, and in terms of the environmental parameter, measuring solar radiation and its effect in thermal comfort should be considered, particularly in extreme climates. Shading is the main approach to mitigating heat stress outdoors under hot summer conditions, and this could be achieved by providing suitable design aspects (Ali-Toudert and Mayer 2006). The mere dependence on the physiological approach to evaluate thermal comfort outdoors is not sufficient. Other factors, such as adaptation, explain the difference between the actual thermal sensation and the calculated thermal sensation based on steady-state models such as PMV. Therefore, people s evaluation of their environment could be influenced by their recent experience, thermal expectations, natural stimulation and other subjective factors Nikolopoulou et al. (2001). Moreover, Outdoor spaces with similar environmental conditions would be differently evaluated by people living in different cultures (Knez and Thorsson 2006). However, investigation is required into the social and cultural function of urban spaces in relation to their thermal conditions. 37
52 Chapter 4 Research Methodology 4 Research Methodology Field survey is the key to understand the true nature of people s interaction with their environment (Nicol 2008). 4.1 Introduction This chapter explains the methodology used in this research which is based on field surveys. The quotation above is part of Nicol s discussion of the application of field survey in the adaptive approach to indoors thermal comfort research. Field surveys enable studying subjects in their "real world settings with the purpose of including the full complexity of conditions that subjects may experience. Whereas other approaches, such as the analytical or the heat-balance, depend on laboratory or climate chamber conditions for their experiments. This chapter gives justification of methodology selection, the frame work upon which the research was designed. In addition to that, physical measurements and human behaviour monitoring are explained. The measured microclimatic parameters and the equipment used for this purpose are described. Also, the development of the questionnaire used for the structured-interviews together with the structure of observation forms and the pilot work are discussed. Details about study areas and participants are given. Finally, research procedures including the preparation of the field work, site analysis, data collection and data sorting are demonstrated. 4.2 Justification of methodology selection Studies of thermal comfort are showing increasing interest in the adaptive approach. According to Nicol (2008), there are two main reasons for such interest. First, there are doubts whether it is possible to transform results obtained under laboratory research settings to represent the complex conditions of the real world settings. Second, field studies such as Brager and de Dear (1998) and Nikolopoulou et al. (2001) show that people adapt to their own climates and tend to tolerate much more variation of thermal conditions than those predicted by laboratory-based thermal models. Field survey is even more central in thermal comfort research in outdoor settings. Outdoor environmental conditions are even more complex than inside buildings. Moreover, people in outdoor spaces have less control on the surrounding environments compared with some indoor spaces. Hence, adaptation is likely to be the only option for people to cope with the outdoor thermal conditions. 38
53 Chapter 4 Research Methodology 4.3 Research design The design of this research has a predictive nature and focuses on causality. Thus, a causal comparative design (Groat and Wang 2002) based on field surveys appears to be the best choice for this study. In this type of design, comparable groups of people or physical environments are chosen, and then data will be collected on a range of relevant variables. The comparable groups allow isolating factors that may unveil a cause of potential significant differences between the measured variables. However, this design can only assign cause in a hypothetical way because, like all correlation studies, it depends on naturally occurring variables. The causal comparative study can indicate a possible causation without establishing cause with the same level of firmness which exists in experimental designs. Thus, to make this design persuasive, the comparable groups should have a strong comparability. The research framework of this study, as explained in chapter one and shown in Figure 4.1, consists of three phases: the conceptual analysis; the fieldwork; and the outcomes. The conceptual analysis provides a detailed review of the-state-of-the-art, and it further develops the research proposal of the study, and concludes by the selection of most suitable methodology to perform the study. The field work starts after all required materials are prepared and tested as well as the procedures of the work are fully understood. After that, the data collected needs to be sorted and analysed in order to present and discuss the outcomes. 39
54 Chapter 4 Research Methodology Theoretical part Literature review Research Questions Research proposal Methodology Conceptual analysis Data collection Pilot work Experimintal part Physical measurements Meteorological Equipment Questionnaire Human behaviour monitoring Observation Field work Data sorting Statistical treatment (Excel, SPSS) Data analysis Results & discussion Conclusions Outcome & conclusions Figure 4.1 Diagram showing the structure of this research 40
55 Chapter 4 Research Methodology Field surveys were conducted according to level III classification defined by Nicol (2008).Level III type of field surveys is the most comprehensive type of field surveys of thermal comfort studies; this type include all factors needed to calculate the heat exchange between a person and the environment, together with subjective responses. Therefore, the data collected in this study includes: i. environmental variables using a mini-weather station; ii. subjective responses of participants using on-site questionnaire; iii. and observing factors required to calculate the heat balance exchange between participants and their environments such as activity and clothing. A combination of physical and human measurements was used to collect the environmental data and human attitudes in each outdoor public space in this study (Figure 4.2). Outdoor public space Field surveys Human behaviour monitoring Physical measurements Equipment Observations Structured interview (questionnaire) Meteorological variables Figure 4.2 Flow of data collection 4.4 Physical measurements The physical measurements consist of monitoring the microclimatic variables at each site, in addition to estimating activity level and clothing insulation of the investigated subjects. Therefore, it would be possible to include the average values of these variables in the PMV model (Fanger 1970) as a representative for the participant s thermal environment. The microclimatic variables, activity levels and clothing insulation will be compared to the 41
56 Chapter 4 Research Methodology subjective thermal sensations and other personal variables obtained from human behaviour monitoring explained below. Key microclimatic variables together with the equipment used to measure them in the study areas as well as the method of estimating activity level and clothing insulation are described in this sub-section microclimatic variables and equipment The environmental monitoring focused on measuring the four classical thermal parameters which are known for their impact on the thermal sensation. These parameters are: air temperature (Ta); wind speed (V); solar radiation (S), relative humidity (RH) and globe temperature (Tg). A portable set of instruments, similar to that used by Nikolopoulou and Steemers (2003) and Nikolopoulou and Lykoudis (2006), used to enable monitoring of the conditions Table 4.1. Air temperature and humidity were measured by using a fully interchangeable probe for measuring temperature and humidity covered with a radiation screen to obtain accurate measurement of air temperature outdoors; globe temperature was measured by a globe thermometer which has a 38mm diameter grey table-tennis ball covering a thermocouple wire; solar radiation was measured using a standard pyranometer fixed on the top of the radiation screen; wind speed was measured using a low power anemometer with a compact cup-star wind transmitter; and a Squirrel 1001 data logger. More information about the probes used, manufacturers and working range can be found in Table 4.1 Sensors were selected to conform to ISO (1985) and fixed on the top of an adapted case shown in Figure 4.3, while the data logger and power supply were located inside it. 4 Part of International Standards deals with the specifications of methods of measurements and testing of physical quantities which characterise thermal environments. 42
 Commercial name A100L2 Low Power Anemometer SKS 1110 Pyranometer HygroClip 2 HC2-S Data logger Squirrel 1001")
57 Chapter 4 Research Methodology Table 4.1 Details of the meteorological sensors Instrument Anemometer (Cup Anemometer) Pyranometer Combined temperature/hum idity probe. Grey Globe thermometer (Thermocouple wire inside a 38mm grey table tense ball) Commercial name A100L2 Low Power Anemometer SKS 1110 Pyranometer HygroClip 2 HC2-S Data logger Squirrel 1001 Manufacturer Range Accuracy Wind speed Limited (trading as Vector Instruments) Skye Instruments Ltd ROTRONIC Grant instruments Measuring wind speed between 0-75 m/s Measuring the incoming solar radiation- working range Wm -2 Measuring relative humidity (0-100%) and temperature (-50 to +100 C) Measuring the globe temperature 0.02 below 10m/s and above 56.5 m/s 0.01 between 10m/s and 56.5 m/s <±1% (RH) <±0.2 C (Ta) <±0.3 C at 0 C Pyranometer (S) Humidity / Temperature Probe (T air,rh) Globe thermometer (T g) Anemometer (V) Figure 4.3 The portable weather station Activity level and clothing insulation Activity level and clothing insulation are among the factors influencing human thermal comfort. Activity level is expressed by metabolic rate (met), 1 met = 58 W/m 2. Figure 4.4 shows the metabolic rates for different activities. Clothing insulation is expressed in terms 43
 Figure 4.5 Thermal insulation values of different combinations of clothes (Goulding et al.")
58 Chapter 4 Research Methodology of clo units. 1 clo= m 2 K/W. Figures 4.5 shows the thermal insulation values of different combinations of clothes.. Figure 4.4 Metabolic rates for different activities (Goulding et al. 1986) Figure 4.5 Thermal insulation values of different combinations of clothes (Goulding et al. 1986) The balance between energy production in the human body together with the heat gain from the surrounding environment on one hand and heat loss from the body on the other hand is largely influencing the sense of comfort. Metabolic rate, which is the amount of energy production in the body by conversion of food in time unit, is significantly dependent on activity level. Clothing offers insulation for the body against the external environment and resists heat loss from the body. Therefore, both activity level and clothing insulation have an important role in prediction thermal sensation based on the heat-balance model. Clothing descriptions and the relevant values used in this study were the same used in the development of the predicting model (PMV) and obtained from ISO The same source was used to estimate the metabolic rate correspondent with the activity level of 5 International Standard presents methods for predicting the general thermal sensation and degree of discomfort using calculation of PMV (predicted mean vote)and PPD (predicted percentage of dissatisfied). 44
59 Chapter 4 Research Methodology participants before and during the interview. Reducing of the metabolic heat by 10% were considered when participants were consuming cold drinks (Baker and Standeven 1996).The associated insulation values of Arabic clothes, which are widely used in Marrakech, were obtained form Al-Ajmi et al (2008). Both activity and clothing of each participant were carefully described and registered in the questionnaire form. Relevant values were estimated accordingly from ISO 7730 and used for data analysis. 4.5 Human behaviour monitoring Two approaches were used for human monitoring: a questionnaire to which participants responded through structured interviews and formal observations made by the researcher. In general, the questionnaire was mainly designed to investigate subjective responses and attitudes of interviewees in each study area in different seasons. At the same time, the observations aimed at exploring the behaviour of people in each study area including patterns of use and activities. Therefore, observation sheets were prepared and filled by the researcher every 20 minutes. In order to test the proposed questionnaire and observation for this study, a pilot study was performed on the University of Bath campus in Bath UK in summer and autumn The next sections will give further details about the questionnaire, the observation and the pilot study used in this research Research Ethics Prior to taking part in the research, participants approval of participating were taken and they were informed about the purpose of the research, data collection and its confidentiality The questionnaire The questionnaire was designed based on the research questions and further developed after the pilot study. Some questions were adopted from previous studies, such as (Nikolopoulou 2011a; Knez and Thorsson 2006) as described in Chapter 3. The questionnaire form consists of four main sections as shown in Appendix A. The first section, section A, questioned thermal sensations and preferences of the participants using seven closed questions. The second section, section B, consists of questions seeking more information about the participants. These include participants expectations and experiences of the concerned open space and its microclimate; the time they spent and the reason of being in the space, their attitudes toward the space during the time of the interview.the third part of the questionnaire was designed to evaluate participants socio-economic conditions. Three questions about educational level, job 45
60 Chapter 4 Research Methodology type, and financial status (Platt 2006) were used to rank participants according to their socio-economic background. Finally, the fourth section was noted by the interviewer and provides information about the subjects location in the space, gender, age, activity, and clothing. More details about each section of questions are given in the following paragraphs. Heading and map The heading of the questionnaire form includes: form number, site name, site map, date of the interview as well as starting and finish time of the interview. The site map is important so as to pinpoint the location in which each interview occurs. Locations of interviews were selected randomly within defined boundaries in each site so that it takes individuals preferences into account. It is also essential to carefully record the exact time of the start and end of each interview with the intention to directly relate subjects responses to the recorded thermal parameters at the time of each interview. Section A: thermal sensations and preferences In section A, the seven closed questions were put together to measure participants perception of their thermal environments. Question number 1 is dealing with subjects preferences to sunlight when that is applicable, there is no reason to ask this question when the weather is overcast. Participants will choose from a 3-point scale whether they are satisfied with the sunlight or more or less sun is required. Questions 2 and 3 were set to evaluate the effect of wind speed on participants thermal sensations. In question 2 the participants were asked to evaluate their perception of wind condition on a 5-point scale during the time of the interview. Participants were also asked to vote for their preferences on wind speed in question 3 on a 3-point scale. In the pilot study, it was apparent that using a 5 -point scale for describing wind conditions caused less confusion for interviewees compared with the 7-point scale. The 5-point scale has been used in different studies such as in Nikolopoulou and Lykoudis (2006), Thorsson et al (2007) and Eliasson et al (2007). Some studies such as in Zacharias et al (2001) adopted a 3-point scale because there was great fluctuations in wind so that it was very difficult to monitor the subjective wind sensations. The 5-point scale was also applicable for humidity sensation which was measured in question 4. The last three questions section A was to evaluate the overall subjective thermal sensation of the interviewees. Scales of 7-point, such as Bedford (1936)and ASHRAE Standard 55 (2006), have been traditionally used to measure the thermal sensation of participants. The accuracy of such scales is generally approved. In this research, 46
61 Chapter 4 Research Methodology however, a five-point scale is used in order to reduce interviewee confusion during the interview (Nikolopoulou et al. 2001). So that the scale in question 5 which represent the "Comfort Vote" of participants would be : -2 cold, -1 cool, 0 neither cool nor warm, +1 warm, and + 2 hot. Because our sample consists of people speaking different languages and from different backgrounds, question 6 was set to obtain the "Preference Vote" scale, thus avoiding any ambiguity resulted from cultural use of words. This might happen when participants from hot climate area voting cool in order to show that they are comfortable. Likewise, participants from cold climate area may vote warm to show that they are just comfortable (Nicol 1993) and (Nicol 2008). Therefore, using (McLntyre and Gonzalez 1976) three points scale can help in getting around this problem. The final question in this section is about the overall satisfaction of interviewees with the climatic variables combined. In previous studies, such as in this question used to be as Are you feeling comfortable? (Nikolopoulou and Lykoudis 2006) or How do you feel right now in this place? (Knez and Thorsson 2006); this questions sound too general. Thus, the phrase thermally comfortable was added. After the pilot study, however, it seems that some people find it difficult to understand what was meant by thermally comfortable, particularly when translated into Arabic. As a result, the phrase weather conditions was used to indicate what type of comfort the question is dealing with. Section B: participants behaviour and place perceptions Questions in section B investigates different issues associated with subjects behaviour and habits; thermal history; expectations; experience of the place; time spent in the place; and their perceptions about it. Since these factors are very unique to ech subject, they will be called personal variables. These variables are examined together with the measured environmental variables; the subjective thermal sensations; and preferences of participants in chapters 5 and 6. More disussion of the questions of this section will be discused below. Question 8 What would you do if it gets warmer/cooler was asked to investigate options available for participants to mitigate any discomfort. As well as question 14, this question indicates the level of perceived control the participants may have. For example, some people answered I will go back home and turn the AC on others said nothing! Apparently, this is due to the reason they were in the place; the first answer is likely to be heard from someone who came to thespace for a walk or for lunch, while the second answer is likely to be heard from someone who is waiting for another person or working in 47
62 Chapter 4 Research Methodology the place. The word cooler in this question was used when the weather conditions tended to be cool and that was mainly in winter, while the word warmer were used when the weather conditions tended to be warm. In question 10, participants were asked if most of their time is spent outdoors or indoors, they can be categorised within one of three groups: indoors group, outdoors group and almost equally between both indoors and outdoors group. Hence, the influence of the environmental and subjective variables on these groups can be analysed. Some questions were examining the reason why participants choose the place to visit and why they had selected the spot they were in when they were approached for the interview. As mentioned above, question 14 together with question 8 were examining the level of perceived control participants had when the interviews took place. Question 15 clarifies whether the selection of the location was influenced by the microclimate of the place. For example, in summer, some people answered that they had chosen to be where they were because of the shade. Others had chosen it because it is a nice spot or because of the fresh air. Question 23 was examining the satisfaction of participants by their positions. Thus, they were asked if they preferred to shift to another position within the site and, if applicable, what the reason for the change was. Question 9 is exploring a possible association between the thermal experience of subjects during childhood and their current subjective thermal sensations and preferences in the outdoor settings. Question 11 asked if participants were expecting the weather conditions to be as if was during the time of the interview. It follows that people were grouped in three groups; one group for those who were correct in their expectation, another group for those who had incorrect expectations; and a third group for those who did not know much about the weather conditions in the area. For those who could not predict the weather condition, they were further asked if they had expected the weather condition to be cooler or warmer. The reason for this question was is to compare participants expectations with their subjective thermal sensations as suggested by Nicol (2008) and their use of space, particularly, how long they spent in the place. Questions 12 and 13 were investigating the participants experience of the place. Question 12 asked participants about the frequency of their use of the space. How often do you use this place? At least once: very day, week, month, rarely or first time. Moreover, in question 13, participants were asked whether they live or work near the associated study area and for how long. 48
63 Chapter 4 Research Methodology Questions 16 and 17 were measuring the total time was spent by each subject in the place. While question 16 was asking about the time of the arrival of the subject until the start of the interview, question 17 was asking about the time the subject expected to stay in the place after the interview. In question 18, participants were also asked where they were just before coming to the place to examine their short-term thermal history. Indoor thermal comfort studies have shown that the short-term thermal history would influence participants thermal balance and consequently their thermal vote. Being under the effect of an air conditioning system short time before the interview may cause the thermal comfort and thermal sensation votes of a subject to be transitory and not representative to the outdoor thermal conditions. Therefore, question 19 was asking participants about how long ago before the interview they were under the effect of air-conditioning whether at home, at work or in a vehicle. This question also helped studying thermal preferences of participants with very little exposure to air conditioned environments and comparing that with those who have been exposed to such environments. Questions 20, 21, and 22 dealt with subjects perceptions towards the place. In question 20, which was developed from Knez and Thorsson (2006), participants were asked to respond to two five-point scales ranging from 1-5: (1) boring-interesting, and (2) attractiveunattractive. The first scale has association with how participants look at what is going in the area, while the second scale is more about who they look at the physical appearance of the space. In questions 21 and 22, participants were asked about what they like and what they dislike in the space. The main aim of the last two questions is to examine if the microclimate of the place is associated with perceptions of the participants towards the place Section C: socio economic circumstances Questions in section C were intended to evaluate the socio-economic background of the participants. Three questions about educational level, job type, and financial status were used to rank participants according to their socio-economic background. This approach may sound subjective and not ideal. Yet, it was used as an attempt in order to categorize participant individually rather than relay on the other general criterion based on the gross domestic product (GDP) per capita In question 24 participants were asked to respond using a six-point scale ranging from 1-6: (1) highly skilled with university degree to (6) no job. The second question, question 25 measured the educational level of participants on a four-point scale from 1-4: (1) Basic, which includes those who did not finish high school and (4) university, which includes those who have a university degree. 49
64 Chapter 4 Research Methodology The third question, which is about the financial circumstances of participants, required special attention and testing because of its personal nature and because of the economic differences between the two countries. For example, the Per Capita GNI (Per Capita Gross National Income) for the United States is $ 45,836 US dollars while the Per Capita GNI for Morocco is $ 2,696 (United Nations 2008), in other words, the net income of a USA citizen is equal to as much as 17 times more than the Moroccan citizen. Therefore, it was decided to use the following question developed by Platt (2006) How well would you say you yourself are managing financially these days? Would you say you are: living comfortably; doing alright; just about getting by; finding it quite difficult; finding it very difficult? These three questions helped in dividing the participants into different groups based on the three factors: job; education; and financial circumstances. After that, in chapter 6, each group will be examined against: subjective thermal sensations, thermal preferences, and patterns of use and behaviour in the outdoor space. At the end of this section, the interview was finished and the finish time noted. The average period of an interview in this study was about 5 minutes. Section D: other observations In section D the researcher observed and noted the interviewee s sitting area whether in shade or sun; surface temperature where participant standing or sitting; clothing; gender; age group; activity; whether eating and or drinking; and whether alone or within group of people. Detailed description of participants clothing was noted in the questionnaire sheet Observations The researcher observed people and activities within defined boundaries in each site. Thus, observation sheets were prepared for each site and filled every 20 minutes during the field study period. The number of people is counted by the researcher with considering the details such as gender, in groups or individuals, in the shade or under the sun. Photos were also taken for each observation phase, see Appendix C. The form consists of three parts: general information about the space; activity and attendance; and the site map. The first part includes: site number; date; time i.e. morning, noon, or late after noon; and sky condition i.e. sunny, partly cloudy, or overcast. Appendix B shows a copy of the observation sheets. The second part of the observation sheet provide fields to fill in the time of start and end of each observation; people activities in details; and the number of people in the space during the observation period. The number of people in each age group was counted i.e. 50
65 Chapter 4 Research Methodology children, who are less than 12 years old, young people from 12 to 18 years old, adults from 18 to 64 years old and senior people more than 64 years old In addition, the number of people according to their gender was also counted. The third part of the observation sheet was the site map. A Google satellite view shots were taken to each site and add to the observation sheet. Hence, people locations in each site were mapped in detail. A mapping code were developed from the work of Whyte (1980). For example, in the observation sheet, it was referred to a male user by (+), for a female user by (o), for a young person by (y). If the users were within a group, a circle line was drawn around the group. A hatching was drawn over shaded areas to enable calculating people who were in shade The pilot study A pilot study was carried out in the campus of the University of Bath in England before undertaking field surveys in Marrakech and Phoenix. The pilot work was performed because of the following reasons: first, it ensured that every question in the questionnaire was measuring, in the field, the relevant variable as required for the aim of the study. Second, the pilot work helped in correcting the wording used in the questionnaire in both languages English and Arabic by interviewing students who speak these languages. It was particularly important to pilot the Arabic version of the questionnaire to unveil any possible problems in the translation. Third, enhancing the design of some multiple choice questions by piloting them as open ended questions and then use the most popular answers in the final questionnaire. The pilot study also helped in testing the portable weather-station in the field. This includes making the interviewer familiar with best options for positioning the weather station close to the interviewee, handling the paperwork, and observing the site on a regular basis. The pilot work started by testing the questionnaire by asking colleges and students to read, answer, and comment on difficulties in understanding the questions. People who were given the questionnaire include both an American student at the University of Bath and a Moroccan resident in Trowbridge near Bath where a Moroccan community is settled. The next step was to examine the standard questionnaire in the field by executing real interviews with ordinary people. Therefore, interviews took place in three sites: at the University of Bath Parade (central open space in the university); the Abbey Plaza near Bath Tourist Information Centre; and Queen Square. The pilot work was performed during summer and autumn. Interviews took place for at least two days in each site covering 51
66 Chapter 4 Research Methodology morning, noon and afternoon times. This enabled piloting the revised questions and ensuring their suitability. Finally, one more stage of the pilot work took place in each site just before starting the field work for the first time. As a result of the pilot work, it has been found that the interview time has to be shortened since it exceeded 5 minutes. Moreover, some questions were omitted, others were added, and the wording of some questions were revised either to use simpler language and or to give more specific meaning. Finally, answers of the closed questions were confirmed. 4.6 Study area In order to meet the objectives of this study, the selected sites had to be located in a hotarid climatic zone. To ensure participation from different socio-cultural backgrounds, cities in different parts of the world were selected, representative of the North African and the western culture lifestyles. This enabled examination of effects of cultural differences on the thermal sensations and use of outdoor spaces. These cultural differences included: clothes; privacy; and patterns of use including time, number of people and their activities. In addition, different space typologies enabled exploration of how design affects the use of space through the creation of different microclimates. Therefore, five sites were carefully selected in two different parts of the world: Marrakech in North Africa and Phoenix-Arizona in North America (Figure 4.6). 52


 Al Koutoubia Park offers more shaded benches whereas site (2) Al")

67 Chapter 4 Research Methodology MARRAKECH 1-Al Koutoubia park 2-Al Koutoubia Plaza PHOENIX 3-Chaparral Park 4-Tempe Beach Park 5-Tempe Market place Figure 4.6 Case study sites in Marrakech and Phoenix Sites in Marrakech Marrakech is located in the western part of North Africa 31 62'N 8 03 W, in the area between the dry semi-arid and the dry arid zone and its altitude is 450m. The two sites in Marrakech, a park and a plaza, are located close to the historical Mosque of Al Koutoubia near the centre of the old city of Marrakech. Site (1) Al Koutoubia Park offers more shaded benches whereas site (2) Al Koutoubia Plaza has very few, most of them are not shaded (Figure 4.7). Meeting, watching and chatting with other people are the most frequent activities in sites (1) and (2). 53
 Al Koutoubia Park: Al Koutoubia Park has a rectangular shape with northwest - southeast long axis.")
68 Chapter 4 Research Methodology Figure 4.7 Satellite view of Al Koutoubia Park and Plaza in Marrakech (Google Earth 2010). Site (1) Al Koutoubia Park: Al Koutoubia Park has a rectangular shape with northwest - southeast long axis. The park is surrounded by the historical mosque of Al Koutoubia from the northwest, main street from the south east, high wall (7m) of the old French consulate from the north east and secondary street from the southwest. The park area is approximately 8800m 2 with almost 40% paved surface. There are 36 benches located all around the park. Moreover, about 20 palm trees are planted mainly on the western side of the central paved area as well as many orange trees of medium and large sizes (Figure 4.8). A cross-shaped fountain is centrally located in the park. However, it is not working. 54
69 Chapter 4 Research Methodology Figure 4.8 part of Al Koutoubia Park (site 1) Site (2) Al Koutoubia Plaza: The plaza has a quadrilateral shape. It is surrounded by the historical mosque of Al Koutoubia from the southwest, main street from the Northeast, high wall (7m) of the old French consulate from the southeast and another park from the northwest. The total area of this plaza is approximately 5600m 2, mostly paved with white stone. There are 12 benches located in the Northwest and north east side of the plaza with very little number of trees are planted in the same area (Figure 4.9). Three large squared basins of less than 45 cm height are located in the middle and southeast side of the plaza. They are filled with soil but not planted and people usually use them as seats. 55

70 Chapter 4 Research Methodology Figure 4.9 part of Al Koutoubia Plaza (site 2) Sites in Phoenix Phoenix is located in the Salt River Valley in central Arizona, 33 26'N 112 1'W, in the dry arid climatic zone and its altitude is 342m. Three sites were selected in Phoenix, site (3) Chaparral Park in Scottsdale, site (4) Tempe Beach Park and Tempe Marketplace in Tempe. Sites (3) and (4) are parks and suitable for sports and physical exercises as well as recreational activities (e.g. cycling, jogging, skating, picnics, etc.). Site (3) offers more shaded areas while site (4) offers more water-related activities (e.g. fishing, water slides, canoeing, etc.). Site (5), Tempe Marketplace, is a modern outdoor shopping mall, opened in It was designed to provide visitors with improved microclimatic conditions in hot conditions. In addition to the compact blocks and narrow paths and spaces, various techniques such as providing extensive shading devices and water sprinklers were used as shown in. Site (3) Chaparral Park: The Chaparral Park is a large green area, approximately 12,000 m 2, surrounds Chaparral Lake (Figure 4.10). It is located in west Scottsdale, in the northeast corner of Hayden and Chaparral Roads. This location is surrounded by residential area from the east, Hayden 56

71 Chapter 4 Research Methodology and Chaparral Roads from the south and the west respectively, and another green area from the north. Figure 4.10 Plan of Chaparral Park showing the borders of the study area in red Chaparral Lake is centrally located in the park, while the green area spreads all around. Walk-sides, playground, picnic areas and car park also exist in the eastern side of the lake while the western side is very narrow to accommodate anything but the sidewalk. Therefore, only the eastern side of the lake was selected for this study. This 6,000 m 2 area consists of more than 50 trees of different sizes clustered or scattered around the lake. Many of them help in shading around 15 benches underneath (Figure 4.11). 57

72 Chapter 4 Research Methodology Figure 4.11 part of Chaparral Park (site 3) Site (4) Tempe Beach Park: Tempe Beach Park was first constructed in 1931 covering around 40,000m 2. It was renovated with the creation of Tempe artificial Lake in It is located near the north side of downtown Tempe, surrounded by Tempe Lake from North, South Mill Avenue and KPMG buildings from West, East Rio Salado Road and US Airways building from south and West East Rio Salado and Railway bridges from the west (Figure 4.12). The chosen part of the park, which is around 8000m 2, could be divided into five areas. The central area is the smallest one and contains part of service facilities in the park, such as toilets, hand wash basins and drinking water tabs. The second area, the splash playground area, includes two main parts. The first part which is children wet playground area consists of waterfall and water slides well as water cannons. The second part is designated for picnics and parties. Benches and tables shaded by sunshades or by trees are available in this part. While they are setting in shade, parents and carers can easily watch the children playing under the sun (Figure 4.13). The eastern area of the site is about two meters lower than that of the first two areas. About ten picnic tables with seats are located in this part. Yet, the adjacent trees can hardly shade them. 58

 13 Tempe")
73 Chapter 4 Research Methodology Figure 4.12 Satellite view of Tempe Beach Park (Google Earth 2010) Figure 4.13 Tempe Beach Park (site 4) 59
74 Chapter 4 Research Methodology The fourth area is the largest area and located next to the lake. It contains large lawn, a long pedestrian way and boats marina. There are few trees in the middle of this area. Yet, most available benches or seats were not well protected from the sun. The southern area contains a baseball court surrounded by a fence. It also contains green lawn with 5 picnic tables. Nevertheless, no proper sunshades are provided. Site (5) Tempe Marketplace: The outdoor space of Tempe Marketplace was selected in this study. The space is a combination of small plazas linked with wide paved pathways. The site is one of the first modern outdoor shopping malls in the USA, equipped with different systems to enhance the thermal environment of visitors. It was opened in 2007, located on Rio Salado Parkway, west of Loop 101. The total area of the place is about 121,000m 2 and offers almost 120 retailers. It contains three main parts: a large block, large car park, and the shopping area which is called The District. The large block includes large stores used by famous retailers like Best Buy and Old Navy. The car parks area is central and exposed to sun with no shading areas. The District is a group of buildings clustered around outdoor space. The buildings accommodate many shops, restaurant and the largest theatre in Arizona. While the extended outdoor space offer seats, water features, stages and shading and evaporating systems. The selected area of study, shown in Figure 4.14, is only about 4000 m 2 and located in the western side of The Distract, just in front of the theatre. The studied area can be divided into two main parts. The central part is the space immediately in front of the theatre. This contains two large parasols under each of them there are four comfortable fabric sofas. It also includes a modern water fountain provided with sofas as well. The second part contains two narrow spaces start from the central space and end near east and west car parks. Both narrow spaces are defined by two parallel rows of shops and partly covered by canopies (Figure 4.15). Few palm trees were brought and replanted in the central space in addition to eight olive trees were planted in eight huge vessels 60
 Figure 4.")
75 Chapter 4 Research Methodology Figure 4.14 Satellite view of Tempe Beach Park (Google Earth 2010) Figure 4.15 Tempe Marketplace (site 5) 61
76 Chapter 4 Research Methodology 4.7 Research procedures Pre-field work preparations were made to select suitable sites for this research. Research materials were also arranged and tested. After initial analysis of each one of the selected sites the actual field work was started. Data collection as explained above included both physical measurements and human behaviour monitoring. The collected data were sorted and were prepared for analyses. The following subsections will give more explanations to these procedures Preparations before the field work Marrakech and Phoenix were chosen for the following reasons: first, both cities are located in similar climatic zone; second the two cities have two distinctive cultures; third English and Arabic are spoken in Phoenix and Marrakech respectively and because the author speaks both languages, it was possible carry out the interviews in both languages; finally, it was possible to establish contacts with organisations and individuals in both cities to have better idea about possible study areas and other secondary data. Thus, further information obtained about the possibility of performing this study in these cities. Research materials such as the questionnaire and observation forms in addition to the portable weather station were prepared and thoroughly tested. Further details about the research materials can be found in 5.2. Potential sites had been visited and explored before the actual field work started. The final sites were selected according to the following criteria: first, sites suitability and availability to meet the objectives of this study. This includes the design and function of sites i.e. park or plaza. It also includes whether the place used by a wide range of people from different backgrounds and age groups or it is restricted to a certain group such as tourists for example. Second, the health and safety issues such as the exclusion of any potential hazards or problems may be caused by the nature of the site or by people or authorities. When required, permissions were arranged with the relevant authorities to start the field work Data collection and sorting Two approaches of field surveys were defined by Lindberg (2004): the use of space approach and the thermal comfort approach. In the first one, the focus is on how the outdoor public space being used by people. The instruments in this approach are usually fixed in one location in the site and mounted on a similar height to instruments of a local meteorological station, thus data form both sources can be compared. On the other hand, the thermal comfort approach focuses on how individuals perceive their thermal 62
77 Chapter 4 Research Methodology environments. It is usually used with questionnaire or interviews. In this type of field surveys, a mobile or portable set of instruments is usually used to measure the microclimatic parameters so that the exact thermal environment of each participant is measured. In the current study, the thermal comfort approach was adopted and data collected during the actual interviews. The collected data are representative of participants thermal conditions. The microclimatic data were sampled and stored every 10 seconds, an observation form was filled every 30 minutes and interviews were carried out with people according to their presence and welling to participate. The meteorological parameters were also measured almost every 30 minutes at the end of each survey session in the middle of each site to obtain the overall microclimatic reading for use of space analysis. Photographs were frequently taken and tagged with the time when they were taken (see Appendix C and Appendix D). Thus, it might be used as a reference to check vague or missing data in the observation forms. The field surveys took place during summer and winter in the morning, noon time, and in the afternoon. Table 4.2 shows dates and times in which field surveys were taking place. Microsoft Excel spreadsheets were set up to sort the human and environmental data collected from the field work. Interviews data were put together with the relevant environmental data in one file. Another file was assigned to include the observation data and its relevant environmental data. Both files were eventually exported to the predicted analysis software IBM SPSS Statistics Further notes about sites, people and environmental conditions were also gathered and used to support the analysis. 63
78 Chapter 4 Research Methodology Table 4.2 Dates and times of filed surveys date time City season site year month days (including weekdays &weekends) morning noon late afternoon Marrakech winter K. Park 2008 Feb 01,03,05,07, 8:00-10:00 * 12:00-14:00 15:00-17:00 Marrakech winter K. Plaza 2008 Feb 02,04,06,08, 8:00-10:00 * 12:00-14:00 15:00-17:00 Marrakech summer K. Park 2008 Jul 22,24,,25, 8:00-10:00 12:00-14:00 17:00-20: Aug 02 Marrakech summer K. Plaza 2008 Jul 22,24,25, 8:00-10:00 * 12:00-14:00 17:00-20:00 Aug 02 Phoenix winter Ch. Park 2009 Jan 11,12,13,20 8:00-10:00 12:00-14:00 15:00-17:30 Phoenix winter T. Lake 2009 Jan 08,09,10 8:00-10:00 12:00-14:00 15:00-17:30 Phoenix winter T. Market 2009 Jan 15,16,17 8:00-10:00 * 12:00-14:00 15:00-18:30 Phoenix summer Ch. Park 2008 Jun 27,28,30 8:00-10:00 12:00-14:00 17:00-19:30 Jul 01 Phoenix summer T. Lake 2008 Jul 06,07,08,09 8:00-10:00** 12:00-14:00** 17:00-20:00 Phoenix summer T. Market 2008 Jul 06,08,09 8:00-10:00 * 12:00-14:00 17:00-20:00 -* Most interviews were conducted after 12:00 as to the site was deserted before that. -** Most interviews were conducted in late afternoon session as to the site was deserted before that. - Dates in bold italic represents weekends. 64
79 Chapter 4 Research Methodology 4.8 Data analysis This sections gives an overview of the statistical tests were used in this study. These are: Chi-square, Independent t-test, and the ordinal regression Chi-square Chi-square (χ²) test of independence is a statistical method based on a cross tabulation table to test whether two (or more) categorical variables are independent or homogeneous by comparing the observed frequencies of cases that occur in each of the categories, with the values that would be expected if there was no association between the two variables being measured conducted to compare the thermal sensation vote (ASV) of Marrakech and Phoenix participants. First, the assumption of Chi-square must be checked, so that the minimum expected cell frequency should be 5 or greater, or at least 80% of cells have expected frequencies of 5 or more. If the assumption has been violated then the Fisher Exact 6 test should be considered, and the next step is the interpretation of Chi-square output. The main value to be checked in this test is Pearson Chi-square. If the associated significance level of Pearson Chi-square values is equal or smaller than 0.5, the result of this test shows a significant association between the two tested variables, yet the strength of this association needs to be examined. Knowing the effect size (strength of association) will help to discover the level of association between the two variables. Having two categorical variables in this test i.e. ASV and the two cultural groups, the recommended effect size is Somers d 7 (Pallant 2010). Somers d effect size enables choosing which variable is the dependent one, in this case ASV is the dependent variable. Table 5.8 shows the criteria to decide the effect size depending on the value of Somers d, taking into account the number of categories in the variables tested where R is the number of rows and C is the number of columns, the smallest value between (R-1) or (C-1) to be considered for choosing the criteria in Table 5.8., in this case C=2. Therefore, the first row should be applied in this case. 6 Exact test helps in obtaining accurate results when the data fail to meet any of Chi-square test assumptions. The Exact significance is always reliable, regardless of the size, distribution, or balance of the data. 7 Somers d is a measure of association between two ordinal variables that ranges from -1 to 1. Values close to an absolute value of 1 indicate a strong relationship between the two variables, and values close to 0 indicate little or no relationship between the variables. 65
80 Chapter 4 Research Methodology Table 4.3 The criteria of deciding the effect size of the Chi-square test Somers d value (R-1) or (C-1) = 1 Weak=.01 Moderate=.30 Strong=.50 (R-1) or (C-1) = 2 Weak =.07 Moderate =.21 Strong =.35 (R-1) or (C-1) = 3 Weak =.06 Moderate =.17 Strong = Independent-sample t-test of difference T-test is a statistical test of difference which compares the means between two unrelated groups on same continuous, dependent variables. The t-test answers the question whether a difference between the two groups is likely to have occurred because of random chance in sample selection. To check whether the data can be analysed by using an independent t-test, a number of assumptions should be fulfilled. These assumptions are: 1- The dependent variable should be measured on a continuous scale; 2- the independent variable should consist of two categorical, independent groups and should be normally distributed; 3- there should be no significant outliers. Outliers are simply single data points within once data that do not follow the usual pattern. SPSS easily detect possible outliers. ; 4- homogeneity of variance which is tested by using Levene s test for variance provided by SPSS. Eta squared 8 (η 2 ), the effect size associated with t-test(jaccard 1990), calculated from: η²= t² t² + df where (df = n 1 + n 2 2), and n 1, n 2 are the populations of two groups. The criterion suggested by Jaccard (1990) for deciding the effect size of t-test depending on Eta squared is used in this study and shown in Table
81 Chapter 4 Research Methodology Table 4.4 The criterion for deciding the effect size of the t-test i.e. Eta squared η² according tojaccard (1990). Strength Eta squared value Weak.05 Moderate.10 Strong The ordinal regression: The ordinal regression analysis(mccullagh 1980) allows to modelling the dependence of a polytomous ordinal response on a set of predictors, which can be factors or covariates. The ordinal regression analysis was carried out to examine how the environmental variables (explanatory variables or predictors) related to the actual thermal sensation votes of participants (criterion or dependent variable). The procedure used in ordinal regression is the logistic regression which is similar to a linear regression model but is suited to models where the dependent variable is dichotomous or branched. The regression coefficients can be used to estimate effect size for each of the predictors (Pallant 2010). The Wald statistic is calculated for variables in the model to determine whether a variable should be removed. Wald statistic 9 results show the major factors that influence the thermal sensation vote. Variables with significant Wald values contribute significantly to the predictive ability of the model. The Beta value (B) 10 in the table is similar to that used in multiple regression analysis, and it is used in the equation to calculate the ASV. The negative or positive B shows the direction of the relationship between the relevant predictor and the dependent variable, ASV in this case The probit analysis Ballantyne et al. (1977) suggested that the neutral temperature can be determined from probit analysis and is represented as the temperature at which the maximum number of participants would change their thermal assessment between two levels of response to a variable. As an example of this, suppose P1, P2, P3, P4 and P5 are the percentages of assessments for thermal sensations 1, 2, 3, 4 and 5 (five point scale 1= cold and 5= Hot) at a fixed condition of parameters affecting thermal sensation. Then the probit analysis 9 The Wald statistic is calculated for the variables in the model to determine whether a variable should be removed. 10 The beta value (standardised regression coefficients): is a measure of how strongly each predictor variable influences the criterion variable. 67
82 Chapter 4 Research Methodology could be applied to the variation of these assessments with change in one of the parameters (such as air temperature Ta or globe temperature Tg). The probit analysis only deals with two levels of response. Therefore, the thermal sensations should be split into two groups in any of following ways: 1. P1 and P2+P3+ P4+P5 2. P1+P2 and P3+P4+P5 3. P1+P2+P3 and P4+P5 4. P1+P2+P3+P4 and P5 The votes can also be split into warmer than neutral and cooler than neutral by splitting the neutral votes between the two groups as follows (P1+P2+0.5 P3) and (0.5 P3+P4+P5). In this example the votes are split into the two groups of neutral or warmer (P3+P4+P5), neutral because it contains P3 (neither warm nor cool) and warmer because it contains P4 (warm) and P5 (hot). The second group is cooler than neutral (P1+P2) because it contains P1 (cold) and P2 (cool). After calculating the percentages of assessments for thermal sensations at each temperature degree or more, the probit analysis is then applied to give a typical cumulated curve labelled (P3+P4+P5) or (neutral or warmer). This cumulated curve shows the total percentage of participants who would change their assessment from cooler than neutral to neutral or warmer at a certain temperature and at all lower temperatures. The neutral temperature would be defined as the transition temperature at which the maximum number of people would change their assessment from cooler than neutral to neutral or warmer. It is the temperature at which (P3+P4+P5)= 50% (Figure 4.16). In other words, when there are equal probabilities of a particular vote being cast for the lower or higher of the two defined categories of thermal sensation. 68
83 Assessments (%) Chapter 4 Research Methodology 100% 90% 80% 70% 60% 50% 40% 30% 20% 10% 0% P1+P2 P3+P4+P5 Tn=24.0 C Temperature ( C) Figure 4.16 Obtaining neutral temperature using probit analysis. 69
84 Chapter 4 Research Methodology 4.9 Concluding remarks Field surveys are central in outdoor thermal comfort research because field surveys enable studying the complex relation between both physical and subjective variables. Therefore, a causal comparative design based on field surveys has been chosen for this study. A combination of physical and human measurements was used to collect environmental data and to measure human attitudes. The physical measurements consist of measuring the microclimatic l variables in each site and estimating activity level and clothing insulation of the investigated subjects. In addition, the human behaviour monitoring consists of two approaches: first, a questionnaire to which participants responded through structured interviews; second, in conjunction with the interviews, formal observations performed by the investigator during field work days. The pilot study was conducted to test and develop the methodology of this study. As a result of the pilot work, it has been found that the interview time has to be shortened. Moreover, some questions were omitted, others were added, and the wording of some questions were revised either to use simpler language and or to give more specific meaning. Finally, answers of the closed questions were confirmed. Moreover a coding for expected answers of the open questions was developed. Five sites were carefully selected in two different parts of the world (Marrakech in N. Africa and Phoenix-Arizona in N. America). The choice considered the following factors to meet the objectives of this study: the selected sites had to be located in a hot-arid climatic zone; participation from different socio-cultural backgrounds to enable examination of effects of cultural differences on the thermal sensations and use of outdoor spaces.; different space typologies enabled exploration of how design affects the use of space through the creation of different microclimates. Pre-field work preparations were made to select suitable sites for this research. Research materials were also arranged and tested. After initial analysis of each one of the selected sites the actual filed work was started. Data collection included both physical measurements and human behaviour monitoring. The collected data were sorted and were prepared for analyses. Results will be presented and discussed in the following chapters. 70
85 Chapter 5 Descriptive analysis 5 Descriptive analysis 5.1 Introduction This chapter is part of the results obtained from the field surveys. It contains a description of the population interviewed and the microclimatic profile of the study areas. Two cultural groups were selected from two different countries in the hot arid climate zone, and another three socio-economic groups. The results presented in this chapter also help in understanding the following: 1. how the two cultural groups evaluate their actual thermal conditions; 2. the relative contribution of heat-balance parameters to thermal perception by subjects in an outdoor space in a hot arid climate. 5.2 Description of sample profile Criteria of sample selection Only those who were sitting or standing in the studied spaces were considered in interviews since, according togehl (1996), these are the optional activities, as opposed to the necessary activities, that have a close relationship with the quality of urban open spaces. Moreover, only local individuals were considered in interviews; tourists and temporary visitors were excluded from analysis to ensure that the sample represents the local culture of the studied area. Culture can be defined as The system of information that codes the manner in which people in an organized group, society or nation interact with their social and physical environment. (Reber 1985). In a previous study that investigated the influence of culture and environmental attitude on participants thermal assessment of a square in Sweden and Japan, Knez and Thorsson (2006) defined cultural groups as two groups of participants visiting the Swedish and the Japanese square, respectively. The two groups were considered as living in two different cultures. Therefore, in the current study two cultural groups were selected from countries with different geographical locations: North Africa and North America; different level of development: developing and developed countries; and different dominant values. Therefore, in the current study, the two groups of participants who were visiting open spaces in Marrakech are representing one culture and those who were visiting Phoenix are representing another culture. 71
86 Chapter 5 Descriptive analysis Description of the whole sample profile The analysis presented below includes the data collected from both cities, in summer and winter. A total of 431 interviews were carried out, 247 in the winter and 182 in the summer, including 86 females and 343 males. In Marrakech, there were 186 interviews in the winter and 117 in the summer, while in Phoenix; there were 65 in the summer and 61 in the winter. The number of interviews in Phoenix was lower than in Marrakech since fewer people were present during the field surveys. The sites studied were used by different age groups, as shown in Table 5.1. Table 5.1 Age distribution of participants Age group < >65 Total Percentage (%) Frequency Sample profile of population interviewed in Marrakech Participants 11 in the Marrakech surveys included local people from both genders and different ages. Among the participants, who took part in the interviews in Marrakech, 83% were males and 17% were females. In general, the presence of males in Marrakech sites was higher than the presence of females, with the exception of the late afternoon time when the number of families increased. Among all people observed 12 in these sites in winter and summer, 63.5% were males and 36.5% were females. 11 Participants, in this study, are only those who took part in the interviews and they are part of the larger population observed in each site. 12 People were in the space and were not necessarily participating in the interviews. 72
87 Chapter 5 Descriptive analysis Figure 5.1 Age group profile of Marrakech survey sample Figure 5.1 shows the percentage of participants age-group in Marrakech. Almost 33% of participants in Marrakech belonged to the year old group. The next most common age group was the year old group, with 30%. Among all the people who were observed in the Marrakech sites, less than 5% were older than 65 years old and almost 35% were younger than 24 years old. Therefore, the participants of Marrakech tend to be relatively young. The age ratio seems to be in agreement with the demographic and social statistics of the United Nations presented in the Demographic Yearbook 2011 (United Nations 2012). These statistics show that around 30% of the population of Morocco aged between (0-18), 65% between (18-65) and 5% aged over 65. The data of the current research does not reflect all the <18 age group because children were not included in interviews. 73
88 Chapter 5 Descriptive analysis Figure 5.2 Reasons for being in the location in Marrakech survey Figure 5.2 shows reasons that make participants to visit Marrakech sites. As can be seen, 55% of participants reported that the main reason for them to visit Al Koutoubia Park and Al Koutoubia Plaza was to go out and enjoy being in the open public space. Almost 30% were waiting for somebody or something, some of them were waiting for the bus in the shade provided by trees in Al Koutoubia Park. Other participants were there for a break or passing by. 74
89 Chapter 5 Descriptive analysis Figure 5.3 Activity of participants in Marrakech for the last ten minutes before the interview Figure 5.3 shows the percentage of the frequent activities of participants during the last ten minutes before the interview. As can be seen, 90% of Marrakech participants were seated and almost 5% were standing. As will be discussed later in this chapter, this is probably due to the characteristics of the design of the outdoor space and some cultural attributes of the users. 75

90 Chapter 5 Descriptive analysis Figure 5.4 Educational attainment of Marrakech survey participants Figure 5.4 gives a brief description of the level of education of the Marrakech sample. As can be seen, almost 50% of the participants in Marrakech had a basic 13 education, while only 20% of them were university graduates. The national literacy rate of Morocco is 56% according to UNESCO (2009).Therefore, the participants of the Marrakech sample tend to have a low educational background Sample profile of population interviewed in Phoenix Participants in the Phoenix surveys included local people from both genders and different ages. Among the participants who took part in the interviews in Phoenix, 60% were males and 40% were females. Among all people observed in these sites in winter and summer, 53% were males and 47% were females 13 The basic education in this context refers to any educational training below high school level or if the participant was illiterate 76
91 Chapter 5 Descriptive analysis Figure 5.5 Age group profile of Phoenix survey sample Figure 5.5 shows the percentage of participants age-group in Phoenix. Almost 30% of participants in Phoenix belonged to the year old group. The next common age group was the year old group, with 25%. Among all the people who were observed in the Phoenix sites, 12% were older than 65 years old and less than 15% were younger than 24 years old. Therefore, the members of the Phoenix sample tend to be relatively older than that in Marrakech. The age ratio seems to be on agreement with the demographic and social statistics of the United Nations presented in the Demographic Yearbook 2011 (United Nations 2012).These statistics show that around 20% of the population of North America is aged between (0-18), 67% between (18-65) and 13% aged over 65. The data of the current research does not reflect the all <18 age group because children were not included in interviews. 77
92 Chapter 5 Descriptive analysis Figure 5.6 Reasons for being in the location in Phoenix survey Figure 5.6 shows what motivated participants to visit the Phoenix sites. As can be seen, similar to Marrakech, 50% of participants reported that the main reason for them to visit these sites was to go out and enjoy the place. Almost 27% were waiting for somebody; this percentage is also similar to that in Marrakech. Other participants were there for a break, passing by, walking dogs and some other reason. 78

93 Chapter 5 Descriptive analysis Figure 5.7 Activity of participants in Phoenix for the last ten minutes before the interview Figure 5.7 shows the activity of participants during the last ten minutes before the interview in percentages. As can be seen, 45% of the participants in the Phoenix survey were seated, 35% were standing, and almost 20% were walking. It is apparent that participants in Phoenix tend to engage in activities that require motion compared to those in Marrakech. This may be influenced by two factors: the design features of the outdoor space and the culture of the users, and this will be discussed later in this chapter. 79
94 Chapter 5 Descriptive analysis Figure 5.8 Education of Phoenix survey participants Figure 5.8 gives a brief description of the educational background of the Phoenix sample. As can be seen, unlike Marrakech, almost 75% of the participants were either college or university graduates while less than 10% of them had basic education. The national literacy rate of the US is 99%, according to The World Factbook (2013). Therefore, the participants of the Phoenix sample tend to have a higher educational background compared to the Marrakech sample Discussion of sample profile The sample profile of participants in Marrakech and Phoenix was described. Only local participants were included in the analysis. In addition, only participants who were sitting or standing, the optional activities (Gehl 1996), in the studied spaces were interviewed. The level of education was higher in Phoenix compared with Marrakech while the average age of Marrakech participants was found to be lower than that of Phoenix participants. The age ratio seems to be in agreement with the demographic and social statistics of the United Nations presented in the Demographic Yearbook 2011(United Nations 2012). This statistics shows that around 30% of the population in North Africa aged between 0-14 and 80
95 Chapter 5 Descriptive analysis only 5% aged over 65. On the other hand, around 20% of the population of North America are aged between 0-14 and 13% are aged over 65. (United Nations 2012). The main reason for Marrakech participants to visit the outdoor space was for enjoyment and going out and this was followed by waiting for someone or something ; a similar response was found in Phoenix. Participants in Phoenix were engaged in activities that require motion, such as walking and running. On the other hand, such activities were minimal in Marrakech where the majority of participants were seated. This is likely due to two factors: the design features of the outdoor space and existing social habits and rules. The first factor, the design features of the outdoor space can restrict or give opportunities for a variety of activities in the place. For example, the design of Al Koutoubia Park allows few activities to take place. Although this park offers shaded areas under the trees, the space left for other activities such as children playing is too small. On the other hand, the layout of Al Koutoubia Plaza includes larger spaces but less shade. The design of Tempe Beach Park in Phoenix, however, with its large playing areas and long paths, allows more activities to take place such as jogging, children playing, and water activities. The cultural attributes of the visitors may also influence the type of activity taking place in the outdoor space. In Marrakech, for instance, women and, to a smaller extent, men are unlikely to be seen exercising in public, while this is very common in Phoenix. Therefore, it is uncommon to use urban public spaces for exercising in Marrakech while exercising is one of the main activities in such spaces in Phoenix. 81
96 Jan Feb Mar Apr May Jun Jul Aug Sep Oct Nov Dec Air Temperature C Chapter 5 Descriptive analysis 5.3 Microclimatic summary for both cities Historical air temperature records of Marrakech and Phoenix for 30 years were obtained from the World Meteorological Organisation and presented in Figure 5.9 and Figure 5.10 respectively. As can be seen, air temperature reaches maximum values in July and reaches the minimum in January in both cities. In winter, air temperatures are similar in Marrakech and Phoenix. However, in summer the mean value of air temperature in Phoenix is around 5 C higher than in Marrakech. Throughout the winter months, from November until early March, Marrakesh gets very pleasant temperatures, with the average high of 18 C; the average low drops below 6 C during this time. During the summer months, late May until September, the temperature in Marrakesh remains high. July is the hottest month of the year, when the temperature climbs to 38 C. Marrakech Mean Temperature C Daily Minimum Mean Temperature C Daily Maximum Mean Temperature C Daily Average Month Figure 5.9 Monthly air temperature in Marrakech (WMO 2011) In Phoenix, the average high is 20 C and the average low drops below 8 C during winter. During the summer months, late May until September, the temperature in Phoenix remains extremely high. July is the hottest month of the year, when the temperature climbs to over 39 C. 82
97 Jan Feb Mar Apr May Jun Jul Aug Sep Oct Nov Dec Air Temperature C Chapter 5 Descriptive analysis Phoenix Mean Temperature C Daily Minimum Mean Temperature C Daily Maximum Mean Temperature C Daily Average Month Figure 5.10 Monthly air temperature in Phoenix (WMO 2011) Figure 5.11 presents average values of air temperature measured during the field surveys in both cities in summer and winter. In winter, air temperature in Phoenix is 2 C lower than in Marrakech while in summer, the mean value of the measured air temperature in Phoenix is around 4 C higher than in Marrakech. By comparing the measured data with historical data, presented in Figure 5.9 and Figure 5.10, it can be noticed that the measured air temperatures during winter and summer match the historical data. Air temperatures are very similar in the two cities in winter, and air temperatures are slightly higher in Phoenix in summer. 83
98 Air Temperature C Chapter 5 Descriptive analysis Marrakech Phoenix Min Max min max winter summer Figure 5.11 Measured air temperature in Marrakech and Phoenix in winter and summer The means of microclimatic variables, presented in Table 5.2, were measured on sites while observations were taking place in both winter and summer. It is apparent that air temperature was very high in both cities throughout the year as expected, with a summer mean air temperature of 35 C in Marrakech and 39 C in Phoenix, as shown in Table 5.2. The winter mean air temperature was at a more comfortable level of 22 C in Marrakech and 20 C in Phoenix. Relative humidity was low throughout the year for both cities, as can be seen from Table 5.2. Table 5.2 Means of measured microclimatic variables in Marrakech and Phoenix Marrakech Phoenix site 1 site 2 site 3 site 4 site 5 Tg ( C ) Tair ( C ) RH % Ws m/s S W/m 2 winter summer winter summer winter summer winter summer winter summer
99 Chapter 5 Descriptive analysis Microclimatic profile Marrakech Table 5.3 provides a summary of the measured microclimatic conditions in Marrakech sites in summer and winter. The table provides the mean values of the measured globe temperature ( C), air temperature ( C), solar radiation (W/m 2 ), wind speed (m.s -1 ), and the relative humidity (%). The mean values were measured in three monitoring periods: morning, midday, and evening. Data were measured between 8:00-11:00 (morning), 11:00-14:00 (midday), and 17:00-20:00 (evening). Evening time was shorter in winter due to the earlier sunset. Data were not included for winter mornings in Marrakech because no surveys took place during that time due to lack of visitors. Table 5.3 Summary of mean climatic variables during survey period in Marrakech in winter (w) and summer (s) Summary of climatic variables variation during survey period (Marrakech) Period Globe Temperature ( C) Air Temperature ( C) Solar Radiation (W/m 2 ) Wind Speed (m/s) RH (%) w s w s w s w s w s Morning Midday Evening Average The difference between solar radiation values, particularly during midday and other periods was significant. Solar radiation levels increased dramatically towards the midday to reach 290 W/m² and 500 W/m² in winter and summer respectively and then it dropped down below 140 W/m² in the evening. Table 5.3 also shows that wind speed is similar throughout the day 0.8 m/s in winter, while the speed doubles between morning and evening in summer from 0.6 to 1.2 m/s. Table 5.3 also shows that in winter, relative humidity level was low and stable throughout the day at around 28%. In summer, relative humidity levels were low, starting at around 35% in the morning and decreased throughout the day to reach their minimum in the evening at around 20%. Figures show the daily profiles of measured values of air temperature, solar radiation and relative humidity in Marrakech as a function of time of the day. The daily variation in temperature was around 15 C in winter and 10 C in summer.as can be seen from Figure
100 Chapter 5 Descriptive analysis Figure 5.12 A daily profile of air temperature as a function of time in Marrakech Figure 5.13 A daily profile of solar radiation levels as a function of time in Marrakech survey 86
101 Chapter 5 Descriptive analysis Figure 5.14 A daily profile of relative humidity levels as a function of time in Marrakech survey Microclimatic profile Phoenix Table 5.4 Summary of mean climatic variables during survey period in Phoenix Summary of climatic variables variation during survey period (Phoenix) Period Globe Temperature ( C) Air Temperature ( C) Solar Radiation (W/m 2 ) Wind Speed (m/s) w s w s w s w s w s Morning Midday Evening Mean RH (%) Table 5.4 provides a summary of the measured microclimatic conditions in the Phoenix sites in summer and winter. In winter, there was a little difference in the mean air temperature between the midday and the evening, 24 C and 23 C respectively. However, lower mean air temperature, 11 C, was measured in the mornings. In summer, the highest mean air temperature, 42 C, was measured in the midday period, with a small difference compared to the mean temperature measured in the evening. The mean air temperature which was measured in the morning period was 34 C. As one may expect, this is slightly lower than the other two periods but still high. 87
102 Chapter 5 Descriptive analysis Solar radiation levels varied over the three periods of measurements. They reached the maximum during the midday period, W/m² in winter and summer respectively. On the other hand, solar radiation levels declined in the evening, W/m² in winter and summer respectively. This pattern could influence the use of the space so that fewer people are expected to be present during a mid-summer day when the air temperature is high i.e. 42 C. Table 5.4 also shows higher wind speed in summer compared to winter, with more wind during midday and in the evening. The table also shows that in winter, relative humidity was around 50% in the morning and decreased to 20% as the temperature rose in the middle of the day and reached 25% in the evening. In summer, on the other hand, relative humidity was around 32% in the morning then decreased to around 22% the middle of the day and stayed constant during the rest of the day. Higher levels of relative humidity were expected here because of the existence of water elements in the Phoenix sites. Figures show scattered plots of the measured values of air temperature, solar radiation and relative humidity in Phoenix as a function of time of the day Figure 5.15 A daily profile of air temperature as a function of time in Phoenix survey 88
103 Chapter 5 Descriptive analysis Figure 5.16 A daily profile of solar radiation levels as a function of time in Phoenix survey Figure 5.17 A daily profile of relative humidity levels as a function of time in Phoenix survey 89
104 Chapter 5 Descriptive analysis Discussion of microclimatic profile The difference in solar radiation values, particularly during the midday and other periods was quite noticeable; as might expected, solar radiation was much higher during the middle of the day. The combination of high air temperatures and high solar radiation levels can lead to uncomfortable thermal conditions in summer. The relative humidity levels were low and stable throughout the day in winter and in summer in Marrakech. In Phoenix, however, higher values of relative humidity were measured, particularly in the morning in winter. This was expected because of the presence of water elements in the Phoenix sites. Wind speed peaked during midday in winter in Marrakech, while it reached the maximum in the evening in summer. In Phoenix, on the other hand, higher wind speed was measured in summer compared to winter with more wind during midday and in the evening. The breeze in summer evenings in conjunction with the relatively lower air temperatures and solar radiation levels makes evenings the most pleasant thermal conditions of the day. 90
105 Chapter 5 Descriptive analysis 5.4 Evaluation of thermal sensation Comparing the environmental variables in the two cities The measured environmental variables were tested to check if they are different or similar in the two cities in summer and winter. This will help in understanding the reason why the two cultural groups have evaluated their thermal environment differently. Independentsample t-test of difference was used for this purpose; results are shown in Table 5.5. By comparing the means of air temperature, solar radiation, wind speed, and the relative humidity, it can be seen that, in winter, significant differences were found between the two cities in the solar radiation intensity S and the relative humidity RH. However, the differences in S and RH between the two cities were weak. Eta squared 14 (η 2 ), the effect size associated with t-test(jaccard 1990), of the S and RH were calculated, η 2 (S) =0.09 and η 2 (RH) = Eta squared values for both S and RH indicate a weak association according to Table 4.4 (see chapter 4 section 4.8.2). In summer, significant differences were found between the two cities in wind speed and air temperature. However, the effect size associated with wind speed is weak, η 2 (Ws) = 0.07 which indicates a weak difference relationship according to Table 4.4. The effect size of t-test associated with air temperature was strong η 2 (T air) = This means that the only significant difference in the environmental variables measured in the two cities in was in air temperature in summer only. Yet this difference was as little as 3 C as shown in Table 5.5. By considering the t-test results, it can be concluded that no significant differences were found between the measured environmental variables in Marrakech and Phoenix. The only exception was in air temperature in summer where the difference was small. 14 Eta squared η 2 is the effect size (strength of association) associated with the t-test η²= t² t² + df where (df = n1 + n2 2), and n1, n2 are the populations of two groups. 91
106 Chapter 5 Descriptive analysis Table 5.5 The t-tests of environmental variables in Marrakech and Phoenix (a) in winter and (b) in summer a- In winter variable Marrakech Phoenix mean SD mean SD T air ( C) t-test eta 2 S (W/m 2 ) ** 0.09 Ws (m/s) RH (%) * 0.02 * p-value <0.05, ** p-value <0.01 b- In summer variable Marrakech Phoenix mean SD mean SD t-test T air ( C) ** 0.21 S (W/m 2 ) Ws (m/s) ** 0.07 RH (%) ** p-value < Comparing the subjective thermal evaluation in the two cities vi. The thermal sensation To examine how the thermal conditions are evaluated by people in two different cities in the hot arid climate, the subjective thermal evaluations of the two groups, in Marrakech and Phoenix, were compared against each other. The Thermal Sensation Vote (ASV) used as a dependent variable and the two cultural groups as the independent variable as shown in Table 5.6. Chi-square (χ²) test of independence was conducted to compare the thermal sensation vote (ASV) of Marrakech and Phoenix participants. Table 5.6 shows dependant (DV) and independent (IV) variables were used in Chisquare test DV IV ASV Marrakech Phoenix 92
107 Chapter 5 Descriptive analysis Table 5.7 presents the results of Chi-square test of ASV.vote of participants of Marrakech and Phoenix. In winter, the test results are χ² (4, N=249) = 33.73, p<0.001 with the effect size Somers d was In summer, Fisher Exact test, defined above, was used to meet the Chi-square test assumption requirements; the test results are χ² (4, N=182) = 9.37, p<0.05 and the effect size Somers d of According to Table 4.3, the effect size of association between ASV and the participants in the two cities was weak in both seasons. In other words, Chi-square test shows a weak association between the actual thermal sensations of Marrakech and Phoenix participants. Therefore, based on these statistics, it may be concluded that people in the Marrakech group evaluated their thermal environment in a different way to the Phoenix group. By considering the conclusion of the previous section that no significant differences were found between the main environmental variables measured in Marrakech and Phoenix for the purpose of this study, thus it can be concluded that the reason why people in Marrakech and in Phoenix evaluated their thermal conditions differently is not necessarily due to differences in the environmental variables between the two cities. Other non-environmental factors may influence this relationship. 93
108 Chapter 6 Thermal sensation and the use of urban public spaces Table 5.7 Results of Chi Square test between cultural groups and actual sensation vote (ASV) Chi-Square Test Measurement of association (effect) Variables N Tables No. Pearson Chi-Square (χ 2 ) a Fisher s Exact Test b Cramer s V Somers d IV DV Value DF Sig. Value Exact Sig. Value Sig. Value Sig. Marrakech Phoenix ASV winter 249 2x summer 182 2x a: Assumption of Chi-square met i.e. less than 25% of the cells have expected count less than 5. b:.fisher s Exact test have been used only when the assumption of Chi-square is violated.
109 Chapter 5 Descriptive analysis Figure 5.18 shows percentage frequency distribution of actual thermal sensation votes (ASV) in Marrakech and Phoenix. As can be seen from the figure, the percentage of participants who reported feeling neither cool nor warm (ASV=0) and those who reported feeling cool (ASV=-1) is different in each city. In fact, as many as 40% of Marrakech participants reported feeling thermally neutral (ASV=0) compared to only 20% in Phoenix. Moreover, less than 10% of Marrakech participants felt cool (ASV= -1) compared to 20% in Phoenix. Figure 5.19 shows the percentage frequency distribution of thermal preference votes in Marrakech and Phoenix. It can be seen in the figure that the largest percentage of participants in Marrakech wanted to maintain their thermal conditions (50%). On the other hand, the largest percentage of participants in Phoenix wanted to be cooler (45%). However, both groups have more than 40% of their participants wanting to be cooler. The 20% who wanted to be warmer in Phoenix may be due to colder temperature in early mornings in winter. The effect of culture appears when twice as many people in Marrakech (40%) felt thermally neutral compared to Phoenix (20%); almost 50% of Marrakech participants preferred to maintain their thermal condition during the interviews. On the other hand, three times as many people in Phoenix (21%) felt cooler than those in Marrakech (7%); nearly 50% of those in Phoenix preferred to be cooler. Despite having 40% of participants feeling neutral towards their thermal environment in Marrakech and 20% in Phoenix, there were 50% of the participants in Marrakech and 30% in Phoenix who preferred to maintain their thermal conditions. This means that 10% of those who preferred to maintain their thermal conditions were feeling warmer or cooler than neutral, and suggesting the possibility of adaptation occurrence. By considering the finding that no significant differences were found between the main environmental variables measured in Marrakech and Phoenix for the purpose of this study, thus it can be concluded that the reason why people in Marrakech and in Phoenix evaluated their thermal conditions differently is not necessarily due to differences in the environmental variables between the two cities. Other non-environmental factors may influence this relationship. It was found that the percentage of participants who prefer to maintain their thermal conditions was higher than the percentage of those who were feeling neutrally comfortable. This means that some of the participants, who were feeling cooler or warmer than neutral, were satisfied with their thermal conditions and this endorses the occurrence of adaptation. 95
110 Percentage (%) Percentage of thermal sensation vote Chapter 5 Descriptive analysis 50% 40% 43% Marrakech Phoenix 30% 32% 28% 24% 20% 21% 20% 18% 10% 4% 7% 0% 2% Actual thermal sensation vote Figure 5.18 Percentage frequency distribution of actual thermal sensation votes (ASV) in Marrakech and Phoenix. (-2=cold, +2=hot) 100% 90% 80% a. City = Marrakech a. City = Phoenix 70% 60% 50% % 30% 20% 10% % cooler no change warmer ThermalPreference Figure 5.19 Percentage distribution of votes on the thermal preference scale in Marrakech and in Phoenix 96
111 Chapter 5 Descriptive analysis vii. The wind sensation Table 5.8 presents the results of Chi-square test between the two cities and wind speed. The test results are χ² (4, N=431) = 71.68, p<0.001 with the effect size Somers d was According to Table 4.3, the effect size of association between wind sensation and the two cities is weak. The t-test results mentioned in section indicate weak differences in wind speed measurements between the two groups in Marrakech and Phoenix during this study. Therefore, it may be concluded that people from the two groups have different evaluations of wind sensations. Table 5.8 Results of Chi Square test between cultural groups and wind sensation Chi-Square Test Variables Pearson Chi-Square (χ 2 ) a Fisher s Exact Test b Somers d IV DV N Value DF Sig. Value Sig. Value Sig. Two cultural groups Marrakech vs. Phoenix wind a: Assumption of Chi-square met i.e. less than 25% of the cells have expected count less than 5. b:.fisher s Exact test have been used only when the assumption of Chi-square violated. Figure 5.20 shows the percentage distribution of participant votes on the wind sensation scale in Marrakech and Phoenix during the two seasons, (-2) is very windy and (2) is calm. As can be seen, the largest percentage of participants in Marrakech, around 40%, felt the wind was neutral i.e. neither windy nor calm. Alternatively, the largest percentage of participants in Phoenix, around 50%, described it as calm. This explains the values presented in Table 5.8 that the association between wind sensation and the cultural groups is weak and therefore, the wind sensation is differently evaluated by people in Marrakech and in Phoenix. It is interesting, however, to find that the wind preferences of participants are similar in both cities as shown by Figure The majority of people in both groups preferred no change in the wind situation (60%) and almost (30%) wanted more wind. In general, in hot arid climates air temperatures are relatively high most of the day and particularly higher in summer (Table 5.5b). Therefore, a strong wind associated with such high temperatures may cause a reverse wind chill effect. Thus, individuals would feel warmer than what the actual air temperature is. This might be applicable in Phoenix in summer where the mean air temperature is 3 C higher than in Marrakech (Table 5.5). Hence people in Phoenix may prefer calm wind when air temperatures are too high. In Marrakech, people wear clothes that cover most of their bodies. Thus, people in Marrakech can be less affected by the variation of wind speed in moderated air temperatures. 97
112 Chapter 5 Descriptive analysis 50% 50% Percentage of wind sensation vote Percentage (%) 40% 30% 20% 10% 15% 31% 12% 41% 20% Marrakech Phoenix 18% 11% 1% 0% Wind sensation vote 1% Figure 5.20 Percentage distribution of votes on the wind sensation scale in Marrakech and in Phoenix (1=calm, 5=very windy) 100% 90% 80% Marrakech Phoenix 70% 60% % 40% 30% % 10% % more wind no change less wind Wind preference Figure 5.21 Percentage distribution of votes on the wind preference scale in Marrakech and in Phoenix 98
113 Chapter 5 Descriptive analysis viii. The humidity sensations Table 5.9 presents the results of the Chi-square test between participants in the two cities and the relative humidity. The test results are χ² (4, N=431) = 23.64, p<0.001 with the effect size of Somers d being According to Table 4.3, the effect size of association of the relative humidity between participants in the two cities is weak. Figure 5.22 shows that more participants felt dry in Phoenix (40%) compared with Marrakech (20%). In fact Table 5.5A (in section 6.3.1) shows a significant difference in RH between the two cities in winter; Marrakech has a higher relative humidity values. In addition to that, the effect of trees and shaded areas in Al Koutoubia Park, where most participants in Marrakech were observed during the noon time, may explain why fewer people felt dry in Marrakech. Table 5.9 Results of Chi Square test between cultural groups and humidity sensation Chi-Square Test Variables Pearson Chi-Square (χ 2 ) a Fisher s Exact Test b Somers d IV DV N Value DF Sig. Value Sig. Value Sig. Two cultural groups Marrakech vs. Phoenix Humidity a: Assumption of Chi-square met i.e. less than 25% of the cells have expected count less than 5. b:.fisher s Exact test have been used only when the assumption of Chi-square violated. Percentage of Humidity sensation vote 50% 40% 30% 20% 10% 0% Marrakech Phoenix 38% 31% 28% 24% 20% 18% 16% 16% 8% 2% Humidity sensation vote Figure 5.22 Percentage distribution of votes on the humidity sensation scale in Marrakech and in Phoenix (-2 =Damp, +2=Dry) 99
114 Chapter 5 Descriptive analysis 5.5 The relationship between the microclimatic parameters and (ASV) This section aims to define the relative contribution of heat-balance parameters (environmental parameters) to the thermal perception of subjects in an outdoor space in hot arid climate. Two steps were followed to find which environmental parameters had strong influence on thermal comfort in the two cities. First, a correlation analysis was carried out between ASV and the environmental parameters. Second, correlated environmental parameters with ASV were selected for further analysis using ordinal regression. The ordinal regression was used because the actual sensation vote ASV is an ordinal variable The correlation analysis: Table 5.10 and Table 5.11 show the results of correlation analysis between ASV and the environmental parameters in Marrakech and Phoenix respectively. It can be seen that T g, T air, R H, W S are correlated with ASV in both cities. Therefore, these variables may be analysed by using the ordinal regression analysis. The globe temperature T g is used as an indicator of solar radiation in addition to air temperature. Moreover, T g has the property of reacting to the environment in much the same way as a human occupant (Nicol 2008). Therefor T g, RH, W s were used in the ordinal regression. It is interesting to find that the wind speed is negatively correlated with ASV in Marrakech and positively correlated with ASV in Phoenix. A possible explanation for this finding is likely related to the difference in air temperatures between the two cities in summer (section 5.4.1). Air temperature values measured in Phoenix were higher that measured in Marrakech. Therefore, in summer, wind speed could have a cooling effect in Marrakech so that a positive wind sensation has a moderate effect on ASV vote. However, in Phoenix, a positive wind sensation vote is likely to associate with a higher ASV because of the heating effect of wind in such higher air temperatures. 100
115 Chapter 5 Descriptive analysis Table 5.10 Correlation analysis between ASV and other environmental and personal parameters in Marrakech Marrakech ASV Tg Tair Rh Ws Pearson Correlation.435 **.420 ** ** -.54* Sig. (2-tailed) N ** Correlation is significant at the 0.01 level (2-tailed). *Correlation is significant at the 0.05 level (2-tailed). Table 5.11 Correlation analysis between ASV and other environmental and personal parameters in Phoenix Phoenix ASV Tg Tair Rh Ws Pearson Correlation.725 **.740 ** **.153* Sig. (2-tailed) N ** Correlation is significant at the 0.01 level (2-tailed). *Correlation is significant at the 0.05 level (2-tailed). 101
116 Chapter 5 Descriptive analysis ASV model for Marrakech Table 5.12 shows the outcome of the ordinal regression to predict the criterion variable (ASV), for data collected in Marrakech, from the explanatory variables which included: globe temperature, wind speed, relative humidity, clothing insulation and metabolic rate. As can be seen, there are three significant variables: globe temperature (p<.001), wind speed (p<.05), and the relative humidity (p<.05); these accounted for almost 23% of the variation in the actual sensation vote (ASV), However, R²= 0.23 indicates weakness in the ability of the predicted model to fit that data. By comparing Wald values for these variables (predictors), globe temperature T g (Wald= 14.4, p<.001) is the most important predictor that influences the actual thermal sensation votes of Marrakech participants followed by wind speed Ws (Wald= 6.86, p<.05). Wind speed and relative humidity were found to be significant in predicting the ASV; however, they have less influence on the ASV compared with T g. Wald values of Ws and RH were: and respectively. Thus, both wind speed and relative humidity were negatively related to the actual thermal sensation votes. The outcome model is presented in equation (1) ASV Marrakech= 0.11T g-0.71ws-0.02rh R²= 0.23 (1) 102
117 Chapter 5 Descriptive analysis Table 5.12 Logistic regression statistics and best fit model to predict ASV using environmental and personal data from Marrakech sites Ordinal Regression (Logit) (a) Dependent variable : ASV Model Fitting Goodness-of-Fit R squared N Chi-Square df Sig. Chi-Square df Sig. Cox and Snell Nagelkerke McFadden a: Marrakech Ordinal Regression (Logit) (a) Location Test of Parallel Lines (b) IV a Estimate (B) Wald df Sig Chi-Square df Sig. T g Ws RH Clo Met a: DV: ASV b: The null hypothesis states that the location parameters (slope coefficients) are the same across response categories. c: Assumptions of Logit Regression met 103
118 Chapter 5 Descriptive analysis ASV model for Phoenix Table 5.13 shows the outcome of the ordinal regression to predict the criterion variable (ASV), for data collected in Marrakech, from the explanatory variables. As can be seen, there are three significant variables: globe temperature (p<.001), wind speed (p<.001), and the relative humidity (p<.05); these accounted for almost 60% of the variation in the actual sensation vote (ASV), (Cox and Snell R²= 0.59). By comparing Wald values for these variables (predictors), globe temperature T g (Wald= 50.66, p<.01) is the most important predictor that influences the actual thermal sensation votes of Phoenix participants, followed by wind speed W s (Wald= 11.05, p<.01) which is negatively related to the actual thermal sensation votes. Relative humidity is found to be significant in predicting the ASV; however, it has less influence on the ASV compared with T g. The Wald value of RH was 6.82 and it is negatively related to the actual thermal sensation votes. The outcome model is presented in equation (2). ASV Phoenix= 0.30 T g -0.89Ws+0.07RH R²= 0.58 (2) Globe temperature is the most important predictor of thermal sensation in Marrakech and Phoenix, T g marrakech (wald=14.4, p<.001), T g Phoenix (wald=50.4, p<.001). Since T g combines the effect of both solar radiation and air temperature, its influence suggests the importance of solar radiation intensity together with air temperature. Although, air temperature is difficult to mitigate in the outdoor settings, solar radiation can be mitigated by design and landscaping, for example, providing shade and trees that can be used as shelters from sun light when air temperature is high, and it should allow the sun light in winter when air temperature is low. Environmental variables such as air temperature and solar radiation, therefore, could have great impact on the use of the outdoor spaces in the hot arid climate, and may determine the number of people and activities in them. 104
119 Chapter 5 Descriptive analysis Table 5.13 Logistic regression statistics and best fit model to predict ASV using environmental and personal data from Phoenix sites Ordinal Regression (Logit) (a) Dependent variable : ASV Model Fitting Goodness-of-Fit R squared Chi- Chi- Cox and N df Sig. df Sig. Nagelkerke McFadden. Square Square Snell a: Phoenix Ordinal Regression (Logit) (a) Location Test of Parallel Lines (b) IV a Estimate (B) Wald df Sig Chi-Square df Sig. T g Ws RH Clo Met a: DV: ASV b: The null hypothesis states that the location parameters (slope coefficients) are the same across response categories. c: Assumptions of Logit Regression met 105
120 Chapter 5 Descriptive analysis 5.6 Conclusions The sample profiles of participants as well as the microclimatic profile in Marrakech and Phoenix were described. Only participants, who were sitting or standing, the optional activities, were interviewed. Moreover, only local individuals were considered in interviews; tourists and temporary visitors were excluded from analysis to ensure that the sample represents the local culture of the studied areas. Cultural groups in this study are defined as two groups of participants visiting Marrakech and the Phoenix open spaces. The two groups were considered as living in two different cultures. The main reason for participants, in both cities, to visit the outdoor space was for enjoyment and going out. Time spent by each cultural group will be presented and discussed later in this study. Participants in Phoenix were engaged in activities that require motion such as walking and running. On the other hand, such activities were minimal in Marrakech where the majority of participants were seated. This is likely to be due to two factors: the design features of the outdoor space and the existing social habits and rules. The difference between solar radiation values, particularly during the middle of the day and other periods, was quite noticeable in both seasons; solar radiation was much higher during the middle of the day in both cities. There was a clear difference in the mean air temperatures between winter and summer in both cities. The breeze in summer evenings in conjunction with the relatively lower air temperatures and solar radiation levels make evenings the most pleasant thermal conditions of the day. This investigation examined how thermal conditions are evaluated by people in different cultures in the hot arid climate. The findings suggests that people in Marrakech group evaluated their thermal environment differently compared to Phoenix group, and the reason is not necessarily due to differences in the environmental variables between the two cities. Other factors such as thermal adaptation may influence this relationship. In fact, it was found that the percentage of participants who prefer to maintain their thermal conditions was higher than those who were feeling neutrally comfortable. In other words, some participants, who were feeling cooler or warmer than neutral, were satisfied with their thermal conditions and this implies the occurrence of thermal adaptation. The relationship between the environmental variables and the actual thermal sensation votes of participates was examined. Globe temperature T g is appeared to be the most important predictor of thermal sensation in Marrakech and Phoenix. This also suggests the importance of solar radiation intensity together with air temperature which could have 106
121 Chapter 5 Descriptive analysis an excessive impact on the use of the outdoor spaces in the hot arid climate, and may determine the number of people and activities in them. Although, air temperature is difficult to mitigate in the outdoor settings, solar radiation can be mitigated by design and landscaping. For example, providing shades and trees that can be used as shelters from sun light with air temperature days, and it should allow the sun light in winter with low air temperature days. 107
122 Chapter 6 Thermal sensation and the use of urban public spaces 6 Thermal sensation and the use of public spaces 6.1 Introduction This chapter presents and discusses how people from different cultures and who live in similar climatic conditions, evaluate the outdoor thermal environment, and use urban public spaces. In a previous study that ]investigated the influence of culture and\environmental attitude on participants thermal assessment of a square in Sweden and Japan, Knez and Thorsson (2006) defined cultural groups as two groups of participants visiting the Swedish and the Japanese square, respectively. The two groups were considered as living in two different cultures. Culture can be defined as The system of information that codes the manner in which people in an organized group, society or nation interact with their social and physical environment. (Reber 1985). Therefore, Knez and Thorsson (2006) assumed in their study that different geographical/climatic zones can also be defined as different cultures. Therefore, in the current study, the two groups of participants who were visiting the open spaces in the city of Marrakech, Morocco are representing one culture and those who were visiting the open spaces in the city of Phoenix, USA are representing another culture, as described in Chapters 4 and 5. The results presented in this chapter help to understand the following: 3. Whether the thermal preferences of subjects in hot arid climates can be explained by heat-balance indices alone; 4. the thermal comfort requirements in the hot arid climate of Marrakech and Phoenix including, neutral temperatures, and preferred temperatures. 5. the use of outdoor space by different cultures in the hot arid climate. 6. the comfort requirements of different social groups in the hot arid climate by comparing the neutral temperatures, preferred temperatures and use of space. 6.2 Evaluating the physiological approach In order to find out if the thermal preferences of subjects in hot arid climates can be explained by physiological approach alone, subjective thermal sensations need to be compared with a heat-balance model. The thermal sensation of different outdoor spaces within the hot arid climate of Marrakech and Phoenix were examined. People were asked to evaluate their thermal sensation at the time of interview on a five-point scale, varying from hot to cold (Actual Sensation Vote, ASV). This was then compared to Fanger s 108
123 Chapter 6 Thermal sensation and the use of urban public spaces model 15, the theoretical Predicted Mean Vote (PMV) 16. This comparison was performed in previous studies in different climates. For example, in a study in the northern latitude,thorsson et al. (2004a) used PMV to assess thermal comfort of participants. Moreover, Nikolopoulou et al. (2001) in a study in the temprate climate used PMV to reveal an evident discrepancy with ASV. Both studies showed that people s expectations might influence their thermal evaluation of their environment. Therefore, the authors concluded that steady-state models such as PMV may not be ideal for assessing outdoor thermal comfort. PMV defined by ISO7730 (2005). The PMV model predicts thermal sensations as a function of six parameters: air temperature, mean radiant temperature, air velocity, humidity, clothing and activity. The first four environmental parameters were measured during the interviews. Clothing levels were observed and registered in the questionnaire form, while the values of thermal insulation of clothing were later estimated according to ISO7730 (2005). Metabolic rates were also estimated from the observed activities, according to the same standard document ISO7730 (2005). The Percentage frequency distribution for PMV and ASV of the interviewees has been calculated for both cities and the different seasons and is presented in Figure 6.1. It is clear that there is a great inconsistency between the ASV and PMV curves; around 60% of the PMV curve falls outside the theoretical comfort conditions (-1 to +1), around 40% feel hot and 20% feel cold. However, the ASV curve is very different and shows that only 20% fall outside the comfort conditions mainly in the hot region (+2). The graph also illustrates that the largest percentage of participants who have voted within the comfort conditions (-1 to +1), have voted for neutrality or for the warm part of the scale (0 and +1). Conversely, the theoretical curve PMV shows that the largest percentage of participants who voted within the predicted comfort conditions (-1 to +1), falls within the cool (-1) and neutral (0) part of the scale. This result indicates that the thermal preferences of subjects in hot arid climates cannot be explained by heat-balance indices alone. Nikolopoulou et al. (2001) in their study that took place in the temperate climate of Cambridge found that purely physiological approach is inadequate to characterise thermal comfort conditions outdoors. The current result proves the previous finding is true in the hot arid climate of Marrakech and Phoenix. In both studies, more than 50% of people voted for the warm part of the scale (Figure 6.2). 15 See section More about PMV can be found in Chapter 2 109
124 Percentage frequency (%) Chapter 6 Thermal sensation and the use of urban public spaces 50% 40% ASV PMV 30% 20% 10% 0% Thermal sensation scale Figure 6.1 Percentage frequency distribution of both actual and predicted thermal sensation votes Figure 6.2 Percentage frequency distribution for PMV and ASV in Cambridge (Nikolopoulou et al. 2001). 110
125 Chapter 6 Thermal sensation and the use of urban public spaces 6.3 Thermal neutrality and thermal sensitivity This study raised the question of whether there are any differences in the thermal comfort requirements, such as thermal sensitivity and thermal neutrality, between different cities in the hot arid climate. In an attempt to answer this question, two groups representing two different cultures i.e. American and North African were selected from Phoenix and Marrakech. More details about these groups can be found in chapter 4 (Methodology). The next step is to find and compare the thermal neutrality and sensitivity for each group. Thermal neutrality is defined as the temperature which gives a neutral thermal sensation neither warm nor cool in the environment (Humphreys 1975) or the thermal index value (temperature) corresponding with a maximum number of building occupants voting neutral on a thermal sensation scale (Brager 1998). The neutral temperature (T n) is the temperature at which subjects feel neither cool nor warm. The average neutral temperature has been used in thermal comfort research to study the effects of experience on respondents thermal perception such as in Lin (2009). Data collected from Marrakech and Phoenix was used to calculate the neutral temperatures to examine how people from different cities adjust to their thermal perceptions. De Dear and Brager (2002) and Hwang and Lin (2007) proposed using a bundle or a bin mean thermal sensation vote, rather than the individual actual votes to reduce individual differences. This can be done by gathering several votes that correspond with one or more T g degrees depending on the highest value of R 2 obtained. Table 6.1 lists mean thermal sensation responses of each three-degree increment of globe temperature; other studies such as Hwang and Lin (2007) used a one-degree increment. The three-degree increment was selected because it better fits the number of participants in this study i.e. the value of R 2 associated with three-degree increment is higher than that when using one or two-degree increment. Because of the significance of the globe temperature T g, as a predictor of the thermal sensation in the context of this study, it was therefore used as a thermal index to calculate the neutral temperature and examine the thermal sensitivity. The sensitivity of subject thermal sensations to T g was evaluated by examining the mean thermal sensation vote responses for each three-degree interval, plotted in Figure 6.3. The fitted regression lines for subject sensation versus T g in the two cities are: In Marrakech: ASV = T g (R 2 = 0.96) (1) In Phoenix: ASV = T g (R 2 = 0.96) (2) 111
126 Actual thermal sensation vote Chapter 6 Thermal sensation and the use of urban public spaces Table 6.1 Mean thermal sensation vote for each three-degree increment of T g (cultural groups) Tg Bin Marrakech Number of Respondents Mean ASV Phoenix Number of Respondents Mean ASV Marrakech Phoenix Linear (Marrakech) Linear (Phoenix) y = x R² = Tn Mar = Tn Ph =24.34 y = x R² = Tg ( C) Figure 6.3 Neutral temperatures calculated using linear model 112
127 Chapter 6 Thermal sensation and the use of urban public spaces Another method used to calculate the neutral temperature, which is employed for advanced analysis in thermal comfort studies, is the probit regression (Ballantyne et al. 1977), As discussed in section (4.8.4) in chapter 4 probit is employed to identify the changing points of a binary response variable, in relation to a stimulus variable. Regarding the ASV as the basis of a binary response variable, this methodology seeks the temperature at which a certain percentage, 50% of the participants in this case, are on the verge of changing their ASV to the next higher value (Nikolopoulou and Lykoudis, 2006). The participants were divided into two groups according to their actual thermal sensation vote. One group includes participants who voted hot, warm, and half the number of participants of those voted neither cool nor warm ; this group is called warmer than neutral. The other group includes the participants who voted cold, cool, and half the number of participants of those voted neither cool nor warm ; this group is called cooler than neutral. The percentages of those who voted warmer than neutral were calculated for each 3 C T g bin (the calculation could equally be done based the percentages of the other group). The results of the probit analysis are presented in the curves shown in Figure 6.4 for Marrakech and Figure 6.5 for Phoenix. The level of 50% probability of transition, i.e. the neutral temperature, is 21.8 C in Marrakech (Figure 6.4) and 24.0 C in Phoenix (Figure 6.5). Both methods, the linear regression and probit analsyis, provide similar results, which gives confidence in the accuracy of the calculated neutral temperature. 113
128 Percentage of participants voting "warmer than neutral" Percentage of participants voting "warmer than neutral" Chapter 6 Thermal sensation and the use of urban public spaces Marrakech 100% 90% 80% 70% 60% 50% 40% 30% 20% 10% 0% Probit model-unacceptable due to warmth Tn=21.8 C Tg ( C) Figure 6.4 Probit regression model of thermal neutral temperature (Marrakech) Phoenix 100% 90% 80% 70% 60% 50% 40% 30% 20% 10% 0% Probit model-unacceptable due to warmth Tn=24.0 C Tg ( C) Figure 6.5 Probit regression model of thermal neutral temperature (Phoenix) 114
129 Chapter 6 Thermal sensation and the use of urban public spaces From Equations (1) and (2), both thermal sensitivity and level of adaptation can be investigated. The value of the coefficeint of determination was R²= 96 for both equations (1) and (2) and indicate a high significance between the subject thermal sensations ASV and the globe temperature T g, which supports the finding the ordinal regression analysis presented above. The slope of fitted lines indicates the thermal sensitivity of subjects; the lower the value of the slope the less thermal sensitive the participants are, as reported by Hwang and Lin (2007). The slope value corresponds to C T g per sensation unit in Marrakech, and the slope value 0.112, corresponds to 8.92 C T g per sensation unit in Phoenix. This means that people in Marrakech were thermally comfortable at a wider range of T g. In other words, the participants in Phoenix were more sensitive to air temperature variations and solar radiation than the participants in Marrakech. A possible explanation of why people in Phoenix were found to be more thermally sensitive, might be that the majority of participants were indoors just before coming to the open space, considering that most indoor spaces in Phoenix are air conditioned including dwellings, shops, and cafes; as well as cars and public transportation. On the other hand, most indoor spaces in Marrakech are naturally ventilated. In fact, 86% of participants in Phoenix spaces were indoors just before visiting the outdoor space where they were interviewed compared to 60% in Marrakech Figure 6.6. coming from indoors coming from outdoors 100% 90% 80% 70% 60% 50% 40% 30% 20% 10% 0% 58% 42% Marrakech 86% 14% Phoenix City Figure 6.6 Percentage of participants coming from indoors/outdoors just before the interview Moreover, participants in Phoenix were actually found to spend longer time in air conditioned spaces just before coming to the open space. In fact, 70% of participants in Phoenix were in an air conditioned space 60 minutes or less before the interview took 115
130 Chapter 6 Thermal sensation and the use of urban public spaces place in summer. In Marrakech, however, only 12% of participants were in an air conditioned space 60 minutes or less before the interview Table 6.2. Table 6.2 Last time the participants were in an air-conditioned space Time (mins) Marrakech Phoenix Frequency Percent (%) Cumulative (%) Frequency Percent (%) Cumulative (%) <15 0 0% 0% 10 17% 17% % 5% 13 22% 40% % 9% 5 9% 48% % 12% 14 24% 72% % 3 5% > % 13 22% Total % % The neutral temperatures (T n) can be calculated by using equations (1) and (2) when ASV= 0. Therefore, the neutral temperatures for Marrakech and Phoenix are C and C T g, respectively. As can be seen, the neutral temperature of Marrakech groups is around 2.30 C lower than that in Phoenix, which is likely due to the difference in clothing insulation between the two groups that is discussed in section The results above show differences in thermal sensitivity and neutrality between the two cultural groups in Marrakech and Phoenix. This finding shows that the thermal requirements of people in Marrakech and Phoenix must be considered separately despite the similarity in the prevailing climate in both locations. 6.4 Preferred temperature The preferred temperature is the temperature that people actually want, compared to the neutral temperature in which people feel comfortable. Comparing preferred temperature values of two different groups can help in exploring differences in their thermal perception or similarities. The smaller difference between the neutral and preferred temperature for a group of people relates to how adapted they are to the thermal environment. The preferred temperature and the neutral temperature of each of the two groups were compared as well. 116
131 Percentage of sample preferring warmer/cooler Chapter 6 Thermal sensation and the use of urban public spaces A probit regression analysis (Ballantyne et al. 1977) was used to calculate the preferred temperatures of participants in Marrakech and Phoenix. In each city, participants were divided into two groups according to their thermal preference vote: want warmer and want cooler. The percentages of each of these groups were calculated for each 2 C T g bin (corresponding with the highest value of R 2 ) using a logistic curve model with the probit function.the preferred temperature is presented by the point at which both models intersect. Figure 6.7 shows that the preferred temperatures for Marrakech and Phoenix participants were and C T g respectively, with a difference of 2.80 C T g, confirming that thermal requirements of people in Marrakech and Phoenix should be considered separately. The difference in preferred temperatures between the two groups is indicates the occurrence of thermal adaptation. Therefore, comparing the preferred temperatures with the neutral temperature could explain which group is better adapted to its environment. The differences between neutral and preferred temperatures in Marrakech and Phoenix are 0.17 and 0.66 C T g respectively. The small difference between the neutral temperature and the preferred temperature in Marrakech, compared to that in Phoenix, indicates that Marrakech participants were better adapted to their thermal environment. 100% Preferred temperatures Prefer warmer-phoenix Prefer cooler-phoenix Prefer warmer-marrakech Prefer cooler-marrakech 80% 60% 40% 20% C C 0% Tg ( C) Figure 6.7 Probit regression models for thermal preferred temperature 117

132 Chapter 6 Thermal sensation and the use of urban public spaces 6.5 Behavioural and psychological adaptation The thermal adaptation theory suggests that people take behavioural actions to make them feel thermally comfortable. Nikolopoulou and Steemers (2003) identified three levels of thermal adaptation: physical, physiological, and psychological. It was also concluded that the relation between physical environment and psychological adaptation is complementary rather than contradictory. This complement could influence the use of urban open spaces. Therefore, this section investigates key adaptive measures that influence thermal sensation in the hot arid climate of Marrakech and Phoenix Clothing as a factors affect thermal evaluation outdoors An important and natural behaviour to improve thermal comfort is clothing adjustments. It was observed that people in Marrakech tend to wear clothes that cover most of their bodies in winter and in summer for both genders, and this is possibly due to cultural rules (Figure 6.8). In Phoenix, on the other hand, people have fewer cultural restrictions on what they wear. Therefore, they wear lighter clothes particularly in summer e.g. T-shirts, shorts, short skirts, etc (Figure 6.9). Figure 6.8 Winter clothing in Marrakech 118

133 Chapter 6 Thermal sensation and the use of urban public spaces Figure 6.9 Winter clothing in Phoenix (left photo by Mike Kelley is licensed under CC BY-NC-SA 2.0) 119
134 Chapter 6 Thermal sensation and the use of urban public spaces Figure 6.10 shows the clothing insulation values as a function of air temperature in Marrakech. It can be observed clearly that there are two separate groups of values; one of them is under 31 C and represents winter participants and the other one is above 31 C and represents summer participants. As can be seen, in winter, participants maintained a high clothing insulation value between when the air temperature was between C. In summer, the clothing insulation values were around 0.4 clo and the air temperature range was between C. In Marrakech, people maintain a seasonal clothing insulation value which was almost always high in winter and moderate in summer. The minimum average value of clothing insulation in Marrakech was 0.35 clo at 38 C. Figure 6.11 shows the clothing insulation values as a function of air temperature in Phoenix. It can be seen that higher values corresponded to lower. For example, the clothing insulation values remained over 0.4 in winter when the air temperatures were below 25 C. The values remained under 0.35 clo when the air temperature exceeded 35 C. In Phoenix, people maintain a seasonal clothing insulation value which was almost always moderate in winter and low in summer. The minimum average value of clothing insulation in Marrakech was 0.35 clo at 38 C. The minimum average value of clothing insulation in Phoenix was 0.2 clo at 44 C. Figure 6.12 shows the clothing insulation levels for both groups in Marrakech and in Phoenix. As can be seen, the level of clothing insulation was significantly higher in Marrakech throughout the year. The mean value of clothing was around 0.70 clo in Marrakech compared with only 0.35 clo in Phoenix. The clo value in Marrakech was twice as much as the value in Phoenix. Figure 6.13 shows the clothing insulation levels of the two groups, in Marrakech and Phoenix, in winter and summer. In winter, the difference in clothing values between the two groups was the greatest. The average clothing insulation value in Marrakech in winter was twice as much as it was in Phoenix, 0.87 and 0.43 clo respectively. The difference in clothing insulation values between the two groups was also significant in summer. However, this difference was not as great as it was in winter. It was interesting to notice that the clothing insulation values of participants in Marrakech in summer was almost the same as it was for participants in Phoenix but in winter.. 120
135 clo clo Chapter 6 Thermal sensation and the use of urban public spaces Marrakech clo Linear (clo) y = x R² = Tair ( C) Figure 6.10 Clothing insulation as a function of air temperature (Marrakech) Phoenix clo Linear (clo) y = x R² = Tair ( C) Figure 6.11 Clothing insulation as a function of air temperature (Phoenix) 121
136 Chapter 6 Thermal sensation and the use of urban public spaces Clo Marrakech Phoenix Figure 6.12 Clothing insulation values of both groups in Marrakech and Phoenix Winter Summer Clo Marrakech Phoenix Figure 6.13 Clothing insulation values of both groups in Marrakech and Phoenix in winter and summer 122

137 Chapter 6 Thermal sensation and the use of urban public spaces Changing place as a factor affects thermal evaluation outdoors Since very little can be done to mitigate high air temperatures outdoors, people tend to maintain their thermal comfort by reducing the solar gain by moving to shade. Seeking shade is an action of adaptation that people may use to reduce the effect of direct solar radiation on their bodies in outdoor environments. Moving to shaded areas is not the only action observed during the study; using umbrellas is another form of adaptation that was seen during observations in Phoenix. Umbrellas were used by pedestrians and by people sitting in the open public space (Figure 6.14). Figure 6.14 The use of umbrellas as a way of adaptation during summer in Phoenix Figure 6.15 shows the averages of the total numbers of people, and the number of people were found in shade calculated for each 3 C of air temperature in Marrakech in winter. The average number of people was relatively high during winter. The average number of people was between 25 and 45. The maximum attendance occurred when the temperature was around 19 C. Moreover, the percentage of the number of people in shade was always more than 50% of the total number of people in the space. 123
138 Chapter 6 Thermal sensation and the use of urban public spaces Figure 6.16 shows the averages of the total numbers of people alongside the number of people were found in shade calculated for each 3 C of air temperature in Phoenix in winter. The average numbers of people varied during winter between 5 and 60. The number of people was increasing when the air temperature increased until it reaches 28 C and the maximum attendance occurred at this point i.e. when the temperature was around 28 C and dropped after that. Moreover, the percentage of people in shade was always less than 50% of the total. The exception was at 28 C where around 83% of the people in the Phoenix spaces were under the shade. Non-local visitors such as tourists preferred sitting in the sunlight in winter (Figure 6.17 and Figure 6.18). Conversely, local people in Marrakech tend to avoid sitting in the direct sunlight in winter. In fact, it seems that there is a belief among the people of Marrakech that winter sun is harmful. As regards summertime, the averages of the total numbers of people besides the number of people who were found in shade calculated for each 3 C of air temperature in Marrakech (Figure 6.19). It appeared that the average number of people was increasing between 28 C and 37 C and then dropped at 40 C. Second, the percentage of the number of people in shade was always more than 50% of the total number of people in the space. Figure 6.20 shows the averages of the total numbers of people alongside the population who were found in shade calculated for each 3 C of air temperature in Phoenix in summer. As can be seen, the number of people looks to be increasing with higher air temperatures. However, this is due to the high number of people were in Tempe Beach Park attending the water play area in the middle of the day when air temperatures were high. The number of people was increasing and the percentage of people who were in shade was less than 50% almost in all categories. Therefore, this can partly be explained by eliminating the effect of direct solar radiation, other factors may explain the high number of people who visited the places Phoenix. One of which could be the occurrence of social activities such as around water play areas or parties. 124
139 Number of people Number of people Chapter 6 Thermal sensation and the use of urban public spaces Marrakech winter Tair( C) Number of people Peope in shade Figure 6.15 Total number of people in Marrakech sites compared to the number of people in shade as a function of air temperature in Marrakech in winter Phoenix winter Total In shade Tair( C) Figure 6.16 Total number of in Phoenix sites compared to the number of people in shade as a function of air temperature in winter 125


140 Chapter 6 Thermal sensation and the use of urban public spaces Figure 6.17 Al Koutoubia Plaza in winter. Right: local people sitting in the shade. Left: tourists sitting in sunlight. Figure 6.18 Al Koutoubia Park in winter, local people sitting in the shade and a tourist in the sunlight. 126
141 Number of people Number of people Chapter 6 Thermal sensation and the use of urban public spaces Marrakech summer Total In shade Tair( C) Figure 6.19 Total number of people in Marrakech sites compared to the number of people in shade as a function of air temperature in Marrakech in summer Phoenix summer Total In shade Tair( C) Figure 6.20 Total number of people in Phoenix sites compared to the number of people in shade as a function of air temperature in summer 127
142 Chapter 6 Thermal sensation and the use of urban public spaces Drinking as a factor affecting thermal evaluation outdoors Consuming cold or hot drinks is one way to alter the metabolic rate as a behavioural action to make individuals feel thermally comfortable. As can be seen, almost 60% of participants in Phoenix consumed cold drinks as a measure to maintain their thermal balance and eventually their sensation of thermal comfort. On the other hand, only 30% of participants in Marrakech consumed cold drinks. Consumption of cool drinks to alter metabolic rate is considered as an action of coping with variable thermal comfort and according to Nikolopoulou and Steemers (2003) it is related to the long-term experience that people have gained through years of using similar spaces. This experience affects their expectations so that they get prepared for actions such as having cool drinks to alter the thermal stress when in the outdoor space. Since people in both cities Marrakech and Phoenix are expected to have such an experience, the difference in cold drink consumption shown in Figure 6.21 might be linked to the culture as well. It is unusual to see people, apart from tourists, in Marrakech sites holding or carrying a bottle of water or cold drink. On the other hand, it is typical for people in Phoenix sites to have water bottles not to mention ice creams and iced soft drinks. Consuming cold drinks in the sites investigated in this study is further evidence that adaptation was taking place to mitigate thermal condition. In addition, the difference in cold drink consumption between the two groups endorses the finding presented above and suggests that participants in Phoenix were better adapted to their thermal conditions compared with those in Marrakech. 128
143 Chapter 6 Thermal sensation and the use of urban public spaces Phoenix (summer) Marrakech (summer) 100% 90% 80% 70% 60% 50% 40% 30% 20% 10% 0% 58% 27% Cold drink consumption Figure 6.21 Percentage of participants who were drinking cold drinks in Marrakech and Phoenix in summer Expectations and Experience Past experience makes people expect the thermal environment in an urban space to be in a certain condition. These expectations sometimes do not match the actual conditions in an urban open space and therefore affect the thermal perceptions of users. This effect can be examined by comparing the neutral and the preferred temperatures; in addition to the time spent by participants in the outdoor space. Table 6.3 compares neutral and preferred temperatures calculated in sections (6.3) and (6.4). The difference found is 0.20 C and 0.65 C in Marrakech and Phoenix respectively. The small difference between the neutral and preferred temperatures indicates the possibility that people in Marrakech have better expectations of the thermal conditions in a given time of the year. 129
144 Average time of stay outdoors (minutes) Chapter 6 Thermal sensation and the use of urban public spaces Table 6.3 Neutral and Preferred temperature for both cites, Marrakech and Phoenix Neutral temperature T n ( C) Preferred temperature T pref ( C) The difference between Neutral and Preferred temperatures ( C) Marrakech Phoenix Weather expectation = yes Marrakech Weather expectation = no Phoenix Figure 6.22 Mean time (in minutes) spent in place as function of weather expectation The time spent in the outdoor space is another factor that might be influenced by expectation. Figure 6.22 compares the average time spent in the space in Marrakech and Phoenix by those who correctly pre-estimated the weather condition during the interview day and those who did not. It can be seen that the time spent in the space by the first 130
145 Chapter 6 Thermal sensation and the use of urban public spaces group was relatively longer in both cities. Thus, the results indicate that participants expectations probably affect the time they spent in the outdoor spaces. However, this finding cannot be generalised because it is not statistically significant i.e. it is suitable only for this sample but not for the whole population in the two cities. Therefore, a larger sample is required to examine this phenomenon. In the direct approach, participants were directly asked about their pre-estimations of weather conditions on the day of the interview. Figure 6.28 and Figure 6.29 show the percentage of what participants had expected whether warmer, cooler or as pre-estimated in Marrakech and Phoenix in winter and summer. 100% 90% 80% 70% 60% 50% 40% 30% 20% 10% 0% Phoenix Marrakech 57% 49% 38% 38% 13% 5% cooler as expected warmer Figure 6.23 How did you expect the weather to be like? (winter) In winter, as can be seen from Figure 6.23, almost 60% of participants in Phoenix had correctly expected weather conditions compared with 50% in Marrakech. Therefore, Phoenix participants had a slightly better expectation of weather conditions in winter compared to participants in Marrakech. However, Figure 6.23 also shows that, in Marrakech, more participants had expected the weather to be warmer than it was during the interview compared to Phoenix. In Marrakech, 13% of participants had expected the weather to be warmer compared to only 5% in Phoenix in winter. Hence, it might be anticipated that participants in Marrakech were more likely to feel thermally discomfortable in winter compared with Phoenix. 131
146 Chapter 6 Thermal sensation and the use of urban public spaces 100% 90% 80% 70% 60% 50% 40% 30% 20% 10% 0% Phoenix Marrakech 88% 61% 32% 8% 5% 7% cooler as expected warmer Figure 6.24 How did you expect the weather to be like? (summer) In summer, Figure 6.24 shows that around 90% of participants in Phoenix had correctly expected weather conditions compared with only 60% in Marrakech. Therefore, Phoenix participants also had better expectation of weather conditions in summer compared to participants in Marrakech. It appeared that the difference in the percentage of correct expectation in summer is much higher than that in winter. There was a significant difference between the two groups in overestimating conditions in summer. In Marrakech, 32% of participants expected the weather to be warmer in summer while only 8% of participants in Phoenix had the same expectation. Therefore, it might be anticipated that more participants in Marrakech were likely to feel thermally comfortable in summer, as they expected the worse condition, compared with Phoenix. 132
147 Chapter 6 Thermal sensation and the use of urban public spaces Table 6.4 Neutral temperatures for both Marrakech and Phoenix groups in winter and summer. Neutral temperature (winter) R 2 Neutral temperature (summer) R 2 T n ( C) T n ( C) Marrakech Phoenix The difference between cities 4 1 Experience has a strong link with expectations so that according to their past experience, people prepare themselves for the expected weather by choosing appropriated clothes, time of being outdoors, type of activity etc. Differences in neutral temperatures were observed between the two groups. People thermal perceptions change through different seasons. Therefore, the thermal neutrality of participants in winter is expected to be different, specifically lower than that in summer and Table 6.4 confirms this. In this study, it was observed that the difference in thermal neutrality between the participants of Marrakech and Phoenix was greater in winter compared to summer. The difference was 4 C in winter and only 1 C in summer. The findings show that winter as the season in which the two groups vary the most. A small difference in thermal neutrality was found between the two groups in summer. This indicates that participants from both cities had similar expectations of weather conditions in summer but not in winter. This finding may be explained in what follows. Experience reminds people that air temperature in the hot season is higher than in the cool season, with high levels of solar radiation. Since the hot season is dominant and longer in both Marrakech and Phoenix, people tend to tolerate high temperatures in summer. On the other hand, the high level of clothing insulation in Marrakech, the slightly lower air temperature and the lower solar radiation levels could have an influence on the relatively lower neutral temperature in winter. 133
148 Chapter 6 Thermal sensation and the use of urban public spaces 6.6 The use of space: attendance, time, and activities The influence of cultural differences on the use of outdoor space under certain climatic conditions was studied by monitoring the number of people visiting the outdoor space (attendance); the activities that were taking place in the space; the time of the visiting as well as the length of stay in the outdoor space. Time spent in outdoor urban spaces can be regarded as an indicator of the satisfaction with the predominant conditions in a place, particularly with optional and social activities, which were defined in section The longer the time spent in the public urban space the more successful the space is. Moreover, Gehl (2011) stated that the greater the number of people and longer time people spend in an outdoor space, the higher the level of activities that take place (Figure 6.25). Attendance Activity Time Figure 6.25 The relationship between attendance, time and activity in public urban spaces Attendance and activity analysis Figures 6.26, 6.27 and 6.28 compare participants of the two cities in terms of number of visitors and activities observed in 30-minute intervals during the survey as well as the mean time spent by each participant. As can be seen from Figure 6.26, the mean number of people who visited the sites in Marrakech was higher than the mean number of people found in Phoenix. The average number of visitors in Marrakech sites was around 37 during each 30-minute interval, while it was only 27 in Phoenix sites. Figure 6.27, however, shows that more activities occurred in Phoenix sites compared with Marrakech. The average number of activities in Phoenix sites was four activities during each observation interval (30 minutes), while it was only one activity in Marrakech. Figure 6.28 shows the time spent by participants during the survey period in both cities. As can be seen, the average time spent by participants in Phoenix was significantly higher than that in Marrakech. People tended to spend approximately an hour and a half in Phoenix sites while those in Marrakech spent less than an hour on average. 134
149 Chapter 6 Thermal sensation and the use of urban public spaces Comparing the two cultural groups reveals that although the number of people was higher in Marrakech urban spaces all around the year, the number of activities and time spent in Phoenix spaces were higher. In Marrakech, however, fewer activities were taking place and people were outdoors, mainly in groups, in the late afternoon because it is part of their daily routine to escape the over-heated dwellings, as many reported. For example, some said: It is too hot at home at this time of the day. In contrast, in Phoenix, people generally tend to visit the sites in smaller groups or individually and be involved in activities such as reading, fishing, having lunch etc. They would move indoors where air conditioned spaces are available, such as in Tempe Marketplace, or they could go home, where most dwellings are air conditioned. It could be useful to have a closer look at each site individually. This could help in understanding how people were able to spend longer time outdoors in less perfect weather conditions. Further analysis were performed without considering the data obtained from Tempe Marketplace which has different features compared with the other four sites (Table 6.5). The results did not show significant differences compared with the data inclusive of Tempe Market place except for the increase in the average time spent in Phoenix sites when the data of Tempe Marketplace were omitted. However, this does not change the initial findings. Mean number of people in the place Marrakech city Phoenix Figure 6.26 Mean number of people in sites in both cities 135
150 Chapter 6 Thermal sensation and the use of urban public spaces 5 Mean number of activities Marrakech city Phoenix Figure 6.27 Mean number of activities in sites in both cities Mean time spent in the place (minutes) Marrakech City Phoenix Figure 6.28 Mean time was spent in sites in both cities 136
151 Chapter 6 Thermal sensation and the use of urban public spaces Table 6.5 Comparing data with and with out participants in Tempe Marketplace (TMP). Phoenix With TMP data Without TMP data Mean number of people Mean number of activities Mean time spent on site Figures 6.29, 6.30 and 6.31 compare participants of the two cities in more detail by showing the three variables: number of people, number of activities and time that was spent in the space, of each of the five sites in summer and winter. As can be seen from Figure 6.29, in winter, the highest number of people is found in Tempe Marketplace in Phoenix. Both Marrakech sites also had high attendance rates. The average number of people in each time intervals was approximately people in winter. The highest numbers of people in summer are found in Tempe Beach Park followed by Al Koutoubia Plaza and Al Koutoubia Park, where the average number of people in each time interval was between 45 and 80 people. The lowest number of people, on the other hand, is found in Chaparral Park in Phoenix, where the average number of people in each time interval was less than 10 people in both seasons. Figure 6.30 shows the mean number of activities in each site in winter and summer. The highest activity level is found in Tempe Beach Park in winter and that was around seven activities in each time interval. These activities include walking and jogging, walking a dog, water play, picnics, reading etc. On the other hand, the lowest number of activities is found in Al Koutoubia Plaza in winter as well as in summer and that was less than two activities in each time interval. 137
152 Chapter 6 Thermal sensation and the use of urban public spaces Figure 6.29 Mean number of people in each site in Marrakech and Phoenix Figure 6.30 Mean number of activities that occurred in sites in both cities 138
153 Chapter 6 Thermal sensation and the use of urban public spaces Figure 6.31 Mean time spent in each site in Marrakech and Phoenix Figure 6.31 shows the mean time spent by participants in each site during the survey period. As can be seen, the longest time spent was in Chaparral Park in winter followed by Tempe Beach Park in summer. In Marrakech on the other hand, participants tended to spend more time in the plaza and into the evening time in summer. The average time spent in Chaparral Park was the longest of all; and this is likely due to the fishing activity which is very popular at this park and its participants spent longer time in the park due to the nature of this activity (Figure 6.32). Comparing numbers of people, numbers of activities and length time spent at each of the five sites shows that Chaparral Park (in Phoenix) had the lowest attendance throughout the year. At the same time, however, Chaparral Park had the longest staying time in winter. Among possible explanations of the relatively low number of people visiting Chaparral Park is the limited availability of shaded areas suitable for sitting. Despite the existence of some shaded areas including a barbecue shade, many seats were not carefully positioned to protect their users from direct sun when it is not required (Figure 6. 33). Nevertheless, the problem of badly located seats can also be found in Tempe Beach Park and in Al Koutoubia Plaza, yet both sites have a better attendance rate compared to Chaparral Park (Figure 6.34). 139


154 Chapter 6 Thermal sensation and the use of urban public spaces Figure 6.32 Fishing as an individual activity in Chaparral Park in Phoenix Figure 6.33 Low attendance in Chaparral Park in Phoenix 140

155 Chapter 6 Thermal sensation and the use of urban public spaces Figure 6.34 Motion activities in Phoenix public outdoor spaces Another possible explanation of the relatively low number of people visiting Chaparral Park is the nature of activities observed in this park. According to the criteria of this study, static activities, such as sitting and standing, were included in the count of people. Most activities observed in this park were physical activities such as jogging, walking dogs, skating, and riding bicycles in addition to other individual activities such as fishing. Unlike social activities such as chatting, playing, dating and picnicking, motion and individual activities do not require the presence of other people or groups and do not necessarily inspire or develop social engagement in the public space. Conversely, the rate of the social activities was noticeably higher in Tempe Beach Park and Al Koutoubia Plaza. Figure 6.35 shows the percentage distribution of social activities such as: chatting, playing, dating and picnics etc. versus other activities in the five public spaces of this study. It is obvious that Chaparral Park has the lowest percentage among all spaces in social activities i.e. less than 25%. The percentage of social activities of other spaces varied between 45% in Tempe Marketplace to 95% in Al Koutoubia Plaza. It might therefore be concluded that social activities appear to play an important role in attracting people to urban public spaces in the hot arid climate. Such activities could inspire groups and families to visit the outdoor space even in the middle of the day, as seen in Tempe 141
156 Chapter 6 Thermal sensation and the use of urban public spaces Beach Park. Social activities, therefore, could stimulate both attendance and the length of stay in the outdoor space which can encourage further activities to take place. 142
157 Chapter 6 Thermal sensation and the use of urban public spaces Tempe Marketplace Al Koutoubia Park 100% 80% 60% 40% 20% 0% Al Koutoubia Plaza Tempe Beach Park Chaparral Park Social Activities Other activities Figure 6.35 A radar chart showing the percentage distribution of social activities versus other activities Tempe Beach Park had the longest time spent by visitors amongst all sites in summer. This park also had the highest number of visitors and shares the highest number of activities with Chaparral Park in summer. A possible explanation for the long time that was spent in this park could be linked to the nature of activities observed in this park such as playing and picnicking, in addition to the arrangements of design elements. The water play area is a very popular part of Tempe Beach Park during summer. It attracts people in groups and families who spent longer times under the trees or the shades next to the water play area even during the middle of day (Figure 6.36). Moreover, people were involved in other social activities such as chatting and picnicking while watching their children playing. Tempe Beach Park had the lowest rate of thermal discomfort in summer; hence only 10% of participants had reported being thermally uncomfortable (Figure 6.37). It looks as though the combination of: shade availability; suitable seating areas; the type of activity, that involves water in this case; and on the top of that, the arrangements of these elements as a whole had met the needs of visitors (Figure 6.38). 143
158 Chapter 6 Thermal sensation and the use of urban public spaces Tempe Marketplace Al Koutoubia Park 100% 80% 60% 40% 20% 0% Al Koutoubia Plaza Tempe Beach Park Chaparral park Number of activities in the middle of the day Number of groups in the middle of the day Figure 6.36 A radar chart showing the percentage distribution of number of activities verses the number of groups in the space in the middle of the day Al Koutoubia Park 40% 30% Thermal discomfort in winter Thermal discomfort in summer Tempe Marketplace 20% 10% Al Koutoubia Plaza 0% Tempe Beach Park Chaparral park Figure 6.37 A radar chart showing the percentage distribution of thermal discomfort 144

159 Chapter 6 Thermal sensation and the use of urban public spaces Figure 6.38 High attendance in Tempe Beach Park Time of visiting analyses Examining patterns of use in different times of the day may reveal some variation between the two cultural groups. The number of people in each site was labelled by the time of the day i.e. morning, noon and, evening. It appeared that the difference in attendance between the middle of the day and evenings was greater in the Marrakech sites so that the number of people who visited the sites in Phoenix in the middle of the day was greater than that in Marrakech. It is not surprising that the number of people in Marrakech sites was generally lower in the middle of the day. It is common in Marrakech that people take a midday nap or a siesta, where the afternoon heat dramatically reduces work productivity. Figure 6.39 shows the number of people in each site labelled by the time of the day in weekdays. As can be seen, the number of people reached the maximum in the evening in all sites in both cities. Marrakech sites has a similar trend of distribution increasing from the morning to reach the maximum in the evening. The drop in solar radiation levels, during this time, is a key factor in reducing the heat gains which reduce the effect of high temperatures in summer evenings in both cities. The same trend can be found in Tempe Beach Park and Tempe Market Place in Phoenix. However, Chaparral Park, which has the least number of visitors during weekdays, shows different trend. Visitors of this park outnumbered those in the middle of the day. This is probably due to that fact that more people from the adjacent neighbourhood visit the Chaparral Park in the morning for jogging and dog walking. 145
160 Chapter 6 Thermal sensation and the use of urban public spaces Figure 6.40 shows the number of people in each site labelled by the time of the day in weekends. As can be seen, the number of people reached the maximum in the evening only in Marrakech sites. Phoenix sites has a different trend. More people tend to visit Phoenix sites in the middle of the day in weekends. This was particularly obvious in Chaparral Park where twice as many people visited the site during the middle of the day compared with the number of visitor in the evening. Phoenix sites such as Chaparral and Tempe Beach Parks offer picnic facilities as well as shaded areas that was used by people including groups and families in the middle of weekend days. Tempe market place with its shopping stores and dining facilities also attracts visitors and families at this time of the day. The shaded areas were used during the middle of the day as expected. Figures 6.41 and Figure 6.42 show the mean air temperature in Marrakech and Phoenix in winter and summer. Figure 6.41 shows that the measures values of air temperature are similar between the two cities at all times of the day. The lowest values were measured in the morning time and it was just over 10 C. The highest values were measured in the noon time and it was around 42 C. Figure 6.42 shows that the main difference in air temperature values between the two cities is found at the noon time. As can be seen, from Figures 6.41 and Figure 6.42 small variation in air temperature is found between noon and evening time. Thus, the temporal difference in air temperature alone cannot explain the increasing use of outdoor spaces towards the evening time. Figure 6.43 shows the average number of groups 17 in the outdoor space as a function of day hours in summer and winter. The secondary axis shows the average solar radiation values. As can be seen, the number of groups increased gradually from the morning hours to the evening in both cities. The number of groups was small, less than ten, in both cities before lunch time. It increased in Phoenix during lunch time before decreasing again in the afternoon. This shows one of the differences between the two cities. Unlike Phoenix, it is unpopular for people in Marrakech to have lunch in public spaces. This cultural difference may explain why more groups were found outdoors in Phoenix in the lunch time. It is appeared that despite the relatively high temperatures in both cities in the evenings, the number of groups was still increasing. 17 defined as two persons or more in the space during the survey, 146
161 Mean number of people Mean number of people Chapter 6 Thermal sensation and the use of urban public spaces Weekdays 120 Morning Middle of the day Evening Al Koutoubia Park Al Koutoubia Plaza Chaparral Park Tempe Beach Park Tempe Marketplace Figure 6.39 Mean number of people in the morning, noon and evening (weekdays). Weekends Morning Middle of the day Evening Al Koutoubia Park Al Koutoubia Plaza Chaparral Park Tempe Beach Park Tempe Marketplace Figure 6.40 Mean number of people in the morning, noon and evening (weekends). 147
162 Air temperature ( C) Air temperature ( C) Chapter 6 Thermal sensation and the use of urban public spaces Marrakech-winter Phoenix-winter Morning Noon Evening Time of the day Figure 6.41 The mean air temperature in Marrakech and Phoenix in winter Marrakech-summer Phoenix-summer Morning Noon Evening Time of the day Figure 6.42 The mean air temperature in Marrakech and Phoenix in summer 148
163 Number of groups in place Solar radiation (W/m 2 ) Chapter 6 Thermal sensation and the use of urban public spaces Therefore, it can be argued that the increasing number of people or groups may be due to the end of the working day or the school days. However, the data include weekends and summer school holidays. Moreover, 23% of the interviewees were housewives, pensioners or unemployed. Hence, a possible explanation for this increase could be the low solar radiation values at that time of the day which attract people to visit the outdoor spaces. Despite the small variation in air temperature that was found between noon and evening time in both cities, Figure 6.43 shows that, in both cities, solar radiation values were significantly decreasing from over 600 W/m 2 in the middle of the day to less than 200 W/m 2 in the evening. The drop in solar radiation level decreases the total heat gain of the body. Therefore, more thermally comfortable seating options will be available in public outdoor space for visitors to select from. Such thermal conditions makes outdoor spaces in Marrakech places to which people may escape the over-heated dwellings as many participants reported. Marrakech Phoenix S Marrakech S Phoenix , y = 0.252x x R² = y = x x R² = Time in hours Figure 6.43 Number of groups of people as function of time (solar radiation) Time of stay analyses Expectation and experience were examined under the effect of time spent by participants in the outdoor space. Hence, participants were asked about their weather expectations, and they were asked about the time they usually spend indoors and outdoors. The latter question was meant to examine the effect of participants experience on the time they spent outdoors. When examining the time people spent in different sites, it seems that the 149
164 Chapter 6 Thermal sensation and the use of urban public spaces participants who considered the weather conditions typical for the season tended to spend more time in the space. Those who did not consider the conditions as typical, or had no idea about the climatic conditions of the area at the time of the interview, spent less time in it, as shown in Figure This is probably due to the unpleasant thermal conditions which they were not used to. People were asked about the time they usually spend indoors and outdoors during the week; they were divided accordingly into two groups, outdoors individuals and indoors individuals. Those who usually spend more time outdoors or the outdoors individuals tend to stay longer in the studied sites compared with the indoors individuals who spend more time indoors as shown in Figure This is probably because of the experience of the outdoor individuals of the outdoor conditions and respective thermal conditions. The time spent outside is influenced by the environmental parameters. Solar radiation is shown to be a key parameter influencing the use of outdoor spaces in this study. The increasing intensity of mean solar radiation is associated with decreasing of the time spent in an outdoor space in a hot arid climate (Figure 6.46). In conclusion, the time spent by people outdoors in a hot arid climate is influenced by their thermal comfort. Among the factors proved to influence people s thermal comfort are: their expectation of the weather, their experience of the outdoor conditions, and the intensity of solar radiation. 150


165 Chapter 6 Thermal sensation and the use of urban public spaces Figure 6.44 Mean time spent in place as function of weather expectation Figure 6.45 Mean time spent in place as function of the time usually spent indoors or outdoors 151
166 Chapter 6 Thermal sensation and the use of urban public spaces 300 Mean solar radiaton (W/m²) <30 mins Time >60 mins Figure 6.46 Solar radiation (W/m²) as function of time spent in place The influence of environmental parameters on the use of space Solar radiation is found to have the greatest and negative influence on both attendance and activities in summer. In general, with low air temperature, solar radiation increases the heat gain by individuals in outdoor public spaces and help in mitigating the heat balance so people can feel thermally comfortable. With increasing air temperature, the increasing solar radiation levels add to the body heat gain and may cause thermal dissatisfaction, thus individuals seek shade to eliminate the effect of solar radiation. The relationship between the number of people in the space and solar radiation (S) is found to be negatively and strongly correlated. For example, the number of people was highly correlated with solar radiation in site (5) Tempe Marketplace (r= , p<0.001). Thus, as the intensity of solar radiation increases, the number of people in the place decreases. Figure 6.47 shows an example of the effect of the direct solar radiation on the use of outdoor spaces in a hot arid climate. Despite the fact that the air temperature was similar in both cases A and B in Marrakech on two winter weekdays in the afternoon, the solar radiation level was higher in case B. Apparently the number of people in case A was much higher compared with case B. Negative but medium correlations were found between the number of people in the place and solar radiation (S) in sites (1, 2, and 3) Al Koutoubia Park, Al Koutoubia Plaza and Chaparral Park, (r=-0.685, p<0.001; r=-0.605, p< 0.001; and r= , p< 0.001) respectively. No significant correlation is found between the number of people and solar radiation in site (4) Tempe Beach Park. 152
 in site (5), Tempe")
 in sites (1, 2, 3, and 4) Al Koutoubia Park, Al Koutoubia Plaza, Chaparral Park and Tempe")
167 Chapter 6 Thermal sensation and the use of urban public spaces A B Figure 6.47 The effect of solar radiation on attendance: A- overcast B-sunny Similarly, the number of activities is found to be negatively and strongly correlated with solar radiation (S) in site (5), Tempe Marketplace (r= , p<0.001). Therefore, as the intensity of solar radiation increases, the number of activities decreases. Negative and medium correlations were found between number of people in the place and solar radiation (S) in sites (1, 2, 3, and 4) Al Koutoubia Park, Al Koutoubia Plaza, Chaparral Park and Tempe Beach Park (-0.462, p<0.001; , p< 0.01; , p< and , p< respectively). In general, the influence of solar radiation on both attendance and activities was obvious in Tempe Marketplace. A possible explanation of this result could be related to the nearby air-conditioned premises such as shops, restaurants, cafés and a cinema. The availability of air conditioned premises in Tempe Marketplace is likely to make people less tolerant to the extra thermal load coming from the solar radiation on hot days, particularly because the main purpose of being around is to visit or use one of these amenities. Thus, why do people have to spend longer time in hot conditions outdoors while air-conditioning is an easy option indoors? In fact, Figure 6.48 shows that around 80% of participants in Tempe Marketplace were standing or sitting outdoors waiting for something, such as a film to start in the nearby cinema, or waiting for someone. Waiting, as reported by Gehl (2011), is a necessary activity that takes place under all conditions. 153
168 Chapter 6 Thermal sensation and the use of urban public spaces Tempe Marketplace Al Koutoubia Park 100% 80% 60% 40% 20% 0% Al Koutoubia Plaza Tempe Beach Park Chaparral Park waiting going out/enjoying the place other Figure 6.48 A radar chart showing the percentage distribution of the reason for being in the outdoor space Previous studies in temperate climates such as that by Nikolopoulou et al. (2001) indicate that the number of people visiting an urban public space tends to increase when the levels of air temperatures and solar radiation increase in all seasons. However, studies in hot humid regions show that the number of people decreased in the hot season as the solar radiation increased (Lin 2009). In this study, the number of people and activities in the studied urban public spaces were negatively and strongly correlated with the solar radiation levels in all seasons. Therefore, as the intensity of solar radiation increases the numbers of people and activities decrease taking into account the relatively high air temperatures in hot arid regions. Moreover, the direct sunlight becomes more undesirable. Hence, people avoid the sun either by facing other direction of the sun or by covering or hiding their eyes such as in Figure 6.49 and Figure One important implication of this finding is that a poor attention to design of the outdoor space may result in abandoned unshaded seating areas. It is possible though to mitigate the effect of solar radiation in outdoor spaces in hot arid climates by paying attention to design elements such as proper allocation of seats and shades. The design of outdoor 154
169 Chapter 6 Thermal sensation and the use of urban public spaces open space should eliminate solar radiation when it is not desirable i.e. on hot summer days and it should allow access of solar radiation in the open space when it is required i.e. early mornings in winter. Nevertheless, such design-related environmental improvements may not be sufficient to bring life to outdoor public spaces in a hot arid climate. Although good outdoor public spaces should provide a variation of shaded and unshaded seats; these spaces should also offer opportunities for social activities to develop, giving people a chance to visit the space with others, to meet others, or to watch others. 155


170 Chapter 6 Thermal sensation and the use of urban public spaces Figure 6.49 A visitor sitting sideways on a bench to avoid direct sunlight Al Koutoubia Plaza Figure 6.50 A group of ladies trying to avoid direct sunlight while sitting on a bench in Al Koutoubia Plaza 156
171 Chapter 6 Thermal sensation and the use of urban public spaces A good design that meets the thermal environment is essential; however, it could be the type of activity taking place that encourages people to get involved and start socialising with others, spending longer time in the outdoor public space and therefore attract more people in the outdoor space. It was also mentioned in the literature that more people and longer stays results in high levels of activitygehl (1996) (Figure 6.25). In general, a welldesigned outdoor space in addition to the type of activities which take place in it, together seem to attract people and give them chances to socialise and hence spend more time despite high air temperatures and high solar radiation intensity. It is not only the number but also the type of activity that encourage groups to start socialising and therefore attract more people and inspiring further activities to take place in the outdoor space. Following the above discussion, this study revealed that open public spaces in the hot arid climate that offer good design and allow social activities are likely to influence their user to stay longer. The design of outdoor open space in such a climate should eliminate the solar radiation when it is not desirable i.e. in hot summer days and it should allow access of solar radiation in the open space when it is required i.e. early mornings in winter. Moreover, variations of shaded and unshaded seating areas should be available so that people are not forced to use specific areas. The design should respond to users needs and bring people together without compelling them to do so. The capacity of the space to stimulate social activities by creating opportunities for people to meet, greet, play, or simply seeing and hearing other people. Social activities appear to play an important role in attracting more people to urban public spaces in the hot arid climate. Such activities could inspire groups and families to visit the outdoor space even in the middle of the day as seen in Tempe Beach Park. Social activities, therefore, could stimulate both attendance and the time of stay in the outdoor space which can promote further activities to take place. Eencouraging visitors to come into the outdoor space and spend longer time will influence further activities to take place which may encourage further visitors to explore and stay in the outdoor. 157
172 Chapter 6 Thermal sensation and the use of urban public spaces 6.7 Conclusions In agreement with previous studies in different climates such as the study by Nikolopoulou et al. (2001) in the temperate climate of England and the study by Thorsson et al. (2004a) in the northern climate of Sweden, this study has found great inconsistencies between ASV and PMV values. The implication of this is that the thermal preferences of subjects in hot arid climates cannot be explained by heat-balance indices alone. Other behavioural and psychological factors may explain the difference between the actual thermal sensation and the calculated thermal sensation based on steady-state models such as PMV. Therefore, this finding expands the existing knowledge and provides evidence that merely dependence on physiological approach to evaluate thermal comfort outdoors in the hot arid climate is not sufficient. Thermal sensitivity and neutrality of visitors of urban public spaces in Marrakech and Phoenix were examined. The study has shown differences in thermal sensitivity and neutrality between the two cultural groups in Marrakech and Phoenix. Marrakech participants were thermally comfortable at a wider range of T g. In other words, subjects in Phoenix were more sensitive to air temperature variations and solar radiation than subjects in Marrakech. The neutral temperatures for Marrakech and Phoenix are 22 C and 24 C T g, respectively. The neutral temperature of Marrakech group is 2 C lower than that in Phoenix, which is likely due to the difference in clothing insulation between the two groups that is discussed in section These findings support the fact that thermal requirements of people in Marrakech and Phoenix must be considered separately despite the similarity in the prevailing climate in both locations. The preferred temperatures were calculated for Marrakech and Phoenix. The preferred temperatures for Marrakech and Phoenix participants are 22.2 and 25.0 C T g respectively, with a difference of 3 C T g, showing another evidence that thermal requirements of people in Marrakech and Phoenix should be considered separately. The differences between neutral and preferred temperatures in Marrakech and Phoenix are 0.2 and 1.0 C Tg respectively. The smaller difference between the neutral temperature and the preferred temperature in Marrakech, compared to that in Phoenix, indicates that Marrakech participants may had more tolerance to their thermal environment. An important and natural behaviour to improve thermal comfort is clothing adjustments. People in Marrakech tend to wear clothes that cover most of their bodies in winter and in summer for both genders, and this is possibly due to cultural rules. In Phoenix, on the other hand, people have less cultural restrictions on what they wear. Therefore, they wear 158
173 Chapter 6 Thermal sensation and the use of urban public spaces lighter clothes particularly in summer e.g. T-shirts, shorts, short skirts, etc. The average clothing insulation value in Marrakech was twice as much as it was in Phoenix, 0.87 and 0.43 clo respectively. The difference in clothing insulation values between the two groups was also significant in summer. Therefore, people in Marrakech may feel thermally comfortable in a lower air temperature compared to people in Phoenix Consuming cold or hot drink is one way to alter the metabolic rate as a behavioural action to make individuals feel thermally comfortable. This study shows that almost 60% of participants in Phoenix consumed cold drinks as a measure to maintain their thermal balance and eventually their sensation of thermal comfort. On the other hand, only 30% of participants in Marrakech consumed cold drinks. On possible explanation of this is cultural difference. It is unusual to see people, apart from tourists, in Marrakech sites holding or carrying a bottle of water or cold drink. On the other hand, it is typical for people in Phoenix sites to have water bottles not to mention ice creams and iced soft drinks. Consuming cold drinks in the sites investigated in this study is evidence that adaptation was taking place to mitigate thermal condition. The past experience makes people expect the thermal environment in an urban space to be in a certain condition. These expectations, sometimes, do not match the actual conditions in an urban open space and therefore influence the thermal perceptions of visitors. The neutral and preferred temperatures; in addition to the time spent by participants in the outdoor space were examined to study the effect of expectations on thermal comfort. The difference between the neutral temperature T n and the preferred temperature T p was greater in Marrakech than in Phoenix. The difference was 0.2 C and 1.0 C in Marrakech and Phoenix respectively. The small difference between neutral and preferred temperature indicates good level of weather expectation. Therefore, compared to Phoenix, people in Marrakech had better expectations of the thermal conditions in a given time of the year. The time spent in the outdoor space is another factor that could be influenced by expectation. The time spent in space by the visitors who correctly predicted the weather condition was relatively longer in both cities. However, a larger sample is required to examine this phenomenon to be able to generalise. This study shows that participants who usually spend more time outdoors due to this life style outdoors individuals tend to stay longer in the studied sites compared with the indoors individuals who spend more time indoors. This is probably because the outdoor individuals have better experience of the outdoor conditions and respective thermal 159
174 Chapter 6 Thermal sensation and the use of urban public spaces conditions. Experience has a strong link with expectations so that according to their past experience, people prepare themselves for the expected weather by choosing appropriated clothes, time of being outdoors, type of activity etc. The difference in thermal neutrality between winter and summer was greater within Marrakech group compared to Phoenix group. Also in this study, it was observed that the difference in thermal neutrality between the two cultural groups was greater in winter compared to summer. The difference was 4.0 C in winter and only 1.0 C in summer. The small difference in thermal neutrality between the two groups in summer indicates that participants form both cultures had similar expectations to weather conditions in the hot season. People know from their past experiences that air temperature in the hot season is higher than in the cool season so people tend to tolerate high temperatures in both Marrakech and Phoenix. In winter, however, the difference in the neutral temperatures was greater. The high level of clothing insulation in Marrakech is a possible cause of the relatively lower neutral temperature compared to Phoenix. The influence of cultural differences on the use of outdoor space under certain climatic conditions was examined. Time, attendance, and activities were monitored and analysed. In Marrakech, fewer activities were taking place and people were outdoors, mainly in groups, in the late afternoon because it is part of their daily routine to escape the overheated dwellings as many reported. On the contrary, people in Phoenix were generally tend to visit the outdoor spaces individually or in small groups and involved in activities such as reading, fishing, having lunch etc. They would move indoors where air conditioned spaces are available, such as in Tempe Marketplace; or they can go home where most dwellings are air conditioned. Solar radiation is shown to be a key parameter influencing the use of outdoor spaces in this study. The increasing intensity of mean solar radiation is associated with decreasing of the time spent in an outdoor space in a hot arid climate. The drop of solar radiation levels decreases the total heat gain of the body. Therefore, more thermally comfortable seating options will be available in public outdoor space for visitors to select from. The number of people and activities in the studied urban public spaces were negatively and strongly correlated with the solar radiation levels in all seasons. Therefore, as the intensity of solar radiation increases the numbers of people and activities decreases taking in account the relatively high air temperatures in hot arid regions. One important implication of this finding is that a poor attention to design may result in abandoned unshaded seating areas. It is possible though to mitigate the effect of solar radiation in outdoor spaces in hot arid climates. The design of outdoor open space in such a climate should eliminate the 160
175 Chapter 6 Thermal sensation and the use of urban public spaces solar radiation when it is not desirable i.e. in hot summer days and it should allow access of solar radiation in the open space when it is required i.e. early mornings in winter. 161
176 Chapter 7 Conclusions 7 Conclusions 7.1 Introduction This final chapter gives a summary of the research and attempts to outline the answers to the research questions. It states the research scope and limitations and suggests issues for future work and further investigation. 7.2 Summary of the study Despite the increasing interest in outdoor thermal comfort studies, little attention has been paid to the hot arid climate. Most studies in the hot arid climate regions have followed the urban climatology approach that was referred to in chapter 3. In such research, the focal centre of the research is on the interaction between the environmental elements and the physical settings of the space, with little consideration given to the human factor. The thermal effect on visitors was studied using standard thermal indexes. Thus, in majority of cases, the adaptive actions as well as the influence of cultural variations on the perceptions of the thermal environment were given little attention. This thesis aimed to extend the understanding of outdoor thermal comfort to the hot arid climates. It studies the complex relationship between the outdoor thermal environments and the thermal sensation of visitors, their adaptive actions, and their use of space. The study also sought to investigate the influence of culture on the subjective evaluation of thermal environments in outdoor urban spaces in hot arid regions. For these reasons, case studies were carefully selected in two different parts of the world (Marrakech in North Africa and Phoenix-Arizona in North America) to represent a variety of visitors in similar climatic context. This enabled the study to consider the effects of the socio-economic and cultural diversity on thermal sensation, behaviour and use of space. In addition, field surveys enable studying the complex relation between both physical and subjective variables. Therefore, a causal comparative design based on field surveys has been chosen for this study. A combination of physical and human measurements was used to collect environmental data and to measure human attitudes. The physical measurements consist of measuring the microclimatic variables in each site and estimating activity level and clothing insulation of the investigated subjects. In addition, the human behaviour monitoring consists of two approaches: first, a questionnaire to which participants responded through structured interviews; second, in 162
177 Chapter 7 Conclusions conjunction with the interviews, formal observations performed by the investigator during field work days. Five sites were carefully selected in two different parts of the world (Marrakech in N. Africa and Phoenix-Arizona in N. America). The choice considered the following factors to meet the objectives of this study: the selected sites had to be located in a hot-arid climatic zone; participation from different socio-cultural backgrounds to enable examination of effects of cultural differences on the thermal sensations and use of outdoor spaces; different space typologies enabled exploration of how design affects the use of space through the creation of different microclimates. Pre-field work preparations were made to select suitable sites for this research. Research materials were also arranged and tested. After initial analysis of each one of the selected sites the actual field work was started. Data collection included both physical measurements and human behaviour monitoring. 7.3 Addressing research questions and objectives As already mentioned in the introduction of this thesis, this study attempts to answer the following: 1. Can the outdoor thermal comfort in hot arid climates be assessed by the physiological approach only (i.e. the heat-balance indices alone.)? 2. How people from different cultures in the hot-arid climate evaluate their actual thermal conditions? 3. What is the relative contribution of the environmental parameters to thermal perceptions of the visitors of urban public spaces in hot arid climates? 4. Are there any differences in the thermal comfort requirements between different cultures in the hot-arid climate including neutral and preferred temperatures? 5. How people from different cultures in the hot-arid climate use urban public spaces? Therefore, the following set of objectives has been developed: 5. To conduct field surveys in outdoor spaces within the hot arid climate. This includes: a. The selection of suitable sites that allow studying the influence of culture on the subjective assessment of thermal sensation, and define socioeconomic groups to compare thermal comfort requirements among them. 163
178 Chapter 7 Conclusions b. Human monitoring through on-site structured interviews and formal observations to record people attendance and activities. c. Physical measurements of microclimatic parameters simultaneously conducted with the human monitoring. 6. To evaluate the physiological approach in a hot arid climate by comparing actual thermal sensation votes with predicted sensation votes which are obtained from a heat-balance model. 7. To investigate the relationship between the environmental parameters and the actual sensation vote (ASV) in different cultures, by using Chi-square (χ²) test of independence, and study the impact of this relationship on the use of the outdoor spaces. 8. To examine factors that affect thermal adaptation between cultures by studying the behaviour of people in public spaces of Phoenix and Marrakech. 9. To measure and compare neutral temperatures and preferred temperatures of the cultural groups, using the mean thermal sensation vote responses. 7.4 Summary of the findings of the study The physiological approach and the thermal comfort assessment The current study found that the solely physiological approach is insufficient to assess the outdoor thermal comfort conditions in hot arid climates. The subjective thermal sensations, represented by ASV were compared with the PMV as a heat-balance model. The outcome shows a great inconsistency between ASV and PMV values indicating that the thermal preferences of subjects in hot arid climates cannot be explained by heatbalance indices alone. This finding is in agreement with Nikolopoulou et al. (2001) in their study in temperate climate of Cambridge which showed that purely physiological approach is inadequate to characterise thermal comfort conditions outdoors. Therefore, this finding expands the existing knowledge and provides evidence that merely dependence on physiological approach to evaluate thermal comfort outdoors in the hot arid climate is not sufficient. Other factors, such as behavioural and psychological adaptation may explain the difference between the actual thermal sensation and the calculated thermal sensation based on steady-state models such as PMV The relative contributions of the environmental parameters Two steps were followed to find the relative contribution of the environmental parameters on thermal perceptions of the visitors of urban public spaces in hot arid climates. First, a 164
179 Chapter 7 Conclusions correlation analysis was carried out between ASV and the environmental parameters. Second, best correlated environmental parameters with ASV selected for further analysis using ordinal regression. The correlation analysis show that T g, T air, R H, W S are all significantly correlated, but with different strengths, with ASV in both cities. Therefore, it can be analysed by using the ordinal regression analysis. ordinal regression. The ordinal regression was used because the actual sensation vote ASV is an ordinal variable. The ordinal regression analysis was carried out to examine how the environmental variable related to the actual thermal sensation votes of participates. Globe temperature T g appeared to be the most important predictor of thermal sensation in Marrakech and Phoenix. Since T g combines the effect of both solar radiation and air temperature, its influence suggests the importance of solar radiation intensity together with air temperature. Although, air temperature is difficult to mitigate in the outdoor settings, solar radiation can be mitigated by design and landscaping. For example, providing trees that can be used as shelters from sun light with air temperature days, and it should allow the sun light in winter with low air temperature days. Environmental variables such as air temperature and solar radiation, therefore, could have a great impact on the use of the outdoor spaces in the hot arid climate, and may determine the number of people and activities in them Factors influencing thermal sensation in Marrakech and Phoenix ix. Clothing An important and natural behaviour to improve thermal comfort is clothing adjustments. In winter, it was observed that people in Marrakech tend to wear clothes that cover most of their bodies in winter and in summer for both genders, and this is possibly due to cultural rules In Phoenix, on the other hand, people have less cultural restrictions on what they wear. Therefore, they wear lighter clothes particularly in summer e.g. T-shirts, shorts, short skirts, etc. The average clothing insulation value in Marrakech was twice as much as it was in Phoenix, 0.87 and 0.43 clo respectively. The difference in clothing insulation values between the two groups was also significant in summer. However, this difference was not as great as it was in winter. x. Changing place Since very little can be done to mitigate high air temperatures outdoors, in addition to clothing adjustments, moving from sun to shade is another way by which participants adapt to mitigate their thermal conditions. Seeking shade is an action of adaptation that people may use to reducing the effect of direct solar radiation on their bodies in outdoor 165
180 Chapter 7 Conclusions environments. Moving to shaded areas is not the only action observed during the study; using umbrellas is another form of adaptation seen during observations in Phoenix. People in Marrakech tend to avoid sitting under the direct sunlight in winter. In general, the percentage of people in shade to other under the sun is higher in Marrakech compared to Phoenix. The high number of people under the sun in Phoenix might be attributed to certain activities were taking place such as playing with water splash. The difference between the air temperature at which maximum attendance occurred in Marrakech and Phoenix was noticeable i.e 19 C and 28 C respectively. This finding might be linked to another finding in this study that levels of clothing insulation were significantly higher in Marrakech throughout the year. Therefore, people in Marrakech may feel thermally satisfied in a lower air temperature compared to the people in Phoenix. xi. Cold drinks Consuming cold or hot drink is one way to alter the metabolic rate as a behavioural action to make individuals feel thermally comfortable. Almost 60% of participants in Phoenix consumed cold drinks as a measure to maintain their thermal balance and eventually their sensation of thermal comfort. On the other hand, only 30% of participants in Marrakech consumed cold drinks. This can be due to cultural difference as it is unusual to see people, apart from tourists, in Marrakech sites holding or carrying a bottle of water or cold drink. On the other hand, it is typical for people in Phoenix sites to have water bottles not to mention ice creams and iced soft drinks. Consuming cold drinks in the sites investigated in this study is evidence that adaptation was taking place to mitigate thermal condition. 166
181 Chapter 7 Conclusions xii. Experience and expectations The past experience influences expectations of the thermal environment in an urban space to be in a certain condition. These expectations, sometimes, do not match the actual conditions in an urban open space and therefore influence the thermal perceptions of visitors. The neutral and preferred temperatures; in addition to the time spent by participants in the outdoor space were examined to study the effect of expectations on thermal comfort. The difference between the neutral temperature T n and the preferred temperature T p was 0.2 C and 1.0 C in Marrakech and Phoenix respectively. The small difference between neutral and preferred temperature indicates good level of weather expectation. Therefore, compared to Phoenix, people in Marrakech had more realistic expectations of the thermal conditions in a given time of the year. The time spent in the outdoor space is another factor that could be influenced by expectation. The time spent in space by the visitors who correctly predicted the weather condition was relatively longer in both cities. However, a larger sample is required to examine this phenomenon to be able to generalise. This study shows that participants who usually spend more time outdoors due to their life style, outdoors individuals, tend to stay longer in the studied sites compared with the indoors individuals who spend more time indoors. This is probably because the outdoor individuals have better experience of the outdoor conditions and respective thermal conditions. Experience has a strong link with expectations so that according to their past experience, people prepare themselves for the expected weather by choosing appropriated clothes, time of being outdoors, type of activity etc. The difference in thermal neutrality between winter and summer was greater within the Marrakech group compared to the Phoenix group. Also in this study, it was observed that the difference in thermal neutrality between the two cultural groups was greater in winter compared to summer. The difference was 4.0 C in winter and only 1.0 C in summer. The small difference in thermal neutrality between the two groups in summer indicates that participants from both cultures had similar expectations to weather conditions in the hot season. People know from their past experiences that air temperature in the hot season is higher than in the cool season so people tend to tolerate high temperatures in both Marrakech and Phoenix. In winter, however, the difference in the neutral temperatures was greater. The high level of clothing insulation in Marrakech is a possible cause of the relatively lower neutral temperature compared to Phoenix. 167
182 Chapter 7 Conclusions Cross-cultural outdoor thermal comfort evaluation Another important finding was that people from different cultures in the hot arid climate are likely to evaluate their thermal conditions differently. Culture can be defined as The system of information that codes the manner in which people in an organized group, society or nation interact with their social and physical environment. (Reber 1985). Therefore,Knez and Thorsson (2006) assumed in their study that different geographical/climatic zones can also be defined as different cultures. In their study in the temperate climate,knez and Thorsson (2006) suggested that urban public spaces with similar environmental conditions would be evaluated differently by people living in different cultures. They concluded that investigation is required on the cultural function of urban spaces in relation to their thermal conditions. The current study, therefore, examined how the thermal conditions are evaluated by people in different cultures in the hot arid climate, the subjective thermal evaluation of the two groups, in Marrakech and Phoenix, were compared against each other. (ASV) was used as a dependant variable and the two cultural groups as the independent variable. Chi-square (χ²) test of independence was conducted to compare (ASV) of Marrakech and Phoenix participants. The influence of culture appears when participants in Marrakech evaluated their thermal environment differently compared to Phoenix. Since no significant differences were found between the main environmental variables measured in Marrakech and Phoenix for the purpose of this study as can be seen in section in chapter 5; the reason why people in Marrakech and in Phoenix evaluated their thermal conditions differently is not necessarily due to differences in the environmental variables between the two cities. Other factors such as thermal adaptation that varies between the two cultures may influence this relationship Cross-cultural outdoor thermal comfort requirements People from different cultures in hot arid climates are likely to have diverse thermal comfort requirements. This study posed the question of whether there are any differences in the thermal comfort requirements, such as thermal sensitivity and thermal neutrality, between different cultures in the hot arid climate. Therefore, thermal sensitivity and neutrality of visitors of urban public spaces in Marrakech and Phoenix were examined. Because of the significance of the globe temperature T g, as a predictor of the thermal sensation that is found in this study, it was therefore used as a thermal index to calculate the neutral temperature and examine the thermal sensitivity. The sensitivity of participants 168
183 Chapter 7 Conclusions to the outdoor thermal conditions was evaluated by examining the mean thermal sensation vote responses plotted against the globe temperature T g. The fitted regression lines for subject sensation verses T g in the two cities are: In Marrakech: ASV = T g (R2 = 0.96, p<0.001) (1) In Phoenix: ASV = T g (R2= 0.96, p<0.001) (2) The values of (R²) in Equation (1) and (2) indicates a high significance between the subject thermal sensations ASV and the globe temperature T g, which supports similar findings obtained by the ordinal regression analysis presented above. The slope of fitted lines indicates the thermal sensitivity of subjects to such a variation. The slope value corresponds to C T g per sensation unit in Marrakech, and the slope value 0.112, corresponds to 8.92 C T g per sensation unit in Phoenix. It means that people in Marrakech were thermally comfortable at a wider range of T g. In other words, subjects in Phoenix were more sensitive to air temperature variations and solar radiation than subjects in Marrakech. A possible explanation of why people in Phoenix were found to be more thermally sensitive, might be that the majority of participants there were indoors just before coming outside, considering that most indoors spaces in Phoenix are air conditioned including dwellings, shops, cafes; as well as cars and public transportation. Actually, 86% of participants in Phoenix spaces were indoors just before visiting the outdoor space where they were interviewed compared to 60% in Marrakech. Moreover, participants in Phoenix were actually found to spend longer time in air conditioned spaces just before coming to the open space. In fact, 70% of participants in Phoenix were in an air conditioned space 60 minutes or less before the interview took place in summer. In Marrakech, however, only 12% of participants were in an air conditioned space 60 minutes or less before the interview. The neutral temperature (T n) can be calculated by using equations (1) and (2) when ASV= 0. Therefore, the neutral temperatures for Marrakech and Phoenix are C and C T g, respectively. As can be seen, the neutral temperature of Marrakech group is 2.30 C lower than that in Phoenix, which is likely due to the difference in clothing insulation between the two groups. The differences in thermal sensitivity and neutrality, between the two cultural groups in Marrakech and Phoenix, support the fact that thermal requirements of people in Marrakech and Phoenix must be considered separately despite the similarity in the prevailing climate in both locations. 169
184 Chapter 7 Conclusions Given the difference in the thermal requirements of urban public space visitors in Marrakech and Phoenix and the possibility of thermal adaptation occurrence, this study has attempted to investigate the underlying reasons for this difference. The adaptive approach to thermal comfort suggests that when it is challenging to enhance the immediate environment, people can take adaptive actions to ease their comfort conditions. The difference in the way visitors of public urban spaces adapt to their thermal environment may explain the differences between the thermal requirements of people in Marrakech and Phoenix. Therefore, the preferred temperatures were calculated for Marrakech and Phoenix. The preferred temperature is the temperature that people actually want, compared to the neutral temperature in which people feel comfortable. The smaller difference between the neutral and preferred temperature for a group of people is the more adapted with the thermal environment they are. The preferred temperatures for Marrakech and Phoenix participants are and C Tg respectively, with a difference of 2.80 C Tg, confirming that thermal requirements of people in Marrakech and Phoenix should be considered separately. This difference in preferred temperatures indicates the occurrence of thermal adaptation. Therefore, comparing the preferred temperatures with the neutral temperature could explain which group is better adapted to its environment. The smaller difference between the neutral temperature and the preferred temperature in Marrakech, compared to that in Phoenix, indicates that Marrakech participants were better adapted to their thermal environment Cross-cultural use of outdoor public spaces Another finding of this study is that people from different cultures in a hot arid climate may use urban public spaces differently. The influence of cultural differences on the use of outdoor space under certain climatic conditions was examined. Time, attendance, and activities were monitored and analysed. The number of people was higher in Marrakech urban spaces all around the year, yet the number of activities and time spent in Phoenix spaces were higher. In Marrakech, however, fewer activities were taking place and people were outdoors, mainly in groups, in the late afternoon because it is part of their daily routine to escape the over-heated dwellings as many reported, For example, some said: it is too hot at home at this time of the day. Phoenix, people generally tend to visit the outdoor spaces in individually or small groups and involved in activities such as reading, fishing, having lunch etc. They would move indoors where air conditioned spaces are available, such as in Tempe Marketplace; or they can go home where most dwellings are air conditioned. 170
185 Chapter 7 Conclusions The time spent outdoors in a hot arid climate is influenced by visitors thermal comfort, which proved to be influenced by expectations of the weather and the experience of the outdoor conditions. It seems that the participants who considered the weather conditions typical for the season tended to spend more time in the space. Those who did not consider the conditions as typical at the time of the interview, spent less time. Moreover, participants who usually spend more time outdoors or the outdoors individuals tend to stay longer in the studied sites compared with the indoors individuals who spend more time indoors. This is probably because of the experience of the outdoor individuals of the outdoor conditions and respective thermal conditions. The time spent outside is influenced by the environmental parameters. Solar radiation is shown to be a key parameter influencing the use of outdoor spaces in this study. The increasing intensity of mean solar radiation is associated with decreasing of the time spent in an outdoor space in a hot arid climate. The solar radiation values in both cities were decreasing from over 600 W/m 2 in the middle of the day to less than 200 W/m 2 in the evenings. The drop of solar radiation levels decreases the total heat gain of the body. Therefore, more thermally comfortable seating options should be available in public outdoor space for visitors to use. The number of people and activities in the studied urban public spaces were negatively and strongly correlated with the solar radiation levels in all seasons. Therefore, as the intensity of solar radiation increases the numbers of people and activities decreases taking into account the relatively high air temperatures in hot arid regions. One important implication of this finding is that a lack of consideration of microclimatic parameters may result in abandoned unshaded seating areas. It is possible though to mitigate the effect of solar radiation in outdoor spaces in hot arid climates. The design of outdoor open space in such a climate should eliminate the solar radiation when it is not desirable (i.e. in hot summer days) and it should allow access of solar radiation in the open space when it is required (i.e. early mornings in winter). Design-related environmental improvements may not be sufficient to bring life to outdoor public spaces in a hot arid climate. There were examples of open public spaces with acceptable physical design, yet they still have low levels of attendance and activities. On hot days, people choose not to be outdoors when getting to the indoor air conditioned space is an option. The availability of air conditioned premises is likely to make people less tolerant to the extra thermal load coming from the solar radiation in hot days. On the other hand, social activities appear to play an important role in attracting people to urban public spaces in the hot arid climate. Such activities could inspire groups and families to 171
186 Chapter 7 Conclusions visit the outdoor space even in the middle of the day as seen in Tempe Beach Park. Social activities, therefore, could stimulate both attendance and the time of stay in the outdoor space which can promote further activities to take place. A good urban outdoor space design in the hot arid climate is that which provides variations of shaded and unshaded seating areas and provides opportunities for social activities to develop. It gives people a chance to meet others, or to watch others. It is essential that the design of urban public spaces respond to the thermal environment of the hot arid climate. However, it is the type of activities which the space offers that encourages people to get involved and start socialising with others, spending longer time and therefore inspire more actives to take place. 7.5 Research contribution to knowledge The current study found that the solely physiological approach is insufficient to assess the outdoor thermal comfort conditions in hot arid climates. This finding is in agreement with Nikolopoulou et al. (2001) study in Cambridge in the UK, and another study by Thorsson et al. (2004a) in Sweden. Both studies showed that purely physiological approach is inadequate to characterise thermal comfort conditions outdoors. Environmental variables such as air temperature and solar radiation, could have a great impact on the use of the outdoor spaces in the hot arid climate, and may determine the number of people and activities in them. Although, air temperature is difficult to mitigate in the outdoor settings, solar radiation can be mitigated by design and landscaping. For example, providing trees that can be used as shelters from sun light with air temperature days, and it should allow the sun light in winter with low air temperature days. The study also shows that participants who usually spend more time outdoors due to their life style, outdoors individuals, tend to stay longer in the studied sites compared with the indoors individuals who spend more time indoors. This is probably because the outdoor individuals have better experience of the outdoor conditions and respective thermal conditions. Experience has a strong link with expectations so that according to their past experience, people prepare themselves for the expected weather by taking adaptive measures such as choosing appropriated clothes, time of being outdoors, type of activity etc. Another important contribution of this study was that people from different cultures in the hot arid climate are likely to evaluate their thermal conditions differently, have diverse thermal comfort requirements, and use urban public spaces differently as well. 172
187 Chapter 7 Conclusions Design-related environmental improvements is necessary but it may not be sufficient to bring life to outdoor public spaces in a hot arid climate. On the other hand, social activities appear to play an important role in attracting people to urban public spaces in the hot arid climate. Access to good open public spaces seems to be a need rather than a luxury for urban inhabitants, and open public spaces in the hot arid climate that offer good design and allow social activities are likely to influence their user to stay longer. 7.6 Recommendations for future research It is recommended that further research on outdoor thermal comfort in hot arid climates to be undertaken in the following areas: The design and allocation of seating elements require further investigation. What implication has the rigidity or flexibility of seats on the thermal comfort of users of the outdoor space? It would be particularly interesting to study the effect of seats allocation on the development of social activities in public spaces. The findings of such studies may lead to a better understanding of the relationship between comfort, design and social interaction in outdoor public spaces. Globe temperature was used in this study as the outdoor thermal comfort index. Other outdoor thermal comfort indices, for example, outdoor standard effective temperature (OUT_SET*) (Spagnolo and de Dear 2003) and physiological equivalent temperature (PET) (VDI 1998) might be used and compared for best evaluation. Further work needs to be done to cover more geographical areas within the hot arid climate since this study covers only Marrakech and Phoenix. Such an expansion may generalise the findings of this study or explain any particularity associated with the sites of current study. More research is needed to study the influence of thermal comfort on the use of outdoor public spaces in hot arid climates by young and older people. A greater focus should be on the relationship between thermal comfort and the time being spent by young and older people and how that may affect their health and will being in such climates. Investigating the thermal requirements and use of outdoor spaces by different social groups by using robust classification methods. This may extend the understanding of the thermal and particular needs of each of these groups. 173
188 References Al-ajmi, F.F., Loveday, D.L., Bedwell, K.H. & Havenith, G., Thermal insulation and clothing area factors of typical Arabian Gulf clothing ensembles for males and females: Measurements using thermal manikins. Applied Ergonomics, 39(3), pp Ali-Toudert, F., Djenane, M., Bensalem, R. & Mayer, H., Outdoor thermal comfort in the old desert city of Beni-Isguen, Algeria. Climate Research, 28(3), pp Ali-Toudert, F. & Mayer, H., Numerical study on the effects of aspect ratio and orientation of an urban street canyon on outdoor thermal comfort in hot and dry climate. Building and Environment, 41(2), pp Ali-Toudert, F. & Mayer, H., Effects of asymmetry, galleries, overhanging façades and vegetation on thermal comfort in urban street canyons. Solar Energy, 81(6), pp Arnfield, A.J., Two decades of urban climate research: A review of turbulence, exchanges of energy and water, and the urban heat island. International Journal of Climatology, 23(1), pp ASHRAE, ASHRAE Standard 55: Thermal environmental conditions for human occupancy. American Society of Heating, Refrigerating, and Air-Conditioning Engineers. Baker, N., Human Nature. In: K. Steemers & M.A. Steane, eds. Environmental diversity in architecture. London ; Spon Press, pp p. Baker, N. & Standeven, M., Thermal comfort for free-running buildings. Energy and Buildings, 23(3), pp Ballantyne, E., Hill, R. & Spencer, J., Probit analysis of thermal sensation assessments. International Journal of Biometeorology, 21(1), pp Bedford, T., The Warmth Factor in Comfort at Work: A Physiological Study of Heating and Ventilation. HM Stationery off. Bosselmann, P., Flores, J. & O'Hare, T., Sun and light for downtown San Francisco. Berkeley: University of California. Brager, G. & de Dear, R., Thermal adaptation in the built environment: a literature review. Energy and Buildings, 27(1), pp Brager, G.S., Field studies of thermal comfort and adaptation. USA: American Society of Heating, Refrigerating, and Air Conditioning Engineers. 174
189 Bruse, M. & Fleer, H., Simulating surface-plant-air interactions inside urban environments with a three dimensional numerical model. Environmental Modelling and Software, 13(3-4), pp Carr, S., Public space. Cambridge ; New York: Cambridge University Press. CIAM, Athens Charter. The Functional City. Athens: Congres Internationaux d'architecture Moderne. Clark, R.P. & Edholm, O.G., Man and his thermal environment. London: Edward Arnold. Cunningham, W.P., Environmental encyclopedia. Gale. Dalman, M., Salleh, E., Sapian, A.R., Tahir, O.M., Dola, K. & Saadatian, O., Microclimate and thermal comfort of urban forms and canyons in traditional and modern residential fabrics in Bandar Abbas, Iran. Modern Applied Science, 5(2), pp De Dear, R.J. & Brager, G.S., Thermal comfort in naturally ventilated buildings: Revisions to ASHRAE Standard 55. Energy and Buildings, 34(6), pp Dessi, V., People's behaviour in an open space as design indicator. 19th PLEA conference Design with climate. Toulouse, France. Dimoudi, A. & Nikolopoulou, M., Vegetation in the urban environment: Microclimatic analysis and benefits. Energy and Buildings, 35(1), pp Eliasson, I., Knez, I., Westerberg, U., Thorsson, S. & Lindberg, F., Climate and behaviour in a Nordic city. Landscape and Urban Planning, 82(1-2), pp Erell, E., Pearlmutter, D. & Williamson, T.J., Urban microclimate: designing the spaces between buildings. Routledge. Evans, G.W., Environmental stress. CUP Archive. Fanger, P. & Toftum, J., Extension of the PMV model to non-air-conditioned buildings in warm climates. Energy and Buildings, 34(6), pp Fanger, P.O., Thermal comfort : analysis and applications in environmental engineering. Copenhagen: Danish Technical Press. Francis, M., Urban open space : designing for user needs. Washington ; London: Island Press : Landscape Architecture Foundation. 175
190 Gehl, J., Life between buildings : using public space. 3rd ed. ed. Copenhagen: Arkitektens Forelag. Gehl, J., Life between the buildings : using public space. 6th ed. ed. Copenhagen: Danish Architectural Press. Gehl, J., Public spaces for a changing public life. In: C.W. Thompson & P. Travlou, eds. Open space: people space. Oxon: Taylor & Francis. Gehl, J., Life between buildings : using public space. 6rd ed. ed. London: Island Press. Gehl, J. & Gemzøe, L., New city spaces. The Danish Architectural Press Cph. Giridharan, R., Lau, S.S.Y., Ganesan, S. & Givoni, B., Lowering the outdoor temperature in high-rise high-density residential developments of coastal Hong Kong: The vegetation influence. Building and Environment, 43(10), pp Goulding, J., Lewis, J. & Steemers, T., Energy in architecture: the European passive solar handbook. Batsford. Griffiths, I.D., Huber, J.W. & Baillie, A.P., Year. Integrating the environment. In: T.C. Steemers & W. Palz, eds. European conference on architecture, 1987 Netherlands. Kluwer Academic Publishers for the Commission of the European Communities. Groat, L. & Wang, D., Architectural research methods. New York ; [Chichester]: Wiley. Heschong, L., Thermal delight in architecture. Cambridge, Mass. ; London: M.I.T. Press. Höppe, P., Die Energiebilanz des Menschen. Meteorologisches Institut, Univ. München. Höppe, P., The physiological equivalent temperature - A universal index for the biometeorological assessment of the thermal environment. International Journal of Biometeorology, 43(2), pp Humphreys, M., Field Studies of Thermal Comfort Compared and Applied. Building Research Establishment. Hwang, R.L. & Lin, T.P., Thermal comfort requirements for occupants of semi-outdoor and outdoor environments in hot-humid regions. Architectural Science Review, 50(4), pp
191 Hwang, R.L., Lin, T.P., Cheng, M.J. & Lo, J.H., Adaptive comfort model for treeshaded outdoors in Taiwan. Building and Environment, 45(8), pp Hwang, R.L., Lin, T.P. & Matzarakis, A., Seasonal effects of urban street shading on long-term outdoor thermal comfort. Building and Environment, 46(4), pp ISO7730, Ergonomics of the Thermal Environment Analytical Determination and Interpretation of Thermal Comfort using Calculation of the PMV and PPD Indices and Local Thermal Comfort Criteria. Geneva: International Standards Organisation. Jaccard, J., Study guide to accompany Jaccard/Becker's statistics for the behavioral sciences, second edition. Brooks/Cole. Jacobs, J., The life and death of great American cities. New York: Random House. Johansson, E., Influence of urban geometry on outdoor thermal comfort in a hot dry climate: A study in Fez, Morocco. Building and Environment, 41(10), pp Katzschner, L., Behaviour of people in open spaces in dependence of thermal comfort conditions. PLEA rd International Conference on Passive and Low Energy Architecture. Geneva, Switzerland, pp. I505-I509. Knez, I. & Thorsson, S., Influences of culture and environmental attitude on thermal, emotional and perceptual evaluations of a public square. International Journal of Biometeorology, 50(5), pp Konya, A., Design primer for hot climates. London: Architectural Press. Krüger, E., Pearlmutter, D. & Rasia, F., Evaluating the impact of canyon geometry and orientation on cooling loads in a high-mass building in a hot dry environment. Applied Energy, 87(6), pp Lin, T.P., Thermal perception, adaptation and attendance in a public square in hot and humid regions. Building and Environment, 44(10), pp Lin, T.P., De Dear, R. & Hwang, R.L., Effect of thermal adaptation on seasonal outdoor thermal comfort. International Journal of Climatology, 31(2), pp Lin, T.P., Matzarakis, A. & Hwang, R.L., Shading effect on long-term outdoor thermal comfort. Building and Environment, 45(1), pp Lindberg, F., Microclimate and Behaviour studies in an urban space, mothodology considerations in a multidisciplinary project. Conference on Public Space. Lund. 177
192 Lynch, K., The Openness of Open Space. In: G. Kepes, ed. Art of Environment. New York: Braziller, pp Madden, K. & Schwartz, A., How to turn a place around : a handbook for creating successful public spaces. New York : Project for Public Spaces, 2000 (2002 [printing]). Mahdjoubi, L., Designing Healthy and Inclusive Public Outdoor Spaces for Young People. In: T. Inns, ed. Designing for the 21st Century: Interdisciplinary Questions and Insights. Gower Publishing Limited. Makaremi, N., Salleh, E., Jaafar, M.Z. & GhaffarianHoseini, A., Thermal comfort conditions of shaded outdoor spaces in hot and humid climate of Malaysia. Building and Environment, 48(1), pp Matzarakis, A., Estimation and calculation of the mean radiant temperature within urban structures. Manual to RayMan. Mayer, H. & Höppe, P., Thermal comfort of man in different urban environments. Theoretical and Applied Climatology, 38(1), pp McCullagh, P., Regression models for ordinal data. Journal of the Royal Statistical Society. Series B (Methodological), pp McIntyre, D.A., Indoor climate. Elsevier. McLntyre, D.A. & Gonzalez, R.R., Man s thermal sensitivity during temperature changes at two levels of clothing insulation and activity,. ASHRAE Tran, 82( Mumford, L., The city in history : its Origins, its Transformations and its Prospects. New York: Harcourt Brace and World. Ng, E. & Cheng, V., Urban human thermal comfort in hot and humid Hong Kong. Energy and Buildings, 55(pp Nicol, F., Thermal Comfort: A Handbook for Field Studies Towards an Adaptive Model. University of East London. Nicol, F., A handbook of adaptive thermal comfort towards a dynamic model. 2nd ed. London: University of Bath. Nikolopoulou, M., 2011a. RUROS: rediscovering the urban realm and open spaces. Final project report for EU, Section, 6( 178
193 Nikolopoulou, M., 2011b. Urban Open Spaces and Adaptation to Climate Change. Applied Urban Ecology. John Wiley & Sons, Ltd, pp Nikolopoulou, M., Baker, N. & Steemers, K., Year. Thermal comfort in urban spaces: different forms of adaptation. In: REBUILD 1999, 1999 Barcelona. Nikolopoulou, M., Baker, N. & Steemers, K., Thermal comfort in outdoor urban spaces: understanding the human parameter. Solar Energy, 70(3), pp Nikolopoulou, M. & Lykoudis, S., Thermal comfort in outdoor urban spaces: Analysis across different European countries. Building and Environment, 41(11), pp Nikolopoulou, M. & Lykoudis, S., Use of outdoor spaces and microclimate in a Mediterranean urban area. Building and Environment, 42(10), pp Nikolopoulou, M. & Steemers, K., Thermal comfort and psychological adaptation as a guide for designing urban spaces. Energy & Buildings, 35(1), pp Pallant, J., SPSS survival manual : a step by step guide to data analysis using SPSS for Windows. Maidenhead, Open University Press. Park, M., Hagishima, A., Tanimoto, J. & Narita, K.I., Effect of urban vegetation on outdoor thermal environment: Field measurement at a scale model site. Building and Environment, 56(pp Payne, G., Social Divisions. 2nd ed. GB: Palgrave Macmillan. Pearlmutter, D., Berliner, P. & Shaviv, E., Physical modeling of pedestrian energy exchange within the urban canopy. Building and Environment, 41(6), pp Pearlmutter, D., Berliner, P. & Shaviv, E., Urban climatology in arid regions: Current research in the Negev desert. International Journal of Climatology, 27(14), pp Pearlmutter, D., Bitan, A. & Berliner, P., Microclimatic analysis of 'compact' urban canyons in an arid zone. Atmospheric Environment, 33(24-25), pp Platt, L., Poverty. In: G. Payne, ed. Social divisions. 2nd ed. Hampshire: Palgrave Macmillan. Reber, A.S., The Penguin dictionary of psychology. Harmondsworth: Penguin. Reps, J.W., The making of urban America: A history of city planning in the United States. Princeton University Press. 179
194 Roberst-Hughes, R., City Health Check: How design can save lives and money. Royal Institute of British Architects (RIBA). Shaftoe, H., Convivial Urban Spaces: Creating Effective Public Places. Earthscan LLC. Shashua-Bar, L., Pearlmutter, D. & Erell, E., The influence of trees and grass on outdoor thermal comfort in a hot-arid environment. International Journal of Climatology, 31(10), pp Shashua-Bar, L., Tzamir, Y. & Hoffman, M.E., Thermal effects of building geometry and spacing on the urban canopy layer microclimate in a hot-humid climate in summer. International Journal of Climatology, 24(13), pp Spagnolo, J. & de Dear, R., A field study of thermal comfort in outdoor and semioutdoor environments in subtropical Sydney Australia. Building and Environment, 38(5), pp Sugawara, H., Tanaka, H., Narita, K.-i., Nakano, T. & Mikami, T., How much cool air does an urban green park produce? Sugiyama, T. & Ward Thompson, C., Older people's health, outdoor activity and supportiveness of neighbourhood environments. Landscape and Urban Planning, 83(2 3), pp The World Factbook, People and Society :United States. 12 November 2013 ed.: Central Intelligence Agency Internet resource. Thorsson, S., Honjo, T., Lindberg, F., Eliasson, I. & Lim, E.M., 2004a. Thermal comfort conditions and patterns of behaviour in outdoor urban spaces in Tokyo, Japan. In: M.H.d. Wit, ed. 21st PLEA conference Design with climate. Eindhoven, The Netherlands. Thorsson, S., Honjo, T., Lindberg, F., Eliasson, I. & Lim, E.M., Thermal comfort and outdoor activity in Japanese urban public places. Environment and Behavior, 39(5), pp Thorsson, S., Lindqvist, M. & Lindqvist, S., 2004b. Thermal bioclimatic conditions and patterns of behaviour in an urban park in Göteborg, Sweden. International Journal of Biometeorology, 48(3), pp Tibbalds, F., Making people-friendly towns: improving the public environment in towns and cities. Taylor & Francis. UNESCO, World Development Indicators: Education completion and outcomes [Online]. UNESCO Institute for Statistics,. Available: [Accessed]. 180
195 UNFPA, State of World Population 2007: Unleashing the Potential of Urban Growth. New York. United Nations, National Accounts Main Aggregates Database [Online]. New York: The Economic Statistics Branch of the United Nations Statistics Division. [Accessed June 16th 2010]. United Nations, Demographic yearbook New York, p. 53. Van Hoof, J., Forty years of Fanger's model of thermal comfort: comfort for all? Indoor air, 18(3), pp Vardoulakis, S., Fisher, B.E., Pericleous, K. & Gonzalez-Flesca, N., Modelling air quality in street canyons: a review. Atmospheric environment, 37(2), pp VDI, VDI 3787 Environmental Meteorology. Methods for the human biometeorological evaluation of climate and air quality for the urban and regional planning. Part I: Climate. Beuth, Berlin. Whyte, W.H., Social life of small urban spaces. Washington: Conservation Foundation. WMO, World Weather Information Service [Online]. World Meteorological Organization. Available: [Accessed 09/03/ ]. Xi, T., Li, Q., Mochida, A. & Meng, Q., Study on the outdoor thermal environment and thermal comfort around campus clusters in subtropical urban areas. Building and Environment, 52(pp Yang, F., Lau, S.S.Y. & Qian, F., Urban design to lower summertime outdoor temperatures: An empirical study on high-rise housing in Shanghai. Building and Environment, 46(3), pp Yao, R., Li, B. & Liu, J., A theoretical adaptive model of thermal comfort-adaptive Predicted MeanáVoteá (apmv). Building and Environment, 44(10), pp Zacharias, J., Stathopoulos, T. & Wu, H., Microclimate and downtown open space activity. Environment and Behavior, 33(2), p Zacharias, J., Stathopoulos, T. & Wu, H., Spatial Behavior in San Francisco's Plazas: The Effects of Microclimate, Other People, and Environmental Design. Environment and Behavior, 36(5), p Zrudlo, L., The design of climate-adapted arctic settlements. Cities Designed for Winter, Building Book Ltd., Helsinki. 181
196 Appendix A: the questionnaire form University of Bath Department of Architecture & Civil Engineering Location Start time:. Date: No - A - 1. What is your sun preference at this moment? 1. Prefer more sun 2. No change 3. Prefer more shade 4. N/A MAP 2. How would you describe the wind situation at the moment? 1. Calm Very windy 3. How would you prefer the wind situation to be at the moment? 1. Prefer more wind 2. No change 3. Prefer less wind Map 4. What do you think of the humidity at this moment? 1. Damp Dry 5. At the moment, do you find the weather to be: 1. Cold 2. Cool 3. Neither cool nor warm 4. Warm 5. Hot 6. Would you like it to be: 1. Cooler 2. No Change 3. Warmer 7. With regard to the overall weather conditions here, do you feel comfortable at this moment? 182
197 1. Yes 2. No - B - 8. What would you do if it gets warmer/cooler? (Open question) 1. Change place 2. Clothes on 3. Clothes off 4. Hot drink 5. Cold drink 6. Nothing/ Don't know 7. Other:. 9. Did you live in an area with similar climate to this during your childhood? If no, what was the climate there? 1. Yes 2. No cooler/ colder 3. No warmer/hotter 10. Where do you spend most of your time during the weekdays? 1. Indoors 2. Equally between both 3. Outdoors 11. Do you think that today s weather is typical for this time of the year? 1. Yes 2. No 3. Don t know If no, what do you think it should be like? 1. Cooler/colder 2. Warmer/hotter 12. How often do you use this place? At least once 1. Every Day 2. Every Week 3. Every Month 4. Rarely 5. First time 13. Do you live or work in this area? 1. No 2. Yes, if yes where in the valley?.. For how long? 1. <1 year 2. 1 to 2 years 3. 2 to 3 years 4. 3 to 5 years 5. 5 to10 years 6. >10 years 14. What is the main reason for you to be in this place? (Open question) 1. Waiting 2. Break 3. Passin by 4. Going out/ enjoying the place 5. walking dog 6. other: Why did you choose this specific place to be in? (Open question) 183
198 1. Sun 2. Shade 3. Accessibility 4. Availability 5. Landscape 6. Other:. 16. How long ago did you arrive in this place? (Open question) 1. <15 min ago min min min min 6. >90 min 17. For how long do think you will stay? (Open question) 1. <15 min min min min min 6. >90 min 18. Where were you just before coming here? 1. Indoors 2. Outdoors 19. How long ago were you in an air-conditioned space (including vehicles)? (Open question) 1. <15 min ago min min min min 6. >90 min 20. How do you experience this place just now? 1. Boring Interesting 1. Attractive Unattractive 21. What do you like the most in this place? (Open question) 22. What do you not like the most in this place? (Open question) 23. Do you prefer to change your position in this place? 1. Yes 2. Doesn't matter 3. No If yes, what is the reason? (Open question) - C What do you do for living? (groups) 1. Highly skilled with Degree 2. Skilled with degree 3. Skille without degree 4. Non-skilled labour 5. Student/ housewife/ retired 6. No job Job s nam Your educational level is: 1. Basic 2. High school 3. College 4. University 184
199 26. How well would you say you are managing financially these days? 1. Living comfortably 2. Doing Alright 3. Just about getting by 4. Finding it quite difficult 5. Finding it very difficult End time: - D - Surface temperature:.. Interviewee has been sitting in: 1. Shade 2. Sun 3. Overcast Gender: 1. Male 2. Female Where is he/she sitting? 1. Bench 2. Ground 3. Grass 4. Other Age group: 1. < >60 Eating/ Drinking in the last 10 mins : 1. Eating 2. Hot drink 3. Cold drink 4. Nothing Activity in the last 10 mins: 1. lying 2. Seated 3. Standing 4. Walking Running Interviewee: 1. Alone 2. With others Clothing: 1.Trousers or 2.Skirt or 3.Dress (1.Long/2. Medium/ 3.Short), 4. Sweater or 5. Jacket (1.Thick/ 2.Light), 6.Coat (1.long/ 2.short), 7.Shirt or 8. T-shirt or 9. Vest (1.long/ 2.short/ 3.sleeveless) Local dress: Men: 1. Dishdasha 2. Besht 3. Tagia 4. Ghutra Women: 10. Islamic Dress 20. Abaya 30. Head scarf 40. Burqa Footwear: 1. Closed 2. Open Colour of clothes: 1. Dark 2. Mixed 3. Light 185
200 Appendix B: the observation form Location: Date: Time: 1. Morning 2. Noon 3. Evening No: Weather condition: 1. sunny, 2. overcast, 3. partly cloudy Time Activities From: 1-eating 2- drinking 3- smoking 4- chatting 5- reading 6- laying down 7- mobile 8- bicycle 9- walking dog To: 11- Dating 12- Fishing 13- Jogging 14-skating 15-Playing 16- picnicking 10- other: Children 12< ( C) Age Young people ( Y) Adults >18-64 Old people >64 ( L) Sex Male (X) Female(O) No of users Notes 186
201 Map 187


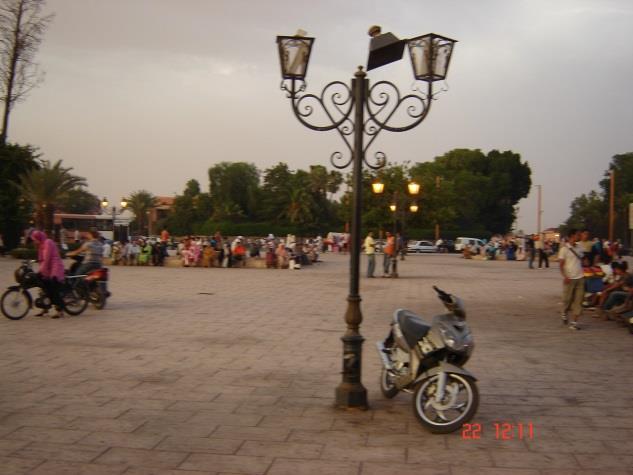
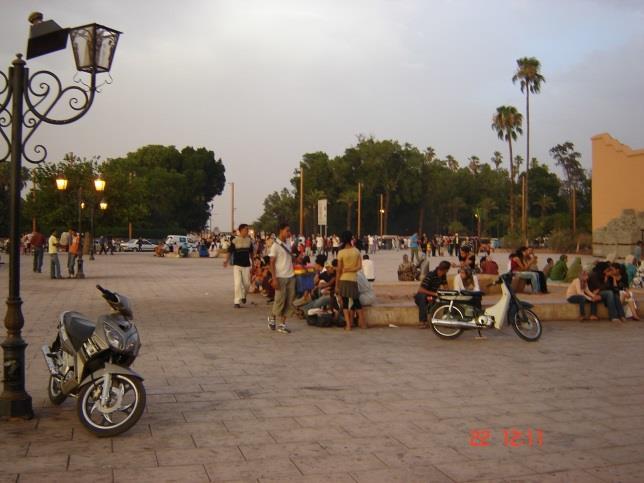
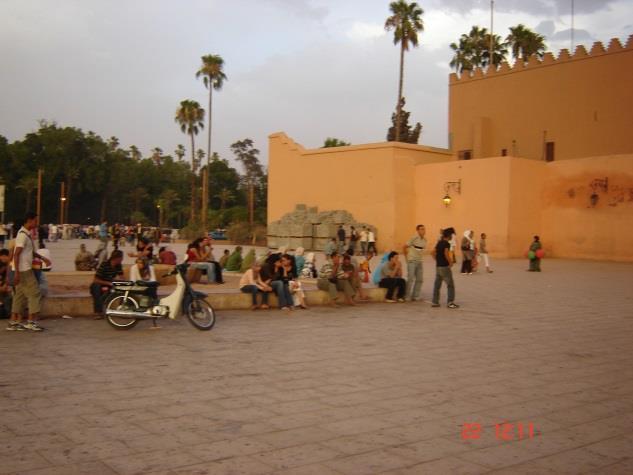
202 Appendix C: observation in Marrakech 188

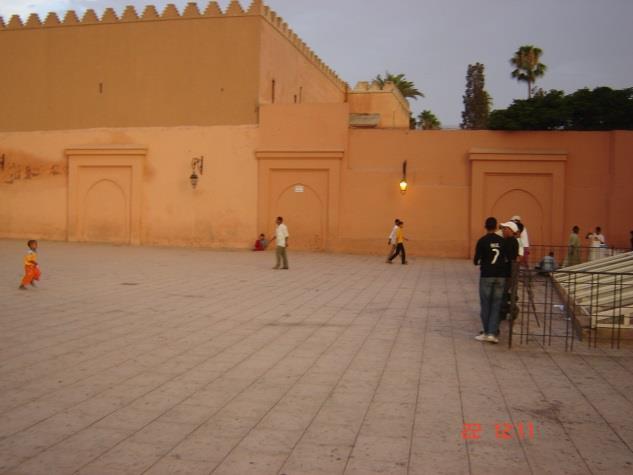
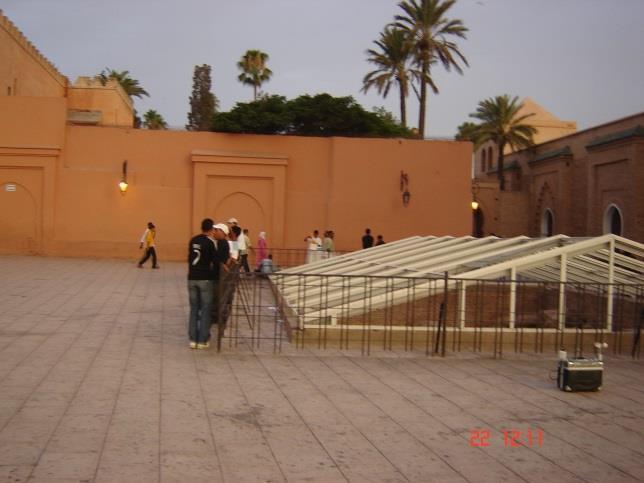
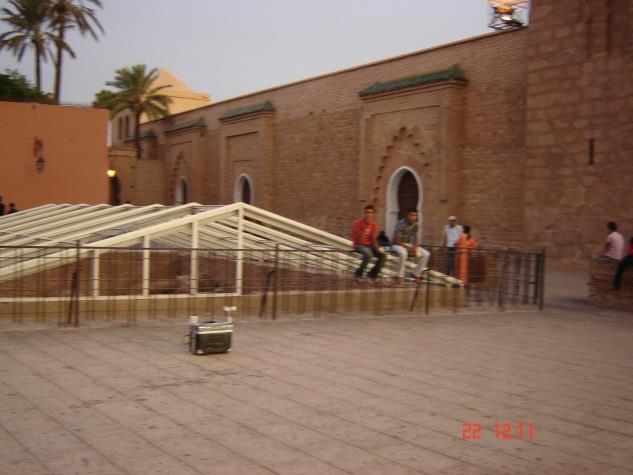
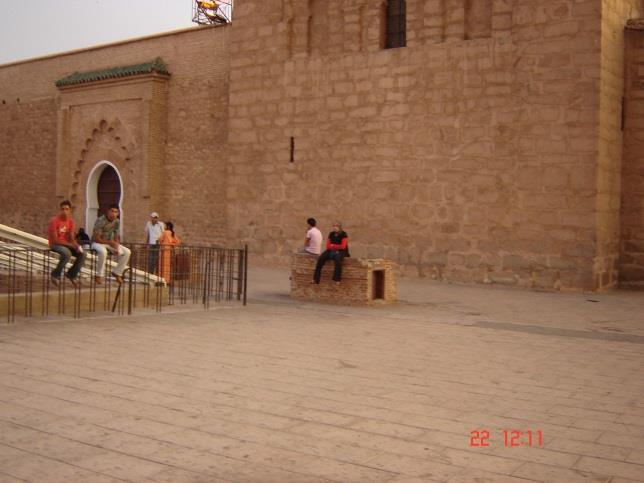
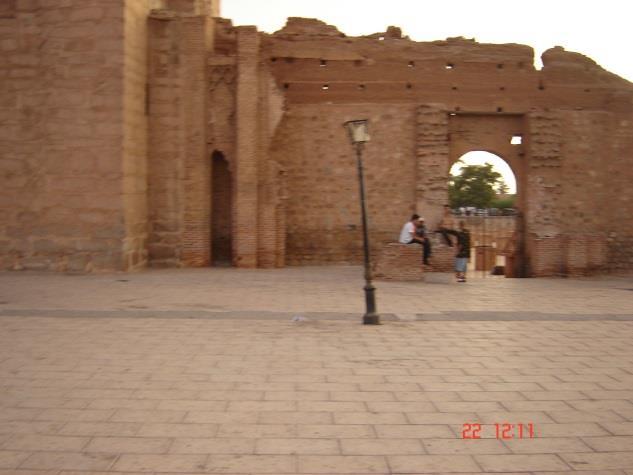
203 189


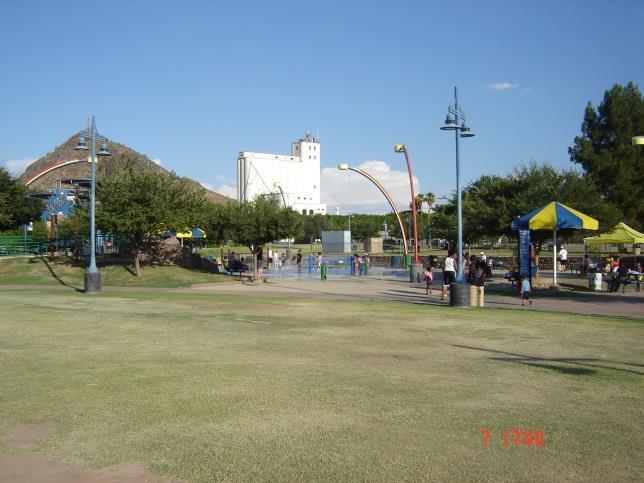
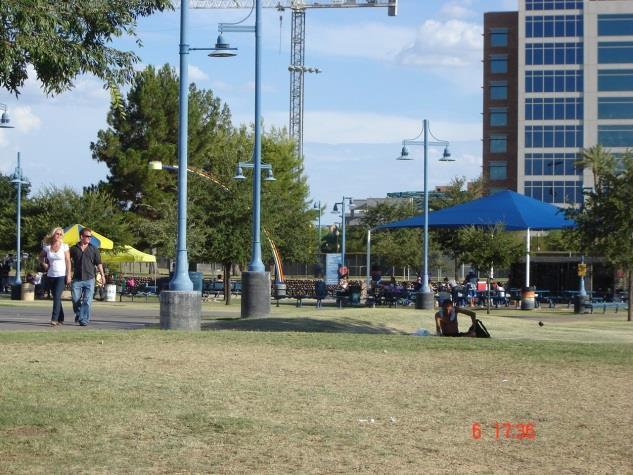
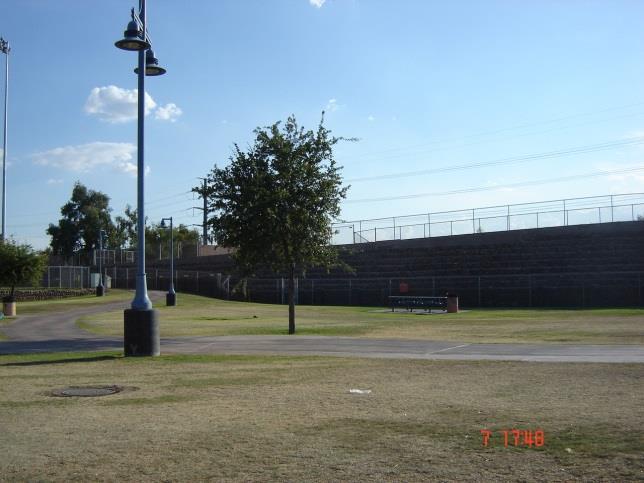
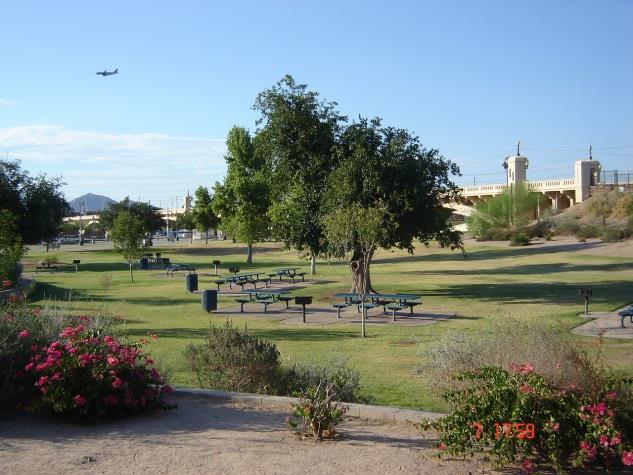
204 Appendix D: observation in Phoenix 190
Outdoor Thermal Comfort in the Hot Arid Climate The effect of socio-economic background and cultural differences
 Outdoor Thermal Comfort in the Hot Arid Climate The effect of socio-economic background and cultural differences FAISAL ALJAWABRA 1, MARIALENA NIKOLOPOULOU 1 Research Unit for the Engineering and Design
Thermal comfort conditions in outdoor spaces
 International Conference Passive and Low Energy Cooling 761 Thermal comfort conditions in outdoor spaces N. Gaitani and M. Santamouris University of Athens, Department of Physics, Division of Applied Physics,
THERMAL COMFORT OF A COURTYARD IN GUANGZHOU IN SUMMER
 THERMAL COMFORT OF A COURTYARD IN GUANGZHOU IN SUMMER L Jin 1,*, QL Meng 1 and LH Zhao 1 1 Building Environment Energy Laboratory, South China University of Technology, Guangzhou 510640, China Engineering
Bio Climatic Analysis of Bhubaneswar-An Investigation to Arrive Human Comfort through Natural Ventilation
 International Journal of Scientific and Research Publications, Volume 6, Issue 5, May 2016 557 Bio Climatic Analysis of Bhubaneswar-An Investigation to Arrive Human Comfort through Natural Ventilation
Behaviour of People in Open Spaces in Dependence of Thermal Comfort Conditions
 Behaviour of People in Open Spaces in Dependence of Thermal Comfort Conditions Lutz Katzschner University Kassel, Environmental Meteorological Institute, Planning Department, Kassel, Germany ABSTRACT:
A Comparison of Calculated and Subjective Thermal Comfort Sensation in Home and Office Environment
 Proceedings of Conference: People and Buildings held at the offices of Arup UK, 23rd September 2011. London: Network for Comfort and Energy Use in Buildings, http://nceub.org.uk A Comparison of Calculated
Information paper 17. Prepared by: David Clark. book:
 Information paper 17 Thermal comfort standards Prepared by: David Clark A paper referenced in the book: Cundall Johnston & Partners LLP. 2013 Issue 1.0: 29 July 2013 This information paper is one of a
REDEFINING APPROPRIATE THERMAL COMFORT STANDARD FOR NATURALLY VENTILATED BUILDINGS IN TROPICS (SINGAPORE AND INDONESIA PERSPECTIVE)
") REDEFINING APPROPRIATE THERMAL COMFORT STANDARD FOR NATURALLY VENTILATED BUILDINGS IN TROPICS (SINGAPORE AND INDONESIA PERSPECTIVE) H Feriadi, NH Wong *, S Chandra, KW Cheong, KW Tham Department of Building,
REDEFINING APPROPRIATE THERMAL COMFORT STANDARD FOR NATURALLY VENTILATED BUILDINGS IN TROPICS (SINGAPORE AND INDONESIA PERSPECTIVE) H Feriadi, NH Wong *, S Chandra, KW Cheong, KW Tham Department of Building,
Statistical Model Evaluation and Calibrations for Outdoor Comfort Assessment in South Florida.
 Statistical Model Evaluation and Calibrations for Outdoor Comfort Assessment in South Florida. Jean-Martin CALDIERON, Mate THITISAWAT, Kasama POLAKIT, Giancarlo MANGONE College for Design and Social Inquiry,
Adaptive Outdoor Thermal Comfort at an Urban Park in Malaysia
 Adaptive Outdoor Thermal Comfort at an Urban Park in Malaysia Rabiatul Adawiyah Nasir a, Sabarinah Sh Ahmad a* and Azni Zain-Ahmed b a Faculty of Architecture, Planning and Surveying, b Faculty of Applied
Using passive solutions to improve thermal summer comfort in timber framed houses in South-west France
 Using passive solutions to improve thermal summer comfort in timber framed houses in South-west France Sylvain Boulet 1, Stéphanie Armand-Decker 2, FCBA Technological Institute I2M-TREFLE laboratory -
PREDICTION OF THERMAL SENSATION IN NON-AIR- CONDITIONED BUILDINGS IN WARM CLIMATES
 PREDICTION OF THERMAL SENSATION IN NON-AIR- CONDITIONED BUILDINGS IN WARM CLIMATES PO Fanger and J Toftum * International Centre for Indoor Environment and Energy, Technical University of Denmark ABSTRACT
Adaptive Thermal Comfort in Warm Dry Climate: Economical dwellings in Mexico
 Adaptive Thermal Comfort in Warm Dry Climate: Economical dwellings in Mexico MARINCIC, I. 1 ; OCHOA, J. M. 1 ; ALPUCHE, M.G. 1 AND GÓMEZ-AZPEITIA, G. 2 1 Dpt. Architecture, University of Sonora, Hermosillo,
Visitors subjective estimations on thermal environment in public urban spaces
 Visitors subjective estimations on thermal environment in public urban spaces J Unger, N Kántor, L Égerházi Department of Climatology and Landscape Ecology, University of Szeged, Hungary unger@geo.u-szeged.hu
Air Movement Preference and Thermal Comfort A survey in classrooms during summer season in Brazil
 Air Movement Preference and Thermal Comfort A survey in classrooms during summer season in Brazil CHRISTHINA CÂNDIDO 1,4, RICHARD DE DEAR, ROBERTO LAMBERTS 1, LEONARDO BITTENCOURT 3 1 Federal University
REAL-TIME CONTROL OF OCCUPANTS THERMAL COMFORT IN BUILDINGS. Galway, Ireland
 REAL-TIME CONTROL OF OCCUPANTS THERMAL COMFORT IN BUILDINGS Magdalena Hajdukiewicz 1,2,3, Padraig O Connor 1, Colin O Neill 1, Daniel Coakley 1,2,3, Marcus M. Keane 1,2,3, Eoghan Clifford 1,2,3 1 Department
Outdoor Thermal Comfort of Two Public Squares in Temperate and Dry Region of Esfahan, Iran
 2010 International Conference on Science and Social Research (CSSR 2010), December 5-7, 2010, Kuala Lumpur, Malaysia Outdoor Thermal Comfort of Two Public Squares in Temperate and Dry Region of Esfahan,
COPYRIGHTED MATERIAL. Contents Overview WHAT'S IN THE SWL PRINTED WHAT'S IN THE SWL ELECTRONIC I NAVIGATION 20 VIII DETAILED DESIGN STRATEGIES E.
 WHAT'S IN THE SWL PRINTED I NAVIGATION 20 SWL Printed Contents SWL Electronic Contents Additional Navigation Methods II USING SUN, WIND & LIGHT 50 Buildings and Energy Use Design Decision Chart for Net-Zero
Assessment of thermal comfort in shopping centre transitional spaces
 Assessment of thermal comfort in shopping centre transitional spaces Marta Avantaggiato 1,2 *, Annamaria Belleri 1, Spencer M. Dutton 3, Wilmer Pasut 1 and Roberto Lollini 1 1 EURAC Research, Institute
AN ASSESSMENT OF THERMAL COMFORT IN NATURALLY VENTILATED ARCHITECTURAL STUDIO IN ABIA STATE UNIVERSITY, UTURU
 International Journal of Advance Studies in Engineering and Scientific Inventions Volume 3 Number 1, JULY 2015. ISSN (Print): 1741-8763 ISSN (Online):1741-8771 AN ASSESSMENT OF THERMAL COMFORT IN NATURALLY
Thermal comfort evaluation of natural ventilation mode: case study of a high-rise residential building
 J. Zuo, L. Daniel, V. Soebarto (eds.), Fifty years later: Revisiting the role of architectural science in design and practice: 50 th International Conference of the Architectural Science Association 2016,
Thermal Comfort in Architecture
 Thermal Comfort in Architecture Ommid Saberi [1], Parisa Saneei [2] Amir Javanbakht [3] 1. Ph.D. Student (Architecture & Energy) in Shahid Beheshti Uni. Tehran Iran e: omid_saberi@yahoo.com 2. Architect
Thermal comfort under transient seasonal conditions of a bioclimatic building in Greece
 54 2nd PALENC Conference and 28th AIVC Conference on Building Low Energy Cooling and Thermal comfort under transient seasonal conditions of a bioclimatic building in Greece A. Androutsopoulos Centre for
Thermal Comfort Evaluation of HDB flats
 Thermal Comfort Evaluation of HDB flats Objective Measurements For this study, empirical data on the thermal comfort parameters (i.e. room space temperature, velocity and relative humidity) was collected
SUBJECTIVE AND MEASURED THERMAL COMFORT IN ITALIAN UNIVERSITY CLASSROOMS IN HEATED AND FREE RUNNING CONDITIONS
 SUBJECTIVE AND MEASURED THERMAL COMFORT IN ITALIAN UNIVERSITY CLASSROOMS IN HEATED AND FREE RUNNING CONDITIONS Stefano Corgnati, Roberta Ansaldi, and Marco Filippi Department of Energy (DENER), Politecnico
CLIMATE CONTROL: INTENT/CRITERIA
 CLIMATE CONTROL: INTENT/CRITERIA This lecture is a review/restatement of information from ARCH 273. Thermal comfort and indoor air quality (coming up) are critical foundations for HVAC system design. Ball
Watts in a comfort index:
 Watts in a comfort index: Evaluating pedestrian energy exchange and thermal stress in urban environments David Pearlmutter Desert Architecture & Urban Planning Bona Terra Department of Man in the Desert
Prediction of Thermal Comfort. mech14.weebly.com
 Prediction of Thermal Comfort Thermal Sensation Scale (Rohles & Nevins, 1974) Fanger s Thermal Comfort Model (1982) Steady state model, applicable for M 3 met and a large group of people Fanger s Thermal
Cool spots in hot climates: a means to achieve pedestrian comfort in hot climates
 Cool spots in hot climates: a means to achieve pedestrian comfort in hot climates Priji Balakrishnan, MArch Architectural Association School of Architecture, London prijibalakrishnan@gmail.com ABSTRACT
Shifting Comfort Zone for Hot-Humid Environments
 PLEA6 - The rd Conference on Passive and Low Energy Architecture, Geneva, Switzerland, 6-8 September 6 Shifting Comfort Zone for Hot-Humid Environments Kitchai Jitkhajornwanich Faculty of Architecture,
A Field Study of Thermal Comfort in Open-plan Office Buildings during Transition Seasons in Harbin. Yunsong Han 1, 2, Huixuan Sun 1, 2, Cheng Sun 1, 2
 A Field Study of Thermal Comfort in Open-plan Office Buildings during Transition Seasons in Harbin Yunsong Han 1, 2, Huixuan Sun 1, 2, Cheng Sun 1, 2 1 School of Architecture, Harbin Institute of Technology,
681: Environmentally Responsive Architecture; Passive Design for School in Southern India
 681: Environmentally Responsive Architecture; Passive Design for School in Southern India Varun Kohli* Architectural Association School of Architecture, London, UK * varun.kohli@som.com Abstract This paper
Energy and indoor temperature consequences of adaptive thermal comfort standards
 Energy and indoor temperature consequences of adaptive thermal comfort standards L. Centnerova and J.L.M. Hensen Czech Technical University in Prague, Czech Republic (lada@tzb.fsv.cvut.cz) Technische Universiteit
Thermal comfort and psychological adaptation as a guide for designing urban spaces
 Energy and Buildings 35 (2003) 95 101 Thermal comfort and psychological adaptation as a guide for designing urban spaces Marialena Nikolopoulou a,*, Koen Steemers b,1 a Centre for Renewable Energy Sources
Cost-Benefit Analysis of Dwelling Retrofit Options
 Cost-Benefit Analysis of Dwelling Retrofit Options The objective was to study the thermal behaviour of the existing house and suggest cost effective improvements. Over recent years the energy efficiency
Available online at ScienceDirect. Procedia Engineering 169 (2016 )
") Available online at www.sciencedirect.com ScienceDirect Procedia Engineering 169 (2016 ) 158 165 4th International Conference on Countermeasures to Urban Heat Island (UHI) 2016 Indoor Thermal Comfort Assessment
Available online at www.sciencedirect.com ScienceDirect Procedia Engineering 169 (2016 ) 158 165 4th International Conference on Countermeasures to Urban Heat Island (UHI) 2016 Indoor Thermal Comfort Assessment
carbon-neutral architectural design Pablo La Roche CRC Press Taylor & Francis Croup Boca Raton London NewYork CRC Press is an imprint of the
 carbon-neutral architectural design Pablo La Roche CRC Press Taylor & Francis Croup Boca Raton London NewYork CRC Press is an imprint of the Taylor fit Francis Group, an informs business Contents Preface
PERSONAL COOLING USING THERMAL CONDUCTION ON THE DESK
 PERSONAL COOLING USING THERMAL CONDUCTION ON THE DESK J. Verhaart 1 ; R. Keune 1 ; M. Veselý 1 ; R. Li 1, W. Zeiler 1. 1: Dep. of the Built Environment, Rondom 70, 5612 AP, P.O. Box 513, 5600 MB Eindhoven,
Initial development of protocols for the study of outdoor thermal comfort. Johansson, Erik; Emmanuel, Rohinton; Thorsson, Sofia; Krüger, Eduardo
 Initial development of protocols for the study of outdoor thermal comfort Johansson, Erik; Emmanuel, Rohinton; Thorsson, Sofia; Krüger, Eduardo Published in: [Host publication title missing] Published:
Microclimatic effects of trees and vegetative ground cover in a hot-arid urban environment David Pearlmutter
 Microclimatic effects of trees and vegetative ground cover in a hot-arid urban environment David Pearlmutter Desert Architecture and Urban Planning ~ Blaustein Institutes for Desert Research Ben-Gurion
Prediction of outdoor human thermal states in non-uniform thermal loads
 http://www.***.net ICUC9@Toulouse BPH5 Human perception and new indicator, 23rd July Prediction of outdoor human thermal states in non-uniform thermal loads Yasuhiro SHIMAZAKI a,atsumasa YOSHIDA b, Takanori
URBAN HEAT ISLAND MITIGATION: LOOKING BEYOND POLICIES TO LOWER AIR TEMPERATURE
 Cities and Climate Change Conference March 5 7, 2018 Edmonton, Alberta, Canada URBAN HEAT ISLAND MITIGATION: LOOKING BEYOND POLICIES TO LOWER AIR TEMPERATURE Evyatar Erell Ben Gurion University of the
SENSITIVITY OF THERMAL CONDITIONS FOR TOURISM TO CLIMATE CHANGE AND VARIABILITY: A COMPARISON OF REGIONAL SCALE CASE STUDIES
 SENSITIVITY OF THERMAL CONDITIONS FOR TOURISM TO CLIMATE CHANGE AND VARIABILITY: A COMPARISON OF REGIONAL SCALE CASE STUDIES C R de Freitas 1 and A. Matzarakis 2 1 School of Geography, Geology & Environmental
Model Home 2020 project i CarbonLight Homes
 Model Home 2020 project i CarbonLight Homes Improving building performance without limiting the occupants Paul Hicks ACIAT Design Manager, VELUX Company Ltd. paul.hicks@velux.co.uk Executive Summary With
Bio-climatic Chart for Different Climatic Zones of Northeast India
 Proceedings of 3 rd International Conference on Solar Radiation and Day Lighting (SOLARIS 27) February 7-9, 27, New Delhi, India Copyright 27, Anamaya Publishers, New Delhi, India Bio-climatic Chart for
ATBU, Journal of Science, Technology & Education (JOSTE); Vol. 3 (4), December, 2015 ISSN:
; Vol. 3 (4), December, 2015 ISSN:") THERMAL COMFORT ASSESSMENT OF ENGINEERING WORKSHOP: A CASE STUDY OF UNIVERSITY OF MAIDUGURI By S. Shodiya 1 *, M.B. Oumarou 1, A.T Quadri 2, and A.B. Muhammed 1 1 Department of Mechanical Engineering,
THERMAL COMFORT ASSESSMENT OF ENGINEERING WORKSHOP: A CASE STUDY OF UNIVERSITY OF MAIDUGURI By S. Shodiya 1 *, M.B. Oumarou 1, A.T Quadri 2, and A.B. Muhammed 1 1 Department of Mechanical Engineering,
Designing Air-Distribution Systems To Maximize Comfort
 Designing Air-Distribution Systems To Maximize Comfort By David A. John, P.E., Member ASHRAE An air-distribution system that provides occupant thermal comfort can be a complicated system to predict and
Perception of Thermal Comfort for Naturally Ventilated High School Classrooms in San Rafael, CA
 Perception of Thermal Comfort for Naturally Ventilated High School Classrooms in San Rafael, CA GWENEDD MURRAY 1 1 Architectural Association, Inc., London, United Kingdom ABSTRACT: The primary intention
Optimizing Indoor Environments for Occupant Satisfaction. Presented by: Kelli Goldstone April 2016
 Optimizing Indoor Environments for Occupant Satisfaction Presented by: Kelli Goldstone April 2016 Outline Function of HVAC Thermal Comfort Air Distribution Radiant Heating / Cooling Case Study Function
CLIMATE CONTROL: OPR
 CLIMATE CONTROL: OPR A review/restatement of information from ARCH 273. Thermal comfort and indoor air quality (coming up) are critical foundations for active climate control (HVAC system) design. OPR
Available online at ScienceDirect. Procedia Engineering 121 (2015 )
") Available online at www.sciencedirect.com ScienceDirect Procedia Engineering 121 (2015 ) 1990 1997 9th International Symposium on Heating, Ventilation and Air Conditioning (ISHVAC) and the 3rd International
Available online at www.sciencedirect.com ScienceDirect Procedia Engineering 121 (2015 ) 1990 1997 9th International Symposium on Heating, Ventilation and Air Conditioning (ISHVAC) and the 3rd International
An Assessment of Thermal Comfort in Hot and Dry Season (A Case Study of 4 Theaters at Bayero University Kano)
") International Journal of Multidisciplinary and Current Research Research Article ISSN: - Available at: http://ijmcr.com An Assessment of Thermal Comfort in Hot and Dry Season (A Case Study of Theaters
International Journal of Multidisciplinary and Current Research Research Article ISSN: - Available at: http://ijmcr.com An Assessment of Thermal Comfort in Hot and Dry Season (A Case Study of Theaters
Evaluation methods for indoor environmental quality assessment according to EN15251
 Summary of this article was published in the REHVA European HVAC Journal Vol 49, Issue 4 (August), 2012, pages 14-19, available at http://www.rehva.eu/en/rehva-european-hvac-journal. Evaluation methods
James Marston Fitch American Building: The Environmental Forces that Shape It
 THERMAL COMFORT Ball State Architecture ENVIRONMENTAL SYSTEMS 1 Grondzik 1 James Marston Fitch American Building: The Environmental Forces that Shape It The fundamental thesis of this book is that the
Work environment. Microclimate - definition. Main microclimate elements. Core temperature. Microclimate
 Microclimate - definition Work environment Microclimate A local atmospheric zone where the climate differs from the surrounding area A small-scale site of special conditions within a larger climate Can
Assessment of outdoor thermal comfort and its relation to urban geometry
 Sustainable Development and Planning VI 3 Assessment of outdoor thermal comfort and its relation to urban geometry R. Cocci Grifoni 1, G. Passerini 2 & M. Pierantozzi 2 1 School of Architecture and Design,
Thermal Comfort Zone for Thai People
 Engineering, 013, 5, 55-59 http://dx.doi.org/10.436/eng.013.5506 Published Online May 013 (http://www.scirp.org/journal/eng) Thermal Comfort Zone for Thai People Juntakan Taweekun *, Ar-U-Wat Tantiwichien
Thermal Environment evaluation in commercial kitchens
 Downloaded from orbit.dtu.dk on: Nov 11, 2018 Thermal Environment evaluation in commercial kitchens Simone, Angela; Olesen, Bjarne W. Publication date: 2013 Link back to DTU Orbit Citation (APA): Simone,
Short-term acclimatization effects in an outdoor comfort study
 Short-term acclimatization effects in an outdoor comfort study EL Krüger, CA Tamura, M Schweiker, A Wagner, P Bröde Universidade Tecnológica Federal do Paraná, Curitiba, Brazil, ekruger@utfpr.edu.br Karlsruhe
A Field Study of the Thermal Environment in Residential Buildings in Harbin
 KC-03-13-4 (4664) A Field Study of the Thermal Environment in Residential Buildings in Harbin Zhao-Jun Wang, Ph.D. Gang Wang Le-Ming Lian ABSTRACT This paper presents the main findings of Project HIT.2000.25
SMART CONTROL FOR NATURAL VENTILATION HOUSE
 Proceedings of the 6th Annual ISC Graduate Research Symposium ISC-GRS 2012 April 13, 2012, Rolla, Missouri SMART CONTROL FOR NATURAL VENTILATION HOUSE ABSTRACT A series of investigations has been conducted
Assessing thermal comfort of dwellings in summer using EnergyPlus
 Assessing thermal comfort of dwellings in summer using EnergyPlus Irina Bliuc, Rodica Rotberg and Laura Dumitrescu Gh. Asachi Technical University of Iasi, Romania Corresponding email: irina_bliuc@yahoo.com
James Marston Fitch American Building: The Environmental Forces that Shape It
 THERMAL COMFORT Ball State Architecture ENVIRONMENTAL SYSTEMS 1 Grondzik 1 James Marston Fitch American Building: The Environmental Forces that Shape It The fundamental thesis of this book is that the
Evaluating the Building Performance of the Center for Promotion of Science in Block 39 in Belgrade, Serbia
 Evaluating the Building Performance of the Center for Promotion of Science in Block 39 in Belgrade, Serbia Berrak Balci Abstract This paper presents the evaluation of the building performance of the previously
BUILDING DESIGN FOR HOT AND HUMID CLIMATES IMPLICATIONS ON THERMAL COMFORT AND ENERGY EFFICIENCY. Dr Mirek Piechowski 1, Adrian Rowe 1
 BUILDING DESIGN FOR HOT AND HUMID CLIMATES IMPLICATIONS ON THERMAL COMFORT AND ENERGY EFFICIENCY Dr Mirek Piechowski 1, Adrian Rowe 1 Meinhardt Building Science Group, Meinhardt Australia 1 Level 12, 501
THE EFFECTS OF INDOOR ENVIRONMENT IN SUPERMARKET ON CLIENTS' AND OPERATORS' SATISFACTION
 THE EFFECTS OF INDOOR ENVIRONMENT IN SUPERMARKET ON CLIENTS' AND OPERATORS' SATISFACTION Wei l. Gu 1,2, Han Q. Wang 3, and Guang X. Kou 3 1 School of energy and power engineering, Central South University,
STUDIES ON THERMAL COMFORT AND ENERGY CONSUMPTION OF HVAC SYSTEM
 STUDIES ON THERMAL COMFORT AND ENERGY CONSUMPTION OF HVAC SYSTEM B Liu,*, N Zhu 2, RQ Zhang.Dep. Of Refrigeration, Tianjin University of Commerce, 334, lbtjcu@tjcu.edu.cn 2.Environment School, Tianjin
Greening the desert city: The challenge of microclimatic moderation in arid urban areas
 Greening the desert city: The challenge of microclimatic moderation in arid urban areas David Pearlmutter Blaustein Institutes for Desert Research Ben-Gurion University of the Negev, Israel Green Infrastructures
Design and retrofitting of a hybrid building in Athens
 International Conference Passive and Low Energy Cooling 597 Design and retrofitting of a hybrid building in Athens A. Gavalas Gavalas Architects, Athens ABSTRACT This paper s aim is to present a building
Copyright: URL to conference website: Date deposited: This work is licensed under a Creative Commons Attribution-NonCommercial 3.
 Ledisma G, Hamza N. Assessment of thermal comfort and passive design strategies in Millennium Schools in Ecuador. In: 33rd International Conference Passive Low Energy Architecture PLEA 2017. 2017, Edinburgh,
Investigation and Analysis of Winter Classroom Thermal Environment. In Chongqing
 ESL-IC-61-8 ICEBO26, Shenzhen, China Investigation and Analysis of Winter Classroom Thermal Environment In Chongqing Jing Liu Baizhan Li Runming Yao Postgraduate Ph.D Ph.D Professor Senior researcher Chongqing,
An Approach to Human Adaptability towards its Built Environment: A Review
 Energy and Power Engineering, 2010, 2, 90-94 doi:10.4236/epe.2010.22013 Published Online May 2010 (http://www.scirp.org/journal/epe) An Approach to Human Adaptability towards its Built Environment: A Review
Thermal comfort assessment of Danish occupants exposed to warm environments and preferred local air movement
 Downloaded from orbit.dtu.dk on: Mar 08, 2019 Thermal comfort assessment of Danish occupants exposed to warm environments and preferred local air movement Simone, Angela; Yu, Juan ; Levorato, Gabriele
A deep courtyard as the best building form for desert climate, an introduction to effects of air movement (Case study: Yazd)
") DESERT DESERT Online at http://jdesert.ut.ac.ir DESERT 15 (2010) 19-26 A deep courtyard as the best building form for desert climate, an introduction to effects of air movement (Case study: Yazd) Sh. Heidari
DESERT DESERT Online at http://jdesert.ut.ac.ir DESERT 15 (2010) 19-26 A deep courtyard as the best building form for desert climate, an introduction to effects of air movement (Case study: Yazd) Sh. Heidari
Thermal comfort in primary schools: a field study in Chile
 Proceedings of 8 th Windsor Conference: Counting the Cost of Comfort in a changing world Cumberland Lodge, Windsor, UK, - April. London: Network for Comfort and Energy Use in Buildings, http://nceub.org.uk
Assessment possibilities of thermal comfort by micro scale models
 COMECAP 2014 e-book of proceedings vol. 2 Page 203 Assessment possibilities of thermal comfort by micro scale models Matzarakis A. The quantification of thermal bioclimate assessment is based on the human
SUPERVISOR CONFIRMATION NAME OF SUPERVISOR : DR MOHAMMED HARIRI BIN BAKRI DATE :
 SUPERVISOR CONFIRMATION I/We, hereby declared that I/We had read through this thesis and in my/our opinion that this thesis is adequate in terms of scope and quality which fulfil the requirements for the
POST OCCUPANCY DESIGN INERVENTION TO IMPROVE COMFORT AND ENERGY PERFORMANCE IN A DESERT HOUSE
 POST OCCUPANCY DESIGN INERVENTION TO IMPROVE COMFORT AND ENERGY PERFORMANCE IN A DESERT HOUSE Vidar Lerum Arizona State University P O Box 871605, Tempe, AZ, 85287-1605, USA vidar.lerum@asu.edu Venkata
Green Space Influence on Thermal Comfort Contrasting approaches in the assessment of conditions in Bragança (Portugal)
") Green Space Influence on Thermal Comfort Contrasting approaches in the assessment of conditions in Bragança (Portugal) ARTUR GONÇALVES 1, ANTÓNIO RIBEIRO 1, LUIS NUNES 1, FILIPE MAIA 1 E MANUEL FELICIANO
Green Space Influence on Thermal Comfort Contrasting approaches in the assessment of conditions in Bragança (Portugal) ARTUR GONÇALVES 1, ANTÓNIO RIBEIRO 1, LUIS NUNES 1, FILIPE MAIA 1 E MANUEL FELICIANO
Design Strategies and Guide lines for Tropical Coast of Pakistan, Using Climate Consultant
 European Journal of Sustainable Development (2016), 5, 3, 505-512 ISSN: 2239-5938 Doi: 10.14207/ejsd.2016.v5n3p505 Design Strategies and Guide lines for Tropical Coast of Pakistan, Using Climate Consultant
Towards green design guidelines for thermally comfortable streets
 Towards green design guidelines for thermally comfortable streets WIEBKE KLEMM, Wageningen University, Landscape Architecture Group, The Netherlands, wiebke.klemm@wur.nl SANDA LENZHOLZER, Wageningen University,
Microclimate improvement through redesign of open urban areas with bioclimatic criteria in a city centre
 Microclimate improvement through redesign of open urban areas with bioclimatic criteria in a city centre Dimoudi A. 1, *, Zoras St. 1, Tamiolaki A-M. 2 Dimoudi S. 2, Liveris P. 3, Pallas Chr. 4, Stathis
HVAC INTEGRATED CONTROL FOR ENERGY SAVING AND COMFORT ENHANCEMENT vahid Vakiloroaya
 HVAC INTEGRATED CONTROL FOR ENERGY SAVING AND COMFORT ENHANCEMENT vahid Vakiloroaya (vahid.vakiloroaya@engineer.com) ABSTRACT: The overall attainable reduction in energy consumption and enhancement of
EMPLOYEE ATTRIBUTES, ORGANISATIONAL FACTORS, TIME MANAGEMENT TENDENCIES, AND EMPLOYEE PERFORMANCE IN CHARTERED UNIVERSITIES IN KENYA
 EMPLOYEE ATTRIBUTES, ORGANISATIONAL FACTORS, TIME MANAGEMENT TENDENCIES, AND EMPLOYEE PERFORMANCE IN CHARTERED UNIVERSITIES IN KENYA BY FRONICA MONARI RESEARCH THESIS SUBMITTED IN PARTIAL FULFILLMENT OF
Impacts of Indoor Temperature and Velocity on Human Physiology in Hot Summer and Cold Winter Climate in China
 Impacts of Indoor Temperature and Velocity on Human Physiology in Hot Summer and Cold Winter Climate in China Hong Liu 1, Baizhan Li 1, Liang Chen 1, Lu Chen 1, Jing Wu 1, Jie Zheng 1, Wenjie Li 1, Runming
Influence of Urban Morphology on Outdoor Thermal Comfort in Summer: A Study in Tunis, Tunisia
 Modern Environmental Science and Engineering (ISSN 2333-2581) April 2016, Volume 2, No. 4, pp. 251-256 Doi: 10.15341/mese(2333-2581)/04.02.2016/007 Academic Star Publishing Company, 2016 www.academicstar.us
OUTDOOR DESIGN CRITERIA: For the Central Phoenix/East Valley Light Rail Transit System
 OUTDOOR DESIGN CRITERIA: For the Central Phoenix/East Valley Light Rail Transit System Harvey Bryan, Ph.D. School of Architecture Arizona State University P.O. Box 871605 Tempe, AZ. 85287-1605 harvey.bryan@asu.edu
A Comparative Study of the Thermal Comfort of Different Building Materials in Sana a
 American Journal of Engineering and Applied Sciences, 6 (1): 20-24, 2013 ISSN: 1941-7020 2014 Alhaddad and Jun, This open access article is distributed under a Creative Commons Attribution (CC-BY) 3.0
NUMERICAL SIMULATION OF CAR COCKPIT HEATING DURING WINTER 1
 UNIVERSITY OF PITESTI SCIENTIFIC BULLETIN FACULTY OF MECHANICS AND TECHNOLOGY AUTOMOTIVE series, year XVI, no.20 ( 1 ) NUMERICAL SIMULATION OF CAR COCKPIT HEATING DURING WINTER 1 Cătălin NEACŞU 1, Mariana
Workshop: Architecture-Tradition and Modernization. Climate Responsive Urban Design
 Workshop: Architecture-Tradition and Modernization Climate Responsive Urban Design Trends of none sustainable planning Planners of the twentieth Century seem to have assumed that urban settlements were
An Employee Thermal Comfort Model for Semiconductor Manufacturing
 An Employee Thermal Comfort Model for Semiconductor Manufacturing Author Information Robbie Walls Corporate Ergonomist Intel Corporation MS CH10-22 5000 W. Chandler Blvd. Chandler, AZ 85226 Phone: (480)
Ocean Discovery Institute: Designing for Zero Net Energy
 CASE STUDY Ocean Discovery Institute: Designing for Zero Net Energy How one client used targeted energy analysis to navigate a limited budget and a tight schedule to join the ranks of San Diego s Zero
Microclimate and Thermal Comfort of Urban Spaces in Hot Dry Damascus. Influence of urban design and planning regulations
 Microclimate and Thermal Comfort of Urban Spaces in Hot Dry Damascus Influence of urban design and planning regulations Keywords Architecture Arid zones Damascus Hot dry regions Thermal indices Urban climate
Assessment of thermal comfort near a glazed exterior wall
 Assessment of thermal comfort near a glazed exterior wall Timothy Anderson 1, Mark Luther 2 and Tim Brain 3 1 School of Engineering, Auckland University of Technology, Auckland 1142, New Zealand 2 School
GREEN CONCEPT OF THERMAL COMFORT DESIGN FOR SUSTAINABLE HOUSING IN THE TROPICS: Learning from Thermal Comfort in School Buildings 1 INTRODUCTION
 Abstract GREEN CONCEPT OF THERMAL COMFORT DESIGN FOR SUSTAINABLE HOUSING IN THE TROPICS: Learning from Thermal Comfort in School Buildings Baharuddin Hamzah Department of Architecture, Hasanuddin University,
Comparison between thermal comfort predictive models and subjective responses in Italian university classrooms
 Comparison between thermal comfort predictive models and subjective responses in Italian university classrooms Roberta Ansaldi 1, Stefano Paolo Corgnati 1 and Marco Filippi 1 1 Department of Energy (DENER),
Bioclimatic Design Approach Integration into Architectural Design: a Library Case Study
 PLEA 2016 Los Angeles - 36 th International Conference on Passive and Low Energy Architecture. Cities, Buildings, People: Towards Regenerative Environments Bioclimatic Design Approach Integration into
Thermal Comfort Measurements in a Hybrid Ventilated Office Room
 Eawag 5237 Thermal Comfort Measurements in a Hybrid Ventilated Office Room Thomas Frank 1), Herbert Güttinger 2) and Stefan van Velsen 3) 1 Swiss Federal Laboratories for Materials Testing and Research
A field study of the performance of the Dutch Adaptive Temperature Limits guideline
 Proceedings of Clima 07 WellBeing Indoors A field study of the performance of the Dutch Adaptive Temperature Limits guideline Stanley Kurvers 1, Kees van der Linden 1, Marco van Beek 2 1 Delft University