IN SITU STABILIZATION OF GRAVEL ROADS WITH FLY ASH. Final Report
|
|
|
- Marilyn Higgins
- 5 years ago
- Views:
Transcription
1 IN SITU STABILIZATION OF GRAVEL ROADS WITH FLY ASH Final Report Reporting Period Start Date: April 1, 2006 Reporting Period End Date: August 31, 2008 Principal Authors: Felipe F. Camargo, Tuncer B. Edil, Craig H. Benson, and Wilfung Martono Date Report Issued: August 2008 DOE Award Number: 05-CBRC-M16 Submitting Organization: Board of Regents of the University of Wisconsin System UNIVERSITY OF WISCONSIN-MADISON Department of Civil and Environmental Engineering 1415 Engineering Drive, Madison, WI 53705

2 DISCLAIMER i
3 ii ABSTRACT The focus of this project is to develop a new large-volume application for selfcementing coal combustion products, namely in situ stabilization of gravel roads using self-cementing CCPs. Within the reduced scope of the project, the emphasis was placed on assessing the engineering properties of two recycled materials and a natural aggregate. Laboratory experiments were conducted in which a road surface gravel (RSG), a recycled pavement material (RPM), a natural crushed aggregate (Class 5 base) were tested to determine the California bearing ratio (CBR), resilient modulus (M r ), and unconfined compressive strength (UCS). The recycled materials were blended with two fly ash contents (10 and 15%) and three curing times (7, 28, and 56 d). A Class C fly ash with 0.7% loss on ignition was used. Resilient modulus and unconfined compression strength tests were also conducted after 5 cycles of freezing and thawing to asses the impact of freeze-thaw cycling. Unstabilized RSG and RPM had CBRs greater than that of Class 5 base, but all three materials had CBR less than typically desired for base course (CBR 50). RPM had a higher summary resilient modulus (SRM) than Class 5 base, whereas the summary resilient modulus (SRM) for RSG was slightly lower than that of Class 5 base. CBRs of RSG and RPM with fly ash were 3 to 11 times the CBR of unstabilized material alone. The CBR for RSG and RPM increased with increasing fly ash content. The UCS of RSG and RPM mixed with fly ash increased with increasing fly ash content and curing time, with significant increases occurring even after 28 d. The UCS was maintained even when the RSG and RPM were exposed to freezing. After 5 freezethaw cycles, the UCS of RSG and RPM mixed with fly ash was still higher (5 and 18%) than the UCS not subjected to freeze-thaw cycling. The SRM of RSG and RPM blended with fly ash increased with fly ash content and curing time, with the rate of increase being largest between 7 and 28 d of curing. Addition of fly ash reduced plastic strains of RSG and RPM during resilient modulus testing. Freeze-thaw cycling had a small effect on the SRM of Class 5 base, RSG, or RPM with or without fly ash, with no consistent effect for materials mixed with fly ash. Environmental assessment and field performance was undertaken relative to a segment of gravel county road (CR 53) that was stabilized with fly ash prior to paving in The field monitoring continued during the course of this project. The results are also presented and indicate a very successful application of the technology.
4 iii ACKNOWLEDGEMENT This study is financially supported by Combustion Byproducts Recycling Consortium, a program of West Virginia University in cooperation with the U.S. Department of Energy National Energy Technology Laboratory. Additional financial support is received from LaFarge North America and Great River Energy. The Minnesota Local Roads Research Board (LRRB), Minnesota Department of Transportation and Chisago County, Minnesota provided support for the field study. The technical support of the late Professor Peter J. Bosscher to improve resilient modulus testing is gratefully acknowledged.
5 iv EXECUTIVE SUMMARY The focus of this project is to develop a new large-volume application for selfcementing coal combustion products, namely in situ stabilization of gravel roads using self-cementing CCPs. Within the reduced scope of the project, the emphasis was placed on assessing the engineering properties of two recycled materials and a natural crushed aggregate for comparison purposes. Laboratory experiments were conducted in which a road surface gravel (RSG) and a recycled pavement material (RPM) were tested to determine the California bearing ratio (CBR), resilient modulus (M r ), and unconfined compressive strength (UCS). Results of these tests were compared to the properties of a conventional base material (Class 5 base). The recycled materials were blended with two fly ash contents (10 and 15%) and three curing times (7, 28, and 56 d). A Class C fly ash with 0.7% loss on ignition was used. Resilient modulus and unconfined compression strength tests were also conducted after 5 cycles of freezing and thawing to asses the impact of freeze-thaw cycling. RSG and RPM had CBRs greater than that of Class 5 base, but all three materials had CBR less than typically desired for base course (CBR 50). After 7 d of curing, CBRs of RSG with fly ash (183 and 334) were 6 to 11 times the CBR of RSG alone (31) whereas CBRs of RPM with fly ash (67 and 134) were 3 to 6 times the CBR of RPM alone (22). The CBR for RPM and RSG increased with increasing fly ash content. The UCS for RSG with fly ash ranged from 1.41 to 3.61 MPa, whereas the UCS for RPM with fly ash ranged from 0.78 to 2.26 MPa. The UCS of RSG and RPM mixed with fly ash increased with increasing fly ash content and curing time, with significant increases occurring even after 28 d. The UCS was maintained even when the RSG and RPM were exposed to freezing. After 5 freeze-thaw cycles, the UCS of RSG and RPM mixed with fly ash was higher (5 and 18%) than the UCS not subjected to freeze-thaw cycling. RPM had a higher summary resilient modulus (SRM) than Class 5 base, whereas the SRM for RSG was slightly lower than that of Class 5 base. RPM also exhibited smaller plastic strains during resilient modulus testing than Class 5 base, whereas RSG showed similar plastic strains to Class 5 base. SRM for RSG and RPM mixed with fly ash were independent of bulk stress and were described by a single modulus. The SRM of RSG blended with fly ash ranged from 5800 to MPa, whereas the SRM of RSG alone was 212 MPa. The SRM of RPM with fly ash ranged from 1800 to 6800 MPa, whereas SRM of RPM alone was 309 MPa. The SRM of RSG and RPM blended with fly ash increased with fly ash content and curing time, with the rate of increase being largest between 7 and 28 d of curing. Addition of fly ash reduced plastic strains of RSG and RPM during resilient modulus testing. Freeze-thaw cycling had a small effect on the SRM of Class 5 base (7% change), RPM (15% change), or RSG (5% change) with or without fly ash, with no consistent effect for materials mixed with fly ash. Environmental assessment and field performance was undertaken relative to a segment of gravel county road (CR 53) that was stabilized with fly ash prior to paving in The field monitoring continued during the course of this project. The results are also presented and indicate a very successful application of the technology with minimal environmental impacts.
6 v PART I LABORATORY INVESTIGATION LIST OF FIGURES Fig. 1. Fig. 2. Fig. 3. Fig. 4. Fig. 5. Fig. 6. Fig. 7. Fig. 8. Fig. 9. Particle size distribution for Class 5 base used in this study with MnDOT Class 5 specifications (a) and RSG with AASHTO surface course specifications (b). Particle size distributions for Class 5 base, RPM, and RSG. Compaction curves for Class 5 base, RPM, and RSG for standard compactive effort. Internal LVDT clamps mounted on a resilient modulus specimen. Compaction curves for (a) RPM and (b) RSG blended with different fly ash contents. CBR and dry unit weight with moisture content for (a) Class 5 base, (b) RPM, and (c) RSG. Photograph of gravel content from a sample of Class 5 base. CBR (a) and normalized CBR (b) with fly ash content for RSG and RPM. Unconfined compression strength for RPM (a) and RSG (b) blended with fly ash. Fig. 10. Freeze-thaw effects on UCS of recycled materials with 10% fly ash (28 d cure). Fig. 11. Summary resilient modulus for Class 5 base, RPM, and RSG. Fig. 12. Resilient modulus test showing no trend in resilient modulus with bulk stress (RSG with 15% fly ash, 7 d cure, trial 2). Fig. 13. Summary resilient modulus with fly ash content for recycled materials. Fig. 14. Summary resilient modulus with curing time for recycled materials with 10% fly ash. Fig. 15. Summary resilient modulus of base materials (a) and recycled materials with 10% fly ash (28 d cure) (b) before and after 5 freeze-thaw cycles. Fig. 16. SRM as a function of UCS for all recycled material specimens blended with fly ash. Fig. 17. SRM as a function of initial tangent modulus (E i ) (a) and modulus at 50% strain (E 50 ) (b) from UC test for all recycled material specimens blended with fly ash. Fig. A.1. Summary resilient modulus based on external LVDT data as a function of fly ash content for base materials. Fig. A.2. Summary resilient modulus based on external LVDT data as a function of curing time for recycled materials blended with 10% fly ash. Fig. A.3. Summary resilient moduli of base materials based on external LVDT data before and after 5 freeze-thaw cycles. Fig. A.4. Summary resilient moduli of recycled materials blended with 10% fly ash (28 d cure) based on external LVDT data before and after 5 freeze-thaw cycles. Fig. B.1. Sample CBR and compaction curves with water content.
7 vi Fig. C.1. Different stages of Class 5 production: pit run (a), sieving material (b), material retained (c), and final Class 5 blend (d). Fig. C.2. Different stages of RSG production: Class 5 base (a), material retained (b), mixing with fines (c), and final RSG blend (d). Fig. C.3. RSG (a), RPM (b), Class 5 (c); and Columbia fly ash (d). Fig. D.1. Compaction testing equipment. Fig. D.2. CBR testing equipment. Fig. D.3. Resilient modulus testing equipment. Fig. D.4. Unconfined compression testing equipment. Fig. D.5. Different stages of freeze-thaw M r testing: freezing specimens (a), thawing specimens (b), frozen end of a specimen (c), and frozen specimen in M r cell (d). Fig. E.1. Calibration for pressure gauge (a) and load cell (b) for resilient modulus test. Fig. E.2. Calibration for small internal LVDTs (a) and large internal LVDTs (b) for resilient modulus test. Fig. E.3. Calibration for external LVDTs for resilient modulus test. Fig. F.1. Resilient moduli from external LVDT measurements (a) and internal LVDT measurements (b) for Portage Sand. Fig. G.1. Resilient modulus tests on specimen of RPM with 10% fly ash with and without geotextiles. Fig. H.1. Temperature records for RPM (a) and RSG (b) with 10% fly ash (28 d cure). Fig. I.1. Ratio of internal to external SRM versus internal SRM for RPM and RSG with and without fly ash and Class 5 base. Fig. I.2. Ratio of internal to external M r versus internal M r for base materials (a) and boxplot of ratio of internal to external M r versus internal M r for base materials (b). Fig. I.3. Internal versus external M r for base materials. Fig. I.4. Ratio of internal to external M r versus internal M r for subgrade materials. Fig. I.5. Internal versus external M r for subgrade materials. Fig. I.6. Ratio of internal to external M r versus internal M r for recycled materials blended with fly ash. Fig. I.7. Internal versus external M r for recycled materials blended with fly ash. Fig. I.8. Ratio of external to internal M r versus internal M r for a range of materials.
8 vii LIST OF TABLES Table 1. Table 2. Table 3. Table 4. Index properties for Class 5 base, RPM, and RSG. Columbia fly ash physical properties and chemical composition (from Tastan 2005). Maximum dry unit weights and optimum CBRs for Class 5 base, RPM, and RSG with and without fly ash. Summary of unconfined compressive strengths of RPM and RSG blended with fly ash. Table 5. SRM and UCS of base materials with and without fly ash before and after 5 freeze-thaw cycles (28 d cure). Table 6. Table 7. Table 8. Summary resilient modulus and power model fitting parameters k 1 and k 2 (Eq. 4.1) for base materials with and without fly ash. Plastic strains, along with other material properties, for two RPMs and two conventional base aggregates. Slopes and p statistics from linear regression analysis for SRM of RPM and RSG with fly ash. Table 9. Typical resilient moduli for chemically stabilized soils (ARA 2004). Table 10. Recommended strengths and stiffness for recycled materials with and without fly ash. Table B.1. NCHRP 1-28A Procedure Ia resilient modulus test sequence for base and subbase materials. Table D.1. Volume for CBR and compaction (152-mm-diameter) PVC molds.
9 viii TABLE OF CONTENTS PART I LABORATORY INVESTIGATION DISCLAIMER... i ABSTRACT... ii ACKNOWLEDGEMENT... iii EXECUTIVE SUMMARY... iv LIST OF FIGURES... v LIST OF TABLES... vii TABLE OF CONTENTS...viii 1. INTRODUCTION BACKGROUND IN SITU PAVEMENT RECYCLING Hot In-Place Recycling Cold In-Place Recycling Full-Depth Reclamation RECYCLED ROADWAY MATERIALS BLENDED WITH FLY ASH EFFECT OF FREEZE-THAW CYCLING ON THE MECHANICAL PROPERTIES OF RECYCLED MATERIALS MATERIALS BASE AND RECYCLED MATERIALS FLY ASH METHODS COMPACTION / CALIFORNIA BEARING RATIO RESILIENT MODULUS UNCONFINED COMPRESSION FREEZE-THAW DURABILITY RESULTS AND ANALYSIS COMPACTION CALIFORNIA BEARING RATIO Base and Recycled Materials without Fly Ash Recycled Materials Blended with Fly Ash UNCONFINED COMPRESSION STRENGTH Effect of Fly Ash Content and Curing Time Effect of Freeze-Thaw RESILIENT MODULUS Base and Recycled Materials without Fly Ash...21
10 ix Effect of Fly Ash Content and Curing Time Effect of Freeze-Thaw Relationship between SRM and UCS SUMMARY AND CONCLUSIONS...28 REFERENCES...31 TABLES...35 FIGURES...46 APPENDIX A...64 APPENDIX B...69 APPENDIX C...76 APPENDIX D...81 APPENDIX E...88 APPENDIX F...92 APPENDIX G...95 APPENDIX H...98 APPENDIX I PART II ENVIRONMENTAL IMPACT AND FIELD PERFORMANCE MONITORING LIST OF FIGURES INTRODUCTION ENVIRONMENTAL DATA METEOROLOGICAL AND SUBSURFACE CONDITIONS TRACE ELEMENTS IN LYSIMETER DRAINAGE TRACE ELEMENTS IN CLT EFFLUENT FIELD MONITORING DATA CONCLUSIONS REFERENCES...122
11 1 1. INTRODUCTION There is growing interest in reducing construction costs and increasing sustainability when reconstructing paved roads and upgrading unpaved roads to paved roads. One approach is to use recycled materials in place of conventional materials. For example, road surface gravel (RSG) from a gravel road undergoing rehabilitation may be reused as the base layer for newly paved roads (Hatipoglu et al. 2008). Alternatively, recycled pavement material (a mixture of pulverized asphalt, base, and subgrade from the existing road) may be used as base course for the new pavement (Wen et al. 2004). In some cases, the strength and stiffness of these recycled materials are enhanced by blending them with cementitious material, such as fly ash from coal-fired electric power plants (Hatipoglu et al. 2008, Li et al. 2007). An impediment to more common use of recycled materials in roadway reconstruction is lack of information on their engineering properties. In addition, pavement engineers need to know how to design pavements using recycled materials that will yield equal or better performance than pavements constructed with virgin materials. This study was conducted to describe the engineering properties of a typical recycled pavement material (RPM) and recycled road surface gravel (RSG) blended with fly ash. The particular objectives of this study were to assess the engineering properties of recycled materials with and without fly ash and to study how freezing and thawing may affect the engineering properties of recycled pavement materials blended with fly ashes. This report describes the findings of this study. Background information is provided in Section 2. Materials and methods are described in Sections 3 and 4. Results and analysis are provided in Section 5. A summary and conclusions are in Section 6.
12 2 2. BACKGROUND 2.1 IN SITU PAVEMENT RECYCLING An alternative to common methods of pavement rehabilitation/reconstruction is to recycle the existing pavement materials. In situ recycling is a pavement rehabilitation method in which some, if not all, of the materials from the existing pavement are used for constructing a new pavement structure. In situ recycling is attractive because of the potential reduction in costs and consumption of natural resources. For example, the Nevada Department of Transportation (NDOT) has reported a savings of $600 million over a span of 20 years by employing in situ recycling methods in lieu of common reconstruction methods (Bemanian et al. 2006). Additional benefits of in situ recycling include conservation of energy, waste reduction, and reduction of greenhouse gas emissions (Kearney and Huffman 1999). There are three different types of in situ recycling in pavement rehabilitation: hot in-place recycling (HIR), cold in-place recycling (CIR), and full-depth reclamation (FDR). The three in situ recycling methods are typically classified according to the procedures used for recycling, and the materials to be recycled into the new pavement. Because of their similarity, however, the nomenclature for in situ recycling is often used interchangeably Hot In-Place Recycling Hot in-place recycling (HIR) is an in situ pavement rehabilitation process where a fraction of the existing asphalt course is used in the new asphalt surface. The existing asphalt is softened by applying heat, mechanically removed, blended with a chemical additive and virgin aggregates or asphalt if needed, and then replaced onto the pavement structure (Button et al. 1999). Typical HIR pavement depths range from 25 to 50 mm.
13 3 HIR is typically used to correct for pavement distress, such as rutting, corrugations, thermal cracking, raveling, flushing and loss of surface friction (Kuennen 1988). HIR is an attractive alternative for pavement rehabilitation because it has been shown to reduce construction costs and energy consumption by as much as 25% and 30%, respectively, when compared with conventional methods (Button et al. 1994) Cold In-Place Recycling Cold in-place recycling (CIR) is similar to hot in-place recycling, but without heat. CIR can be performed either partially or to the full depth of the existing pavement structure. Recycled asphalt pavement (RAP), the material obtained by pulverizing the existing asphalt layer, is reused for the new pavement. Typical depths for CIR range from 50 to 100 mm (Salomon and Newcomb 2000). CIR consists of pulverizing the existing asphalt layer to a specified depth, mixing the recycled asphalt pavement (RAP) aggregates with an emulsion, compacting the material to the desired density, and letting the material cure. The recycled layer is typically used as a base layer that is surfaced with a thin layer of wearing course. However, CIR has been used for surface course for roadways with low to medium traffic volume (Epps 1990). Typical chemical additives used in CIR include soft asphalt cements, cutback asphalt, foamed asphalt cements, and emulsions combined with cement, fly ash, or lime (AASHTO-AGC-ARTBA 1998) Full-Depth Reclamation Full-depth reclamation (FDR) consists of pulverizing and mixing the existing asphalt layer with the underlying aggregate base, and sometimes subgrade, to form a recycled base layer for a new asphalt pavement. This method is also referred to as fulldepth cold in-place recycling. A primary difference between FDR and CIR is the depth of
14 4 pulverization of the existing pavement. FDR extends 100 to 300 mm deep, depending on the dimensions of the existing pavement structure (Salomon and Newcomb 2000). In contrast, CIR consists of depths only 50 to 100 mm. The material generated from FDR, comprised of existing RAP and underlying base and subgrade materials, is referred to as recycled pavement material (RPM) (Li et al. 2007). RPM can be used as base course for a new pavement (Wilson et al. 1998). In practice, however, RPM is often mixed with a binder or admixture to enhance the strength and stiffness (Wen et al. 2004; Taha et al. 2002; Crovetti 2000; Misra et al. 2005; Li et al. 2007). RPM can be improved by adding good quality granular material, or by blending with Portland cement, hydrated lime, fly ash, or bituminous agents (slow or medium set asphalt emulsions) (Kearney and Huffman 1999). FDR is also used to upgrade unpaved pavements to asphalt pavements (Hatipoglu et al. 2008). The existing road surface gravel is blended with fly ash and reused as the base course of a new pavement. 2.2 RECYCLED ROADWAY MATERIALS BLENDED WITH FLY ASH The effect of RAP content on strength and stiffness may be an impediment for using recycled materials as base course for a new pavement (Taha et al. 1999; Cooley 2005; Kim et al. 2007). An alternative is to enhance the mechanical properties of recycled materials by adding cementitious fly ash. Cementitious fly ashes have been used to effectively improve the mechanical properties of soft subgrades (Edil et al. 2002; Senol et al. 2006). However, enhancing the mechanical properties of granular materials through fly ash addition is largely undocumented in the literature. Data on recycled materials blended with fly ash is even scarcer. Li et al. (2007) evaluated the use of recycled asphalt pavement blended with fly ash as base course during the reconstruction of a 0.5-km section of asphalt pavement in
15 5 Waseca, Minnesota. The recycled base layer was obtained by pulverizing the existing asphalt pavement and underlying materials to a depth of 300 mm, removing the uppermost 75 mm of RPM, uniformly spreading Class C fly ash (10% by dry weight) on the surface, and mixing the fly ash and RPM with water to a depth of 150 mm. Compaction was carried out within 1-2 hours of mixing and the final compacted layer was cured for 7 d prior to placing 75 mm of hot mix asphalt. Strength and stiffness of field and laboratory specimens were measured to evaluate the effectiveness of enhancing the mechanical properties of RPM through fly ash addition. Strength was measured by CBR tests, whereas stiffness was measured by resilient modulus (M r ) tests. Field-mix specimens were prepared by collecting fly ash treated RPM and compacting the mixture into CBR and M r molds. The specimens were prepared at dry unit weights measured in the field, sealed with plastic, and cured (7 d for CBR, 14 d for M r ) at 100% relative humidity. Laboratory-mix specimens were prepared from fly ash and RPM samples obtained during construction. These specimens were prepared to mean field water contents and dry unit weights. RPM-only specimens were prepared in a similar manner. CBR of RPM increased significantly with the addition of fly ash, ranging from 3 to 17 for RPM (laboratory) and from 70 to 94 for RPM with fly ash (laboratory). The RPM did not meet the CBR typically required for base course (CBR 50), whereas fly ash addition increased the CBR of RPM beyond 50. Field specimens exhibited CBRs approximately two thirds lower than laboratory specimens, but still had CBR significantly larger than RPM alone. Similar trends were observed for M r of RPM. Addition of fly ash increased the M r of laboratory RPM specimens appreciably (2.2 times, on average), whereas M r of field specimens were 25% lower, on average, than the M r of laboratory specimens.
16 6 A similar study was conducted by Hatipoglu et al. (2008) where cementitious fly ash was added to the existing road surface gravel (RSG) when upgrading a 3.5-km road section in Chisago, Minnesota from an unpaved road to a paved road. Cementitious offspecification fly ash was mixed (10% by dry weight) with the existing RSG and water to a depth of 250 mm and compacted within 1-2 hr. Following compaction, the RSG with fly ash was overlain by 90 mm of HMA within 3 to 7 d. Field and laboratory specimens of RSG and RSG with fly ash were prepared in the same manner as Li et al. (2007). However, the M r specimens were cured for 7 d as opposed 14 d. Results obtained by Hatipoglu et al. (2008) are very similar to those obtained by Li et al. (2007). The CBR of RSG was 24, thus not meeting the typical minimum CBR requirements for base course. However, RSG mixed with fly ash in the laboratory had a CBR of 154, whereas field-mix RSG had CBR ranging from 16 to 90. Field CBRs were as much as 60% lower than laboratory prepared specimens. Similar trends were observed for M r of RSG. Addition of fly ash increased the M r of laboratory prepared RSG by as much as 2 fold. In contrast to CBR, the M r of the RSG field specimens was higher than the M r of laboratory specimens. Wen et al. (2007, 2008) evaluated using high carbon fly ash to increase the strength and stiffness of RPM. They found that CBR and M r of RPM blended with fly ash were higher than CBR and M r for RPM without fly ash. Moreover, the CBR of RPM was lower than the CBR of conventional crushed aggregate, whereas the CBR of RPM blended with fly ash was at least comparable to the CBR of conventional crushed aggregate. The M r of RPM was higher than the M r of conventional crushed aggregate, but RPM exhibited higher plastic deformations than those of conventional crushed aggregate during M r testing. Addition of fly ash reduced plastic deformations for RPM, where RPM exhibited less plastic deformations than the conventional crushed aggregate.
17 7 Crovetti (2000) conducted falling weight deflectometer (FWD) tests on pavement test sections to evaluate the structural capacity of pavements containing recycled pavement material blended with fly ash (7% by dry weight) and asphalt emulsion (application rate of 7 L/m 2 ). Field structural capacity was computed from moduli defined from FWD tests. The test section containing recycled pavement materials blended with fly ash had the highest structural capacity, yielding increase in lifespan of 58% when compared to the control, and 28% when compared to the section with emulsified asphalt. No surface distresses were encountered in any of the test sections after one year of service. In a similar study, Wen et al. (2004) reported no surface distresses for test sections containing recycled pavement materials blended with fly ash after two years of service. Moreover, backcalculated FWD data indicated that the structural capacity of the test section containing fly ash increased 49% after 1 year of service. Addition of fly ash can also have detrimental effects on pavements. A series of cold in-place recycling (CIR) test sections using Class C fly ash were constructed by the Kansas Department of Transportation. Test sections with higher fly ash contents exhibited more initial cracking than those with lower fly ash contents. Cross and Young (1997) evaluated the durability, fatigue, and thermal cracking potential of laboratoryprepared samples of the CIR materials blended with Class C fly ash. Fatigue testing indicated an increase in brittleness with increasing fly ash content, which would yield a pavement structure with greater propensity for fatigue and thermal cracking. Thus, using more Class C fly ash than the necessary is not recommended. 2.3 EFFECT OF FREEZE-THAW CYCLING ON THE MECHANICAL PROPERTIES OF RECYCLED MATERIALS Little data are available on the effects of freeze-thaw cycling on the engineering properties of granular materials. Furthermore, even less data are available on the effects
18 8 of freeze-thaw cycling on the mechanical properties of recycled materials with and without fly ash. Simonsen et al. (2002) investigated the effects of one freeze-thaw cycle on the resilient modulus of 5 soils: glacial till, silty fine sand, coarse gravelly sand, fine sand, and marine clay. Specimens were compacted at optimum water content using kneading compaction. No inflow or outflow (closed system) was allowed during omnidirectional (3D) freezing and thawing. Resilient modulus testing was carried out according to AASHTO TP A reduction in resilient modulus was observed for all materials after 1 freezethaw cycle. The percent reduction in M r for each material was as follows: glacial till (27%), silty fine sand (19%), coarse gravelly sand (23%), fine sand (50%), and marine clay (57%). Simonsen et al. (2002) indicate that freezing and thawing results in a looser soil structure, which causes a lower resilient modulus. Rosa (2006) evaluated the effect of freeze-thaw on the engineering properties of one RSG and four RPMs mixed with fly ash. The materials were cured and then subjected to varying freeze-thaw cycles (0, 1, 3, 5, 10, and 12) using a closed system. Resilient modulus tests were performed after freeze-thaw cycling. The resilient modulus decreased with increasing freeze-thaw cycles, leveling off after 5 cycles. Reduction in resilient modulus for the coarse material-fly ash mixtures ranged from 7 to 42%, with an average of 24.5%. Furthermore, RPMs blended with fly ash showed higher reductions in resilient modulus as the fines content increased. Rosa (2006) also reports that the reduction in resilient modulus for materials blended with fly ash depends on the CaO content of the fly ash. For example, the M r decrease of RPM blended with fly ash having 25.8% CaO ranged from 19-29%, whereas the RPM blended with fly ash having 24.0% CaO showed reductions in M r ranging from 33-43%. No relationship was found between fly ash classification and reductions in M r after freeze-thaw cycling.
19 9 Zaman and Naji (2003) evaluated the effect of freeze-thaw cycling on a typical Oklahoma base aggregate blended with Class C fly ash (10% by dry weight). Resilient modulus and unconfined compression strength tests were conducted on specimens after 0, 4, 12, and 30 freeze-thaw cycles (3 and 28 d cure). Resilient modulus increased up to 12 freeze-thaw cycles for specimens cured for 28 d, but exhibited a drop in resilient modulus for 30 freeze-thaw cycles. The specimens cured for 3 d, however, showed an increase in resilient modulus up to 30 cycles. An increase in freeze-thaw cycles also resulted in an increase in UCS for all cases. The effect of freeze-thaw cycling on M r and UCS was attributed to retardation or acceleration of cementitious reactions. Baugh (2007) evaluated the effect of freeze-thaw cycling on the resilient modulus and unconfined compression strength of three recycled materials blended with cement kiln dust (5, 10, 15, and 20% by dry weight): recycled asphalt pavement (RAP), recycled pavement material (RPM), and road surface gravel (RSG). Specimens were prepared at 95% of maximum dry unit weight, cured for 7 d, soaked in water for 5 h, drained for 5 to 10 min, sealed in plastic, and subjected to freeze-thaw cycling (0, 5, and 10 cycles). Resilient modulus testing was carried out according to NCHRP 1-28A. The summary resilient modulus (SRM) of RAP and RPM blended with cement kiln dust (CKD) decreased after 5 freeze-thaw cycles (33 and 37% reduction in SRM), whereas no further reductions in SRM occurred after 10 freeze-thaw cycles. In contrast, the SRM of RSG blended with CKD decreased up to 10 freeze-thaw cycles. The maximum reduction in SRM observed was approximately 50%. Increasing the CKD content resulted in a higher reduction in SRM for a given material. The majority of the reduction in UCS for RAP and RPM also occurred within the first 5 freeze-thaw cycles (30% reduction in UCS). There was no observed trend in UCS of RSG blended with CKD as a function of freeze-thaw cycling, with a maximum change in UCS of 15%. The effect of freeze-thaw cycling on the SRM and UCS of the material-
20 10 fly ash mixtures was attributed to ice expansion and formation of ice lenses, which break the bonds created between the fly ash and particles and result in a loss of strength and stiffness. Li et al. (2007) conducted falling weight deflectometer (FWD) tests on a pavement structure, having a base layer of recycled pavement materials (RPM) blended with class C fly ash (10% by dry weight), to evaluate the changes in pavement modulus exposed to freeze-thaw cycling after the first winter after construction. FWD tests were conducted in 10 different stations along the pavement in November 2004 and August 2005 (3 months and 1 year after construction). Statistical analysis on the base moduli (RPM blended with fly ash) measured before and after 1 winter exposure showed the base moduli were statistically the same, suggesting no strength losses for the base layer after freeze-thaw cycling. Hatipoglu et al. (2008) conducted a similar study on a pavement having a base layer of road surface gravel (RSG) blended with class C fly ash (10% by dry weight). FWD tests were conducted in different stations along the pavement in November 2005, May 2006, and October 2006 (2 months, 8 months, and 1 year after construction). Statistical analysis of the base moduli indicated strength losses after one winter exposure (from November 2005 to May 2006) followed by an increase in base modulus (from May 2006 to October 2006). The median base moduli in May 2006 for RSG blended with fly ash were comparable to those of RPM blended with fly ash (Li et al. 2007), even though a drop in modulus occurred for the RSG base layer.
21 11 3. MATERIALS 3.1 BASE AND RECYCLED MATERIALS Two recycled materials and a conventional base material were selected for this study. The recycled materials consisted of a recycled pavement material (RPM) and a road surface gravel (RSG). The base material was a gravel meeting the Class 5 specifications for base course in Minnesota (MnDOT 2005). The Class 5 base was used as a control material. The Class 5 base and RSG were manufactured in the laboratory because the materials were not readily available for testing. RPM was obtained from a roadway reconstruction project in southwestern Madison, Wisconsin, near the intersection of Muir Field Road and Carnwood Road. The RPM was a blend of pulverized asphalt and limestone base layers created by removing the existing pavement (approximately equal thickness of asphalt and base), having an asphalt content of 4.6% (ASTM D 6307). RPM used for testing was sieved through the 25 mm sieve. Class 5 base meeting Minnesota Department of Transportation specifications (MnDOT) was created by blending pit run gravel obtained from Wimme Sand and Gravel (Plover, Wisconsin) with crushed pea gravel obtained from Midwest Decorative Stone and Landscape Supply (Madison, Wisconsin). The pit run gravel was sieved past the 25 mm sieve prior to blending with the pea gravel. The particle size distribution for the Class 5 base is shown in Fig. 1 (a) along with MnDOT specifications for Class 5 base used for base course applications. A typical RSG was created by blending the manufactured Class 5 base with washed limestone fines obtained from Rosenbaum Crushing and Excavating (Stoughton, Wisconsin). The Class 5 base was sieved past the 19 mm sieve prior to blending with the washed limestone fines. The RSG meets the American Association of State Highway and Transportation Officials (AASHTO) gradation requirements for the
22 12 surface course materials, as outlined in AASHTO M 147 (AASHTO 2001). The particle size distribution for RSG is shown in Fig. 1 (b) along with three AASHTO specifications for surface course gravel (Gradations D, E, and F). A summary of the index properties and soil classifications for the three base materials is shown in Table 1. Particle size distribution (PSD) curves, which were determined using ASTM D 422, are shown in Fig. 2. Class 5 base classifies as SP according to the United States Soil Classification System (USCS), whereas RSG classifies as SM, and RPM as GW-GM. All three materials are nonplastic, even though RPM and RSG have more than 10% fines. Compaction tests were performed at standard compactive effort for all three materials using the method in ASTM D 698. Optimum water contents and maximum dry unit weights are summarized in Table 3. Bell-shaped curves were obtained for RPM and RSG. Class 5 base, however, showed little variation in dry unit weight with water content (Fig. 3). 3.2 FLY ASH The Columbia fly ash for this study was obtained from Columbia Power Plant Unit No. 2, in Portage, Wisconsin where sub-bituminous coal is burned in pulverized boilers. The fly ash is collected using electrostatic precipitators. Columbia fly ash has a powdery texture, light brown color, classifies as Class C according to ASTM C 618, has a specific gravity of 2.63, and has cementitious properties. Physical properties and chemical composition of Columbia fly ash are summarized in Table 2, along with the typical chemical composition of Class C fly ash. According to Janz and Johansson (2002), the ratio of CaO to SiO 2 is indicative of the potential for pozzolanic reactions, and binders containing larger ratios are likely to be more effective in enhancing the engineering properties of materials. Similarly, Tastan
23 13 (2005) indicates that cementing is also related to the ratio of CaO to (SiO 2 + Al 2 O 3 ). Tastan (2005) reported higher strengths for subgrade soils blended with fly ash at CaO/SiO2 ratios ranging from 0.5 to 1.0 and CaO/(SiO 2 + Al2O 3 ) ratios ranging from 0.4 to 0.7. The ratio of CaO to SiO 2 for Columbia fly ash is 0.4, whereas the ratio of CaO to (SiO 2 + Al 2 O 3 ) is 0.8. Rosa (2006) reports the pozzolanic activity of Columbia fly ash at 7 days is 95.8%.
24 14 4. METHODS 4.1 COMPACTION / CALIFORNIA BEARING RATIO Specimens for compaction and California bearing ratio (CBR) tests were compacted in PVC molds following Method C in ASTM D 698. Particles larger than 25 mm were removed prior to compaction. Materials were compacted in three lifts of equal mass and thickness. CBR tests were performed on specimens without fly ash immediately after compaction, whereas specimens with fly ash were tested after 7 d of curing. All CBR tests were conducted following the methods in ASTM D To simulate condition shortly after construction, CBR specimens were not soaked prior to testing and 7 d curing was employed on specimens with fly ash (Bin-Shafique et al. 2004). An MTS Systems machine (model Sintec 10/GL) was used for loading the specimens. Data were collected with a PC equipped with TestWorks software. 4.2 RESILIENT MODULUS The RPM and Class 5 base materials classify as Type I material in NCHRP 1-28A, which requires a specimen 152 mm in diameter and 305 mm in height for resilient modulus testing (NCHRP 2004). For consistency, all specimens were prepared to these dimensions even though smaller specimens could have been used for RSG. Specimens were compacted in six lifts of equal mass and thickness using a split mold 152 mm in diameter. All materials were compacted to 100% of maximum standard Proctor density at optimum water content. Specimens were compacted to within 1% of the target dry density and 0.5% of target moisture content (NCHRP 2004). Similar methods were employed for base materials prepared with and without fly ash. Specimens of Class 5 base for resilient modulus (M r ) testing were prepared in a split mold placed directly on the bottom plate of the resilient modulus test cell. A latex
25 15 membrane was placed inside the split mold. Vacuum was applied to attract the membrane to the inside surface of the mold. Resilient modulus testing was performed in accordance with the NCHRP 1-28A protocol (NCHRP 2004). All materials were tested under Procedure Ia, which applies to base and subbase materials. All resilient modulus tests were conducted with both internal and external linear variable displacement transducers (LVDT). Clamps for the internal LVDTs (Fig. 4) were built in accordance with NCHRP 1-28A specifications. The external LVDTs had a measurement range of ± 5 mm for specimens without fly ash and ±1.5 mm for specimens with fly ash. Internal LVDTs used for specimens without fly ash had a measurement range of ±5 mm, whereas a range of ±1.5 mm was used for specimens with fly ash. The former had an accuracy of mm, while the latter had an accuracy of mm. Calibration data for resilient modulus testing equipment is in Appendix E. An MTS Systems Model servo-hydraulic machine was used for loading the specimens. Loading sequences, confining pressure, and data acquisition were controlled by a PC equipped with Labview 8.5 software. Resilient moduli (M r ) from the last 5 cycles of each test sequence were averaged to obtain the resilient modulus for each load sequence. The resilient modulus data were fit to the power function proposed by Moosazedh and Witczak (1981): M r k 1 k 2 = θ (4.1) where θ is bulk stress and k 1 and k 2 are fitting parameters. For a given material, k 2 was not expected to vary appreciably. Hence, k 2 obtained from replicate or triplicate tests were averaged and fixed for that material. A second fit was then performed using the average k 2 and fitting k 1 to all tests. A summary resilient modulus (SRM) was also computed, as suggested in Section of NCHRP 1-28A. For base materials, the
26 16 summary resilient modulus corresponds to the resilient modulus at a bulk stress of 208 kpa. 4.3 UNCONFINED COMPRESSION Unconfined compression tests were conducted on the specimens with fly ash after resilient modulus testing. ASTM D 5102 was used for the unconfined compression tests. Stresses applied during resilient modulus testing are low enough that specimens with fly ash do not deform significantly. Therefore, resilient modulus specimens could be reused for unconfined compression tests. Strain rates ranging from 0.5% to 2.1% per minute are suggested in ASTM D However, slower rates are optional for stiffer materials. All specimens were loaded at a strain rate of 0.21% per minute (Acosta 2002), or 0.64 mm per minute for specimens that are 305 mm tall. A Satec Systems servohydraulic compression machine (Model MII 400 RD) was used for testing. Data were collected with a PC equipped with Partner software. 4.4 FREEZE-THAW DURABILITY Tests were conducted to determine the effects of freeze-thaw cycling on the engineering properties of each of the materials. Rosa (2006) reports the effects of freeze and thawing on resilient modulus and unconfined compression generally occur within 5 cycles. Therefore, test specimens were subjected to 5 freeze-thaw cycles and then their resilient modulus was measured. Unconfined compression tests were also performed on the specimens with fly ash subjected to freeze-thaw after the resilient modulus tests were conducted. Specimens for freeze-thaw testing were prepared in the same manner as other resilient modulus specimens. All specimens were compacted to 100% of maximum standard Proctor density at optimum water content. The saturation level for the Class 5
27 17 base was 49%, whereas the saturation level for RPM and RSG were 89% and 65%, respectively. Preliminary testing on a specimen instrumented with a thermocouple showed that complete freezing occurred within one day at -19 C. Thus, all specimens were retained in the freezer for at least 1 day. After freezing, the height and weight were measured and the specimen was allowed to thaw at room temperature. This process was repeated until 5 freeze-thaw cycles were completed. After the last cycle, specimens were extruded frozen and thawed inside the resilient modulus cell. Resilient modulus testing was then conducted as described previously. Unconfined compression tests were conducted on specimens with fly ash after the resilient modulus tests were completed.
28 18 5. RESULTS AND ANALYSIS 5.1 COMPACTION Maximum dry unit weights and optimum water contents for RPM and RSG, with and without fly ash, are summarized in Table 3. The compaction characteristics of RPM and RSG blended with fly ash are similar to the compaction characteristics of RPM and RSG without fly ash (Fig. 5). However, increasing fly ash content resulted in an increase in optimum water content and a decrease in maximum dry unit weight. The shift in compaction curves with increasing fly ash content was more pronounced for RPM. The lower dry unit weights for material-fly ash mixtures is attributed to the loss of energy to breaking of the bonds, created as a result of cementation, during compaction. Wen et al. (2008) and Senol et al. (2003) also report that adding fly ash to RPM or soil causes a shift in the compaction curve, and that the type of shift (up or down) can depend on the type of fly ash. 5.2 CALIFORNIA BEARING RATIO Base and Recycled Materials without Fly Ash CBR and dry unit weight are shown in Fig. 6 as a function of moisture content for Class 5 base, RPM, and RSG. There is little variation in CBR or dry unit weight with water content for Class 5 base because it is a granular material with low fines content. Bell-shaped curves were obtained for CBR and dry unit weight for both RPM and RSG. Optimum CBRs for all materials were at approximately the same water content as the maximum dry unit weight. Both RPM and RSG had higher CBR than Class 5 base. The CBR for Class 5 base was 10, whereas RPM and RSG had CBRs of 22 and 31, respectively. The CBR for Class 5 base was significantly lower than expected (<50). However, a second CBR test confirmed the initial results (Fig. 6). The low CBR of the Class 5 base is attributed to its
29 19 large sand fraction (59%), and the rounded to subrounded characteristics of the gravel fraction (Fig. 7). CBR decreases with increasing particle roundness because of the decrease in friction between particles. CBRs obtained for RPM and RSG were higher than expected. Baugh (2008) reports an average CBR of 13 for RPM, whereas Li et al (2007) report CBRs ranging from 3 to 17. Similarly, Baugh (2008) reports an average CBR of 21 for RSG, whereas Hatipoglu et al. (2008) report a CBR of 24. These CBRs, however, were obtained for specimens prepared at optimum water content and 95% of standard Proctor dry unit weight, whereas optimum CBRs for this study were determined from the relationship between CBR and water content (Fig. 6) Recycled Materials Blended with Fly Ash CBRs for RPM and RSG blended with fly ash are summarized in Table 3. The variation of CBR and normalized CBR (defined as CBR of base material with fly ash over CBR of base material) with fly ash content for RPM and RSG are shown in Fig. 8. As expected, CBR increases significantly with increasing fly ash content for both recycled materials. The increase in CBR is attributed to cementation of the particles by the fly ash. RSG with fly ash had CBRs greater than RPM with fly ash. RPM shows a three fold increase in CBR when mixed with 10% fly ash, whereas RSG shows a six fold increase. Addition of 15% fly ash yields further gains in CBR for both recycled materials. Hatipoglu et al. (2008) and Li et al. (2007) report similar increases in CBR for RPM and RSG mixed with 10% fly ash. Both RPM and RSG had CBR higher than the CBR typically desired for base materials (CBR 50) (Hunt 1986) when mixed with 10% fly ash (67 for RPM and 183 for RSG). RPM mixed with 15% fly ash had a CBR of 134,
30 20 whereas RSG mixed with 15% fly ash had a CBR of 334. Thus, both recycled materials have very high bearing strength when mixed with 15% fly ash. These results are similar to those reported by Wen et al. (2008) for RPM blended with high carbon fly ash. The CBR of RPM increased with increasing fly ash content up to 18% fly ash (from 38 to 212). 5.3 UNCONFINED COMPRESSION STRENGTH Effect of Fly Ash Content and Curing Time Unconfined compression strengths (UCS) for RPM and RSG blended with fly ash are summarized in Table 4 and are shown in Fig. 9. The UCS reported in Table 4 are the average of the UCS of duplicate specimens. The UCS for both RPM and RSG increase with increasing fly ash content and, under the same conditions, RSG exhibits higher UCS than RPM. The UCS of RPM and RSG mixed with fly ash also increased with curing time (Fig. 9), with significant increases occurring even after 28 d. The UCS in Table 4 are similar to those reported by Wen et al. (2008) (1.3 to 2.04 MPa for RPM mixed with up to 14% high carbon self-cementing fly ash and curing times up to 14 d). Mechanistic Empirical Pavement Design Guide (MEPDG) suggests a minimum unconfined compressive strength (28 d cure) of 5.2 MPa for a chemically stabilized base layer and 1.7 MPa for a chemically stabilized subbase layer (ARA 2004). The highest unconfined compressive strength observed in this study was 3.61 MPa (RSG with 15% fly ash). Thus, the RPM and RSG blended with fly ash fall below the minimum suggested UCS for chemically stabilized base layers. The UCS requirement for a subbase layer were met for all but one mixture of RSG and fly ash, but for only one mixture prepared with RPM (15% fly ash and 28 d cure). Even though the UCS criteria are not satisfied for most cases of RPM, field experience (Hatipoglu et al. 2008, Wen et al. 2004, Crovetti 2000, Li et al 2007) has shown that RPM and RSG blended with 10-15% fly ash has
31 21 more than adequate strength to support construction traffic and other loads commonly applied to base and subbase layers Effect of Freeze-Thaw Summary resilient moduli (SRM) and UCS of base materials with and without fly ash, before and after 5 freeze-thaw cycles, are summarized in Table 5. UCS of RPM and RSG with 10% fly ash before and after 5 freeze-thaw cycles are shown in (Fig. 10). The UCS of RSG increased 18% after 5 freeze-thaw cycles and the UCS of RPM increased by 5%. Zaman and Naji (2003) report similar findings for the UCS of an aggregate base blended with 10% Class C fly ash (28 d cure). They found that the UCS increased with increasing freeze-thaw cycles (up to 30 cycles). Zaman and Naji (2003) attribute the increase in UCS to accelerated cementitious reactions during thawing. 5.4 RESILIENT MODULUS Base and Recycled Materials without Fly Ash Analysis of resilient modulus data indicated deformations measured with internal LVDTs more accurately described deformation of the specimens (see Appendix I). Thus, the resilient moduli presented herein are based on deformations measured with internal LVDTs. The SRM for the Class 5 base, RPM, and RSG, computed in accordance with Procedure Ia of NCHRP 1-28A, are summarized in Table 6, along with the parameters k 1 and k 2 for the resilient modulus power function model (Eq. 4.1). These SRM and parameters correspond to compaction at optimum water content and at maximum dry unit weight. SRM for Class 5 base, RPM, and RSG are shown in Fig. 11. RPM has the highest SRM (309 MPa) of the three base materials. Alternatively, RSG has the lowest SRM (212 MPa), whereas Class 5 base has a SRM of 236 MPa. The resilient moduli of
32 22 the base materials do not follow the same hierarchy as observed for CBR (RSG has the highest CBR, followed by RPM and Class 5 base). However, other studies have reported similar differences between M r and CBR. For example, Wen et al. (2007 and 2008) report CBRs for RPM that are lower than CBRs for Wisconsin Grade 2 gravel, whereas the resilient moduli had the opposite relationship. This difference, however, may be explained by the nature of the two tests. Resilient modulus testing induces small deformations to evaluate stiffness, whereas a CBR test induces larger deformations to assess bearing strength. MEPDG reports typical ranges of resilient modulus for various materials based on their USCS classification (ARA 2004). The SRM for Class 5 base is higher than the suggested ranges (165 to 228 MPa) for materials having the same USCS classification (SP). Similarly, the SRM for RPM is higher than the suggested range (245 to 279 MPa) for materials classified as GW-GM. The SRM for RSG falls within the suggested range (193 to 259 MPa) for materials classified as SM. Even though Class 5 base has a low CBR, SRM of Class 5 base is typical of a base aggregate. For example, Kim and Labuz (2007) performed resilient modulus tests on CR 53, an aggregate base conforming to MnDOT s Class 5 specifications that was obtained from a full-depth reclamation (FDR) project in Wright County, MN. A SRM of 182 MPa was computed for the CR 53 aggregate base using data from Kim and Labuz (2007). The high resilient modulus for RPM is attributed to its RAP content (50%). For example, Kim and Labuz (2007) performed resilient modulus tests on an aggregate base blended with varying RAP contents (0-75%), with the CR 53 material used as base aggregate. All blends of aggregate base and RAP had resilient moduli higher than the aggregate base alone, which explains the high SRM for RPM when compared to materials of similar USCS classification. Furthermore, increasing the RAP content for CR 53 aggregate resulted in increasing resilient modulus.
33 23 Average plastic strains were calculated for all base materials during resilient modulus testing (Table 6) using data from the internal LVDTs. Plastic strain for a resilient modulus test was calculated as the sum of the plastic strains for each loading sequence, excluding the plastic strains in the conditioning phase (Sequence 0). Class 5 base and RSG showed average plastic strains of 3.35% and 3.33%, respectively, whereas RPM showed a plastic strain of only 1.94%. These results are different from those in Wen et al. (2008 and 2009) and Kim and Labuz (2007). They indicate that plastic strains for RPM are typically higher than plastic strains of typical aggregate base materials. The plastic strains for RPM may be higher or lower than those of conventional base aggregates, depending on the type of aggregate. For example, the plastic strains (ε plastic ) for two RPMs and two conventional base aggregates, along with other material properties, are summarized in Table 7. The Class 5 base and WI RPM are the materials used in this study. The crushed granite aggregate and MnROAD RPM (Wen et al. 2009) were obtained from a research project at the MnROAD facility in Minnesota. The plastic strain of both RPMs (2.77% for MnROAD RPM and 1.94% for WI RPM) is lower than that of Class 5 base (3.35%), but is significantly higher than the plastic strain of crushed granite aggregate (0.71%). The high plastic strain for Class 5 base is attributed to its large sand fraction (59%) compared to crushed granite aggregate (30%) Effect of Fly Ash Content and Curing Time Summary resilient moduli for RPM and RSG blended with fly ash are summarized in Table 6, along with the parameters k 1 and k 2 for the resilient modulus power function model (Eq. 4.1). The resilient modulus of specimens blended with fly ash showed no apparent dependency on bulk stress (i.e. k 2 in Eq 4.1 was close to zero). An example of a resilient modulus test showing no trend is shown in Fig. 12. A linear regression analysis was performed on resilient modulus data for all specimens with fly ash to
34 24 determine if a statistically significant relationship existed between resilient modulus and bulk stress. In this analysis, the probability of falsely rejecting the null hypothesis (slope is zero), referred to as the p-value, is determined and compared to the significance level, α. A p-value higher than α indicates the slope is statistically no different from zero and the resilient modulus is independent of bulk stress. Results of the regression analysis are summarized in Table 8. Two thirds of the tests showed no stress dependency for α = 0.05, the significance level commonly used in hypothesis testing (Berthouex and Brown 2002). In those cases where k 2 was not found to be statistically insignificant, the p-value was only slightly smaller than α, suggesting only a slight dependency on bulk stress. Furthermore, the analysis was based on all bulk stresses employed in the resilient modulus test protocol, with some significantly higher than that would be encountered in a pavement structure. Thus, the resilient moduli of the materials blended with fly ash are described herein with a single modulus. This approach is consistent with MEPDG, which recommends a constant modulus for chemically stabilized materials (ARA 2004). As in the CBR test, addition of fly ash resulted in a significant increase in SRM for both materials, with the RSG exhibiting higher SRM than RPM. Specimens cured for 28 days were used because MEPDG specifies properties at 28 d cure for other chemically stabilized materials. Summary resilient moduli for RPM and RSG blended with fly ash are shown in Fig. 13 as a function of fly ash content. SRM increases with increasing fly ash content. This finding is consistent with Wen et al. (2008). They report an increase in resilient modulus of RPM as the fly ash content was increased from 10 to 18%. Increasing the fly ash content causes more cementation of the particles, yielding specimens with higher stiffness. Diminishing returns are likely to be realized at fly ash contents higher than those described here. Additional testing is needed to assess the fly ash content beyond which stiffness no longer increases. Moreover, higher fly ash
35 25 contents may not necessarily be beneficial. For example, a series of cold in-place recycling (CIR) test sections mixed with varying Class C fly ash contents were constructed by the Kansas Department of Transportation. Test sections with higher fly ash contents exhibited more initial cracking than those with lower fly ash contents (Cross and Young 1997). A laboratory study confirmed an increase in brittleness (i.e. asphalt layer more prone to fatigue and thermal cracking) for CIR and fly ash mixtures as a result of increasing fly ash contents (Cross and Young 1997). The effect of curing time on the SRM of RPM and RSG with fly ash is shown in Fig. 14. The data in Fig. 14 are from specimens blended with 10% fly ash that were cured for 7, 28, and 56 d. SRM increased with curing time for both RPM and RSG, with the increase rate being larger between 7 and 28 d. SRM for RPM increases an additional 250 MPa for 56 d of curing, whereas a more pronounced increase is observed for RSG (1000 MPa increase) for 56 d of curing. Wen et al (2008) also report an increase in resilient modulus with curing time for RPM mixed with fly ash. Resilient moduli based on internal LVDT measurements for materials blended with fly ash were not found in the literature. However, a range of resilient moduli for chemically stabilized soils (Table 9) is reported by MEPDG (ARA 2004). The range of SRM for both materials blended with fly ash is similar to the ranges for materials stabilized with other chemicals. For example, resilient moduli for materials stabilized with lime-cement-fly ash range from 3500 to MPa, whereas resilient moduli of soil cement ranges from 350 to 6900 MPa. The addition of fly ash not only increased resilient modulus, but also resulted in smaller plastic strains for both recycled materials (Table 6). Plastic strains ranged from 0.5 to 1.22% for RPM with fly ash, whereas plastic strains ranged from 0.62 to 2.18% for RSG with fly ash. Wen et al. (2008) also report a decrease in plastic strains for RPM specimens blended with fly ash.
36 Effect of Freeze-Thaw The effect of freeze-thaw cycling on the SRM is shown in Fig. 15. Freeze-thaw cycling has a small effect on SRM of Class 5 base (7% change), RPM (15% change), or RSG (5% change) with or without fly ash. There is no consistent effect of freeze-thaw cycling on materials without fly ash; the SRM of Class 5 base decreased slightly (7%), whereas RPM and RSG increased slightly (14% and 1%). Rosa (2006) suggests a reduction of 20 to 66% for various coarse and fine grained materials. Freeze-thaw data on RPM alone were not found in the literature. RPM and RSG mixed with fly ash decreased modestly (15% and 5%). The decrease in SRM is smaller than the decreases reported by Rosa (2006) for RPM and RSG mixed with fly ash (7 to 42%). The small effect of freeze-thaw cycling on the SRM is consistent with the small volume changes recorded during freezing and thawing, which cause little change in soil structure (Simosen et al. 2002). No net changes were observed for Class 5 base and RPM, whereas the volume change for RSG ranged from 0.4 to 0.6%. RSG and RPM with fly ash had no net increases in volume. Rosa (2006) also reports no net volume changes for RPM and RSG mixed with fly ash. The small decrease in SRM for RPM and RSG with fly ash is probably due to the breaking of cement bonds during freezing Relationship between SRM and UCS The relationship between the SRM and UCS for RPM and RSG blended with fly ash is shown in Fig. 16. A strong relationship exists between SRM and UCS, which suggests that the SRM of RPM and RSG blended with fly ash could be estimated from a UC test. In particular, SRM can be estimated by SRM = 3280 UCS (5.1) A similar relationship with the initial tangent modulus (E i ) and the secant modulus at 50% of UCS (E 50 ), as obtained from the static UC test, are shown in Fig. 17. E 50 was
37 27 determined by dividing half of the UCS by the corresponding strain at that stress level, whereas the E i was computed by modeling the stress-strain behavior using the hyperbolic equation (Krizek 1967): ε σ = a + bε (5.2) where σ is axial stress, ε is axial strain, a and b are empirical coefficients, and 1/a is the initial tangent modulus (E i ). Eq. 5.2 was fit to the UCS data to determine E i. The SRM of RSG and RPM blended with fly ash can also be estimated by or by SRM = 5.7 E i (5.3) SRM = 5.7 E 50 (5.4) The E i and E 50 have the same relationship with SRM (Eq. 3 and 4), which suggests that the stress-strain relationship of these materials are highly linear. The R 2 is 0.93 for Eq. 5.2, 0.65 for Eq. 5.3, and 0.58 for Eq Thus, UCS should provide a more reliable estimate of SRM rather than E i or E 50.
38 28 6. SUMMARY AND CONCLUSIONS This laboratory investigation dealt with the influence of fly ash addition and freeze-thaw cycling on the engineering properties of two recycled roadway materials, recycled pavement material (RPM) and recycled road surface gravel (RSG). The objectives were to assess the engineering properties of recycled materials with and without fly ash and to study how freezing and thawing may affect the engineering properties. California bearing ratio, resilient modulus, and unconfined compression tests were conducted on RPM and RSG with and without fly ash. Resilient modulus and unconfined compression tests were also performed on specimens with and without fly ash after 5 freeze-thaw cycles. Two fly ash contents (10 and 15%), corresponding to typical application ranges used in practice, were used and three curing times (7, 28, and 56 d) were evaluated. Class 5 base, with a conventional base material gradation employed in Minnesota, was used as a control. RSG and RPM had CBRs greater than that of Class 5 base, but all three materials had CBR less than typically desired for base course material (CBR 50). Addition of fly ash to RSG or RPM significantly increased the CBR, and the CBR increased with increasing fly ash content for both materials. Adding fly ash increased the CBR of the RSG by at least 6 times and the CBR of RPM by at least 3 times. Moreover, addition of fly ash (10 and 15%) to RPM and RSG resulted in CBRs greater than the CBR typically desired for base course. Unconfined compression tests were not conducted on Class 5 base, RPM, and RSG alone because they are granular materials with relatively low fines content (<15%) and therefore little cohesion. The UCS of RPM and RSG mixed with fly ash increased with increasing fly ash content. The UCS for both materials also increased with curing time, with significant increases occurring even after 28 d. RPM and RSG mixed with fly ash had UCS lower than the minimum suggested UCS for a chemically stabilized base
39 29 layer (5.2 MPa), but field experience reported by others has shown RPM and RSG mixed with fly ash have more than adequate strength to support construction traffic and other loads commonly applied to base and subbase layers. In addition, the UCS is maintained even when the RPM and RSG are exposed to freezing. After 5 freeze-thaw cycles, the UCS of RPM and RSG mixed with fly ash was higher (5 and 18%) than the UCS not subjected to freeze-thaw cycling. RPM had a higher summary resilient modulus (SRM) than Class 5 base, whereas the SRM for RSG was slightly lower than that of Class 5 base. RPM also exhibited smaller plastic strains during M r testing than Class 5 base, whereas RSG showed similar plastic strains to Class 5 base. The SRM for RPM and RSG mixed with fly ash were independent of bulk stress and were described by a single modulus. Addition of fly ash significantly increased the SRM of RPM and RSG (at least a factor of 6 and 29, respectively), and the SRM increased as the fly ash content was increased for both materials. SRM also increased with curing time, with the rate of increase being largest between 7 and 28 d of curing. Plastic strains for RPM and RSG with fly ash were smaller than the plastic strains of the recycled materials alone. Freeze-thaw cycling had a small effect on SRM of Class 5 base (7% change), RPM (15% change), or RSG (5% change) with or without fly ash, with no consistent effect for materials mixed with fly ash. A strong relationship (R 2 =0.93) was found for SRM and UCS of RPM and RSG mixed with fly ash, suggesting that the resilient moduli of these materials can be estimated from a UC test. SRM can be estimated by multiplying UCS by Recommended strengths and stiffness for the RPM and RSG are summarized in Table 10. The CBRs in Table 10 correspond to 7 d of cure to simulate condition shortly after construction, whereas the SRM and UCS correspond to 28 d cure because the materialfly ash mixture will continue to gain strength and stiffness during that period of time. The
40 30 SRM F-T in Table 10 corresponds to the stiffness of the recycled materials subjected to freeze-thaw cycling due to seasonal changes (28 d cure).
41 31 REFERENCES Acosta, H. A. (2002). Stabilization of Soft Subgrade Soils Using Fly Ash, MS Thesis, University of Wisconsin-Madison, Madison, WI. AASHTO (2001). Standard Specifications for Transportation Materials and Methods of Sampling and Testing, 21 st Ed., American Association of State Highway and Transportation Officials, Washington, D.C., Part I, Specifications, M AASHTO-AGC-ARTBA Joint Committee (1998). Report of Cold Recycling of Asphalt Pavements, Task Force 38 Report. American Association of State Highway and Transportation Officials, Washington, D.C. ARA (2004). Guide for Mechanistic-Empirical Design on New and Rehabilitated Pavement Structures, NCHRP Project 1-37A. Prepared for National Cooperative Highway Research Program, Washington, D.C. Baugh, J. (2008). Suitability of Cement Kiln Dust for Reconstruction of Roads, MS Thesis, University of Wisconsin-Madison, Madison, WI. Bemanian, S., Polish, P., and Maurer, G. (2006). Cold in-place recycling and full-depth reclamation projects by Nevada department of transportation, Journal of the Transportation Research Board, 1949, pp Berthouex, P. and Brown, L. (2002). Statistics for Environmental Engineers. 2 nd Ed., CRC Press, Boca Raton, Fla. Bin-Shafique, S., Edil, T., Benson, C., and Senol, A. (2004). Incorporating a fly ash stabilized layer into pavement design, Geotechnical Engineering, 157(GE4), pp Button, J., Little, D., and Estakhri, C. (1994). Hot In-Place Recycling of Asphalt Concrete, NCHRP Synthesis of Highway Practice 193. National Cooperative Highway Research Program, Washington, D.C. Button, J., Estakhri, C., and Little, D. (1999). Overview of hot in-place recycling of bituminous pavements, Journal of the Transportation Research Board, 1684, pp Cooley, D. (2005). Effects of Reclaimed Asphalt Pavement on Mechanical Properties of Base Materials, MS Thesis, Brigham Young University, Provo, UT. Cross, S. A. and Young, D. A. (1997). Evaluation of type C fly ash in cold in-place recycling, Journal of the Transportation Research Board, 1583, pp Crovetti, J. (2000). Construction and performance of fly ash-stabilized cold in-place recycled asphalt pavement in Wisconsin, Journal of the Transportation Research Board, 1730, pp
42 32 Edil, T. B., Benson, C., Bin-Shafique, M., Tanyu, B., Kim, W. and Senol, A. (2002). Field evaluation of construction alternatives for roadways over soft subgrade, Journal of the Transportation Research Board, 1786, pp Epps, J. A. (1990). Cold-Recycled Bituminous Concrete Using Bituminous Materials, NCHRP Synthesis of Highway Practice 160. National Cooperative Highway Research Program, Washington, D.C. Hatipoglu, B., Edil, T., and Benson, C. (2008). Evaluation of base prepared from road surface gravel stabilized with fly ash, ASCE Geotechnical Special Publication, 177, pp Hunt, R.E. (1986). Geotechnical Engineering Techniques and Practices. McGraw Hill Book Company, NY. Janz, M. and Johansson, S.-E. (2002). "The Function of Different Binding Agents in Deep Stabilization," Report 9. Swedish Deep Stabilization Research Centre, Linkoping, Sweden. Jong, D., Bosscher, P., and Benson, C. (1998). Field assessment of changes in pavement moduli caused by freezing and thawing, Journal of the Transportation Research Board, 1615, pp Kearney, E.J. and Huffman, J.E. (1999). Full-depth reclamation process, Journal of the Transportation Research Board, 1684, pp Kim, W., Labuz, J., and Dai, S. (2007). Resilient modulus of base course containing recycled asphalt pavement, Journal of the Transportation Research Board, 2005, pp Kuennen, T. (1988). Hot in-place recycling specs developed by ARRA, Roads and Bridges, 2(10), pp. 72. Krizek, R. (1967). Stress-strain behavior of a marine clay, Proceedings of 1 st Southeast Asian Regional Conference on Soil Engineering, Asian Institute of Technology, Bangkok, Thailand, pp Li, L., Benson, C. H., Edil, T. B., Hatipoglu, B., and Tastan, E. (2007). Evaluation of recycled asphalt pavement material stabilized with fly ash, ASCE Geotechnical Special Publication (CD-ROM), 169. Mahoney, J.P., Lary, J.A., Sharma, J., and Jackson, N. (1985). Investigation of seasonal load restriction in Washington State, Journal of the Transportation Research Board, 1043, pp Misra, A., Upadhyaya, S., Gustin, F., Roohanirad, A., and Stokes, J. (2005). Full-depth cold in-place recycling of asphalt pavements using self-cementing fly ash, Proceedings of World of Coal Ash 2005, University of Missouri-Kansas, Kansas.
43 33 Moosazedh, J., and Witczak, M. (1981). Prediction of subgrade moduli for soil that exhibits nonlinear behavior, Journal of the Transportation Research Board, 810, pp MnDOT (2005). Standard Specifications for Construction, Minnesota Department of Transportation, St. Paul, MN. NCHRP (2004). Laboratory determination of resilient modulus for flexible pavement design, National Cooperative Highway Research Program Research Results Digest, 285, pp Ping, W. and Ge, L. (1996). Evaluation of resilient modulus of cemented limerock base materials in Florida, Journal of the Transportation Research Board, 1546, pp Rosa, M. (2006). Effect of Freeze and Thaw Cycling on Soils Stabilized using Fly Ash, MS Thesis, University of Wisconsin-Madison, Madison, WI. Salomon, A. and Newcomb, D. (2000). Cold In-Place Recycling Literature Review and Preliminary Mixture Design Procedure. Report MN-RC Minnesota Department of Transportation, St. Paul, MN. Senol, A., Bin-Shafique, M. S., Edil, T.B., and Benson, C. (2003). Use of class C fly ash for stabilization of soft subgrade, ARI Bulletin of the Istanbul Technical University, 53(1), pp Senol, A., Edil, T. B., Bin-Shafique, M. S., Acosta, H. A., and Benson, C. H. (2006). Soft subgrades stabilization by using various fly ashes, Resources Conservation and Recycling, 46(4), pp Simonsen, E., Janoo, V., and Isacsson, U. (2002). Resilient properties of unbound road material during seasonal frost conditions, Journal of Cold Region Eng., 16(1), pp Tastan, E. (2005). Stabilization or Organic Soil using Fly Ash, MS Thesis, University of Wisconsin-Madison, Madison, WI. Taha, R., Ali, G., Basma, A., and Al-Turk, O. (1999). Evaluation of reclaimed asphalt pavement aggregate in road bases and subbases, Journal of the Transportation Research Board, 1652, pp Taha, R., Al-Harthy, A., Al-Shamsi, K., and Al-Zubeidi, M. (2002). Cement stabilization of reclaimed asphalt pavement aggregate for road bases and subbases, Journal of Materials in Civil Engineering, 14(3), pp Tatsuoka, F., Teachavorasinskun, S., Dong, J., Kohata, Y., and Sato, T. (1994). Importance of measuring local strains in cyclic triaxial tests on granular materials, ASTM Special Technical Publication, 1213, pp
44 34 Wen, H., Tharaniyil, M., Ramme, B. and Krebs, U. (2004). Field performance evaluation of class C fly ash in full-depth reclamation: case history study, Journal of the Transportation Research Board, 1869, pp Wen, H., Baugh, J., and Edil, T. (2007). Use of cementitious high carbon fly ash to stabilize recycled pavement materials as pavement base material, Proceedings of 86 th Annual Meeting (CD ROM), Transportation Research Board, Washington, D.C. Wen, H., Warner, J., and Edil, T. (2008). Laboratory comparison of crushed aggregate and recycled pavement material with and without high-carbon fly ash, Proceedings of 87 th Annual Meeting (DVD), Transportation Research Board, Washington, D.C. Wen, H., Camargo, F., and Edil, T. (2009). Field and laboratory evaluation of sustainable materials at MnROAD, Submitted to 88 th Annual Meeting, Transportation Research Board, Washington, D.C. Wilson, J., Fischer, D., and Martens, K. (1998). Pulverize, Mill & Relay Asphaltic Pavement & Base Course, Construction Report WI Wisconsin Department of Transportation, Madison, WI. Zaman, M., and Naji, K. (2003). Effect of freeze-thaw cycles on class C fly ash stabilized aggregate base, Proceedings of 82 nd Annual Meeting (CD ROM), Transportation Research Board, Washington, D.C.
45 TABLES 35
46 Sample Class 5 base D 50 (mm) C u C c G s Table 1. Index properties for Class 5 base, RPM, and RSG. w opt (%) γ d max (kn/m 3 ) Asphalt Content (%) LL (%) PL (%) Gravel Content (%) Sand Content (%) Fine Content (%) USCS Symbol AASHTO Symbol NP NP SP A-1-a RPM NP NP GW-GM A-1-a RSG NP NP SM A-1-b D 50 = median particle size, Cu = coefficient of uniformity, Cc = coefficient of curvature, Gs = specific gravity, w opt = optimum water content, γ d max = maximum dry density, LL = liquid limit, PL = plastic limit, NP = nonplastic. Note: Particle size analysis conducted following ASTM D 422, Gs determined by ASTM D 854, γ d max and w opt determined by ASTM D 698, USCS classification determined by ASTM D 2487, AASHTO classification determined by ASTM D 3282, asphalt content determined by ASTM D 6307, and Atterberg limits determined by ASTM D
47 37 Table 2. Columbia fly ash physical properties and chemical composition (from Tastan 2005). Parameter Columbia Typical Class C SiO 2, % Al 2 O 3, % Fe 2 O 3, % SiO 2 + Al 2 O 3 + Fe 2 O 3, % CaO, % MgO, % SO 3, % - 3 CaO/SiO CaO/(SiO 2 +Al 2 O 3 ) Loss on Ignition, % Fineness, amount retained on #325 sieve, % 12-37
48 38 Table 3. Maximum dry unit weights and optimum CBRs for Class 5 base, RPM, and RSG with and without fly ash. Material Fly Ash Content (%) Optimum Water Content* (%) Maximum Dry Unit Weight (kn/m 3 ) CBR (%) Class 5 base RPM RSG * Optimum water content for dry unit weights. 38
49 39 Table 4. Summary of unconfined compressive strengths of RPM and RSG blended with fly ash. Material Fly Ash Content (%) Curing Time Unconfined Compressive Strength Initial Tangent Modulus (MPa) Secant Modulus (MPa) (d) (MPa) RPM RSG
50 40 Table 5. SRM and UCS of base materials with and without fly ash before and after 5 freeze-thaw cycles (28 d cure). Material Fly Ash SRM UCS (MPa) SRM after / Content (MPa) UCS after / SRM before UCS (%) before Before After Before After Class 5 base RPM RSG
51 Table 6. Summary resilient modulus and power model fitting parameters k 1 and k 2 (Eq. 4.1) for base materials with and without fly ash. Material Class 5 base Fly Ash Content (%) Curing External Time (d) k 1 k 2 SRM (MPa) Internal k 1 k 2 SRM (MPa) Plastic Strain (%) SRM INT/ SRM EXT RPM RSG Note: Bulk stress (θ) in terms of kpa in Eq
52 42 Table 7. Plastic strains, along with other material properties, for two RPMs and two conventional base aggregates. Relative Gravel Sand Fines γ Material d SRM ε (%) (%) (%) (kn/m 3 Density plastic ) (MPa) (%) (%) Class 5 base Crushed granite aggregate MnROAD RPM * * WI RPM * Modified Proctor
53 43 Table 8. Slopes and p statistics from linear regression analysis for SRM of RPM and RSG with fly ash. Material Fly Ash Curing Time Content (d) (%) Trial k 2 p value * RPM * * * * * RSG *
54 44 Table 9. Typical resilient moduli for chemically stabilized soils (ARA 2004). Chemically Stabilized Material Elastic or Resilient Modulus (MPa) Min Max Typical Lean concrete Cement stabilized aggregate Open graded cement stabilized aggregate Soil cement Lime-cement-fly ash Lime stabilized soils* *Reactive soils with at least 25% fines and a plasticity index of at least 10.
55 45 Table 10. Recommended strengths and stiffness for recycled materials with and without fly ash. Material RPM RSG Fly Ash Content (%) CBR (%) SRM (MPa) SRM F-T (MPa) UCS (kpa)
56 FIGURES 46
57 Class 5 Blend Class 5 Limits 80 Percent Passing (%) Upper Bound (MnDOT Class 5) 20 Lower Bound (MnDOT Class 5) 10 (a) Particle Size (mm) RSG Grading D Grading E Grading F Percent Passing (%) (b) Particle Size (mm) Fig. 1. Particle size distribution for Class 5 base used in this study with MnDOT Class 5 specifications (a) and RSG with AASHTO surface course specifications (b).
58 Class 5 RPM RSG Percent Passing (%) Particle Size (mm) Fig. 2. Particle size distributions for Class 5 base, RPM, and RSG.
59 Class 5 RPM RSG ZAV, Gs = 2.64 ZAV, Gs = 2.72 Dry Unit Weight (kn/m 3 ) Mositure Content (%) Fig. 3. Compaction curves for Class 5 base, RPM, and RSG for standard compactive effort.

60 Fig. 4. Internal LVDT clamps mounted on a resilient modulus specimen. 50
61 % Fly Ash 10% Fly Ash 15% Fly Ash (a) Dry Unit Weight (kn/m 3 ) RPM % Fly Ash 10% Fly Ash 15% Fly Ash (b) Dry unit weight (kn/m 3 ) Moisture Content (%) RSG Fig. 5. Compaction curves for (a) RPM and (b) RSG blended with different fly ash contents.
62 52 23 Dry Unit Weight CBR - Trial 1 CBR - Trial 2 (a) ZAV, Gs = Dry unit weight (kn/m 3 ) CBR (%) Dry Unit Weight CBR (b) ZAV, Gs = Dry unit weight (kn/m 3 ) CBR (%) (c) ZAV, Gs= Dry unit weight (kn/m 3 ) CBR (%) Dry Unit Weight CBR Moisture Content (%) Fig. 6. CBR and dry unit weight with moisture content for (a) Class 5 base, (b) RPM, and (c) RSG.

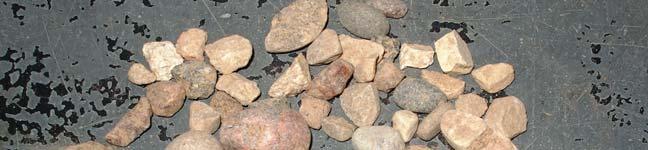


63 Fig. 7. Photograph of gravel content from a sample of Class 5 base. 53
64 RPM RSG (a) 250 CBR (%) RPM RSG (b) Normalized CBR (CBR /CBR ) fly ash no fly ash Fly Ash Content (%) Fig. 8. CBR (a) and normalized CBR (b) with fly ash content for RSG and RPM.
65 % fly ash 15% fly ash (a) RPM UCS (MPa) (b) RSG UCS (MPa) Curing Time (d) Fig. 9. Unconfined compression strength for RPM (a) and RSG (b) blended with fly ash.
66 cycles 5 cycles 10% Fly ash, 28 d cure 2.0 UCS (MPa) RPM RSG Fig. 10. Freeze-thaw effects on UCS of recycled materials with 10% fly ash (28 d cure).
67 Summary Resilient Modulus (MPa) RPM Class 5 base RSG Fig. 11. Summary resilient modulus for Class 5 base, RPM, and RSG.
68 RSG (15% fly ash, 7 d cure, trial 2) k = k = Resilient Modulus (MPa) Bulk Stress (kpa) Fig. 12. Resilient modulus test showing no trend in resilient modulus with bulk stress (RSG with 15% fly ash, 7 d cure, trial 2).
69 59 Summary Resilient Modulus (MPa) RPM (28 d cure) RSG (28 d cure) Class Fly Ash Content (%) Fig. 13. Summary resilient modulus with fly ash content for recycled materials.
70 60 Summary Resilient Modulus (MPa) RPM (10% fly ash) RSG (10% fly ash) Curing Time (d) Fig. 14. Summary resilient modulus with curing time for recycled materials with 10% fly ash.
71 cycles 5 cycles (a) No fly ash Summary Resilient Modulus (MPa) Class 5 RPM RSG % Fly ash, 28 d cure (b) 7000 Summary Resilient Modulus (MPa) RPM RSG Fig. 15. Summary resilient modulus of base materials (a) and recycled materials with 10% fly ash (28 d cure) (b) before and after 5 freeze-thaw cycles.
72 Summary Resilient Modulus (MPa) SRM = 3280 UCS R 2 = Unconfined Compression Strength (MPa) Fig. 16. SRM as a function of UCS for all recycled material specimens blended with fly ash.
73 Summary Resilient Modulus (MPa) SRM = 5.7 E i R 2 = E (MPa) i (a) Summary Resilient Modulus (MPa) SRM = 5.7 E 50 R 2 = E 50 (MPa) (b) Fig. 17. SRM as a function of initial tangent modulus (E i ) (a) and modulus at 50% strain (E 50 ) (b) from UC test for all recycled material specimens blended with fly ash.
74 64 APPENDIX A RESILIENT MODULI FOR EXTERNAL LVDT MEASUREMENTS
75 65 Summary Resilient Modulus (MPa) RPM (28 d cure) RSG (28 d cure) Class 5 External LVDT Fly Ash Content (%) Fig. A.1. Summary resilient modulus based on external LVDT data as a function of fly ash content for base materials.
76 RPM (10% fly ash) RSG (10% fly ash) External LVDT Summary Resilient Modulus (MPa) Curing Time (d) Fig. A.2. Summary resilient modulus based on external LVDT data as a function of curing time for recycled materials blended with 10% fly ash.
77 cycles 5 cycles External LVDT Summary Resilient Modulus (MPa) Class 5 RPM RSG Fig. A.3. Summary resilient moduli of base materials based on external LVDT data before and after 5 freeze-thaw cycles.
78 cycles 5 cycles External LVDT 10% fly ash, 28 d cure Summary Resilient Modulus (MPa) RPM RSG Fig. A.4. Summary resilient moduli of recycled materials blended with 10% fly ash (28 d cure) based on external LVDT data before and after 5 freeze-thaw cycles.
79 69 APPENDIX B BASE COURSE TESTING PROTOCOL
80 70 This appendix summarizes testing procedures used at the University of Wisconsin Madison for resilient modulus and California bearing ratio tests on granular materials used as base course. B.1 CALIFORNIA BEARING RATIO (CBR) The CBR test procedure has been combined with the compaction test procedure such that a CBR is calculated for each point on the compaction curve. This procedure yields the relationship between CBR and water content (e.g. Fig. B.1), from which the maximum CBR is obtained. Material passing the 25 mm sieve is compacted into a 152-mm-diameter mold. Materials blended with fly ash are compacted 1 hour after fly ash and water have been added. A water content measurement is made on extra material immediately after compaction is completed. Compacted specimens are cured in a wet room for the desired curing time prior to testing. A surcharge of 4.54 kg is applied to the specimen during testing. If a specimen is soaked, the surcharge of 4.54 kg is also applied during the soaking period. Soaking generally is not conducted because CBR is used to evaluate bearing resistance of the material immediately after construction. B.2 RESILIENT MODULUS/UNCONFINED COMPRESSION The resilient modulus test procedure is based on the NCHRP 1-28A protocol for base and subbase materials (NCHRP 2004). Material passing the 25 mm sieve is compacted at optimum water content using standard Proctor energy into a 152-mmdiameter mold PVC mold having a height of 305 mm. Material is compacted into the mold in 51 mm layers.
81 71 Two external and two internal LVDTs are used for collecting deformation data. Internal LVDTs are placed at quarter points of the specimen with a gauge length of 152 mm. Base materials with and without fly ash are tested using Procedure Ia (NCHRP 2004) for base and subbase materials. In the past, base materials with fly ash were tested using Procedure II for fine-grained subgrades (cohesive soil). However, the stress conditions for each procedure were developed to cover the range of stress states likely to develop underneath flexible pavements subjected to moving loads (NCHRP 2004). Thus, the base and subbase procedure should be used for materials with fly ash to best represent field conditions. The base and subbase loading scheme is shown in Table B.1. A summary resilient modulus is also computed, as suggested in Section of NCHRP 1-28A. This summary resilient modulus corresponds to the resilient modulus at a bulk stress of 208 kpa for base materials (σ cyclic =103 kpa, σ 3 =35 kpa). Specimens for freeze-thaw testing are prepared in PVC molds (152 mm diameter and 305 mm height) in the same manner as other resilient modulus specimens. Rosa (2006) reported that effects of freeze-thaw on resilient modulus and unconfined compression generally occur within 5 cycles. Therefore, test specimens are subjected to 5 freeze-thaw cycles, and then their resilient modulus are measured. Preliminary testing is performed on a specimen instrumented with a thermocouple to evaluate the time necessary for complete freezing and thawing. Specimen height and weight are monitored between freezing and thawing cycles. After the last cycle, specimens are extruded frozen and thawed inside the resilient modulus cell. Unconfined compression tests are performed on specimens with fly ash after resilient modulus testing. Specimens are loaded with a strain rate of 0.21% per minute (Acosta et al. 2002), which is 0.64 mm per minute for specimens that are 305 mm tall.
82 72 Table B.1. NCHRP 1-28A Procedure Ia resilient modulus test sequence for base and subbase materials. Sequence Confining Contact Cyclic Stress, Maximum Cycles Pressure, σ 3 (kpa) Stress, σ contact (kpa) σ cyclic (kpa) Stress, σ max (kpa)
83 Dry Unit Weight CBR Dry Unit Weight (kn/m3) CBR Moisture content (%) Fig. B.1. Sample CBR and compaction curves with water content.
84 74 B.3 RESILIENT MODULUS STEP-BY-STEP PROCEDURE 1) Turn on MTS 406 controller. 2) Turn hydrostatic pressure on low for 1-2 minutes. 3) Turn on LVDT power supply on Tektronix PS280, placed under computer desk. 4) If error light comes on, hit reset and turn hydrostatic pressure on low again. 5) Switch pressure to high. 6) Place filter paper on bottom plate. DO NOT USE GEOTEXTILES. 7) Measure specimen height and diameter at three spots and average them. 8) Place compacted specimen on bottom plate. If specimen is compacted on the bottom plate, skip to Step 12. 9) Place rubber membrane over specimen using a mold. Be careful not to disturb the sample. A vacuum pump for stretching the membrane should be used for wetter samples. 10) Place two o-rings on the bottom to hold the membrane in place. 11) Place filter paper and top plate over sample. 12) Place two more o-rings to secure membrane to top plate. 13) Apply vacuum to specimen. Fittings are placed on bottom cap. 14) Place lower clamps at 76 mm from the bottom of the specimen. Use spring stretcher for placing clamp over specimen. Place nuts on screw to secure spring during testing. 15) Place upper clamps at 228 mm from the bottom of the specimen. Measure distance between clamps at three points, making sure the distance corresponds to 152 mm. 16) Place LVDTs on pedestal (adjust pedestal height if needed). Fix LVDTs by using an L-wrench to tighten the screws, keeping LVDTs and pedestal vertically aligned.
85 75 Make sure there is enough stroke range for testing. Stroke range can be adjusted by monitoring voltage in the Measurement & Automation program. 17) Place chamber on bottom cap, making sure there is no soil on bottom cap. 18) Place cover plate, making sure it is not skewed. 19) Clean plunger and lubricate it with WD ) Place LVDT on top of specimen and make sure plunger is in the socket. Apply vacuum grease around plunger and cover plate to avoid air leaks. 21) Screw cover plate in uniformly. 22) Place ball bearing on top of plunger. 23) Plug air supply hose into cell (bottom cap). 24) Log into PC and start RM-MTS version 7 (Labview 8.5). 25) Chose base and subbase test protocol. 26) Input specimen diameter (152.4 mm). 27) Select file path to be saved (*.txt). 28) Hit run. Use mouse to control piston speed on program screen. 29) Apply contact pressure as specified on screen (<0.02 kn) and hit ok. 30) Apply seating load. 31) Turn vacuum pump off and remove hose from fitting. 32) Clamp both sides of bottom cap to lock it down. 33) Set external LVDTs with enough stroke range for testing. 34) Hit ok to start testing. Some materials may require the LVDTs to be re-set during testing, depending on how much plastic strain occurs. If that is the case, re-set external LVDTs in between load sequences and monitor internal LVDTs so that stroke range is not exceeded.
86 76 APPENDIX C MATERIAL CONSTRUCTION
87 77 Generating the Class 5 and RSG materials was a difficult task because of the large quantities that had to be sieved and uniformly mixed. In addition, the pit run material contained a considerable amount of cobbles and boulders. Therefore, a large sieve was constructed and the material was sieved by using a Bobcat 553 skid steer loader. The different stages of generating the Class 5 material are shown in Fig. C.1. RSG required less effort to sieve because a smaller quantity was needed for laboratory testing. However, the addition of fines required a careful mixing procedure. The material was first sieved by hand, air dried at room temperature, and carefully mixed with a shovel until uniform. The samples were then placed in sealed buckets. Different stages of generating the RSG material are shown in Fig. C.2. Samples of the three base materials and Columbia fly ash are shown in Fig. C.3.
, sieving material")
88 Fig. C.1. Different stages of Class 5 production: pit run (a), sieving material (b), material retained (c), and final Class 5 blend (d). 78
, material")
89 Fig. C.2. Different stages of RSG production: Class 5 base (a), material retained (b), mixing with fines (c), and final RSG blend (d). 79
, RPM (b),")

90 Fig. C.3. RSG (a), RPM (b), Class 5 (c); and Columbia fly ash (d). 80
91 81 APPENDIX D TESTING EQUIPMENT
92 82 Table D.1. Volume for CBR and compaction (152-mm-diameter) PVC molds. Mold + Water Mold Plates + With Water Density Volume Temp Grease g g ºC kg/m 3 m 3 A B C D E F G H I J K L M N O P Q R S T U V
93 Fig. D.1. Compaction testing equipment. 83

94 Fig. D.2. CBR testing equipment. 84

95 Fig. D.3. Resilient modulus testing equipment. 85

96 Fig. D.4. Unconfined compression testing equipment. 86
, thawing")
97 Fig. D.5. Different stages of freeze-thaw M r testing: freezing specimens (a), thawing specimens (b), frozen end of a specimen (c), and frozen specimen in M r cell (d). 87
98 88 APPENDIX E CALIBRATION OF RESILIENT MODULUS TESTING EQUIPMENT
99 y = x R 2 = Pressure (kpa) Applied Voltage (volts) (a) 7 6 y = x R 2 = Force (kpa) (b) Applied Voltage (volts) Fig. E.1. Calibration for pressure gauge (a) and load cell (b) for resilient modulus test.
100 M922499A M922499A Small Internal LVDTs 2.5 Displacement (mm) y = x R 2 = y = x R 2 = Applied Voltage (volts) M M Large Internal LVDTs Displacement (mm) y = x R 2 = y = x R 2 = Applied Voltage (volts) Fig. E.2. Calibration for small internal LVDTs (a) and large internal LVDTs (b) for resilient modulus test.
101 M M External LVDTs Displacement (mm) y = x R 2 = y = x R 2 = Applied Voltage (volts) Fig. E.3. Calibration for external LVDTs for resilient modulus test.
102 92 APPENDIX F RESILIENT MODULUS OF PORTAGE SAND
103 93 Two resilient modulus tests (PS-3, PS-4) were performed on Portage sand (PS) to check the resilient modulus testing equipment by comparison with data from a previous study (PS-1, PS-2). Specimens having 152-mm diameter and 305-mm height were prepared dry at 95% of maximum dry unit weight using the rain-through-air method (Sawangsuriya 2001). Resilient moduli were computed from external deformation readings and geotextiles were placed on either end of the test specimen to be consistent with previous tests (Fig. F.1 (a)). Resilient moduli computed from data from internal LVDTs for PS-3 and PS-4 are shown in Fig. F.1 (b). Resilient moduli from external measurements were similar to those from the previous study. In addition, regression lines fitted with a power model were comparable for all tests. Resilient moduli from internal measurements were consistent for both tests (PS-3, PS-4) and their regression lines were practically the same.
104 PS-1 (External) PS-2 (External) PS-3 (External) PS-4 (External) PS-1 fit PS-2 fit PS-3 fit PS-4 fit Resilient Modulus (MPa) Bulk Stress (kpa) (a) 1000 PS-3 (Internal) PS-4 (Internal) PS-3 fit PS-4 fit Resilient Modulus (MPa) 100 (b) Bulk Stress (MPa) Fig. F.1. Resilient moduli from external LVDT measurements (a) and internal LVDT measurements (b) for Portage Sand.
105 95 APPENDIX G INFLUENCE OF GEOTEXTILE ON RESILIENT MODULUS
106 96 A specimen of RPM mixed with 10% fly ash was used to evaluate how geotextiles (GT) placed between the specimen and end platens affect the resilient modulus. A protocol consisting of 13 loading sequences was used, where the loads increase incrementally by 0.2 kn. Confining pressure was not applied. This protocol was used because it is simple and fast. Resilient moduli from these tests are shown in Fig. G.1. The geotextiles significantly affected the resilient modulus computed from external LVDT measurements. For example, the M r computed from external LVDT data more than doubled when geotextiles were not used, whereas the M r computed using data from the internal LVDTs was not influenced by the GTs. Based on this test, filter paper was used between the specimen and end platens for all remaining tests in the study.
107 External External - No GT Internal Internal - No GT Resilient Modulus (MPa) Bulk Stress (MPa) Fig. G.1. Resilient modulus tests on specimen of RPM with 10% fly ash with and without geotextiles.
108 98 APPENDIX H TEMPERATURE RECORDS OBSERVED DURING FREEZE-THAW TESTS
109 Freezing Thawing Temperature (celsius) Time (hours) (a) Freezing Thawing Temperature (celsius) (b) Time (hours) Fig. H.1. Temperature records for RPM (a) and RSG (b) with 10% fly ash (28 d cure).
110 100 APPENDIX I RESILIENT MODULUS FROM INTERNAL AND EXTERNAL LVDT MEASUREMENTS
111 101 I.1 DATA SUMMARY Resilient modulus test specimens were instrumented with both internal and external LVDTs. Internal LVDTs were mounted on clamps around the specimen and membrane, whereas external LVDTs were mounted on the plunger outside the chamber and rested on the cover plate (Fig. D.3). Internal LVDTs were placed at quarter points of the specimen to measure deformations over half the length of the specimen, whereas external LVDTs measured deformations of the entire specimen length. The summary resilient moduli (SRM) computed from internal LVDT measurements is higher than those for external LVDT measurements for all resilient modulus tests (Table 6). The ratio of internal to external SRM ranged from 1.2 to 1.4 for the base and recycled materials without fly ash and from 4.0 to 18.3 for the recycled materials blended with fly ash. The internal SRM are higher because displacement measurements for external LVDT readings are affected by bedding errors, sample end effects, and machine compliance (Tatsuoka et al. 1994, Ping et al. 2003, Bejarano et al. 2002). The resilient modulus results for base and recycled materials without fly ash are similar to those found by Ping et al. (1996, 2003). Ping et al. (1996) conducted resilient modulus tests on lime rock, a weathered limestone base material commonly used in Florida, instrumented with internal and external LVDTs. The ratio of internal to external resilient moduli calculated from the data reported ranges from 0.85 to Ping et al. (2003) conducted resilient modulus tests on granular soils (A-3 and A-2-4) instrumented with internal and external LVDTs. The ratio of internal to external resilient moduli ranged from 1.19 to 1.35 for A-3 soils, whereas the ratio ranged from 1.14 to 1.30 for A-2-4 soils. The ratio of internal to external SRM for the recycled materials blended with fly ash was significantly higher than ratios for materials without fly ash (ranging from 4.0 to
112 ) (Table 6). The ratio of internal to external SRM also increases with increasing stiffness (Fig. I.1). The increase in ratio is attributed to an increase in overestimation of the displacement as the material becomes stiffer (i.e. lower displacements), increasing the difference between external and internal displacement measurements. Bejarano et al. (2002) also report higher M r from internal readings, with an increase in the difference in M r for increasing stiffness due to greater influence of machine compliance. I.2 BASE MATERIALS Additional resilient moduli computed from internal and external LVDT measurements were obtained from the Minnesota Department of Transportation (MnDOT) database for comparison with the data collected in this study. The ratio of internal to external M r was computed for all cycles during resilient modulus testing, except those from the loading phase (Sequence 0). The ratio of internal to external M r as a function of internal M r for base and recycled materials without fly ash is shown in Fig. I.2, along with the corresponding bloxplot. The Class 5 base, RPM, RSG, MnROAD Class 6, and MnROAD RPM in Fig. 1.2 are materials tested at the University of Wisconsin-Madison (UW). The MnROAD Class 6 base and RPM in Fig. I.2 were obtained from a research project at the MnROAD facility in Minnesota. The Class 6 material is a crushed aggregate conforming to Minnesota s Class 6 specifications (MnDOT 2005), and the RPM is a recycled material containing 50% RAP. The remaining tests were conducted at MnDOT (MnDOT base, RPM, and reclaimed concrete). MnDOT base materials include gravels, granite, and taconite tailings. The MnDOT RPMs consist of base materials (Class 5, Class 6, and taconite tailings) having RAP contents of 30, 50, and 70%.
113 103 There is no apparent trend in the data (Fig. I.2 (a)). The boxplot shows that the majority of the ratios ranging are between 1.0 and 2.2, with a median ratio of 1.5 for all base and recycled materials (Fig. I.2 (b)). The relationship between internal (M r INT ) and external resilient moduli (M r EXT ) for base and recycled materials is shown in Fig. I.3. This relationship can be described by M = 5 (I.1) r INT 1. M r EXT Eq. I.1 has R 2 = This slope of Eq. I.1 equals the median M r ratio shown in the boxplot in Fig. I.2 (b). I.3 SUBGRADE MATERIALS Resilient modulus data for subgrade materials instrumented with both internal and external LVDTs were also obtained from the MnDOT database and from a previous UW study. The ratio of internal to external reslient moduli as a function of internal M r for subgrade materials is shown in Fig. I.4. The ratio of internal to external resilient moduli for subgrade materials increases approximately linearly with increasing internal M r, ranging from 1 to 10. This relationship can be described by M M r INT r EXT = r INT M (I.2) which has R 2 = The relationship between internal and external M r for subgrade materials is shown in Fig. I.5. The relationship between internal and external can be described by the power function: M r INT = ( M r EXT ) (I.3) which has R 2 = 0.86.
114 104 I.3 RECYCLED MATERIALS WITH FLY ASH The ratio of internal to external resilient moduli as a function of internal M r for subgrade materials is shown in Fig. I.6. The ratio of internal to external M r for recycled materials blended with fly ash increases with increasing internal M r, ranging from 2 to 25. An approximate linear relationship exists between the ratio of internal to external M r and internal M r for the recycled materials with fly ash: M M r INT r EXT = r INT M (I.4) which has R 2 = The relationship between internal and external M r for recycled materials blended with fly ash is shown in Fig. I.7. There is no apparent trend in internal to external M r for these materials. The recycled materials blended with fly ash have significantly higher stiffness than those without fly ash, which results in less accurate external deformation measurements due to a higher machine compliance effect. This behavior is also observed in Fig. I.6, where larger scatter exists when the internal M r exceeds 6000 MPa. The ratio of external to internal M r for a range of materials (fine-grained soils, crushed aggregates, recycled materials, recycled materials with fly ash, and concrete) is shown in Fig. I.8. To be consistent with the other data in Fig. I8, the data for fine-grained materials were limited to measurements on 150-mm diameter. The ratio of external to internal M r decreases with increasing internal M r. This trend is attributed to the increasing effect of machine compliance as the specimen becomes stiffer, which increases the difference between internal and external M r and therefore decreases ratio of external to internal M r.
115 Class 5 RPM RSG RPM - fly ash RSG - fly ash SRM INT /SRM EXT Internal SRM (MPa) Fig. I.1. Ratio of internal to external SRM versus internal SRM for RPM and RSG with and without fly ash and Class 5 base.
116 Class 5 Base RPM RSG MnROAD Class 6 MnROAD RPM MnDOT Base MnDOT RPM MnDOT Reclaimed Concrete M r INT /M r EXT (a) Internal M (MPa) r (b) Fig. I.2. Ratio of internal to external M r versus internal M r for base materials (a) and boxplot of ratio of internal to external M r versus internal M r for base materials (b). 103
117 UW Base MnDOT Base 700 Internal M r (MPa) M =1.50 M r INT r EXT R 2 = External M (MPa) r Fig. I.3. Internal versus external M r for base materials.
118 UW Subgrade MnDOT Subgrade 9 8 M r INT /M r EXT M r INT /M r EXT = M r INT R 2 = Internal M r (MPa) Fig. I.4. Ratio of internal to external M r versus internal M r for subgrade materials.
119 106 Internal M r (MPa) UW Subgrade MnDOT Subgrade M r INT = (M r EXT ) R 2 = External M (MPa) r Fig. I.5. Internal versus external M r for subgrade materials.
120 Recycled Materials with Fly Ash M r INT /M r EXT M r INT /M r EXT = M r INT R 2 = Internal M r (MPa) Fig. I.6. Ratio of internal to external M r versus internal M r for recycled materials blended with fly ash.
121 Recycled Materials with Fly Ash Internal M r (MPa) External M r (MPa) Fig. I.7. Internal versus external M r for recycled materials blended with fly ash.
122 UW Base MnDOT Base MnDOT Subgrade Recycled Materials-Fly ash Concrete M r EXT /M r INT Internal M r (MPa) Fig. I.8. Ratio of external to internal M r versus internal M r for a range of materials.
123 110 PART II ENVIRONMENTAL IMPACT AND FIELD PERFORMANCE MONITORING LIST OF FIGURES Fig. 1. Layout (a) and photograph of completed field monitoring instrumentation system (b). Fig. 2. Air temperature and relative humidity at CR 53. Fig. 3. Cumulative precipitation at Cambridge, MN (nearest NOAA Station to CR 53). Fig. 4. Fig. 5. Soil temperature and volumetric water content measurements in S-RSG layer at 216 mm depth from the AC pavement surface. Soil temperature and volumetric water content measurements in S-RSG layer at 241 mm depth from the AC pavement surface. Fig. 6. Soil temperature and volumetric water content measurements in RSG at 445 mm depth from the AC pavement surface. Fig. 7. Fig. 8. Fig. 9. Soil temperature and volumetric water content measurements in subgrade at 700 mm depth from the AC pavement surface. Soil temperature measurements in RSG at 420 mm depth and in subgrade at 685 mm depth from the AC pavement surface. Cumulative percolation into Lysimeter. Fig. 10. Concentrations of trace elements in leachate collected in lysimeter: elements with high concentrations (a), elements with moderate and persistent concentrations (b), and elements with low and diminishing concentrations (c). Fig. 11. Concentrations of trace elements in effluent from CLT on CH2 (Chisago Station 2): elements with peak concentrations exceeding 1 mg/l (a), elements with peak concentrations exceeding 10 μg/l, but less than 1 mg/l (b), and elements with peak concentrations less than 10 μg/l (c). Fig. 12. Concentrations of trace elements in effluent from CLT on CH5 (Chisago Station 5): elements with peak concentrations exceeding 1 mg/l (a), exceeding 10 μg/l, but less than 1 mg/l (b), and less than 10 μg/l (c). Fig. 13. Maximum deflections - deflections from the center sensor at 40 kn load (a) and soil stiffness gauge stiffness of subgrade, S-RSG after compaction and after 7 d of curing (b). Fig. 14. Elastic moduli back-calculated from FWD tests by using MODULUS 6.0 software for S-RSG (a) and subgrade (b). Fig. 15. Elastic modulus from laboratory resilient modulus, SSG and FWD tests at each station (a) and statistical evaluation of results (b).
124 INTRODUCTION Utilization of byproducts is becoming a common method to improve the ride quality and structural capacity of roads. Use of self-cementitious fly ash in stabilizing the existing road-surface gravel to form a stable base for hot mixed asphalt layer was implemented in the conversion of a gravel road (CR 53) to a paved road in Chisago County, MN. A study was conducted to evaluate both short and long term geo-mechanical and geo-environmental performance of the road constructed using fly ash stabilization by UW-Madison Geo Engineering Program. In the framework of the study, resilient modulus, California Bearing Ratio (CBR), unconfined compressive strength, soil stiffness gauge (SSG), dynamic cone penetrometer (DCP), falling weight deflectometer (FWD) tests have been performed to evaluate the geo-mechanical characteristics. DCP and SSG were performed on both subgrade and stabilized base. Resilient modulus, CBR and unconfined compressive strength tests were conducted on fly ash mixed in the field prepared right after construction and cured for 7 d. A lysimeter was constructed for assessing ground water impacts associated with leaching of metals from fly-ash stabilized subgrade. Column leaching tests were performed to asses the leaching characteristics of fly ash stabilized road-surface gravel. An automated field monitoring system was installed to observe the climatic conditions and provide a basis to interpret the geo-mechanical and geo-environmental performance of the roadway. The field instrumentation measures and records air temperature, relative humidity and precipitation. Volumetric water content and temperature in base, subbase, and subgrade at six locations. A report describing the project where self-cementing fly ashes from a coal-fired electric power plant were used to stabilize an existing gravel road to form a base for HMA pavement during reconstruction as a paved road of a 3.5-km section of gravel
125 112 County Road 53 in Chisago County, MN ( 88 km north of Saint Paul, MN) was prepared and submitted to Minnesota Department of Transportation (Hatipoglu et al. 2006). The area where fly ash stabilized material placed was cut and shaped in conformance with the lines and grades given on the plans. Then cementitious fly ash (10% by dry weight) was spread uniformly on the surface using truck-mounted lay-down equipment similar to that described in Edil et al. (2002). The fly ash was mixed with a CMI RS road reclaimer into the gravel road to a depth of 254 mm, with water being added during mixing using a water truck. This mixture, which contained 10% fly ash by dry weight, was compacted within 1-2 hr by a tamping foot compactor followed by a vibratory steel drum compactor. The stabilized road surface gravel (S-RSG) was overlain with 51 mm nonwearing course and 38 mm wearing course (total 89 mm) of HMA within 3 to 7 d after compaction of the fly ash stabilized base. The field monitoring was continued under this CBRC project after the completion of the project. Environmental data and field performance data collected is updated through 2008 and presented.
126 ENVIRONMENTAL DATA 2.1 METEOROLOGICAL AND SUBSURFACE CONDITIONS The field instrumentation system installed at CR 53 is shown in Fig. 1. Air temperature and relative humidity between November 2005 and May 2006 are shown in Fig. 2. The air temperature ranged from -27 and 34 oc during the monitoring period, with sub-freezing temperatures occurring between November and April. Precipitation record at the site was obtained from the nearest weather station at Cambridge, MN. The cumulative precipitation is shown in Fig. 3 for the period from November 2005 to May The air temperature and the subsurface temperatures and the volumetric water contents as measured by sensors 1, 2, 3, and 4 (see Fig. 1 (a)) are plotted in Figs Additional subsurface temperatures were measured by sensors 5 and 6 at depths of 420 and 685 mm, respectively. They are plotted along with the air temperature in Fig. 8 for the period October 2005 to April Temperature of the S-RSG (Sensors 3 and 4) ranged between -10 o C and 35 o C (Figs. 4 and 5). This layer was frozen for about 3-4 months. The temperature of the unstabilized RSG ranged between -1 or -4 o C and 31 o C (Figs. 6 and 8). This layer also experienced subfreezing temperatures for about 3-4 months but the temperature was slightly below the freezing point. Furthermore, subfreezing temperatures penetrated for very short periods after major cold air temperature spells in December and February. The temperature of the subgrade ranged between -1 or -3 o C and 27 o C (Figs. 7 and 8). The subsurface temperatures varied seasonally with the air temperature. The magnitude and frequency of variation diminishes with depth, which reflects the thermal damping provided by the pavement materials. Overall, the main layer that experienced freezing was the S-RSG although some penetration occurred below this layer. Main frost effects on the pavement would be expected to emanate from this layer.
127 114 The volumetric water contents are given in Figs. 4 and 5 for the S-RSG layer, in Fig. 6 for the RSG layer, and Fig. 7 for the subgrade. The volumetric water contents drop when the soil temperature begins to fall below 0 o C (volumetric water contents are not reported in these figures for periods when freezing was established). These apparent drops in water content reflect freezing of the pore water. The water content measured by WCRs is determined by measuring the velocity of an electromagnetic wave propagated along the probe. The velocity of the wave varies with the apparent dielectric constant of the soil, which is dominated by the dielectric constant of the water phase. When the pore water freezes, the dielectric constant of the water phase drops significantly and this appears as a drop in water content in WCR data (Benson and Bosscher 1999). Higher volumetric water contents were recorded in the fine-textured subgrade (maximum of about 33.5%) than the coarse-grained RSG (maximum of 28%), which reflects the greater propensity of fine-textured soils to retain water. The volumetric water content of SRGS, however, was quite high (up to 44 to 54%). This may be partly due to calibration as we have not yet obtained the calibration curves for S-RSG but used the curves for SRPM from Waseca project. This will be revised. No spikes are present in the water content records, which reflects the ability of the HMA to impede infiltration during precipitation and snow melt events and to limit evaporation during drier periods. The annual variation in water content is relatively small in the subgrade and the RSG layer, with a larger variation in the S-RSG layer. Higher water contents are recorded in the spring, when greater precipitation occurs. The seasonal variation in water content is also reflected in the drainage collected in the lysimeter, as shown in Fig. 3 when a significant rise is recorded in April There is not complete annual record of drainage drainage yet to make definitive conclusions.
128 TRACE ELEMENTS IN LYSIMETER DRAINAGE Approximately 29.6 m 3 of leachate corresponding to 3,183 mm of total drainage occurred during the monitoring period from November 2005 to June 2006 as shown in Fig. 9. This corresponds to 16 pore volumes of flow, PVF through the S-RSG by the end of March This amount has increased to 48 PVF by June 15, The low lying topography of the area and the heavy precipitation that occurred in Spring 2006 may have led to flooding of the lysimeter as these are very high numbers. For instance, in the City of Waseca only 1.8 PVF occurred over 20 months in a similar arrangement through a fly ash stabilized recycled pavement material. During this period, ph of the drainage has been near neutral ( ) and Eh = mv. Concentrations of trace elements in drainage from the lysimeters are shown in Fig. 10 as a function of PVF. The figure is divided into three parts: high concentration, moderate and persistent, and low and diminishing concentration. Elements not shown in Fig. 10 include those below the detection limit (Be, Ag, Hg, and Tl) and elements not typically associated with health risks (e.g., Ca). All of the concentrations are below USEPA maximum contaminant levels (MCLs) and Minnesota health risk levels (HRLs). The exception is Mn, which had a maximum concentration of 3,682 μg/l and exceeded the Minnesoata HRL of 100 μg/l. However, the Minnesota Department of Health no longer recommends the HRL value and plans exist to increase the HRL to 1,000 to 1,300 μg/l ( USEPA does not have a primary criterion for Mn although there is a secondary criterion. Most of the concentrations appear to be stabilizing and persistent. Concentrations of some elements appear to be low and decreasing (Pb, Sb and Sn).
129 TRACE ELEMENTS IN CLT EFFLUENT Two column tests were performed using material from Station 2 and 5 (20+00 and 40+00). Concentrations of trace elements in the effluent from the CLT on the S-RSG are shown in Figs. 11 and 12, respectively, for Stations 2 and 5. Elements are plotted separately in 3 groups depending on their peak concentrations in Figs. 11 and 12, those having peak concentrations exceeding 1 mg/l, those having peak concentrations between 10 and 1,000 μg/l, and those having peak concentrations less than 10 μg/l. Comparison of Fig. 11 with Fig. 12 indicates that the trace element concentrations are comparable for the two samples obtained at two different stations as the same elements are grouped into the same concentration range in both plots. The only exception is Sr which has a peak concentration slightly over 10 μg/l in Station 5 and slightly lower than 10 μg/l in Station 2 sample. Comparison of Figs. 11 and 12 indicates that the trace element concentrations in the CLT effluent typically are higher than concentrations in the drainage collected in the field (Fig. 10). The poor agreement suggests that the CLT test method that was used may not be appropriate for evaluating leaching of trace elements from S-RSG, unless a conservative estimate of the trace element concentrations is acceptable. Despite the higher concentrations obtained from the CLT, most of the elements have concentrations below USEPA MCLs and Minnesota HRLs. The exceptions are for B (peak = 2,820 μg/l in St. 5, no MCL, HRL = 600 μg/l,), Be (peak = 1 and 0.2 μg/l in St. 5 and St. 2, MCL = 4 μg/l, HRL = 0.08 μg/l), Cr (peak = 801 and 543 μg/l in St. 5 and St. 2, MCL = 100 μg/l, HRL = 100 μg/l), Ba (peak = 4,460 and 4,490 μg/l in St. 5 and St. 2, MCL, HRL = 2,000 μg/l), As (peak = 50 and 37 μg/l in St. 5 and St. 2, MCL = 10 μg/l, no HRL), and Se (peak = 45 and 48 μg/l in St. 5 and St. 2, MCL = 50 μg/l, HRL = 30 μg/l). Although the leachates do not appear to exceed the
130 117 new HRL limit of 2 μg/l for Sb, there are some concentrations that approach the limit in one of the CLT (Sta. 5). The elution behavior observed in the CLT effluent follows two patterns: (i) firstflush response, where the concentration falls from an initially high value and then remains nearly constant, and (ii) persistent leaching, where the concentration initially increases and then remains relatively constant.
131 FIELD MONITORING DATA Maximum deflections from the FWD tests for the 40-kN drop are shown in Fig. 13 (a) for November 2005 several months after construction and when the air and ground temperatures were dipping although there was no frost penetration and for May 2006 when ground temperatures but also the volumetric water contents both in RSG and S- RSG layers were significantly higher compared to November 2005 (see Figs. 4, 5, and 6). The volumetric water content of the subgrade layer was comparable between the two FWD testing dates (see Fig. 7). Maximum deflection, which is measured at the center of the loading plate, is a gross indicator of pavement response to dynamic load. Also given on Fig. 13b are the subgrade and S-RSG SSG surveys. There is a marked increase in deflections in May The deflections in May 2006 are particularly larger at Stations to The S-RSG stiffness as measured by SSG shows some variation but does not indicate any weakness around Station The subgrade stiffness, however, tends to mimic the variation observed in the FWD maximum deflections. The additional data obtained in October 2006 and November 2007 indicate similar response with limited deflections implying stable conditions have been established. Elastic moduli of the S-RSG that were obtained by inversion of the FWD data are shown in Fig. 14 (a). For the inversion, a three-layer profile was assumed that consisted of asphalt (89-mm thick), S-RSG (254-mm thick), and an infinitely thick subgrade. Modulus of the asphalt was allowed to vary between 345 and 11,750 MPa and the Poisson s ratio was set as 0.4. The S-RSG was assumed to have a Poisson s ratio of 0.35 and the modulus was allowed to vary between MPa. The subgrade was assumed to have a Poisson s ratio of The modulus of the S-RSG varies between 513 and 1098 MPa (mean = 741 MPa) in November 2005 and between 74 and 199 MPa (mean = 156 MPa) in May Most of the S-RSG moduli are Mpa in November In May 2006, S-RSG
132 119 moduli are 100 to 200 MPa at most stations but it is markedly low at Station The subgrade moduli also are lower in May 2006 in comparison to November 2005 but they appear to be fairly uniform along the roadway. The moduli obtained in October 2006 and November 2007 have means 350 to 378 MPa indicating stable conditions. Moduli obtained from the FWD inversion are compared with those obtained from the resilient modulus tests on field-mix specimens and the moduli computed from the stiffness measured with the SSG in Fig. 15. Elastic modulus (E) was computed from the SSG stiffness (K SSG ) using (Sawangsuriya et al., 2003): 2 KSSG (1 υ ) E = (1) 1.77 R where R is the outside radius of the SSG foot (0.057 m) and υ is Poisson s ratio (assumed to be 0.35). Moduli obtained from the resilient modulus test on field-mix samples are markedly lower than those obtained from November 2005 FWD but comparable to those from May 2006 FWD. SSG gives 50% higher moduli than the moduli obtained from the resilient modulus test. November 2005 FWD data appear anomalously high compared to other moduli data here and elsewhere. However, the additional moduli data obtained on October 2006 and November 2007 from FWD are reasonable and lower than November 2005 data but higher than May 2006 data.
133 CONCLUSIONS A field case where Class C and off-specification cementitious fly ashes (10% by weight) were used to stabilize road-surface gravel (RSG) during construction of a flexible pavement was monitored as part of this project. Moduli obtained from the FWD inversion are compared with those obtained from the resilient modulus tests on field-mix specimens and the moduli computed from the stiffness measured with the SSG. Moduli obtained from the resilient modulus test on field-mix samples are markedly lower than those obtained from November 2005 FWD but comparable to those from May 2006 FWD. However, the FWD surveys conducted in October 2006 and November 2007 indicate stable moduli (about 350 MPa) between the November 2005 and May 2006 moduli. SSG gives 50% higher moduli compared to the modulus obtained from the resilient test. Chemical analysis of the draining leachate showed that the concentrations of many trace elements were reasonably steady toward the end of the monitoring period. Longer-term monitoring is needed to fully understand the potential for S-RSG to leach trace elements during the service life of a pavement. However, during the monitoring period, all of the concentrations (with the exception of Mn) were below USEPA maximum contaminant levels (MCLs) and Minnesota health risk levels (HRLs) established by the Minnesota Dept. of Public Health. The trace element concentrations in the CLT effluent typically are higher than concentrations in the drainage collected in the field in the lysimeters. The poor agreement suggests that the CLT test method that was used may not be appropriate for evaluating leaching of trace elements from S-RSG, unless a conservative estimate of the trace element concentrations is acceptable. Despite the higher concentrations obtained from the CLT, most of the elements have concentrations below USEPA MCLs and Minnesota HRLs. The exceptions are for B, Be, Cr, Ba, As,
134 121 and Se. The lysimeter monitoring was discontinued because of the invasion of the lysimeter by high groundwater at this location.
135 122 REFERENCES Benson, C.H. and Bosscher, P.J., Time-domain reflectometry in geotechnics: a review. In: W. Marr and C. Fairhurst (Editors), Nondestructive and Automated Testing for Soil and Rock Properties, ASTM STP ASTM International, West Conshohocken, PA, pp Edil, T.B. et al., Field evaluation of construction alternatives for roadways over soft subgrade. Transportation Research Record, No. 1786: National Research Council, Washington DC, pp Hatipoglu, B., Edil, T.B., and Benson, C.H Fly Ash Stabilization of Gravel Road as Base for Pavement at Chisago County Road 53, Minnesota, Geo Engineering Report No , Department of Civil and Environmental Engineering, University of Wisconsin-Madison. Li, L., Benson, C. H., Edil, T.B. and Hatipoglu, B Fly Ash Stabilization of Recycled Asphalt Pavement Material in Waseca, Minnesota. Geo Engineering Report N , Department of Civil and Environmental Engineering, University of Wisconsin-Madison. Sawangsuriya, A., Edil, T.B. and Bosscher, P.J Relationship Between Soil Stiffness Gauge Modulus and Other Test Moduli for Granular Soils, Transportation Research Record, No. 1849, Paper No , National Research Council, Washington D. C., 2003, pp. 3-10
 Sensor 3 B Sensor 4 C (Sensor 5,6) 2.75 3.")


136 123 N (a) Lysimeter Sensor ID Depth of sensor from ACP surface (mm) S S S S S m 3.05 m A (Sensor 1,2) Sensor 3 B Sensor 4 C (Sensor 5,6) UW- Sta Locations of datalogger modem, weather station and solar panel Leachate collection tank S HMA Fly-ash mixed gravel Gravel Sensor 3, 4 Sensor 5 POC line Subgrade Volumetric water content & soil temperature gauge Soil temperature sensor Sensor 2 Sensor 1 Lysimeter Sensor 6 Drawing is not in scale Solar panel Rain gauge (b) Relative humidity and air temperature gauge CR23X data logger, AM25T multiplexer and COM 200 modem Lysimeter Battery STA: UW Phone line Fig. 1. Layout (a) and photograph of completed field monitoring instrumentation system (b).


137 Fig. 2. Air temperature and relative humidity at CR
138 Fig. 3. Cumulative precipitation at Cambridge, MN (nearest NOAA Station to CR 53). 125


139 Fig. 4. Soil temperature and volumetric water content measurements in S-RSG layer at 216 mm depth from the AC pavement surface. 126


140 Fig. 5. Soil temperature and volumetric water content measurements in S-RSG layer at 241 mm depth from the AC pavement surface. 127


141 Fig. 6. Soil temperature and volumetric water content measurements in RSG at 445 mm depth from the AC pavement surface. 128


142 Fig. 7. Soil temperature and volumetric water content measurements in subgrade at 700 mm depth from the AC pavement surface. 129


143 Fig. 8. Soil temperature measurements in RSG at 420 mm depth and in subgrade at 685 mm depth from the AC pavement surface. 130


144 Fig. 9. Cumulative percolation into Lysimeter. 131
Use of Fly Ash for Reconstruction of Bituminous Roads
 2009-27A Appendices to Use of Fly Ash for Reconstruction of Bituminous Roads Take the steps... Research...Knowledge...Innovative Solutions! Transportation Research Technical Report Documentation Page 1.
Sustainable Reconstruction of Highways with In-Situ Reclamation of Materials Stabilized for Heavier Loads
 BCR2A Conference, Proc. 2nd Int. Conf. on Bearing Capacity of Roads, Railways and Airfields 2009, Champaign, IL, 2009, CD-ROM, pp. 1011-1017. Sustainable Reconstruction of Highways with In-Situ Reclamation
Laboratory Comparison of Crushed Aggregate and Recycled Pavement Material With and Without High Carbon Fly Ash
 Geotech Geol Eng (21) 28:45 411 DOI 1.17/s176-9-93-1 ORIGINAL PAPER Laboratory Comparison of Crushed Aggregate and Recycled Pavement With and Without High Carbon Fly Ash Haifang Wen Justin Warner Tuncer
Use of Fly Ash for Reconstruction of Bituminous Roads
 2009-27 Use of Fly Ash for Reconstruction of Bituminous Roads Take the steps... Research...Knowledge...Innovative Solutions! Transportation Research 1. Report No. 2. 3. Recipients Accession No. MN/RC 2009-27
An Assessment of Resilient Modulus Testing: Internal and External Deflection Measurements
 Geotechnical Testing Journal, Vol. 35, No. 6, 2012 Available online at www.astm.org doi:10.1520/gtj20120077 Felipe Camargo, 1 Craig Benson, 2 and Tuncer Edil 3 An Assessment of Resilient Modulus Testing:
Recycled Base Aggregates in Pavement Applications
 Recycled Base Aggregates in Pavement Applications Jeffrey S. Melton, Ph.D. Outreach Director, Recycled Materials Resource Center jeffrey.melton@unh.edu The Big Picture Sustainability Nexus of major issues
Use of Fly Ash for Reconstruction of Bituminous Roads
 2009-27 Use of Fly Ash for Reconstruction of Bituminous Roads Take the steps... Research...Knowledge...Innovative Solutions! Transportation Research 1. Report No. 2. 3. Recipients Accession No. MN/RC 2009-27
Mix Design Issues for. In-Place Recycling Products
 CIR Definition Mix Design Issues for Cold in-place recycling (CIR) is the on-site recycling process to a typical treatment depth of 3 to 5 inches, using a train of equipment (tanker trucks, milling machines,
LARGE SCALE MODEL EXPERIMENTS OF RECYCLED BASE COURSE MATERIALS STABILIZED WITH CEMENT AND CEMENT KILN DUST. Brian R. Kootstra
 LARGE SCALE MODEL EXPERIMENTS OF RECYCLED BASE COURSE MATERIALS STABILIZED WITH CEMENT AND CEMENT KILN DUST by Brian R. Kootstra A thesis submitted in partial fulfillment of the requirements for the degree
Foundry Byproducts as Sustainable Geotechnical Construction Materials
 Foundry Byproducts as Sustainable Geotechnical Construction Materials Craig H. Benson, PhD, PE, DGE Wisconsin Distinguished Professor Director, Recycled Materials Resource Center University of Wisconsin-Madison
How to Select the Appropriate Pavement Rehabilitation Option. David Rettner, PE American Engineering Testing, Inc.
 1 How to Select the Appropriate Pavement Rehabilitation Option David Rettner, PE American Engineering Testing, Inc. 2 Pavement Rehabilitation Selection Understanding the Problem 3 Pavement Assessment Pavement
IFCEE 09, American Society of Civil Engineers, 2009, Orlando, Florida
 IFCEE 9, American Society of Civil Engineers, 29, Orlando, Florida Field Evaluation of Fly Ash Stabilized Subgrade in US 12 Highway Lin Li 1, M. ASCE, P.E., Onur Tastan 2, Craig H. Benson 3, F. ASCE, P.E.,
FULL DEPTH RECLAMATION. FDR Candidates STABILIZER DESIGN. Benefits. Benefits LOCAL ROADS PROGRAM What is Full Depth Reclamation (FDR)?
?") FULL DEPTH RECLAMATION Presented to: LOCAL ROADS PROGRAM 2012 What is Full Depth Reclamation (FDR)? Full Depth Reclamation is a pavement rehabilitation technique in which the full flexible pavement section
FULL DEPTH RECLAMATION Presented to: LOCAL ROADS PROGRAM 2012 What is Full Depth Reclamation (FDR)? Full Depth Reclamation is a pavement rehabilitation technique in which the full flexible pavement section
Full-Depth Reclamation with Cement
 Full-Depth Reclamation with Cement 28th Annual Regional Local Roads Conference David L. Rettner Sr. Vice President American Engineering Testing, Inc. Design Construction Field Testing Performance Types
Characterizing Engineering Properties of Foundry Sands
 Characterizing Engineering Properties of Foundry Sands Craig H. Benson, PhD, PE Recycled Materials Resource Center University of Washington chbenson@u.washington.edu www.recycledmaterials.org Recycled
Stephanie Drain, P.E Midwestern States Regional In-Place Recycling Conference Schaumburg, IL September 11, 2013
 Stephanie Drain, P.E. 2013 Midwestern States Regional In-Place Recycling Conference Schaumburg, IL September 11, 2013 George Papa Bear Halas One of the greatest NFL coaches of all time Coaching career
Renae Kuehl, PE, SRF Consulting Group Dan Wegman, PE, Braun Intertec Corporation November 2, 2017
 BASE STABILIZATION GUIDANCE AND ADDITIVE SELECTION FOR PAVEMENT DESIGN Renae Kuehl, PE, SRF Consulting Group Dan Wegman, PE, Braun Intertec Corporation November 2, 2017 Who is the LRRB? Serves local agencies
Roadway Base Stabilization Current Practice
 Roadway Base Stabilization Current Practice AGC MNDOT TRANSPORTATION CONSTRUCTION AND GRADING INNOVATIONS FORUM December 6, 2016 OVERVIEW ROAD TYPES BASE STRENGTHENING APPLIES TO ALL KEY CONSIDERATIONS
FULL - DEPTH RECYCLING OF ASPHALT PAVEMENTS WITH PORTLAND CEMENT
 FULL - DEPTH RECYCLING OF ASPHALT PAVEMENTS WITH PORTLAND CEMENT Dick Martin Pavement Recycling Specialist Road Recycling Council New England Region What is Full Depth Reclamation? FDR is the rehabilitation
THE BENEFICIAL REUSE OF ASPHALT SHINGLES IN ROADWAY CONSTRUCTION. Tuncer B. Edil and Justin D. Warner
 THE BENEFICIAL REUSE OF ASPHALT SHINGLES IN ROADWAY CONSTRUCTION by Tuncer B. Edil and Justin D. Warner Final report submitted to the Solid Waste Reduction and Recycling Demonstration Program Wisconsin
Hot Mix Asphalt with RAP (and/or Other Materials)
") Recycled Materials Resource Center UNH contact info: Kevin Gardner Co-Center Director kevin.gardner@unh.edu 603-862-4334 Jeff Melton Out Reach Director jeffrey.melton@unh.edu 603-862-2107 Recycled Materials
Recycled Materials Resource Center UNH contact info: Kevin Gardner Co-Center Director kevin.gardner@unh.edu 603-862-4334 Jeff Melton Out Reach Director jeffrey.melton@unh.edu 603-862-2107 Recycled Materials
The Usage, Storage and Testing of Recycled Materials - Results of Survey
 The Usage, Storage and Testing of Recycled Materials - Results of Survey TPF-5 (129) Recycled Unbound Materials Mn/DOT Contract No. 89264 Work Order No. 2 CFMS Contract No. B14513 Addendum to Task 1A:
FULL DEPTH RECLAMATION FOR CITIES AND COUNTIES. OTEC - October 27, 2015
 FULL DEPTH RECLAMATION FOR CITIES AND COUNTIES OTEC - October 27, 2015 OVERVIEW Time + Traffic + Environment = Deterioration Temporary repairs include overlays or mill and fills to extend service life
Full Depth Reclamation
 Design Manual Chapter 5 - Roadway Design 5J - Pavement Rehabilitation Program 5J-3 Full Depth Reclamation A. General Full depth reclamation (FDR) is a pavement rehabilitation technique in which the full
Road Rehabilitation Using Foamed Asphalt
 Road Rehabilitation Using Foamed Asphalt 2008 M&RR Author: Roger Olson Andrew Eller March 2008 INTRODUCTION During the Arab Oil Embargo of 1973, the price of crude oil quadrupled to $12 per barrel. Subsequently
Airport Pavement Rehabilitation 2015 Minnesota Airports Conference
 Airport Pavement Rehabilitation 2015 Minnesota Airports Conference St. Cloud, Minnesota April 16, 2015 David L. Rettner, P. E. American Engineering Testing, Inc. Pavement Life Cycle Routine Maintenance
7.1 Flexible Pavement Design. 7.2 Rigid Pavement Design TRANSPORTATION SYSTEM ENGINEERING 1, 61360
 7.1 Flexible Pavement Design 7.2 Rigid Pavement Design 1 Highway pavements are divided into two main categories: Flexible -Bituminous concrete Rigid -Portland cement concrete- Flexible pavements usually
CHEMICAL STABILIZATION PAVEMENT SUBGRADE CHEMICAL STABILIZATION OF PAVEMENT SUBGRADE
 OF The "subgrade" is the in situ material upon which the pavement structure is placed. Although there is a tendency to look at pavement performance in terms of pavement structures and mix design alone,
THE BENEFICIAL REUSE OF ASPHALT SHINGLES IN ROADWAY CONSTRUCTION. Justin D. Warner
 THE BENEFICIAL REUSE OF ASPHALT SHINGLES IN ROADWAY CONSTRUCTION by Justin D. Warner A thesis submitted in partial fulfillment of the requirements for the degree of Master of Science Geological Engineering
Design Criteria and Testing for Cold In-Place Recycling. Todd Thomas Technical Services Engineer Colas Solutions, Inc.
 Design Criteria and Testing for Cold In-Place Recycling Todd Thomas Technical Services Engineer Colas Solutions, Inc. August 29, 2012 Presentation Topics CIR description Project selection criteria for
Practical approach for designing flexible pavements using recycled roadway materials as base course
 Road Materials and Pavement Design ifirst, 2012, 1 18 Practical approach for designing flexible pavements using recycled roadway materials as base course Ali Ebrahimi*, Brian R. Kootstra, Tuncer B. Edil
What is it? What is Granular Base Stabilization ti (GBS)? Emulsion Full Depth Reclamation Process
? Emulsion Full Depth Reclamation Process") Emulsion Full Depth Reclamation and Granular Base Stabilization An Engineered Approach 47 th Idaho Asphalt Conference Rocktober 25 th, 2007 Full Depth Reclamation (FDR) What is it? Rehabilitation technique
Emulsion Full Depth Reclamation and Granular Base Stabilization An Engineered Approach 47 th Idaho Asphalt Conference Rocktober 25 th, 2007 Full Depth Reclamation (FDR) What is it? Rehabilitation technique
Advantages of Full Depth Recycling
 Definition of FDR re-use existing asphalt, base and subgrade material 6 12 (150 300 mm) to produce a new base course a new wearing surface is applied a stabilizer can be incorporated Advantages of Full
Beneficial Use of Coal Combustion By-products in the Rehabilitation of Failed Asphalt Pavements
 Beneficial Use of Coal Combustion By-products in the Rehabilitation of Failed Asphalt Pavements Tarunjit S. Butalia and William E. Wolfe Abstract This study demonstrates the use of Class F fly ash in combination
Full-Depth Reclamation of Asphalt Pavements Using Lime-Activated Class F Fly Ash: Structural Monitoring Aspects
 2009 World of Coal Ash (WOCA) Conference - May 4-7, 2009 in Lexington, KY, USA http://www.flyash.info/ Full-Depth Reclamation of Asphalt Pavements Using Lime-Activated Class F Fly Ash: Structural Monitoring
Full Depth Reclamation
 Full Depth Reclamation FDR Has Been Around A While 2 3 What is Full Depth Reclamation (FDR)? Full Depth Reclamation is a pavement rehabilitation technique in which the full flexible pavement section and
Iowa Thickness Design Guide for Low Volume Roads Using Reclaimed Hydrated Class C Fly Ash Bases
 Bergeson and Barnes 1998 TRANSPORTATION CONFERENCE PROCEEDINGS 253 Iowa Thickness Design Guide for Low Volume Roads Using Reclaimed Hydrated Class C Fly Ash Bases KENNETH L. BERGESON AND ANDREW G. BARNES
SCALING AND EQUIVALENCY OF BENCH-SCALE TESTS TO FIELD SCALE CONDITIONS
 SCALING AND EQUIVALENCY OF BENCH-SCALE TESTS TO FIELD SCALE CONDITIONS by GREGORY JAMES SCHAERTL A thesis submitted in partial fulfillment of the requirements for the degree of MASTER OF SCIENCE CIVIL
RESILIENT MODULUS TESTING OF OPEN GRADED DRAINAGE LAYER AGGREGATES FOR INTERLOCKING CONCRETE BLOCK PAVEMENTS
 RESILIENT MODULUS TESTING OF OPEN GRADED DRAINAGE LAYER AGGREGATES FOR INTERLOCKING CONCRETE BLOCK PAVEMENTS SUMMARY David Hein, P. Eng., Principal Engineer Applied Research Associates, Inc. 541 Eglinton
Feasibility of Lime Stabilized Expansive Soil as a Subbase Material for Flexible Pavements
 Feasibility of Lime Stabilized Expansive Soil as a Subbase Material for Flexible Pavements S. Patel 1, L. M. Reddy 2 And P. M. Chaudhary 3 Abstract A large portion of India roughly equal to 0.8 million
SUSTAINABLE CONSTRUCTION CASE HISTORY: FLY ASH STABILIZATION OF RECYCLED ASPHALT PAVEMENT MATERIAL
 Li, Benson, Edil and Hatipoglu 1 Session Title: Building Green Highways: Recycled and Waste Materials in Transportation Applications Sponsoring Committees: AFP (Committee on Physicochemical and Biological
Evaluation Plan for Investigation of In- Place Recycling of Asphalt Concrete as Unbound Base Material
 November 2004 Evaluation Plan for Investigation of In- Place Recycling of Asphalt Concrete as Unbound Base Material PPRC 2003-2004 Strategic Plan Item 2.4.2 Prepared by Partnered Pavement Research Center
Sustainable Construction Case History: Fly Ash Stabilization of Recycled Asphalt Pavement Material
 Geotech Geol Eng (8) 26:177 187 DOI.7/s76-7-9155-2 ORIGINAL PAPER Sustainable Construction Case History: Fly Ash Stabilization of Recycled Asphalt Pavement Material Lin Li Æ Craig H. Benson Æ Tuncer B.
Center for By-Products Utilization
 Center for By-Products Utilization USE OF COAL COMBUSTION PRODUCTS IN PERMEABLE ROADWAY BASE CONSTRUCTION By Tarun R. Naik, Rudolph N. Kraus, Rafat Siddique, and Paul Ziemkiewicz Report No. CBU-2003-16
Principles of Soil Stabilization
 Principles of Soil Stabilization by E. J. Y oder, R esearch E ngineer Joint Highway Research Project Purdue University A problem continually facing an engineer is that dealing with procedures and techniques
LEACHING OF TRACE ELEMENTS FROM SOILS STABLIZED WITH COAL FLY ASH
 LEACHING OF TRACE ELEMENTS FROM SOILS STABLIZED WITH COAL FLY ASH By Craig H. Benson 1, Sazzad Bin-Shafique 2, and Tuncer B. Edil 1 ABSTRACT: Batch water leaching tests (WLTs) and column leaching tests
Resilient Moduli and Structural Layer Coefficient of Flyash Stabilized Recycled Asphalt Base
 27 World of Coal Ash (WOCA), May 7-1, 27, Northern Kentucky, USA http://www.flyash.info Resilient Moduli and Structural Layer Coefficient of Flyash Stabilized Recycled Asphalt Base Anil Misra 1, Sunil
Lime Use For Soil & Base Improvement
 Lime Use For Soil & Base Improvement Application Design Testing P3 Symposium July 19, 2007 Appian Way Eric Berger Common Additives for Soil Treatment Clay Silt/ Sand Gravel Lime Lime Portland Cement Lime/
Mechanistic-Climatic Characterization of Foamed Asphalt Stabilized Granular Pavements in Saskatchewan
 Mechanistic-Climatic Characterization of Foamed Asphalt Stabilized Granular Pavements in Saskatchewan Curtis Berthelot, Ph.D., P.Eng. Department of Civil and Geological Engineering University of Saskatchewan
Resilient Modulus of Recycled Asphalt Pavement and Recycled Concrete Aggregate
 3901 Resilient Modulus of Recycled Asphalt Pavement and Recycled Concrete Aggregate Ozlem Bozyurt 1, James M. Tinjum, PhD, PE, M. ASCE 2, Young-Hwan Son, PhD 3, Tuncer B. Edil, PhD, PE, DGE, F. ASCE 4,
U.S. National Overview Cold-In Place- Recycling. Laramie, Wyoming 18 th July 2013
 U.S. National Overview Cold-In Place- Recycling Laramie, Wyoming 18 th July 2013 Why recycle? Correct pavement defects Increase structural capacity Geometry Limited elevation rise or limited width Reuse
A STUDY ON THE PERFORMANCE OF DEEP LAYER SUBGRADE STABILIZATION
 Research Experience for Undergraduates at UNC Charlotte Sean Windt Civil and Environmental Engineering Department A STUDY ON THE PERFORMANCE OF DEEP LAYER SUBGRADE STABILIZATION CONTENTS INTRODUCTION LITERATURE
Soil-Cement Technology for Pavements: Different Products for Different Applications
 Soil-Cement Technology for Pavements: Different Products for Different Applications A publication from the Portland Cement Association Compliments of 801 South 71st Avenue Phoenix, AZ 85043 623-936-8800
Sensitivity of Subgrade Resilient Modulus to Moisture Variation
 Sensitivity of Subgrade Resilient Modulus to Moisture Variation Haithem Soliman, EIT Graduate Student Department of Civil Engineering University of Manitoba Email: umsolimh@cc.umanitoba.ca and Ahmed Shalaby,
TABLE OF CONTENTS DECLARATION DEDICATION ACKNOWLEDGEMENTS ABSTRACT ABSTRAK
 vii TABLE OF CONTENTS CHAPTER TITLE PAGE DECLARATION DEDICATION ACKNOWLEDGEMENTS ABSTRACT ABSTRAK TABLE OF CONTENTS LIST OF TABLES LIST OF FIGURES LIST OF ABBREVIATIONS LIST OF SYMBOLS LIST OF APPENDICES
ITEM 252 IN-PLACE FULL DEPTH COLD FLEXIBLE PAVEMENT RECYCLING
 AFTER NOVEMBER 1, 2008 ITEM 252 IN-PLACE FULL DEPTH COLD FLEXIBLE PAVEMENT RECYCLING 252.1 Description. This work shall consist of a stabilized base course composed of a mixture of the existing bituminous
INCORPORATING A FLY ASH STABILIZED LAYER INTO PAVEMENT DESIGN CASE STUDY
 INCORPORATING A FLY ASH STABILIZED LAYER INTO PAVEMENT DESIGN CASE STUDY by Sazzad Bin-Shafique, Tuncer B. Edil, Craig H. Benson and Aykut Senol Geo Engineering Report No. 03-04 Geo Engineering Program
Materials for Civil and Construction Engineers
 Materials for Civil and Construction Engineers CHAPTER 9 Asphalt Binders and Asphalt Mixtures Bituminous Materials Asphalt Natural or Refined from petroleum oil Tar Asphalt Cement Cutback Emulsion 2 Source
Recycled Unbound Base Pooled Fund Study
 Recycled Unbound Base Pooled Fund Study Tuncer B. Edil Recycled Materials Resource Center Geological Engineering Program University of Wisconsin-Madison !! Recycled Concrete Aggregate (RCA)! Demolition
Bituminous Pavements and Surfaces
 PART ONE Bituminous Pavements and Surfaces Bituminous pavements and surfaces are composed of compacted aggregate and bitumen. The aggregate transmits the load from the surface to the base, takes the abrasive
Introduction to Bitumen Stabilised Materials BSMs
 Introduction to Bitumen Stabilised Materials BSMs Kim Jenkins SARF Course on BSMs Assagai, Shongweni 14 and 15 July 2015 tellenbosch Hot In Place In Plant Cold Rut resistant 3% 2% What defines a BSM? Strongly
Structural Requirements of Bituminous Paving Mixtures
 A2D04: Committee on Characteristics of Bituminous Paving Mixtures To Meet Structural Requirements Chairman: Reynaldo Roque Structural Requirements of Bituminous Paving Mixtures AMY EPPS, Texas A&M University
An Introduction to Soil Stabilization with Portland Cement
 An Introduction to Soil Stabilization with Portland Cement Course No: G02-012 Credit: 2 PDH J. Paul Guyer, P.E., R.A., Fellow ASCE, Fellow AEI Continuing Education and Development, Inc. 9 Greyridge Farm
Incorporating Recycling into Pavement Design Where does it Fit?
 Incorporating Recycling into Pavement Design Where does it Fit? AEMA-ARRA-ISSA-PPRA Fall Meeting Niagara Falls, Ontario October 13-15, 2015 David Hein, P. Eng., Principal Engineer Vice-President, Transportation
FLY ASH STABILIZATION OF RECYCLED ASPHALT PAVEMENT MATERIAL IN WASECA, MINNESOTA
 FLY ASH STABILIZATION OF RECYCLED ASPHALT PAVEMENT MATERIAL IN WASECA, MINNESOTA by Lin Li, Craig H. Benson, Tuncer B. Edil, and Bulent Hatipoglu Geo Engineering Report No. 06-18 Department of Civil and
Performance Comparison of Cold in Place Recycled and Conventional HMA Mixes
 IOSR Journal of Mechanical and Civil Engineering (IOSR-JMCE) ISSN: 2278-1684 Volume 4, Issue 1 (Nov-Dec. 2012), PP 27-31 Performance Comparison of Cold in Place Recycled and Conventional HMA Mixes Kamran
Chemical Stabilization of Selected Laterite Soils Using Lateralite for Highway Pavement
 International Journal of Engineering and Technology Volume 5 No. 5, May, 2015 Chemical Stabilization of Selected Laterite Soils Using Lateralite for Highway Pavement I. Akiije Department of Civil and Environmental
USE OF LIME-ACTIVATED CLASS F FLY ASH IN FULL DEPTH RECLAMATION OF ASPHALT PAVEMENTS
 USE OF LIME-ACTIVATED CLASS F FLY ASH IN FULL DEPTH RECLAMATION OF ASPHALT PAVEMENTS William E. Wolfe, Ph.D., P.E., Project Manager Civil and Environmental Engineering and Geodetic Science The Ohio State
Stabilizing Soft Fine-Grained Soils with Fly Ash
 Stabilizing Soft Fine-Grained Soils with Fly Ash Tuncer B. Edil, M.ASCE 1 ; Hector A. Acosta, M.ASCE 2 ; and Craig H. Benson, M.ASCE 3 Abstract: The objective of this study was to evaluate the effectiveness
APPENDIX A DRAFT PERFORMANCE-BASED MIX DESIGN PROCEDURE FOR POROUS FRICTION COURSE
 APPENDIX A DRAFT PERFORMANCE-BASED MIX DESIGN PROCEDURE FOR POROUS FRICTION COURSE Standard Practice for Permeable Friction Course (PFC) Mix Design AASHTO Designation: 1. SCOPE 1.1 This standard covers
Center for By-Products Utilization
 Center for By-Products Utilization USE OF COAL COMBUSTION PRODUCTS IN PERMEABLE ROADWAY BASE CONSTRUCTION By Tarun R. Naik, Rudolph N. Kraus, Rafat Siddique, and Paul Ziemkiewicz Report No. CBU-2003-02
Integrated Pavement Solutions
 Integrated Pavement Solutions 1 Product Solutions for Every Paving Need Application Solution Mainline highways Commercial airports General aviation airports PCC pavement Heavy-duty industrial Concrete
MODEL STUDY ON CYCLIC LOADING RESPONSES OF FLEXIBLE PAVEMENT SYSTEM LAID ON EXPANSIVE SUBGRADE
 MODEL STUDY ON CYCLIC LOADING RESPONSES OF FLEXIBLE PAVEMENT SYSTEM LAID ON EXPANSIVE SUBGRADE G.Radhakrishnan 1 1 Research Scholar, Department of Civil Engineering, JNTUK, Kakinada - 533 004, India. Email:
An Introduction to Soil Stabilization for Pavements
 PDHonline Course C450 (2 PDH) An Introduction to Soil Stabilization for Pavements Instructor: J. Paul Guyer, P.E., R.A., Fellow ASCE, Fellow AEI 2012 PDH Online PDH Center 5272 Meadow Estates Drive Fairfax,
Cement Treated Sub-Base For Bituminous Pavement
 6th International Conference on Recent Trends in Engineering & Technology (ICRTET - 2018) Cement Treated Sub-Base For Bituminous Pavement 1 Aher D.D., 2 Sangale Y. B., 3 Pagar S. R., 4 Yadnesh Patil, 5
SCOPE OF ACCREDITATION TO ISO/IEC 17025:2005
 SCOPE OF ACCREDITATION TO ISO/IEC 17025:2005 TOLUNAY-WONG ENGINEERS, INC 10710 Sam Houston Parkway West, Suite 100 Houston, TX 77031 Patricia Hodgkins Phone: 504 202 7541 Valid To: February 29, 2020 Certificate
Index FM 5-472/NAVFAC MO 330/AFJMAN (I)
") RETURN TO TOC FM 5-472/NAVFAC MO 330/AFJMAN 32-1221(I) Index A accelerators, 4-7 additive, 5-1, 5-2, 5-5, 5-6 admixtures, 4-2, 4-3, 4-7, 4-8, 4-9, 4-20 adsorption, 2-6, 2-7 aerial photographs, 2-28, 2-30,
RETURN TO TOC FM 5-472/NAVFAC MO 330/AFJMAN 32-1221(I) Index A accelerators, 4-7 additive, 5-1, 5-2, 5-5, 5-6 admixtures, 4-2, 4-3, 4-7, 4-8, 4-9, 4-20 adsorption, 2-6, 2-7 aerial photographs, 2-28, 2-30,
Application of Laboratory Asphalt Cracking Tests to Cold In-Place Recycled (CIR) Mixtures*
 Mixtures*") Application of Laboratory Asphalt Cracking Tests to Cold In-Place Recycled (CIR) Mixtures* American Engineering Testing, Inc. (AET) Eyoab Z. Teshale, David Rettner, Allen Hartleib, Dan Kriesel Presented
Application of Laboratory Asphalt Cracking Tests to Cold In-Place Recycled (CIR) Mixtures* American Engineering Testing, Inc. (AET) Eyoab Z. Teshale, David Rettner, Allen Hartleib, Dan Kriesel Presented
Structural Evaluation of Asphalt Pavements with Full-Depth Reclaimed Base
 Structural Evaluation of Asphalt Pavements with Full-Depth Reclaimed Base Joseph F. Labuz, Principal Investigator Department of Civil Engineering University of Minnesota December 2012 Research Project
Mechanistic-Empirical Design Guide Modeling of Asphalt Emulsion Full Depth Reclamation Mixes
 Mechanistic-Empirical Design Guide Modeling of Asphalt Emulsion Full Depth Reclamation Mixes Todd W. Thomas SemMaterials, L.P. 6120 South Yale Avenue, Suite 700 Tulsa, Oklahoma 74136 Telephone 918-524-8353
Effect of High Percentages of Reclaimed Asphalt Pavement on Mechanical Properties of Cement- Treated Base Material
 Brigham Young University BYU ScholarsArchive All Theses and Dissertations 2014-07-10 Effect of High Percentages of Reclaimed Asphalt Pavement on Mechanical Properties of Cement- Treated Base Material Jacob
National AustStab Guidelines Pavement design guide for a cement stabilised base layer for light traffic [Version B 31 July 2012]
![National AustStab Guidelines Pavement design guide for a cement stabilised base layer for light traffic [Version B 31 July 2012]](/thumbs/73/68716073.jpg "National AustStab Guidelines Pavement design guide for a cement stabilised base layer for light traffic [Version B 31 July 2012]") National AustStab Guidelines Pavement design guide for a cement stabilised base layer for light traffic [Version B 31 July 2012] The Association is a non-profit organisation sponsored by organisations
National AustStab Guidelines Pavement design guide for a cement stabilised base layer for light traffic [Version B 31 July 2012] The Association is a non-profit organisation sponsored by organisations
IPWEA/WALGA Specification for the supply of recycled road base
 IPWEA/WALGA Specification for the supply of recycled road base Version 1 May 2016 IPWEA/WALGA Specification for the supply of recycled road base FOREWORD These Specifications have been developed by the
Determination of Mechanical Properties of Materials Used in WAY-30 Test Pavements
 The Ohio Department of Transportation Office of Research & Development Executive Summary Report Determination of Mechanical Properties of Materials Used in WAY-30 Test Pavements Start date: January 1,
Granular Base INTRODUCTION PERFORMANCE RECORD MATERIAL PROCESSING REQUIREMENTS. file://w:\wwwroot\ref\17\16673.htm
 Page 1 of 5 RECLAIMED ASPHALT PAVEMENT User Guideline Granular Base INTRODUCTION Reclaimed asphalt pavement (RAP) can be used as granular base or subbase material in virtually all pavement types, including
Geotechnical characteristics of recycled asphalt
 Geotechnical characteristics of recycled asphalt A. Arulrajah Associate Professor, Swinburne University of Technology J. Piratheepan Lecturer, Swinburne University of Technology Final report April 2011
Stabilization of A-6 Lateritic Soil using Cold Reclaimed Asphalt Pavement
 International Journal of Engineering and Technology Volume 4 No. 1, January, 2014 Stabilization of A-6 Lateritic Soil using Cold Reclaimed Asphalt Pavement A. M. Mustapha 1, R. Jibrin 2, N. M. Etsuworo
KANSAS DEPARTMENT OF TRANSPORTATION SPECIAL PROVISION TO THE STANDARD SPECIFICATIONS, EDITION 2007
 Sheet 1 of 6 KANSAS DEPARTMENT OF TRANSPORTATION SPECIAL PROVISION TO THE STANDARD SPECIFICATIONS, EDITION 2007 Delete SECTION 2501 and replace with the following: SECTION 2501 PART V 2501.1 GENERAL In
Project Selection for In-Place Recycling and CRAB. Types of Cold Recycling
 Project Selection for In-Place Recycling and CRAB 54 th Annual Idaho Asphalt Conference Moscow, Idaho October 23, 2014 Stephen A (Steve) Cross, PhD, PE Professor, Oklahoma State University Technical Director
2501 PART V SECTION 2501 PART V
 SECTION 2501 PART V 2501.1 GENERAL In order to properly monitor materials on a project, follow all applicable procedures as outlined in the KDOT Construction Manual, Part V. This includes, but is not limited
DIVISION 2500 MISCELLANEOUS METHODS OF TEST
 TABLE OF CONTENTS DIVISION 2500 MISCELLANEOUS METHODS OF TEST SECTION 2501 PART V... 2500-1 PAGE i SECTION 2501 PART V 2501.1 GENERAL In order to properly monitor materials on a project, follow all applicable
Technical Brief. The Versatile Chemical. National Lime Association. Lime-Treated Soil Drying, Modification, and Stabilization
 National Lime Association LIME The Versatile Chemical Technical Brief Steps for Mixture Design and Testing for Lime Stabilized Soil Evaluate soil to gain a general understanding of its suitability for
Performance Characteristics of Liquid and Lime-Treated Asphalt Mixtures
 Performance Characteristics of Liquid and Lime-Treated Asphalt Mixtures P. Sebaaly & E. Hajj Department of Civil& Env. Engineering,University of Nevada, Reno, Nevada, USA ABSTRACT: An extensive laboratory
Long-Term Performance of Failed Flexible Pavements Stabilized with Cement
 Long-Term Performance of Failed Flexible Pavements Stabilized with Cement Gregory E. Halsted, P.E., Portland Cement Association Paper prepared for presentation at the Long-term Warranty Contracts for Pavement
SOIL STABILIZATION AND DRYING USING FLY ASH
 SOIL STABILIZATION AND DRYING USING FLY ASH by H. A. Acosta, T. B. Edil, and C. H. Benson Geo Engineering Report No. 03-03 Geo Engineering Program University of Wisconsin-Madison Madison, Wisconsin 53706
VDOT Pavement Recycling Initiative. Andy Babish, P.E. State Materials Engineer
 Andy Babish, P.E. State Materials Engineer Pavement Recycling Initiative Background Goal and Key Components Going Forward 2 Initiative Background - 2008: 3 Full Depth Reclamation trial sections constructed
by Michael H. Fleming, ISMF LLC
 PennDOT LTAP technical INFORMATION SHEET #159 W i n t e r / 2 0 1 3 Full-Depth Reclamation A roadway rehabilitation technique using green technology by Michael H. Fleming, ISMF LLC While preparing your
FLY ASH AMENDED SOILS AS HIGHWAY BASE MATERIALS
 FLY ASH AMENDED SOILS AS HIGHWAY BASE MATERIALS ABSTRACT Ahmet H. Aydilek., Member, ASCE 1, Sunil Arora, Member, ASCE 2 Class F fly ash cannot be used alone in soil stabilization applications as it is
Roller Compacted Concrete for M30
 Roller Compacted Concrete for M30 Durga Prasad Student, Department of Civil Engineering, MVR College of Engineering. K.Prudhvi Assistant Professor, Department of Civil Engineering, MVR College of Engineering.