TAB E CLASS II AND AMBIENT AIR QUALITY STANDARDS DISPERSION MODELING REPORT - REVISED
|
|
|
- Merry Carr
- 5 years ago
- Views:
Transcription
1 TAB E CLASS II AND AMBIENT AIR QUALITY STANDARDS DISPERSION MODELING REPORT - REVISED
2 AIR DISPERSION MODELING REPORT CLASS II AND AMBIENT AIR QUALITY STANDARDS (AAQS) ANALYSIS CAROLINAS CEMENT COMPANY LLC CASTLE HAYNE PLANT Prepared for: Carolinas Cement Company LLC Castle Hayne, North Carolina Plant PN Prepared by: Environmental Quality Management, Inc. Cedar Terrace Office Park, Suite Durham-Chapel Hill Boulevard Durham, North Carolina February 25, 2008 (Revised December 19, 2008) (Revised February 25, 2011)
3 TABLE OF CONTENTS Section Page Figures... iv Tables... v Executive Summary... vi 1 Introduction and Analysis Overview Introduction Modeling Overview PSD Baseline and Increment Availability Site Description Source Identification and Characterization Kiln Stack Conditions Proposed CCC Sources Other Off-site Sources AAQS and Class II Air Quality Modeling Methodology Model Specification Model Selection Source Identification and Location Receptor Locations Meteorological Data Model Inputs Building Downwash Background Concentrations Reporting Results of the Class II and AAQS Ambient Impact Analysis Significant Impact Analysis Increment Consumption Analysis AAQS Analysis PM 10 Cause and Contribute Analysis NO 2 Cause and Contribute Analysis Toxic Air Pollutants Additional Impacts Analysis Soils and Vegetation Growth Impacts Visibility ii
4 TABLE OF CONTENTS (continued) Appendix Page A 20D Analysis/Off-site Source Inventory... A-1 B AERSURFACE Run Files... B-1 C 1-Hour NO 2 Tier III Modeling Protocol... C-1 D Structure Dimensions... D-1 E Significant Impact Areas... E-1 F 1-Hour NO 2 Cause and Contribute Output... F-1 G VISCREEN Printouts... G-1 H Detailed Soils and Vegetation Analysis (submitted separately)... H-1 iii
5 FIGURES Number Page 1 General Location of Carolinas Cement, Castle Hayne Plant Existing Aerial of Plant Layout Detailed Site Plan of Carolinas Cement Proposed Facility Structure Identification Overall Receptor Grid for Air Quality Modeling Analysis Near Field Receptor Grid Used for the Air Quality Modeling Analysis Layout of Selected Distances Considered in the VISCREEN Analysis iv
6 TABLES Number Page 1 Kiln Stack Condition Parameters Kiln Stack Determinative Analysis Results CCC Point Source Parameters CCC Fugitive Source Characteristics CCC Area Source Characteristics Off-site Sources Included in PM 10 Cumulative Modeling Off-site Sources Included in NO 2 Cumulative Modeling Options Selected in the Modeling Analysis Provided Background Concentrations Summary of Sulfur Dioxide Significant Impacts Summary of Carbon Monoxide Significant Impacts Summary of Nitrogen Dioxide Significant Impacts Summary of PM 10 Significant Impacts Summary of PM 2.5 Significant Impacts PM 10 PSD Increment Consumption - Summary PM 10 Cumulative AAQS Impact Analysis - Summary PM 10 Source Contribution to Potential Exceedance PM 2.5 AAQS Impact Analysis - Summary TSP AAQS Impact Analysis - Summary NO 2 Cumulative AAQS Impact Analysis - Summary Lead AAQS Impact Analysis - Summary NO 2 Cause and Contribute Example Output Toxic Air PollutantCompliance Demonstration v
7 EXECUTIVE SUMMARY This document provides the dispersion modeling analysis required as part of the Prevention of Significant Deterioration (PSD) submittal for the proposed Carolinas Cement Company LLC (CCC) plant located near Castle Hayne, North Carolina. CCC is proposing the construction of a new Portland cement manufacturing plant. This document includes an evaluation of the Class II area Significant Impact Levels (SIL) and associated Significant Impact Area (SIA), Class II area PSD increment consumption, impact on the State and National Ambient Air Quality Standards (AAQS) in the Class II area, and other additional impacts. Dispersion modeling was performed for pollutant emissions from the proposed new sources at CCC and compared to ambient air levels specified by all applicable regulatory requirements. The Class II analysis used the AMS/EPA Regulatory Model (AERMOD), along with all appropriate meteorological, receptor, and regulatory options. Both stack and fugitive emissions were included in the SIL, PSD, and AAQS analyses. Toxic air pollutant (TAP) emissions were also considered as were additional impacts analysis considering plant and soils impacts and growth in the area since August The SIA analysis exceeded the SILs only for PM 10, PM 2.5 and nitrogen dioxide (NO 2 ); thus additional modeling was performed for Class II area PSD increment and AAQS analyses for these pollutants. Pursuant to North Carolina s modeling guidance, an analysis of CCC emissions only to demonstrate compliance with the State s total suspended particulate (TSP) standard was also conducted. Building downwash was included in the modeling. Terrain in the area is flat to gently rolling and thus, not a significant concern. Nonetheless, elevations for all source, building, and receptor locations were included in the analysis. Other existing sources in the region out to a distance of 50 km were considered in terms of their combined impacts for the AAQS and PSD increment analysis. A 20D analysis was conducted on the inventory of PM 10 and nitrogen oxides (NO X ) sources obtained from the North Carolina Department of Environment and Natural Resources (DENR), with those not screening vi
8 out being included in the modeling. A full Class I impact analysis using the CALPUFF modeling methodology is presented in a separate document dated Dec 19, Based on this dispersion modeling analysis, the ambient air impacts of the project were estimated to be less than all applicable standards and guidelines issued by DENR and the U.S. Environmental Protection Agency (EPA) for the Class II area. All input, output, and intermediate files used in the modeling are provided to DENR in an electronic format. vii
9 SECTION 1 INTRODUCTION AND ANALYSIS OVERVIEW 1.1 Introduction CCC is submitting a revised air permit application to construct a modern 6000 ton per day (clinker) Portland cement manufacturing plant at the site of its existing cement terminal near Castle Hayne, North Carolina. A more detailed description of the project is presented in the Regulatory Analysis Report section (Tab A) of this application. Figure 1 provides a general location of the proposed plant location. The project emissions triggered requirements under the PSD rules at 15A NCAC 02D.0530 for the following pollutants: PM 10, PM 2.5, sulfur dioxide (SO 2 ), NO x, carbon monoxide (CO), and volatile organic compounds (VOC). The project emissions will also trigger requirements under 15A NCAC 2Q.0700 regarding toxic air pollutants (TAPs). This document provides the dispersion modeling analysis performed under the above regulatory programs. This included analysis of compliance with the State and National AAQS, Class II PSD Increments, and TAP ambient guideline concentrations. 1

10 Figure 1. General Location of Carolinas Cement, Castle Hayne Plant 2
11 1.2 Modeling Overview This section provides an overview of the dispersion modeling analysis that was followed to perform the Class II and AAQS air quality impact assessments in support of the permit application. This analysis addresses the methodologies and models that were used to assess the SIA for each criteria pollutant, the PSD increment consumption due to all PSD increment consuming sources for any pollutants that exceed the applicable SIL, the overall impacts on the AAQS (including other sources in the area, e.g., 20D sources) for any pollutants that exceed the applicable SIL, and additional air impacts. A summary of the dispersion modeling performed is as follows: Used AERMET to generate a five year meteorological data set for the AERMOD modeling. This process was performed by DENR as part of their available meteorological datasets. Used the American Meteorological Society/Environmental Protection Agency (AMS/EPA) Regulatory Model (AERMOD - Version used the BeeLine software called BEEST - Version 9.83) including terrain in the model using 1 arc second National Elevation Datasets (NED) as well as building downwash. Used the Building Profile Input Program for PRIME (BPIPPRM) model for all downwash calculations (latest version is included in the BEEST software). Performed AERMOD modeling to determine the SIA, for all proposed sources for each applicable criteria pollutant; for those pollutants where no significant impacts occur at or beyond the plant fence line, no further modeling analysis was required for that pollutant. For any SIL that was exceeded beyond the fence line, additional modeling was performed using AERMOD for PSD increment concentration impacts and AAQS analysis. This included other sources of that pollutant located within the SIA, other sources within approximately 50 km that have emissions greater than the 20D distance, and background concentrations supplied by DENR. Used the AERMOD Model and similar procedures to those used for the criteria pollutants to model TAPs as appropriate. Included all modeling elements as applicable and discussed with DENR at the preapplication meeting held July 25, 2007 and subsequent correspondence/meetings with DENR staff. Followed modeling guidance as listed below: o Revision to the Guideline on Air Quality Models, FR Volume 70, No. 216, 68218, November 9,
12 o North Carolina PSD Modeling Guidance from DENR (September 2010), o Guidelines for Evaluating the Air Quality Impacts of Toxic Pollutants in North Carolina from DENR (December 2009). o Quarry Guidance for Refined Modeling from DENR. o Guidance Concerning the Implementation of the 1-hour NO 2 NAAQS for the Prevention of Significant Deterioration Program, Memorandum from Stephen D. Page, US EPA, June 29, o Applicability of Appendix W Modeling Guidance for the 1-hour NO 2 National Ambient Air Quality Standard, Memorandum from Tyler Fox, US EPA, June 28, PSD Baseline and Increment Availability The baseline date in an area is defined as the date at the time of the first PSD permit application in the area. Baseline dates must be defined for each pollutant that consumes PSD increments. The area in question is that area designated as attainment or unclassifiable in the area surrounding the CCC plant in which the source would exceed the SIL. The baseline dates for this area were established previously for PM 10 (December 14, 1979) and for NO 2 (December 26, 1991). All applicable nearby sources as supplied by DENR were included in the cumulative PSD increment consumption analysis for the area around the CCC facility. Because existing monitoring is located in the nearby area and counties, it was requested that preconstruction monitoring not be required at the discretionary authority exercised by DENR. All background air concentrations were provided by monitors in the DENR monitoring network. 4
13 SECTION 2 SITE DESCRIPTION Figure 2 presents an aerial view of the site including existing roads and plant buildings. The buildings currently located on this site were from the previously active Ideal Cement facility. CCC currently utilizes some of the silos on site for storage and truck/rail loadout operations as part of their permitted cement terminal operations. The proposed facility will be newly constructed equipment and structures. The existing structures may be reused where feasible. Figure 3 provides a detailed site plan of the proposed facility. Figure 4 provides a view of the structures to be located on the facility property and their identification as used within the modeling demonstration. The geographical setting around the plant is flat to gently rolling with very few significant elevated terrain features. The Northeast Cape Fear River borders the site to the north. It joins the Cape Fear River southwest of the site and flows toward Wilmington to the south. The river valley does not create much of a terrain change from the surrounding topography. Most terrain within 10 kilometers of the site is at elevations similar to the plant. The area is characterized by small farms, small businesses, pine forests, and sparsely populated rural residential areas. The town of Castle Hayne lies less than three miles to the southwest and has a population of less than

14 Figure 2. Existing Aerial of Plant Layout 6
15 Figure 3. Detailed Site Plan of Carolinas Cement Proposed Facility 7
16 Figure 4. Structure Identification 8
17 SECTION 3 SOURCE IDENTIFICATION AND CHARACTERIZATION All proposed sources are described in detail in the application for the PSD Permit. New sources will consist of a full cement production operation including a quarry, raw material blending operations, a preheater/precalciner kiln with in-line raw mill, clinker cooler, clinker handling and storage, finish mill, and cement storage and loadout operations. Emission increases will occur due to the construction of the new cement manufacturing operations. These increases were considered in the SIA and PSD increment analyses. In addition to all CCC sources being considered in the AAQS analysis, all off site sources within the applicable SIA for each applicable pollutant, and those sources within 50 km outside the SIA of the facility using the 20D analysis were also included. In the 20D analysis individual source allowable or potential emissions in tons per year were compared to 20 times the distance between each facility and CCC. In this fashion, small and/or distant sources with insignificant air impacts were not considered further and larger sources were included in all PSD increment and AAQS analyses as appropriate. Further discussion of the off-site sources and the 20D analysis will be presented later in this report. Each source at CCC (whether characterized as a point, area, or volume) was assigned a unique alphanumeric name in the modeling generally related to the source identification in the CCC PSD application or some descriptive name. Specific inputs in terms of location, source characteristics, source types, pollutants, emission rates, etc., were fully characterized as per the proposed facility design. Roadway, storage pile, loadout, material transfer, and similar fugitive sources were also characterized over the entire facility. Off-site source information, obtained from DENR files, was also considered as part of this analysis. Each off-site source included as part of PSD and AAQS analysis, following the 20D screening was also uniquely identified. 9
18 3.1 Kiln Stack Conditions There are two different kiln operating conditions that determine the exhaust flow conditions at the main stack. Normally the preheater/precalciner kiln and raw mill are operated together with kiln gasses passing through the in-line raw mill (contacting and heating the raw material as it is ground) before exiting the baghouse, scrubber, and main stack. The kiln system is operated with the mill on condition approximately 80 percent of the time. When the raw mill is not operating ( mill off condition, approximately 20 percent of the time), kiln system exhaust gasses bypass the raw mill and are directed through the baghouse, scrubber, and main stack. This is a short-term condition that normally occurs only a few hours at a time because the raw mill must operate to produce kiln feed (once the feed is depleted from storage, the kiln must shut down). The stack gas exhaust temperature is slightly higher during this condition because heat is not being transferred to the raw material. The effect of the scrubber is to reduce exhaust gas temperatures during both operating conditions. The actual stack exhaust flow rate is slightly lower during the mill off condition. Stack emission rates for most pollutants are not affected by the two different kiln operating conditions. However, higher SO 2 emissions generally occur with the mill off condition because SO 2 is absorbed in the raw mill, only when it is operating. Although variations in SO 2 emission rates are expected, these effects are minimized by operation of the wet scrubber to reduce SO 2. As a result of the varied conditions for the kiln stack, it was necessary to determine which condition would yield a most conservative modeling analysis for the different averaging periods required. In an effort to make this determination two AERMOD modeling runs were run for each of the main kiln stack conditions (mill on conditions and mill off conditions). Table 1 shows the two conditions analyzed for the kiln stack. This analysis was made for both long-term and short-term averaging conditions, considered building downwash effects, and included the full receptor grid as established for the remaining modeling demonstrations. Table 2 summarizes the results of this main kiln stack analysis using a unity (1 lb/hr) emission rate for determining the most conservative conditions for modeling purposes. 10
19 Source Identification in Model Source Description TABLE 1. KILN STACK CONDITION PARAMETERS Coordinate Location (UTM NAD 27, Zone 18) Easting (m) Northing (m) Base Elevation (m) Stack Height (m) Stack Gas Temperature (K) Stack Gas Exit Velocity (m/s) E44 Main Stack Mill On E44 Main Stack Mill Off Stack Diameter (m) TABLE 2. KILN STACK DETERMINATIVE ANALYSIS RESULTS Highest Modeled Concentration (μg/m 3 ) a Kiln Stack Condition Modeled Averaging Period 1-hour 3-hour 8-hour 24-hour Annual Mill On Condition Mill Off Condition a Using a 1 lb/hr emission rate. 11
20 As illustrated in Table 2 the most conservative approach is to model using the maximum emission rates for all applicable pollutants and the mill off stack exhaust conditions as the worstcase operating scenario. 3.2 Proposed CCC Sources Table 3 presents a complete set of stack, baghouse, and other point sources and their related identifiers along with all associated stack parameters, and coordinates for all proposed stacks. Tables 4 and 5 present the source characteristics for the fugitive emission sources that will be included in the proposed project. These sources include roadways, storage piles, conveyors, crushers, and other material transfer operations (process-related fugitive sources). Emission estimates for the CCC facility are presented in Tab C of this permit application. These emissions represent the potential short-term and long-term scenarios of operation and thus, will give representative potential air impacts for both the short-term and annual air quality analyses. All coordinates for the sources (as well as all coordinates for other sources, fence lines, and receptors around the plant) are referenced to the Universal Transverse Mercator (UTM) NAD27 format (Zone 18). It should be noted that emission rates of PM and PM 10 have been further reduced from miscellaneous baghouses at CCC (excluding the kiln, clinker cooler, and coal mill systems). The modeling results in this report for PM, PM 10 and PM 2.5 are based on emissions from the miscellaneous baghouses at grain loadings of 0.01 / / gr/dscf for PM / PM 10 / PM 2.5, respectively. Tab C, as revised of February 18, 2011, estimates emissions from these sources at grain loadings of / / gr/dscf for PM / PM 10 / PM 2.5, respectively. As demonstrated in Section 5 of this report, all air quality constraints for the various PM fractions were met at the higher emission rates and thus it is not necessary to re-model PM at the lower emission rates. 12
21 Source Identification in Model Source Description TABLE 3. CCC POINT SOURCE PARAMETERS Coordinate Location (UTM NAD 27, Zone 18) Easting Northing (m) (m) Base Elevation (m) Stack Height (ft) Stack Gas Temperature ( o F) Stack Gas Exit Velocity (ft/s) E5 Raw mill feed bin E6 Raw mill feed transport E7 Raw mill feed E8 Raw mill reject E9 Kiln dust bin E10 Raw meal transport to silo E11 Raw meal silo E12 Raw meal silo extraction E13 Kiln feed E44 Main Stack E1 Coal rail unloading E2 Coal unloading by truck E3 Coal transport to storage E4 Coal transport from storage E14 Coal mill feed bin E15 Coal mill feed bin E16 Coal mill feed transport Stack Diameter (ft) 13
22 Source Identification in Model Source Description Coordinate Location (UTM NAD 27, Zone 18) Easting Northing (m) (m) Base Elevation (m) Stack Height (ft) Stack Gas Temperature ( o F) Stack Gas Exit Velocity (ft/s) E17 Fine coal bin E18 Fine coal bin E19 Clinker discharge from cooler E20 Clinker dome E21 Off-spec bin E22 Cement mill feed bin E23 Cement mill feed bin E46 Cement additive bin E47 Cement additive intake E24 Cement mill feed E25 Cement mill recirculation bin E26 Cement mill reject E27 Cement transport E28 Cement mill feed E29 Cement mill recirculation bin E30 Cement mill reject E31 Cement transport Stack Diameter (ft) 14
23 Source Identification in Model Source Description Coordinate Location (UTM NAD 27, Zone 18) Easting Northing (m) (m) Base Elevation (m) Stack Height (ft) Stack Gas Temperature ( o F) Stack Gas Exit Velocity (ft/s) E45 Cement mill stack E32 Cement dome E33 Cement dome extraction rail E34 Cement dome extraction truck E40 Cement silo E41 Cement silo extration E42 Cement transport E43 Packing plant ES-4 Cement silo ES-R33 Screw conv/truck loadout Stack Diameter (ft) 15
24 Source Identification Model Source Description TABLE 4. CCC FUGITIVE SOURCE CHARACTERISTICS Coordinate Location (UTM NAD 27, Zone 18) Easting (m) Northing (m) Base Elevation (m) Release Height (ft) Initial Horizontal Dispersion Coefficient (ft) Initial Vertical Dispersion Coefficient (ft) FQ1 Marl Quarry Primary Crusher FQ2 Mining Conveyor 1 Transfer FQ3 Spoils Primary Crusher FQ4 Spoils Conveyor 3 Transfer FQ5 Radial Stacker Transfer FQ6 Stacker to Pile FQ7 Spoils Conveyor 1 Transfer FQ8 Secondary Crusher F1 Additive Hopper and Conveyor F2 Enclosed Hopper w/dust Suppression F3PB1 Marl Building Emissions F4 Belt Conveyor Transfer F5 Belt Conveyor Transfer F6 Belt Conveyor Transfer F7 Belt Conveyor Transfer F7A Conveyor to Silo F7B Silo to Enclosed Belt F7C Conveyor to Silo
25 Source Identification Model Source Description Coordinate Location (UTM NAD 27, Zone 18) Easting (m) Northing (m) Base Elevation (m) Release Height (ft) Initial Horizontal Dispersion Coefficient (ft) Initial Vertical Dispersion Coefficient (ft) F7D Silo to Enclosed Belt F8 Gypsum-Limestone building transfers M1b LS/Marl Loading M2 Spoils/Other Loading M3 Overburden Loading M4 Overburden Unloading PR1_1 South entrance PR1_2 South entrance PR1_3 South entrance PR1_4 South entrance PR1_5 South entrance PR1_6 South entrance PR1_7 South entrance PR1_8 South entrance PR1_9 South entrance PR1_10 South entrance PR1_11 South entrance PR1_12 South entrance PR1_13 South entrance
26 Source Identification Model Source Description Coordinate Location (UTM NAD 27, Zone 18) Easting (m) Northing (m) Base Elevation (m) Release Height (ft) Initial Horizontal Dispersion Coefficient (ft) Initial Vertical Dispersion Coefficient (ft) PR1_14 South entrance PR1_15 South entrance PR1_16 South entrance PR1_17 South entrance PR1_18 South entrance PR2_1 Additives truck route PR2_2 Additives truck route PR2_3 Additives truck route PR2_4 Additives truck route PR2_5 Additives truck route PR2_6 Additives truck route PR2_7 Additives truck route PR2_8 Additives truck route PR2_9 Additives truck route PR2_10 Additives truck route PR2_11 Additives truck route PR2_12 Additives truck route PR2_13 Additives truck route PR2_14 Additives truck route
27 Source Identification Model Source Description Coordinate Location (UTM NAD 27, Zone 18) Easting (m) Northing (m) Base Elevation (m) Release Height (ft) Initial Horizontal Dispersion Coefficient (ft) Initial Vertical Dispersion Coefficient (ft) PR2_15 Additives truck route PR2_16 Additives truck route PR2_17 Additives truck route PR2_18 Additives truck route PR2_19 Additives truck route PR2_20 Additives truck route PR2_21 Additives truck route PR2_22 Additives truck route PR2_23 Additives truck route PR2_24 Additives truck route PR2_25 Additives truck route PR2_26 Additives truck route PR2_27 Additives truck route PR2_28 Additives truck route PR2_29 Additives truck route PR2_30 Additives truck route PR2_31 Additives truck route PR2_32 Additives truck route PR2_33 Additives truck route
28 Source Identification Model Source Description Coordinate Location (UTM NAD 27, Zone 18) Easting (m) Northing (m) Base Elevation (m) Release Height (ft) Initial Horizontal Dispersion Coefficient (ft) Initial Vertical Dispersion Coefficient (ft) PR2_34 Additives truck route PR2_35 Additives truck route PR2_36 Additives truck route PR2_37 Additives truck route PR2_38 Additives truck route PR2_39 Additives truck route PR2_40 Additives truck route PR2_41 Additives truck route PR2_42 Additives truck route PR2_43 Additives truck route PR2_44 Additives truck route PR2_45 Additives truck route PR2_46 Additives truck route PR2_47 Additives truck route PR2_48 Additives truck route PR2_49 Additives truck route PR2_50 Additives truck route PR2_51 Additives truck route PR2_52 Additives truck route
29 Source Identification Model Source Description Coordinate Location (UTM NAD 27, Zone 18) Easting (m) Northing (m) Base Elevation (m) Release Height (ft) Initial Horizontal Dispersion Coefficient (ft) Initial Vertical Dispersion Coefficient (ft) PR2_53 Additives truck route PR2_54 Additives truck route PR2_55 Additives truck route PR2_56 Additives truck route PR2_57 Additives truck route PR2_58 Additives truck route PR2_59 Additives truck route PR2_60 Additives truck route PR2_61 Additives truck route PR3_1 Entrance connector PR3_2 Entrance connector PR3_3 Entrance connector PR4_1 Gyp truck route PR4_2 Gyp truck route PR4_3 Gyp truck route PR4_4 Gyp truck route PR4_5 Gyp truck route PR4_6 Gyp truck route PR4_7 Gyp truck route
30 Source Identification Model Source Description Coordinate Location (UTM NAD 27, Zone 18) Easting (m) Northing (m) Base Elevation (m) Release Height (ft) Initial Horizontal Dispersion Coefficient (ft) Initial Vertical Dispersion Coefficient (ft) PR4_8 Gyp truck route PR4_9 Gyp truck route PR4_10 Gyp truck route PR4_11 Gyp truck route PR4_12 Gyp truck route PR4_13 Gyp truck route PR4_14 Gyp truck route PR4_15 Gyp truck route PR4_16 Gyp truck route PR4_17 Gyp truck route PR5_1 Internal connector PR5_2 Internal connector PR5_3 Internal connector PR5_4 Internal connector PR5_5 Internal connector PR5_6 Internal connector PR5_7 Internal connector PR5_8 Internal connector PR6_1 Exit connector
31 Source Identification Model Source Description Coordinate Location (UTM NAD 27, Zone 18) Easting (m) Northing (m) Base Elevation (m) Release Height (ft) Initial Horizontal Dispersion Coefficient (ft) Initial Vertical Dispersion Coefficient (ft) PR6_2 Exit connector PR7_1 Cement silo entrance PR7_2 Cement silo entrance PR8_1 Cement silo exit PR8_2 Cement silo exit PR9_1 South exit PR9_2 South exit PR9_3 South exit PR9_4 South exit PR9_5 South exit PR9_6 South exit PR9_7 South exit PR9_8 South exit PR9_9 South exit PR9_10 South exit PR9_11 South exit PR9_12 South exit PR9_13 South exit PR9_14 South exit
32 Source Identification Model Source Description Coordinate Location (UTM NAD 27, Zone 18) Easting (m) Northing (m) Base Elevation (m) Release Height (ft) Initial Horizontal Dispersion Coefficient (ft) Initial Vertical Dispersion Coefficient (ft) PR10_1 Employee parking PR10_2 Employee parking PR10_3 Employee parking PR10_4 Employee parking PR10_5 Employee parking PR10_6 Employee parking PR10_7 Employee parking PR11_1 Packing entrance PR11_2 Packing entrance PR11_3 Packing entrance PR11_4 Packing entrance PR11_5 Packing entrance PR11_6 Packing entrance PR11_7 Packing entrance PR11_8 Packing entrance PR11_9 Packing entrance PR11_10 Packing entrance PR11_11 Packing entrance PR11_12 Packing entrance
33 Source Identification Model Source Description Coordinate Location (UTM NAD 27, Zone 18) Easting (m) Northing (m) Base Elevation (m) Release Height (ft) Initial Horizontal Dispersion Coefficient (ft) Initial Vertical Dispersion Coefficient (ft) PR12_1 Packing exit PR12_2 Packing exit PR12_3 Packing exit PR12_4 Packing exit PR12_5 Packing exit PR12_6 Packing exit PR12_7 Packing exit PR12_8 Packing exit PR12_9 Packing exit PR12_10 Packing exit PR12_11 Packing exit PR12_12 Packing exit UR1_1 Limestone/Marl haul UR1_2 Limestone/Marl haul UR1_3 Limestone/Marl haul UR1_4 Limestone/Marl haul UR1_5 Limestone/Marl haul UR1_6 Limestone/Marl haul UR1_7 Limestone/Marl haul
34 Source Identification Model Source Description Coordinate Location (UTM NAD 27, Zone 18) Easting (m) Northing (m) Base Elevation (m) Release Height (ft) Initial Horizontal Dispersion Coefficient (ft) Initial Vertical Dispersion Coefficient (ft) UR1_8 Limestone/Marl haul UR1_9 Limestone/Marl haul UR1_10 Limestone/Marl haul UR1_11 Limestone/Marl haul UR1_12 Limestone/Marl haul UR1_13 Limestone/Marl haul UR1_14 Limestone/Marl haul UR1_15 Limestone/Marl haul UR1_16 Limestone/Marl haul UR1_17 Limestone/Marl haul UR1_18 Limestone/Marl haul UR1_19 Limestone/Marl haul UR1_20 Limestone/Marl haul UR1_21 Limestone/Marl haul UR1_22 Limestone/Marl haul UR1_23 Limestone/Marl haul UR1_24 Limestone/Marl haul UR1_25 Limestone/Marl haul UR1_26 Limestone/Marl haul
35 Source Identification Model Source Description Coordinate Location (UTM NAD 27, Zone 18) Easting (m) Northing (m) Base Elevation (m) Release Height (ft) Initial Horizontal Dispersion Coefficient (ft) Initial Vertical Dispersion Coefficient (ft) UR1_27 Limestone/Marl haul UR1_28 Limestone/Marl haul UR1_29 Limestone/Marl haul UR1_30 Limestone/Marl haul UR1_31 Limestone/Marl haul UR1_32 Limestone/Marl haul UR1_33 Limestone/Marl haul UR1_34 Limestone/Marl haul UR1_35 Limestone/Marl haul UR1_36 Limestone/Marl haul UR2_1 Spoils/Other haul UR2_2 Spoils/Other haul UR2_3 Spoils/Other haul UR2_4 Spoils/Other haul UR2_5 Spoils/Other haul UR2_6 Spoils/Other haul UR2_7 Spoils/Other haul UR2_8 Spoils/Other haul UR2_9 Spoils/Other haul
36 Source Identification Model Source Description Coordinate Location (UTM NAD 27, Zone 18) Easting (m) Northing (m) Base Elevation (m) Release Height (ft) Initial Horizontal Dispersion Coefficient (ft) Initial Vertical Dispersion Coefficient (ft) UR2_10 Spoils/Other haul UR2_11 Spoils/Other haul UR2_12 Spoils/Other haul UR2_13 Spoils/Other haul UR2_14 Spoils/Other haul UR2_15 Spoils/Other haul UR2_16 Spoils/Other haul UR2_17 Spoils/Other haul UR2_18 Spoils/Other haul UR2_19 Spoils/Other haul UR2_20 Spoils/Other haul UR2_21 Spoils/Other haul UR2_22 Spoils/Other haul UR2_23 Spoils/Other haul UR2_24 Spoils/Other haul UR2_25 Spoils/Other haul UR2_26 Spoils/Other haul UR2_27 Spoils/Other haul UR2_28 Spoils/Other haul
37 Source Identification Model Source Description Coordinate Location (UTM NAD 27, Zone 18) Easting (m) Northing (m) Base Elevation (m) Release Height (ft) Initial Horizontal Dispersion Coefficient (ft) Initial Vertical Dispersion Coefficient (ft) UR2_29 Spoils/Other haul UR2_30 Spoils/Other haul UR2_31 Spoils/Other haul UR2_32 Spoils/Other haul UR2_33 Spoils/Other haul UR2_34 Spoils/Other haul UR2_35 Spoils/Other haul UR2_36 Spoils/Other haul UR2_37 Spoils/Other haul UR2_38 Spoils/Other haul UR2_39 Spoils/Other haul UR2_40 Spoils/Other haul UR2_41 Spoils/Other haul UR2_42 Spoils/Other haul UR2_43 Spoils/Other haul UR2_44 Spoils/Other haul UR2_45 Spoils/Other haul UR2_46 Spoils/Other haul UR2_47 Spoils/Other haul
38 Source Identification Model Source Description Coordinate Location (UTM NAD 27, Zone 18) Easting (m) Northing (m) Base Elevation (m) Release Height (ft) Initial Horizontal Dispersion Coefficient (ft) Initial Vertical Dispersion Coefficient (ft) UR2_48 Spoils/Other haul UR2_49 Spoils/Other haul UR2_50 Spoils/Other haul UR2_51 Spoils/Other haul UR2_52 Spoils/Other haul UR2_53 Spoils/Other haul UR2_54 Spoils/Other haul UR2_55 Spoils/Other haul UR2_56 Spoils/Other haul UR2_57 Spoils/Other haul UR2_58 Spoils/Other haul UR2_59 Spoils/Other haul UR2_60 Spoils/Other haul UR2_61 Spoils/Other haul UR2_62 Spoils/Other haul UR2_63 Spoils/Other haul UR2_64 Spoils/Other haul UR2_65 Spoils/Other haul UR2_66 Spoils/Other haul
39 Source Identification Model Source Description Coordinate Location (UTM NAD 27, Zone 18) Easting (m) Northing (m) Base Elevation (m) Release Height (ft) Initial Horizontal Dispersion Coefficient (ft) Initial Vertical Dispersion Coefficient (ft) UR2_67 Spoils/Other haul UR2_68 Spoils/Other haul UR2_69 Spoils/Other haul UR2_70 Spoils/Other haul UR2_71 Spoils/Other haul UR2_72 Spoils/Other haul UR2_73 Spoils/Other haul UR2_74 Spoils/Other haul UR2_75 Spoils/Other haul UR2_76 Spoils/Other haul UR2_77 Spoils/Other haul UR2_78 Spoils/Other haul UR2_79 Spoils/Other haul UR2_80 Spoils/Other haul UR2_81 Spoils/Other haul UR2_82 Spoils/Other haul UR2_83 Spoils/Other haul UR2_84 Spoils/Other haul UR2_85 Spoils/Other haul
40 Source Identification Model Source Description Coordinate Location (UTM NAD 27, Zone 18) Easting (m) Northing (m) Base Elevation (m) Release Height (ft) Initial Horizontal Dispersion Coefficient (ft) Initial Vertical Dispersion Coefficient (ft) UR2_86 Spoils/Other haul UR2_87 Spoils/Other haul UR2_88 Spoils/Other haul UR2_89 Spoils/Other haul UR2_90 Spoils/Other haul UR2_91 Spoils/Other haul UR3_1 Overburden loop UR3_2 Overburden loop UR3_3 Overburden loop UR3_4 Overburden loop UR3_5 Overburden loop UR3_6 Overburden loop UR3_7 Overburden loop UR3_8 Overburden loop UR3_9 Overburden loop UR3_10 Overburden loop UR3_11 Overburden loop UR3_12 Overburden loop UR3_13 Overburden loop
41 Source Identification Model Source Description Coordinate Location (UTM NAD 27, Zone 18) Easting (m) Northing (m) Base Elevation (m) Release Height (ft) Initial Horizontal Dispersion Coefficient (ft) Initial Vertical Dispersion Coefficient (ft) UR3_14 Overburden loop UR3_15 Overburden loop UR3_16 Overburden loop UR3_17 Overburden loop UR3_18 Overburden loop UR3_19 Overburden loop UR3_20 Overburden loop UR3_21 Overburden loop UR3_22 Overburden loop UR3_23 Overburden loop UR3_24 Overburden loop UR3_25 Overburden loop UR3_26 Overburden loop UR3_27 Overburden loop UR3_28 Overburden loop UR3_29 Overburden loop UR3_30 Overburden loop UR3_31 Overburden loop UR3_32 Overburden loop
42 Source Identification Model Source Description Coordinate Location (UTM NAD 27, Zone 18) Easting (m) Northing (m) Base Elevation (m) Release Height (ft) Initial Horizontal Dispersion Coefficient (ft) Initial Vertical Dispersion Coefficient (ft) UR3_33 Overburden loop UR3_34 Overburden loop UR3_35 Overburden loop UR3_36 Overburden loop UR3_37 Overburden loop UR3_38 Overburden loop UR3_39 Overburden loop UR3_40 Overburden loop UR3_41 Overburden loop UR3_42 Overburden loop UR3_43 Overburden loop UR3_44 Overburden loop UR3_45 Overburden loop UR3_46 Overburden loop UR3_47 Overburden loop UR3_48 Overburden loop UR3_49 Overburden loop UR3_50 Overburden loop UR3_51 Overburden loop
43 Source Identification Model Source Description Coordinate Location (UTM NAD 27, Zone 18) Easting (m) Northing (m) Base Elevation (m) Release Height (ft) Initial Horizontal Dispersion Coefficient (ft) Initial Vertical Dispersion Coefficient (ft) UR3_52 Overburden loop UR3_53 Overburden loop UR3_54 Overburden loop UR3_55 Overburden loop UR3_56 Overburden loop UR3_57 Overburden loop UR3_58 Overburden loop UR3_59 Overburden loop
44 TABLE 5. CCC AREA SOURCE CHARACTERISTICS Road Segment Identification Road Segment Description Southwest Corner - East (m) Southwest Corner - North (m) Base Elevation (m) Release Height (ft) East Length (ft) North Length (ft) Angle of Road Segment from North Vertical Dispersion Coefficient (ft) PQ1 Limestone/Marl (Crusher Feed) PQ2 Spoils/other (Crusher Feed) PQ3 Spoils (Stacker Pile) PQ4 Overburden (Active Pile) PB2PB3 Gypsum/Limestone Additive Piles M1A Mining (Drilling and Blasting)
45 3.3 Other Off-site Sources As shown in Section 5, the SILs were exceeded for PM 10, PM 2.5 and NO 2 (1-hr averaging period only), thus requiring a cumulative impact analysis for these pollutants. SILs were not exceeded for SO 2 and CO emissions. In order to meet the PSD modeling criteria for including the impacts of other sources within and outside of the SIA, several inventories of facilities and sources were obtained from DENR or created from DENR files within an approximately 50 km radius of the CCC facility. The AAQS inventory was developed based upon the SIL analysis submitted and included potential emissions of PM 10 and NO x for inclusion in the AAQS analysis. The interim SIL for PM 2.5 established by DENR were also exceeded; however, per DENR guidance no offsite sources were required for the PM 2.5 demonstration. The emissions for increment consuming sources, other than the potential emissions of CCC sources, were provided by DENR. Coordinates for each source were compared to the outer boundary of each applicable SIA for each pollutant. Those sources that fell within the specified SIA were included within the cumulative impact analysis. For those sources located outside the established SIA, the DENR prescribed 20D screening analysis was used to determine which additional sources to include. The 20D screening analysis was conducted as follows: The distance between each off-site source and the applicable CCC SIA was calculated (in kilometers) and multiplied by 20 (the so-called 20D). For short-term analysis, distance D was defined as the distance from the source in the screening area to the PSD source defining the impact area (i.e., CCC). For long-term analysis, distance D was defined as the distance from the source in the screening area to the closest edge of the SIA. Each source along with its calculated 20D distance was compared to the annual tonnage of applicable pollutant. Those sources with annual potential emissions greater than 20D were retained and considered in both the PSD increment and the full AAQS analysis. Tables 6 and 7 lists the off-site sources that were included as part of the PSD increment and AAQS analysis. The off-site sources remaining after the 20D analysis which were considered in the modeling are presented in Appendix A along with their source characteristics 37
46 TABLE 6. OFF-SITE SOURCES INCLUDED IN PM 10 CUMULATIVE MODELING Source Identification NAAQS PSD Oldecastle - Adams Products Co. Barnhill Contracting Co. CEMEX, Inc. X X X Corning Inc. X X CP&L Progress Energy - Sutton Plant X X DAK Americas LLC Del Laboratories, Inc. Elementis Chromium X X X General Electric Company X X International Paper - Riegelwood Mill Invista, S.a.r.l. Martin Marietta Materials - Rocky Point Ready Mixed Concrete Co - Scotts Hill Ready Mixed Concrete Co - Wilmington S & W Ready Mix Concrete X X X X X X 38
47 TABLE 7. OFF-SITE SOURCES INCLUDED IN NO 2 CUMULATIVE MODELING 1 Source Identification NAAQS American Distillation, Inc. Barnhill Contracting Company CP&L Progress Energy - Sutton Plant Caro Corning Incorporated DAK Americas LLC Elementis Chromium EPCOR USA North Carolina LLC - Southport Plant Fortron Industries LLC Global Nuclear Fuel - Americas, LLC International Paper - Riegelwood Mill Invista, S.a.r.l. Kinder Morgan, Wilmington New Hanover County WASTEC Southern States Chemical Wilbara, LLC X X X X X X X X X X X X X X X 1 The NO 2 SIL was only triggered for the 1-hour averaging period, for which there is no established PSD increment. 39
48 and emissions. Appendix A also identifies which sources were used in the PSD increment analysis and which were included in the AAQS analysis. Detailed source information was necessary to compile the 20D screening analysis and determine all off-site sources to include in the cumulative NAAQS and PSD Increment modeling runs. The off-site source inventory obtained from DENR files included source-specific stack parameters for each facility included within the inventory. As a most conservative approach it was agreed upon with Mr. Chuck Buckler with DENR that those sources within the SIA for each pollutant be treated as specific individual sources at each facility and those facilities outside the SIA be characterized using the facility wide emissions and the most representative stack that would provide a conservative result. The subsequent subsections discuss each source that was included within the cumulative analysis Oldecastle - Adams Products Company Castle Hayne This facility is being included as a PM 10 NAAQS source that is located 2.7 km from the CCC facility. This facility is within the designated SIA for PM 10 and as per the agreed upon methodology, all sources at this facility were included American Distillation Company, Inc. This facility is being included as a NO 2 NAAQS source that is located in Brunswick County 19 km from the CCC facility. This facility is outside the designated SIA for NO 2 and includes a single boiler stack Barnhill Contracting Company This facility is being included as a PM 10 and NO 2 NAAQS source that is located 6.0 km from the CCC facility. This facility is inside the designated SIA for PM 10 and NO 2. This facility was characterized within the DENR emission inventory as a single source described as a baghouse stack on a 425 tph asphalt plant CEMEX, Inc. CEMEX operates one cement terminal facility within close proximity to CCC. The 40
49 facility is being included as a PM 10 NAAQS source located at 0.5 km from the CCC facility (as measured using facility coordinates of the main stacks). This facility is within the designated SIA for PM 10 and as per the agreed upon methodology, all sources at this facility were included Corning Inc. This facility is being included as a PM 10 and NO 2 NAAQS source and a PSD Increment consuming source for PM 10. This facility is located in Wilmington 14.0 km from the CCC facility. This facility is outside the designated SIA for PM 10 and inside the designated SIA for NO 2. A representative emission point was used to model all facility wide PM 10 emissions. To accomplish this, the source designated as Stack 3 was selected because it was the tallest and most buoyant stack and thus would yield the most conservative impacts on PM 10 concentrations at this distance from the CCC facility. All sources emitting NO x were modeled as individual stacks since the facility is inside the SIA for NO CP&L dba Progress Energy Carolinas Sutton Plant This facility is being included as a PM 10 and NO 2 NAAQS source and a PSD Increment consuming source for PM 10. This facility is located 16.5 km from the CCC facility. This facility is outside the designated SIA for PM 10 and inside the designated SIA for NO 2. A representative emission point was used to model all facility wide PM 10 emissions. To accomplish this, the source designated as Unit 3 was selected because it was the tallest and most buoyant stack and thus would yield the most PM 10 conservative impacts on concentrations at this distance from the CCC facility. All sources emitting NO x were modeled as individual stacks since the facility is inside the SIA for NO DAK Americas LLC This facility is being included as a PM 10 and NO 2 NAAQS source that is located in Brunswick County 19.0 km from the CCC facility. This facility is outside the designated SIA for both pollutants. As per the agreed upon methodology, a representative emission point was used to model all facility wide emissions. To accomplish this, the source designated as ES-01 was selected because it was the tallest and most buoyant stack and thus would yield the most 41
50 conservative impacts on concentrations at this distance from the CCC facility Del Laboratories, Inc. This facility is being included as a PM 10 NAAQS source that is located in Pender County 7.1 km from the CCC facility. This facility is outside the designated SIA for PM 10. Detailed information about this facility was available, therefore all sources at this facility were included Elementis Chromium This facility is being included as a PM 10 and NO 2 NAAQS source that is located 1.7 km from the CCC facility (as measured using facility coordinates of the main stacks). This facility is within the designated SIA for PM 10 and NO 2 and as per the agreed upon methodology, all sources at this facility were included. Records review was conducted from DENR files on this facility and several permit applications were obtained for reference. As a result of this file review, it was determined that only two sources at this facility were NO 2 sources. The two sources that were determined to be gaseous sources were designated as EP101 and EP127 in the DENR inventory. Allowable/potential emissions were determined from information in the permit EPCOR USA North Carolina LLC Southport Plant This facility is being included as a NO 2 NAAQS source that is located in Brunswick County 50 km from the CCC facility. This facility is outside the designated SIA for NO 2 and as per the agreed upon methodology, a representative emission point was used to model all facility wide emissions. To accomplish this, the source designated as Unit 1 stack was selected because it is one of the two tallest and most buoyant stacks and thus would yield the most conservative impacts on concentrations at this distance from the CCC facility Fortron Industries, LLC This facility is being included as a NO 2 NAAQS source that is located in Wilmington, 15 km from the CCC facility. This facility is inside the designated SIA for NO 2,and individual emission points were used to model all facility wide emissions. 42
51 General Electric Company This facility is being included as a PM 10 NAAQS source and a PSD Increment consuming source for PM 10. This facility is located 9 km from the CCC facility. This facility is outside the designated SIA for PM 10 and as per the agreed upon methodology, a representative emission point was used to model all facility wide potential emissions. To accomplish this, the source designated as AE2 was selected as the tallest and most buoyant stack and thus would yield the most conservative impacts on concentrations at this distance from the CCC facility Global Nuclear Fuel Americas LLC This facility is being included as a NO 2 NAAQS source that is located in New Hanover County 9 km from the CCC facility. This facility is inside the designated SIA for NO 2, and individual emission points were used to model all facility wide emissions International Paper Riegelwood Mill This facility is being included as a PM 10 and NO 2 NAAQS source that is located in Columbus County 34 km from the CCC facility. This facility is outside the designated SIA for both pollutants. As per the agreed upon methodology, a representative emission point was used to model all facility wide emissions. To accomplish this, the source designated as RB5 was selected because it was the tallest and most buoyant stack and thus would yield the most conservative impacts on concentrations at this distance from the CCC facility Invista, S.a.r.l. This facility is being included as a PM 10 and NO 2 NAAQS located 15 km from the CCC facility. The facility is located outside the designated SIA for PM 10 and inside the designated SIA for NO 2. A representative emission point was used to model all facility wide allowable PM 10 emissions. To accomplish this, the source designated as HTR5 (Heater 5) was selected, as this was the tallest and most buoyant stack and thus would yield the most conservative impacts on PM 10 concentrations at this distance from the CCC facility. All sources emitting NO x were modeled as individual stacks since the facility is inside the SIA for NO 2. 43
52 Kinder Morgan - Wilmington This facility is being included as a NO 2 NAAQS source that is located in Wilmington, 16 km from the CCC facility. This facility is inside the designated SIA for NO 2,and individual emission points were used to model all facility wide emissions Martin Marietta Materials Rocky Point This facility is being included as a PM 10 NAAQS source that is located in Pender County 6 km from the CCC facility. This facility is within the designated SIA for PM 10 and as per the agreed upon methodology, all sources at this facility were included New Hanover County WASTEC This facility is being included as an NO 2 NAAQS source. This facility is located 15 km from the CCC facility. This facility is inside the designated SIA for NO 2, and individual emission points were used to model all facility wide allowable emissions Ready Mixed Concrete Scotts Hill This facility is being included as a PM 10 NAAQS source located in Pender County 7.8 km from the CCC facility. This facility is outside the designated SIA for PM 10 and as per the agreed upon methodology, all emission points at this facility were included. This facility was characterized within the DENR emission inventory as a single point source Ready Mixed Concrete Wilmington This facility is being included as a PM 10 NAAQS source located 8.2 km from the CCC facility. This facility is within the designated SIA for PM 10 and as per the agreed upon methodology, all emission points at this facility were included. This facility was characterized within the DENR emission inventory as a single point source S&W Ready Mix Concrete Castle Hayne This facility is being included as a PM 10 NAAQS source located 3.0 km from the CCC 44
53 facility. This facility is within the designated SIA for PM 10 and as per the agreed upon methodology, all emission points at this facility were included. This facility was characterized within the DENR emission inventory as a single point source Southern States Chemical This facility is being included as a NO 2 NAAQS source. This facility is located 16 km from the CCC facility. This facility is inside the designated SIA for NO 2 and consists of two source venting through a single stack designated as EP-1/2 (Sulfuric Acid Plants) Wilbara, LLC This facility is being included as a NO 2 NAAQS. It is a new facility located in Wilmington 13.8 km from the CCC facility. This facility is inside the designated SIA for NO 2, and consists of one permitted emission point. The source designated as Sulfuric Acid Plant Stack represents the source of NO x emissions from the facility. 45
54 SECTION 4 AAQS AND CLASS II AIR QUALITY MODELING METHODOLOGY 4.1 Model Specification Dispersion modeling procedures followed the EPA recommended model selection and application protocol in the Guideline on Air Quality Models (November 9, 2005) and in the EPA New Source Review Workshop Manual (draft, October 1990) as well as the guidance provided by DENR in the North Carolina PSD Modeling Guidance (September 2010), Guidelines for Evaluating the Air Quality Impacts of Toxic Pollutants in North Carolina (December 2009), and the Quarry Guidance for Refined Modeling were used throughout this analysis. For the evaluation of the 1-hour standards for NO 2, additional guidance also included the following: Guidance Concerning the Implementation of the 1-hour NO 2 NAAQS for the Prevention of Significant Deterioration Program, Memorandum from Stephen D. Page, US EPA, June 29, Applicability of Appendix W Modeling Guidance for the 1-hour NO 2 National Ambient Air Quality Standard, Memorandum from Tyler Fox, US EPA, June 28, This methodology was implemented for both the CCC sources-only analysis and the full impact analysis (including off-site sources). The CCC source modeling followed three goals: Determined whether the air quality impact analysis can forego further modeling for each PSD pollutant depending on the significant impact analysis and the associated SIA. Defined the impact area for which a full impact analysis will be performed. Determined other sources and background concentrations that should be included in the analysis. Based on the pollutants and emission rates associated with the proposed facility, dispersion modeling was required for emissions of TSP, PM 10, PM 2.5, SO 2, NO x, and CO, as well 46
55 as thirteen TAPs (see applicability determination in Tab C of this application). The level of detail in the modeling for these criteria pollutants was dependent on the determination of the extent of the SIA for each pollutant. Dispersion modeling is not required for VOC emissions. Off site sources were included for those pollutants that exceeded the applicable SIL. The other sources included were within the SIA as well as those beyond the SIA with allowable emissions that may cause them to interact with the CCC facility for both PSD increment consumption and AAQS impacts. Potentially interacting sources were evaluated for inclusion based on the DENR-suggested 20D approach. Concentrations for all sources combined plus background were compared to the AAQS for each pollutant to determine compliance. For the PSD increments, the combined impacts of all increment consuming sources were compared to the allowable increments. These off-site sources were presented in Tables 6 and 7, previously. 4.2 Model Selection For those pollutants that required dispersion modeling, the AMS/EPA Regulatory Model (AERMOD) was used for the modeling. AERMOD (Version 09292) was used to perform all PSD and AAQS related full impact modeling. AERMOD is a steady-state straight-line Gaussian plume model that is recommended by the Guideline on Air Quality Models. AERMOD has many features that make it the most representative model for this analysis including: Recommended and accepted by the EPA Multiple sources Point, area, and volume source capabilities Hour-by-hour boundary layer meteorological data used in calculations User-specified grouped source concentration estimates Consideration of both daytime convective turbulence and nighttime stable conditions Building downwash Variable receptor locations. Digitized terrain data derived from the 1-arc second National Elevation Dataset (NED) was used in AERMOD to allow the model to perform its full suite of analyses considering the gentle slope of the surrounding terrain. These NED data were preprocessed using the AMS/EPA Regulatory Model Terrain Pre-processor (AERMAP). AERMAP processes commercially 47
56 available NED data and creates a file suitable for use within an AERMOD control file. This file contains elevation and hill-height scaling factors for each receptor in the air dispersion study. The use of AERMOD and AERMAP preprocessor was implemented through the Bee-Line software called BEEST (Version 9.83). The selection of AERMOD is consistent with DENR guidance. No other air dispersion model was used for this Class II analysis, although one other related model was used to calculate building downwash influence on the plumes. This model is the EPA Building Profile Input Program for PRIME (BPIPPRM). The BPIPPRM Model is included in the BEEST program and was used throughout this analysis. 4.3 Source Identification and Location Each source was identified in this modeling documentation in Section 3 for all point and fugitive source. Each source has a unique identifier that was used throughout the modeling analysis both in the model and in any tables presenting the concentration estimates. A Cartesian coordinate system in UTM coordinates was assigned to all sources in this analysis. Any other sources that were considered in the modeling for PSD increment purposes or AAQS impacts were also assigned a unique identification number and had coordinates in the same UTM system as the CCC sources. All sources described in Tables 3 through 7 were considered as appropriate for SIL, PSD, and AAQS analysis. 4.4 Receptor Locations Modeling of the individual sources was performed using AERMOD to determine maximum impact locations. The receptors that were used for the SIL, PSD, and AAQS analysis include a fence line (or property line) grid at approximately 100 meter intervals and multiple Cartesian grids from the fence line out to a distance of 13 km (which was sufficient to fully determine the SIA). Grid spacings were established at 100 m grid spacing from the fenceline out to approximately 2.5 km (this grid density was extended to the east for full inclusion of the subject property fenceline), 250 m grid spacing from 2.5 km to 5 km, 500 m grid spacing from 5 km to 10 km, and 1000 grid spacing from 10 km to 13 km. SIL modeling analyses indicated that all maximum impacts occurred within 8 kilometers of the facility boundaries. Figure 5 shows 48
57 the entire gridded domain and Figure 6 shows the near field receptors to the proposed facility. Terrain elevations were included in all cases for each receptor as derived from the NED data. 4.5 Meteorological Data Five years of meteorological data from a nearby representative weather observation site was deemed acceptable for dispersion modeling for this PSD regulatory study. A five year data set of meteorological data from the Wilmington, NC site [National Weather Service (NWS) No )] for surface data and from the Charleston, SC site (NWS No ) for the upper air data was processed by DENR (March 2008 dataset) using the AERMET meteorological processor and available on their website for the years For all TAP evaluations the March 2008 dataset was used. For all criteria pollutant evaluations, the Wilmington/Charleston May 2010 PSD meteorological dataset was used. Per DENR s current PSD Modeling Guidance, for each NWS meteorological data site, DENR has processed three meteorological data subsets assuming a surface roughness of 1.0 (high), 0.5 (medium), and 0.05 (low). The appropriate meteorological data file subset to use is then selected based on the surface roughness of the facility/project site which can be determined using the AERSURFACE preprocessor. To make this determination, the surface roughness surrounding the proposed facility was evaluated using AERSURFACE. This was accomplished by downloading the North Carolina Land Use data from DENR and providing the following AERSURFACE inputs: 49
58 Northing (meters) Coordinates shown are UTM NAD Easting (meters) Carolinas Cement Company LLC Castle Hayne, North Carolina Figure 5. Overall Receptor Grid for Air Quality Modeling Analysis 50
59 Northing (meters) Coordinates shown are UTM NAD Easting (meters) Carolinas Cement Company LLC Castle Hayne, North Carolina Figure 6. Near Field Receptor Grid Used for the Air Quality Modeling Analysis 51
60 Input filename: north_carolina_nlcd_erd tif Output filename: CCC_AERSURFACE.out Type of coordinate: UTM Center of the study area: 238, Easting; 2,807, Northing UTM Zone: 18 Horizontal Datum: NAD83 Radius of the study area (km): 1.0 Define by multiple sectors: No Temporal resolution: No Continuous snow cover: No Month/Season assignments Default Sit an airport: No Arid region: No Surface moisture: Average This yielded a surface roughness length (Z o ) of Based upon this analysis the medium subset (Z o = 0.5) was selected. Appendix B contains the input/output files from the completed AERSURFACE run. 4.6 Model Inputs AERMOD is very versatile both in terms of the physical phenomena that it can represent and the options that are available for model control and calculations. The regulatory default options of AERMOD were used throughout all applications, with the exception of the 1-hour NO 2 modeling demonstration. Table 8 presents a summary of the features that were set by the regulatory default option as well as other options selected for this analysis Hour NO 2 Tier III Modeling Justification and Inputs To perform the 1-hour NO 2 modeling evaluation, Tier III modeling was performed. In order to perform this modeling evaluation, non-regulatory options were required, specifically the use of the PVMRM algorithm within AERMOD. In order for non-regulatory options to be used for regulatory purposes the following determination must be made as per 40 CFR Part 51, Appendix W (Guideline on Air Quality Models) section (e): 52
61 Regulatory defaults*. TABLE 8. OPTIONS SELECTED IN THE MODELING ANALYSIS Option description Concentrations in micrograms/cubic meter (μg/m3). UTM coordinates in NAD27for fence line and all other receptor locations was used. Terrain elevations were considered. The downwind distance plume rise option were used for all sources. Buoyancy-induced dispersion was used. The profile base elevation height was set to 10.1 meters (33 ft). Building aerodynamic downwash was performed using the BPIP-PRIME algorithms. Stack tip downwash was modeled. Program control parameters, receptors, and source input data were output. Concentrations during calm hours were set to zero and the CALMS processor used Averaging times were selected consistent with those applicable to the PSD increments, AAQS, and significant impact concentrations for TSP, SO 2, PM 10, PM 2.5, NO x, CO, and TAPs. *Non-regulatory options (specifically the PVMRM algorithm) were used to complete the 1-hour NO 2 modeling demonstration. 53
62 an alternative refined model may be used provided that: i. The model has received a scientific peer review; ii. The model can be demonstrated to be applicable to the problem on a theoretical basis; iii. The data bases which are necessary to perform the analysis are available and adequate; iv. Appropriate performance evaluations of the model have shown that the model is not biased toward underestimates; and v. A protocol on methods and procedures to be followed has been established. A Tier III modeling justification and protocol was submitted to Mr. Jim Roller with DENR for review and approval was received on January 6, This document is included in Appendix C of this report. Specifically, the following inputs were used within the PVMRM algorithms to complete this 1-hour NO 2 modeling demonstration: NO 2 /NO x Ratio (NO2STACK) : 0.05 Equilibrium Ratio (NO2EQUIL) : 0.75 Background Ozone Value (OZONEVAL) : Hourly Derived Data. These values were derived based upon ozone season data only from the Castle Hayne monitoring station. This evaluation considered a representative 5-year period and is considered sufficiently conservative for this demonstration and the sensitivity of the modeling algorithm. A more detailed discussion of this dataset and how it was derived can be found within Appendix C. 4.7 Building Downwash The effluent plumes from the proposed stacks at the site will be affected by nearby buildings and structures. Because the stacks and building dimensions are such that building downwash of released effluent may cause the plumes to be influenced (which will tend to bring the plume closer to the ground), these effects were included in the analysis. All structure dimensions can be found in Appendix D. The building and stack configuration of the CCC facility was shown in Figure 4 for all structures. According to the EPA guidance on considering the influence of a building stack, if the stack is less than a Good Engineering Practice (GEP) stack height, the effluent should be treated as if it were affected by the building. GEP stack height is defined as: 54
63 H GEP = h b + 1.5L where: H GEP h b L = Good Engineering Practice stack height (m) = Nearby structure height = The lesser of the nearby structure height or maximum projected width. In this case, the height of each stack was compared to the calculated GEP stack height for each building. A second criterion that was applied to determine if downwash would be applied for each source/building combination whether the stacks are located downwind and within 5L of the building, upwind and within 2L of the building, or off to the side and within 0.5L of the building. The results of these comparisons for each stack and each building for each of 36 wind directions were tabulated. To perform this analysis, the model recommended by the EPA, BPIPPRM was used. The BEE-Line version of the BPIPPRM Model within BEEST was used to generate all downwash calculations. 4.8 Background Concentrations Table 9 summarizes the proposed background concentrations for each criteria pollutant of concern. These values are based on monitoring station data recommended by DENR. It is also understood from DENR policy that TSP background concentrations will not be required as part of the AAQS analysis and therefore has been excluded from Table 9. 55
64 TABLE 9. PROVIDED BACKGROUND CONCENTRATIONS Pollutant Monitor Year Averaging Period Background Concentration (μg/m 3 ) NO 2 Mecklenburg County hour 82.7 PM 10 Duplin County hour 20 PM 2.5 Duplin County hour 16.8 Annual Reporting All modeling has been documented in this modeling report, which is part of the permit application. Electronic copies of all input and output files of the modeling analysis have been provided to DENR under separate cover on portable media in ASCII or BEEST formats. One full copy of the model documentation including diskettes has been provided, with additional paper copies of the documentation made available as required. 56
65 SECTION 5 RESULTS OF THE CLASS II AND AAQS AMBIENT IMPACT ANALYSIS 5.1 Significant Impact Analysis The emissions and source characteristics for sources included in the SIL analysis were presented and discussed earlier in this report. The dispersion modeling was performed over a 5- year period of meteorological data using AERMOD. Per DENR guidance, the highest concentrations of each applicable averaging period (depending on pollutant) were used to determine the maximum significant concentration impacts and SIAs. Tables 10 through 14 present the significant impact analysis results for SO 2, CO, NO 2, PM 10, and PM 2.5. No other criteria pollutants were required to be modeled under this PSD analysis. As shown in the tables, the SIL s were exceeded for NO 2 (1-hr averaging period only), PM 10, and PM 2.5. The SILs were not exceeded for CO and SO 2. For the SO 2 SIL analysis, it is important to note that the annual SIL analysis was based upon the Portland Cement NSPS of 0.4 lb/ton clinker (100 lb/hr). This standard is a 30-day rolling average and as such does not reflect short-term variations in emission rates (i.e., 1-hour values). Therefore, the short-term SIL analysis (1-hour, 3- hour, and 24-hour averaging periods) was performed at an increased emission rate of 173 lb/hr. As with the SO 2 SIL analysis, the NO 2 SIL analysis also required two distinct SIL runs (annual and 1-hour). The annual run was also based upon the Portland Cement NSPS 30-day rolling average of 1.5 lb/ton clinker (375 lb/hr), while the short-term (1-hour) SIL analysis was run using a higher emission rate of 2.8 lb/ton clinker (700 lb/hr). This higher emission rate was evaluated using the cause and contribute analysis detailed in Section and provides a shorter-term emission rate that can be emitted and not cause or contribute to any modeled potential exceedance. 57
66 TABLE 10. SUMMARY OF SULFUR DIOXIDE SIGNIFICANT IMPACTS Year 1988 Averaged Concentration (μg/m 3 ) 1-Hour 1 3-Hour 1 24-Hour 1 Annual 2 Distance to Distance to Distance to Significant Highest Significant Highest Significant Highest Impact Concentration Impact Concentration Impact Concentration (km) (μg/m 3 ) (km) (μg/m 3 ) (km) (μg/m 3 ) Distance to Significant Impact (km) 8.6 NA 3.3 NA 0.2 NA NA 3.0 NA 0.2 NA NA 8.9 NA 3.4 NA 0.2 NA NA 2.8 NA 0.2 NA NA 2.8 NA 0.2 NA Significant Level 10.0* Anywhere offsite 25.0 Anywhere offsite 5.0 Anywhere offsite 1.0 Anywhere offsite *Interim 1-Hour SIL established by DENR 1 Based upon SO 2 emission rate of 173 lb/hr 2 Based upon SO 2 emission rate of 0.4 lb/ton clinker (100 lb/hr) 58
67 TABLE 11. SUMMARY OF CARBON MONOXIDE SIGNIFICANT IMPACTS Year Highest Concentration (μg/m 3 ) 1-hour Distance to Significant Impact (km) Highest Concentration (μg/m 3 ) 8-hour Distance to Significant Impact (km) NA 27 NA NA 28 NA NA 26 NA NA 25 NA NA 23 NA Significant Level 2,000 Anywhere offsite 500 Anywhere offsite 59
68 TABLE 12. SUMMARY OF NITROGEN DIOXIDE SIGNIFICANT IMPACTS Year 1988 Averaged Concentration (μg/m 3 ) 1-Hour 1 Annual 2 Distance to Significant Impact (km) Highest Concentration (μg/m 3 ) Distance to Significant Impact (km) 0.8 NA NA NA NA NA Significant Level 10.0* Anywhere offsite 1.0 Anywhere offsite *Interim 1-Hour SIL established by DENR 1 Based upon NO 2 emission rate of 700 lb/hr 2 Based upon NO 2 emission rate of 1.5 lb/ton clinker (375 lb/hr) 60
69 TABLE 13. SUMMARY OF PM 10 SIGNIFICANT IMPACTS Year Highest Concentration (μg/m 3 ) 24-Hour Distance to Significant Impact (km) Significant Level 5.0 Anywhere offsite 61
70 TABLE 14. SUMMARY OF PM 2.5 SIGNIFICANT IMPACTS 24-Hour Annual Year Highest Concentration (μg/m 3 ) Distance to Significant Impact (km) Highest Concentration (μg/m 3 ) Distance to Significant Impact (km) Significant Level 1.2 Anywhere offsite 0.3 Anywhere offsite 62
71 Because the SIA s for NO 2, PM 10, and PM 2.5 were beyond the fence line, additional Class II PSD Increment and AAQS modeling was required and is presented in subsequent sections. Maps of the SIAs are shown in Appendix D. 5.2 Increment Consumption Analysis This analysis included all emissions at CCC and all increment-consuming sources identified by DENR. Table 15 summarizes the highest increment consumption for each averaging period and pollutant and compares the CCC PSD and all other PSD source impacts to the full PSD increments. All averaging times and results are reported consistent with DENR policy. As can be seen, the increment consumption is less than the full PSD increments for all averaging times. There are no PSD increments established based upon current DENR PSD Modeling Guidance for 1-hour NO 2 or PM 2.5. Therefore, an increment analysis for these pollutants was not required to be performed. 5.3 AAQS Analysis DENR requires that a demonstration be provided showing that the proposed source emissions when modeled with other sources (as appropriate for those sources exceeding applicable SILs) in the area and adding background do not exceed the AAQS (except for TSP and PM 2.5, where only the impact of CCC sources is required to be modeled). Dispersion modeling for cumulative AAQS impact assessment was conducted for PM 10 and NO 2, which exceeded the SILs for the applicable CCC emissions. Other major sources existing in and near the SIA were included in the modeling. The criteria outlined in Section 3 were used to compare the potential emissions for each source within approximately 50 km to the 20D distance. These results are presented in Appendix E, with the sources failing the 20D screening being included in the analysis. The sources remaining after 20D were described and presented in Section 3. Table 16 and Tables 18 to 21 show a summary of the appropriate impacts combined with the background concentrations. As shown, the impacts for each year for each averaging period are less than the applicable AAQS for PM 2.5, TSP, and lead. 63
72 TABLE 15. PM 10 PSD INCREMENT CONSUMPTION - SUMMARY Averaging Period Combined CCC and Off-Site Source Concentrations, (μg/m 3 ) Highest Five-Year Concentration (μg/m 3 ) Allowable PSD Increment (μg/m 3 ) 24-Hour (H2H) Annual (H1H) Averaging Period CCC Source Only Concentrations (μg/m 3 ) Highest Five-Year Concentration (μg/m 3 ) Allowable PSD Increment (μg/m 3 ) 24-Hour (H2H) Annual (H1H)
73 5.3.1 PM 10 Cause and Contribute Analysis A potential exceedance for the cumulative 24-hour impacts was predicted at a receptor located to the north of the CCC property and located on Martin Marietta s property. Because this receptor location is within a 250 meter grid spacing, a hot-spot analysis was conducted by creating a 100 meter grid spacing surrounding this receptor. This was performed, as required by DAQ guidance and ensures that the highest potential exceedance was identified. The potential exceedance appears to be due to industrial source allowable emissions from the Martin Marietta site and the fact that the receptor is located on that property in close proximity to the emission source. The current modeling does not exclude any offsite industrial properties with restricted access that would otherwise be excluded from compliance modeling for individual sources. Therefore, the modeled potential exceedance does not indicate an actual violation of the AAQS. To demonstrate the proposed project had no significant impact to this receptor, a source contribution run was made isolating the worst case receptor and run for the 24-hour period (April 4, 1991) that yielded the exceedance shown in Table 16. As a result of this run it was determined that CCC contributes only μg/m 3 to this receptor during this 24-hour modeled period, which is below the applicable SIL of 5.0 μg/m 3, and that Martin Marietta contributes 727 μg/m 3 (99.97%) of the impact to this receptor. Table 17 shows the results of this source contribution analysis which includes the combined CCC sources and the top ten contributors to this modeled exceedance. All modeling demonstrations (full receptor grid, hot-spot analysis and isolated receptor source contribution) have been submitted to DENR for review. 65
74 TABLE 16. PM 10 CUMULATIVE AAQS IMPACT ANALYSIS - SUMMARY Combined CCC and Off-site Sources (20D Sources) Averaging Period Cumulative Source Impact* (μg/m 3 ) Background Concentration (μg/m 3 ) Total Concentration (μg/m 3 ) AAQS (μg/m 3 ) Percent of AAQS 24-hour (H6H) % CCC Sources Only 24-hour (H6H) % Offsite Sources Only 24-hour (H6H) % *Modeled impacts for each of the cases may occur at different receptor locations. 66
75 TABLE 17. PM 10 SOURCE CONTRIBUTION TO POTENTIAL EXCEEDANCE Modeled Receptor 236, Easting 3,811, Northing Period Modeled Year Month Day Averaging Period Modeled Source ID Source Description Modeled Concentration* (μg/m 3 ) NQS_ All Sources (CCC + Offsite Sources) CCC_ONLY Combined CCC Sources Only NQS_OS Combined Offsite Sources Only TOP CONTRIBUTING OFF-SITE SOURCES 20D_PM44 Martin Marietta Materials, Inc. - Rocky Point D_PM11 Elementis Chromium D_PM09 CEMEX, Inc D_PM08 CEMEX, Inc D_PM38 Oldecastle - Adams Products Co D_PM04 CP&L Co d/b/a Progress Energy Caro D_PM36 General Electric Company D_PM39 Ready Mixed Concrete Company - Wilmington D_PM37 Invista, S.a.r.l D_PM02 International Paper - Riegelwood Mill *Modeled concentrations do not include background values 67
76 Table 18. PM 2.5 AAQS Impact Analysis - Summary Averaging Period Total Source Impact (μg/m 3 ) Background Concentration (μg/m 3 ) Total Concentration (μg/m 3 ) AAQS (μg/m 3 ) Percent of AAQS 24-hour (98%) % Annual (H1H) % TABLE 19. TSP AAQS IMPACT ANALYSIS - SUMMARY Averaging Period Total Source Impact (μg/m 3 ) Background Concentration (μg/m 3 ) Total Concentration (μg/m 3 ) AAQS (μg/m 3 ) Percent of AAQS 24-hour (H2H) 58 NA % Annual (H1H) 14 NA % 68
77 TABLE 20. NO 2 CUMULATIVE AAQS IMPACT ANALYSIS - SUMMARY Combined CCC and Off-site Sources (20D Sources) Averaging Period Cumulative Source Impact (μg/m 3 ) Background Concentration (μg/m 3 ) Total Concentration* (μg/m 3 ) AAQS (μg/m 3 ) Percent of AAQS 1-Hour (98%) NA NA % * Background concentrations included in the NO2Post output provided within this table. TABLE 21. LEAD AAQS IMPACT ANALYSIS - SUMMARY Averaging Period Total Source Impact (μg/m 3 ) Background Concentration (μg/m 3 ) Total Concentration (μg/m 3 ) AAQS (μg/m 3 ) Percent of AAQS Monthly (H1H) 1.76E-03 NA 1.76E-03 NA NA 3-Month Rolling 0.00E+00 NA 0.00E E % 69
78 5.3.2 NO 2 Cause and Contribute Analysis The cumulative 1-hour NO 2 AAQS impacts indicate there were modeled potential exceedances. Because this receptor location is within a 1000 meter grid spacing, a hot-spot analysis was conducted by creating a 100 meter grid spacing surrounding this receptor. This was performed, as required by DAQ guidance and ensures that the highest potential exceedance was identified. Also, as previously noted, the modeling does not exclude any offsite industrial properties with restricted access that would otherwise be excluded from compliance modeling for individual sources. As shown in Table 20, the worst case receptor is 201% of the 1-hour NAAQS. It was also shown within Table 12 that the modeled SIL values for CCC were 28 μg/m 3. This modeled SIL value is an averaged value of the H1H modeled results, which is significantly higher than the 98% value modeled within the NAAQS demonstration. As a conservative demonstration, subtracting the SIL results from the cumulative NAAQS results would yield 350 μg/m 3, which is still 162 μg/m 3 greater than the NAAQS. This would suggest that these potential exceedances are present as a result of the offsite sources alone and CCC does not cause these potential exceedances. To demonstrate CCC had no significant impact to these receptors, a cause and contribute analysis was performed. In order to evaluate the NO 2 impact, a POST file was created for the source category when both the CCC Sources and the Cumulative Sources NAAQS modeling was conducted. Two third-party post processing programs were also used to evaluate these two POST files. These programs were NO2Post (version 2.1) and Contribution Analyst (version 1.1), both developed by Bee-Line Software. As mentioned previously, a POST file was created during the Cumulative Sources NAAQS modeling. This POST file was post-processed via NO2Post to analyze each hour for each receptor to determine the 98 th percentile values for all receptors within the modeling domain. The established background values were also input into NO2Post via a user created file named NO2Background.txt. NO2Post was set to create a secondary output file (named NO2Post_CA.txt ), that records those receptors that modeled above the NAAQS for use in the post-processor program called Contribution Analyst. Based upon this post-processing, a total of 910 receptors required further analysis. Contribution Analyst was used to analyze the modeled data on a temporal and spatial basis. To accomplish this analysis the POST files from the CCC only modeling were input into 70
79 the post-processor along with the output file from the NO2Post program ( NO2Post_CA.txt ). This post processor reads in the receptors that exceeded the NAAQS (including background values) from the NO2Post_CA file. Once it identifies these receptors, Contribution Analyst reads in the temporal values from both the CCC Only modeling for each identified receptor where an exceedance was identified. The data is then paired for comparison to determine what the highest modeled contribution of CCC sources was to the modeled exceedances. As a result, it was determined that CCC contributes well below the established SIL at all identified receptors. As a demonstration of this, Table 22 provides the single highest contribution made by CCC to one of the identified modeled potential exceedances. Note that the receptor was chosen for demonstration based on the highest CCC impact and does not represent the highest modeled potential cumulative impact. A complete output of these post-processed results is provided in Appendix F. TABLE 22. NO 2 CAUSE AND CONTRIBUTE EXAMPLE OUTPUT Modeled Receptor # , Easting 3,794,348 Northing Modeled Period Year Month Day Hour Cumulative Impacts* (μg/m 3 ) CCC Only Impacts (μg/m 3 ) Average *Modeled concentrations include background values 71
80 5.4 Toxic Air Pollutants DENR requires that a modeling demonstration be provided showing that the proposed source emissions do not exceed the Toxics Significant Ambient Air Concentrations (SAAC) at 15A NCAC 02D The potential emissions from all CCC sources were modeled for those air toxics that exceeded the toxic air pollutant permitting emission rates (TPER) at 15A NCAC 02Q Table 23 provides air dispersion modeling results for all toxic air pollutants that required modeling, all values presented are H1H values. Overall, the impacts for each averaging period is less than the applicable SAAC. 5.5 Additional Impacts Analysis PSD review requires an analysis of any potential impairment to visibility, soils, and vegetation that may occur as a result of the proposed CCC sources. The review also requires an analysis of the air quality impact projected for the area as a result of general commercial, residential, industrial, and other growth associated with the proposed project Soils and Vegetation The AAQS were designed to protect the public health (primary standards) and welfare (secondary standards) from known or anticipated adverse effects and include a margin of safety. Factors that were considered in designing the standards included vegetation effects, soil effects, and material damage effects. Modeling of all the proposed and existing emissions for the AAQS analysis indicated that the maximum concentrations for all averaging times were less than each applicable AAQS. In an effort to further evaluate the potential impacts of CCC on the surrounding soils and vegetation, a more refined analysis of this area has been completed and will be submitted under separate cover as Appendix H to this report. 72
81 TABLE 23. TOXIC AIR POLLUTANTCOMPLIANCE DEMONSTRATION Pollutant Averaging Period Maximum Concentration (μg/m 3 ) SAAC (μg/m 3 ) Percent of SAAC Ammonia 1 Hour 3.18E E % Arsenic Annual 7.00E E % Benzene Annual 1.33E E % Beryllium Annual 2.00E E % Cadmium Annual 2.00E E % Chromium (VI) Soluble Chromate Chromium (VI) Bioavailable Chromate Fluorides 24 Hour 1.80E E % Annual 3.00E E % 1 Hour 2.87E E % 24 Hour 4.13E E % Formaldehyde 1 Hour 1.46E E % Hydrogen Chloride 1 Hour 5.32E E % Manganese 24 Hour 1.25E E % Mercury 24 Hour 1.70E E % 73
82 5.5.2 Growth Impacts A growth analysis includes a projection of the associated industrial, commercial and residential source growth that will occur in the area due to the source. CCC estimates that the project will create approximately 160 permanent jobs onsite and an additional 350 jobs in the area to support the operations of the facility after startup. CCC plans to fill as many of the permanent positions as possible by training local people. During the 2-year construction phase, there will be approximately 800 contracting jobs. CCC estimates that once operational, there will be about 64,100 truck trips and 58,400 passenger vehicle trips to the plant per year. The Draft Traffic Study concludes that this traffic is within the operational loads of the existing roads and no upgrades are necessary. The secondary emissions related to the project, which under the PSD rules do not include mobile source tailpipe emission, are not expected to have an adverse impact on local ambient air quality Visibility Visibility impacts for affected Class I areas were calculated using a long range transport model, i.e., CALPUFF. The results of this and the other Class I area impacts are presented in a separate report. DENR also requires demonstration that no adverse visibility impacts will occur in the Class II areas as a result of this proposed project. As per Section 6.0, Visibility Impairment, of the North Carolina PSD Modeling Guidance (September 2010), a visibility impact analysis was conducted to evaluate impacts that occur within the area affected by emissions from the proposed CCC facility. As per the clarifications for such an analysis from DENR ( from Chuck Buckler, DENR, to Josh Dunbar, Environmental Quality Management dated January 7, 2008), a screening analysis using the EPA VISCREEN Model (Workbook for Plume Visual Impact Screening and Analysis, EPA-450/ , Research Triangle Park, NC, 1988 and Tutorial Package for the VISCREEN Model, EPA, Research Triangle Park, NC, 1992) was conducted. A methodology for applying VISCREEN was followed whereby various distances from the proposed CCC facility were modeled (from 10 km to 110 km) as if a Class II area of interest were present at that distance (in VISCREEN, distances to specific Class I areas are input 74
83 but in this case distances to hypothetical Class I areas were used). Figure 7 shows a few of the distances considered in the VISCREEN analysis. VISCREEN was applied using the model defaults for emissions and meteorology along with CCC facility emissions for PM 10 and NO x and visual background range specified by DENR (80 km). The output from each successive VISCREEN run was examined to determine compliance with the color difference parameter (Delta-E) and the plume contrast using three wavelengths of light (0.4, 0.55, and 0.7 mm) against both a sky background and a terrain background. The assumed observer stands at the nearest edge of the area of the distance range of interest. The observer is modeled to be looking back towards the facility outside of the area as well as within the area out to the outer edge of the area of interest. The methodology that was followed was as follows: 1. Assume a circular hypothetical Class I area of 5 km in width with its nearest downwind edge 10 km from the CCC facility in Castle Hayne, NC. 2. Initiate VISCREEN with all model defaults for a Level-1 screening analysis including emissions for primary NO 2, soot, and primary SO 4, worst case meteorology, and the critical threshold levels for Delta-E and contrast (2.00 and 0.05, respectively). 3. Set the background visual range to 80 km as specified by DENR (even though the background visual map of the U.S. in Figure 4-3 of the Tutorial Package for the VISCREEN Model shows a background visual range of no more than 20 km in this locale). 4. Use the maximum hourly emissions of NO x and PM 10 for all sources combined at the proposed CCC facility NO x, lb/h and PM 10, lb/h. 5. Set the distances as required for each individual VISCREEN run of each hypothetical Class I area: a. Distances between CCC and observer 10, 15, km b. Distances between CCC and closest area boundary 10, 15, km c. Distances between CCC and farthest area boundary 15, 20, km 6. Run VISCREEN for each set of distances. 7. Determine at what distance (ring) both the Delta-E and contrast are compliant. 8. Determine if any areas of interest are within that distance. 75

84 Figure 7. Layout of Selected Distances Considered in the VISCREEN Analysis 76
85 The summary printouts from the VISCREEN Model are attached in Appendix G. The compliant distance was reached in the modeling for the color difference parameter and contrast for both sky and terrain background inside and outside a hypothetical Class I area at 95 km. The nearest Class I areas to the proposed CCC facility, namely, Swanquarter National Wildlife Refuge located 170 km to the northeast and Cape Romain National Wildlife Refuge located 220 km to the south southwest were reviewed. As neither one of the areas lie within the compliance distance of 95 km and no other parks or other natural public areas will be adversely affected, it is concluded that no scenic vistas in North Carolina (or other nearby states as well) will be affected by the construction and operation of the proposed CCC facility. 77
86 APPENDIX A 20D ANALYSIS/OFF-SITE SOURCE INVENTORY A-1
87 Carolinas Cement Company OFF-SITE SOURCES TO BE INCLUDED IN PM10 CUMULATIVE MODELING Plant Name Location Distance PM10 Sources km NAAQS PSD Oldecastle - Adams Products Co. Castle Hayne 2.7 X Archer Daniels Midland Co. Brunswick Co Barnhill Contracting Co. Castle Hayne 6.0 X CEMEX, Inc. Castle Hayne 0.5 X Corning Inc. Wilmington 14.0 X X CP&L Progress Energy - Sutton Plant Wilmington 16.5 X X DAK Americas LLC Brunswick Co X Del Laboratories, Inc. Pender Co. 7.1 X Elementis Chromium Castle Hayne 1.7 X General Electric Company Wilmington 9.4 X X International Paper - Riegelwood Mill Columbus Co X Invista, S.a.r.l. Wilmington 14.3 X Martin Marietta Materials - Rocky Point Pender Co. 6.0 X New Hanover Co. WASTEC Wilmington 15.1 NuStar Asphalt Refining, LLC Wilmington 23.7 Primary Energy of NC - Southport Plant Brunswick Co Ready Mixed Concrete Co - Scotts Hill Pender Co. 7.8 X Ready Mixed Concrete Co - Wilmington Wilmington 8.2 X S & W Ready Mix Concrete Castle Hayne 3.0 X Southern States Chemical Wilmington 15.3 Wilbara, LLC Wilmington 13.8 CCC PM10 20D Analysis.xls 1 of 22
88 PM10 Off-site Emission Inventory for Carolinas Cement Company, LLC FINAL SOURCE LIST Model ID COUNTY PLANT NAME PERMIT # POLLU- TANT Allowable Emissions ST (lb/hr) Allowable Emissions LT (lb/hr) Allowable Emissions (<=TPY) UTM EAST UTM NORTH UTM ZONE STACK* * REL PT TYPE HT (FT) DIAM (FT) EXITVEL (FT/SEC) FLOW RATE (FT 3 /MIN) 20D_PM01 Brunswick DAK Americas LLC PM , ES , No 20D_PM02 Columbus International Paper - Riegelwood Mill PM , , RB , No 20D_PM03 New Hanover Barnhill Contracting Company PM , RP1 Asphalt plan , No 20D_PM04 New Hanover CP&L Co d/b/a Progress Energy Caro PM , , Unit 3 stack ,484, No 20D_PM05 New Hanover CEMEX, Inc PM , ERP-G1 Silo , YES 20D_PM06 New Hanover CEMEX, Inc PM , ERP-G2 Truck Lo , YES 20D_PM07 New Hanover CEMEX, Inc PM , ERP-G5 Masonry , YES 20D_PM08 New Hanover CEMEX, Inc PM , ERP-H1 M Packi , YES 20D_PM09 New Hanover CEMEX, Inc PM , ERP-I1-2 C Pack , YES 20D_PM10 New Hanover Corning Incorporated PM , Stack , No 20D_PM11 New Hanover Elementis Chromium PM , EP101 Main stac , YES 20D_PM12 New Hanover Elementis Chromium PM , EP102 Process t , YES 20D_PM13 New Hanover Elementis Chromium PM , EP103 Recycle a , YES 20D_PM14 New Hanover Elementis Chromium PM , EP104 Recycle v , YES 20D_PM15 New Hanover Elementis Chromium PM , EP105 Recycle v , YES 20D_PM16 New Hanover Elementis Chromium PM , EP111 Quench ta , YES 20D_PM17 New Hanover Elementis Chromium PM , EP112 Quench ta , YES 20D_PM18 New Hanover Elementis Chromium PM , EP113 Quench ta , YES 20D_PM19 New Hanover Elementis Chromium PM , EP116 Filter vent , YES 20D_PM20 New Hanover Elementis Chromium PM , EP118 3 tanks , YES 20D_PM21 New Hanover Elementis Chromium PM , EP119 Evap/tank , YES 20D_PM22 New Hanover Elementis Chromium PM , EP119A Acid/tan , YES 20D_PM23 New Hanover Elementis Chromium PM , EP120 Tank vent , YES 20D_PM24 New Hanover Elementis Chromium PM , EP tanks YES 20D_PM25 New Hanover Elementis Chromium PM , EP123 Chrystalliz , YES 20D_PM26 New Hanover Elementis Chromium PM , EP124 Chromic a , YES 20D_PM27 New Hanover Elementis Chromium PM , EP127 ES-20 Dry , YES 20D_PM28 New Hanover Elementis Chromium PM , EP132 Reject filte , YES 20D_PM29 New Hanover Elementis Chromium PM , EP133 Reject filte , YES 20D_PM30 New Hanover Elementis Chromium PM , EP138 Fines sys , YES 20D_PM31 New Hanover Elementis Chromium PM , EP139 Salt cake , YES 20D_PM32 New Hanover Elementis Chromium PM , EP-2USF Steam , YES 20D_PM33 New Hanover Elementis Chromium PM , EP-4USF Silo , YES 20D_PM34 New Hanover Elementis Chromium PM , EP-5USF Silo , YES 20D_PM35 New Hanover Elementis Chromium PM , Fugitives YES 20D_PM36 New Hanover General Electric Company PM , AE , No 20D_PM37 New Hanover Invista, S.a.r.l PM , , HTR , No 20D_PM38 New Hanover Oldecastle - Adams Products Co PM , ERP , YES 20D_PM39 New Hanover Ready Mixed Concrete Company - Wilmington PM , ERP , No 20D_PM40 New Hanover S & W Ready Mix Conc - Castle Hayne PM , ERP , YES 20D_PM41 Pender Del Laboratories, Inc PM , B , YES 20D_PM42 Pender Del Laboratories, Inc PM , MR YES 20D_PM43 Pender Del Laboratories, Inc PM , PW YES 20D_PM44 Pender Martin Marietta Materials, Inc. - Rocky Point PM , ERP YES 20D_PM45 Pender Ready Mixed Concrete Company - Scotts Hill PM , ERP-Baghouses , YES PSD INCREMENT SOURCES GAS TEMP ( 0 F) Within SIA? PSD_PM01 PSD_PM02 PSD_PM03 New Hanover CP&L - SUTTON 1318R10 TSP , Unit 3 stack ,484, No New Hanover CP&L - SUTTON 1318R11 TSP , Unit 3 stack ,484, No New Hanover CORNING INCORPORATED 3809R15 TSP , Stack , No New Hanover CORNING INCORPORATED 3809R19 TSP , Stack , No New Hanover CORNING INCORPORATED 3809R30 TSP , Stack , No New Hanover CORNING INCORPORATED 3809R32 TSP , Stack , No New Hanover CORNING INCORPORATED 3809R33 TSP , Stack , No New Hanover GENERAL ELECTRIC CO., WILM 1756R04 TSP , AE , No New Hanover GENERAL ELECTRIC CO., WILM 1756R08 TSP , AE , No NOTES: *All stacks are included for sources inside the SIA. For sources outside the SIA, the dominant or most representative stack is used for modeling all of that source's emissions. Page 2 of 22 Printed: 1/20/2011
89 PM10 Off-site Emission Inventory for Carolinas Cement Company, LLC Search Parameters: PM 10 UTM: N km, E km Zone 17 SOURCES UTM: N km, E km Zone 18 Radius: 60 km REGION COUNTY CITY NAME PLANT NAME PERMIT # REV# UTM EAST WIRO Brunswick Leland American Distillation, Inc R , ERP-100 BOILER 100 STACK 0.20 PM10 WIRO Brunswick Southport Archer Daniels Midland Company T , ep3 & PM10 WIRO Brunswick Southport Archer Daniels Midland Company T , PM10 WIRO Brunswick Southport Archer Daniels Midland Company T , Ep PM10 WIRO Brunswick Southport Archer Daniels Midland Company T , & 11 EP10 & EP PM10 WIRO Brunswick Southport Archer Daniels Midland Company T , & 22 turbines w/ steam inj 0.77 PM10 WIRO Brunswick Southport Archer Daniels Midland Company T , , 38 EP25, EP PM10 WIRO Brunswick Southport Archer Daniels Midland Company T , ,8 EP7, EP PM10 WIRO Brunswick Southport Archer Daniels Midland Company T , ep1 ce PM10 WIRO Brunswick Southport Archer Daniels Midland Company T , ep-2 eu PM10 WIRO Brunswick Southport Archer Daniels Midland Company T , EP46 EP PM10 WIRO Brunswick Southport Archer Daniels Midland Company T , ep-48 diesel emer gen 0.03 PM10 WIRO Brunswick Southport Archer Daniels Midland Company T , EU30 EU PM10 WIRO Brunswick Leland Boggs Materials Inc R , ERP-2 Plant #2 stack 1.80 PM10 WIRO Brunswick Leland Boggs Materials Inc R , Rap Rap Fugitives 0.40 PM10 WIRO Brunswick Leland Carolina Pole Leland, Inc R , ERP1 Stack for boiler 5.31 PM10 WIRO Brunswick Leland DAK Americas LLC T , A-15 VERTICAL 1.45 PM10 WIRO Brunswick Leland DAK Americas LLC T , A-16 VERTICAL 1.45 PM10 WIRO Brunswick Leland DAK Americas LLC T , A-25 vertical 1.55 PM10 WIRO Brunswick Leland DAK Americas LLC T , A-32 VERTICAL 3.74 PM10 WIRO Brunswick Leland DAK Americas LLC T , A-32A VERTICAL 3.74 PM10 WIRO Brunswick Leland DAK Americas LLC T , A-37 VERTICAL 3.74 PM10 WIRO Brunswick Leland DAK Americas LLC T , A-44 vertical 0.19 PM10 WIRO Brunswick Leland DAK Americas LLC T , ES-01 vertical 3.15 PM10 WIRO Brunswick Leland DAK Americas LLC T , ES-02 vertical 3.15 PM10 WIRO Brunswick Leland DAK Americas LLC T , ES vertical PM10 WIRO Brunswick Leland DAK Americas LLC T , ES vertical PM10 WIRO Brunswick Leland DAK Americas LLC T , ES vertical PM10 WIRO Brunswick Leland DAK Americas LLC T , FUG fugitives 4.48 PM10 WIRO Brunswick Leland DAK Americas LLC T , Gly-1 VERTICAL 0.06 PM10 WIRO Brunswick Leland Malmo Asphalt Plant R , EP1 Baghouse on Drum Mixer 1.06 PM10 WIRO Brunswick Leland Malmo Asphalt Plant R , IEP4 One No. 2 Fuel Oil-Fired Asphalt Tank Heater 0.10 PM10 WIRO Brunswick Southport Primary Energy of North Carolina LLC - Southport Plant T , Unit 1 stack PM10 WIRO Brunswick Southport Primary Energy of North Carolina LLC - Southport Plant T , Unit 2 stack PM10 WIRO Brunswick Southport Primary Energy of North Carolina LLC - Southport Plant T , ash pumps Ash Vacuum Pump Stacks 0.08 PM10 WIRO Brunswick Southport Primary Energy of North Carolina LLC - Southport Plant T , coal handling coal handling 0.05 PM10 WIRO Brunswick Southport Primary Energy of North Carolina LLC - Southport Plant T , cooling towers cooling towers 8.63 PM10 WIRO Brunswick Southport Primary Energy of North Carolina LLC - Southport Plant T , fire pump Fire Pump Stack 0.01 PM10 WIRO Brunswick Southport Primary Energy of North Carolina LLC - Southport Plant T , Roads Fugitive Dust from Plant Road 0.09 PM10 WIRO Brunswick Southport Primary Energy of North Carolina LLC - Southport Plant T , silos silo stacks 0.01 PM10 WIRO Brunswick Southport Primary Energy of North Carolina LLC - Southport Plant T , Wood Handling Wood Handling 0.26 PM10 WIRO Brunswick Southport Progress Energy Carolinas - Brunswick Plant R , AUX B Auxboiler Stack 0.03 PM10 WIRO Brunswick Southport Progress Energy Carolinas - Brunswick Plant R , GEN A Emergency Diesel Generator A 0.11 PM10 WIRO Brunswick Southport Progress Energy Carolinas - Brunswick Plant R , GEN B Emergency Diesel Generator B 0.11 PM10 WIRO Brunswick Southport Progress Energy Carolinas - Brunswick Plant R , GEN C Emergency Diesel Generator C 0.11 PM10 WIRO Brunswick Southport Progress Energy Carolinas - Brunswick Plant R , GEN D Emergency Diesel Generator D 0.11 PM10 WIRO Brunswick Southport Progress Energy Carolinas - Brunswick Plant R , GEN E Emergency Diesel Generator E 0.01 PM10 WIRO Brunswick Leland Ready Mixed Concrete Company - Leland R , ERP-Baghouses Plant Vents 1.18 PM10 WIRO Brunswick Bolivia S & W Ready Mix Concrete Co. - Bolivia R , ERP-F1 Fugitive Emissions 2.42 PM10 WIRO Brunswick Bolivia S & W Ready Mix Concrete Co. - Bolivia R , ERP-S2 Bag Filter Exhuast 0.01 PM10 WIRO Brunswick Bolivia S & W Ready Mix Concrete Co. - Bolivia R , ERP-W1 Bag Filter Exaust 0.03 PM10 WIRO Brunswick Southport Southport Concrete Corporation R , ERP1 Baghouse Vents 3.03 PM10 WIRO Brunswick Leland Technical Coating International, Inc T , EP-1 EP PM10 WIRO Brunswick Leland Technical Coating International, Inc T , EP-2 EP PM10 WIRO Brunswick Leland Technical Coating International, Inc T , EP-2A EP-2A 0.00 PM10 WIRO Brunswick Leland Technical Coating International, Inc T , EP-3 EP PM10 WIRO Brunswick Leland Technical Coating International, Inc T , EP-3A EP-3A 0.00 PM10 WIRO Brunswick Leland Technical Coating International, Inc T , EP-4 EP PM10 WIRO Brunswick Navassa US Marine Navassa T , CS-1 ES-WW-1 Stack 0.04 PM10 WIRO Brunswick Leland Victaulic Company R , Rubber Process exhaust from rubber curing ovens 0.11 PM10 WIRO Columbus Riegelwood Hexion Acme Facility T , boiler 2.50 PM10 WIRO Columbus Riegelwood Hexion Acme Facility T , ,02c,0... various Hex paraf bf's 3.31 PM10 WIRO Columbus Riegelwood Hexion Acme Facility T , b hex cat ox 0.03 PM10 WIRO Columbus Riegelwood International Paper - Riegelwood Mill R , cw-1 vertical 6.24 PM10 WIRO Columbus Riegelwood International Paper - Riegelwood Mill R , Fug. Fugitive 0.20 PM10 WIRO Columbus Riegelwood International Paper - Riegelwood Mill R , HRDS Haul Road Fugitives 5.82 PM10 WIRO Columbus Riegelwood International Paper - Riegelwood Mill R , J fugitive PM10 WIRO Columbus Riegelwood International Paper - Riegelwood Mill R , JA301 vertical 0.01 PM10 WIRO Columbus Riegelwood International Paper - Riegelwood Mill R , JA306 Vertical 0.01 PM10 WIRO Columbus Riegelwood International Paper - Riegelwood Mill R , JA307 Vertical 0.01 PM10 WIRO Columbus Riegelwood International Paper - Riegelwood Mill R , JA322 Vertical 0.01 PM10 WIRO Columbus Riegelwood International Paper - Riegelwood Mill R , K4001 vertical 2.42 PM10 WIRO Columbus Riegelwood International Paper - Riegelwood Mill R , LK3 Vertical 4.04 PM10 WIRO Columbus Riegelwood International Paper - Riegelwood Mill R , PB1 vertical 7.55 PM10 WIRO Columbus Riegelwood International Paper - Riegelwood Mill R , pb2 vertical PM10 WIRO Columbus Riegelwood International Paper - Riegelwood Mill R , PB5 Vert PM10 WIRO Columbus Riegelwood International Paper - Riegelwood Mill R , RB3 vertical PM10 WIRO Columbus Riegelwood International Paper - Riegelwood Mill R , RB5 vertical PM10 WIRO Columbus Riegelwood International Paper - Riegelwood Mill R , RLS Vertical 0.63 PM10 WIRO Columbus Riegelwood International Paper - Riegelwood Mill R , SLK3 vertical 1.14 PM10 WIRO Columbus Riegelwood International Paper - Riegelwood Mill R , SLK6 Vertical 1.14 PM10 WIRO Columbus Riegelwood International Paper - Riegelwood Mill R , ST3 vertical PM10 UTM NORTH UTM ZONE STACK NO. STACK DESC EMISSIONS (TONS) POLLUTANT Page 3 of 22 Printed: 1/20/2011
90 PM10 Off-site Emission Inventory for Carolinas Cement Company, LLC Search Parameters: PM 10 UTM: N km, E km Zone 17 SOURCES UTM: N km, E km Zone 18 Radius: 60 km REGION COUNTY CITY NAME PLANT NAME PERMIT # REV# UTM EAST WIRO Columbus Riegelwood International Paper - Riegelwood Mill R , ST4 vertical PM10 WIRO Columbus Riegelwood International Paper - Riegelwood Mill R , ST5a vertical PM10 WIRO Columbus Riegelwood International Paper - Riegelwood Mill R , ST5b vertical PM10 WIRO Columbus Riegelwood International Paper - Riegelwood Mill R , V-139 Vert PM10 WIRO Columbus Riegelwood West Fraser, Inc. - Armour Lumber Mill T , A1-1 cyclone separator 0.05 PM10 WIRO Columbus Riegelwood West Fraser, Inc. - Armour Lumber Mill T , C1-1 verical w/cap PM10 WIRO Columbus Riegelwood West Fraser, Inc. - Armour Lumber Mill T , fugl1-1 debark 1.04 PM10 WIRO Columbus Riegelwood West Fraser, Inc. - Armour Lumber Mill T , fugl1-2 log saw PM10 WIRO Duplin Rose Hill House of Raeford Farms, Inc. - Rose Hill R , ES-2 Boiler Stack 1.18 PM10 WIRO Duplin Teachey House of Raeford Farms, Inc. - Wallace Division R , ERP-1 One stack for both boilers 0.11 PM10 WIRO Duplin Rose Hill Murphy - Brown LLC - Chief Feed Mill R , RP01 Truck receiving pit 0.01 PM10 WIRO Duplin Rose Hill Murphy - Brown LLC - Chief Feed Mill R , RP06 Ground grain distribution 0.01 PM10 WIRO Duplin Rose Hill Murphy - Brown LLC - Chief Feed Mill R , RP07 Mixed feed distribution 0.21 PM10 WIRO Duplin Rose Hill Murphy - Brown LLC - Chief Feed Mill R , RP11 Boiler 0.20 PM10 WIRO Duplin Rose Hill Murphy - Brown LLC - Chief Feed Mill R , RP12 Boiler 0.20 PM10 WIRO Duplin Rose Hill Murphy - Brown LLC - Chief Feed Mill R , RP13 Hammermill 1.75 PM10 WIRO Duplin Rose Hill Murphy - Brown LLC - Chief Feed Mill R , RP14 Hammermill 1.75 PM10 WIRO Duplin Rose Hill Murphy - Brown LLC - Chief Feed Mill R , RP15S kw generator 0.01 PM10 WIRO Duplin Rose Hill Murphy - Brown LLC - Chief Feed Mill R , RP15S kw generator 0.01 PM10 WIRO Duplin Rose Hill Murphy - Brown LLC - Chief Feed Mill R , RP16c Rail unloading - controlled bay 0.91 PM10 WIRO Duplin Rose Hill Murphy - Brown LLC - Chief Feed Mill R , RP16f Rail unloading - fugative 0.12 PM10 WIRO Duplin Rose Hill Murphy - Brown LLC - Chief Feed Mill R , RP17c Truck unloading - controlled bay 1.36 PM10 WIRO Duplin Rose Hill Murphy - Brown LLC - Chief Feed Mill R , RP17f Truck unloading- fugative 0.18 PM10 WIRO Duplin Rose Hill Murphy - Brown LLC - Chief Feed Mill R , RPGR01 Pellet cooling PM10 WIRO Duplin Rose Hill Murphy Milling Company - Register Site R , ERP-1 SILOS 0.03 PM10 WIRO Duplin Rose Hill Murphy Milling Company - Register Site R , ERP-2 Truck Receiving 0.04 PM10 WIRO Duplin Rose Hill Murphy Milling Company - Register Site R , ERP-3 Truck Loadout 0.13 PM10 WIRO Duplin Rose Hill Murphy Milling Company - Register Site R , ERP-4 Column Dryer 0.13 PM10 WIRO Duplin Rose Hill Murphy-Brown LLC - Rosemary Feed Mill R , RP01R No.2 oil-fired boiler 0.24 PM10 WIRO Duplin Rose Hill Murphy-Brown LLC - Rosemary Feed Mill R , RP1 Ingredient dump bag filter 0.01 PM10 WIRO Duplin Rose Hill Murphy-Brown LLC - Rosemary Feed Mill R , RP10 Truck loadout 2.62 PM10 WIRO Duplin Rose Hill Murphy-Brown LLC - Rosemary Feed Mill R , RP2 Pellet cooler system PM10 WIRO Duplin Rose Hill Murphy-Brown LLC - Rosemary Feed Mill R , RP3&4 Hammermill 4.12 PM10 WIRO Duplin Rose Hill Murphy-Brown LLC - Rosemary Feed Mill R , RP5 grain drier 0.08 PM10 WIRO Duplin Rose Hill Murphy-Brown LLC - Rosemary Feed Mill R , RP9 Railcar receiving 0.40 PM10 WIRO Duplin Rose Hill Nash Johnson & Sons Farms - Feed Mill R , B1 Boiler Stack # PM10 WIRO Duplin Rose Hill Nash Johnson & Sons Farms - Feed Mill R , B2 Boiler Stack # PM10 WIRO Duplin Rose Hill Nash Johnson & Sons Farms - Feed Mill R , E101 Bagfilter on Hammermill Line # PM10 WIRO Duplin Rose Hill Nash Johnson & Sons Farms - Feed Mill R , E102 Hammermill Line 2 with Bagfilter 0.85 PM10 WIRO Duplin Rose Hill Nash Johnson & Sons Farms - Feed Mill R , E103 Receiving and Distribution area with Bagfilter 1.70 PM10 WIRO Duplin Rose Hill Nash Johnson & Sons Farms - Feed Mill R , E104 Storage Bin (100) with bagfilter 0.03 PM10 WIRO Duplin Rose Hill Nash Johnson & Sons Farms - Feed Mill R , E105 Storage Bin(111) with Bagfilter (105) 0.03 PM10 WIRO Duplin Rose Hill Nash Johnson & Sons Farms - Feed Mill R , E106 Storage Bin (125) with bagfilter (106) 0.15 PM10 WIRO Duplin Rose Hill Nash Johnson & Sons Farms - Feed Mill R , E109 Storage Bin (ES-009) with Bagfilter (109) 5.82 PM10 WIRO Duplin Rose Hill Nash Johnson & Sons Farms - Feed Mill R , E110 Storage Bin (ES-010) with bagfilter (110) 5.82 PM10 WIRO Duplin Rose Hill Nash Johnson & Sons Farms - Feed Mill R , E111 Pellet Line No. 1 (ES-011) with three parallel cyclones (111) 8.31 PM10 WIRO Duplin Rose Hill Nash Johnson & Sons Farms - Feed Mill R , E112 Pellet Line No. 2 (ES-012) with three parallel cyclones (112) 8.31 PM10 WIRO Duplin Rose Hill Nash Johnson & Sons Farms - Feed Mill R , E114 Hammermill Line 3 with Bagfilter 0.85 PM10 WIRO Duplin Rose Hill Nash Johnson & Sons Farms - Feed Mill R , E115 Pellet Line No. 3 (ES-015) with three parallel cyclones (115) 8.31 PM10 WIRO Duplin Rose Hill Nash Johnson & Sons Farms - Feed Mill R , Receiving Truck pits, Rail pits, and Receiving 0.83 PM10 WIRO Duplin Rose Hill Rose Hill Animal Disease Diagnostic Laboratory R , RP-INC-1 Incinerator release point 0.01 PM10 WIRO Duplin Rose Hill Valley Proteins Inc T , EP1-6 GROUPED PROCESS VENTS PM10 WIRO New Hanover Wilmington Apex Oil Company, Inc R , ESH1 One No. 2 fuel-oil-fired hot-oil heater (ID No. ES-H1, 10.0 MM Btu/hr.) 0.05 PM10 WIRO New Hanover Wilmington Apex Oil Company, Inc R , ESH2 One No. 2 fuel-oil-fired hot-oil steam boiler (ID No. ES-H2, 12.5 MM Btu/hr.) 0.05 PM10 WIRO New Hanover Castle Hayne Barnhill Contracting Company R , RP1 Bag house stack, on 425 TPH Asphalt plant 3.33 PM10 WIRO New Hanover Wilmington BASF Corporation R , D2603 silencer on Vitamin C granulator exhaust fan FA PM10 WIRO New Hanover Wilmington BASF Corporation R , F2602 fan from bag filter for hopper PM10 WIRO New Hanover Wilmington BASF Corporation R , F2636A fan for bagfilter F2636 A 0.12 PM10 WIRO New Hanover Wilmington BASF Corporation R , FA1401 fan for bag filter on GR used to be called FN-1131 in earlier permits 0.97 PM10 WIRO New Hanover Wilmington BASF Corporation R , FA2601 fan for bagfilter BF2601 on crusher SR PM10 WIRO New Hanover Wilmington BASF Corporation R , FA2611 fan discharge from filter baghopuse 3.38 PM10 WIRO New Hanover Wilmington BASF Corporation R , FA2637 fan for bagfilter F-2637 off of crushers SR2636A/B 0.99 PM10 WIRO New Hanover Wilmington BASF Corporation R , FA2639A fan for bag filter F2639A 0.12 PM10 WIRO New Hanover Wilmington BASF Corporation R , FA2641 fan for bagfilter F2641 off of WC2659/60/65/ PM10 WIRO New Hanover Wilmington BASF Corporation R , ST1970 STACK 0.10 PM10 WIRO New Hanover Wilmington Bradley Creek Pump Station R , ERP-1 Generator Stack 0.01 PM10 WIRO New Hanover Wilmington Carolina Marine Terminal R , EP-10 thru 16 Fugitive Releases from Unloading, Handling & Storage of Chromium Ore 5.92 PM10 WIRO New Hanover Wilmington Carolina Marine Terminal R , EP-7 thru 9 Fugitive Emissions from Urea Unloading and Handling 0.31 PM10 WIRO New Hanover Wilmington Carolina Power and Light Company d/b/a Progress Energy Caro T , F1 Coal Fugitives 0.94 PM10 WIRO New Hanover Wilmington Carolina Power and Light Company d/b/a Progress Energy Caro T , F2 Barge Coal Hopper 0.12 PM10 WIRO New Hanover Wilmington Carolina Power and Light Company d/b/a Progress Energy Caro T , F3 Barge Coal Conveyer 0.18 PM10 WIRO New Hanover Wilmington Carolina Power and Light Company d/b/a Progress Energy Caro T , ICT1 IC TURBINE 1 STACK 0.06 PM10 WIRO New Hanover Wilmington Carolina Power and Light Company d/b/a Progress Energy Caro T , ICT2A IC TURBINE 2A STACK 0.18 PM10 WIRO New Hanover Wilmington Carolina Power and Light Company d/b/a Progress Energy Caro T , ICT2B IC TURBINE 2B STACK 0.18 PM10 WIRO New Hanover Wilmington Carolina Power and Light Company d/b/a Progress Energy Caro T , UNIT 1 UNIT 1 & 2 STACK PM10 WIRO New Hanover Wilmington Carolina Power and Light Company d/b/a Progress Energy Caro T , Unit 3 Unit 3 stack PM10 WIRO New Hanover Castle Hayne Carolinas Cement Company, LLC R , ERP-ES1 Rail Unloading 0.15 PM10 WIRO New Hanover Castle Hayne Carolinas Cement Company, LLC R , ERP-ES2 Truck loadout 0.01 PM10 WIRO New Hanover Castle Hayne Carolinas Cement Company, LLC R , ERP-ES4 Silo Vents 0.01 PM10 WIRO New Hanover Castle Hayne CEMEX, Inc R , ERP-G1 Silo PM10 WIRO New Hanover Castle Hayne CEMEX, Inc R , ERP-G2 Truck Loading 0.08 PM10 WIRO New Hanover Castle Hayne CEMEX, Inc R , ERP-G5 Masonary Silo 0.03 PM10 UTM NORTH UTM ZONE STACK NO. STACK DESC EMISSIONS (TONS) POLLUTANT Page 4 of 22 Printed: 1/20/2011
91 PM10 Off-site Emission Inventory for Carolinas Cement Company, LLC Search Parameters: PM 10 UTM: N km, E km Zone 17 SOURCES UTM: N km, E km Zone 18 Radius: 60 km REGION COUNTY CITY NAME PLANT NAME PERMIT # REV# UTM EAST WIRO New Hanover Castle Hayne CEMEX, Inc R , ERP-H1 Masonary Packing 0.03 PM10 WIRO New Hanover Castle Hayne CEMEX, Inc R , ERP-I1-2 Cement Packing 0.04 PM10 WIRO New Hanover Wilmington CEMEX, Inc R , J1-4 Stack J-1 thru J PM10 WIRO New Hanover Wilmington CEMEX, Inc R , L-3 Truck Loading Stack 0.16 PM10 WIRO New Hanover Wilmington Container Products Corporation R , EP-3 Paint Booth stack 0.10 PM10 WIRO New Hanover Wilmington Corbett Package Company R , ERP-B1 boiler stack 0.36 PM10 WIRO New Hanover Wilmington Corning Incorporated T , PM10 WIRO New Hanover Wilmington Corning Incorporated T , PM10 WIRO New Hanover Wilmington Corning Incorporated T , PM10 WIRO New Hanover Wilmington Corning Incorporated T , Source PM10 WIRO New Hanover Wilmington Corning Incorporated T , a 2a 0.82 PM10 WIRO New Hanover Wilmington Corning Incorporated T , EPG1-5 emer gen 0.02 PM10 WIRO New Hanover Wilmington Corning Incorporated T , HB-22 all humidif boilers 0.01 PM10 WIRO New Hanover Wilmington CTI of NC Inc T , wil boiler 0.15 PM10 WIRO New Hanover Wilmington CTI of NC Inc T , wil-2 30 hp boiler 0.01 PM10 WIRO New Hanover Castle Hayne Elementis Chromium T , EP101 EP PM10 WIRO New Hanover Castle Hayne Elementis Chromium T , EP102 EP PM10 WIRO New Hanover Castle Hayne Elementis Chromium T , EP103 EP PM10 WIRO New Hanover Castle Hayne Elementis Chromium T , EP104 EP PM10 WIRO New Hanover Castle Hayne Elementis Chromium T , EP105 EP PM10 WIRO New Hanover Castle Hayne Elementis Chromium T , EP111 EP PM10 WIRO New Hanover Castle Hayne Elementis Chromium T , EP112 EP PM10 WIRO New Hanover Castle Hayne Elementis Chromium T , EP113 EP PM10 WIRO New Hanover Castle Hayne Elementis Chromium T , EP116 EP PM10 WIRO New Hanover Castle Hayne Elementis Chromium T , EP118 EP PM10 WIRO New Hanover Castle Hayne Elementis Chromium T , EP119 EP PM10 WIRO New Hanover Castle Hayne Elementis Chromium T , EP119A EP119A 0.17 PM10 WIRO New Hanover Castle Hayne Elementis Chromium T , EP120 EP PM10 WIRO New Hanover Castle Hayne Elementis Chromium T , EP121 EP PM10 WIRO New Hanover Castle Hayne Elementis Chromium T , EP123 EP PM10 WIRO New Hanover Castle Hayne Elementis Chromium T , EP124 EP PM10 WIRO New Hanover Castle Hayne Elementis Chromium T , EP132 EP PM10 WIRO New Hanover Castle Hayne Elementis Chromium T , EP133 EP PM10 WIRO New Hanover Castle Hayne Elementis Chromium T , EP139 EP PM10 WIRO New Hanover Castle Hayne Elementis Chromium T , EP-2USF EP-2USF PM10 WIRO New Hanover Castle Hayne Elementis Chromium T , EP-4USF EP-4USF 4.44 PM10 WIRO New Hanover Castle Hayne Elementis Chromium T , EP-5USF EP-5USF 4.44 PM10 WIRO New Hanover Castle Hayne Elementis Chromium T , Fugitives fugitives 0.13 PM10 WIRO New Hanover Wilmington Fortron Industries LLC T , ERP PPS-Product Silo (TA-602) 0.04 PM10 WIRO New Hanover Wilmington Fortron Industries LLC T , ERP-FU-081 Oil-Fired Boiler Stack (FU-081) 0.69 PM10 WIRO New Hanover Wilmington Fortron Industries LLC T , ERP-FU-751a Thermal Oxidizer Stack 0.36 PM10 WIRO New Hanover Wilmington Fortron Industries LLC T , ERP-FU-751b Thermal Oxidizer Diverts Vent 0.09 PM10 WIRO New Hanover Wilmington Fortron Industries LLC T , ERP-MS PPS Product Silo (TA-601) 0.04 PM10 WIRO New Hanover Wilmington Fortron Industries LLC T , ERP-MS-605 Product Bagging Operation 0.04 PM10 WIRO New Hanover Wilmington Fortron Industries LLC T , ERP-MS-726 Emergency Generator Stack 0.01 PM10 WIRO New Hanover Wilmington General Electric Company R , AE2 Stack 0.43 PM10 WIRO New Hanover Wilmington General Electric Company R , AE2 Stack 0.43 PM10 WIRO New Hanover Wilmington Hess Corporation - Wilmington Terminal R , B-1 Boiler Stack 0.43 PM10 WIRO New Hanover Wilmington Hewletts Creek Pump Station R , ERP-1 Generator Stack 0.02 PM10 WIRO New Hanover Wilmington INVISTA S.a.r.l R , Boilers Boiler Stack 0.01 PM10 WIRO New Hanover Wilmington Invista, S.a.r.l T , B7600 Resins heater 2.55 PM10 WIRO New Hanover Wilmington Invista, S.a.r.l T , BLR1EP Boiler # PM10 WIRO New Hanover Wilmington Invista, S.a.r.l T , BLR4EP Boiler # PM10 WIRO New Hanover Wilmington Invista, S.a.r.l T , BLR5EP Boiler # PM10 WIRO New Hanover Wilmington Invista, S.a.r.l T , DMTRAIL DMT RAILCAR LOADING PM10 WIRO New Hanover Wilmington Invista, S.a.r.l T , DMTREMELT DMT remelt hopper 0.11 PM10 WIRO New Hanover Wilmington Invista, S.a.r.l T , FLAKEMAKERS DMT flake makers 0.06 PM10 WIRO New Hanover Wilmington Invista, S.a.r.l T , G4074 PTA dryer scrubber 3.10 PM10 WIRO New Hanover Wilmington Invista, S.a.r.l T , G-4904 Flare 1.45 PM10 WIRO New Hanover Wilmington Invista, S.a.r.l T , HEATNEW Resins gas heater 0.01 PM10 WIRO New Hanover Wilmington Invista, S.a.r.l T , HTR1 Heater PM10 WIRO New Hanover Wilmington Invista, S.a.r.l T , HTR3 Heater PM10 WIRO New Hanover Wilmington Invista, S.a.r.l T , HTR4 Heater PM10 WIRO New Hanover Wilmington Invista, S.a.r.l T , HTR5 Heater PM10 WIRO New Hanover Wilmington Invista, S.a.r.l T , L4080EP FABRIC FILTER STACK ON TPA GRINDER 0.02 PM10 WIRO New Hanover Wilmington Invista, S.a.r.l T , L4081EP FABRIC FILTER ON TPA GRINDER 0.02 PM10 WIRO New Hanover Wilmington Invista, S.a.r.l T , PTARAIL PTA railcar loading 0.88 PM10 WIRO New Hanover Wilmington Invista, S.a.r.l T , T-4078 Fabric filter on PTA grinder feed bin 0.04 PM10 WIRO New Hanover Wilmington Invista, S.a.r.l T , T-4083 PTA surge bins 0.08 PM10 WIRO New Hanover Wilmington Invista, S.a.r.l T , T-4084A TPA bulk loading silo 0.02 PM10 WIRO New Hanover Wilmington Invista, S.a.r.l T , T-4084B TPA bulk loading silo 0.02 PM10 WIRO New Hanover Wilmington Invista, S.a.r.l T , T-4084C TPA bulk loading silo 0.02 PM10 WIRO New Hanover Wilmington Invista, S.a.r.l T , T-4084D TPA bulk loading silo 0.01 PM10 WIRO New Hanover Wilmington Invista, S.a.r.l T , T-4084E TPA bulk loading silo 0.01 PM10 WIRO New Hanover Wilmington Invista, S.a.r.l T , T-4084F TPA bulk loading silo 0.01 PM10 WIRO New Hanover Wilmington Invista, S.a.r.l T , T Multi-purpose still feed tank 2.01 PM10 WIRO New Hanover Wilmington Invista, S.a.r.l T , T Residue burn tank 1.84 PM10 WIRO New Hanover Wilmington Invista, S.a.r.l T , Tanks-11 MPME isomer tanks 2.33 PM10 WIRO New Hanover Wilmington Kinder Morgan, Wilmington R , mmbtu boiler stack 0.03 PM10 WIRO New Hanover Wilmington Kinder Morgan, Wilmington R , boiler stack PM10 WIRO New Hanover Wilmington Kinder Morgan, Wilmington R , boiler stack PM10 WIRO New Hanover Wilmington Kinder Morgan, Wilmington R , boiler stack PM10 UTM NORTH UTM ZONE STACK NO. STACK DESC EMISSIONS (TONS) POLLUTANT Page 5 of 22 Printed: 1/20/2011
92 PM10 Off-site Emission Inventory for Carolinas Cement Company, LLC Search Parameters: PM 10 UTM: N km, E km Zone 17 SOURCES UTM: N km, E km Zone 18 Radius: 60 km REGION COUNTY CITY NAME PLANT NAME PERMIT # REV# UTM EAST WIRO New Hanover Wilmington Kinder Morgan, Wilmington R , Boiler Stack PM10 WIRO New Hanover Wilmington Louisiana-Pacific Corporation R , B1 Boilers 0.13 PM10 WIRO New Hanover Wilmington Louisiana-Pacific Corporation R , EP1 Discharge at top of Cyclone # PM10 WIRO New Hanover Wilmington Louisiana-Pacific Corporation R , EP10 Vent above LVL line PM10 WIRO New Hanover Wilmington Louisiana-Pacific Corporation R , EP11 Vent above LVL line PM10 WIRO New Hanover Wilmington Louisiana-Pacific Corporation R , EP12 Vent above LVL line PM10 WIRO New Hanover Wilmington Louisiana-Pacific Corporation R , EP13 Vent above LVL line PM10 WIRO New Hanover Wilmington Louisiana-Pacific Corporation R , EP14 Vent above LVL line PM10 WIRO New Hanover Wilmington Louisiana-Pacific Corporation R , EP15 Vent above LVL line PM10 WIRO New Hanover Wilmington Louisiana-Pacific Corporation R , EP16 Vent above LVL line PM10 WIRO New Hanover Wilmington Louisiana-Pacific Corporation R , EP2 Discharge at top of Cyclone # PM10 WIRO New Hanover Wilmington Louisiana-Pacific Corporation R , EP6 Discharge at top of Cyclone # PM10 WIRO New Hanover Wilmington Louisiana-Pacific Corporation R , EP8 Discharge at top of Cyclone # PM10 WIRO New Hanover Wilmington Louisiana-Pacific Corporation R , EP9 Vent above LVL Line PM10 WIRO New Hanover Wilmington Louisiana-Pacific Corporation R , TB-1 Truck Bin Loadout Emissions 3.41 PM10 WIRO New Hanover Wilmington MeadWestvaco Packaging Systems, LLC T , cyclone cyclone stack 0.07 PM10 WIRO New Hanover Wilmington MeadWestvaco Packaging Systems, LLC T , Fug Fug 0.01 PM10 WIRO New Hanover Wilmington MeadWestvaco Packaging Systems, LLC T , pr1 pr PM10 WIRO New Hanover Wilmington National Gypsum Company R , Baghouse exhaust 1.75 PM10 WIRO New Hanover Wilmington National Gypsum Company R , Baghouse exhaust from #1 Calciner 1.00 PM10 WIRO New Hanover Wilmington National Gypsum Company R , Baghouse exhaust from #2 Calciner 1.09 PM10 WIRO New Hanover Wilmington National Gypsum Company R , Baghouse exhaust from Calcidyne # PM10 WIRO New Hanover Wilmington National Gypsum Company R , Baghouse exhaust from Calcidyne # PM10 WIRO New Hanover Wilmington National Gypsum Company R , Baghouse exhaust from Calcidyne # PM10 WIRO New Hanover Wilmington National Gypsum Company R , Baghouse exhaust from BET 1.38 PM10 WIRO New Hanover Wilmington National Gypsum Company R , Baghouse exhaust 9.44 PM10 WIRO New Hanover Wilmington National Gypsum Company R , Baghouse exhaust from stucco bins 0.14 PM10 WIRO New Hanover Wilmington National Gypsum Company R , A Kiln exhaust zone PM10 WIRO New Hanover Wilmington National Gypsum Company R , B Kiln Exhaust Zone PM10 WIRO New Hanover Wilmington National Gypsum Company R , C Kiln exhaust zone PM10 WIRO New Hanover Wilmington National Gypsum Company R , D Kiln exhaust zone PM10 WIRO New Hanover Wilmington New Hanover County WASTEC R , EP-1 1A Stack 4.91 PM10 WIRO New Hanover Wilmington New Hanover County WASTEC R , EP-2 2A Stack 4.43 PM10 WIRO New Hanover Wilmington New Hanover County WASTEC R , EP-3 3A Stack PM10 WIRO New Hanover Wilmington New Hanover County WASTEC R , EP-3E SILO STACK 0.06 PM10 WIRO New Hanover Wilmington NuStar Asphalt Refining, LLC T , EP-40 STACK 0.94 PM10 WIRO New Hanover Wilmington NuStar Asphalt Refining, LLC T , EP-50 STACK 0.90 PM10 WIRO New Hanover Castle Hayne Oldecastle - Adams Products Company R , ERP Point and Fugitive Releases 1.81 PM10 WIRO New Hanover Wilmington Ready Mixed Concrete Company - Wilmington R , ERP-1 Baghouse Vents 0.46 PM10 WIRO New Hanover Wilmington S & G Prestress Company R , ERP-1&2 Cement Silo Vents 0.13 PM10 WIRO New Hanover Castle Hayne S & W Ready Mix Concrete - Castle Hayne R , ERP-1 Vent for Dust Collector 0.23 PM10 WIRO New Hanover Wilmington S & W Ready Mix Concrete Co - Wilmington Plant R , ERP-1 ERP PM10 WIRO New Hanover Wilmington S & W Ready Mix Concrete Co - Wilmington Plant R , ERP-2 Truck load out area PM10 WIRO New Hanover Wilmington Southern States Chemical T , EP-1/2 plant 1 &2 ep PM10 WIRO New Hanover Wilmington Southern States Chemical T , ERP-HR Haul Road Fugitives 2.33 PM10 WIRO New Hanover Wilmington Vopak Terminal T , Boilers BOILERS B1, B2, B3 and B PM10 WIRO New Hanover Wilmington Vopak Terminal T , FLARE FLARE 0.03 PM10 WIRO New Hanover Wilmington Vopak Terminal South Wilmington R , st1 two grouped boilers 0.65 PM10 WIRO New Hanover Wilmington Wilbara, LLC R , ES-1 Sulfuric acid plant stack 0.00 PM10 WIRO New Hanover Wilmington Wilmington Materials R , ERP-Crusher Crusher vent 0.01 PM T , A-FC-280 IC engine test stations, Field Maint., Bldg PM T , A-FC PM T , A-FC STACK PM T , A-FC PM T , A-FC PM T , A-FC PM T , A-FC STACK PM T , A-FC STACK PM T , A-FC Peak Generator 0.04 PM T , A-FC Peak Generator 0.04 PM T , A-FC Peak Generator 0.04 PM T , A-HP PM T , A-HP PM T , A-HP PM T , A-HP STACK PM T , A-HP STACK PM T , A-HP PM T , A-HP PM T , A-HP STACK PM T , A-HP STACK PM T , A-HP Main steam plant boiler #1 (burning No. 2) 0.06 PM T , A-HP Main steam plant boiler #2 (burning No. 2) 0.06 PM T , A-HP Main steam plant boiler #3 (burning No. 2) 0.06 PM T , A-HP Main steam plant boiler #4 (burning No. 2) 0.06 PM T , A-HP &2 Main steam plant boilers 1 & PM T , A-HP STACK PM T , A-HP &4 Main steam plant boilers 3 & PM T , A-HP Main steam plant boiler PM T , A-HP STACK PM T , A-HP STACK 0.00 PM T , A-HP STACK PM T , A-HP Emergency Generator 0.07 PM10 UTM NORTH UTM ZONE STACK NO. STACK DESC EMISSIONS (TONS) POLLUTANT Page 6 of 22 Printed: 1/20/2011
93 PM10 Off-site Emission Inventory for Carolinas Cement Company, LLC Search Parameters: PM 10 UTM: N km, E km Zone 17 SOURCES UTM: N km, E km Zone 18 Radius: 60 km REGION COUNTY CITY NAME PLANT NAME PERMIT # REV# UTM EAST T , A-HP STACK 0.00 PM T , A-HP STACK 0.00 PM T , A-HP-ICETS IC engine test stands, Hadnot Point 0.05 PM T , A-HP-S PM T , A-MP Boiler 0.09 PM T , A-MP Boiler 0.09 PM T , A-MP Boiler 0.09 PM T , A-MP-625 Boilers, Montford Point, Bldg PM T , A-NH-100 Boilers, Naval Hospital, Bldg PM T , A-PP-2615 Boilers, Paradise Point, Bldg PM T , B-BB-9 Boilers, Courthouse Bay, Bldg PM T , C-AS STACK PM T , C-AS PM T , C-AS IC engine test station 0.05 PM T , C-AS PM T , C-AS PM T , C-AS STACK PM T , C-AS STACK PM T , C-AS STACK PM T , C-AS PM T , C-AS PM T , C-AS PM T , C-AS-4151 Boilers, Air Station, Bldg PM T , C-AS PM T , C-AS STACK PM T , C-AS JET ENGINE TESTING 0.55 PM T , C-AS Woodworking 0.01 PM T , C-CG-650 Boilers, Camp Geiger, Bldg PM T , C-RR-15 Boilers, Rifle Range, Bldg PM T , GR242 Boilers 0.01 PM T , HP PM T , IA-BM-825 Boilers, Berkeley Manor, Bldg PM T , IA-BM-835 Boilers, Berkeley Manor, Bldg PM T , IA-FC Boiler 0.01 PM T , IA-FC Boiler 0.01 PM T , IA-FC Boiler 0.01 PM T , IA-HP Boiler 0.01 PM T , IA-LCH Boiler 0.01 PM T , IA-MG-SH8-58 Boiler 0.01 PM T , IA-NH Boiler 0.01 PM T , IA-NH-120 Boilers, Naval Hospital, Bldg PM T , IA-NH-121 Boilers, Naval Hospital, Bldg PM T , IA-PP Boiler 0.01 PM T , IA-PP Boiler 0.01 PM T , IA-PP-1943-H7 Boiler 0.01 PM T , IA-TT Boiler 0.01 PM T , IA-TT Boiler 0.01 PM T , IB-BB Boiler 0.17 PM T , IC-AS Boiler 0.00 PM T , IC-AS Boiler 0.00 PM T , IC-AS Boiler 0.00 PM T , IC-AS Boiler 0.00 PM T , IC-AS Boiler 0.00 PM T , IC-AS Boiler 0.00 PM T , IC-AS Boiler 0.00 PM T , IC-CG Boiler 0.00 PM T , ICE-ZA Internal combustion engines (Zone A) 0.87 PM T , ICE-ZB Internal combustion engines (Zone B) 0.12 PM T , ICE-ZC Internal combustion engines (Zone C) 0.40 PM T , IC-VL Boiler 0.00 PM T , IC-VL Boiler 0.00 PM T , U-C-AS Boiler 0.00 PM10 WIRO Onslow Richlands Martin Marietta Materials, Inc., - Onslow Quarry R , ERP1 Quarry Fugitives 0.22 PM10 WIRO Onslow Jacksonville Mine Safety Appliances R , EP-2 Baghouse 0.01 PM10 WIRO Onslow Jacksonville Mine Safety Appliances R , EP-3 Grouped Combustion Exhausts 0.01 PM10 WIRO Onslow Jacksonville Mine Safety Appliances R , G-EP-1 Grouped CD Exhausts 0.01 PM10 WIRO Onslow Jacksonville Ready Mixed Concrete Company - Jacksonville R , EP-1 Bag House on top of silo 0.12 PM10 WIRO Onslow Jacksonville Ready Mixed Concrete Company - Jacksonville R , EP-2 Bag house on top of silo 0.12 PM10 WIRO Onslow Jacksonville Ready Mixed Concrete Company - Jacksonville R , EP-3 Bag house on top of silo 0.12 PM10 WIRO Onslow Jacksonville S & W Ready Mix Concrete - Jacksonville R , ERP-1 Vent for Bag House 0.21 PM10 WIRO Onslow Jacksonville S & W Ready Mix Concrete - Jacksonville R , ERP-2 Vent for Bag House 0.87 PM10 WIRO Onslow Holly Ridge S & W Ready Mix Concrete Co - Holly Ridge R , ER-3 Weigh Hopper 0.03 PM10 WIRO Onslow Holly Ridge S & W Ready Mix Concrete Co - Holly Ridge R , ER4 Weigh Hopper at truck load out area PM10 WIRO Onslow Holly Ridge S & W Ready Mix Concrete Co - Holly Ridge R , ERP-1 ERP PM10 WIRO Onslow Holly Ridge S & W Ready Mix Concrete Co - Holly Ridge R , ERP-2 Sand and Aggregate Weigh Hopper 0.20 PM10 WIRO Pender Rocky Point Del Laboratories, Inc R , B-1 boiler stack 0.04 PM10 WIRO Pender Rocky Point Del Laboratories, Inc R , MR-1 exhaust from mixing room bagfilter 0.10 PM10 WIRO Pender Rocky Point Del Laboratories, Inc R , PW-1 exhaust from pre-weigh bagfilter 0.10 PM10 WIRO Pender Rocky Point H & P Wood Turnings, Inc R , ERP-1 Cyclone Stack 1.05 PM10 WIRO Pender Rocky Point Martin Marietta Materials, Inc. - Rocky Point R , ERP1 Emission Point 0.01 PM10 WIRO Pender Hampstead Ready Mixed Concrete Company - Scotts Hill R , ERP-Baghouses Plant Vents 0.76 PM10 WIRO Pender St Helena S & W Ready Mix Concrete Co. - St. Helena R , ERP6 Truck load out point 0.40 PM10 UTM NORTH UTM ZONE STACK NO. STACK DESC EMISSIONS (TONS) POLLUTANT Page 7 of 22 Printed: 1/20/2011
94 PM10 Off-site Emission Inventory for Carolinas Cement Company, LLC Search Parameters: PM 10 UTM: N km, E km Zone 17 SOURCES UTM: N km, E km Zone 18 Radius: 60 km REGION COUNTY CITY NAME PLANT NAME PERMIT # REV# UTM EAST WIRO Pender Burgaw Windsor Fiberglass, Inc R , Vent Vent 0.10 PM10 FRO Sampson Harrells Coastal Plains Pork, LLC R , EP1 FACILITY WIDE FUGITIVE EMISSONS 0.43 PM10 * Release Point Types: 01 - FUGITIVE (NO STACK) 02 - VERTICAL STACK 03 - HORIZONTAL STACK 04 - GOOSE NECK STACK 05 - VERTICAL STACK WITH RAIN CAP 06 - DOWNWARD-FACING VENT Caveat: In order to split out emissions per release point, the total emissions per operating scenario were back calculated and split based on the quantification of % emissions through each release point. The values are only as good as the recorded data for % of emissions allocated to each release point. UTM NORTH UTM ZONE STACK NO. STACK DESC EMISSIONS (TONS) POLLUTANT Page 8 of 22 Printed: 1/20/2011
95 PM10 Off-site Emission Inventory for Carolinas Cement Company, LLC Search Parameters: PM 10 UTM: N km, E km Zone 17 SOURCES UTM: N km, E km Zone 18 Radius: 60 km REGION COUNTY CITY NAME PLANT NAME WIRO Brunswick Leland American Distillation, Inc. WIRO Brunswick Southport Archer Daniels Midland Company WIRO Brunswick Southport Archer Daniels Midland Company WIRO Brunswick Southport Archer Daniels Midland Company WIRO Brunswick Southport Archer Daniels Midland Company WIRO Brunswick Southport Archer Daniels Midland Company WIRO Brunswick Southport Archer Daniels Midland Company WIRO Brunswick Southport Archer Daniels Midland Company WIRO Brunswick Southport Archer Daniels Midland Company WIRO Brunswick Southport Archer Daniels Midland Company WIRO Brunswick Southport Archer Daniels Midland Company WIRO Brunswick Southport Archer Daniels Midland Company WIRO Brunswick Southport Archer Daniels Midland Company WIRO Brunswick Leland Boggs Materials Inc WIRO Brunswick Leland Boggs Materials Inc WIRO Brunswick Leland Carolina Pole Leland, Inc. WIRO Brunswick Leland DAK Americas LLC WIRO Brunswick Leland DAK Americas LLC WIRO Brunswick Leland DAK Americas LLC WIRO Brunswick Leland DAK Americas LLC WIRO Brunswick Leland DAK Americas LLC WIRO Brunswick Leland DAK Americas LLC WIRO Brunswick Leland DAK Americas LLC WIRO Brunswick Leland DAK Americas LLC WIRO Brunswick Leland DAK Americas LLC WIRO Brunswick Leland DAK Americas LLC WIRO Brunswick Leland DAK Americas LLC WIRO Brunswick Leland DAK Americas LLC WIRO Brunswick Leland DAK Americas LLC WIRO Brunswick Leland DAK Americas LLC WIRO Brunswick Leland Malmo Asphalt Plant WIRO Brunswick Leland Malmo Asphalt Plant WIRO Brunswick Southport Primary Energy of North Carolina LLC - Southport Plant WIRO Brunswick Southport Primary Energy of North Carolina LLC - Southport Plant WIRO Brunswick Southport Primary Energy of North Carolina LLC - Southport Plant WIRO Brunswick Southport Primary Energy of North Carolina LLC - Southport Plant WIRO Brunswick Southport Primary Energy of North Carolina LLC - Southport Plant WIRO Brunswick Southport Primary Energy of North Carolina LLC - Southport Plant WIRO Brunswick Southport Primary Energy of North Carolina LLC - Southport Plant WIRO Brunswick Southport Primary Energy of North Carolina LLC - Southport Plant WIRO Brunswick Southport Primary Energy of North Carolina LLC - Southport Plant WIRO Brunswick Southport Progress Energy Carolinas - Brunswick Plant WIRO Brunswick Southport Progress Energy Carolinas - Brunswick Plant WIRO Brunswick Southport Progress Energy Carolinas - Brunswick Plant WIRO Brunswick Southport Progress Energy Carolinas - Brunswick Plant WIRO Brunswick Southport Progress Energy Carolinas - Brunswick Plant WIRO Brunswick Southport Progress Energy Carolinas - Brunswick Plant WIRO Brunswick Leland Ready Mixed Concrete Company - Leland WIRO Brunswick Bolivia S & W Ready Mix Concrete Co. - Bolivia WIRO Brunswick Bolivia S & W Ready Mix Concrete Co. - Bolivia WIRO Brunswick Bolivia S & W Ready Mix Concrete Co. - Bolivia WIRO Brunswick Southport Southport Concrete Corporation WIRO Brunswick Leland Technical Coating International, Inc. WIRO Brunswick Leland Technical Coating International, Inc. WIRO Brunswick Leland Technical Coating International, Inc. WIRO Brunswick Leland Technical Coating International, Inc. WIRO Brunswick Leland Technical Coating International, Inc. WIRO Brunswick Leland Technical Coating International, Inc. WIRO Brunswick Navassa US Marine Navassa WIRO Brunswick Leland Victaulic Company WIRO Columbus Riegelwood Hexion Acme Facility WIRO Columbus Riegelwood Hexion Acme Facility WIRO Columbus Riegelwood Hexion Acme Facility WIRO Columbus Riegelwood International Paper - Riegelwood Mill WIRO Columbus Riegelwood International Paper - Riegelwood Mill WIRO Columbus Riegelwood International Paper - Riegelwood Mill WIRO Columbus Riegelwood International Paper - Riegelwood Mill WIRO Columbus Riegelwood International Paper - Riegelwood Mill WIRO Columbus Riegelwood International Paper - Riegelwood Mill WIRO Columbus Riegelwood International Paper - Riegelwood Mill WIRO Columbus Riegelwood International Paper - Riegelwood Mill WIRO Columbus Riegelwood International Paper - Riegelwood Mill WIRO Columbus Riegelwood International Paper - Riegelwood Mill WIRO Columbus Riegelwood International Paper - Riegelwood Mill WIRO Columbus Riegelwood International Paper - Riegelwood Mill WIRO Columbus Riegelwood International Paper - Riegelwood Mill WIRO Columbus Riegelwood International Paper - Riegelwood Mill WIRO Columbus Riegelwood International Paper - Riegelwood Mill WIRO Columbus Riegelwood International Paper - Riegelwood Mill WIRO Columbus Riegelwood International Paper - Riegelwood Mill WIRO Columbus Riegelwood International Paper - Riegelwood Mill WIRO Columbus Riegelwood International Paper - Riegelwood Mill * RELEASE PT TYPE HT (FT) DIAM (FT) EXITVEL (FT/SEC) FLOW RATE (FT 3 /MIN) Carolina Cement Reference Coordinate (UTM NAD27) Easting (m) Northing (m) Main Stack (km) (km) Largest SIA (TSP/PM10) 7.8 km GAS TEMP ( 0 F) INVENTORY YEAR DISTANCE (KM) Class Within SIA? (Yes/No) Actual Emissions (TPY) Potential Emissions (TPY)** , SYN No , TV No , TV TV , TV , TV , TV , TV , TV , TV , TV TV TV , SYN No SYN , SML No , TV No , TV , TV , TV , TV , TV , TV , TV , TV , TV , TV , TV TV TV , SML No SML , TV No , TV , , TV TV TV TV TV , TV TV , SYN No , SYN , SYN , SYN , SYN , SYN , SML No SML No SML SML , SML No , TV No , TV , TV , TV , TV , TV , TV No SML No , TV No , TV , TV , TV No TV TV TV , TV , TV , TV , TV , TV , TV , TV , TV , TV , TV , TV , TV , TV , TV , TV Page 9 of 22 Printed: 1/20/2011
96 PM10 Off-site Emission Inventory for Carolinas Cement Company, LLC Search Parameters: PM 10 UTM: N km, E km Zone 17 SOURCES UTM: N km, E km Zone 18 Radius: 60 km REGION COUNTY CITY NAME PLANT NAME WIRO Columbus Riegelwood International Paper - Riegelwood Mill WIRO Columbus Riegelwood International Paper - Riegelwood Mill WIRO Columbus Riegelwood International Paper - Riegelwood Mill WIRO Columbus Riegelwood International Paper - Riegelwood Mill WIRO Columbus Riegelwood West Fraser, Inc. - Armour Lumber Mill WIRO Columbus Riegelwood West Fraser, Inc. - Armour Lumber Mill WIRO Columbus Riegelwood West Fraser, Inc. - Armour Lumber Mill WIRO Columbus Riegelwood West Fraser, Inc. - Armour Lumber Mill WIRO Duplin Rose Hill House of Raeford Farms, Inc. - Rose Hill WIRO Duplin Teachey House of Raeford Farms, Inc. - Wallace Division WIRO Duplin Rose Hill Murphy - Brown LLC - Chief Feed Mill WIRO Duplin Rose Hill Murphy - Brown LLC - Chief Feed Mill WIRO Duplin Rose Hill Murphy - Brown LLC - Chief Feed Mill WIRO Duplin Rose Hill Murphy - Brown LLC - Chief Feed Mill WIRO Duplin Rose Hill Murphy - Brown LLC - Chief Feed Mill WIRO Duplin Rose Hill Murphy - Brown LLC - Chief Feed Mill WIRO Duplin Rose Hill Murphy - Brown LLC - Chief Feed Mill WIRO Duplin Rose Hill Murphy - Brown LLC - Chief Feed Mill WIRO Duplin Rose Hill Murphy - Brown LLC - Chief Feed Mill WIRO Duplin Rose Hill Murphy - Brown LLC - Chief Feed Mill WIRO Duplin Rose Hill Murphy - Brown LLC - Chief Feed Mill WIRO Duplin Rose Hill Murphy - Brown LLC - Chief Feed Mill WIRO Duplin Rose Hill Murphy - Brown LLC - Chief Feed Mill WIRO Duplin Rose Hill Murphy - Brown LLC - Chief Feed Mill WIRO Duplin Rose Hill Murphy Milling Company - Register Site WIRO Duplin Rose Hill Murphy Milling Company - Register Site WIRO Duplin Rose Hill Murphy Milling Company - Register Site WIRO Duplin Rose Hill Murphy Milling Company - Register Site WIRO Duplin Rose Hill Murphy-Brown LLC - Rosemary Feed Mill WIRO Duplin Rose Hill Murphy-Brown LLC - Rosemary Feed Mill WIRO Duplin Rose Hill Murphy-Brown LLC - Rosemary Feed Mill WIRO Duplin Rose Hill Murphy-Brown LLC - Rosemary Feed Mill WIRO Duplin Rose Hill Murphy-Brown LLC - Rosemary Feed Mill WIRO Duplin Rose Hill Murphy-Brown LLC - Rosemary Feed Mill WIRO Duplin Rose Hill Murphy-Brown LLC - Rosemary Feed Mill WIRO Duplin Rose Hill Nash Johnson & Sons Farms - Feed Mill WIRO Duplin Rose Hill Nash Johnson & Sons Farms - Feed Mill WIRO Duplin Rose Hill Nash Johnson & Sons Farms - Feed Mill WIRO Duplin Rose Hill Nash Johnson & Sons Farms - Feed Mill WIRO Duplin Rose Hill Nash Johnson & Sons Farms - Feed Mill WIRO Duplin Rose Hill Nash Johnson & Sons Farms - Feed Mill WIRO Duplin Rose Hill Nash Johnson & Sons Farms - Feed Mill WIRO Duplin Rose Hill Nash Johnson & Sons Farms - Feed Mill WIRO Duplin Rose Hill Nash Johnson & Sons Farms - Feed Mill WIRO Duplin Rose Hill Nash Johnson & Sons Farms - Feed Mill WIRO Duplin Rose Hill Nash Johnson & Sons Farms - Feed Mill WIRO Duplin Rose Hill Nash Johnson & Sons Farms - Feed Mill WIRO Duplin Rose Hill Nash Johnson & Sons Farms - Feed Mill WIRO Duplin Rose Hill Nash Johnson & Sons Farms - Feed Mill WIRO Duplin Rose Hill Nash Johnson & Sons Farms - Feed Mill WIRO Duplin Rose Hill Rose Hill Animal Disease Diagnostic Laboratory WIRO Duplin Rose Hill Valley Proteins Inc WIRO New Hanover Wilmington Apex Oil Company, Inc. WIRO New Hanover Wilmington Apex Oil Company, Inc. WIRO New Hanover Castle Hayne Barnhill Contracting Company WIRO New Hanover Wilmington BASF Corporation WIRO New Hanover Wilmington BASF Corporation WIRO New Hanover Wilmington BASF Corporation WIRO New Hanover Wilmington BASF Corporation WIRO New Hanover Wilmington BASF Corporation WIRO New Hanover Wilmington BASF Corporation WIRO New Hanover Wilmington BASF Corporation WIRO New Hanover Wilmington BASF Corporation WIRO New Hanover Wilmington BASF Corporation WIRO New Hanover Wilmington BASF Corporation WIRO New Hanover Wilmington Bradley Creek Pump Station WIRO New Hanover Wilmington Carolina Marine Terminal WIRO New Hanover Wilmington Carolina Marine Terminal WIRO New Hanover Wilmington Carolina Power and Light Company d/b/a Progress Energy Caro WIRO New Hanover Wilmington Carolina Power and Light Company d/b/a Progress Energy Caro WIRO New Hanover Wilmington Carolina Power and Light Company d/b/a Progress Energy Caro WIRO New Hanover Wilmington Carolina Power and Light Company d/b/a Progress Energy Caro WIRO New Hanover Wilmington Carolina Power and Light Company d/b/a Progress Energy Caro WIRO New Hanover Wilmington Carolina Power and Light Company d/b/a Progress Energy Caro WIRO New Hanover Wilmington Carolina Power and Light Company d/b/a Progress Energy Caro WIRO New Hanover Wilmington Carolina Power and Light Company d/b/a Progress Energy Caro WIRO New Hanover Castle Hayne Carolinas Cement Company, LLC WIRO New Hanover Castle Hayne Carolinas Cement Company, LLC WIRO New Hanover Castle Hayne Carolinas Cement Company, LLC WIRO New Hanover Castle Hayne CEMEX, Inc. WIRO New Hanover Castle Hayne CEMEX, Inc. WIRO New Hanover Castle Hayne CEMEX, Inc. * RELEASE PT TYPE HT (FT) DIAM (FT) EXITVEL (FT/SEC) FLOW RATE (FT 3 /MIN) Carolina Cement Reference Coordinate (UTM NAD27) Easting (m) Northing (m) Main Stack (km) (km) Largest SIA (TSP/PM10) 7.8 km GAS TEMP ( 0 F) INVENTORY YEAR DISTANCE (KM) Class Within SIA? (Yes/No) Actual Emissions (TPY) Potential Emissions (TPY)** , TV , TV , TV , TV , TV No ,002, TV TV TV , SYN No , SML No , NR No , NR , NR , NR , NR , NR , NR , NR , NR , NR , NR , NR , NR , NR SML No SML SML SML , SYN No SYN SYN , SYN , SYN , SYN ,281, SYN , SYN No , SYN SYN SYN SYN SYN SYN SYN SYN SYN , SYN , SYN SYN , SYN SYN , , SML No , TV No , SYN No , SYN , SYN YES , SYN No SYN SYN , SYN SYN , SYN , SYN SYN SYN , SYN , SML No SML No SML , TV No TV TV , TV , TV , TV ,039, TV ,484, TV , SML YES SML , SML , SYN YES , SYN , SYN Page 10 of 22 Printed: 1/20/2011
97 PM10 Off-site Emission Inventory for Carolinas Cement Company, LLC Search Parameters: PM 10 UTM: N km, E km Zone 17 SOURCES UTM: N km, E km Zone 18 Radius: 60 km REGION COUNTY CITY NAME PLANT NAME WIRO New Hanover Castle Hayne CEMEX, Inc. WIRO New Hanover Castle Hayne CEMEX, Inc. WIRO New Hanover Wilmington CEMEX, Inc. WIRO New Hanover Wilmington CEMEX, Inc. WIRO New Hanover Wilmington Container Products Corporation WIRO New Hanover Wilmington Corbett Package Company WIRO New Hanover Wilmington Corning Incorporated WIRO New Hanover Wilmington Corning Incorporated WIRO New Hanover Wilmington Corning Incorporated WIRO New Hanover Wilmington Corning Incorporated WIRO New Hanover Wilmington Corning Incorporated WIRO New Hanover Wilmington Corning Incorporated WIRO New Hanover Wilmington Corning Incorporated WIRO New Hanover Wilmington CTI of NC Inc WIRO New Hanover Wilmington CTI of NC Inc WIRO New Hanover Castle Hayne Elementis Chromium WIRO New Hanover Castle Hayne Elementis Chromium WIRO New Hanover Castle Hayne Elementis Chromium WIRO New Hanover Castle Hayne Elementis Chromium WIRO New Hanover Castle Hayne Elementis Chromium WIRO New Hanover Castle Hayne Elementis Chromium WIRO New Hanover Castle Hayne Elementis Chromium WIRO New Hanover Castle Hayne Elementis Chromium WIRO New Hanover Castle Hayne Elementis Chromium WIRO New Hanover Castle Hayne Elementis Chromium WIRO New Hanover Castle Hayne Elementis Chromium WIRO New Hanover Castle Hayne Elementis Chromium WIRO New Hanover Castle Hayne Elementis Chromium WIRO New Hanover Castle Hayne Elementis Chromium WIRO New Hanover Castle Hayne Elementis Chromium WIRO New Hanover Castle Hayne Elementis Chromium WIRO New Hanover Castle Hayne Elementis Chromium WIRO New Hanover Castle Hayne Elementis Chromium WIRO New Hanover Castle Hayne Elementis Chromium WIRO New Hanover Castle Hayne Elementis Chromium WIRO New Hanover Castle Hayne Elementis Chromium WIRO New Hanover Castle Hayne Elementis Chromium WIRO New Hanover Castle Hayne Elementis Chromium WIRO New Hanover Wilmington Fortron Industries LLC WIRO New Hanover Wilmington Fortron Industries LLC WIRO New Hanover Wilmington Fortron Industries LLC WIRO New Hanover Wilmington Fortron Industries LLC WIRO New Hanover Wilmington Fortron Industries LLC WIRO New Hanover Wilmington Fortron Industries LLC WIRO New Hanover Wilmington Fortron Industries LLC WIRO New Hanover Wilmington General Electric Company WIRO New Hanover Wilmington General Electric Company WIRO New Hanover Wilmington Hess Corporation - Wilmington Terminal WIRO New Hanover Wilmington Hewletts Creek Pump Station WIRO New Hanover Wilmington INVISTA S.a.r.l. WIRO New Hanover Wilmington Invista, S.a.r.l. WIRO New Hanover Wilmington Invista, S.a.r.l. WIRO New Hanover Wilmington Invista, S.a.r.l. WIRO New Hanover Wilmington Invista, S.a.r.l. WIRO New Hanover Wilmington Invista, S.a.r.l. WIRO New Hanover Wilmington Invista, S.a.r.l. WIRO New Hanover Wilmington Invista, S.a.r.l. WIRO New Hanover Wilmington Invista, S.a.r.l. WIRO New Hanover Wilmington Invista, S.a.r.l. WIRO New Hanover Wilmington Invista, S.a.r.l. WIRO New Hanover Wilmington Invista, S.a.r.l. WIRO New Hanover Wilmington Invista, S.a.r.l. WIRO New Hanover Wilmington Invista, S.a.r.l. WIRO New Hanover Wilmington Invista, S.a.r.l. WIRO New Hanover Wilmington Invista, S.a.r.l. WIRO New Hanover Wilmington Invista, S.a.r.l. WIRO New Hanover Wilmington Invista, S.a.r.l. WIRO New Hanover Wilmington Invista, S.a.r.l. WIRO New Hanover Wilmington Invista, S.a.r.l. WIRO New Hanover Wilmington Invista, S.a.r.l. WIRO New Hanover Wilmington Invista, S.a.r.l. WIRO New Hanover Wilmington Invista, S.a.r.l. WIRO New Hanover Wilmington Invista, S.a.r.l. WIRO New Hanover Wilmington Invista, S.a.r.l. WIRO New Hanover Wilmington Invista, S.a.r.l. WIRO New Hanover Wilmington Invista, S.a.r.l. WIRO New Hanover Wilmington Invista, S.a.r.l. WIRO New Hanover Wilmington Invista, S.a.r.l. WIRO New Hanover Wilmington Kinder Morgan, Wilmington WIRO New Hanover Wilmington Kinder Morgan, Wilmington WIRO New Hanover Wilmington Kinder Morgan, Wilmington WIRO New Hanover Wilmington Kinder Morgan, Wilmington * RELEASE PT TYPE HT (FT) DIAM (FT) EXITVEL (FT/SEC) FLOW RATE (FT 3 /MIN) Carolina Cement Reference Coordinate (UTM NAD27) Easting (m) Northing (m) Main Stack (km) (km) Largest SIA (TSP/PM10) 7.8 km GAS TEMP ( 0 F) INVENTORY YEAR DISTANCE (KM) Class Within SIA? (Yes/No) Actual Emissions (TPY) Potential Emissions (TPY)** , SYN , SYN , SYN No , SYN , SML No , SML No , TV No , TV , TV , TV , TV , TV TV , TV No TV , TV YES , TV , TV , TV , TV , TV , TV , TV , TV , TV , TV , TV , TV TV , TV , TV , TV , TV , TV , TV , TV , TV TV TV No , TV , , TV TV TV TV , TV , SYN No , SYN , SYN No , SML No , TV No , TV No , TV , TV , TV TV , TV TV , TV TV , TV , TV , TV , TV , TV TV TV TV TV TV TV TV TV TV TV TV , TV TV , TV SYN No SYN SYN SYN Page 11 of 22 Printed: 1/20/2011
98 PM10 Off-site Emission Inventory for Carolinas Cement Company, LLC Search Parameters: PM 10 UTM: N km, E km Zone 17 SOURCES UTM: N km, E km Zone 18 Radius: 60 km REGION COUNTY CITY NAME PLANT NAME WIRO New Hanover Wilmington Kinder Morgan, Wilmington WIRO New Hanover Wilmington Louisiana-Pacific Corporation WIRO New Hanover Wilmington Louisiana-Pacific Corporation WIRO New Hanover Wilmington Louisiana-Pacific Corporation WIRO New Hanover Wilmington Louisiana-Pacific Corporation WIRO New Hanover Wilmington Louisiana-Pacific Corporation WIRO New Hanover Wilmington Louisiana-Pacific Corporation WIRO New Hanover Wilmington Louisiana-Pacific Corporation WIRO New Hanover Wilmington Louisiana-Pacific Corporation WIRO New Hanover Wilmington Louisiana-Pacific Corporation WIRO New Hanover Wilmington Louisiana-Pacific Corporation WIRO New Hanover Wilmington Louisiana-Pacific Corporation WIRO New Hanover Wilmington Louisiana-Pacific Corporation WIRO New Hanover Wilmington Louisiana-Pacific Corporation WIRO New Hanover Wilmington Louisiana-Pacific Corporation WIRO New Hanover Wilmington MeadWestvaco Packaging Systems, LLC WIRO New Hanover Wilmington MeadWestvaco Packaging Systems, LLC WIRO New Hanover Wilmington MeadWestvaco Packaging Systems, LLC WIRO New Hanover Wilmington National Gypsum Company WIRO New Hanover Wilmington National Gypsum Company WIRO New Hanover Wilmington National Gypsum Company WIRO New Hanover Wilmington National Gypsum Company WIRO New Hanover Wilmington National Gypsum Company WIRO New Hanover Wilmington National Gypsum Company WIRO New Hanover Wilmington National Gypsum Company WIRO New Hanover Wilmington National Gypsum Company WIRO New Hanover Wilmington National Gypsum Company WIRO New Hanover Wilmington National Gypsum Company WIRO New Hanover Wilmington National Gypsum Company WIRO New Hanover Wilmington National Gypsum Company WIRO New Hanover Wilmington National Gypsum Company WIRO New Hanover Wilmington New Hanover County WASTEC WIRO New Hanover Wilmington New Hanover County WASTEC WIRO New Hanover Wilmington New Hanover County WASTEC WIRO New Hanover Wilmington New Hanover County WASTEC WIRO New Hanover Wilmington NuStar Asphalt Refining, LLC WIRO New Hanover Wilmington NuStar Asphalt Refining, LLC WIRO New Hanover Castle Hayne Oldecastle - Adams Products Company WIRO New Hanover Wilmington Ready Mixed Concrete Company - Wilmington WIRO New Hanover Wilmington S & G Prestress Company WIRO New Hanover Castle Hayne S & W Ready Mix Concrete - Castle Hayne WIRO New Hanover Wilmington S & W Ready Mix Concrete Co - Wilmington Plant WIRO New Hanover Wilmington S & W Ready Mix Concrete Co - Wilmington Plant WIRO New Hanover Wilmington Southern States Chemical WIRO New Hanover Wilmington Southern States Chemical WIRO New Hanover Wilmington Vopak Terminal WIRO New Hanover Wilmington Vopak Terminal WIRO New Hanover Wilmington Vopak Terminal South Wilmington WIRO New Hanover Wilmington Wilbara, LLC WIRO New Hanover Wilmington Wilmington Materials * RELEASE PT TYPE HT (FT) DIAM (FT) EXITVEL (FT/SEC) FLOW RATE (FT 3 /MIN) Carolina Cement Reference Coordinate (UTM NAD27) Easting (m) Northing (m) Main Stack (km) (km) Largest SIA (TSP/PM10) 7.8 km GAS TEMP ( 0 F) INVENTORY YEAR DISTANCE (KM) Class Within SIA? (Yes/No) Actual Emissions (TPY) Potential Emissions (TPY)** , SYN SML No , SML , SML SML , SML SML SML , SML , SML , SML , SML , SML , SML SML , TV No TV , TV , SYN No SYN , SYN , SYN , SYN , SYN , SYN , SYN , SYN , SYN , SYN , SYN , SYN , TV No , TV , TV TV , TV No , TV , SML YES , SML No , SML No , SML YES , SML No SML , TV No TV ,074, TV No , TV , SYN No , NA TV No SYN No TV No , TV , TV , TV , TV , TV , TV , TV , TV , TV , TV , TV TV TV TV TV TV TV TV TV , TV , TV , TV , TV , TV TV , TV , TV TV TV TV TV Page 12 of 22 Printed: 1/20/2011
99 PM10 Off-site Emission Inventory for Carolinas Cement Company, LLC Search Parameters: PM 10 UTM: N km, E km Zone 17 SOURCES UTM: N km, E km Zone 18 Radius: 60 km REGION COUNTY CITY NAME PLANT NAME WIRO Onslow Richlands Martin Marietta Materials, Inc., - Onslow Quarry WIRO Onslow Jacksonville Mine Safety Appliances WIRO Onslow Jacksonville Mine Safety Appliances WIRO Onslow Jacksonville Mine Safety Appliances WIRO Onslow Jacksonville Ready Mixed Concrete Company - Jacksonville WIRO Onslow Jacksonville Ready Mixed Concrete Company - Jacksonville WIRO Onslow Jacksonville Ready Mixed Concrete Company - Jacksonville WIRO Onslow Jacksonville S & W Ready Mix Concrete - Jacksonville WIRO Onslow Jacksonville S & W Ready Mix Concrete - Jacksonville WIRO Onslow Holly Ridge S & W Ready Mix Concrete Co - Holly Ridge WIRO Onslow Holly Ridge S & W Ready Mix Concrete Co - Holly Ridge WIRO Onslow Holly Ridge S & W Ready Mix Concrete Co - Holly Ridge WIRO Onslow Holly Ridge S & W Ready Mix Concrete Co - Holly Ridge WIRO Pender Rocky Point Del Laboratories, Inc. WIRO Pender Rocky Point Del Laboratories, Inc. WIRO Pender Rocky Point Del Laboratories, Inc. WIRO Pender Rocky Point H & P Wood Turnings, Inc. WIRO Pender Rocky Point Martin Marietta Materials, Inc. - Rocky Point WIRO Pender Hampstead Ready Mixed Concrete Company - Scotts Hill WIRO Pender St Helena S & W Ready Mix Concrete Co. - St. Helena * RELEASE PT TYPE HT (FT) DIAM (FT) EXITVEL (FT/SEC) FLOW RATE (FT 3 /MIN) Carolina Cement Reference Coordinate (UTM NAD27) Easting (m) Northing (m) Main Stack (km) (km) Largest SIA (TSP/PM10) 7.8 km GAS TEMP ( 0 F) INVENTORY YEAR DISTANCE (KM) Class Within SIA? (Yes/No) Actual Emissions (TPY) Potential Emissions (TPY)** TV TV TV TV , TV , TV , TV , TV , TV , TV , TV , TV TV TV TV TV , TV , TV , TV , TV , TV , TV , TV TV TV , TV TV , TV , TV TV TV TV , TV TV , TV TV TV TV TV TV TV TV TV TV TV TV TV TV TV TV TV TV TV TV TV TV TV TV TV TV TV TV SML No , SML No , SML , SML SML No SML SML , SML No , SML SML No SML , SML SML , SML YES SML SML , SML No SML YES , SML No SML No Page 13 of 22 Printed: 1/20/2011
100 PM10 Off-site Emission Inventory for Carolinas Cement Company, LLC Search Parameters: PM 10 UTM: N km, E km Zone 17 SOURCES UTM: N km, E km Zone 18 Radius: 60 km REGION COUNTY CITY NAME PLANT NAME WIRO Pender Burgaw Windsor Fiberglass, Inc. FRO Sampson Harrells Coastal Plains Pork, LLC * Release Point Types: 01 - FUGITIVE (NO STACK) 02 - VERTICAL STACK 03 - HORIZONTAL STACK 04 - GOOSE NECK STACK 05 - VERTICAL STACK WITH RAIN CAP 06 - DOWNWARD-FACING VENT Caveat: In order to split out emissions per release point, the total emissions per operating scenario were back calculated and split ba quantification of % emissions through each release point. The values are only as good as the recorded data for % of emissions alloca release point. * RELEASE PT TYPE HT (FT) DIAM (FT) EXITVEL (FT/SEC) FLOW RATE (FT 3 /MIN) Carolina Cement Reference Coordinate (UTM NAD27) Easting (m) Northing (m) Main Stack (km) (km) Largest SIA (TSP/PM10) 7.8 km GAS TEMP ( 0 F) INVENTORY YEAR DISTANCE (KM) Class Within SIA? (Yes/No) Actual Emissions (TPY) Potential Emissions (TPY)** , SML No SML No 0.43 **Potential Emissions from 11/07 DENR-supplied inventory Page 14 of 22 Printed: 1/20/2011
101 PM10 Off-site Emission Inventory for Carolinas Cement Company, LLC Search Parameters: PM 10 UTM: N km, E km Zone 17 SOURCES UTM: N km, E km Zone 18 Radius: 60 km REGION COUNTY CITY NAME PLANT NAME WIRO Brunswick Leland American Distillation, Inc. WIRO Brunswick Southport Archer Daniels Midland Company WIRO Brunswick Southport Archer Daniels Midland Company WIRO Brunswick Southport Archer Daniels Midland Company WIRO Brunswick Southport Archer Daniels Midland Company WIRO Brunswick Southport Archer Daniels Midland Company WIRO Brunswick Southport Archer Daniels Midland Company WIRO Brunswick Southport Archer Daniels Midland Company WIRO Brunswick Southport Archer Daniels Midland Company WIRO Brunswick Southport Archer Daniels Midland Company WIRO Brunswick Southport Archer Daniels Midland Company WIRO Brunswick Southport Archer Daniels Midland Company WIRO Brunswick Southport Archer Daniels Midland Company WIRO Brunswick Leland Boggs Materials Inc WIRO Brunswick Leland Boggs Materials Inc WIRO Brunswick Leland Carolina Pole Leland, Inc. WIRO Brunswick Leland DAK Americas LLC WIRO Brunswick Leland DAK Americas LLC WIRO Brunswick Leland DAK Americas LLC WIRO Brunswick Leland DAK Americas LLC WIRO Brunswick Leland DAK Americas LLC WIRO Brunswick Leland DAK Americas LLC WIRO Brunswick Leland DAK Americas LLC WIRO Brunswick Leland DAK Americas LLC WIRO Brunswick Leland DAK Americas LLC WIRO Brunswick Leland DAK Americas LLC WIRO Brunswick Leland DAK Americas LLC WIRO Brunswick Leland DAK Americas LLC WIRO Brunswick Leland DAK Americas LLC WIRO Brunswick Leland DAK Americas LLC WIRO Brunswick Leland Malmo Asphalt Plant WIRO Brunswick Leland Malmo Asphalt Plant WIRO Brunswick Southport Primary Energy of North Carolina LLC - Southport Plant WIRO Brunswick Southport Primary Energy of North Carolina LLC - Southport Plant WIRO Brunswick Southport Primary Energy of North Carolina LLC - Southport Plant WIRO Brunswick Southport Primary Energy of North Carolina LLC - Southport Plant WIRO Brunswick Southport Primary Energy of North Carolina LLC - Southport Plant WIRO Brunswick Southport Primary Energy of North Carolina LLC - Southport Plant WIRO Brunswick Southport Primary Energy of North Carolina LLC - Southport Plant WIRO Brunswick Southport Primary Energy of North Carolina LLC - Southport Plant WIRO Brunswick Southport Primary Energy of North Carolina LLC - Southport Plant WIRO Brunswick Southport Progress Energy Carolinas - Brunswick Plant WIRO Brunswick Southport Progress Energy Carolinas - Brunswick Plant WIRO Brunswick Southport Progress Energy Carolinas - Brunswick Plant WIRO Brunswick Southport Progress Energy Carolinas - Brunswick Plant WIRO Brunswick Southport Progress Energy Carolinas - Brunswick Plant WIRO Brunswick Southport Progress Energy Carolinas - Brunswick Plant WIRO Brunswick Leland Ready Mixed Concrete Company - Leland WIRO Brunswick Bolivia S & W Ready Mix Concrete Co. - Bolivia WIRO Brunswick Bolivia S & W Ready Mix Concrete Co. - Bolivia WIRO Brunswick Bolivia S & W Ready Mix Concrete Co. - Bolivia WIRO Brunswick Southport Southport Concrete Corporation WIRO Brunswick Leland Technical Coating International, Inc. WIRO Brunswick Leland Technical Coating International, Inc. WIRO Brunswick Leland Technical Coating International, Inc. WIRO Brunswick Leland Technical Coating International, Inc. WIRO Brunswick Leland Technical Coating International, Inc. WIRO Brunswick Leland Technical Coating International, Inc. WIRO Brunswick Navassa US Marine Navassa WIRO Brunswick Leland Victaulic Company WIRO Columbus Riegelwood Hexion Acme Facility WIRO Columbus Riegelwood Hexion Acme Facility WIRO Columbus Riegelwood Hexion Acme Facility WIRO Columbus Riegelwood International Paper - Riegelwood Mill WIRO Columbus Riegelwood International Paper - Riegelwood Mill WIRO Columbus Riegelwood International Paper - Riegelwood Mill WIRO Columbus Riegelwood International Paper - Riegelwood Mill WIRO Columbus Riegelwood International Paper - Riegelwood Mill WIRO Columbus Riegelwood International Paper - Riegelwood Mill WIRO Columbus Riegelwood International Paper - Riegelwood Mill WIRO Columbus Riegelwood International Paper - Riegelwood Mill WIRO Columbus Riegelwood International Paper - Riegelwood Mill WIRO Columbus Riegelwood International Paper - Riegelwood Mill WIRO Columbus Riegelwood International Paper - Riegelwood Mill WIRO Columbus Riegelwood International Paper - Riegelwood Mill WIRO Columbus Riegelwood International Paper - Riegelwood Mill WIRO Columbus Riegelwood International Paper - Riegelwood Mill WIRO Columbus Riegelwood International Paper - Riegelwood Mill WIRO Columbus Riegelwood International Paper - Riegelwood Mill WIRO Columbus Riegelwood International Paper - Riegelwood Mill WIRO Columbus Riegelwood International Paper - Riegelwood Mill WIRO Columbus Riegelwood International Paper - Riegelwood Mill Allowable Emissions ST (lb/hr) Allowable Emissions LT (lb/hr) Allowable Emissions (<=TPY) ST 20D LT 20D- ST Is TPY>20D? LT Is TPY>20D- Include Source? in Modeling? Allowable Emissions Ref No No No , No No No Permit (PSD avoidance) No No No No No No YES YES YES Permit/calculated YES YES YES YES YES YES YES YES YES YES YES YES YES No No No , No No No Permit/calculated No No No Minor source for PM No No No No No No , No No No No No No Major VOC source (PM is negligible) No No No Major VOC source (PM is negligible) No No No No No No Permit/calculated , YES YES YES Permit/calc/DENR est YES YES YES YES YES YES YES YES YES YES YES YES YES YES YES YES YES YES Page 15 of 22 Printed: 1/20/2011
102 PM10 Off-site Emission Inventory for Carolinas Cement Company, LLC Search Parameters: PM 10 UTM: N km, E km Zone 17 SOURCES UTM: N km, E km Zone 18 Radius: 60 km REGION COUNTY CITY NAME PLANT NAME WIRO Columbus Riegelwood International Paper - Riegelwood Mill WIRO Columbus Riegelwood International Paper - Riegelwood Mill WIRO Columbus Riegelwood International Paper - Riegelwood Mill WIRO Columbus Riegelwood International Paper - Riegelwood Mill WIRO Columbus Riegelwood West Fraser, Inc. - Armour Lumber Mill WIRO Columbus Riegelwood West Fraser, Inc. - Armour Lumber Mill WIRO Columbus Riegelwood West Fraser, Inc. - Armour Lumber Mill WIRO Columbus Riegelwood West Fraser, Inc. - Armour Lumber Mill WIRO Duplin Rose Hill House of Raeford Farms, Inc. - Rose Hill WIRO Duplin Teachey House of Raeford Farms, Inc. - Wallace Division WIRO Duplin Rose Hill Murphy - Brown LLC - Chief Feed Mill WIRO Duplin Rose Hill Murphy - Brown LLC - Chief Feed Mill WIRO Duplin Rose Hill Murphy - Brown LLC - Chief Feed Mill WIRO Duplin Rose Hill Murphy - Brown LLC - Chief Feed Mill WIRO Duplin Rose Hill Murphy - Brown LLC - Chief Feed Mill WIRO Duplin Rose Hill Murphy - Brown LLC - Chief Feed Mill WIRO Duplin Rose Hill Murphy - Brown LLC - Chief Feed Mill WIRO Duplin Rose Hill Murphy - Brown LLC - Chief Feed Mill WIRO Duplin Rose Hill Murphy - Brown LLC - Chief Feed Mill WIRO Duplin Rose Hill Murphy - Brown LLC - Chief Feed Mill WIRO Duplin Rose Hill Murphy - Brown LLC - Chief Feed Mill WIRO Duplin Rose Hill Murphy - Brown LLC - Chief Feed Mill WIRO Duplin Rose Hill Murphy - Brown LLC - Chief Feed Mill WIRO Duplin Rose Hill Murphy - Brown LLC - Chief Feed Mill WIRO Duplin Rose Hill Murphy Milling Company - Register Site WIRO Duplin Rose Hill Murphy Milling Company - Register Site WIRO Duplin Rose Hill Murphy Milling Company - Register Site WIRO Duplin Rose Hill Murphy Milling Company - Register Site WIRO Duplin Rose Hill Murphy-Brown LLC - Rosemary Feed Mill WIRO Duplin Rose Hill Murphy-Brown LLC - Rosemary Feed Mill WIRO Duplin Rose Hill Murphy-Brown LLC - Rosemary Feed Mill WIRO Duplin Rose Hill Murphy-Brown LLC - Rosemary Feed Mill WIRO Duplin Rose Hill Murphy-Brown LLC - Rosemary Feed Mill WIRO Duplin Rose Hill Murphy-Brown LLC - Rosemary Feed Mill WIRO Duplin Rose Hill Murphy-Brown LLC - Rosemary Feed Mill WIRO Duplin Rose Hill Nash Johnson & Sons Farms - Feed Mill WIRO Duplin Rose Hill Nash Johnson & Sons Farms - Feed Mill WIRO Duplin Rose Hill Nash Johnson & Sons Farms - Feed Mill WIRO Duplin Rose Hill Nash Johnson & Sons Farms - Feed Mill WIRO Duplin Rose Hill Nash Johnson & Sons Farms - Feed Mill WIRO Duplin Rose Hill Nash Johnson & Sons Farms - Feed Mill WIRO Duplin Rose Hill Nash Johnson & Sons Farms - Feed Mill WIRO Duplin Rose Hill Nash Johnson & Sons Farms - Feed Mill WIRO Duplin Rose Hill Nash Johnson & Sons Farms - Feed Mill WIRO Duplin Rose Hill Nash Johnson & Sons Farms - Feed Mill WIRO Duplin Rose Hill Nash Johnson & Sons Farms - Feed Mill WIRO Duplin Rose Hill Nash Johnson & Sons Farms - Feed Mill WIRO Duplin Rose Hill Nash Johnson & Sons Farms - Feed Mill WIRO Duplin Rose Hill Nash Johnson & Sons Farms - Feed Mill WIRO Duplin Rose Hill Nash Johnson & Sons Farms - Feed Mill WIRO Duplin Rose Hill Rose Hill Animal Disease Diagnostic Laboratory WIRO Duplin Rose Hill Valley Proteins Inc WIRO New Hanover Wilmington Apex Oil Company, Inc. WIRO New Hanover Wilmington Apex Oil Company, Inc. WIRO New Hanover Castle Hayne Barnhill Contracting Company WIRO New Hanover Wilmington BASF Corporation WIRO New Hanover Wilmington BASF Corporation WIRO New Hanover Wilmington BASF Corporation WIRO New Hanover Wilmington BASF Corporation WIRO New Hanover Wilmington BASF Corporation WIRO New Hanover Wilmington BASF Corporation WIRO New Hanover Wilmington BASF Corporation WIRO New Hanover Wilmington BASF Corporation WIRO New Hanover Wilmington BASF Corporation WIRO New Hanover Wilmington BASF Corporation WIRO New Hanover Wilmington Bradley Creek Pump Station WIRO New Hanover Wilmington Carolina Marine Terminal WIRO New Hanover Wilmington Carolina Marine Terminal WIRO New Hanover Wilmington Carolina Power and Light Company d/b/a Progress Energy Caro WIRO New Hanover Wilmington Carolina Power and Light Company d/b/a Progress Energy Caro WIRO New Hanover Wilmington Carolina Power and Light Company d/b/a Progress Energy Caro WIRO New Hanover Wilmington Carolina Power and Light Company d/b/a Progress Energy Caro WIRO New Hanover Wilmington Carolina Power and Light Company d/b/a Progress Energy Caro WIRO New Hanover Wilmington Carolina Power and Light Company d/b/a Progress Energy Caro WIRO New Hanover Wilmington Carolina Power and Light Company d/b/a Progress Energy Caro WIRO New Hanover Wilmington Carolina Power and Light Company d/b/a Progress Energy Caro WIRO New Hanover Castle Hayne Carolinas Cement Company, LLC WIRO New Hanover Castle Hayne Carolinas Cement Company, LLC WIRO New Hanover Castle Hayne Carolinas Cement Company, LLC WIRO New Hanover Castle Hayne CEMEX, Inc. WIRO New Hanover Castle Hayne CEMEX, Inc. WIRO New Hanover Castle Hayne CEMEX, Inc. Allowable Emissions ST (lb/hr) Allowable Emissions LT (lb/hr) Allowable Emissions (<=TPY) ST 20D LT 20D- ST Is TPY>20D? LT Is TPY>20D- Include Source? in Modeling? YES YES YES YES No No No Permit/calculated , No No No No No No , No No No , No No No , No No No , No No No , No No No , No No No Permit/calculated No No No No YES YES Permit No No No Allowable Emissions Ref No No No No No No , YES YES YES Permit/calculated YES YES YES YES YES YES YES NA As Modified NA. Source location corrected. This is the subject project YES YES YES Permit/DENR WIRO PTE estimate YES YES Page 16 of 22 Printed: 1/20/2011
103 PM10 Off-site Emission Inventory for Carolinas Cement Company, LLC Search Parameters: PM 10 UTM: N km, E km Zone 17 SOURCES UTM: N km, E km Zone 18 Radius: 60 km REGION COUNTY CITY NAME PLANT NAME WIRO New Hanover Castle Hayne CEMEX, Inc. WIRO New Hanover Castle Hayne CEMEX, Inc. WIRO New Hanover Wilmington CEMEX, Inc. WIRO New Hanover Wilmington CEMEX, Inc. WIRO New Hanover Wilmington Container Products Corporation WIRO New Hanover Wilmington Corbett Package Company WIRO New Hanover Wilmington Corning Incorporated WIRO New Hanover Wilmington Corning Incorporated WIRO New Hanover Wilmington Corning Incorporated WIRO New Hanover Wilmington Corning Incorporated WIRO New Hanover Wilmington Corning Incorporated WIRO New Hanover Wilmington Corning Incorporated WIRO New Hanover Wilmington Corning Incorporated WIRO New Hanover Wilmington CTI of NC Inc WIRO New Hanover Wilmington CTI of NC Inc WIRO New Hanover Castle Hayne Elementis Chromium WIRO New Hanover Castle Hayne Elementis Chromium WIRO New Hanover Castle Hayne Elementis Chromium WIRO New Hanover Castle Hayne Elementis Chromium WIRO New Hanover Castle Hayne Elementis Chromium WIRO New Hanover Castle Hayne Elementis Chromium WIRO New Hanover Castle Hayne Elementis Chromium WIRO New Hanover Castle Hayne Elementis Chromium WIRO New Hanover Castle Hayne Elementis Chromium WIRO New Hanover Castle Hayne Elementis Chromium WIRO New Hanover Castle Hayne Elementis Chromium WIRO New Hanover Castle Hayne Elementis Chromium WIRO New Hanover Castle Hayne Elementis Chromium WIRO New Hanover Castle Hayne Elementis Chromium WIRO New Hanover Castle Hayne Elementis Chromium WIRO New Hanover Castle Hayne Elementis Chromium WIRO New Hanover Castle Hayne Elementis Chromium WIRO New Hanover Castle Hayne Elementis Chromium WIRO New Hanover Castle Hayne Elementis Chromium WIRO New Hanover Castle Hayne Elementis Chromium WIRO New Hanover Castle Hayne Elementis Chromium WIRO New Hanover Castle Hayne Elementis Chromium WIRO New Hanover Castle Hayne Elementis Chromium WIRO New Hanover Wilmington Fortron Industries LLC WIRO New Hanover Wilmington Fortron Industries LLC WIRO New Hanover Wilmington Fortron Industries LLC WIRO New Hanover Wilmington Fortron Industries LLC WIRO New Hanover Wilmington Fortron Industries LLC WIRO New Hanover Wilmington Fortron Industries LLC WIRO New Hanover Wilmington Fortron Industries LLC WIRO New Hanover Wilmington General Electric Company WIRO New Hanover Wilmington General Electric Company WIRO New Hanover Wilmington Hess Corporation - Wilmington Terminal WIRO New Hanover Wilmington Hewletts Creek Pump Station WIRO New Hanover Wilmington INVISTA S.a.r.l. WIRO New Hanover Wilmington Invista, S.a.r.l. WIRO New Hanover Wilmington Invista, S.a.r.l. WIRO New Hanover Wilmington Invista, S.a.r.l. WIRO New Hanover Wilmington Invista, S.a.r.l. WIRO New Hanover Wilmington Invista, S.a.r.l. WIRO New Hanover Wilmington Invista, S.a.r.l. WIRO New Hanover Wilmington Invista, S.a.r.l. WIRO New Hanover Wilmington Invista, S.a.r.l. WIRO New Hanover Wilmington Invista, S.a.r.l. WIRO New Hanover Wilmington Invista, S.a.r.l. WIRO New Hanover Wilmington Invista, S.a.r.l. WIRO New Hanover Wilmington Invista, S.a.r.l. WIRO New Hanover Wilmington Invista, S.a.r.l. WIRO New Hanover Wilmington Invista, S.a.r.l. WIRO New Hanover Wilmington Invista, S.a.r.l. WIRO New Hanover Wilmington Invista, S.a.r.l. WIRO New Hanover Wilmington Invista, S.a.r.l. WIRO New Hanover Wilmington Invista, S.a.r.l. WIRO New Hanover Wilmington Invista, S.a.r.l. WIRO New Hanover Wilmington Invista, S.a.r.l. WIRO New Hanover Wilmington Invista, S.a.r.l. WIRO New Hanover Wilmington Invista, S.a.r.l. WIRO New Hanover Wilmington Invista, S.a.r.l. WIRO New Hanover Wilmington Invista, S.a.r.l. WIRO New Hanover Wilmington Invista, S.a.r.l. WIRO New Hanover Wilmington Invista, S.a.r.l. WIRO New Hanover Wilmington Invista, S.a.r.l. WIRO New Hanover Wilmington Invista, S.a.r.l. WIRO New Hanover Wilmington Kinder Morgan, Wilmington WIRO New Hanover Wilmington Kinder Morgan, Wilmington WIRO New Hanover Wilmington Kinder Morgan, Wilmington WIRO New Hanover Wilmington Kinder Morgan, Wilmington Allowable Emissions ST (lb/hr) Allowable Emissions LT (lb/hr) Allowable Emissions (<=TPY) ST 20D LT 20D- ST Is TPY>20D? LT Is TPY>20D- Include Source? in Modeling? Allowable Emissions Ref. YES YES No No No Permit/DENR WIRO PTE estimate No No No No No No No YES YES DENR Inventory PTE (11/07) YES YES YES YES YES YES No No No Permit/calculated (PM10) YES YES YES Permit/calculated (PM10) YES YES YES YES YES YES YES YES YES YES YES YES YES YES YES YES YES YES YES YES YES YES No No No Permit/calculated No YES YES Permit/synthetic minor limit YES No No No No No No No No No Permit/calculated , YES YES YES Permit/calculated YES YES YES YES YES YES YES YES YES YES YES YES YES YES YES YES YES YES YES YES YES YES YES YES YES YES YES No No No Page 17 of 22 Printed: 1/20/2011
104 PM10 Off-site Emission Inventory for Carolinas Cement Company, LLC Search Parameters: PM 10 UTM: N km, E km Zone 17 SOURCES UTM: N km, E km Zone 18 Radius: 60 km REGION COUNTY CITY NAME PLANT NAME WIRO New Hanover Wilmington Kinder Morgan, Wilmington WIRO New Hanover Wilmington Louisiana-Pacific Corporation WIRO New Hanover Wilmington Louisiana-Pacific Corporation WIRO New Hanover Wilmington Louisiana-Pacific Corporation WIRO New Hanover Wilmington Louisiana-Pacific Corporation WIRO New Hanover Wilmington Louisiana-Pacific Corporation WIRO New Hanover Wilmington Louisiana-Pacific Corporation WIRO New Hanover Wilmington Louisiana-Pacific Corporation WIRO New Hanover Wilmington Louisiana-Pacific Corporation WIRO New Hanover Wilmington Louisiana-Pacific Corporation WIRO New Hanover Wilmington Louisiana-Pacific Corporation WIRO New Hanover Wilmington Louisiana-Pacific Corporation WIRO New Hanover Wilmington Louisiana-Pacific Corporation WIRO New Hanover Wilmington Louisiana-Pacific Corporation WIRO New Hanover Wilmington Louisiana-Pacific Corporation WIRO New Hanover Wilmington MeadWestvaco Packaging Systems, LLC WIRO New Hanover Wilmington MeadWestvaco Packaging Systems, LLC WIRO New Hanover Wilmington MeadWestvaco Packaging Systems, LLC WIRO New Hanover Wilmington National Gypsum Company WIRO New Hanover Wilmington National Gypsum Company WIRO New Hanover Wilmington National Gypsum Company WIRO New Hanover Wilmington National Gypsum Company WIRO New Hanover Wilmington National Gypsum Company WIRO New Hanover Wilmington National Gypsum Company WIRO New Hanover Wilmington National Gypsum Company WIRO New Hanover Wilmington National Gypsum Company WIRO New Hanover Wilmington National Gypsum Company WIRO New Hanover Wilmington National Gypsum Company WIRO New Hanover Wilmington National Gypsum Company WIRO New Hanover Wilmington National Gypsum Company WIRO New Hanover Wilmington National Gypsum Company WIRO New Hanover Wilmington New Hanover County WASTEC WIRO New Hanover Wilmington New Hanover County WASTEC WIRO New Hanover Wilmington New Hanover County WASTEC WIRO New Hanover Wilmington New Hanover County WASTEC WIRO New Hanover Wilmington NuStar Asphalt Refining, LLC WIRO New Hanover Wilmington NuStar Asphalt Refining, LLC WIRO New Hanover Castle Hayne Oldecastle - Adams Products Company WIRO New Hanover Wilmington Ready Mixed Concrete Company - Wilmington WIRO New Hanover Wilmington S & G Prestress Company WIRO New Hanover Castle Hayne S & W Ready Mix Concrete - Castle Hayne WIRO New Hanover Wilmington S & W Ready Mix Concrete Co - Wilmington Plant WIRO New Hanover Wilmington S & W Ready Mix Concrete Co - Wilmington Plant WIRO New Hanover Wilmington Southern States Chemical WIRO New Hanover Wilmington Southern States Chemical WIRO New Hanover Wilmington Vopak Terminal WIRO New Hanover Wilmington Vopak Terminal WIRO New Hanover Wilmington Vopak Terminal South Wilmington WIRO New Hanover Wilmington Wilbara, LLC WIRO New Hanover Wilmington Wilmington Materials Allowable Emissions ST (lb/hr) Allowable Emissions LT (lb/hr) Allowable Emissions (<=TPY) ST 20D LT 20D- ST Is TPY>20D? LT Is TPY>20D- Include Source? in Modeling? No No No Allowable Emissions Ref No No No Permit-Minor PM from printing No No No Permit (synthetic minor) No No No Permit/calculated No No No Permit/calculated No YES YES DENR WIRO PTE estimate No YES YES Calculated (AP-42) No No No No YES YES DENR Conc Batch Plant spreadsheet No No No Calculated (AP-42) No No No Permit/calculated No No No Permit/calculated No No No No No No Source Added: Permit, DAQ PD No No No NA NA NA NA NA NA NA No Note source excluded because distance exceeds 50km + SIA Page 18 of 22 Printed: 1/20/2011
105 PM10 Off-site Emission Inventory for Carolinas Cement Company, LLC Search Parameters: PM 10 UTM: N km, E km Zone 17 SOURCES UTM: N km, E km Zone 18 Radius: 60 km REGION COUNTY CITY NAME PLANT NAME WIRO Onslow Richlands Martin Marietta Materials, Inc., - Onslow Quarry WIRO Onslow Jacksonville Mine Safety Appliances WIRO Onslow Jacksonville Mine Safety Appliances WIRO Onslow Jacksonville Mine Safety Appliances WIRO Onslow Jacksonville Ready Mixed Concrete Company - Jacksonville WIRO Onslow Jacksonville Ready Mixed Concrete Company - Jacksonville WIRO Onslow Jacksonville Ready Mixed Concrete Company - Jacksonville WIRO Onslow Jacksonville S & W Ready Mix Concrete - Jacksonville WIRO Onslow Jacksonville S & W Ready Mix Concrete - Jacksonville WIRO Onslow Holly Ridge S & W Ready Mix Concrete Co - Holly Ridge WIRO Onslow Holly Ridge S & W Ready Mix Concrete Co - Holly Ridge WIRO Onslow Holly Ridge S & W Ready Mix Concrete Co - Holly Ridge WIRO Onslow Holly Ridge S & W Ready Mix Concrete Co - Holly Ridge WIRO Pender Rocky Point Del Laboratories, Inc. WIRO Pender Rocky Point Del Laboratories, Inc. WIRO Pender Rocky Point Del Laboratories, Inc. WIRO Pender Rocky Point H & P Wood Turnings, Inc. WIRO Pender Rocky Point Martin Marietta Materials, Inc. - Rocky Point WIRO Pender Hampstead Ready Mixed Concrete Company - Scotts Hill WIRO Pender St Helena S & W Ready Mix Concrete Co. - St. Helena Allowable Emissions ST (lb/hr) Allowable Emissions LT (lb/hr) Allowable Emissions (<=TPY) ST 20D LT 20D- ST Is TPY>20D? LT Is TPY>20D- Include Source? in Modeling? , , No No No , No No No , , No No No , , No No No No No No Allowable Emissions Ref No YES YES DAQ air permit review YES YES No No No DAQ air permit review No YES YES DENR WIRO PTE estimate No YES YES Calculated/permit file No No No Page 19 of 22 Printed: 1/20/2011
106 PM10 Off-site Emission Inventory for Carolinas Cement Company, LLC Search Parameters: PM 10 UTM: N km, E km Zone 17 SOURCES UTM: N km, E km Zone 18 Radius: 60 km REGION COUNTY CITY NAME PLANT NAME WIRO Pender Burgaw Windsor Fiberglass, Inc. FRO Sampson Harrells Coastal Plains Pork, LLC * Release Point Types: 01 - FUGITIVE (NO STACK) 02 - VERTICAL STACK 03 - HORIZONTAL STACK 04 - GOOSE NECK STACK 05 - VERTICAL STACK WITH RAIN CAP 06 - DOWNWARD-FACING VENT Caveat: In order to split out emissions per release point, the total emissions per operating scenario were back calculated and split ba quantification of % emissions through each release point. The values are only as good as the recorded data for % of emissions alloca release point. Allowable Emissions ST (lb/hr) Allowable Emissions LT (lb/hr) Allowable Emissions (<=TPY) ST 20D LT 20D- ST Is TPY>20D? LT Is TPY>20D- Include Source? in Modeling? No No No No No No Allowable Emissions Ref. Page 20 of 22 Printed: 1/20/2011
107 PSD Inventory for Carolinas Cement Company, LLC REGION COUNTY COMPANY PERMIT POLLUTANT TONS/YR LBS/HR TRIGGER DATE FAYETTEVILLE BLADEN BCH ENERGY CORPORATION 7351R01 TSP 0 13-May-94 FAYETTEVILLE BLADEN BROWN & ROOT, INC. 8583R00 TSP May-98 FAYETTEVILLE BLADEN BROWN & ROOT, INC. - TARHEEL 8583R01 TSP 0 24-Jul-98 FAYETTEVILLE BLADEN BROWN'S OF CAROLINA 8155R00 TSP 16.9 FAYETTEVILLE BLADEN CAROLINA FOOD PROCESSORS, INC. 7221R00 TSP 8.4 FAYETTEVILLE BLADEN CLARKTON COTTON CO. 7070R01 TSP 7.7 FAYETTEVILLE BLADEN COGENTRIX OF N.C. 5455R00 TSP 12 FAYETTEVILLE BLADEN COGENTRIX OF NC, KENANSVILLE 5492R00 TSP 121 FAYETTEVILLE BLADEN CROWELL CONSTRUCTORS, INC. 2817R06 TSP -105 FAYETTEVILLE BLADEN PEANUT PROCESSORS, INC. 7877R00 TSP Dec-94 FAYETTEVILLE BLADEN S.T. WOOTEN CORP.-ASPHALT PLT. NO R00 TSP Aug-96 FAYETTEVILLE BLADEN SOUTHERN PEANUT COMPANY, INC. 1973R06 TSP 1.5 FAYETTEVILLE SAMPSON K&K DIMENSIONS, CLINTON 4426R00 TSP 8.0 FAYETTEVILLE SAMPSON KEENER LUMBER, CLINTON 4583R00 TSP 1.07 FAYETTEVILLE SAMPSON KEENER LUMBER, CLINTON 4583R01 TSP 1.07 WILMINGTON BRUNSWICK ARCHER DANIELS MIDLAND CO. 2502R12 TSP Sep-93 WILMINGTON BRUNSWICK ARCHER DANIELS MIDLAND COMPANY 2502R15 TSP Jun-97 WILMINGTON BRUNSWICK BOGGS MATERIALS, INC. 8833R00 TSP Feb-00 WILMINGTON BRUNSWICK CAPE FEAR CONCRETE 9592R00 TSP 7 19-Jan-06 WILMINGTON BRUNSWICK COGENTRIX OF N.C. 5884R00 TSP 3.6 WILMINGTON BRUNSWICK DUPONT 3033R05 TSP 1.4 WILMINGTON BRUNSWICK DUPONT 3033R06 TSP 5.9 WILMINGTON BRUNSWICK DUPONT 3033R19 TSP 3.2 WILMINGTON BRUNSWICK DUPONT, PHOENIX 4276R02 TSP? WILMINGTON BRUNSWICK ESTECH GENERAL CHEMICALS CORP., NAV 188R04 TSP? WILMINGTON BRUNSWICK GENERAL WOOD PRESERVING, LELAND 3753R02 TSP 10.1 WILMINGTON BRUNSWICK GENERAL WOOD PRESERVING, LELAND 3753R04 TSP 17.6 WILMINGTON BRUNSWICK IKE WILLIAMSON SAND PIT, ACB 9826R00 TSP 9 26-Sep-07 WILMINGTON BRUNSWICK MALMO ASPHALT PLANT 8716R00 TSP Mar-99 WILMINGTON BRUNSWICK MARTIN MARIETTA AGGREGATES 7648R00 TSP Apr-94 WILMINGTON BRUNSWICK MARTIN MARIETTA AGGREGATES 7846R00 TSP Mar-95 WILMINGTON BRUNSWICK PFIZER, SOUTHPORT 2502R03 TSP 1.2 WILMINGTON BRUNSWICK PFIZER, SOUTHPORT 2502R05 TSP 2.4 WILMINGTON BRUNSWICK STANDARD PRODUCTS, SOUTHPORT 2468R05 TSP WILMINGTON COLUMBUS ALSCO 7694R00 TSP Feb-94 WILMINGTON COLUMBUS ALSCO 7694R01 TSP Apr-94 WILMINGTON COLUMBUS DICKERSON CAROLINA, INC. 6682R00 TSP 14.6 WILMINGTON COLUMBUS FACET GLAS, INC. 6102R00 TSP 1.2 WILMINGTON COLUMBUS FEDERAL PAPER BOARD 2248R8 TSP 10 WILMINGTON COLUMBUS FEDERAL PAPER BOARD 3441R09 TSP? WILMINGTON COLUMBUS GEORGIA PACIFIC CORP. 7R09 TSP WILMINGTON COLUMBUS J L POWELL & COMPANY, INC. 9579R00 TSP 2 15-Dec-05 WILMINGTON COLUMBUS PRIDGEN CABINET WORKS, INC. 8116R00 TSP 1.1 WILMINGTON COLUMBUS WHITEVILLE PLYWOOD CO., INC. 946R04 TSP 2.7 WILMINGTON COLUMBUS WHITEVILLE PLYWOOD CO., INC. 946R07 TSP 2.4 WILMINGTON COLUMBUS WRIGHT CHEMICAL CORP. 1394R06 TSP 13.5 WILMINGTON COLUMBUS WRIGHT CHEMICAL CORP. 1394R08 TSP -1.3 WILMINGTON DUPLIN CARGILL, INC. 8189R00 TSP Sep-95 WILMINGTON DUPLIN CARROLL'S FOODS, WARSAW 2897R02 TSP 8.36 WILMINGTON DUPLIN CARROLL'S FOODS, WARSAW 2897R12 TSP Oct-94 WILMINGTON DUPLIN COGENTRIX OF NC, KENANSVILLE 5492R00 TSP 12 WILMINGTON DUPLIN FUSSELL LIME & ROCK CO., INC. 2947R04 TSP 34.8 WILMINGTON DUPLIN GUILFORD EAST, KENANSVILLE 2484R02 TSP 6.10 WILMINGTON DUPLIN GUILFORD MILLS, INC. 2484R05 TSP WILMINGTON DUPLIN GUILFORD MILLS, INC. 2484R06 TSP Dec-93 WILMINGTON DUPLIN J.P. STEVENS, WACE 3148R02 TSP WILMINGTON DUPLIN MURPHY FAMILY FARMS 8462R00 TSP Mar-98 WILMINGTON DUPLIN MURPHY FARMS, INC. 5516R03 TSP 1.0 WILMINGTON DUPLIN MURPHY FARMS, INC. 7796R01 TSP 1.0 WILMINGTON DUPLIN MURPHY FARMS, MT. OLIVE I 8469R00 TSP Apr-98 WILMINGTON DUPLIN ROSE HILL ANIMAL DISEASE DIAG. LAB 6210R02 TSP NEG 04-Nov-94 WILMINGTON DUPLIN STEVCOKNIT FABRICS COMPANY, INC. 3148R12 TSP Jun-97 WILMINGTON DUPLIN VEY PROTEINS, INC. 5127R10 TSP Nov-95 WILMINGTON NEW HANOVER AMERICAN COAL, WILMINGTON 4696R00 TSP WILMINGTON NEW HANOVER CAPE INDUSTRIES 130R10 TSP NEG WILMINGTON NEW HANOVER CAPE INDUSTRIES 130R15 TSP -2.4 WILMINGTON NEW HANOVER CAPE INDUSTRIES 164R09 TSP 3.8 WILMINGTON NEW HANOVER CAROLINA MARINE TERMINAL 9210R01 TSP May-05 WILMINGTON NEW HANOVER CORNING GLASS, WILMINGTON 3809? TSP 2.45 WILMINGTON NEW HANOVER CORNING INCORPORATED 3809R15 TSP Jan-94 WILMINGTON NEW HANOVER CORNING INCORPORATED 3809R19 TSP 10.1 WILMINGTON NEW HANOVER CORNING INCORPORATED 3809R30 TSP Apr-00 WILMINGTON NEW HANOVER CORNING INCORPORATED 3809R32 TSP Feb-01 WILMINGTON NEW HANOVER CORNING INCORPORATED 3809R33 TSP Jun-01 WILMINGTON NEW HANOVER CP&L - SUTTON 1318R10 TSP Mar-95 WILMINGTON NEW HANOVER CP&L - SUTTON 1318R11 TSP 3.05 WILMINGTON NEW HANOVER DEPOORTERE CORP., WILMINGTON 4473R01 TSP -1.3 WILMINGTON NEW HANOVER DIAMOND SHAMROCK 2937R12 TSP WILMINGTON NEW HANOVER DICKERSON CAROLINA INC. 2905R06 TSP 14.6 WILMINGTON NEW HANOVER DICKERSON INC., WILMINGTON 4582R03 TSP WILMINGTON NEW HANOVER EASTERN PORTLAND CEMENT, WILMINGTON 5860R00 TSP WILMINGTON NEW HANOVER FORTRON INDUSTRIES 7323R01 TSP WILMINGTON NEW HANOVER GANG NAIL, WILMINGTON 5572R00 TSP 7.25 WILMINGTON NEW HANOVER GENERAL ELECTRIC CO., WILMINGTON 1756R04 TSP 1.50 Page 21 of 22 Printed: 1/20/2011
108 PSD Inventory for Carolinas Cement Company, LLC REGION COUNTY COMPANY PERMIT POLLUTANT TONS/YR LBS/HR TRIGGER DATE WILMINGTON NEW HANOVER GENERAL ELECTRIC CO., WILMINGTON 1756R08 TSP 2.6 WILMINGTON NEW HANOVER GOLD BOND BUILDING PRODUCTS 3725RR4 TSP WILMINGTON NEW HANOVER HERCOFINA, WILMINGTON 130R03 TSP? WILMINGTON NEW HANOVER HERCOFINA, WILMINGTON 130R53 TSP -102 WILMINGTON NEW HANOVER INDUSTRIAL AND MARINE SANDBLASTING 4607R00 TSP WILMINGTON NEW HANOVER JAMES A. LOUGHLIN WWTP (AKA NORTHSIDE WWTP) 9541R00 TSP 3 18-Oct-05 WILMINGTON NEW HANOVER KOCH SULFUR PRODUCTS CO., WILMINGTON 4548R02 TSP WILMINGTON NEW HANOVER KREIDO BIOFUELS, INC. 9842R00 TSP 1 14-Dec-07 WILMINGTON NEW HANOVER LOUISIANA-PACIFIC CORP. 5572R05 TSP Mar-94 WILMINGTON NEW HANOVER MATERIAL SALVAGE & RECYCLING, INC. 8943R00 TSP Jun-01 WILMINGTON NEW HANOVER MITEX WOOD PRODUCTS 5572R02 TSP 6.3 WILMINGTON NEW HANOVER NC STATE PORTS AUTHORITY 4683R00 TSP WILMINGTON NEW HANOVER NC STATE PORTS AUTHORITY 4683R01 TSP WILMINGTON NEW HANOVER NC STATE PORTS AUTHORITY 4683R11 TSP Mar-94 WILMINGTON NEW HANOVER NEW HANOVER COUNTY STEAM PLANT 5151R00 TSP 29.2 WILMINGTON NEW HANOVER NEW HANOVER COUNTY STEAM PLANT 5151R02 TSP 11.4 WILMINGTON NEW HANOVER NEW HANOVER REGIONAL MEDICAL CENTER 9671R00 TSP 1 25-Aug-06 WILMINGTON NEW HANOVER OCCIDENTAL CHEMICAL 2937R20 TSP -6.9 WILMINGTON NEW HANOVER PORT CITY CONCRETE, LLC 9841R00 TSP 1 25-Oct-07 WILMINGTON NEW HANOVER ROYAL STATE CONSTRUCTION, BOLIVIA 4483R00 TSP WILMINGTON NEW HANOVER S & G PRESTRESS CO. 7778R00 TSP 1 27-Jul-94 WILMINGTON NEW HANOVER S.T. WOOTEN CORPORATION 9567R00 TSP Oct-05 WILMINGTON NEW HANOVER S.T. WOOTEN CORPORATION 9683R00 TSP 1 27-Sep-06 WILMINGTON NEW HANOVER SOUTHERN EQUIPMENT CO., INC. DBA WILMINGTON CEMENT 9824R00 TSP 1 18-Oct-07 WILMINGTON NEW HANOVER TAKEDA CHEM PRODUCTS, USA, INC. 5591R04 TSP 12.9 WILMINGTON NEW HANOVER TAKEDA CHEM PRODUCTS, USA, INC. 5591R05 TSP 8.1 WILMINGTON NEW HANOVER TAKEDA CHEM PRODUCTS, USA, INC. 5591R11 TSP 14.0 WILMINGTON NEW HANOVER VERIZON WIRELESS - JORDAN G00 TSP Jul-04 WILMINGTON NEW HANOVER WILMINGTON FERTILIZER CO. 5144R01 TSP WILMINGTON NEW HANOVER WILMINGTON SAND & GRAVEL CO. 5144R03 TSP 3.3 WILMINGTON ONSLOW MARINE BASE, CAMP LEJEUNE 4641R00 TSP WILMINGTON ONSLOW MARINE BASE, CAMP LEJEUNE 4641R01 TSP WILMINGTON ONSLOW MARINE BASE, CAMP LEJEUNE 4645R00 TSP WILMINGTON ONSLOW U.S. NAVAL REG MED, CAMP LEJEUNE 4663R00 TSP WILMINGTON ONSLOW U.S. NAVAL REG MED, CAMP LEJEUNE 4663R01 TSP 13.5 WILMINGTON PENDER ADAMS CONSTRUCTION CO. 7321R00 TSP 6.0 WILMINGTON PENDER BURGAW LUMBER, ROCKY POINT 4624R00 TSP Page 22 of 22 Printed: 1/20/2011
109 Carolinas Cement Company OFF-SITE SOURCES TO BE INCLUDED IN CUMULATIVE MODELING Plant Name Location Distance NO2 Sources km NAAQS Elementis Chromium Castle Hayne 1.86 X Barnhill Contracting Co. Castle Hayne 6.27 X Global Nuclear Fuel - Americas, LLC Wilmington 9.65 X Wilbara, LLC Wilmington X Corning Inc. Wilmington X Invista, S.a.r.l. (00164) Wilmington X Fortron Industries LLC Wilmington X New Hanover Co. WASTEC Wilmington X Southern States Chemical Wilmington X Kinder Morgan, Wilmington Wilmington X CP&L Progress Energy - Sutton Plant Wilmington X American Distillation, Inc. Brunswick Co X DAK Americas LLC Brunswick Co X International Paper - Riegelwood Mill Columbus Co X EPCOR USA North Carolina LLC - Southport Plant Brunswick Co X CCC NOx 20D Analysis xls 1 of 8
110 NO x Off-site Emission Inventory for Titan America FINAL SOURCE LIST (SORTED BY DISTANCE) Model ID COUNTY PLANT NAME PERMIT # POLLU- TANT Allowable Emissions ST (lb/hr) Max Normal Emissions (lb/hr) 1 Allowable Emissions LT (tpy) 2 UTM EAST UTM NORTH New Hanover Elementis Chromium NOx , , EP , New Hanover Elementis Chromium NOx , EP , New Hanover Barnhill Contracting Company NOx , RP1 Asphalt Plant , New Hanover Global Nuclear Fuel - Americas, LLC NOx , Incinerator Stack , New Hanover Global Nuclear Fuel - Americas, LLC NOx , ERP-S , New Hanover Global Nuclear Fuel - Americas, LLC NOx , ERP-S , New Hanover Global Nuclear Fuel - Americas, LLC NOx , ERP-S , New Hanover Wilbara, LLC NOx , Sulfuric acid plant stack , New Hanover Corning Incorporated NOx , a , New Hanover Corning Incorporated NOx , , New Hanover Corning Incorporated NOx , , New Hanover Corning Incorporated NOx , , New Hanover Corning Incorporated NOx , , New Hanover Corning Incorporated NOx , , New Hanover Corning Incorporated NOx , HB New Hanover Corning Incorporated NOx , EPG , New Hanover Invista, S.a.r.l NOx , , B HTR , New Hanover Invista, S.a.r.l NOx , B , New Hanover Invista, S.a.r.l NOx , BLR1EP , New Hanover Invista, S.a.r.l NOx , BLR4EP , New Hanover Invista, S.a.r.l NOx , BLR5EP , New Hanover Invista, S.a.r.l NOx , HTR , New Hanover Invista, S.a.r.l NOx , HTR , New Hanover Invista, S.a.r.l NOx , HTR , New Hanover Invista, S.a.r.l NOx , TO , New Hanover Invista, S.a.r.l NOx , G New Hanover Fortron Industries LLC NOx , ERP-FU-081 Boiler , New Hanover Fortron Industries LLC NOx , Thermal Oxidizer Stack , , New Hanover Fortron Industries LLC NOx , MS-726 Generator , New Hanover Fortron Industries LLC NOx , MS-2726 Generator New Hanover New Hanover County WASTEC NOx , EP , New Hanover New Hanover County WASTEC NOx , EP , New Hanover New Hanover County WASTEC NOx , EP , New Hanover Southern States Chemical NOx , ES1/2 Sulfuric Acid Plant , New Hanover Kinder Morgan, Wilmington NOx , Boiler , New Hanover Kinder Morgan, Wilmington NOx , Boiler Stack New Hanover Kinder Morgan, Wilmington NOx , Boiler Stack New Hanover Kinder Morgan, Wilmington NOx , Boiler Stack New Hanover Carolina Power and Light Company d/b/a Pro NOx , , , IC TURBINE 1 STACK , New Hanover Carolina Power and Light Company d/b/a Pro NOx , IC TURBINE 2A STACK , New Hanover Carolina Power and Light Company d/b/a Pro NOx , IC TURBINE 2B STACK , New Hanover Carolina Power and Light Company d/b/a Pro NOx 4, , UNIT 1 & 2 STACK ,039, New Hanover Carolina Power and Light Company d/b/a Pro NOx 8, , Unit 3 stack ,484, New Hanover Carolina Power and Light Company d/b/a Pro NOx , Turbine ,403, , New Hanover Carolina Power and Light Company d/b/a Pro NOx , Turbine ,403, , New Hanover Carolina Power and Light Company d/b/a Pro NOx , AB1, DPH1, DPH2, FWP ,484, Brunswick American Distillation, Inc NOx , ERP-200 Boiler , Brunswick DAK Americas LLC NOx , , ES , Columbus International Paper - Riegelwood Mill NOx 1, , , , RB5 Recovery Boiler , Brunswick EPCOR USA North Carolina LLC - Southport NOx , , Unit 1 stack , UTM ZONE STACK 3 RELEASE PT TYPE 4 HT (FT) DIAM (FT) EXITVEL (FT/SEC) FLOW RATE (FT3/MIN) GAS TEMP (0F) DISTANCE (KM) NOTES: 1 Maximum normal emissions provided on a facility-wide basis (not used in modeling) 2 Long-term allowable emissions provided on a facility-wide basis 3 All stacks are included for sources inside the SIA. For sources outside the SIA, the dominant or most representative stack is used for modeling the total of each facility's emissions. 4 Release Point Types: 01 - FUGITIVE (NO STACK) 02 - VERTICAL STACK Page 2 of 8 Printed: 2/24/2011
111 NO x Off-site Emission Inventory for Titan America Search Parameters: NO X UTM: N km, E km Zone 17 SOURCES UTM: N km, E km Zone 18 Radius: 60 km REGION COUNTY CITY NAME PLANT NAME PERMIT # REV# UTM EAST UTM NORTH UTM ZONE FRO Bladen Riegelwood Lower Cape Fear Water & Sewer Authority - Kings Bluff G , ERP-Gen1 Exhaust for gen NOx WIRO Brunswick Leland American Distillation, Inc R , ERP-200 BOILER 200 STACK 3.67 NOx , WIRO Brunswick Leland Carolina Pole Leland, Inc R , ERP1 Stack for boiler NOx , WIRO Brunswick Leland DAK Americas LLC T , ES-01 vertical NOx , WIRO Brunswick Leland DAK Americas LLC T , ES-02 vertical NOx , WIRO Brunswick Leland DAK Americas LLC T , ES vertical NOx , WIRO Brunswick Leland DAK Americas LLC T , ES vertical NOx , WIRO Brunswick Leland DAK Americas LLC T , ES vertical NOx , WIRO Brunswick Leland ExxonMobil Chemical Company R , Generator stack Generator stack 0.02 NOx , WIRO Brunswick Leland Malmo Asphalt Plant R , EP1 Baghouse on Drum Mixer 2.53 NOx , WIRO Brunswick Leland Malmo Asphalt Plant R , IEP4 One No. 2 Fuel Oil-Fired Asphalt Tank 0.63 NOx WIRO Brunswick Leland Technical Coating International, Inc T , EP-1 EP NOx , WIRO Brunswick Leland Technical Coating International, Inc T , EP-2 EP NOx , WIRO Brunswick Leland Technical Coating International, Inc T , EP-2A EP-2A 0.04 NOx , WIRO Brunswick Leland Technical Coating International, Inc T , EP-3 EP NOx , WIRO Brunswick Leland Technical Coating International, Inc T , EP-3A EP-3A 0.04 NOx , WIRO Brunswick Leland Technical Coating International, Inc T , EP-4 EP NOx , WIRO Brunswick Leland Victaulic Company R , Rubber Process exhaust from rubber curing ovens 1.38 NOx WIRO Brunswick Southport Archer Daniels Midland Company T , & 22 turbines w/ steam inj 2.70 NOx , WIRO Brunswick Southport Archer Daniels Midland Company T , ep-48 diesel emer gen 0.86 NOx WIRO Brunswick Southport EPCOR USA North Carolina LLC - Southport Plant T , Unit 1 stack NOx , WIRO Brunswick Southport EPCOR USA North Carolina LLC - Southport Plant T , Unit 2 stack NOx , WIRO Brunswick Southport EPCOR USA North Carolina LLC - Southport Plant T , fire pump Fire Pump Stack 0.14 NOx WIRO Brunswick Southport Progress Energy Carolinas - Brunswick Plant R , AUX B Auxboiler Stack 0.25 NOx , WIRO Brunswick Southport Progress Energy Carolinas - Brunswick Plant R , GEN A Emergency Diesel Generator A 3.50 NOx , WIRO Brunswick Southport Progress Energy Carolinas - Brunswick Plant R , GEN B Emergency Diesel Generator B 3.50 NOx , WIRO Brunswick Southport Progress Energy Carolinas - Brunswick Plant R , GEN C Emergency Diesel Generator C 3.50 NOx , WIRO Brunswick Southport Progress Energy Carolinas - Brunswick Plant R , GEN D Emergency Diesel Generator D 3.50 NOx , WIRO Brunswick Southport Progress Energy Carolinas - Brunswick Plant R , GEN E Emergency Diesel Generator E 0.15 NOx , WIRO Brunswick Southport Progress Energy Carolinas - Brunswick Plant R , SAMG-DG1 Temporary Emergency Diesel Engine G 0.01 NOx , WIRO Brunswick Southport Progress Energy Carolinas - Brunswick Plant R , SAMG-DG2 Temporary Emergency Diesel Engine G 0.01 NOx , WIRO Brunswick Southport Progress Energy Carolinas - Brunswick Plant R , U-FIREPUMP 255hp Diesel Fire Pump Engine 0.02 NOx , WIRO Columbus Riegelwood Hexion Acme Facility T , boiler NOx , WIRO Columbus Riegelwood Hexion Acme Facility T , b hex cat ox NOx , WIRO Columbus Riegelwood International Paper - Riegelwood Mill R , J fugitive NOx WIRO Columbus Riegelwood International Paper - Riegelwood Mill R , K4001 vertical NOx , WIRO Columbus Riegelwood International Paper - Riegelwood Mill R , LK3 Vertical 3.65 NOx , WIRO Columbus Riegelwood International Paper - Riegelwood Mill R , PB1 vertical 1.34 NOx , WIRO Columbus Riegelwood International Paper - Riegelwood Mill R , pb2 vertical NOx , WIRO Columbus Riegelwood International Paper - Riegelwood Mill R , PB5 Vert NOx , WIRO Columbus Riegelwood International Paper - Riegelwood Mill R , PCK B 2 Package Boiler NOx , WIRO Columbus Riegelwood International Paper - Riegelwood Mill R , PKGB 1 Package Boiler NOx , WIRO Columbus Riegelwood International Paper - Riegelwood Mill R , RB4A RB4A NOx , WIRO Columbus Riegelwood International Paper - Riegelwood Mill R , RB4B RB4A NOx , WIRO Columbus Riegelwood International Paper - Riegelwood Mill R , RB5 vertical NOx , WIRO Columbus Riegelwood International Paper - Riegelwood Mill R , ST3 vertical 3.68 NOx , WIRO Columbus Riegelwood International Paper - Riegelwood Mill R , ST4 vertical 3.68 NOx , WIRO Columbus Riegelwood International Paper - Riegelwood Mill R , ST5a vertical 3.68 NOx , WIRO Columbus Riegelwood International Paper - Riegelwood Mill R , ST5b vertical 3.68 NOx , WIRO Columbus Riegelwood West Fraser, Inc. - Armour Lumber Mill T , C1-1 verical w/cap NOx , STACK NO. STACK DESC ACTUAL EMISSIONS (TONS) POLLUTANT * RELEASE PT TYPE HT (FT) DIAM (FT) EXITVEL (FT/SEC) FLOW RATE (FT 3 /MIN) WIRO Duplin Rose Hill House of Raeford Farms, Inc. - Rose Hill R , ES-2 Boiler Stack 3.31 NOx , WIRO Duplin Rose Hill Murphy - Brown LLC - Chief Feed Mill R , RP11 Boiler 4.53 NOx , WIRO Duplin Rose Hill Murphy - Brown LLC - Chief Feed Mill R , RP12 Boiler 4.53 NOx , WIRO Duplin Rose Hill Murphy - Brown LLC - Chief Feed Mill R , RP15S kw generator 0.80 NOx , WIRO Duplin Rose Hill Murphy - Brown LLC - Chief Feed Mill R , RP15S kw generator 0.76 NOx , WIRO Duplin Rose Hill Murphy Milling Company - Register Site R , ERP-4 Column Dryer 0.05 NOx WIRO Duplin Rose Hill Murphy-Brown LLC - Rosemary Feed Mill R , RP01R No.2 oil-fired boiler 3.61 NOx , WIRO Duplin Rose Hill Murphy-Brown LLC - Rosemary Feed Mill R , RP11 Back-up boiler 0.40 NOx , WIRO Duplin Rose Hill Nash Johnson & Sons Farms - Feed Mill R , B1 Boiler Stack # NOx , WIRO Duplin Rose Hill Nash Johnson & Sons Farms - Feed Mill R , B2 Boiler Stack # NOx , WIRO Duplin Rose Hill Rose Hill Animal Disease Diagnostic Laboratory R , RP-INC-1 Incinerator release point 0.01 NOx , WIRO Duplin Rose Hill Valley Proteins Inc T , EP1-6 GROUPED PROCESS VENTS NOx , WIRO Duplin Teachey House of Raeford Farms, Inc. - Wallace Division R , ERP-1 One stack for both boilers 2.11 NOx , WIRO New Hanover Castle Hayne Barnhill Contracting Company R , RP1 Bag house stack, on 425 TPH Asphalt p 8.06 NOx , WIRO New Hanover Castle Hayne Elementis Chromium T , EP101 EP NOx , WIRO New Hanover Castle Hayne Elementis Chromium T , EP127 EP NOx , WIRO New Hanover Wilmington Apex Oil Company, Inc R , ESH1 One No. 2 fuel-oil-fired hot-oil heater (ID 1.00 NOx , WIRO New Hanover Wilmington Apex Oil Company, Inc R , ESH2 One No. 2 fuel-oil-fired hot-oil steam bo 1.00 NOx , WIRO New Hanover Wilmington Bradley Creek Pump Station R , ERP-1 Generator Stack 0.41 NOx , Page 3 of 8 Printed: 2/24/2011
112 REGION COUNTY CITY NAME PLANT NAME PERMIT # REV# NO x Off-site Emission Inventory for Titan America UTM EAST UTM NORTH UTM ZONE WIRO New Hanover Wilmington Carolina Power and Light Company d/b/a Progress Ener T , ICT1 IC TURBINE 1 STACK 0.93 NOx , WIRO New Hanover Wilmington Carolina Power and Light Company d/b/a Progress Ener T , ICT2A IC TURBINE 2A STACK 2.90 NOx , WIRO New Hanover Wilmington Carolina Power and Light Company d/b/a Progress Ener T , ICT2B IC TURBINE 2B STACK 3.00 NOx , WIRO New Hanover Wilmington Carolina Power and Light Company d/b/a Progress Ener T , UNIT 1 UNIT 1 & 2 STACK 1, NOx ,039, WIRO New Hanover Wilmington Carolina Power and Light Company d/b/a Progress Ener T , Unit 3 Unit 3 stack 3, NOx ,484, WIRO New Hanover Wilmington Carolina Power and Light Company d/b/a Progress Ener T , ICT3 Turbine NOx ,403, WIRO New Hanover Wilmington Carolina Power and Light Company d/b/a Progress Ener T , ICT4 Turbine NOx ,403, WIRO New Hanover Wilmington Carolina Power and Light Company d/b/a Progress Ener T , MISC AB1, DPH1, DPH2, FWP NOx ,484, WIRO New Hanover Wilmington Corning Incorporated T , NOx , WIRO New Hanover Wilmington Corning Incorporated T , NOx , WIRO New Hanover Wilmington Corning Incorporated T , ES NOx , WIRO New Hanover Wilmington Corning Incorporated T , NOx , WIRO New Hanover Wilmington Corning Incorporated T , Source NOx , WIRO New Hanover Wilmington Corning Incorporated T , a 2a NOx , WIRO New Hanover Wilmington Corning Incorporated T , EPG1-5 emer gen 0.63 NOx , WIRO New Hanover Wilmington Corning Incorporated T , HB-22 all humidif boilers 0.21 NOx WIRO New Hanover Wilmington CTI of NC Inc T , EP-DE vertical 0.04 NOx WIRO New Hanover Wilmington CTI of NC Inc T , wil boiler 1.45 NOx , WIRO New Hanover Wilmington CTI of NC Inc T , wil-2 30 hp boiler 0.12 NOx WIRO New Hanover Wilmington Flint Hills Resources, LP T , WTP TO Thermal Oxidizer Stack 0.19 NOx , WIRO New Hanover Wilmington Fortron Industries LLC T , ERP-FU-081 Oil-Fired Boiler Stack (FU-081) 7.82 NOx , WIRO New Hanover Wilmington Fortron Industries LLC T , ERP-FU-751a Thermal Oxidizer Stack NOx , WIRO New Hanover Wilmington Fortron Industries LLC T , ERP-FU-751b Thermal Oxidizer Diverts Vent 0.20 NOx WIRO New Hanover Wilmington Fortron Industries LLC T , ERP-MS2726 Emergency Generator Stack 0.38 NOx WIRO New Hanover Wilmington Fortron Industries LLC T , ERP-MS-726 Emergency Generator Stack 0.31 NOx , WIRO New Hanover Wilmington Global Nuclear Fuel - Americas, LLC R , ERP-FM14 Boiler Stack 1.80 NOx , WIRO New Hanover Wilmington Global Nuclear Fuel - Americas, LLC R , ERP-IES Insignificant Generator Stacks 1.11 NOx , WIRO New Hanover Wilmington Global Nuclear Fuel - Americas, LLC R , ERP-S13 Incinerator Stack 0.32 NOx , WIRO New Hanover Wilmington Global Nuclear Fuel - Americas, LLC R , ERP-S35 ERP-S NOx , WIRO New Hanover Wilmington Global Nuclear Fuel - Americas, LLC R , ERP-S39 ERP-S NOx , WIRO New Hanover Wilmington Global Nuclear Fuel - Americas, LLC R , ERP-S40 ERP-S NOx , WIRO New Hanover Wilmington Hess Corporation - Wilmington Terminal R , B-1 Boiler Stack 1.10 NOx , WIRO New Hanover Wilmington Hess Corporation - Wilmington Terminal R , VCU Vapor Combustion Unit 4.22 NOx WIRO New Hanover Wilmington Hess Corporation - Wilmington Terminal R , VRU Vapor Recovery Unit (Backup) 0.00 NOx WIRO New Hanover Wilmington Hewletts Creek Pump Station R , ERP-1 Generator Stack 0.82 NOx , WIRO New Hanover Wilmington INVISTA S.a.r.l T , Boilers Boiler Stack 0.15 NOx , WIRO New Hanover Wilmington INVISTA S.a.r.l T , VCU VCU Stack 0.05 NOx WIRO New Hanover Wilmington Invista, S.a.r.l T , B7600 Resins heater 6.10 NOx , WIRO New Hanover Wilmington Invista, S.a.r.l T , BLR1EP Boiler # NOx , WIRO New Hanover Wilmington Invista, S.a.r.l T , BLR4EP Boiler # NOx , WIRO New Hanover Wilmington Invista, S.a.r.l T , BLR5EP Boiler # NOx , WIRO New Hanover Wilmington Invista, S.a.r.l T , G-4904 Flare NOx WIRO New Hanover Wilmington Invista, S.a.r.l T , TO Liquid Waste Incinerator 0.00 NOx , WIRO New Hanover Wilmington Invista, S.a.r.l T , HTR1 Heater NOx , WIRO New Hanover Wilmington Invista, S.a.r.l T , HTR3 Heater NOx , WIRO New Hanover Wilmington Invista, S.a.r.l T , HTR4 Heater NOx , WIRO New Hanover Wilmington Invista, S.a.r.l T , HTR5 Heater NOx , WIRO New Hanover Wilmington Kinder Morgan, Wilmington R , mmbtu boiler stack 0.44 NOx WIRO New Hanover Wilmington Kinder Morgan, Wilmington R , boiler stack NOx WIRO New Hanover Wilmington Kinder Morgan, Wilmington R , boiler stack NOx WIRO New Hanover Wilmington Kinder Morgan, Wilmington R , boiler stack NOx WIRO New Hanover Wilmington Kinder Morgan, Wilmington R , Boiler Stack NOx , WIRO New Hanover Wilmington Louisiana-Pacific Corporation R , B1 Boilers 1.46 NOx WIRO New Hanover Wilmington National Gypsum Company R , Baghouse exhaust 2.66 NOx , WIRO New Hanover Wilmington National Gypsum Company R , Baghouse exhaust from #1 Calciner 1.97 NOx WIRO New Hanover Wilmington National Gypsum Company R , Baghouse exhaust from Calcidyne # NOx , WIRO New Hanover Wilmington National Gypsum Company R , Baghouse exhaust from Calcidyne # NOx , WIRO New Hanover Wilmington National Gypsum Company R , Baghouse exhaust from Calcidyne # NOx , WIRO New Hanover Wilmington National Gypsum Company R , A Kiln exhaust zone NOx , WIRO New Hanover Wilmington National Gypsum Company R , B Kiln Exhaust Zone NOx , WIRO New Hanover Wilmington National Gypsum Company R , C Kiln exhaust zone NOx , WIRO New Hanover Wilmington National Gypsum Company R , D Kiln exhaust zone NOx , WIRO New Hanover Wilmington New Hanover County WASTEC T , EP-1 1A Stack NOx , WIRO New Hanover Wilmington New Hanover County WASTEC T , EP-2 2A Stack NOx , WIRO New Hanover Wilmington New Hanover County WASTEC T , EP-3 3A Stack NOx , WIRO New Hanover Wilmington NuStar Asphalt Refining, LLC T , EP-40 STACK 1.13 NOx , WIRO New Hanover Wilmington NuStar Asphalt Refining, LLC T , EP-50 STACK 7.87 NOx , WIRO New Hanover Wilmington Southern States Chemical T , EP-1/2 Sulfuric Acid Plants 0.16 NOx , WIRO New Hanover Wilmington Sweeney Water Treatment Plant R , RPlab Ozone destruction exhaust 0.91 NOx , WIRO New Hanover Wilmington Vopak Terminal T , Boilers BOILERS 0.71 NOx ,074, WIRO New Hanover Wilmington Vopak Terminal T , FLARE FLARE 0.39 NOx , WIRO New Hanover Wilmington Vopak Terminal South Wilmington R , st1 two grouped boilers 2.45 NOx , WIRO New Hanover Wilmington Wilbara R , ES-1 Sulfuric acid plant stack 0.00 NOx , WIRO New Hanover Wilmington Wilmington Materials R , ERP-Crusher Crusher vent 0.05 NOx STACK NO. STACK DESC ACTUAL EMISSIONS (TONS) POLLUTANT * RELEASE PT TYPE HT (FT) DIAM (FT) EXITVEL (FT/SEC) FLOW RATE (FT 3 /MIN) T , A-FC-280 IC engine test stations, Field Maint., Bld 0.65 NOx Page 4 of 8 Printed: 2/24/2011
113 REGION COUNTY CITY NAME PLANT NAME PERMIT # REV# NO x Off-site Emission Inventory for Titan America UTM EAST UTM NORTH UTM ZONE T , A-FC Peak Generator 0.79 NOx , T , A-FC Peak Generator 0.77 NOx , T , A-FC Peak Generator 0.77 NOx , T , A-HP Main steam plant boiler #1 (burning No 0.40 NOx , T , A-HP Main steam plant boiler #2 (burning No 0.40 NOx , T , A-HP Main steam plant boiler #3 (burning No 0.40 NOx , T , A-HP Main steam plant boiler #4 (burning No 0.40 NOx , T , A-HP &2 Main steam plant boilers 1 & NOx , T , A-HP &4 Main steam plant boilers 3 & NOx , T , A-HP Main steam plant boiler NOx , T , A-HP Emergency Generator 1.71 NOx T , A-HP-ICETS IC engine test stands, Hadnot Point 0.63 NOx T , A-MP Boiler 1.78 NOx , T , A-MP Boiler 1.78 NOx , T , A-MP Boiler 1.78 NOx , T , A-MP-625 Boilers, Montford Point, Bldg NOx , T , A-NH-100 Boilers, Naval Hospital, Bldg NOx , T , A-PP-2615 Boilers, Paradise Point, Bldg NOx , T , B-BB-9 Boilers, Courthouse Bay, Bldg NOx , T , C-AS IC engine test station 0.63 NOx T , C-AS Fire training pit 0.08 NOx T , C-AS-4151 Boilers, Air Station, Bldg NOx , T , C-AS JET ENGINE TESTING 1.09 NOx T , C-CG-650 Boilers, Camp Geiger, Bldg NOx , T , C-RR-15 Boilers, Rifle Range, Bldg NOx , T , GR242 Boilers 0.30 NOx T , IA-BM-825 Boilers, Berkeley Manor, Bldg NOx T , IA-BM-835 Boilers, Berkeley Manor, Bldg NOx , T , IA-FC Boiler 0.14 NOx T , IA-FC Boiler 0.19 NOx , T , IA-FC Boiler 0.14 NOx T , IA-HP Boiler 0.14 NOx T , IA-HP-TP Fire training pit 0.03 NOx T , IA-LCH Boiler 0.14 NOx T , IA-MG-SH8-58 Boiler 0.14 NOx T , IA-NH Boiler 0.14 NOx T , IA-NH-120 Boilers, Naval Hospital, Bldg NOx T , IA-NH-121 Boilers, Naval Hospital, Bldg NOx T , IA-PP Boiler 0.14 NOx T , IA-PP Boiler 0.14 NOx T , IA-PP-1943-H7 Boiler 0.14 NOx T , IA-TT Boiler 0.14 NOx T , IA-TT Boiler 0.14 NOx T , IB-BB Boiler 3.06 NOx T , IC-AS Boiler 0.03 NOx T , IC-AS Boiler 0.03 NOx T , IC-AS Boiler 0.03 NOx T , IC-AS Boiler 0.03 NOx T , IC-AS Boiler 0.03 NOx T , IC-AS Boiler 0.03 NOx T , IC-AS Boiler 0.03 NOx T , IC-CG Boiler 0.03 NOx T , ICE-ZA Internal combustion engines (Zone A) NOx T , ICE-ZB Internal combustion engines (Zone B) 1.13 NOx T , ICE-ZC Internal combustion engines (Zone C) 4.34 NOx T , IC-VL Boiler 0.03 NOx T , IC-VL Boiler 0.03 NOx T , Propane Boilers Stack Emissions 0.06 NOx T , U-C-AS Boiler 0.03 NOx T , U-C-VL-TFM203 Boilers, Verona Loop, Bldg. TFM NOx T , U-C-VL-TFM204 Boilers, Verona Loop, Bldg. TFM NOx WIRO Onslow Jacksonville Mine Safety Appliances R , EP-2 Baghouse 0.23 NOx , WIRO Onslow Jacksonville Mine Safety Appliances R , EP-3 Grouped Combustion Exhausts 0.23 NOx , WIRO Onslow Jacksonville Onslow Memorial Hospital R , Boiler Boiler Stack 2.46 NOx , WIRO Onslow Jacksonville Onslow Memorial Hospital R , Generator Generator Stack 0.84 NOx WIRO Pender Rocky Point Coty US LLC R , B-1 boiler stack 0.75 NOx , * Release Point Types: 01 - FUGITIVE (NO STACK) 02 - VERTICAL STACK 03 - HORIZONTAL STACK 04 - GOOSE NECK STACK 05 - VERTICAL STACK WITH RAIN CAP 06 - DOWNWARD-FACING VENT STACK NO. STACK DESC ACTUAL EMISSIONS (TONS) POLLUTANT * RELEASE PT TYPE HT (FT) DIAM (FT) EXITVEL (FT/SEC) FLOW RATE (FT 3 /MIN) Page 5 of 8 Printed: 2/24/2011
114 SOURCES NO x Off-site Emission Inventory for Titan America Carolinas Cement Reference Coordinate (UTM NAD27) Easting (m) Northing (m) Search Parameters: NO X UTM: N km, E km Zone (km) (km) UTM: N km, E km Zone Radius: 60 km Largest NOx SIA 18.0 km 20-D Analysis REGION COUNTY CITY NAME PLANT NAME FRO Bladen Riegelwood Lower Cape Fear Water & Sewer Authority - Kings Bluff WIRO Brunswick Leland American Distillation, Inc. WIRO Brunswick Leland Carolina Pole Leland, Inc. WIRO Brunswick Leland DAK Americas LLC WIRO Brunswick Leland DAK Americas LLC WIRO Brunswick Leland DAK Americas LLC WIRO Brunswick Leland DAK Americas LLC WIRO Brunswick Leland DAK Americas LLC WIRO Brunswick Leland ExxonMobil Chemical Company WIRO Brunswick Leland Malmo Asphalt Plant WIRO Brunswick Leland Malmo Asphalt Plant WIRO Brunswick Leland Technical Coating International, Inc. WIRO Brunswick Leland Technical Coating International, Inc. WIRO Brunswick Leland Technical Coating International, Inc. WIRO Brunswick Leland Technical Coating International, Inc. WIRO Brunswick Leland Technical Coating International, Inc. WIRO Brunswick Leland Technical Coating International, Inc. WIRO Brunswick Leland Victaulic Company WIRO Brunswick Southport Archer Daniels Midland Company WIRO Brunswick Southport Archer Daniels Midland Company WIRO Brunswick Southport EPCOR USA North Carolina LLC - Southport Plant WIRO Brunswick Southport EPCOR USA North Carolina LLC - Southport Plant WIRO Brunswick Southport EPCOR USA North Carolina LLC - Southport Plant WIRO Brunswick Southport Progress Energy Carolinas - Brunswick Plant WIRO Brunswick Southport Progress Energy Carolinas - Brunswick Plant WIRO Brunswick Southport Progress Energy Carolinas - Brunswick Plant WIRO Brunswick Southport Progress Energy Carolinas - Brunswick Plant WIRO Brunswick Southport Progress Energy Carolinas - Brunswick Plant WIRO Brunswick Southport Progress Energy Carolinas - Brunswick Plant WIRO Brunswick Southport Progress Energy Carolinas - Brunswick Plant WIRO Brunswick Southport Progress Energy Carolinas - Brunswick Plant WIRO Brunswick Southport Progress Energy Carolinas - Brunswick Plant WIRO Columbus Riegelwood Hexion Acme Facility WIRO Columbus Riegelwood Hexion Acme Facility WIRO Columbus Riegelwood International Paper - Riegelwood Mill WIRO Columbus Riegelwood International Paper - Riegelwood Mill WIRO Columbus Riegelwood International Paper - Riegelwood Mill WIRO Columbus Riegelwood International Paper - Riegelwood Mill WIRO Columbus Riegelwood International Paper - Riegelwood Mill WIRO Columbus Riegelwood International Paper - Riegelwood Mill WIRO Columbus Riegelwood International Paper - Riegelwood Mill WIRO Columbus Riegelwood International Paper - Riegelwood Mill WIRO Columbus Riegelwood International Paper - Riegelwood Mill WIRO Columbus Riegelwood International Paper - Riegelwood Mill WIRO Columbus Riegelwood International Paper - Riegelwood Mill WIRO Columbus Riegelwood International Paper - Riegelwood Mill WIRO Columbus Riegelwood International Paper - Riegelwood Mill WIRO Columbus Riegelwood International Paper - Riegelwood Mill WIRO Columbus Riegelwood International Paper - Riegelwood Mill WIRO Columbus Riegelwood West Fraser, Inc. - Armour Lumber Mill WIRO Duplin Rose Hill House of Raeford Farms, Inc. - Rose Hill WIRO Duplin Rose Hill Murphy - Brown LLC - Chief Feed Mill WIRO Duplin Rose Hill Murphy - Brown LLC - Chief Feed Mill WIRO Duplin Rose Hill Murphy - Brown LLC - Chief Feed Mill WIRO Duplin Rose Hill Murphy - Brown LLC - Chief Feed Mill WIRO Duplin Rose Hill Murphy Milling Company - Register Site WIRO Duplin Rose Hill Murphy-Brown LLC - Rosemary Feed Mill WIRO Duplin Rose Hill Murphy-Brown LLC - Rosemary Feed Mill WIRO Duplin Rose Hill Nash Johnson & Sons Farms - Feed Mill WIRO Duplin Rose Hill Nash Johnson & Sons Farms - Feed Mill WIRO Duplin Rose Hill Rose Hill Animal Disease Diagnostic Laboratory WIRO Duplin Rose Hill Valley Proteins Inc WIRO Duplin Teachey House of Raeford Farms, Inc. - Wallace Division WIRO New Hanover Castle Hayne Barnhill Contracting Company WIRO New Hanover Castle Hayne Elementis Chromium WIRO New Hanover Castle Hayne Elementis Chromium WIRO New Hanover Wilmington Apex Oil Company, Inc. WIRO New Hanover Wilmington Apex Oil Company, Inc. WIRO New Hanover Wilmington Bradley Creek Pump Station GAS TEMP ( 0 F) INVENTORY YEAR DISTANCE (KM) NOTES Within SIA? (Yes/No) Allowable Emissions (TPY) ST 20D LT 20D ST Is TPY>2 0D? LT Is TPY>2 0D-? Include Source in Modeling? No No No No No No YES YES No No No No No 3, YES YES YES YES YES YES YES Insignificant/Exempt No No No No No No Insignificant/Exempt No No No No No No No No No Plus thermal oxidizer No Insignificant/Exempt No No No No No No No No 2, YES YES YES YES Insignificant/Exempt No No No No No No No No No No No No No No No No No No No 7, YES YES YES YES YES YES YES YES YES YES YES YES YES YES YES YES YES Stack parameters corrected based on No No No No information received from Tony Sabetti, Wilmington DENR office No No No No No No No No No No No No No No No No No No No No No No No No No 1, No No No No No No No No No No No No YES No YES YES YES 1, YES YES YES YES No No No No No Insignificant/Exempt No No Page 6 of 8 Printed: 2/24/2011
115 REGION COUNTY CITY NAME PLANT NAME WIRO New Hanover Wilmington Carolina Power and Light Company d/b/a Progress Ener WIRO New Hanover Wilmington Carolina Power and Light Company d/b/a Progress Ener WIRO New Hanover Wilmington Carolina Power and Light Company d/b/a Progress Ener WIRO New Hanover Wilmington Carolina Power and Light Company d/b/a Progress Ener WIRO New Hanover Wilmington Carolina Power and Light Company d/b/a Progress Ener WIRO New Hanover Wilmington Carolina Power and Light Company d/b/a Progress Ener WIRO New Hanover Wilmington Carolina Power and Light Company d/b/a Progress Ener WIRO New Hanover Wilmington Carolina Power and Light Company d/b/a Progress Ener WIRO New Hanover Wilmington Corning Incorporated WIRO New Hanover Wilmington Corning Incorporated WIRO New Hanover Wilmington Corning Incorporated WIRO New Hanover Wilmington Corning Incorporated WIRO New Hanover Wilmington Corning Incorporated WIRO New Hanover Wilmington Corning Incorporated WIRO New Hanover Wilmington Corning Incorporated WIRO New Hanover Wilmington Corning Incorporated WIRO New Hanover Wilmington CTI of NC Inc WIRO New Hanover Wilmington CTI of NC Inc WIRO New Hanover Wilmington CTI of NC Inc WIRO New Hanover Wilmington Flint Hills Resources, LP WIRO New Hanover Wilmington Fortron Industries LLC WIRO New Hanover Wilmington Fortron Industries LLC WIRO New Hanover Wilmington Fortron Industries LLC WIRO New Hanover Wilmington Fortron Industries LLC WIRO New Hanover Wilmington Fortron Industries LLC WIRO New Hanover Wilmington Global Nuclear Fuel - Americas, LLC WIRO New Hanover Wilmington Global Nuclear Fuel - Americas, LLC WIRO New Hanover Wilmington Global Nuclear Fuel - Americas, LLC WIRO New Hanover Wilmington Global Nuclear Fuel - Americas, LLC WIRO New Hanover Wilmington Global Nuclear Fuel - Americas, LLC WIRO New Hanover Wilmington Global Nuclear Fuel - Americas, LLC WIRO New Hanover Wilmington Hess Corporation - Wilmington Terminal WIRO New Hanover Wilmington Hess Corporation - Wilmington Terminal WIRO New Hanover Wilmington Hess Corporation - Wilmington Terminal WIRO New Hanover Wilmington Hewletts Creek Pump Station WIRO New Hanover Wilmington INVISTA S.a.r.l. WIRO New Hanover Wilmington INVISTA S.a.r.l. WIRO New Hanover Wilmington Invista, S.a.r.l. WIRO New Hanover Wilmington Invista, S.a.r.l. WIRO New Hanover Wilmington Invista, S.a.r.l. WIRO New Hanover Wilmington Invista, S.a.r.l. WIRO New Hanover Wilmington Invista, S.a.r.l. WIRO New Hanover Wilmington Invista, S.a.r.l. WIRO New Hanover Wilmington Invista, S.a.r.l. WIRO New Hanover Wilmington Invista, S.a.r.l. WIRO New Hanover Wilmington Invista, S.a.r.l. WIRO New Hanover Wilmington Invista, S.a.r.l. WIRO New Hanover Wilmington Kinder Morgan, Wilmington WIRO New Hanover Wilmington Kinder Morgan, Wilmington WIRO New Hanover Wilmington Kinder Morgan, Wilmington WIRO New Hanover Wilmington Kinder Morgan, Wilmington WIRO New Hanover Wilmington Kinder Morgan, Wilmington WIRO New Hanover Wilmington Louisiana-Pacific Corporation WIRO New Hanover Wilmington National Gypsum Company WIRO New Hanover Wilmington National Gypsum Company WIRO New Hanover Wilmington National Gypsum Company WIRO New Hanover Wilmington National Gypsum Company WIRO New Hanover Wilmington National Gypsum Company WIRO New Hanover Wilmington National Gypsum Company WIRO New Hanover Wilmington National Gypsum Company WIRO New Hanover Wilmington National Gypsum Company WIRO New Hanover Wilmington National Gypsum Company WIRO New Hanover Wilmington New Hanover County WASTEC WIRO New Hanover Wilmington New Hanover County WASTEC WIRO New Hanover Wilmington New Hanover County WASTEC WIRO New Hanover Wilmington NuStar Asphalt Refining, LLC WIRO New Hanover Wilmington NuStar Asphalt Refining, LLC WIRO New Hanover Wilmington Southern States Chemical WIRO New Hanover Wilmington Sweeney Water Treatment Plant WIRO New Hanover Wilmington Vopak Terminal WIRO New Hanover Wilmington Vopak Terminal WIRO New Hanover Wilmington Vopak Terminal South Wilmington WIRO New Hanover Wilmington Wilbara WIRO New Hanover Wilmington Wilmington Materials NO x Off-site Emission Inventory for Titan America GAS TEMP ( 0 F) INVENTORY YEAR DISTANCE (KM) NOTES Within SIA? (Yes/No) Allowable Emissions (TPY) ST 20D LT 20D ST Is TPY>2 0D? LT Is TPY>2 0D-? Include Source in Modeling? YES 7, YES YES YES YES YES YES YES 1, N/A YES 1, N/A YES N/A YES YES No YES YES YES YES YES YES YES EPG3&4 permitted; others exempt YES Insignificant/Exempt No Insignificant/Exempt No No No No No Insignificant/Exempt No No No No No YES No YES YES 1, YES YES YES YES Insignificant/Exempt No Insignificant/Exempt No YES No YES YES YES YES YES No No No No No Insignificant/Exempt No Insignificant/Exempt No No No No No No Insignificant/Exempt No YES 3, YES YES YES YES YES YES YES YES YES YES YES YES Insignificant/Exempt No YES No YES YES YES YES YES Insignificant/Exempt YES No No No No No No No No No No No No No YES YES YES YES YES YES No No No No No Stack parameters revised to reflect YES No YES YES sulfuric acid plants stack Insignificant/Exempt YES No No No No No No No No No No YES No YES YES Crusher vent is insignificant. Sand YES No dryer & air curtain burners are not operational per Dean Carroll, DENR Wilmington office No No No No Page 7 of 8 Printed: 2/24/2011
116 NO x Off-site Emission Inventory for Titan America REGION COUNTY CITY NAME PLANT NAME WIRO Onslow Jacksonville Mine Safety Appliances WIRO Onslow Jacksonville Mine Safety Appliances WIRO Onslow Jacksonville Onslow Memorial Hospital WIRO Onslow Jacksonville Onslow Memorial Hospital WIRO Pender Rocky Point Coty US LLC GAS TEMP ( 0 F) INVENTORY YEAR DISTANCE (KM) NOTES Within SIA? (Yes/No) Allowable Emissions (TPY) ST 20D LT 20D ST Is TPY>2 0D? LT Is TPY>2 0D-? Include Source in Modeling? No No No No No No No No No No No No No No No No No No No No No No 2, No No No No No No No No No No No No No No No No No No No No No No No No No No No No No No No No No No No No No No No No No No No No No No No No No Insignificant/Exempt YES No * Release Point Types: 01 - FUGITIVE (NO STACK) 02 - VERTICAL STACK 03 - HORIZONTAL STACK 04 - GOOSE NECK STACK 05 - VERTICAL STACK WITH RAIN CAP 06 - DOWNWARD-FACING VENT Page 8 of 8 Printed: 2/24/2011
117 APPENDIX B AERSURFACE RUN FILES B-1
118 CCC_AERSURFACE.out 1/11/2011 ** Generated by AERSURFACE, dated ** Center UTM Easting (meters): ** Center UTM Northing (meters): ** UTM Zone: 18 Datum: NAD27 ** Study radius (km) for surface roughness: 1.0 ** Airport? N, Continuous snow cover? N ** Surface moisture? Average, Arid region? N ** Month/Season assignments? Default ** Late autumn after frost and harvest, or winter with no snow: ** Winter with continuous snow on the ground: 0 ** Transitional spring (partial green coverage, short annuals): ** Midsummer with lush vegetation: ** Autumn with unharvested cropland: ** FREQ_SECT ANNUAL 1 SECTOR ** Sect Alb Bo Zo SITE_CHAR
119 APPENDIX C 1-HOUR NO 2 TIER III MODELING PROTOCOL C-1
120 Josh Dunbar From: Sent: To: Cc: Subject: Attachments: Roller, Jim Thursday, January 06, :57 PM Josh Dunbar Willis James; John Carroll; Freeman, Jerry; Vandervaart, Donald RE: CCC NO2 Modeling Tier III Revised Proposal image001.jpg; image002.jpg; image003.jpg; image004.jpg Josh, Your NO2 Modeling protocol is approved as submitted. If new issues arise and changes need to be made, please coordinate with Jerry or me. Thanks! James Roller, Environmental Program Supervisor III NC DENR, Division of Air Quality Permits/AQAB 2728 Capital Blvd Raleigh, NC Phone: Fax: * * * * * * * * * * * * * * * * * * * * * * * * * * * * * * * * * * * * * E mail correspondence to and from this address may be subject to the North Carolina Public Records Law and may be disclosed to third parties. * * * * * * * * * * * * * * * * * * * * * * * * * * * * * * * * * * * * * From: Josh Dunbar [mailto:jdunbar@falconengineers.com] Sent: Thursday, December 09, :58 AM To: Roller, Jim Cc: Willis James; John Carroll Subject: CCC NO2 Modeling Tier III Revised Proposal Jim, Based upon your comments received on our proposed approach to the NO2 Modeling for Carolinas Cement, we have revised our methodology for determining the Ozone Background values. We have revised the previously submitted protocol/request to include this proposed method. I have also included an excel spreadsheet that includes the ozone monitoring data used and how the data was derived for this proposal. As always, please let me know if you have any questions and we look forward to your response. Josh Dunbar, PE Vice President T F M jdunbar@falconengineers.com Rowland Road Raleigh, NC ENGINEERING + INSPECTION + TESTING + AGENCY CM 1
121 Justification and Protocol for Use of Tier III Modeling for PSD Permitting Non-Regulatory Options in AERMOD Specifically PVMRM Carolinas Cement Company Castle Hayne, North Carolina 1-Hour NO2 Background On February 9, 2010 the United States Environmental Protection Agency (EPA) promulgated a new 1-hour Nitrogen Dioxide (NO2) National Ambient Air Quality Standard (NAAQS). On April 12, 2010 this new 1-hour NO2 standard became effective. In June of 2010, EPA issued two clarification memoranda concerning the implementation of the new 1-hour NO2 standard as it relates to PSD permitting (see Attachment A). These memoranda provided guidance on the use of AERMOD as it relates to modeling options and requirements for using alternative models/non-regulatory options. In summary, the use of non-regulatory options in AERMOD, specifically the Ozone Limiting Method (OLM) and the Plume Volume Molar Ratio Method (PVMRM), would change the status of the model as stated in Section 3.1.2(c) of 40 CFR Part 51, Appendix W (Guideline on Air Quality Models): A preferred model should be operated with the options listed in Appendix A as Recommendations for Regulatory Use. If other options are exercised, the model is no longer preferred. Any other modification to a preferred model that would result in a change in the concentration estimates likewise alters its status as a preferred model. Use of the model must then be justified on a case-by-case basis. In order for non-regulatory options to be used for regulatory purposes the following determination must be made as per section (e): an alternative refined model may be used provided that: i. The model has received a scientific peer review; ii. The model can be demonstrated to be applicable to the problem on a theoretical basis; iii. The data bases which are necessary to perform the analysis are available and adequate; iv. Appropriate performance evaluations of the model have shown that the model is not biased toward underestimates; and v. A protocol on methods and procedures to be followed has been established. 1
122 Project Overview and Anticipated Modeling Strategy Based upon previously conducted modeling, it is anticipated that a more refined (Tier III) modeling approach will be required and justified as part of this 1-hour NO2 modeling demonstration. This document provides the background justification for use of the PVMRM algorithm in AERMOD as part of this Tier III approach. In addition, it is expected that this facility will not model below the established NC SIL values for 1-hour NO2 and that the current inventory of offsite NO2 sources may result in modeled 1-hour NO2 NAAQS exceedances. This being the case, it is proposed that a cause and contribute analysis be conducted for this facility. As per EPA guidance this methodology is acceptable provided that: the permit applicant can show that the NOx emissions increase from the proposed source will not have a significant impact at the point and time of any modeled violation In following this guidance, it is proposed that for each receptor with a modeled exceedance, the proposed facility s contribution will also be evaluated at that point and time to determine if this contribution is below the establish SIL values. To assist in making this determination it is proposed that third party software be used called Contribution Analyst, developed by Bee-Line Software. This software reads the POST files from AERMOD and post-processed output files from NO2Post (also developed by Bee-Line) to post-process the applicable data and analyze the runs both spatially and temporally. NO2Post will be run first and told to generate a receptor based output file for use with Contribution Analyst. This output file is a data file that reads into Contribution Analyst to determine which receptors are exceeding the established NAAQS values. Contribution Analyst also reads in the POST files from both the NAAQS and SIL runs and analyzes this data based upon this NO2Post receptor file. The results are a calculation data file (text file) and receptor file (GRF file) that can be further analyzed to determine if the proposed facility had any significant cause or contribution to the modeled exceedance. The user manual for this program has been attached for review and reference. Overall Justification for Tier III Modeling Using PVMRM The following will address each of the five requirements noted in (e) in order to justify the use of OLM/PVMRM for the purpose of determining compliance with the Federal 1-hour NO2 standard. 1 Justification for Scientific Peer Review [3.2.2 (e)(i)] As noted in the memorandum from Taylor Fox on June 28, 2010; Since AERMOD is the preferred model for dispersion for a wide range of application, the focus of the alternative model demonstration for use of the OLM/PVMRM options within AERMOD is on the treatment of NOx chemistry within the model, and does not need to address basic dispersion algorithms within 2
123 AERMOD. Therefore the following will address the basic chemistry of each of the nonregulatory options. Basic OLM Chemistry The following is a simplified explanation of the basic chemistry relevant to the OLM/PVMRM. First, the relatively high temperatures typical of most combustion sources promote the formation of NO2 by the following thermal reaction: 2 2 In-stack formation of NO2 OLM assumes a default 10% of the NOx in the exhaust is converted to NO2 by this reaction, and no further conversion by this reaction occurs once the exhaust leaves the stack. The remaining percentage of the NOx emissions is assumed to be nitric oxide (NO). As the exhaust leaves the stack and mixes with the ambient air, the NO reacts with ambient ozone (O3) to form NO2 and molecular oxygen (O2), as represented below: Oxidation of NO by ambient O3 The OLM assumes that at any given receptor location, the amount of NO that is converted to NO2 by this reaction is proportional to the ambient O3 concentration. If the O3 concentration is less than the NO concentration, the amount of NO2 formed by this reaction is limited. If the O3 concentration is greater than or equal to the NO concentration, all of the NO is assumed to be converted to NO2. In the presence of radiation from the sun, ambient NO2 can be destroyed: Photo-dissociation of NO2 As a conservative assumption, the OLM ignores this reaction. Another reaction that can form NO2 in the atmosphere is the reaction of NO with reactive hydrocarbons (HC), as represented below: Oxidation of NO by reactive HC The OLM also ignores this reaction. This may be a non-conservative assumption with respect to NO2 formation in urban/industrial areas with relatively large amounts of reactive HC emissions. Basic PVMRM Chemistry Building on the basic OLM chemistry, the PVMRM determines the conversion rate for NOx to NO2 based on a calculation of the NOx moles emitted into the plume, and the amount of O3 moles contained within the volume of the plume between the source and receptor. The dispersion 3
124 algorithms in AERMOD and other steady-state plume models are based on the use of total dispersion coefficients, which are formulated to represent the time-averaged spread of the plume. A more appropriate definition of the volume of the plume for purposes of determining the ozone moles available for conversion of NOx is based on the instantaneous volume of the plume, which is represented by the use of relative dispersion coefficients, (Cole and Summerhays, 1979; Bange, 1991). The implementation of PVMRM in AERMOD is based on the use of relative dispersion coefficients to calculate the plume volume. Weil (1996 and 1998) has defined formulas for relative dispersion that are consistent with the AERMOD treatment of dispersion, and which can be calculated using meteorological parameters available within AERMOD. The chemistry for both models has been peer-reviewed as noted by the documents posted on EPA s Support Center for Regulatory Air Modeling (SCRAM) web site entitled Sensitivity Analysis Of PVMRM And OLM In AERMOD and Evaluation Of Bias In AERMOD- PVMRM. Both documents indicate that the models appear to perform as expected. 2 Justification for OLM/PVMRM Theoretical Demonstration [3.2.2 (e)(ii)] As noted in the document entitled Sensitivity Analysis of PVMRM and OLM In AERMOD prepared by Roger W. Brode, it indicates the following: This report presents results of a sensitivity analysis of the PVMRM and OLM options for NO x to NO 2 conversion in the AERMOD dispersion model. Several single source scenarios were examined as well as a multiple-source scenario. The average conversion ratios of NO 2 /NO x for the PVMRM option tend to be lower than for the OLM option and for the Tier 2 option or the Ambient Ratio Method which has a default value of 0.75 for the annual average. The sensitivity of the PVMRM and OLM options to emission rate, source parameters and modeling options appear to be reasonable and are as expected based on the formulations of the two methods. For a given NO x emission rate and ambient ozone concentration, the NO 2 /NO x conversion ratio for PVMRM is primarily controlled by the volume of the plume, whereas the conversion ratio for OLM is primarily controlled by the ground-level NO x concentration. Overall the PVMRM option appears to provide a more realistic treatment of the conversion of NO x to NO 2 as a function of distance downwind from the source than OLM or the other NO 2 screening options (Hanrahan, 1999a; Hanrahan, 1999b). No anomalous behavior of the PVMRM or OLM options was identified as a result of these sensitivity tests. Based on this report for both OLM/PVMRM it appears to be applicable to the problem of NO2 formation and as noted by the author provides a better estimation of the NO2 impacts compared to other screening options. 3 Justification for Availability of Data to Perform PVMRM [3.2.2 (e)(iii)] The data needed to conduct an OLM/PVMRM run are as follows: 1. Hourly meteorological data, 2. Ozone data, and 3. In-stack NO2/NOx ratio. 4
125 Both meteorological and ozone data sets must be processed into AERMOD ready formats. North Carolina Department of Environment and Natural Resources (DENR), Division of Air Quality (DAQ) preprocess the meteorological data following applicable EPA guidance. For this site, based upon DAQ Guidance, the Wilmington (Wilmington/Charleston) Met data set will be used with the medium surface roughness subset. DAQ also maintains a number of ozone monitoring sites throughout North Carolina. For this demonstration data was extracted from the Castle Hayne, NC monitor (Monitor # ). This monitoring site only records data during the ozone season (April through October) and as such provides a conservative approach to data analysis. The most recent 5-years of ozone data were downloaded and analyzed. To use the existing meteorological datasets provided by DAQ it was necessary to derive an ozone background dataset that could be paired with these hourly data. To accomplish this task two sets of data were derived, one for the ozone season and one for the non-ozone season. Each derivation will be explained below: Ozone Season Dataset For the ozone season, data was available for the most recent 5 years (2005 to 2009). To provide a conservative value for these hours, each hour was observed for each of the 5-years of and the highest value from the 5-year set was recorded. This was performed for each hour from April 1 st to October 31 st. The table below provides an example of this procedure. Date Hour 2005 (ppm) 2006 (ppm) 2007 (ppm) 2008 (ppm) 2009 (ppm) Max (ppm) April April April October Each of these maximum values will be used for the date and time it represents when paired with the DAQ meteorological data sets for the 1988 to 1992 modeling years. It was observed that for these data no hour 3 data was recorded for any date. To account for this, the maximum values for the hour before and after (Hour 2 and Hour 4, respectively) were observed and the maximum value recorded to represent this hour. No other data filling was performed if other years recorded data for this observed hour (i.e., data available for all years but not 2008). 5
126 Non-ozone Season Dataset For the non-ozone season, no data was available for the selected ozone monitor. A data inquiry was made of available ozone monitors in North Carolina via EPA AirData ( and none reported having a full year of recorded ozone data available. As such, a conservative standard 24-hour set of data was derived from the available ozone season data. To accomplish this, the available data from the first and last month of the ozone season were observed (i.e., April and October). As a conservative method, the maximum hourly values from each day (i.e., April Hour 1, April 2 Hour 1, etc.) were extracted for the 5-year period (2005 to 2009). These maximum values were then averaged for each hourly period (i.e., Hour 1, Hour 2, etc.). To illustrate this point the table below illustrates this described method. Example: Non-Ozone Season Derivation for Hour 1 Date 2005 (ppm) 2006 (ppm) 2007 (ppm) 2008 (ppm) 2009 (ppm) Maximum (ppm) April April No Data October October Average Value for Hour 1 of the Non-Ozone Season Dataset Just as discussed with the Ozone season data, it was observed that for these data no hour 3 data was recorded for any date. To account for this, the maximum values for the hour before and after (Hour 2 and Hour 4, respectively) were observed and the maximum value recorded to represent this hour. No other data filling was performed if other years recorded data for this observed hour. Based upon this methodology the following 24-hour dataset was derived to use for each non-ozone season day. 6
127 Proposed Non-Ozone 24-Hour Dataset Non-Ozone Hour Ozone Background Value (ppm)
128 Both sets of values derived for the ozone season and non-ozone season present a conservative approach, as the maximum values are used for the ozone season values and the average of maximum hourly values (from April and October) were used for the non-ozone season values. Given this approach the modeled concentrations should yield an analysis that is conservative for every hour modeled. NOX emissions produced by the kiln system consist mainly of NO gas with a relatively small amount of NO2. The NO2 to NOX in-stack ratio for modern cement kilns ranges from 1 to 5 percent. A conservative in-stack ratio of 5 percent (0.05) will be used for this analysis. Attachment B provides a list of available literature reviewed and sited for this justification. 4 Justification for Performance Evaluations [3.2.2 (e)(iv)] As noted in the document entitled Evaluation of Bias In AERMOD-PVMRM prepared by Roger W. Brode, it states the following: This report presents results of an analysis of evaluation results to determine whether the AERMOD- PVMRM algorithm produces biased or unbiased estimates of the NO 2 /NO x ratio. Evaluation results from two aircraft studies and two long-term field studies were examined, as well as comparisons between AERMOD-PVMRM and other refined chemically reactive plume models. Comparisons between predicted and observed NO 2 /NO x ratios were based on results paired in time and space, providing a more rigorous assessment than is commonly used in evaluating the performance of air dispersion models. While there does not appear to be a clear and objective criterion established by EPA for determining whether a model is biased or unbiased, a general rule of thumb that is commonly used as a benchmark in judging the performance of air dispersion models is agreement with observations within a factor of two. In all cases, the average ratio between predicted and observed NO 2 /NO x ratios showed agreement within a factor of two, and in most cases within about a factor of 1.5. Based on all of the data available, the AERMOD- PVMRM algorithm is judged to provide unbiased estimates of the NO 2 /NO x ratio based on criteria that are comparable to, or more rigorous than, evaluations performed for other dispersion models that are judged to be refined, implying unbiased performance. As noted in the above report it has been determined that PVMRM has been judged to provide unbiased estimates based on criteria that are comparable to, or more rigorous than, evaluations performed for other dispersion models. At the present time no assessment of bias has been conducted for the OLM model. 5 Justification for Protocol on Methods and Procedures [3.2.2 (e)(v)] DAQ has previously reviewed and approved the modeling protocol for this facility for PSD Permitting activities. The methods described within this document would append the protocol upon approval by DAQ of this justification for 1-hour NO2 modeling activities. Specifically, it is proposed that the NO2 1-hour modeling demonstration for this facility use the Tier III modeling 8
129 approach by applying the PVMRM algorithm. The proposed values for each of the required PVMRM variables are as follows: 1. NO2/NOx Ratio (NO2STACK) : 0.05 This value is consistent with the various studies and references available for modern cement plants. As shown with the provided references, this value is typically within the 1% to 5 % range. As such, the proposed 5% is a conservative value. 2. Equilibrium Ratio (NO2EQUIL) : 0.75 This value has been accepted by EPA as an appropriate conservative value for this type of modeling evaluation. Per EPA guidance, this value has been adopted. 3. Background Ozone Value (OZONEVAL) : Hourly Derived Data As discussed previously, this value was derived based upon ozone season data only from the Castle Hayne monitoring station. This evaluation considered a representative 5-year period and is considered a sufficiently conservative value for this demonstration and the sensitivity of the modeling algorithm. Conclusion Based on the information provided above, it has been determined that the method for determining hourly NO2 concentrations using AERMOD in conjunction with the non-regulatory PVMRM option is acceptable based on the requirements in 40 CFR Part 51, Appendix W, 3.2.2(e). This is based upon the following justifications: 1. The model has received a scientific peer review [3.2.2 (e)(i).]; The chemistry for both models have received scientific peer review as noted in Sensitivity Analysis of PVMRM and OLM in AERMOD and Evaluation of Bias in AERMOD-PVMRM. Both documents indicate that the models appear to perform as expected. 2. The model can be demonstrated to be applicable to the problem on a theoretical basis [3.2.2 (e)(ii).]; Both models have been reviewed and the chemistry has been widely accepted by EPA and other government agencies as being appropriate for addressing the formation of NO2 and the calculation of NO2 concentration at receptors downwind. Additionally, the Sensitivity Analysis of PVMRM and OLM in AERMOD report indicates OLM/PVMRM provides a better estimation of the NO2 impacts compared to other screening options. 3. The data bases which are necessary to perform the analysis are available and adequate [3.2.2 (e)(iii)]; DAQ preprocesses the required meteorological data required for this analysis, 9
130 ozone monitoring data is available within the facility area, and historical studies have provided appropriate NO2/NOx ratios. 4. Appropriate performance evaluations of the model have shown that the model is not biased toward underestimates [3.2.2 (e)(iv)]; As noted the Evaluation of Bias in AERMOD-PVMRM report, PVMRM has been judged to provide an unbiased estimate. 5. A protocol on methods and procedures to be followed has been established [3.2.2 (e)(v)]. The methods and procedures for conducting this assessment for determining compliance with the 1-hour NO2 NAAQS were provided within this document and the previously approved modeling protocol for this facility. 10
131 Attachment A References for PVMRM Justification 11
132 References for PVMRM in AERMOD EPA, Applicability of Appendix W Modeling Guidance for 1-hour NO2 National Ambient Air Quality Standard. Tyler Fox Memorandum, dated June 28, U.S. Environmental Protection Agency, Research Triangle Park, NC. EPA, Guidance Concerning the Implementation of the 1-hour NO2 NAAQS fror the Prevention of Significant Deterioration Program. Stephen D. Page Memorandum, dated June 29, U.S. Environmental Protection Agency, Research Triangle Park, NC. MACTEC, Sensitivity Analysis of PVMRM and OLM in AERMOD. Final Report, Alaska DEC Contract No MACTEC Federal Programs, Inc., Research Triangle Park, NC. MACTEC, Evaluation of Bias in AERMOD-PVMRM. Final Report, Alaska DEC Contract No MACTEC Federal Programs, Inc., Research Triangle Park, NC. 12
133 Attachment B NO 2 In-stack References 13
134 References for In-Stack NO2 Gas Content in Cement Kilns Reference 1 EMEP/EEA emission inventory guidebook 2009, Chapter 2.A.1 Cement production, European Environment Agency NO X are formed in the combustion process either by oxidation of the nitrogen in the combustion air (thermal NO X ), or by oxidation of the nitrogen compounds in the fuel (fuel NO X ). Thermal NO X form at temperatures above 1200 C. Due to the very high temperatures in the cement kiln thermal NO X dominate. Nitrogen monoxide accounts for about 95 % and nitrogen dioxide for about 5 %. Reference 2 Technical Report TR-ECRA , European Cement Research Academy, Dusseldorf, Germany NO 2 usually accounts for not more than 5% of total NO X in cement kiln flue gases Reference 3 The French Cement Industry Guide to NOx Emissions Reduction Measures, ADEME (French Agency for Environment and Energy Management), 16 December NO X formation in cement plants is 95 % nitrogen monoxide; NO 2 formation occurs at low temperatures in contact with the air in the atmosphere. Reference 4 Health Consultation, Lafarge Corporation, Seattle Washington Cement Plant, U.S. DEPARTMENT OF HEALTH AND HUMAN SERVICES, Public Health Service, Agency for Toxic Substances and Disease Registry, June 23, Ninety-five percent of Lafarge s NO X emissions are in the form of NO, the remaining 5% are NO 2. Reference 5 Environmental Data of the European Cement Industry 2001, Verein Deutscher Zementwerke e.v., Dusseldorf, Germany, September The clinker burning process is a high-temperature process resulting in the formation of nitrogen oxides (NO X ). Nitrogen monoxide (NO) accounts for about 95 %, and nitrogen dioxide (NO 2 ) for about 5 % of this compound present in the exhaust gas of rotary kiln plants. 14
135 Reference 6 from Robert Shenk, FLSmidth Inc. to Jay Willis, Titan America, September 21, Concerning testing experience for cement kilns with modern pyroprocessing systems and low NO X calciners it would appear that the modern low NO X systems indicate about 99% NO as part of overall NO X emissions when looking at FTIR analyzer. 15
136 Attachment C Contribution Analyst User s Manual 16
137 APPENDIX D STRUCTURE DIMENSIONS D-1
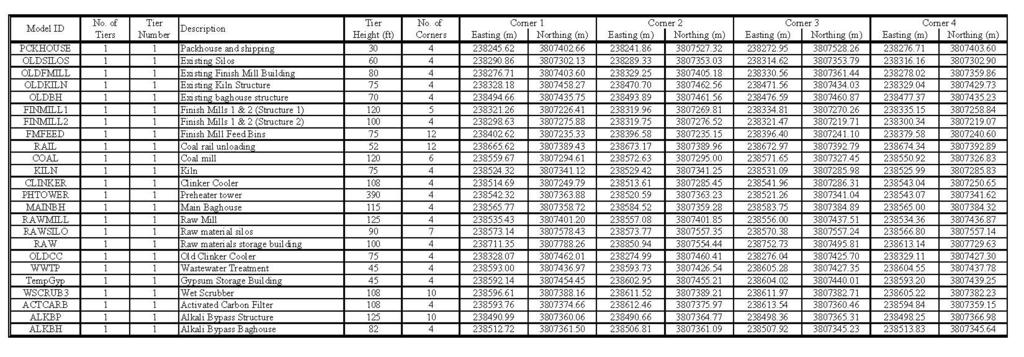
138 D-2
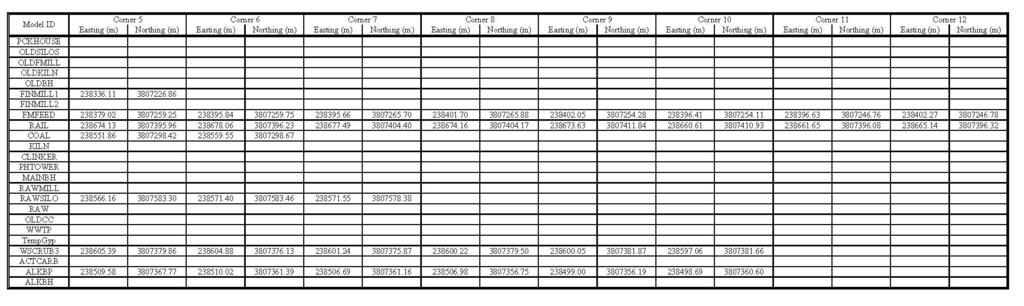
139 D-3
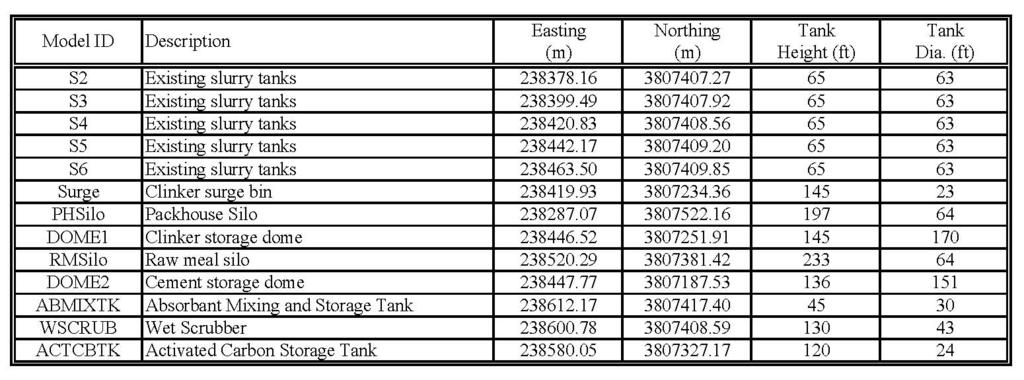
140 D-4
141 APPENDIX E SIGNIFICANT IMPACT AREAS E-1
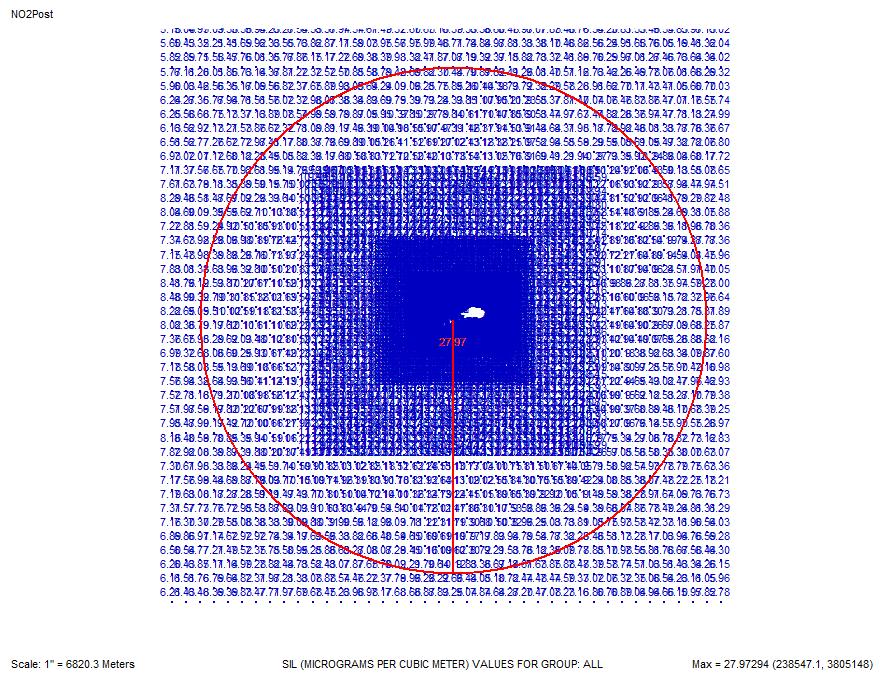
142 E-2
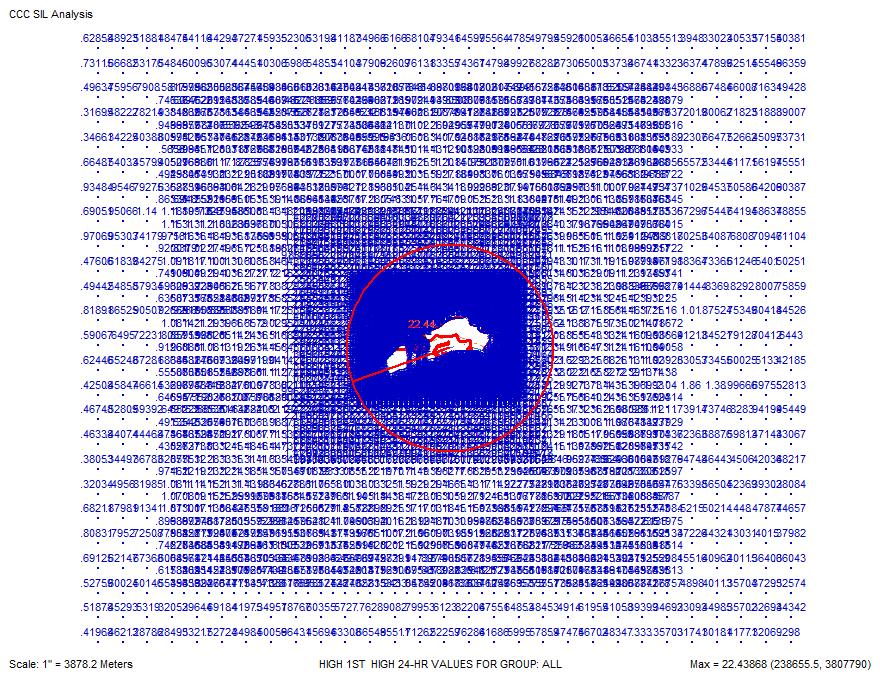
143 E-3
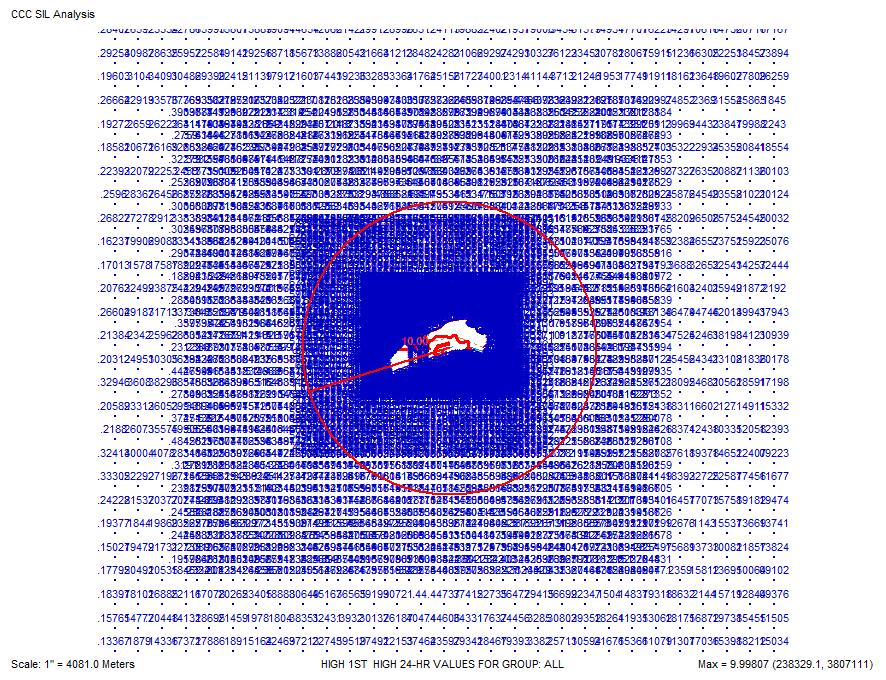
144 E-4
145 APPENDIX F 1-HOUR NO 2 CAUSE AND CONTRIBUTE OUTPUT F-1
146 CA_Calc.txt 2/22/2011 Contribution Analyst version 1.1 Run completed 2/22/2011 3:44:35 PM Input Files File type: AERMOD c:\ccc NO2\CCC Only Run (021711)\1-hr NO2 CCC 1988.plt c:\ccc NO2\CCC Only Run (021711)\1-hr NO2 CCC 1989.plt c:\ccc NO2\CCC Only Run (021711)\1-hr NO2 CCC 1990.plt c:\ccc NO2\CCC Only Run (021711)\1-hr NO2 CCC 1991.plt c:\ccc NO2\CCC Only Run (021711)\1-hr NO2 CCC 1992.plt NO2Post or SO2Post file: C:\CCC NO2\Cause and Contribute Output Files (021711) \NO2Post_CA.txt Results Receptor #1 ( , ) Average Receptor #2 ( , ) Average Receptor #3 ( , ) Average Receptor #4 ( , ) Hour Average
147 CA_Calc.txt 2/22/2011 Receptor #5 ( , ) Average Receptor #6 ( , ) Average Receptor #7 ( , ) Average Receptor #8 ( , ) Average Receptor #9 ( , ) Average Receptor #10 ( , ) Average Receptor #11 ( , ) 2
148 CA_Calc.txt 2/22/ Average Receptor #12 ( , ) Average Receptor #13 ( , ) Average Receptor #14 ( , ) Average Receptor #15 ( , ) Average Receptor #16 ( , ) Average Receptor #17 ( , ) 3
149 CA_Calc.txt 2/22/ Average Receptor #18 ( , ) Average Receptor #19 ( , ) Average Receptor #20 ( , ) Average Receptor #21 ( , ) Hour Average Receptor #22 ( , ) Average Receptor #23 ( , ) 4
150 CA_Calc.txt 2/22/ Average Receptor #24 ( , ) Average Receptor #25 ( , ) Average Receptor #26 ( , ) Average Receptor #27 ( , ) Average Receptor #28 ( , ) Hour Average Receptor #29 ( , )
151 CA_Calc.txt 2/22/ Average Receptor #30 ( , ) Average Receptor #31 ( , ) Hour Average Receptor #32 ( , ) Average Receptor #33 ( , ) Hour Average Receptor #34 ( , ) Average Receptor #35 ( , ) Hour
152 CA_Calc.txt 2/22/ Average Receptor #36 ( , ) Average Receptor #37 ( , ) Average Receptor #38 ( , ) Average Receptor #39 ( , ) Average Receptor #40 ( , ) Average Receptor #41 ( , )
153 CA_Calc.txt 2/22/ Average Receptor #42 ( , ) Hour Average Receptor #43 ( , ) Average Receptor #44 ( , ) Average Receptor #45 ( , ) Average Receptor #46 ( , ) Hour Average Receptor #47 ( , )
154 CA_Calc.txt 2/22/ Average Receptor #48 ( , ) Average Receptor #49 ( , ) Average Receptor #50 ( , ) Average Receptor #51 ( , ) Average Receptor #52 ( , ) Average Receptor #53 ( , ) Hour
155 CA_Calc.txt 2/22/2011 Average Receptor #54 ( , ) Hour Average Receptor #55 ( , ) Average Receptor #56 ( , ) Average Receptor #57 ( , ) Average Receptor #58 ( , ) Average Receptor #59 ( , )
156 CA_Calc.txt 2/22/2011 Average Receptor #60 ( , ) Average Receptor #61 ( , ) Average Receptor #62 ( , ) Average Receptor #63 ( , ) Average Receptor #64 ( , ) Average Receptor #65 ( , ) Average
157 CA_Calc.txt 2/22/2011 Receptor #66 ( , ) Hour Average Receptor #67 ( , ) Hour Average Receptor #68 ( , ) Average Receptor #69 ( , ) Average Receptor #70 ( , ) Average Receptor #71 ( , ) Hour Average
158 CA_Calc.txt 2/22/2011 Receptor #72 ( , ) Average Receptor #73 ( , ) Average Receptor #74 ( , ) Average Receptor #75 ( , ) Average Receptor #76 ( , ) Average Receptor #77 ( , ) Average Receptor #78 ( , ) 13
159 CA_Calc.txt 2/22/ Average Receptor #79 ( , ) Average Receptor #80 ( , ) Average Receptor #81 ( , ) Average Receptor #82 ( , ) Average Receptor #83 ( , ) Average Receptor #84 ( , ) 14
160 CA_Calc.txt 2/22/ Average Receptor #85 ( , ) Average Receptor #86 ( , ) Average Receptor #87 ( , ) Average Receptor #88 ( , ) Hour Average Receptor #89 ( , ) Average Receptor #90 ( , ) 15
161 CA_Calc.txt 2/22/ Average Receptor #91 ( , ) Average Receptor #92 ( , ) Average Receptor #93 ( , ) Average Receptor #94 ( , ) Average Receptor #95 ( , ) Hour Average Receptor #96 ( , )
162 CA_Calc.txt 2/22/ Average Receptor #97 ( , ) Average Receptor #98 ( , ) Hour Average Receptor #99 ( , ) Average Receptor #100 ( , ) Hour Average Receptor #101 ( , ) Average Receptor #102 ( , ) Hour
163 CA_Calc.txt 2/22/ Average Receptor #103 ( , ) Average Receptor #104 ( , ) Average Receptor #105 ( , ) Average Receptor #106 ( , ) Average Receptor #107 ( , ) Average Receptor #108 ( , )
164 CA_Calc.txt 2/22/ Average Receptor #109 ( , ) Hour Average Receptor #110 ( , ) Average Receptor #111 ( , ) Average Receptor #112 ( , ) Average Receptor #113 ( , ) Hour Average Receptor #114 ( , )
165 CA_Calc.txt 2/22/ Average Receptor #115 ( , ) Average Receptor #116 ( , ) Average Receptor #117 ( , ) Average Receptor #118 ( , ) Average Receptor #119 ( , ) Average Receptor #120 ( , ) Hour
166 CA_Calc.txt 2/22/2011 Average Receptor #121 ( , ) Hour Average Receptor #122 ( , ) Average Receptor #123 ( , ) Average Receptor #124 ( , ) Average Receptor #125 ( , ) Average Receptor #126 ( , )
167 CA_Calc.txt 2/22/2011 Average Receptor #127 ( , ) Average Receptor #128 ( , ) Average Receptor #129 ( , ) Average Receptor #130 ( , ) Average Receptor #131 ( , ) Average Receptor #132 ( , ) Average
168 CA_Calc.txt 2/22/2011 Receptor #133 ( , ) Hour Average Receptor #134 ( , ) Hour Average Receptor #135 ( , ) Average Receptor #136 ( , ) Average Receptor #137 ( , ) Average Receptor #138 ( , ) Hour Average
169 CA_Calc.txt 2/22/2011 Receptor #139 ( , ) Average Receptor #140 ( , ) Average Receptor #141 ( , ) Average Receptor #142 ( , ) Average Receptor #143 ( , ) Average Receptor #144 ( , ) Average Receptor #145 ( , ) 24
170 CA_Calc.txt 2/22/ Average Receptor #146 ( , ) Average Receptor #147 ( , ) Average Receptor #148 ( , ) Average Receptor #149 ( , ) Average Receptor #150 ( , ) Average Receptor #151 ( , ) 25
171 CA_Calc.txt 2/22/ Average Receptor #152 ( , ) Average Receptor #153 ( , ) Average Receptor #154 ( , ) Average Receptor #155 ( , ) Hour Average Receptor #156 ( , ) Average Receptor #157 ( , ) 26
172 CA_Calc.txt 2/22/ Average Receptor #158 ( , ) Average Receptor #159 ( , ) Average Receptor #160 ( , ) Average Receptor #161 ( , ) Average Receptor #162 ( , ) Hour Average Receptor #163 ( , )
173 CA_Calc.txt 2/22/ Average Receptor #164 ( , ) Average Receptor #165 ( , ) Hour Average Receptor #166 ( , ) Average Receptor #167 ( , ) Hour Average Receptor #168 ( , ) Average Receptor #169 ( , ) Hour
174 CA_Calc.txt 2/22/ Average Receptor #170 ( , ) Average Receptor #171 ( , ) Average Receptor #172 ( , ) Average Receptor #173 ( , ) Average Receptor #174 ( , ) Average Receptor #175 ( , )
175 CA_Calc.txt 2/22/ Average Receptor #176 ( , ) Hour Average Receptor #177 ( , ) Average Receptor #178 ( , ) Average Receptor #179 ( , ) Average Receptor #180 ( , ) Hour Average Receptor #181 ( , )
176 CA_Calc.txt 2/22/ Average Receptor #182 ( , ) Average Receptor #183 ( , ) Average Receptor #184 ( , ) Average Receptor #185 ( , ) Average Receptor #186 ( , ) Average Receptor #187 ( , ) Hour
177 CA_Calc.txt 2/22/2011 Average Receptor #188 ( , ) Hour Average Receptor #189 ( , ) Average Receptor #190 ( , ) Average Receptor #191 ( , ) Average Receptor #192 ( , ) Average Receptor #193 ( , )
178 CA_Calc.txt 2/22/2011 Average Receptor #194 ( , ) Average Receptor #195 ( , ) Average Receptor #196 ( , ) Average Receptor #197 ( , ) Average Receptor #198 ( , ) Average Receptor #199 ( , ) Average
179 CA_Calc.txt 2/22/2011 Receptor #200 ( , ) Hour Average Receptor #201 ( , ) Hour Average Receptor #202 ( , ) Average Receptor #203 ( , ) Average Receptor #204 ( , ) Average Receptor #205 ( , ) Hour Average
180 CA_Calc.txt 2/22/2011 Receptor #206 ( , ) Average Receptor #207 ( , ) Average Receptor #208 ( , ) Average Receptor #209 ( , ) Average Receptor #210 ( , ) Average Receptor #211 ( , ) Average Receptor #212 ( , ) 35
181 CA_Calc.txt 2/22/ Average Receptor #213 ( , ) Average Receptor #214 ( , ) Average Receptor #215 ( , ) Average Receptor #216 ( , ) Average Receptor #217 ( , ) Average Receptor #218 ( , ) 36
182 CA_Calc.txt 2/22/ Average Receptor #219 ( , ) Average Receptor #220 ( , ) Average Receptor #221 ( , ) Average Receptor #222 ( , ) Hour Average Receptor #223 ( , ) Average Receptor #224 ( , ) 37
183 CA_Calc.txt 2/22/ Average Receptor #225 ( , ) Average Receptor #226 ( , ) Average Receptor #227 ( , ) Average Receptor #228 ( , ) Average Receptor #229 ( , ) Hour Average Receptor #230 ( , )
184 CA_Calc.txt 2/22/ Average Receptor #231 ( , ) Average Receptor #232 ( , ) Hour Average Receptor #233 ( , ) Average Receptor #234 ( , ) Hour Average Receptor #235 ( , ) Average Receptor #236 ( , ) Hour
185 CA_Calc.txt 2/22/ Average Receptor #237 ( , ) Average Receptor #238 ( , ) Average Receptor #239 ( , ) Average Receptor #240 ( , ) Average Receptor #241 ( , ) Average Receptor #242 ( , )
186 CA_Calc.txt 2/22/ Average Receptor #243 ( , ) Hour Average Receptor #244 ( , ) Average Receptor #245 ( , ) Average Receptor #246 ( , ) Average Receptor #247 ( , ) Hour Average Receptor #248 ( , )
187 CA_Calc.txt 2/22/ Average Receptor #249 ( , ) Average Receptor #250 ( , ) Average Receptor #251 ( , ) Average Receptor #252 ( , ) Average Receptor #253 ( , ) Average Receptor #254 ( , ) Hour
188 CA_Calc.txt 2/22/2011 Average Receptor #255 ( , ) Hour Average Receptor #256 ( , ) Average Receptor #257 ( , ) Average Receptor #258 ( , ) Average Receptor #259 ( , ) Average Receptor #260 ( , )
189 CA_Calc.txt 2/22/2011 Average Receptor #261 ( , ) Average Receptor #262 ( , ) Average Receptor #263 ( , ) Average Receptor #264 ( , ) Average Receptor #265 ( , ) Average Receptor #266 ( , ) Average
190 CA_Calc.txt 2/22/2011 Receptor #267 ( , ) Hour Average Receptor #268 ( , ) Hour Average Receptor #269 ( , ) Average Receptor #270 ( , ) Average Receptor #271 ( , ) Average Receptor #272 ( , ) Hour Average
191 CA_Calc.txt 2/22/2011 Receptor #273 ( , ) Average Receptor #274 ( , ) Average Receptor #275 ( , ) Average Receptor #276 ( , ) Average Receptor #277 ( , ) Average Receptor #278 ( , ) Average Receptor #279 ( , ) 46
192 CA_Calc.txt 2/22/ Average Receptor #280 ( , ) Average Receptor #281 ( , ) Average Receptor #282 ( , ) Average Receptor #283 ( , ) Average Receptor #284 ( , ) Average Receptor #285 ( , ) 47
193 CA_Calc.txt 2/22/ Average Receptor #286 ( , ) Average Receptor #287 ( , ) Average Receptor #288 ( , ) Average Receptor #289 ( , ) Hour Average Receptor #290 ( , ) Average Receptor #291 ( , ) 48
194 CA_Calc.txt 2/22/ Average Receptor #292 ( , ) Average Receptor #293 ( , ) Average Receptor #294 ( , ) Average Receptor #295 ( , ) Average Receptor #296 ( , ) Hour Average Receptor #297 ( , )
195 CA_Calc.txt 2/22/ Average Receptor #298 ( , ) Average Receptor #299 ( , ) Hour Average Receptor #300 ( , ) Average Receptor #301 ( , ) Hour Average Receptor #302 ( , ) Average Receptor #303 ( , ) Hour
196 CA_Calc.txt 2/22/ Average Receptor #304 ( , ) Average Receptor #305 ( , ) Average Receptor #306 ( , ) Average Receptor #307 ( , ) Average Receptor #308 ( , ) Average Receptor #309 ( , )
197 CA_Calc.txt 2/22/ Average Receptor #310 ( , ) Hour Average Receptor #311 ( , ) Average Receptor #312 ( , ) Average Receptor #313 ( , ) Average Receptor #314 ( , ) Hour Average Receptor #315 ( , )
198 CA_Calc.txt 2/22/ Average Receptor #316 ( , ) Average Receptor #317 ( , ) Average Receptor #318 ( , ) Average Receptor #319 ( , ) Average Receptor #320 ( , ) Average Receptor #321 ( , ) Hour
199 CA_Calc.txt 2/22/2011 Average Receptor #322 ( , ) Hour Average Receptor #323 ( , ) Average Receptor #324 ( , ) Average Receptor #325 ( , ) Average Receptor #326 ( , ) Average Receptor #327 ( , )
200 CA_Calc.txt 2/22/2011 Average Receptor #328 ( , ) Average Receptor #329 ( , ) Average Receptor #330 ( , ) Average Receptor #331 ( , ) Average Receptor #332 ( , ) Average Receptor #333 ( , ) Average
201 CA_Calc.txt 2/22/2011 Receptor #334 ( , ) Hour Average Receptor #335 ( , ) Hour Average Receptor #336 ( , ) Average Receptor #337 ( , ) Average Receptor #338 ( , ) Average Receptor #339 ( , ) Hour Average
202 CA_Calc.txt 2/22/2011 Receptor #340 ( , ) Average Receptor #341 ( , ) Average Receptor #342 ( , ) Average Receptor #343 ( , ) Average Receptor #344 ( , ) Average Receptor #345 ( , ) Average Receptor #346 ( , ) 57
203 CA_Calc.txt 2/22/ Average Receptor #347 ( , ) Average Receptor #348 ( , ) Average Receptor #349 ( , ) Average Receptor #350 ( , ) Average Receptor #351 ( , ) Average Receptor #352 ( , ) 58
204 CA_Calc.txt 2/22/ Average Receptor #353 ( , ) Average Receptor #354 ( , ) Average Receptor #355 ( , ) Average Receptor #356 ( , ) Hour Average Receptor #357 ( , ) Average Receptor #358 ( , ) 59
205 CA_Calc.txt 2/22/ Average Receptor #359 ( , ) Average Receptor #360 ( , ) Average Receptor #361 ( , ) Average Receptor #362 ( , ) Average Receptor #363 ( , ) Hour Average Receptor #364 ( , )
206 CA_Calc.txt 2/22/ Average Receptor #365 ( , ) Average Receptor #366 ( , ) Hour Average Receptor #367 ( , ) Average Receptor #368 ( , ) Hour Average Receptor #369 ( , ) Average Receptor #370 ( , ) Hour
207 CA_Calc.txt 2/22/ Average Receptor #371 ( , ) Average Receptor #372 ( , ) Average Receptor #373 ( , ) Average Receptor #374 ( , ) Average Receptor #375 ( , ) Average Receptor #376 ( , )
208 CA_Calc.txt 2/22/ Average Receptor #377 ( , ) Hour Average Receptor #378 ( , ) Average Receptor #379 ( , ) Average Receptor #380 ( , ) Average Receptor #381 ( , ) Hour Average Receptor #382 ( , )
209 CA_Calc.txt 2/22/ Average Receptor #383 ( , ) Average Receptor #384 ( , ) Average Receptor #385 ( , ) Average Receptor #386 ( , ) Average Receptor #387 ( , ) Average Receptor #388 ( , ) Hour
210 CA_Calc.txt 2/22/2011 Average Receptor #389 ( , ) Hour Average Receptor #390 ( , ) Average Receptor #391 ( , ) Average Receptor #392 ( , ) Average Receptor #393 ( , ) Average Receptor #394 ( , )
211 CA_Calc.txt 2/22/2011 Average Receptor #395 ( , ) Average Receptor #396 ( , ) Average Receptor #397 ( , ) Average Receptor #398 ( , ) Average Receptor #399 ( , ) Average Receptor #400 ( , ) Average
212 CA_Calc.txt 2/22/2011 Receptor #401 ( , ) Hour Average Receptor #402 ( , ) Hour Average Receptor #403 ( , ) Average Receptor #404 ( , ) Average Receptor #405 ( , ) Average Receptor #406 ( , ) Hour Average
213 CA_Calc.txt 2/22/2011 Receptor #407 ( , ) Average Receptor #408 ( , ) Average Receptor #409 ( , ) Average Receptor #410 ( , ) Average Receptor #411 ( , ) Average Receptor #412 ( , ) Average Receptor #413 ( , ) 68
214 CA_Calc.txt 2/22/ Average Receptor #414 ( , ) Average Receptor #415 ( , ) Average Receptor #416 ( , ) Average Receptor #417 ( , ) Average Receptor #418 ( , ) Average Receptor #419 ( , ) 69
215 CA_Calc.txt 2/22/ Average Receptor #420 ( , ) Average Receptor #421 ( , ) Average Receptor #422 ( , ) Average Receptor #423 ( , ) Hour Average Receptor #424 ( , ) Average Receptor #425 ( , ) 70
216 CA_Calc.txt 2/22/ Average Receptor #426 ( , ) Average Receptor #427 ( , ) Average Receptor #428 ( , ) Average Receptor #429 ( , ) Average Receptor #430 ( , ) Hour Average Receptor #431 ( , )
217 CA_Calc.txt 2/22/ Average Receptor #432 ( , ) Average Receptor #433 ( , ) Hour Average Receptor #434 ( , ) Average Receptor #435 ( , ) Hour Average Receptor #436 ( , ) Average Receptor #437 ( , ) Hour
218 CA_Calc.txt 2/22/ Average Receptor #438 ( , ) Average Receptor #439 ( , ) Average Receptor #440 ( , ) Average Receptor #441 ( , ) Average Receptor #442 ( , ) Average Receptor #443 ( , )
219 CA_Calc.txt 2/22/ Average Receptor #444 ( , ) Hour Average Receptor #445 ( , ) Average Receptor #446 ( , ) Average Receptor #447 ( , ) Average Receptor #448 ( , ) Hour Average Receptor #449 ( , )
220 CA_Calc.txt 2/22/ Average Receptor #450 ( , ) Average Receptor #451 ( , ) Average Receptor #452 ( , ) Average Receptor #453 ( , ) Average Receptor #454 ( , ) Average Receptor #455 ( , ) Hour
221 CA_Calc.txt 2/22/2011 Average Receptor #456 ( , ) Hour Average Receptor #457 ( , ) Average Receptor #458 ( , ) Average Receptor #459 ( , ) Average Receptor #460 ( , ) Average Receptor #461 ( , )
222 CA_Calc.txt 2/22/2011 Average Receptor #462 ( , ) Average Receptor #463 ( , ) Average Receptor #464 ( , ) Average Receptor #465 ( , ) Average Receptor #466 ( , ) Average Receptor #467 ( , ) Average
223 CA_Calc.txt 2/22/2011 Receptor #468 ( , ) Hour Average Receptor #469 ( , ) Hour Average Receptor #470 ( , ) Average Receptor #471 ( , ) Average Receptor #472 ( , ) Average Receptor #473 ( , ) Hour Average
224 CA_Calc.txt 2/22/2011 Receptor #474 ( , ) Average Receptor #475 ( , ) Average Receptor #476 ( , ) Average Receptor #477 ( , ) Average Receptor #478 ( , ) Average Receptor #479 ( , ) Average Receptor #480 ( , ) 79
225 CA_Calc.txt 2/22/ Average Receptor #481 ( , ) Average Receptor #482 ( , ) Average Receptor #483 ( , ) Average Receptor #484 ( , ) Average Receptor #485 ( , ) Average Receptor #486 ( , ) 80
226 CA_Calc.txt 2/22/ Average Receptor #487 ( , ) Average Receptor #488 ( , ) Average Receptor #489 ( , ) Average Receptor #490 ( , ) Hour Average Receptor #491 ( , ) Average Receptor #492 ( , ) 81
227 CA_Calc.txt 2/22/ Average Receptor #493 ( , ) Average Receptor #494 ( , ) Average Receptor #495 ( , ) Average Receptor #496 ( , ) Average Receptor #497 ( , ) Hour Average Receptor #498 ( , )
228 CA_Calc.txt 2/22/ Average Receptor #499 ( , ) Average Receptor #500 ( , ) Hour Average Receptor #501 ( , ) Average Receptor #502 ( , ) Hour Average Receptor #503 ( , ) Average Receptor #504 ( , ) Hour
229 CA_Calc.txt 2/22/ Average Receptor #505 ( , ) Average Receptor #506 ( , ) Average Receptor #507 ( , ) Average Receptor #508 ( , ) Average Receptor #509 ( , ) Average Receptor #510 ( , )
230 CA_Calc.txt 2/22/ Average Receptor #511 ( , ) Hour Average Receptor #512 ( , ) Average Receptor #513 ( , ) Average Receptor #514 ( , ) Average Receptor #515 ( , ) Hour Average Receptor #516 ( , )
231 CA_Calc.txt 2/22/ Average Receptor #517 ( , ) Average Receptor #518 ( , ) Average Receptor #519 ( , ) Average Receptor #520 ( , ) Average Receptor #521 ( , ) Average Receptor #522 ( , ) Hour
232 CA_Calc.txt 2/22/2011 Average Receptor #523 ( , ) Hour Average Receptor #524 ( , ) Average Receptor #525 ( , ) Average Receptor #526 ( , ) Average Receptor #527 ( , ) Average Receptor #528 ( , )
233 CA_Calc.txt 2/22/2011 Average Receptor #529 ( , ) Average Receptor #530 ( , ) Average Receptor #531 ( , ) Average Receptor #532 ( , ) Average Receptor #533 ( , ) Average Receptor #534 ( , ) Average
234 CA_Calc.txt 2/22/2011 Receptor #535 ( , ) Hour Average Receptor #536 ( , ) Hour Average Receptor #537 ( , ) Average Receptor #538 ( , ) Average Receptor #539 ( , ) Average Receptor #540 ( , ) Hour Average
235 CA_Calc.txt 2/22/2011 Receptor #541 ( , ) Average Receptor #542 ( , ) Average Receptor #543 ( , ) Average Receptor #544 ( , ) Average Receptor #545 ( , ) Average Receptor #546 ( , ) Average Receptor #547 ( , ) 90
236 CA_Calc.txt 2/22/ Average Receptor #548 ( , ) Average Receptor #549 ( , ) Average Receptor #550 ( , ) Average Receptor #551 ( , ) Average Receptor #552 ( , ) Average Receptor #553 ( , ) 91
237 CA_Calc.txt 2/22/ Average Receptor #554 ( , ) Average Receptor #555 ( , ) Average Receptor #556 ( , ) Average Receptor #557 ( , ) Hour Average Receptor #558 ( , ) Average Receptor #559 ( , ) 92
238 CA_Calc.txt 2/22/ Average Receptor #560 ( , ) Average Receptor #561 ( , ) Average Receptor #562 ( , ) Average Receptor #563 ( , ) Average Receptor #564 ( , ) Hour Average Receptor #565 ( , )
239 CA_Calc.txt 2/22/ Average Receptor #566 ( , ) Average Receptor #567 ( , ) Hour Average Receptor #568 ( , ) Average Receptor #569 ( , ) Hour Average Receptor #570 ( , ) Average Receptor #571 ( , ) Hour
240 CA_Calc.txt 2/22/ Average Receptor #572 ( , ) Average Receptor #573 ( , ) Average Receptor #574 ( , ) Average Receptor #575 ( , ) Average Receptor #576 ( , ) Average Receptor #577 ( , )
241 CA_Calc.txt 2/22/ Average Receptor #578 ( , ) Hour Average Receptor #579 ( , ) Average Receptor #580 ( , ) Average Receptor #581 ( , ) Average Receptor #582 ( , ) Hour Average Receptor #583 ( , )
242 CA_Calc.txt 2/22/ Average Receptor #584 ( , ) Average Receptor #585 ( , ) Average Receptor #586 ( , ) Average Receptor #587 ( , ) Average Receptor #588 ( , ) Average Receptor #589 ( , ) Hour
243 CA_Calc.txt 2/22/2011 Average Receptor #590 ( , ) Hour Average Receptor #591 ( , ) Average Receptor #592 ( , ) Average Receptor #593 ( , ) Average Receptor #594 ( , ) Average Receptor #595 ( , )
244 CA_Calc.txt 2/22/2011 Average Receptor #596 ( , ) Average Receptor #597 ( , ) Average Receptor #598 ( , ) Average Receptor #599 ( , ) Average Receptor #600 ( , ) Average Receptor #601 ( , ) Average
245 CA_Calc.txt 2/22/2011 Receptor #602 ( , ) Hour Average Receptor #603 ( , ) Hour Average Receptor #604 ( , ) Average Receptor #605 ( , ) Average Receptor #606 ( , ) Average Receptor #607 ( , ) Hour Average
246 CA_Calc.txt 2/22/2011 Receptor #608 ( , ) Average Receptor #609 ( , ) Average Receptor #610 ( , ) Average Receptor #611 ( , ) Average Receptor #612 ( , ) Average Receptor #613 ( , ) Average Receptor #614 ( , ) 101
247 CA_Calc.txt 2/22/ Average Receptor #615 ( , ) Average Receptor #616 ( , ) Average Receptor #617 ( , ) Average Receptor #618 ( , ) Average Receptor #619 ( , ) Average Receptor #620 ( , ) 102
248 CA_Calc.txt 2/22/ Average Receptor #621 ( , ) Average Receptor #622 ( , ) Average Receptor #623 ( , ) Average Receptor #624 ( , ) Hour Average Receptor #625 ( , ) Average Receptor #626 ( , ) 103
249 CA_Calc.txt 2/22/ Average Receptor #627 ( , ) Average Receptor #628 ( , ) Average Receptor #629 ( , ) Average Receptor #630 ( , ) Average Receptor #631 ( , ) Hour Average Receptor #632 ( , )
250 CA_Calc.txt 2/22/ Average Receptor #633 ( , ) Average Receptor #634 ( , ) Hour Average Receptor #635 ( , ) Average Receptor #636 ( , ) Hour Average Receptor #637 ( , ) Average Receptor #638 ( , ) Hour
251 CA_Calc.txt 2/22/ Average Receptor #639 ( , ) Average Receptor #640 ( , ) Average Receptor #641 ( , ) Average Receptor #642 ( , ) Average Receptor #643 ( , ) Average Receptor #644 ( , )
252 CA_Calc.txt 2/22/ Average Receptor #645 ( , ) Hour Average Receptor #646 ( , ) Average Receptor #647 ( , ) Average Receptor #648 ( , ) Average Receptor #649 ( , ) Hour Average Receptor #650 ( , )
253 CA_Calc.txt 2/22/ Average Receptor #651 ( , ) Average Receptor #652 ( , ) Average Receptor #653 ( , ) Average Receptor #654 ( , ) Average Receptor #655 ( , ) Average Receptor #656 ( , ) Hour
254 CA_Calc.txt 2/22/2011 Average Receptor #657 ( , ) Hour Average Receptor #658 ( , ) Average Receptor #659 ( , ) Average Receptor #660 ( , ) Average Receptor #661 ( , ) Average Receptor #662 ( , )
255 CA_Calc.txt 2/22/2011 Average Receptor #663 ( , ) Average Receptor #664 ( , ) Average Receptor #665 ( , ) Average Receptor #666 ( , ) Average Receptor #667 ( , ) Average Receptor #668 ( , ) Average
256 CA_Calc.txt 2/22/2011 Receptor #669 ( , ) Hour Average Receptor #670 ( , ) Hour Average Receptor #671 ( , ) Average Receptor #672 ( , ) Average Receptor #673 ( , ) Average Receptor #674 ( , ) Hour Average
257 CA_Calc.txt 2/22/2011 Receptor #675 ( , ) Average Receptor #676 ( , ) Average Receptor #677 ( , ) Average Receptor #678 ( , ) Average Receptor #679 ( , ) Average Receptor #680 ( , ) Average Receptor #681 ( , ) 112
258 CA_Calc.txt 2/22/ Average Receptor #682 ( , ) Average Receptor #683 ( , ) Average Receptor #684 ( , ) Average Receptor #685 ( , ) Average Receptor #686 ( , ) Average Receptor #687 ( , ) 113
259 CA_Calc.txt 2/22/ Average Receptor #688 ( , ) Average Receptor #689 ( , ) Average Receptor #690 ( , ) Average Receptor #691 ( , ) Hour Average Receptor #692 ( , ) Average Receptor #693 ( , ) 114
260 CA_Calc.txt 2/22/ Average Receptor #694 ( , ) Average Receptor #695 ( , ) Average Receptor #696 ( , ) Average Receptor #697 ( , ) Average Receptor #698 ( , ) Hour Average Receptor #699 ( , )
261 CA_Calc.txt 2/22/ Average Receptor #700 ( , ) Average Receptor #701 ( , ) Hour Average Receptor #702 ( , ) Average Receptor #703 ( , ) Hour Average Receptor #704 ( , ) Average Receptor #705 ( , ) Hour
262 CA_Calc.txt 2/22/ Average Receptor #706 ( , ) Average Receptor #707 ( , ) Average Receptor #708 ( , ) Average Receptor #709 ( , ) Average Receptor #710 ( , ) Average Receptor #711 ( , )
263 CA_Calc.txt 2/22/ Average Receptor #712 ( , ) Hour Average Receptor #713 ( , ) Average Receptor #714 ( , ) Average Receptor #715 ( , ) Average Receptor #716 ( , ) Hour Average Receptor #717 ( , )
264 CA_Calc.txt 2/22/ Average Receptor #718 ( , ) Average Receptor #719 ( , ) Average Receptor #720 ( , ) Average Receptor #721 ( , ) Average Receptor #722 ( , ) Average Receptor #723 ( , ) Hour
265 CA_Calc.txt 2/22/2011 Average Receptor #724 ( , ) Hour Average Receptor #725 ( , ) Average Receptor #726 ( , ) Average Receptor #727 ( , ) Average Receptor #728 ( , ) Average Receptor #729 ( , )
266 CA_Calc.txt 2/22/2011 Average Receptor #730 ( , ) Average Receptor #731 ( , ) Average Receptor #732 ( , ) Average Receptor #733 ( , ) Average Receptor #734 ( , ) Average Receptor #735 ( , ) Average
267 CA_Calc.txt 2/22/2011 Receptor #736 ( , ) Hour Average Receptor #737 ( , ) Hour Average Receptor #738 ( , ) Average Receptor #739 ( , ) Average Receptor #740 ( , ) Average Receptor #741 ( , ) Hour Average
268 CA_Calc.txt 2/22/2011 Receptor #742 ( , ) Average Receptor #743 ( , ) Average Receptor #744 ( , ) Average Receptor #745 ( , ) Average Receptor #746 ( , ) Average Receptor #747 ( , ) Average Receptor #748 ( , ) 123
269 CA_Calc.txt 2/22/ Average Receptor #749 ( , ) Average Receptor #750 ( , ) Average Receptor #751 ( , ) Average Receptor #752 ( , ) Average Receptor #753 ( , ) Average Receptor #754 ( , ) 124
270 CA_Calc.txt 2/22/ Average Receptor #755 ( , ) Average Receptor #756 ( , ) Average Receptor #757 ( , ) Average Receptor #758 ( , ) Hour Average Receptor #759 ( , ) Average Receptor #760 ( , ) 125
271 CA_Calc.txt 2/22/ Average Receptor #761 ( , ) Average Receptor #762 ( , ) Average Receptor #763 ( , ) Average Receptor #764 ( , ) Average Receptor #765 ( , ) Hour Average Receptor #766 ( , )
272 CA_Calc.txt 2/22/ Average Receptor #767 ( , ) Average Receptor #768 ( , ) Hour Average Receptor #769 ( , ) Average Receptor #770 ( , ) Hour Average Receptor #771 ( , ) Average Receptor #772 ( , ) Hour
273 CA_Calc.txt 2/22/ Average Receptor #773 ( , ) Average Receptor #774 ( , ) Average Receptor #775 ( , ) Average Receptor #776 ( , ) Average Receptor #777 ( , ) Average Receptor #778 ( , )
274 CA_Calc.txt 2/22/ Average Receptor #779 ( , ) Hour Average Receptor #780 ( , ) Average Receptor #781 ( , ) Average Receptor #782 ( , ) Average Receptor #783 ( , ) Hour Average Receptor #784 ( , )
275 CA_Calc.txt 2/22/ Average Receptor #785 ( , ) Average Receptor #786 ( , ) Average Receptor #787 ( , ) Average Receptor #788 ( , ) Average Receptor #789 ( , ) Average Receptor #790 ( , ) Hour
276 CA_Calc.txt 2/22/2011 Average Receptor #791 ( , ) Hour Average Receptor #792 ( , ) Average Receptor #793 ( , ) Average Receptor #794 ( , ) Average Receptor #795 ( , ) Average Receptor #796 ( , )
277 CA_Calc.txt 2/22/2011 Average Receptor #797 ( , ) Average Receptor #798 ( , ) Average Receptor #799 ( , ) Average Receptor #800 ( , ) Average Receptor #801 ( , ) Average Receptor #802 ( , ) Average
278 CA_Calc.txt 2/22/2011 Receptor #803 ( , ) Hour Average Receptor #804 ( , ) Hour Average Receptor #805 ( , ) Average Receptor #806 ( , ) Average Receptor #807 ( , ) Average Receptor #808 ( , ) Hour Average
279 CA_Calc.txt 2/22/2011 Receptor #809 ( , ) Average Receptor #810 ( , ) Average Receptor #811 ( , ) Average Receptor #812 ( , ) Average Receptor #813 ( , ) Average Receptor #814 ( , ) Average Receptor #815 ( , ) 134
280 CA_Calc.txt 2/22/ Average Receptor #816 ( , ) Average Receptor #817 ( , ) Average Receptor #818 ( , ) Average Receptor #819 ( , ) Average Receptor #820 ( , ) Average Receptor #821 ( , ) 135
281 CA_Calc.txt 2/22/ Average Receptor #822 ( , ) Average Receptor #823 ( , ) Average Receptor #824 ( , ) Average Receptor #825 ( , ) Hour Average Receptor #826 ( , ) Average Receptor #827 ( , ) 136
282 CA_Calc.txt 2/22/ Average Receptor #828 ( , ) Average Receptor #829 ( , ) Average Receptor #830 ( , ) Average Receptor #831 ( , ) Average Receptor #832 ( , ) Hour Average Receptor #833 ( , )
283 CA_Calc.txt 2/22/ Average Receptor #834 ( , ) Average Receptor #835 ( , ) Hour Average Receptor #836 ( , ) Average Receptor #837 ( , ) Hour Average Receptor #838 ( , ) Average Receptor #839 ( , ) Hour
284 CA_Calc.txt 2/22/ Average Receptor #840 ( , ) Average Receptor #841 ( , ) Average Receptor #842 ( , ) Average Receptor #843 ( , ) Average Receptor #844 ( , ) Average Receptor #845 ( , )
285 CA_Calc.txt 2/22/ Average Receptor #846 ( , ) Hour Average Receptor #847 ( , ) Average Receptor #848 ( , ) Average Receptor #849 ( , ) Average Receptor #850 ( , ) Hour Average Receptor #851 ( , )
286 CA_Calc.txt 2/22/ Average Receptor #852 ( , ) Average Receptor #853 ( , ) Average Receptor #854 ( , ) Average Receptor #855 ( , ) Average Receptor #856 ( , ) Average Receptor #857 ( , ) Hour
287 CA_Calc.txt 2/22/2011 Average Receptor #858 ( , ) Hour Average Receptor #859 ( , ) Average Receptor #860 ( , ) Average Receptor #861 ( , ) Average Receptor #862 ( , ) Average Receptor #863 ( , )
288 CA_Calc.txt 2/22/2011 Average Receptor #864 ( , ) Average Receptor #865 ( , ) Average Receptor #866 ( , ) Average Receptor #867 ( , ) Average Receptor #868 ( , ) Average Receptor #869 ( , ) Average
289 CA_Calc.txt 2/22/2011 Receptor #870 ( , ) Hour Average Receptor #871 ( , ) Hour Average Receptor #872 ( , ) Average Receptor #873 ( , ) Average Receptor #874 ( , ) Average Receptor #875 ( , ) Hour Average
290 CA_Calc.txt 2/22/2011 Receptor #876 ( , ) Average Receptor #877 ( , ) Average Receptor #878 ( , ) Average Receptor #879 ( , ) Average Receptor #880 ( , ) Average Receptor #881 ( , ) Average Receptor #882 ( , ) 145
291 CA_Calc.txt 2/22/ Average Receptor #883 ( , ) Average Receptor #884 ( , ) Average Receptor #885 ( , ) Average Receptor #886 ( , ) Average Receptor #887 ( , ) Average Receptor #888 ( , ) 146
292 CA_Calc.txt 2/22/ Average Receptor #889 ( , ) Average Receptor #890 ( , ) Average Receptor #891 ( , ) Average Receptor #892 ( , ) Hour Average Receptor #893 ( , ) Average Receptor #894 ( , ) 147
293 CA_Calc.txt 2/22/ Average Receptor #895 ( , ) Average Receptor #896 ( , ) Average Receptor #897 ( , ) Average Receptor #898 ( , ) Average Receptor #899 ( , ) Hour Average Receptor #900 ( , )
294 CA_Calc.txt 2/22/ Average Receptor #901 ( , ) Average Receptor #902 ( , ) Hour Average Receptor #903 ( , ) Average Receptor #904 ( , ) Hour Average Receptor #905 ( , ) Average Receptor #906 ( , ) Hour
295 CA_Calc.txt 2/22/ Average Receptor #907 ( , ) Average Receptor #908 ( , ) Average Receptor #909 ( , ) Average Receptor #910 ( , ) Average
296 APPENDIX G VISCREEN PRINTOUTS G-1
297 CCC_1208.SUM 12/19/2008 Visual Effects Screening Analysis for Source: Carolina Cement Company Class I Area: Class I *** Level-1 Screening *** Input Emissions for Particulates LB /HR NOx (as NO2) LB /HR Primary NO2.00 LB /HR Soot.00 LB /HR Primary SO4.00 LB /HR **** Default Particle Characteristics Assumed Transport Scenario Specifications: Background Ozone: Background Visual Range: Source-Observer Distance: Min. Source-Class I Distance: Max. Source-Class I Distance: Plume-Source-Observer Angle: Stability: 6 Wind Speed: 1.00 m/s.04 ppm km km km km degrees R E S U L T S Asterisks (*) indicate plume impacts that exceed screening criteria Maximum Visual Impacts INSIDE Class I Area Screening Criteria ARE Exceeded Delta E Contrast =========== ============ Backgrnd Theta Azi Distance Alpha Crit Plume Crit Plume ======== ===== === ======== ===== ==== ===== ==== ===== SKY * * SKY * * TERRAIN * * TERRAIN * * Maximum Visual Impacts OUTSIDE Class I Area Screening Criteria ARE Exceeded Delta E Contrast =========== ============ Backgrnd Theta Azi Distance Alpha Crit Plume Crit Plume ======== ===== === ======== ===== ==== ===== ==== ===== SKY * * SKY * * TERRAIN * * TERRAIN * * Visual Effects Screening Analysis for Source: Carolina Cement Company Class I Area: Class I *** Level-1 Screening *** Input Emissions for Particulates NOx (as NO2) LB /HR LB /HR Primary NO2.00 LB /HR 1
298 CCC_1208.SUM 12/19/2008 Soot.00 LB /HR Primary SO4.00 LB /HR **** Default Particle Characteristics Assumed Transport Scenario Specifications: Background Ozone: Background Visual Range: Source-Observer Distance: Min. Source-Class I Distance: Max. Source-Class I Distance: Plume-Source-Observer Angle: Stability: 6 Wind Speed: 1.00 m/s.04 ppm km km km km degrees R E S U L T S Asterisks (*) indicate plume impacts that exceed screening criteria Maximum Visual Impacts INSIDE Class I Area Screening Criteria ARE Exceeded Delta E Contrast =========== ============ Backgrnd Theta Azi Distance Alpha Crit Plume Crit Plume ======== ===== === ======== ===== ==== ===== ==== ===== SKY * * SKY * * TERRAIN * * TERRAIN * Maximum Visual Impacts OUTSIDE Class I Area Screening Criteria ARE Exceeded Delta E Contrast =========== ============ Backgrnd Theta Azi Distance Alpha Crit Plume Crit Plume ======== ===== === ======== ===== ==== ===== ==== ===== SKY * * SKY * * TERRAIN * * TERRAIN * * Visual Effects Screening Analysis for Source: Carolina Cement Company Class I Area: Class I *** Level-1 Screening *** Input Emissions for Particulates LB /HR NOx (as NO2) LB /HR Primary NO2 Soot LB /HR LB /HR Primary SO4.00 LB /HR **** Default Particle Characteristics Assumed Transport Scenario Specifications: Background Ozone: Background Visual Range: Source-Observer Distance: Min. Source-Class I Distance:.04 ppm km km km 2
299 CCC_1208.SUM 12/19/2008 Max. Source-Class I Distance: Plume-Source-Observer Angle: Stability: 6 Wind Speed: 1.00 m/s km degrees R E S U L T S Asterisks (*) indicate plume impacts that exceed screening criteria Maximum Visual Impacts INSIDE Class I Area Screening Criteria ARE Exceeded Delta E Contrast =========== ============ Backgrnd Theta Azi Distance Alpha Crit Plume Crit Plume ======== ===== === ======== ===== ==== ===== SKY * ====.05 =====.062* SKY * * TERRAIN * * TERRAIN * Maximum Visual Impacts OUTSIDE Class I Area Screening Criteria ARE Exceeded Delta E Contrast =========== ============ Backgrnd Theta Azi Distance Alpha Crit Plume Crit Plume ======== ===== === ======== ===== ==== ===== ==== ===== SKY * * SKY * * TERRAIN * * TERRAIN * * Visual Effects Screening Analysis for Source: Carolina Cement Company Class I Area: Class I *** Level-1 Screening *** Input Emissions for Particulates LB /HR NOx (as NO2) LB /HR Primary NO2 Soot LB /HR LB /HR Primary SO4.00 LB /HR **** Default Particle Characteristics Assumed Transport Scenario Specifications: Background Ozone: Background Visual Range: Source-Observer Distance: Min. Source-Class I Distance: Max. Source-Class I Distance: Plume-Source-Observer Angle: Stability: 6 Wind Speed: 1.00 m/s.04 ppm km km km km degrees R E S U L T S Asterisks (*) indicate plume impacts that exceed screening criteria Maximum Visual Impacts INSIDE Class I Area Screening Criteria ARE Exceeded Delta E Contrast 3
300 CCC_1208.SUM 12/19/2008 =========== ============ Backgrnd Theta Azi Distance Alpha Crit Plume Crit Plume ======== ===== === ======== ===== ==== ===== ==== ===== SKY SKY * * * -.102* TERRAIN 10. TERRAIN * * *.039 Maximum Visual Impacts OUTSIDE Class I Area Screening Criteria ARE Exceeded Delta E Contrast =========== ============ Backgrnd Theta Azi Distance Alpha Crit Plume Crit Plume ======== ===== === ======== ===== ==== ===== SKY * ====.05 =====.289* SKY * * TERRAIN * * TERRAIN * * Visual Effects Screening Analysis for Source: Carolina Cement Company Class I Area: Class I *** Level-1 Screening *** Input Emissions for Particulates LB /HR NOx (as NO2) LB /HR Primary NO2.00 LB /HR Soot.00 LB /HR Primary SO4.00 LB /HR **** Default Particle Characteristics Assumed Transport Scenario Specifications: Background Ozone: Background Visual Range: Source-Observer Distance: Min. Source-Class I Distance: Max. Source-Class I Distance: Plume-Source-Observer Angle: Stability: 6 Wind Speed: 1.00 m/s.04 ppm km km km km degrees R E S U L T S Asterisks (*) indicate plume impacts that exceed screening criteria Maximum Visual Impacts INSIDE Class I Area Screening Criteria ARE Exceeded Delta E =========== Contrast ============ Backgrnd Theta Azi Distance Alpha Crit Plume Crit Plume ======== ===== === ======== ===== ==== ===== ==== ===== SKY SKY * * * TERRAIN * * TERRAIN Maximum Visual Impacts OUTSIDE Class I Area Screening Criteria ARE Exceeded Delta E Contrast 4
301 CCC_1208.SUM 12/19/2008 =========== ============ Backgrnd Theta Azi Distance Alpha Crit Plume Crit Plume ======== ===== === ======== ===== ==== ===== ==== ===== SKY SKY * * * -.140* TERRAIN 10. TERRAIN * * *.212* Visual Effects Screening Analysis for Source: Carolina Cement Company Class I Area: Class I *** Level-1 Screening *** Input Emissions for Particulates LB /HR NOx (as NO2) LB /HR Primary NO2.00 LB /HR Soot.00 LB /HR Primary SO4.00 LB /HR **** Default Particle Characteristics Assumed Transport Scenario Specifications: Background Ozone: Background Visual Range: Source-Observer Distance: Min. Source-Class I Distance: Max. Source-Class I Distance: Plume-Source-Observer Angle: Stability: 6 Wind Speed: 1.00 m/s.04 ppm km km km km degrees R E S U L T S Asterisks (*) indicate plume impacts that exceed screening criteria Maximum Visual Impacts INSIDE Class I Area Screening Criteria ARE Exceeded Delta E Contrast =========== ============ Backgrnd Theta Azi Distance Alpha Crit Plume Crit Plume ======== ===== === ======== ===== ==== ===== ==== ===== SKY * SKY * * TERRAIN * * TERRAIN Maximum Visual Impacts OUTSIDE Class I Area Screening Criteria ARE Exceeded Delta E =========== Contrast ============ Backgrnd Theta Azi Distance Alpha Crit Plume Crit Plume ======== ===== === ======== ===== ==== ===== ==== ===== SKY SKY * * * -.110* TERRAIN * * TERRAIN * * Visual Effects Screening Analysis for Source: Carolina Cement Company Class I Area: Class I 5
302 CCC_1208.SUM 12/19/2008 *** Level-1 Screening *** Input Emissions for Particulates LB /HR NOx (as NO2) Primary NO LB /HR LB /HR Soot Primary SO LB /HR LB /HR **** Default Particle Characteristics Assumed Transport Scenario Specifications: Background Ozone: Background Visual Range: Source-Observer Distance: Min. Source-Class I Distance: Max. Source-Class I Distance: Plume-Source-Observer Angle: Stability: 6 Wind Speed: 1.00 m/s.04 ppm km km km km degrees R E S U L T S Asterisks (*) indicate plume impacts that exceed screening criteria Maximum Visual Impacts INSIDE Class I Area Screening Criteria ARE Exceeded Delta E Contrast =========== ============ Backgrnd Theta Azi Distance Alpha Crit Plume Crit Plume ======== ===== === ======== ===== ==== ===== ==== ===== SKY * SKY * * TERRAIN * * TERRAIN Maximum Visual Impacts OUTSIDE Class I Area Screening Criteria ARE Exceeded Delta E Contrast =========== ============ Backgrnd Theta Azi Distance Alpha Crit Plume Crit Plume ======== ===== === ======== ===== ==== ===== ==== ===== SKY * * SKY * * TERRAIN * * TERRAIN * * Visual Effects Screening Analysis for Source: Carolina Cement Company Class I Area: Class I *** Level-1 Screening *** Input Emissions for Particulates LB /HR NOx (as NO2) LB /HR Primary NO2 Soot LB /HR LB /HR Primary SO4.00 LB /HR **** Default Particle Characteristics Assumed 6
303 CCC_1208.SUM 12/19/2008 Transport Scenario Specifications: Background Ozone: Background Visual Range: Source-Observer Distance: Min. Source-Class I Distance: Max. Source-Class I Distance: Plume-Source-Observer Angle: Stability: 6 Wind Speed: 1.00 m/s.04 ppm km km km km degrees R E S U L T S Asterisks (*) indicate plume impacts that exceed screening criteria Maximum Visual Impacts INSIDE Class I Area Screening Criteria ARE Exceeded Delta E Contrast =========== ============ Backgrnd Theta Azi Distance Alpha Crit ======== ===== === ======== ===== ==== Plume ===== Crit ==== Plume ===== SKY * SKY * * TERRAIN * * TERRAIN Maximum Visual Impacts OUTSIDE Class I Area Screening Criteria ARE Exceeded Delta E Contrast =========== ============ Backgrnd Theta Azi Distance Alpha Crit Plume Crit Plume ======== ===== === ======== ===== ==== ===== ==== ===== SKY * * SKY * TERRAIN * * TERRAIN * * Visual Effects Screening Analysis for Source: Carolina Cement Company Class I Area: Class I *** Level-1 Screening *** Input Emissions for Particulates LB /HR NOx (as NO2) LB /HR Primary NO2.00 LB /HR Soot.00 LB /HR Primary SO4.00 LB /HR **** Default Particle Characteristics Assumed Transport Scenario Specifications: Background Ozone: Background Visual Range: Source-Observer Distance: Min. Source-Class I Distance: Max. Source-Class I Distance: Plume-Source-Observer Angle: Stability: 6 Wind Speed: 1.00 m/s.04 ppm km km km km degrees 7
304 CCC_1208.SUM 12/19/2008 R E S U L T S Asterisks (*) indicate plume impacts that exceed screening criteria Maximum Visual Impacts INSIDE Class I Area Screening Criteria ARE Exceeded Delta E Contrast =========== Backgrnd Theta Azi Distance Alpha Crit Plume ============ Crit Plume ======== ===== === ======== ===== ==== ===== ==== ===== SKY * SKY * TERRAIN * TERRAIN Maximum Visual Impacts OUTSIDE Class I Area Screening Criteria ARE Exceeded Delta E Contrast =========== ============ Backgrnd Theta Azi Distance Alpha Crit ======== ===== === ======== ===== ==== Plume ===== Crit ==== Plume ===== SKY * SKY * * TERRAIN * * TERRAIN * * Visual Effects Screening Analysis for Source: Carolina Cement Company Class I Area: Class I *** Level-1 Screening *** Input Emissions for Particulates LB /HR NOx (as NO2) LB /HR Primary NO2.00 LB /HR Soot.00 LB /HR Primary SO4.00 LB /HR **** Default Particle Characteristics Assumed Transport Scenario Specifications: Background Ozone: Background Visual Range: Source-Observer Distance: Min. Source-Class I Distance: Max. Source-Class I Distance: Plume-Source-Observer Angle: Stability: 6 Wind Speed: 1.00 m/s.04 ppm km km km km degrees R E S U L T S Asterisks (*) indicate plume impacts that exceed screening criteria Maximum Visual Impacts INSIDE Class I Area Screening Criteria ARE Exceeded Delta E =========== Contrast ============ Backgrnd Theta Azi Distance Alpha Crit Plume Crit Plume ======== ===== === ======== ===== ==== SKY ===== 4.905* ====.05 =====.020 SKY *
305 CCC_1208.SUM 12/19/2008 TERRAIN * TERRAIN Maximum Visual Impacts OUTSIDE Class I Area Screening Criteria ARE Exceeded Delta E Contrast =========== Backgrnd Theta Azi Distance Alpha Crit Plume ============ Crit Plume ======== ===== === ======== ===== ==== ===== ==== ===== SKY * SKY * * TERRAIN * * TERRAIN * * Visual Effects Screening Analysis for Source: Carolina Cement Company Class I Area: Class I *** Level-1 Screening *** Input Emissions for Particulates LB /HR NOx (as NO2) LB /HR Primary NO2.00 LB /HR Soot.00 LB /HR Primary SO4.00 LB /HR **** Default Particle Characteristics Assumed Transport Scenario Specifications: Background Ozone: Background Visual Range: Source-Observer Distance: Min. Source-Class I Distance: Max. Source-Class I Distance: Plume-Source-Observer Angle: Stability: 6 Wind Speed: 1.00 m/s.04 ppm km km km km degrees R E S U L T S Asterisks (*) indicate plume impacts that exceed screening criteria Maximum Visual Impacts INSIDE Class I Area Screening Criteria ARE Exceeded Delta E Contrast =========== ============ Backgrnd Theta Azi Distance Alpha Crit Plume Crit Plume ======== ===== === ======== ===== ==== ===== ==== ===== SKY * SKY TERRAIN * TERRAIN Maximum Visual Impacts OUTSIDE Class I Area Screening Criteria ARE Exceeded Delta E =========== Contrast ============ Backgrnd Theta Azi Distance Alpha Crit Plume Crit Plume ======== ===== === ======== ===== ==== SKY ===== 5.856* ====.05 =====.028 SKY * * 9
306 CCC_1208.SUM 12/19/2008 TERRAIN * TERRAIN Visual Effects Screening Analysis for Source: Carolina Cement Company Class I Area: Class I *** Level-1 Screening *** Input Emissions for Particulates LB /HR NOx (as NO2) LB /HR Primary NO2.00 LB /HR Soot Primary SO LB /HR LB /HR **** Default Particle Characteristics Assumed Transport Scenario Specifications: Background Ozone: Background Visual Range: Source-Observer Distance: Min. Source-Class I Distance: Max. Source-Class I Distance: Plume-Source-Observer Angle: Stability: 6 Wind Speed: 1.00 m/s.04 ppm km km km km degrees R E S U L T S Asterisks (*) indicate plume impacts that exceed screening criteria Maximum Visual Impacts INSIDE Class I Area Screening Criteria ARE Exceeded Delta E Contrast =========== ============ Backgrnd Theta Azi Distance Alpha Crit Plume Crit Plume ======== ===== === ======== ===== ==== ===== ==== ===== SKY * SKY TERRAIN TERRAIN Maximum Visual Impacts OUTSIDE Class I Area Screening Criteria ARE Exceeded Delta E Contrast =========== ============ Backgrnd Theta Azi Distance Alpha Crit Plume Crit Plume ======== ===== === ======== ===== ==== ===== ==== ===== SKY * SKY TERRAIN * *.040 TERRAIN Visual Effects Screening Analysis for Source: Carolina Cement Company Class I Area: Class I *** Level-1 Screening *** Input Emissions for Particulates LB /HR 10
307 CCC_1208.SUM 12/19/2008 NOx (as NO2) LB /HR Primary NO2.00 LB /HR Soot.00 LB /HR Primary SO4.00 LB /HR **** Default Particle Characteristics Assumed Transport Scenario Specifications: Background Ozone: Background Visual Range: Source-Observer Distance: Min. Source-Class I Distance: Max. Source-Class I Distance: Plume-Source-Observer Angle: Stability: 6 Wind Speed: 1.00 m/s.04 ppm km km km km degrees R E S U L T S Asterisks (*) indicate plume impacts that exceed screening criteria Maximum Visual Impacts INSIDE Class I Area Screening Criteria ARE Exceeded Delta E Contrast =========== ============ Backgrnd Theta Azi Distance Alpha Crit Plume Crit Plume ======== ===== === ======== ===== ==== ===== ==== ===== SKY * SKY TERRAIN TERRAIN Maximum Visual Impacts OUTSIDE Class I Area Screening Criteria ARE Exceeded Delta E Contrast =========== ============ Backgrnd Theta Azi Distance Alpha Crit Plume Crit Plume ======== ===== === ======== ===== ==== ===== ==== ===== SKY * SKY TERRAIN * TERRAIN Visual Effects Screening Analysis for Source: Carolina Cement Company Class I Area: Class I *** Level-1 Screening *** Input Emissions for Particulates NOx (as NO2) LB /HR LB /HR Primary NO2.00 LB /HR Soot.00 LB /HR Primary SO4.00 LB /HR **** Default Particle Characteristics Assumed Transport Scenario Specifications: Background Ozone: Background Visual Range:.04 ppm km 11
308 CCC_1208.SUM 12/19/2008 Source-Observer Distance: Min. Source-Class I Distance: Max. Source-Class I Distance: Plume-Source-Observer Angle: Stability: 6 Wind Speed: 1.00 m/s km km km degrees R E S U L T S Asterisks (*) indicate plume impacts that exceed screening criteria Maximum Visual Impacts INSIDE Class I Area Screening Criteria ARE Exceeded Delta E Contrast =========== Backgrnd Theta Azi Distance Alpha Crit Plume ============ Crit Plume ======== ===== === ======== ===== ==== ===== ==== ===== SKY * SKY TERRAIN TERRAIN Maximum Visual Impacts OUTSIDE Class I Area Screening Criteria ARE Exceeded Delta E Contrast =========== ============ Backgrnd Theta Azi Distance Alpha Crit Plume Crit Plume ======== ===== === ======== ===== ==== ===== ==== ===== SKY * SKY TERRAIN * TERRAIN Visual Effects Screening Analysis for Source: Carolina Cement Company Class I Area: Class I *** Level-1 Screening *** Input Emissions for Particulates NOx (as NO2) LB /HR LB /HR Primary NO2 Soot LB /HR LB /HR Primary SO4.00 LB /HR **** Default Particle Characteristics Assumed Transport Scenario Specifications: Background Ozone: Background Visual Range: Source-Observer Distance: Min. Source-Class I Distance: Max. Source-Class I Distance: Plume-Source-Observer Angle: Stability: 6 Wind Speed: 1.00 m/s.04 ppm km km km km degrees R E S U L T S Asterisks (*) indicate plume impacts that exceed screening criteria Maximum Visual Impacts INSIDE Class I Area 12
309 CCC_1208.SUM 12/19/2008 Screening Criteria ARE Exceeded Delta E Contrast =========== ============ Backgrnd Theta Azi Distance Alpha Crit ======== ===== === ======== ===== ==== Plume ===== Crit ==== Plume ===== SKY SKY * TERRAIN 10. TERRAIN Maximum Visual Impacts OUTSIDE Class I Area Screening Criteria ARE Exceeded Delta E Contrast =========== Backgrnd Theta Azi Distance Alpha Crit Plume ============ Crit Plume ======== ===== === ======== ===== ==== ===== ==== ===== SKY * SKY TERRAIN TERRAIN Visual Effects Screening Analysis for Source: Carolina Cement Company Class I Area: Class I *** Level-1 Screening *** Input Emissions for Particulates LB /HR NOx (as NO2) LB /HR Primary NO2.00 LB /HR Soot.00 LB /HR Primary SO4.00 LB /HR **** Default Particle Characteristics Assumed Transport Scenario Specifications: Background Ozone: Background Visual Range: Source-Observer Distance: Min. Source-Class I Distance: Max. Source-Class I Distance: Plume-Source-Observer Angle: Stability: 6 Wind Speed: 1.00 m/s.04 ppm km km km km degrees R E S U L T S Asterisks (*) indicate plume impacts that exceed screening criteria Maximum Visual Impacts INSIDE Class I Area Screening Criteria ARE Exceeded Delta E Contrast =========== ============ Backgrnd Theta Azi Distance Alpha Crit ======== ===== === ======== ===== ==== Plume ===== Crit ==== Plume ===== SKY * SKY TERRAIN TERRAIN Maximum Visual Impacts OUTSIDE Class I Area 13
310 CCC_1208.SUM 12/19/2008 Screening Criteria ARE Exceeded Delta E Contrast =========== ============ Backgrnd Theta Azi Distance Alpha Crit ======== ===== === ======== ===== ==== Plume ===== Crit ==== Plume ===== SKY SKY * TERRAIN 10. TERRAIN Visual Effects Screening Analysis for Source: Carolina Cement Company Class I Area: Class I *** Level-1 Screening *** Input Emissions for Particulates LB /HR NOx (as NO2) LB /HR Primary NO2 Soot LB /HR LB /HR Primary SO4.00 LB /HR **** Default Particle Characteristics Assumed Transport Scenario Specifications: Background Ozone: Background Visual Range: Source-Observer Distance: Min. Source-Class I Distance: Max. Source-Class I Distance: Plume-Source-Observer Angle: Stability: 6 Wind Speed: 1.00 m/s.04 ppm km km km km degrees R E S U L T S Asterisks (*) indicate plume impacts that exceed screening criteria Maximum Visual Impacts INSIDE Class I Area Screening Criteria ARE NOT Exceeded Delta E Contrast =========== ============ Backgrnd Theta Azi Distance Alpha Crit Plume Crit Plume ======== ===== === ======== ===== ==== ===== ==== ===== SKY SKY TERRAIN TERRAIN Maximum Visual Impacts OUTSIDE Class I Area Screening Criteria ARE Exceeded Delta E Contrast =========== ============ Backgrnd Theta Azi Distance Alpha Crit ======== ===== === ======== ===== ==== Plume ===== Crit ==== Plume ===== SKY * SKY TERRAIN TERRAIN Visual Effects Screening Analysis for Source: Carolina Cement Company 14
311 CCC_1208.SUM 12/19/2008 Class I Area: Class I *** Level-1 Screening *** Input Emissions for Particulates LB /HR NOx (as NO2) Primary NO LB /HR LB /HR Soot.00 LB /HR Primary SO4.00 LB /HR **** Default Particle Characteristics Assumed Transport Scenario Specifications: Background Ozone: Background Visual Range: Source-Observer Distance: Min. Source-Class I Distance: Max. Source-Class I Distance: Plume-Source-Observer Angle: Stability: 6 Wind Speed: 1.00 m/s.04 ppm km km km km degrees R E S U L T S Asterisks (*) indicate plume impacts that exceed screening criteria Maximum Visual Impacts INSIDE Class I Area Screening Criteria ARE NOT Exceeded Delta E Contrast =========== ============ Backgrnd Theta Azi Distance Alpha Crit Plume Crit Plume ======== ===== === ======== ===== ==== ===== ==== ===== SKY SKY TERRAIN TERRAIN Maximum Visual Impacts OUTSIDE Class I Area Screening Criteria ARE NOT Exceeded Delta E Contrast =========== ============ Backgrnd Theta Azi Distance Alpha Crit Plume Crit Plume ======== ===== === ======== ===== ==== ===== ==== ===== SKY SKY TERRAIN TERRAIN Visual Effects Screening Analysis for Source: Carolina Cement Company Class I Area: Class I *** Level-1 Screening *** Input Emissions for Particulates NOx (as NO2) LB /HR LB /HR Primary NO2.00 LB /HR Soot Primary SO LB /HR LB /HR 15
312 CCC_1208.SUM 12/19/2008 **** Default Particle Characteristics Assumed Transport Scenario Specifications: Background Ozone: Background Visual Range: Source-Observer Distance: Min. Source-Class I Distance: Max. Source-Class I Distance: Plume-Source-Observer Angle: Stability: 6 Wind Speed: 1.00 m/s.04 ppm km km km km degrees R E S U L T S Asterisks (*) indicate plume impacts that exceed screening criteria Maximum Visual Impacts INSIDE Class I Area Screening Criteria ARE NOT Exceeded Delta E =========== Contrast ============ Backgrnd Theta Azi Distance Alpha Crit Plume Crit Plume ======== ===== === ======== ===== ==== ===== ==== ===== SKY SKY TERRAIN TERRAIN Maximum Visual Impacts OUTSIDE Class I Area Screening Criteria ARE NOT Exceeded Delta E Contrast =========== ============ Backgrnd Theta Azi Distance Alpha Crit Plume Crit Plume ======== ===== === ======== ===== ==== ===== ==== ===== SKY SKY TERRAIN TERRAIN Visual Effects Screening Analysis for Source: Carolina Cement Company Class I Area: Class I *** Level-1 Screening *** Input Emissions for Particulates LB /HR NOx (as NO2) LB /HR Primary NO2.00 LB /HR Soot.00 LB /HR Primary SO4.00 LB /HR **** Default Particle Characteristics Assumed Transport Scenario Specifications: Background Ozone: Background Visual Range: Source-Observer Distance: Min. Source-Class I Distance: Max. Source-Class I Distance: Plume-Source-Observer Angle: Stability: 6.04 ppm km km km km degrees 16
313 CCC_1208.SUM 12/19/2008 Wind Speed: 1.00 m/s R E S U L T S Asterisks (*) indicate plume impacts that exceed screening criteria Maximum Visual Impacts INSIDE Class I Area Screening Criteria ARE NOT Exceeded Delta E Contrast =========== ============ Backgrnd Theta Azi Distance Alpha Crit Plume Crit Plume ======== ===== === ======== ===== ==== ===== ==== ===== SKY SKY TERRAIN 10. TERRAIN Maximum Visual Impacts OUTSIDE Class I Area Screening Criteria ARE NOT Exceeded Delta E =========== Contrast ============ Backgrnd Theta Azi Distance Alpha Crit Plume Crit Plume ======== ===== === ======== ===== ==== ===== ==== ===== SKY SKY TERRAIN TERRAIN
314 APPENDIX H DETAILED SOILS AND VEGETATION ANALYSIS H-1
315 Additional Impact Analysis (AIA) Detailed Soils and Vegetation Carolinas Cement Company LLC Castle Hayne Plant Prepared for: Carolinas Cement Company LLC Castle Hayne, North Carolina Submitted by: Falcon Engineering, Inc Rowland Road Raleigh, North Carolina (919) Project Number E February 25, 2011
316 TABLE OF CONTENTS Page Figures... III Tables... III Executive Summary... IV Section 1 Project Background and Analysis Overview Introduction Soil and Vegetation Analysis Overview... 1 Section 2 Soils and Vegetation Survey Soils Survey Vegetation Survey Overview of Vegetation and Land Use Agriculture and Forestry Natural Communities Classifications Summary of Natural Communities... 9 Section 3 Soil and Vegetation Sensitivity to Exposure Direct NOx Exposure Direct SO2 Exposure Direct CO Exposure Direct and Indirect PM Exposure Direct and Indirect VOC Exposure Section 4 Results of Soil and Vegetation Impact Analysis Direct NO2 Exposure Direct SO2 Exposure Direct CO Exposure Direct and Indirect Chromium Exposure Direct and Indirect Benzene Exposure Appendix A Tables... A-1 Appendix B Drawings and Figures... B-1 Appendix C Works Cited... C-1 ii
317 FIGURES Page Figure 1 Exposure Response Curve for Foliar Injury from Direct NOX Exposure TABLES Page Table 1 Ecological Screening Thresholds Table 2 Exposure-Response Data for Foliar Injury to Vegetation from Direct SO2 Exposure... Error! Bookmark not defined. Table 3 NOx Soil and Vegetation Impact Analysis Table 4 SO2 Soil and Vegetation Impact Analysis Table 5 CO Soil and Vegetation Impact Analysis Table 6 Chromium Soil and Vegetation Impact Analysis Table 7 Benzene Soil Impact Analysis iii
318 EXECUTIVE SUMMARY This document provides a refined soils and vegetation analysis required as part of the Prevention of Significant Deterioration (PSD) permit application submittal for the proposed Carolinas Cement Company LLC (CCC) plant located near Castle Hayne, North Carolina. CCC is proposing the construction of a new Portland cement manufacturing plant. This document includes an Additional Impact Analysis (AIA), specifically the ecological impacts to soils and vegetation surrounding CCC. Dispersion modeling was performed for pollutant emissions from the proposed new sources at CCC. These results were submitted under separate cover in a report dated February 25, The modeling results from the February report served as the basis for this demonstration by evaluating appropriate ecological screening threshold values. Based upon this analysis it was determined that CCC would not have a significant impact on the soils and vegetation surrounding the proposed plant. iv
319 SECTION 1 PROJECT BACKGROUND AND ANALYSIS OVERVIEW 1.1 Introduction CCC has submitted a revised air permit application to construct a modern 6000 ton per day (clinker) Portland cement manufacturing plant at the site of its existing cement terminal near Castle Hayne, North Carolina. A more detailed description of the project is presented in the Regulatory Analysis Report section (Tab A) of the application package. The project emissions triggered requirements under the PSD rules at 15A NCAC 02D.0530 for the following pollutants: PM10, PM2.5, sulfur dioxide (SO2), NOx, carbon monoxide (CO), and volatile organic compounds (VOC). The project emissions will also trigger requirements under 15A NCAC 2Q.0700 regarding toxic air pollutants (TAPs). This document provides the methodologies that were followed in completing the additional impacts analysis (AIA) for soils and vegetation. The results of this analysis are also summarized within this report. 1.2 Soil and Vegetation Analysis Overview Pursuant to 40 CFR (o), an applicant for a PSD permit is required to conduct an analysis of the impairment to soils and vegetation that may occur as a result of the proposed source. The applicant is not required to provide an analysis of impacts to vegetation having no significant commercial or recreational value. Since developing its comprehensive 1980 guidance document entitled A Screening Procedure for the Impacts of Air Pollution Sources on Plants, Soils, and Animals, the United States Environmental Protection Agency (EPA) has not issued significant guidance on the preferred approach for conducting a complete and accurate soils and vegetation analysis, with the exception of limited guidance provided in the NSR Workshop Manual and a few Environmental Appeals Board (EAB) decisions. The NSR Workshop Manual recommends an evaluation of impacts on the soil and vegetation types found within the Class II Modeling Domain that was established for the modeled criteria pollutants within the Significant Impact Analysis (i.e., SIL Analysis). This provides a reasonable reference for establishing impact thresholds for the analysis beyond the secondary NAAQS (which are generally considered to be protective of most soils and vegetation). 1
320 For the purposes of this vegetation survey, the term significant commercial value is interpreted to mean plant species that are harvested for sale which include commodity crops (i.e., corn, soybeans, tobacco, wheat, etc.), hay, and forest products. The concept of significant recreational value for vegetation is much more ambiguous in a rural area dominated by agriculture and forestry than it would be in an area where recreation areas are more clearly defined. To simplify the analysis and to ensure the vegetation survey encompasses as many potentially sensitive species as possible, dominant plant species are evaluated within all areas of the designated impact area regardless of whether or not these areas are designated as parks or other public protected areas which offer significant recreational value. Based on other recently performed AIAs accepted by the NCDAQ and other state regulatory agencies, potential impacts were evaluated on soils and vegetation from deposition [PM trace metals and volatile organic compounds (VOC)] in addition to direct phytotoxic effects of modeled criteria pollutants (i.e., CO, NOx, SO2, and PM). It should be noted that detailed deposition modeling was not required to be performed, instead a more conservative screening estimate of deposition was made, as applicable, based upon the modeled ambient concentrations. This screening methodology is presented in Section 4.4. CCC is located near the border of New Hanover and Pender counties near Wilmington, North Carolina. Possible additional impacts were evaluated out to the extent of the currently established modeling domain, as presented in the Class II Air Dispersion Modeling Report submitted to the North Carolina Department of Environment and Natural Resources (DENR). When completing the AIA soils and vegetation inventory, an evaluation of the soils and vegetation within the entire modeling domain is required. To maintain consistency between the performed modeling analysis for the criteria pollutants and the NSR Workshop Manual, the study area was defined as the Class II modeling domain. It was also shown within the Class II modeling report that the largest SIA was 18.0 km, which is suggests that modeling domain is sufficient for the determination of significant impacts of this facility. The subsequent sections of this Soils and Vegetation AIA provide the following: 1) The characteristics of the land use, soils, and vegetation in the impact area, 2) The general soil and vegetation sensitivity to CO, NOx, SO2, PM, and VOC, 3) The observed thresholds below which adverse effects from these pollutants are expected to be negligible, 4) A summary of results of the soil and vegetation impact assessment. Contaminants of Potential Ecological Concern (COPEC) deposition within the modeling domain from CCC will not affect any Class I Areas (federally protected national parks and wilderness areas), as it is completely located within the Class II Area. The Class I report dated January 30, 2009 discusses the possible effects of sulfate and nitrate deposition on the surrounding region. Therefore, no specific review of any Class I area will be provided in this document, although areas of state or regional interest will be 2
321 discussed in Section 2.2 (Vegetation Survey). The following sections present the PSD additional impacts analysis associated with the COPEC s from the CCC facility. 3
322 SECTION 2 SOILS AND VEGETATION SURVEY 2.1 Soils Survey Soils data, for the purposes of this project, were obtained from several sources in order to accurately describe the soil horizons, parent material, and chemistry that are found in the CCC modeling domain. The primary data resource was the U.S. Department of Agriculture (USDA) Natural Resources and Conservation Service (NRCS) 1, which in cooperation with other state and local agencies, completed a survey of soils in New Hanover County, North Carolina, in , and in Pender County, North Carolina, in Also, the Federal Geographic Data Committee (FGDC) Geologic Data Subcommittee (GDS) maintains up-to-date digital cartographic standards for geologic maps in the United States, which provides additional geologic data necessary for interpreting the soil series parent substrate material. 4 Additionally, geospatial soil data was obtained from the USDA Natural Resources Conservation Service, Soil Data Mart. 5 For the CCC modeling domain, the majority of the soils parent material consists of a mixture of eroded Cretaceous age (140 to 65 million years) sedimentary rocks 6 mixing with woody organic material (mucks), clayey and loamy marine deposits, loamy and sandy marine deposits, sandy and loamy alluvium, eolian sands, and/or sandy fluviomarine deposits. 7 Like the rest of the Southeastern Atlantic-coastal states, eastern North Carolina is dominated by the South Atlantic Coastal Plain and the Western Atlantic coastline. The coastal plain is bordered on the west by the mostly Paleozoic geology of the Piedmont plateau. 8 The South Atlantic Coastal Plain is a relatively flat landform with an average elevation of less than 300 feet above sea level, and extends 50 to 100 kilometers inland from the ocean. 9 Generally, the coastal plain is wet, including many brown and black water rivers, marshes, pocosins, and swamplands. 10 Pender and New Hanover Counties are both located within the Atlantic Coast Flatwoods USDA major land resource area (MRLA) with approximately 70% of the land cover being forested. 11 This region is dominated by many broad shallow valleys that have widely meandering stream channels with slow moving water flow. Elevation ranges from 25 to 50 meters, with local relief of less than 10 meters, though some short steep slopes border the stream valleys. Stream valleys in this MRLA are shallow, narrow, and local relief is only a few meters. Wetness is a major land use problem as many of the soils require artificial 4
323 drainage before they can be used for agriculture, though in some areas sandy soils need irrigation during droughts. Most of the soils in the region are deep, sandy-loams or silty-loams, with restricted drainage. Almost 50% of the soils in the modeling domain are considered hydric, which form under conditions of saturation, flooding, or ponding, long enough to develop anaerobic conditions in the upper soil horizons, and thus support wetlands. Otherwise, the most extensive soil group in the area is the Aquults, with a thermic temperature regime and an aquic moisture regime. These soils are deep, with a medium to fine texture. Soils that are aquic are poorly drained, and maintain a reducing moisture regime that is virtually free of dissolved oxygen because of saturation by water. In some poorly drained soils, drain tiles help to maintain the available water in the aquic soils at more optimal ranges for non-wetland plants and agriculture, thus allowing commercial agriculture to excel in the region. Some soils in the area have an udic moisture regime and are excessively well-drained. 12 Soil series dominant in the area include Goldsboro, Dorovan, Craven, Leon, Murville, Seagate, and Woodington. 13 The region is important for the production of various agricultural crops and products, such as the commercial production of corn, soybeans, tobacco, peanuts, beets, and wheat, in addition to livestock (hogs and sheep) and pulpwood (farm woodlots) production. 14,15 The modeling domain for the CCC contains several soil series that the USDA considers Prime Farmland, 16 which identifies soils that are exceptionally suitable for high yielding agricultural production. These soils can be viewed in Appendix A, Table A- 1. Based on the analysis of the available data discussed above, the soil series in the modeling domain can be described as a nearly level coastal plain, dominated by many broad shallow valleys that have widely meandering stream channels with slow moving water flow, small lakes, pocosins, and wetlands. Soils are generally sandy-loams in the upper soil horizons (area that could be effected by any COPEC deposition and tillage). The majority of the soils in the study area are poorly drained (58.7%), with 49.8% of the soils considered hydric, while well-drained soils account for less than half (41.3%) of the overall area. Soils are acidic to circumneutral, with ph ranges from 3.2 to 9.0, with a weighted average soil ph of The cation exchange capacity (CEC) of the soil is the sum of the exchangeable cations that a soil can absorb at a specific ph, 18 and in this study area the CEC ranges from meq/100g soil, with a weighted average of 14.3 meq/100g soil. 19 The base saturation percentage of the soil is the extent to which the absorption complex of a soil is saturated with alkali or alkaline earth cations (expressed as a percentage of the CEC) 20, or saturation of deposited cations onto soil surfaces. Base saturation for the soils in the modeling domain was found to range from 0-100%, with a weighted average of 14.0%. 21 Due to low ph, CEC, and base saturation levels, the soils in general throughout the modeling domain are somewhat chemically susceptible to acidification or eutrophication, due to the low buffering capacity of the soil. Acidification of the soil may be a concern due to the chemical qualities of soil in the modeling domain. However, 5
324 further discussion of soil acidification is addressed in Sections 3 and 4, specifically section 3.4.1, for Trace Metals. The facility expansion will not cause or contribute to any exceedance of PSD increments or NAAQS in the modeling domain and as a result, CCC will not cause the acidification of soils in the area. Detailed soil characteristics are provided in Appendix A, Table A-1. An ArcGIS map depicting the soil types for the modeling domain is provided in Appendix B, Drawing Vegetation Survey Overview of Vegetation and Land Use In order to describe the vegetation in the Class II modeling domain surrounding CCC, multiple sources of North Carolina land use data and natural communities descriptions were applicable to creating a base map in ArcGIS (Appendix B, Drawing 001). Sources of data included first, aerial photographs, which were obtained from GoogleEarth imagery, allowing an initial evaluation of general natural communities and agricultural tenure. 22 Second, ArcGIS shape and raster files of land use data were obtained from the North Carolina Geographic Information Coordinating Council, which were uploaded and clipped to build base maps for analysis and area measurements. 23 Third, detailed descriptions of land use in North Carolina were reviewed in a corresponding NC OneMap support file, 24 which were then compared with the Schafale and Weakley publication, Classification of Natural Communities of North Carolina. 25 The descriptions of North Carolina natural communities classifications found in this publication were utilized to describe the dominant vegetation of the modeling domain in respect to the land use shape files obtained from the NC OneMap. ArcGIS tools were then used to analyze the data via data tables, calculations, and statistics Agriculture and Forestry The land use and vegetation in the modeling domain is dominated by Southern Yellow Pine woodlots (73.3% of the land use) 26, specifically by Mesic Pine Flatwoods (woodlots and protected areas). Agriculture accounts for 11.9% of the modeling domain, specifically for the cultivation of Corn (Zea maize x.), Soybeans (Glycine max x.), Tobacco (Nicotiana tabacum), Peanuts (Arachis hypogaea), and Wheat (Triticum aestivum), with some oats, vegetable, poultry, and livestock (sheep and hogs) production as well. 27 According to the NC Geographic Information Coordinating Council, 3.2% of the domain is used for pasture/hay and 8.6% of county is in crop production, including corn, soybeans, tobacco, peanuts, potatoes, beets, wheat, and oats Natural Communities Classifications The CCC modeling domain is located in the U.S. EPA Level III Ecoregion of the Mid- Atlantic Coastal Plain, and more specifically in the Carolina Flatwoods, Swamps and Peatlands, and the Mid-Atlantic Floodplains and Low Terraces (Level IV Ecoregions) 29. 6
325 Pre-Colonization natural communities supported a complex mixture of wet and mesic pine flatwoods and Pocosins, draining into Cypress-Gum bottomland/wetland, brown/black water rivers, estuaries and salt marsh, as well as maritime shrublands and forest, and inter-dune communities. 30, 31, 32 The current natural communities that are present in the modeling domain include Upper Beach and Dune Grass (0.2%), Maritime Shrub (0.3%), Salt Marsh and Maritime Wet Grassland (2.0%), Low Pocosin (0.26%), Nonriverine Wet Hardwood Forest (1.4%), Cypress Savanna (0.1%), Mesic Pine Flatwoods (73.3%), Wet Marl Forest (0.1%), Pine-Scrub Oak Sandhill (1.4%), Cypress-Gum Swamp (1.5%), and Water (5.9% - open ocean, estuaries (brackish), rivers, streams, lakes, and other Waters of the United States 33 ). 34 The natural communities are discussed briefly below. They account for 86.3% of the land use in the modeling domain. The Upper Beach and Dune Grass natural communities account for only 0.2% of the area, or 342 acres. Though relatively undisturbed community in the ecoregion, this was never a dominant community type in North Carolina as it is found only in a narrow band along the coast. Historic and recent human impacts to coastal barrier dunes have begun to be addressed as the importance of the dune communities to the protection of the coast has been recognized. Restoration efforts have included establishing native grasses and other species in disturbed dunes. 35 The Upper Beach and Dune Grass community in this ecoregion is dominated by coarse shifting or recently stabilized sands (Newhan soil series), which are excessively drained, and the vegetation is dominated by Seaoats (Uniola paniculata), Bitter Panicgrass (Panicum amarum), American Beachgrass (Ammophila breviligulata), and further inland by various species of Bluestem grass (Andropogon spp.). 36 Various other species of low-growing, woody shrubs such as Seacoast Marsh Elder (Iva imbricata) are found growing in stabilized sands. In addition, some areas become inundated occasionally by saltwater flooding during storms and are dominated by salt-tolerant species such as Saltmeadow Cordgrass (Spartina patens). Often found adjacent to and inland from the Upper Beach and Dune Grass community, is the Maritime Shrub community, accounting for 0.3% of the area, or 640 acres. This natural community is dominated by dense evergreen shrubs and small trees. Due to its physiographic location, much of this community has been impacted by coastal development and climate change. 37 This community is dominated by Wax myrtle (Myrica cerifera), Yaupon Holly (Ilex vomitoria), Eastern Red Cedar (Juniperus virginiana), and Dwarf Live Oak (Quercus minima). 38 This community is found in extremely welldrained soils (also Newhan soil series) with no horizon development of stabilized sand dunes, dune swales, and sand flats protected from salt water flooding and the most extreme salt spray. Salt Marsh and Maritime Wet Grassland accounts for 2.0% of the modeling domain, or 3,860 acres. Many of these areas are used for small boat docking, fishing, and shellfishing. Vegetation in this community is dominated by Sea Oats in drier areas, and Jamaica Swamp Sawgrass (Cladium mariscus spp. Jamaicense), Saltwort/Glasswort (Salicornia bigelovii), Needlegrass Rush (Juncus roemerianus), and Cordgrasses (Spartina spp.). 39 This natural community is a major contributor to coastal protection, occurring along the intertidal shore of estuaries and sounds where salinity ranges from near ocean 7
326 strength to near fresh in upriver marshes, and ranks among the most productive ecosystems on earth. 40 Further inland, the natural communities diversify from many of the salt tolerant species of the coast and estuaries to a mixture of wet and mesic communities. One of the most unique natural communities of the Mid-Atlantic Coastal Plain is the Low Pocosins, or are peatlands (with peat deposits over 1 meter deep), which have formed on poorly drained interstream flats, bays, and swales. 41 Low Poccosins account for 0.3% of the modeling domain, or 515 acres, and are seasonally flooded or saturated, though often slightly higher in elevation than surrounding lands. The peat is deep and saturated enough that plant roots never reach mineral soil. This community consists of a dense shrub layer less than 1.5 meters tall dominated by Fetterbush Lyonia (Lyonia lucida), Swamp Titi (Cyrilla racemiflora), Inkberry (Ilex glabra), and Laurel Greenbrier (Smilax laurifolia). 42 This community receives its nutrient input only from rainfall and thus plant species have adapted to an extremely acidic and nutrient poor environmental conditions. 43 Typically on the margins of large Pocosins, poorly drained loamy or clayey soils, support a Palustrine seasonally saturated or flooded natural community known as the Nonriverine Wet Hardwood Forest. This community is distinguished by the combination of bottomland oak or mixed hardwood vegetation located on flats not flooded by rivers or tidal waters. Nonriverine Wet Hardwood Forest accounts for 1.4% of the study area, or 2,704 acres. This community is dominated by Swamp Chestnut Oak (Quercus michauxii), Laurel Oak (Quercus laurifolia), American Elm (Ulmus americana), Red Maple (Acer rubrum), and Swamp Tupelo (Nyssa biflora). 44 This natural community is easy to drain and rich soils make excellent farmland, so though once common in the area, very few of these communities remain intact and make this one of the most threatened community types on the Coastal Plain. 45 This community is not found present within the confines of the currently proposed CCC project. Cypress Savannah is found on wetland soils with a clay hardpan, forming Palustrine, seasonally to temporarily flooded wetlands in Carolina bays and other clayey depressions. 46 Considered a rare community in North Carolina, only 0.1% of area, or 215 acres, were accountable for this natural community. With an open to sparse canopy dominated by Bald Cypress (Taxodium distichum), some other wetland trees and shrubs grow in minimal association. This community is dependent on a combination of flooding and fire to maintain an open savanna structure, for without flooding or fire young pines and hardwoods begin to invade many sites. 47 The modeling domain is dominated by the Mesic Pine Flatwoods natural community, accounting for 73.3% of the study area, or 142,446 acres. This community is found in mesic, non-wetland sites, with either flat or rolling Coastal Plain sediments, which are neither excessively drained nor with a significant seasonal high water table, and dominated by a closed to open canopy of Longleaf Pine (Pinus palustris) or Loblolly Pine (Pinus taeda), and in some cases of Slash Pine (Pinus elliottii). 48 This community has been cleared in some areas for agriculture, but is mostly utilized for large, privately owned woodlots and pulpwood production. 49 8
327 The modeling domain contains a very rare natural community, Wet Marl Forest, which is presently known to exist in only southern Pender County, on a marl outcrop area. 50 The only known example of such a community in North Carolina is in Rocky Point Marl Forest, located in Southern Pender County, and it is not known to exist on the current CCC property. 51 Flat or gently sloped poorly drained uplands with marl or limestone near the surface, retain wet, seasonal to intermittently flooded soils that exhibit relatively high base saturation levels. This closed canopy forest of mesic and wetland hardwoods accounts for 0.1%, or 87 acres, of the study area, and is dominated by many species of oaks such as Shummard s Oak (Quercus shumardii), White Oak (Quercu alba), Swamp White Oak (Quercus michauxii), and others in conjunction with hickories (Carya myristiciformis, C. aquatic, C. aquatic, C. cordiformis, and others), Red Mulberry (Morus rubra), Carolina Basswood (Tilia americana var. caroliniana), American Elm (Ulmus Americana), Sweetgum (Liquidambar styraciflua), and a diverse understory of mesic small trees, shrubs, herbs, and vines. 52 The Pine-Scrub Oak Sandhill is found on sites with generally rolling to more steeply sloping sandy Coastal Plain sediments with a clay layer near the surface, exhibiting dry to xeric moisture regimes. This open canopy community is found on about 1.4%, or 2,736 acres, and is dominated by Longleaf Pine (Pinus palustris), Turkey Oak (Quercus marilandica), Black Oak (Quercus marilandica), and other oak species (Quercus spp.). 53 The understory is often moderately sparse, though at times it can be rather dense. This community naturally experience frequent low intensity surface fires which keeps the understory sparse and stimulates herbaceous growth. 54 The final natural community found within the modeling domain of the CCC facility is the Cypress-Gum Swamp. This community is typically classified into two subtypes, Blackwater Subtype and Brownwater Subtype, though they are presented here as one group as remote analysis of available data does to differentiate between the two subtypes. 55 Cypress-Gum Swamp communities account for 1.5% of the study area (2,892 acres) and are found in backswamps, sloughs, swales, and on floodplains of blackwater and brownwater rivers. The hydrology is palustrine, with seasonal to semipermanent flooding, and the water tends to be very acidic, low in mineral sediment and nutrients. 56 Cypress- Gum Swamps are dominated by Swamp Tupelo (Nyssa biflora), Blackgum (Nyssa sylvatica), Pond Cypress (Taxodium ascendens), and Bald Cypress (Taxodium distichum). 57 The environmental factors mentioned above enable very slow growth in trees, and therefore community recovery from logging activities can be slow Summary of Natural Communities By describing the basic matrix of the plant communities of the modeling domain, both agricultural and natural, more efficient analysis of gap dynamics, ecosystem functionality, and possible impacts to various change agents such as urbanization, development, and/or the increase of COPEC s can be analyzed in respect to the proposed CCC project. The natural communities can be viewed in tabular format in Appendix A, Table A-2, and geospatially depicted in Appendix B, Drawing 001. About three-quarters (73.3%) of the land use in the study area are found in Pine Flatwoods as 9
328 protected areas or private woodlots. 59 For this Additional Impacts Analysis (AIA), assessing the increase of COPECs in the impact area is important for ecological parameters due to the high presence of wetlands (49.8% of the county) 60,61 and other sensitive or rare communities in the area, and also from a commercial (recreational, fisheries, agricultural and agro forestry) perspective as well. It can be difficult to predict ecological or agricultural impacts due to air emissions based on data and conclusions available in peer-reviewed literature because of significant variations in experimental designs. 62 For the purposes of this project, threshold values (TRVs) for assessing COPEC impacts were obtained first from EPA sources. Where data was absent for particular COPECs, additional literature review was completed in order to determine critical TRVs. The EPA maintains a high level of screening of peer-reviewed literature in developing these ecological screening levels (Eco-SSL s) 63 and establishing TRVs 64,65 for COPECs. Many COPECs do not have federal Eco-SSL s or TRVs, and thus a review of other sources of TRVs for secondary receptors (vegetation, plants, animals, water, etc) is necessary. Other sources of data include but are not limited to the EPA Supplemental Guidance to RAGS: Region 4 Bulletins for Ecological Risk Assessment 66, EPA Region 5 Ecological Screening Levels 67, EPA Screening Level Ecological Risk Assessment Protocol for Hazardous Waste Combustion Facilities 68, EPA s secondary NAAQS standards (not human-health based) 69, peer-reviewed literature in scientific journals and publications, World Health Organization s standards 70, or other international/multi-national organizations. 71 It is important to note that many of these TRVs are guidance levels and are not based on any regulatory standards. 10
329 SECTION 3 SOIL AND VEGETATION SENSITIVITY TO EXPOSURE The following sections provide an evaluation of potential adverse effects to soils and vegetation from direct and indirect exposure to the NOX, SO2, CO, PM, and VOC emissions from CCC. These evaluations reference threshold exposure levels that define the lowest air, deposited soil, or plant tissue concentrations at which either acute or chronic exposure damage has been recorded in the referenced technical literature. The screening thresholds established are expected to be protective of even the most sensitive soils and vegetation in the modeling domain and are presented in Table 1. By describing the basic matrix of both agricultural and natural plant communities in the modeling domain, a more detailed analysis of possible impacts from the CCC project s PSD triggering pollutant emissions was conducted. Specifically, during the course of the literature review conducted to establish soils and vegetation screening thresholds for potential adverse impacts, the available literature was searched for toxicological studies of the species known to exist within the impact area (refer to Tables A-3 to A-4 of Appendix A) with a primary focus on wetlands, pine flatwoods, and corn. As the scope of the vegetation survey was not limited to only species with commercial or recreational value, Table A-5 of Appendix A and Drawing 001 of Appendix B show the locations of all natural areas, water bodies, state park, preserves, and other recreation areas within the modeling domain that may have specific recreational and commercial value, and therefore, may contain plant species of specific interest for the vegetation analysis. 11
330 TABLE 1 ECOLOGICAL SCREENING THRESHOLDS Pollutant Acute Ecological Screening Threshold Chronic Ecological Screening Threshold Value Units Avg. Ref Value Units Avg. Ref NO2 NA 100 µg/m 3 Ann. 1 SO µg/m 3 3-hr 1 NA CO 10,000 µg/m 3 8-hr 2 NA PM Trace Metals Trace Metals: Chromium NA 200 µg/kg soil Ann. 3 NA 18 µg/kg plant Ann. 3 VOC Constituents of Concern Benzene NA 255 µg/kg soil Ann. 3 1 U.S.EPA, Policy Assessment for the Review of the Secondary National Ambient Air Quality Standards for Oxides of Nitrogen and Oxides of Sulfur. US EPA Office of Air Quality Planning and Standards, EPA-452/R a, January 14, U.S.EPA: Office of Air Quality Planning and Standards - Assessment for the Review of the Carbon Monoxide National Ambient Air Quality Standards, EPA 452/R , October U.S. EPA Office of Solid Waste and Emergency Response, Screening Level Ecological Risk Assessment Protocol for Hazardous Waste Combustion Facilities, EPA530-D A, August
331 3.1 Direct NO x Exposure Nitrogen is an essential plant nutrient, which is a key component in plant proteins and chlorophyll that has been recognized by science and agricultural communities for over 200 years. Gaseous NOX enters plant leaves through the stomata, which open at sunrise and close in darkness, although drought conditions, higher temperatures, and low concentrations of atmospheric CO2 can also cause the stomata to open during the night. 72 Sufficient ambient concentrations of nitrogen oxide (NO) and nitrogen dioxide (NO2) (which are collectively referred to as NOX) can have phytotoxic effects on plants through decreased photosynthesis and induced visible foliar injury. However, the functional relationship between ambient concentrations of NOX and a specific plant response, such as foliar injury, reduction in rates of photosynthesis, or reduced growth, is a complex process that relies on a number of internal and external factors specific to the plant species studied. In the recently completed review of the secondary NO2 NAAQS, EPA concluded that existing ambient NOX concentrations are rarely high enough to cause phytotoxic effects to vegetation. 73 Nevertheless, the 2010 Integrated Science Assessment (ISA) for the NO2 NAAQS review includes a complete and thorough review of experimental studies on the topic of adverse impacts from NOX exposure on many types of vegetation. Based on this literature review, EPA concluded that very little new research has been done on the phytotoxic effects of NOX to alter the conclusions in the 1993 Air Quality Criteria Document (AQCD). Additionally, in the January 14, 2011, U.S. EPA Policy Assessment for the Review of the Secondary National Ambient Air Quality Standards for Oxides of Nitrogen and Oxides of Sulfur, it is indicated that the current NAAQS secondary standards are sufficient for the protection of vegetation from direct damage associated with exposure to gaseous NOx. 74 The 1993 AQCD included results from various experimental studies for various species found in the modeling domain, including Loblolly Pine, Sweetgum, Corn, and Soybeans. Loblolly Pine and Sweetgum both showed no injury due to NO2 concentrations of 100 ppb (6 hr/day for 28 days). Though this species is not dominant in the modeling domain, it is present and it is listed here due to its similar growth habit of several of the dominant pine species that were not reviewed in the AQCD document. Corn showed no injury due to NO2 concentrations ranging from 100 to 1,000 ppb at 24-hour exposures, for two weeks. Soybeans showed no response to NO2 concentrations of 100 to 400 ppb at varying time intervals from two weeks to two months. The relationship of exposure response of vegetation to various NOx concentrations over time is shown in Figure 1 below. 13
332 Figure 1 Exposure Response Curve for Foliar Injury from Direct NOX Exposure 14
333 It is reasonable to expect based on the results of the chronic exposure studies that plants would not exhibit any adverse response to NO2 concentrations below 100 ppb, and in fact, the exposure-response curve suggests NO2 concentrations up to 600 ppb would be protective. 75 Based on all of the experimental evidence reviewed, as well as the recently published U.S.EPA 2011 Policy Assessment for the Review of the Secondary National Ambient Air Quality Standards for Oxides of Nitrogen and Oxides of Sulfur, the current NAAQS secondary standard provides a protective screening threshold for injury to sensitive plants from NOX. Thus, an annual screening threshold for chronic exposure was used based on the current secondary NO2 NAAQS standard of 53 ppb (100 µg/m 3 ), which is far below any site-specific screening thresholds that would be established based on the peer-reviewed literature. 3.2 Direct SO 2 Exposure Sulfur is an essential plant nutrient that has been recognized by science and agricultural communities for over 200 years. 76 Intermediary metabolism requires sulfur, and it is a constituent of many organic compounds (amino acids and proteins in plant tissues). 77 The most common form of sulfur uptake is as sulfate (SO4 2- ) from the soil through the roots, although uptake of sulfate through direct deposition to foliage and uptake of SO2 through foliage from the atmosphere are other significant pathways. SO2 is absorbed into plant foliage via diffusion through the stomata. 78,79 Therefore, plants generally show a higher degree of resistance to SO2 at night and they become more sensitive with increasing irradiance, similar to the NOX exposure pathways discussed previously. 80 Acute and chronic symptomology of SO2 exposure to vegetation is intensified by increased temperatures, increased relative humidity (from 35 to 75 percent), and increased available soil water capacity. 81,82 Soil fertilization via nitrogen in the form of nitrate (NO3 - ) increases SO2 tolerance of plants, although the ammonium ion (NH4 + ) in fertilizers may exhibit competing adverse effects. 83 Visible injury response of various plants in field conditions is commonly the response to a mixture of high concentration acute and low concentration chronic SO2 exposures, and variable environmental conditions. The use of defined SO2 concentration thresholds for visible injury can be difficult, despite the overwhelming amount of related research over the past 100 years. Foliar SO2 injury in dicotyledonous plants appears initially as dull, darkgreen water soaked appearance, forming into marginal and interveinal bifacial necrosis. 84 Specifically, acute SO2 injury on leaves of soybean is typically seen as a whitish-tan interveinal necrosis. 85 Dicots that are common in the impact area and are relatively sensitive to SO2, include Soybeans, Wheat, Beets, Oats, and American Elm (Ulmus americana). Chronic foliar injury in monocots is commonly seen as interveinal and marginal chlorosis (rapid inhibition of chlorophyll formation), extending from the lead tip downward toward the lead base. 86,87 Acute foliar injury in monocots is commonly seen as reddish-brown tip necrosis, that, depending on the duration of repeated exposure to SO2, can lead to distinct banding patterns in the necrotic area (corn) and premature dropping of older needles in species of pine. 88 Monocots in the impact area 15
334 for CCC, which are considered sensitive to SO2, include Corn (Zea maize x.) and various sedges and grasses. In general, injury caused by SO2 exposure ranges from tissue damage from acute exposure, to yield reduction, growth inhibition, and severe tissue damage or loss from chronic exposure. Currently, SO2 is the only criteria pollutant with a secondary NAAQS distinct from the primary standard which was specifically established based on welfare effects including acute foliar injury resulting from exposure to SO2 in the ambient air. The current secondary SO2 NAAQS, 0.50 ppm (1,300 µg/m 3 ) on a 3-hr average basis, was promulgated in The last AQCD for ecological effects of SO2 was completed in According to the recent ISA developed for the SO2 NAAQS review, controlled experiments and field observations supported retaining this secondary standard, and the limited research on acute foliar damage that has been conducted since the 1982 AQCD was developed provides no clear evidence of acute foliar injury below the level of the current standard. 89 Therefore, relying on information presented in the most recent AQCD developed for SO2, as well as the U.S.EPA 2011 Policy Assessment for the Review of the Secondary National Ambient Air Quality Standards for Oxides of Nitrogen and Oxides of Sulfur, it is indicated that the current NAAQS secondary standard is sufficient for the protection of vegetation from direct damage associated with exposure to gaseous SOx. 90 An acute screening threshold was used for injury to sensitive plants from SO2 emissions of 1300 μg/m 3 on a 3- hour average basis, based on the existing secondary NAAQS standard. 3.3 Direct CO Exposure Concentrations of CO are not typically detrimental to vegetation, and have not been found to produce detrimental effects on plants at concentrations below 114,500 μg/m 3 for exposures from 1 to 3 weeks, nor has it been shown that CO is absorbed by plants via transpiration and root uptake. 91 Microorganisms in the soil appear to be a major sink for CO. On April 30, 1971, EPA promulgated identical primary and secondary NAAQS for CO set at 9 ppm (10,000 μg/m 3 ) on an 8-hour average basis and 35 ppm (40,000 μg/m 3 ) on a 1- hr average basis (36 FR 8186). After a reexamination of the scientific data upon which the CO NAAQS was based, EPA announced its final decision on September 13, 1985 to revoke the secondary standard for CO, due to a lack of evidence of direct effects on public welfare at ambient concentrations. Subsequent scientific reviews of data available on the welfare effects of CO including effects on soils and vegetation in 1991, 2000, and 2009 have not altered EPA s previous decision to not impose a secondary NAAQS for CO. In October of 2010, U.S.EPA conducted a policy assessment on CO NAAQS primary and secondary standards and continued to uphold this decision. 92 Based on this recent action, an acute screening threshold for potential adverse impacts 16
335 to vegetation from CO exposure of 10,000 μg/m 3 on an 8-hour average basis was utilized. No chronic effects from CO exposure were documented in the literature. 3.4 Direct and Indirect PM Exposure PM is not a single pollutant, but instead is composed of a heterogeneous, largely inert, mix of compounds with differing particle size, mechanisms of formation, and chemical composition. PM can enter the foliage of vegetation through the stomata if the particle size is small enough (PM2.5). 93 For coarse particles (PM10) that are water soluble, or have some water soluble components and/or react with chemicals in the soil, plant uptake of ions from the leaf or through the roots does occur. 94 Indirect entry through roots may cause chronic effects because of changes in soil chemistry. 95 Detrimental effects of PM on vegetation (phytotoxicity) have been demonstrated in areas that are in the immediate vicinity of some types of stationary industrial sources. The most imposing effect of PM deposition on vegetation is a physical smothering of the leaf surface, reducing light transmission (decreased photosynthesis) and possible closure and clogging of stomata (decreased transpiration), both of which can cause reduced productivity, inhibited growth, or ultimately death. Exposure to a given concentration of airborne PM and the resulting mass of deposited material may lead to widely varying phytotoxic effects depending on the particle size and chemical composition of the PM species in the ambient air. In the most recent AQCD for PM conducted in 2004, EPA recognized this fact when it stated effects of particulate deposition on individual plants or ecosystems are difficult to characterize because of the complex interactions among biological, physicochemical, and climatic factors. 96 A subsequent staff paper issued by U.S. EPA concerning the PM NAAQS review process also acknowledged the difficulty in assessing adverse effects on soils and vegetation from PM air pollution when evaluated as a single class by stating the following: 97 Because PM size classes do not necessarily have specific differential relevance for vegetation or ecosystem effects (Whitby, 1978; EPA, 1996a), it is the opinion of the staff that an ecologically relevant indicator for PM should be based on one or more chemical species found in ambient PM. The chemical species found in PM specifically evaluated in the AQCD include trace metals and semivolatile organic compounds (which can deposit and cause phytotoxic effects). The following sections establish screening thresholds for each of these chemical species found in PM which exhibit ecological toxicity and can be used as indicators to assess potential adverse impacts from CCC s PM emissions. Trace Metals PM emissions from the proposed sources at the CCC are expected to contain the following trace metals with documented ecological toxicity: antimony, arsenic, 17
336 beryllium, cadmium, chromium IV (bioavailable), chromium IV (soluble), cobalt, lead, manganese, mercury, nickel, and selenium. 98 Deposited heavy metals tend to accumulate in soil layers just below the level where root activity occurs. 99 Although some trace metals are essential for vegetative growth, they can be toxic to plants when accumulated in large quantities through both direct uptake from foliage and indirect uptake from soils through root systems. 100 As shown in Table A-3 of Appendix A, a complete inventory of plant and soil toxicity data was compiled for the emitted metallic compounds found in PM based on the U.S. EPA Screening Level Ecological Risk Assessment Protocol (SLERAP) toxicity reference values (TRVs) and the U.S. EPA Office of Solid Waste and Emergency Response (OSWER) Ecological Soil Screening Levels (Eco- SSLs). In order to determine which of these chemical species to evaluate quantitatively in the air dispersion modeling analysis for comparison against the screening threshold, a toxicity-weighted emissions score was calculated for each metallic compound by dividing the annual potential emissions in tons per year (tpy) by the lowest of the plant and soil TRVs or Eco-SSLs in µg/kg. The resulting individual pollutant scores for plant and soil toxicity were then expressed as a percentage of the total score for all metallic compounds to determine the compound that is most likely to cause the highest offsite impacts on plants and soils. To determine which pollutant is expected to have the highest cumulative impact on plants and soils, the percentages of the total emission score for plant and soil toxicity were averaged. Based on this analysis, modeling impacts of chromium (Chromium VI) were evaluated, both soluble and bioavailable, in order to evaluate potential ecological impacts from the CCC s PM emissions (refer to Table A-3 of Appendix A). This toxicity-weighted emissions scoring approach is identical to the procedure used to select chemicals of potential ecological concern (COPECs) in multiple ecological Screening Analyses and AIA s for other PSD applicants. 101 Chromium is both an essential nutrient and a carcinogen, yet the essentiality and carcinogenicity of chromium depend on its chemical form. Oxidation state and solubility (trivalent chromium compounds are less toxic than those of hexavalent chromium (Cr VI )) are particularly important in determining the biological effects of chromium compounds. For this reason, total chromium measurements are of little value in assessing its nutritional benefits or its toxicological hazards. 102 According to the NCDENR s Update Guidelines for Implementing Acceptable Ambient Levels (AALs) for Chromium (VI) Compounds, the primary form of Cr (VI) present in combustion processes is a soluble chromate compound under NC TAP rules, chromic acid (CrO3), which is not considered a marine pollutant by the US EPA. 103 In addition, Chromium(VI)-contaminated soil can support a viable anaerobic bacterial community (such as those found in wetlands); however, Cr(VI) alters the soil composition, which could affect the soil biodegradation potential, 104 However, with decreasing ph in acid media such as the soils in and near the CCC facility, Cr VI compounds are transposed to soluble sodium chromate. Soluble Cr VI compounds dissolve under lower ph soil conditions. 105 Since the TRVs for chromium are the lowest thresholds from among the TRVs and Eco-SSLs listed in Table A-3 of Appendix A, a chronic screening threshold for potential adverse 18
337 impacts to soils from total chromium exposure of 200 µg/kg over the lifetime of the CCC s operations were utilized. To evaluate adverse effects on vegetation from total chromium exposure, a chronic screening threshold of 18 µg/kg over the lifetime of the CCC s operations based on the plant TRV was utilized. No acute ecological screening thresholds for metallic compound deposition were found in the literature review, and therefore, only chronic impacts were evaluated. 3.5 Direct and Indirect VOC Exposure VOC in the atmosphere is partitioned between the gas and particle phases, depending on the liquid-phase vapor pressure of the organic compounds at the ambient temperatures, the surface area per unit volume of air of PM in the atmosphere available for adsorption, and the nature of the particles and of the chemical being adsorbed. Trace low vapor pressure semivolatile organics such as certain polycyclic organic matter (POM) and polynuclear aromatic hydrocarbons (PAH) are more likely to adsorb onto particles, while more commonly emitted VOC compounds such formaldehyde and benzene remain in the gas phase. These particle-phase semivolatile organic compounds may enter plants indirectly by uptake through the roots or directly by deposition onto the cuticles and stomata. 106 The dominant exposure pathway depends on the chemical and physical properties of the pollutant, (i.e., lipophilicity, water solubility, vapor pressure and Henry s law constant), environmental conditions such as ambient temperature and soil organic content, and the plant species which influences the available surface area for deposition and the lipids available for accumulation. 107 Concentrations of VOC, when evaluated as a class of pollutant, are not typically directly detrimental to vegetation or soils (with the exception of ethylene), and have not been found to produce detrimental effects on plants, until VOCs and NOX react in sunlight to form atmospheric ozone (O3) Most compounds found within VOC tend to be highly reactive with short atmospheric residence times that prevent persistent exposure to vegetation and the possibility for phytotoxic effects, and therefore, almost no literature is available on the direct effects of VOC emissions on plants. 111 Similar to PM, concentrations of VOC when evaluated as a class of pollutant are not typically directly detrimental to vegetation or soils (with the exception of ethylene), and they have not been found to produce detrimental effects on plants until VOCs and NOX react in sunlight to form atmospheric ozone (O3) Most compounds found within VOC tend to be highly reactive with short atmospheric residence times that prevent persistent exposure to vegetation and the possibility for phytotoxic effects, and therefore, very little literature is available on the direct effects of VOC emissions on plants. 115 Ecological screening levels for soil contamination for selected VOC compounds are, however available, and as shown in Table A-4 of Appendix A, the available EPA Supplemental Guidance to RAGS: Region 4 Bulletins for Ecological Risk Assessment 116 and EPA Region 5 Ecological Screening Levels (ESL) for emitted VOCs were used to determine which compound to evaluate quantitatively in the modeling portion of this analysis
338 The same toxicity-weighted emissions scoring approach applied to metals and PAHs was applied to these VOC compounds. Based on this analysis, benzene is expected to produce the highest offsite soil impacts. Absorption of benzene through leaf stomata or cell walls can cause death in plants and roots and damage to the leaves of many agricultural crops. 118 Benzene is carried via the atmosphere. When it comes into contact with soil, benzene will usually breakdown quickly. It can be mobile in soil, however, and may contaminate groundwater. 119 Benzene is expected to produce the highest offsite soil and vegetation impacts. Therefore, a chronic screening threshold for potential adverse impacts to soils from benzene exposure of 255 µg/kg over the lifetime of the CCC s operations was utilized. No acute ecological screening thresholds for benzene deposition were found in the literature review, and therefore, CCC only evaluated chronic impacts. 20
339 SECTION 4 RESULTS OF SOIL AND VEGETATION IMPACT ANALYSIS 4.1 Direct NO 2 Exposure In order to assess compliance with the acute screening threshold for direct NO2 exposure [53 ppb (100 µg/m 3 ) on an annual average basis], the Highest First High (H1H) modeled concentrations from CCC sources only was used. As shown in Table 3, CCC remains below the established acute ecological screening threshold values. As such, no further ecological analysis were performed and no adverse impacts to soils and vegetation from direct NO2 exposure are expected. TABLE 2 NO2 SOIL AND VEGETATION IMPACT ANALYSIS Pollutant Averaging Period Modeled Result 1 (μg/m 3 ) Acute Ecological Screening Threshold (μg/m 3 ) Chronic Ecological Screening Threshold (μg/m 3 ) NO2 Annual 0.8 NA Based on H1H modeled concentrations. 4.2 Direct SO 2 Exposure In order to assess compliance with the acute screening thresholds for direct SO2 exposure (1300 μg/m 3 on a 3-hr average basis), the H1H modeled concentration from the 3-hr averaging period for CCC sources only was used. As shown in Table 4, CCC remains below the established screening threshold values. As such, no further impact analysis were performed and no adverse impacts to soils and vegetation from direct SO2 exposure are expected. 21
340 TABLE 3 SO2 SOIL AND VEGETATION IMPACT ANALYSIS Pollutant Averaging Period Modeled Result 1 (μg/m 3 ) Acute Ecological Screening Threshold (μg/m 3 ) Chronic Ecological Screening Threshold (μg/m 3 ) SO2 3-hour 9.1 1,300 NA 1 Based on H1H modeled concentrations. 4.3 Direct CO Exposure In order to assess compliance with the acute screening threshold for direct CO exposure (10,000 μg/m 3 on an 8-hour average basis), the H1H 8-hr modeled concentration for CCC sources only were relied upon. As shown in Table 5, CCC s 8-hr average impacts are less than the acute screening threshold, and therefore, no adverse impacts to soils and vegetation from direct CO exposure are expected. TABLE 4 CO SOIL AND VEGETATION IMPACT ANALYSIS Pollutant Averaging Period Modeled Result 1 (μg/m 3 ) Acute Ecological Screening Threshold (μg/m 3 ) Chronic Ecological Screening Threshold (μg/m 3 ) CO 8-hour 28 10,000 NA 1 Based on H1H modeled concentrations. 4.4 Direct and Indirect Chromium Exposure Particle-phase deposition modeling for chromium was performed to determine the maximum offsite annual average deposition rate. This maximum deposition rate from among the five-years modeled was then used to calculate the maximum accumulated soil and plant tissue concentrations at the end of the facility s useful life. The same modeling parameters presented within the January 2011 modeling report were used with the exception of the deposition parameters. Dry and wet particle phase deposition modeling for chromium was conducted using the Method 2 approach in AERMOD. As recommended in the AERMOD User s Guide, the recommended mass fraction of 22
341 chromium emissions in the fine mode (55 percent) and mass-mean aerodynamic particle diameter (1.2 µm) were used, as presented in Appendix B of the draft ANL report. In order to compare these maximum modeled deposition rates with the ecological screening values established, the procedure outlined in EPA s guidance document A Screening Procedure for Impacts on Air Pollution Sources on Plants, Soils, and Animals was used. Based upon this screening methodology the following equations were used to derive the deposited concentration on soils: Where: DC = deposited concentration (μg/kg soil), Wdep = weight deposited (μg), and Wsoil = weight of soil (kg). To derive the weighted deposited (Wdep) the following equation was used: Where: DR = maximum annual average deposition rate from the source (μg/m 2/ yr), Adep = deposition area (1 m 2 ), and N = expected lifetime of the source (years). To derive the weight of the local soil (Wsoil), the following equation was used: Where: d = depth of soil through which the deposited material is distributed (cm), and ρsoil = bulk density of soil (g/cm 3 ). Based upon site-specific conditions it was determined that the depth through which the deposited material is distributed (d) is 4.5 cm, the bulk density of soil (ρsoil) is 1.27 g/cm 3. Given the long expected lifetime of this source (N), a conservative value of 100 years 23
342 was selected. As a conservative approach the H1H modeled value for total chromium deposition was used. To derive the concentration in plant tissue, the following equation was used: Where: TC = tissue concentration (μg/kg plant), DC = deposited soil concentration (μg/kg soil), and CR = concentration ratio. Table 3.6 in EPA s guidance A Screening Procedure for Impacts on Air Pollution Sources on Plants, Soils, and Animals provides the required plant-to-soil concentration ratios. Based upon this table, for chromium a ratio of 0.02 is recommended. The results of the chromium soil and plant tissue concentration calculations are provided in Table A-6, Appendix A based upon the deposition modeling performed and the methodology described above. As shown in Table 6, the highest deposited chromium concentrations modeled for CCC are below the chronic ecological screening threshold, and therefore, no adverse impacts to soils and vegetation from chromium exposure are expected. TABLE 5 CHROMIUM SOIL AND VEGETATION IMPACT ANALYSIS Pollutant Averaging Period Highest Deposited Concentration (μg/kg) Acute Ecological Screening Threshold (μg/kg) Chronic Ecological Screening Threshold (μg/kg) Total Chromium Annual (soil) 96.8 NA 200 Annual (plant) 1.94 NA Direct and Indirect Benzene Exposure Gas-phase deposition modeling for benzene was performed to determine the maximum offsite annual average deposition rate. These results were used to calculate the 24
343 maximum accumulated soil concentration at the end of the CCC s useful life (100 years). This methodology is consistent with the procedure outlined previously for chromium. Given the volatile nature of benzene, it is expected that deposited amounts will not remain or accumulate within the soils as this methodology assumes, as such this will present a most conservative approach. The same modeling parameters presented within the January 2011 modeling report were used with the exception of the deposition parameters used for benzene. The following pollutant specific source parameters required for benzene gas deposition modeling taken from Appendix C and D of the ANL report were used: 1) diffusivity in air, cm 2 /s, 2) diffusivity in water, cm 2 /s, 3) cuticular resistance, s/cm, and 4) Henry s law constant, Pa m 3 /mol. As there are no vegetation screening values only soil concentrations were determined. The results of the benzene gas-phase deposition modeling are provided in Table 7. Table A-7, Appendix A provides a detailed summary of the modeling results and concentration derivation. As shown in Table 7, the highest deposited benzene concentrations modeled for CCC are below the chronic ecological screening threshold, and therefore, no adverse impacts to soils and vegetation from benzene exposure are expected. TABLE 6 BENZENE SOIL IMPACT ANALYSIS Pollutant Averaging Period Highest Deposited Concentration (μg/kg soil) Acute Ecological Screening Threshold (μg/kg soil) Chronic Ecological Screening Threshold (μg/kg soil) Benzene Annual 2.95 NA
344 APPENDIX A TABLES A-1
345 TABLE A-1 SOILS DATA SUMMARY FOR CCC AIA Unit Symbol Soil Name New Hanover County Acres Pender County Total for SIA Percent of Total Acreage Prime Farmland 1 Average Cation Exchange Capacity (CEC) 1 (meq./100g) Average Soil ph of Upper Soil Horizon 1 % Base Saturation 2 Soil Moisture Regime Drainage Class % Hydric Soils Moist Bulk Density g/cm 3 AnB Alpin fine sand, 1-6% slopes 5,822 5, % excessively drained 1.45 AuB Autryville fine sand, 1-4% slopes 5,916 5, % Yes well drained 1.65 AyB2 Aycock loam, 3-6% slopes, eroded % Yes well drained 1.45 Ba Bayboro, ponded or drained % Yes hydric very poorly drained 0.10% 1.4 BaB Baymeade fine sand, 1-4% percent slopes 3,658 3, % Yes well drained 1.68 Be Baymeade fine sand, 1-6% percent slopes 1,590 1, % Yes well drained 1.7 Bh Baymeade-Urban land complex, 1-6% slopes % well drained 1.7 Bo Bohicket silty clay loam, frequently flooded (esturaries) % hydric very poorly drained 0.00% 1.3 Bp Borrow pits, loamy, 0-6% slopes % well drained 1.5 Ca Carteret fine sand, frequently flooded 3,744 3, % hydric very poorly drained 1.90% 1.53 Cr Craven fine sandy loam, 1-4% 1,430 1, % Yes well drained 1.4 Ct Croatan muck, 0-1% slopes 11,172 11, % hydric very poorly drained 5.70% 0.53 Do Dorovan, organic material, 0-1% slopes 1,030 12,614 13, % very poorly drained 0.32 EmA Exum loam, 0-2% slopes % Yes moderately well drained 1.4 Fo Foreston loamy fine sand, 0-2% slopes 9,073 9, % Yes moderately well drained 1.3 GoA Goldsboro fine sandy loam, 0-2% slopes 9,360 9, % Yes moderately well drained 1.5 Gr Grantham loam, 0-2% slopes % hydric poorly drained 0.00% 1.4 Gt Grifton sandy loam, 0-2% slopes % hydric poorly drained 0.20% 1.55 InA Invershiel Pender complex, 0-2% slopes 1,426 1, % Yes poorly drained 1.5 Jo Johnston, sandy-loamy alluvium, 0-2% slopes 3, , % hydric very poorly drained 1.80% 1.35 KaA Kalmia loamy fine sand, 0-2% slopes % Yes well drained 1.53 Ke Kenansville fine sand, 0-3% slopes 2,219 2, % Yes well drained 1.6 KeB Kenansville fine sand, 0-4% slopes % Yes well drained 1.6 Kr Kureb sand, 1-8% slopes 2,847 2, % excessively drained 1.7 KuB Kureb fine sand, 2-6% slopes % excessively drained 1.7 La Lakeland sand, 1-8% slopes 2,719 2, % excessively drained 1.4 Le Leon sand, 0-2% slopes 3,725 3, % Yes hydric poorly drained 1.90% 1.25 LnA Leon fine sand, 0-2% slopes 9,853 9, % hydric poorly drained 5.10% 1.25 Ls Lynchburg fine sandy loam, 0-2% slopes % somewhat poorly drained 1.45 Lu Lumbee fine sandy loam, 0-2% slopes, occ. Flooded % hydric poorly drained 0.20% 1.45 Ly Lynn Haven fine sand, 0-2% slopes 1,398 1, % Yes hydric poorly drained 0.70% 1.4 Ma Mandarin fine sand % somewhat poorly drained 1.4 McC Marvyn and Craven soils, 6-12% slopes 1,906 1, % Yes well drained 1.55 Me Meggett loam, 0-2% slopes 2,525 2, % Yes hydric poorly drained 1.30% 1.25 Mk Muckalee loam, frequently flooded, 0-2% slopes 2,523 2, % hydric poorly drained 1.30% 1.38 Mp Mine Pits 1,150 1, % excessively drained 1.6 Mu Murville fine sand, 0-2% slopes 18,695 2,853 21, % Yes hydric very poorly drained 11.10% 1.53 Nh Newhan fine sand, 0-10% slopes % well drained 1.68 NhC Newhan fine sand, dredged, 2-10% slopes % excessively drained 1.68 NkE Newhan-Corolla complex, 0-30% slopes % excessively drained 1.68 No Norfolk fine sandy loam, 0-4% slopes % Yes NoA Norfolk loamy fine sand, 0-2% % Yes well drained 1.63 NoB Norfolk loamy fine sand, 2-6% % Yes well drained 1.63 Ocean Open Ocean in SIA 3,000 3,100 6, % 0
346 TABLE A-1 SOILS DATA SUMMARY FOR CCC AIA Unit Symbol Soil Name New Hanover County Acres Pender County Total for SIA Percent of Total Acreage Prime Farmland 1 Average Cation Exchange Capacity (CEC) 1 (meq./100g) Average Soil ph of Upper Soil Horizon 1 % Base Saturation 2 Soil Moisture Regime Drainage Class % Hydric Soils Moist Bulk Density g/cm 3 On Onslow loamy fine sand 1,810 2,066 3, % Yes moderately well drained 1.68 PaA Pactolus fine sand, 0-2% sand 6,466 6, % well drained 1.68 Pm Pamlico muck, 0-1% slopes % hydric very poorly drained 0.30% 0.43 Pn Pantego loam, 0-1% slopes 2, , % hydric very poorly drained 1.10% 1.5 Pt Pits, marl % Ra Rains fine sandy loam, 0-2% slopes 200 1,592 1, % hydric poorly drained 0.90% 1.45 Rm Rimini sand, 1-6% slopes % excessively drained 1.5 Se Seagate fine sand, 0-2% slopes 4,500 4, % moderately well drained 1.35 Sh Seagate-Urban land complex, 0-2% slopes % moderately well drained 1.35 St Stallings fine sand, 0-2% slopes 1,580 1, % Yes somewhat poorly drained 1.55 TM Tidal marsh, 0-1% slopes 1,810 1, % hydric very poorly drained 0.90% 1.3 To Torhunta loamy fine sand 3,016 9,146 12, % hydric very poorly drained 6.30% 1.5 Ur Urban land 2,640 2, % 0 W Water 160 1,005 1, % 0 Wa Wakulla sand, 1-8% slopes % somewhat excessively drained 1.53 Wo Woodington fine sandy loam ,022 17, % hydric poorly drained 9.00% 1.55 Wr Wrightsboro fine sandy loam, 0-2% 1,844 1, % Yes moderately well drained 1.53 Total Acreage in Study Area 66, , , % Area Weighted Average Range USDA Natural Resources Conservation Service, United States Department of Agriculture. The Soil Data Mart. Available online at accessed [12/15/2010]. 2 Lippert, Robert, Regional Soils Data: CEC and ph versus Base Saturation Relationships for the Southeast. Clemson University Extension Service, Department of Entomolgy, Soils and Plant Sciences, South Carolina. Available online at accessed [12/22/10].
347 TABLE A-2 NORTH CAROLINA LAND USE COVER CLASSES WITH DOCUMENTED ADVERSE EFFECTS Thematic Class 2 NC Land Cover Class 2 Land Cover Description 2 North Carolina Natural Communities Classification 1 Dominant Species 1,2 or Description Botanical Name 3 Acres in Class II Modeling Domain Urban High Intensity Developed 80% Impervious Surfaces 1, % Urban Low Intensity Developed 50-80% Impervious Surfaces 1, % 3 Corn Zea mays Soybeans Glycine max Tobacco Nicotiana tabacum 3 2 Cultivated Crops Peanuts Arachis hypogaea Potatoes Solanum tuberosum 16, % 20 Beets Beta vulgaris Wheat Triticum aestivum Oats Avena sativa Fescue Festuca spp Pasture Bluestem Andropogon spp. 6, % 3 Bermuda Grass Cynodon spp. Seaoats Uniola paniculata Herbaceous Upland Upper Beach and Dune Grass Bitter Panicgrass Panicum amarum % 3 Bluestem Andropogon spp. Seaoats Uniola paniculata Herbaceous Riverine/Estuarine Jamaica Swamp Sawgrass Cladium mariscus spp. Jamaicense Salt Marsh or Maritime Wet Saltwort/Glasswort Salicornia bigelovii Grassland Needlegrass Rush Juncus roemerianus 3, % 3 Cordgrass Spartina spp. Wax myrtle Myrica cerifera Evergreen Shrubland Maritime Shrub Yaupon Holly Ilex vomitoria Eastern Red Cedar Juniperus virginiana % 3 Dwarf Live Oak Quercus minima Fetterbush Lyonia Lyonia lucida Mixed Shrubland Low Pocosin Swamp Titi Cyrilla racemiflora Inkberry Ilex glabra % 3 Laurel Greenbrier Smilax laurifolia Swamp Chestnut Oak Quercus michauxii Hardwood Swamps Laurel Oak Quercus laurifolia Nonriverine Wet Hardwood American Elm Ulmus americana Forest Red Maple Acer rubrum 2, % 3 Swamp Tupelo Nyssa biflora Needleleaf Deciduous Cypress Savanna Bald Cypress Taxodium distichum % 3 Longleaf Pine Pinus palustris Southern Yellow Pine Mesic Pine Flatwoods Loblolly Pine Pinus taeda 142, % 3 Slash Pine Pinus elliottii Red Mulberry Morus rubra Broadleaf Evergreen Forest Carolina Basswood Tilia americana var. caroliniana Wet Marl Forest (rare community Shumard's Oak Quercus shumardii on limestone substrate found American Elm Ulmus americana only in southern Pender County) White Oak Quercus alba % 3 Sweetgum Liquidambar styraciflua Longleaf Pine Pinus palustris Mixed Hardwoods/Conifers Pine - Scrub Oak Sandhill Turkey Oak Quercus laevis 2, % 3 Blackjack Oak Quercus marilandica Swamp Tupelo Nyssa biflora Oak/Gum/Cypress Cypress-Gum Swamp Blackgum Nyssa sylvatica Pond Cypress Taxodium ascendens 2, % 3 Bald Cypress Taxodium distichum 20 5 Water Includes salt, fresh & brackish 11, % 3 % of SIA Exposure modeling depth (cm)
348 TABLE A-2 NORTH CAROLINA LAND USE COVER CLASSES WITH DOCUMENTED ADVERSE EFFECTS Acres in Class II NC Land North Carolina Natural Cover Class 2 Land Cover Description 2 Dominant Species 1,2 or Botanical Name 3 Modeling % of SIA Communities Classification 1 Description Domain Unconsolidated Sediment Tidal sandy-silty areas % 3 Thematic Class 2 Sum Total 194, % Exposure modeling depth (cm) Weighted Average 4.47 References & Citations: 1 Schafale, Michael P., Weakley, Alan S Classification of the Natural Communities of North Carolina: Third Approximation. North Carolina Natural Heritage Program, Division of Parks and Recreation, N.C. Department of Environment, Health, and Natural Resources. 2 NC Geographic Information Coordinating Council, The North Carolina Center for Geographic Information and Analyses: NC One Map. Available online at [ accessed [December 13, 2010]. 3 Radford, Albert E., Ahles, Harry E., and C. Ritchie Bell, Manual of the Vascular Flora of the Carolinas. The University of North Carolina Press, Chapel Hill, North Carolina pp. TRV References/Data Sources: a - (Roberts 1982) b - Directive 2008/50/EC of the European Parliament and of the Council of the European Union: On ambiant air quality and cleaner air for Europe, 21 May 2008, c - Air Quality Management - National Ambient Air Quality Standards (NAAQS) for Criteria Pollutants, secondary standards d - Additional Impacts Analysis, Tampa Electric Polk County IGCC, 2007 e - Screening Level Ecological Risk Assessment Protocol, Appendix E: Toxicity Reference Values, USEPA 1999 f - Toxicological Benchmarks for Screening COPCs for Effects on Terrestrial Plants, 1997 Revision. Efroymson, Will, Suter, Wooten,US Department of Energy g - Faucon et al., Revisiting copper and cobalt concentrations in supposed hyperaccumulators from SC Africa: influence of washing and metal concentrations in soil * - water values for threshold levels are in ug/l h - Flagler, Richard B., Recognition of Air Pollution Injury to Vegetation: A Pictorial Atlas, 2nd, ed., Air & Waste Management Association, Pittsburg, Pennsylvania, i - National Academy of Engineering and National Research Council Energy Futures and Urban Air Pollution: Challenges for China and the United States. The National Academies Press, Washington, D.C. j - Photosynthetic Response of Field-Grown Soybeans to Fumigations with Sulphur Dioxide,R. N. Muller, J. E. Miller and D. G. Sprugel, Journal of Applied Ecology, Vol. 16, No. 2 (Aug., 1979), pp British Ecological Society k - Ozone and Sulfur Dioxide-Induced Changes in Soybean Growth, RA Reinert and DE Weber, The American Phytopathological Society, Phytopathology, Vol. 70, No. 9, 1980, pp l - Summary of phytotoxic levels of soil arsenic, SC Sheppard, Water, Air & Soil Pollution, Kluwer Academic Publications, Netherlands, Vol. 64: pp , 1992.
349 TABLE A-3 ECOLOGICAL TOXICITY DATA FOR TRACE METALS WITH DOCUMENTED ADVERSE EFFECTS HAPs metals CAS No. Carolina Cement Emissions Data % of Total Metals Emissions Annual Emissions (Tons/Yr) Recommended Ecological Screening Levels (µg/kg) Community Level Receptor Plants/Soil (Region 4) Reference Score Percent of Total Score Toxicity Reference Values (TRVs) Soil Invertebrates (µg/kg) Ecological Soil Screening Levels from EPA OSWER Superfund Toxicity Weighted Emissions Score for Plant Toxicity [tpy/(µg/kg)] Percent of Total Toxicity Weighted Emissions Score for Plant Toxicity Antimony and compounds % 7.46E E % 500 NA 2 NA 78, E % 2.13E % 0.12% Arsenic & inorganic arsenic compounds % 1.48E-02 10, E % 1, ,000 NA E % 5.91E % 2.06% Beryllium and compounds % 9.17E E % 100 NA 2 NA 40, E % 8.34E % 0.06% Cadmium and compounds % 2.57E E % , , , E % 1.60E % 0.10% Chromium and compounds % 1.61E E % NA NA E % 8.04E % 57.87% Chromium (VI) & compounds % 1.77E E % NA NA E % 8.83E % 6.36% Cobalt and compounds % 1.90E-02 20, E % NA NA 2 13,000 NA E % 9.49E % 0.04% Lead and compounds % 8.61E-02 50, E % 4, , ,000 1,700, E % 1.72E % 0.12% Manganese and compounds % 9.72E , E % NA NA 2 220, , E % 9.72E % 0.36% Mercury and compounds % 2.30E E % 349 2,500 2 NA NA E % 2.30E % 8.61% Nickel and compounds % 2.01E-02 30, E % 25, , , , E % 6.71E % 0.03% Selenium and compounds % 2.20E E % 50 7, , E % 2.72E % 24.28% Total HAPs Metals 1.54E E % 1.46E % 1.47E % 100% References: 1 - U.S. EPA Supplemental Guidance to RAGS: Region 4 Bulletins, Ecological Risk Assessment. Originally published November Table 4 from Website version last updated November 30, 2001: U.S. EPA Office of Solid Waste and Emergency Response, Screening Level Ecological Risk Assessment Protocol for Hazardous Waste Combustion Facilities, EPA530-D A, August U.S. EPA Office of Solid Waste and Emergency Response, Waste and Cleanup Risk Assessment, Ecological Soil Screening Level (Eco-SSLs) Guidance and Documents, April 4, 2005, available at Plants (µg/kg) Reference Plants (µg/kg) Soil Invertebrates (µg/kg) Reference Toxicity Weighted Emissions Score for Soil Toxicity [tpy/(µg/kg)] Percent of Total Toxicity Weighted Emissions Score for Soil Toxicity Average Percent of Total Toxicity Weighted Emissions Score for Plant & Soil Toxicity
350 TABLE A-4 ECOLOGICAL TOXICITY DATA FOR VOC COMPOUNDS WITH DOCUMENTED ADVERSE EFFECTS VOC Compounds/Constiuents CAS No. CCC Annual Emissions Ecological Screening Levels from EPA Region 5 1 Recommended Ecological Screening Levels EPA Region 4 2 Toxicity Weighted Emissions Score 3 Percent of Total Toxicity Weighted Emissions Score (tpy) (% of Total) (µg/kg) (µg/kg) [tpy/(µg/kg)] [tpy/(µg/kg)] Acrolein E % 5,270 NA 2.93E % 2-Butanone (Methyl ethyl ketone) E % 89,600 NA 3.67E % Benzene E % E % Carbon disulfide E % 94 NA 1.28E % Carbonyl sulfide E % 13,100 NA 1.34E % Dichloromethane (Methylene chloride) E % 4,050 2, E % Methyl chloride 4.16E % 10,400 NA 4.00E % o-xylenes E % 10, E % Styrene E % 4, E % Toluene E % 5, E % Total for Pollutants of Concern % 7.65E % 1 U.S. EPA Region 5 Waste Division, RCRA Corrective Action Guidance and Policy Documents, Ecological Screening Levels, August 22, 2003 available at 2 USEPA Supplemental Guidance to RAGS: Region 4 Bulletins, Ecological Risk Assessment. Originally published November Toxicity weighted emissions score relies on lowest of TRV or EcoSSL values for plants/soils from EPA Region 4 or 5.
351 TABLE A-5 NATURAL AREAS, WATER BODIES, STATE PARKS / RECREATION AREAS, AND PRESERVES IN THE MODELING DOMAIN Map ID No. Natural or Protected Area Distance from CCC (km) Direction from CCC Lake or Reservoir Type of Water Body Location (DD MM SS) Location (UTM NAD83 Zone 18) Wetlands River or Stream(s) N W East North 1 Holly Shelter State Park & Game Lands 8.7 ENE x x , ,187, Lanes Ferry Park 7.1 N x x , ,185, Belhammon Tract 5.7 WSW x x , ,192,687.01
352 TABLE A-6 DERIVED ECOLOGICAL CONCENTRATIONS FOR BENZENE AND CHROMIUM Deposited Concentration (DC) Tissue Concentration (TC) Period Highest a Annual Scalars b (MC) (W dep ) Ratio (CR) c Annual Average Weight Deposited Concentration μg/m 3 μg/m 3 μg μg/kg μg/kg Benzene Annual 1.33E E E E E+02 NA NA Chromium (VI) Soluble Chromate Chromium (VI) Bioavailable Chromate 24 Hour 1.80E E E-05 Annual 3.00E E E-05 Total Chromium Annual 6.60E E E E-01 NOTES: a. Based on worse case year for each averaging period b. Based upon Screen3 Conversion Factors c. Concentration ratios derived from Table 3.6 in "A Screening Procedure for the Impacts of Air Pollution Sources on Plants, Soils, and Animals." EPA 450/ Expected Lifetime of Source (N) 75 years Depth of Soil through which deposited material is distributed (d) 4.5 cm Deposition velocity (V dep ) 1 cm/sec Average soil density (ρ soil ) 1.27 g/cm 3 Average Weight of Local Soils (for 1 square meter) kg
353 APPENDIX B DRAWINGS AND FIGURES B-1


354 78 0'0"W 77 58'0"W 77 56'0"W 77 54'0"W 77 52'0"W 77 50'0"W 77 48'0"W 77 46'0"W 77 44'0"W 77 42'0"W 77 40'0"W 77 38'0"W 77 36'0"W 77 30'0"W 77 28'0"W 34 29'0"N Holly Shelter State Park 2 - Lanes Ferry Park 3 - Belhamman Tract Highs m it Holly Holly Shelter Shelter Game Game Land Land SP SP Use and Natural Communities U 210 V lc96_14km_clip 34 30'0"N Pender GRIDCODE 117 Urban: High Density Urban: Low Density Cultivated Crops Pasture Upper Beach & Dune Grass Salt Marsh & Maritime Wet Grassland Maritime Shrub Decidous Shrubland Low Pocosins Mixed Hardwoods Nonriverine Wet Hardwood Forest Cypress Savannah Mesic Pine Flatwoods Wet Marl Forest Pine-Scrub Oak Sandill Cypress-Gum Swamp Water Unconsolidated Sediment V U 34 28'0"N '0"N '0"N 133 V U Nc Hw y '0"N! a Isl nd ee Cr k r lte 34 24'0"N he S lly Ho '0"N 34 22'0"N 34 21'0"N 132 U V M New Hanover Kerr 34 19'0"N ille u r rayv V U Clay 132 tz d 77 59'0"W 77 57'0"W '0"W 74 O 132 riol e U V Wilmington 77 53'0"W So dl Carolinas Cement Corporation p A rbore t um ville 78 1'0"W Pla ce cess Prin ld Crestwoo le oo Rogers e 4th 78 3'0"W 23rd Mc Ra 76 ge ra rt po Air 34 17'0"N dd un sha Eli Go Mi Military Cutoff n rdo Brunswick Fi e 34 18'0"N Gor don Blue 421 Ros Harris 34 20'0"N 50 U V Land-Use Key Key to Land '0"N 34 27'0"N 77 51'0"W m Pe o br oke J s ne µ 12 Kilometers '0"W 77 47'0"W 77 45'0"W 77 43'0"W 77 41'0"W 77 39'0"W 77 37'0"W 77 35'0"W 77 33'0"W 2736 ROWLAND ROAD RALEIGH, NORTH CAROLINA '0"N PHONE: ,0800 FAX: FALCONENGINEERS.COM DATE: December 18, '0"N DRAWN BY: J. SCHEWE CHECKED BY: J. DUNBAR DESIGNED BY: 34 24'0"N DSG CHECKED BY: SCALE: 1 in = 12,273 ft PROJECT NO.: E '0"N NO. DATE 34 22'0"N REVISIONS REMARKS 34 21'0"N 34 20'0"N 34 19'0"N 34 18'0"N 34 17'0"N 34 16'0"N 34 15'0"N 34 14'0"N Additional Impacts Analysis Vegetation in the Modeling Domain C h 34 31'0"N 34 28'0"N Castle Hayne, North Carolina Class II Modeling 53 V U Domain (14 sq. km) Carolinas Cement Company ith Sm Natural Areas Onslow in the Impact Area 34 32'0"N 34 16'0"N 77 32'0"W 34 34'0"N 34 33'0"N 77 34'0"W 34 13'0"N 34 12'0"N 34 11'0"N DRAWING NO.001


355 77 58'0"W 77 56'0"W 34 34'0"N 77 54'0"W 77 52'0"W 77 50'0"W 77 48'0"W 77 46'0"W 77 44'0"W 77 42'0"W 77 40'0"W 77 38'0"W 77 36'0"W 77 34'0"W 77 32'0"W 77 30'0"W Holly Ridge Burgaw Class II Modeling Domain Onslow (14 sq. km) 34 28'0"N 53 V U North Topsail Beach St. Helena 34 32'0"N C h Highsm it Holly Holly Shelter Shelter Game Game Land Land SP SP 34 31'0"N RALEIGH, NORTH CAROLINA PHONE: , '0"N FAX: FALCONENGINEERS.COM DATE: December 20, 2010 DRAWN BY: J. SCHEWE 34 25'0"N CHECKED BY: J. DUNBAR DESIGNED BY: DSG CHECKED BY: SCALE: 1 in = 4 kilometers 34 24'0"N PROJECT NO.: E V U Surf City 34 30'0"N Pender '0"N 34 23'0"N 34 28'0"N 210 V U NO. V U Topsail Beach 34 21'0"N Nc H w y ! ( 421 an I sl d k ee Cr 34 20'0"N er elt 34 22'0"N h ys 34 19'0"N ll 34 24'0"N Ho 34 18'0"N Castle Hayne 34 23'0"N 34 17'0"N Carolina Cement Companies Kirkland Skippers Corner 132 V U 34 21'0"N 34 16'0"N Murraysville r ra y Kerr 34 19'0"N Wrightsboro M vil le u 132 V U Clay Brunswick dl p Military Cutoff 30th Ch Wilmington 74 So oo sha Eli es 23rd e th Mc Ra '0"N ut estn le un dg Ju 132 U V p Hightsville Air Navassa Mi Kings Grant ort 34 17'0"N Ogden dd Gor don Blue 34 18'0"N 34 15'0"N Bayshore Harris New Hanover 34 20'0"N A rbor e t u m Wrightsville Beach Clear Run µ 12 Kilometers Leland 78 5'0"W 78 3'0"W 78 1'0"W 77 59'0"W 77 57'0"W REMARKS 34 22'0"N '0"N DATE REVISIONS '0"N 34 25'0"N 34 27'0"N 2736 ROWLAND ROAD 77 55'0"W 77 53'0"W 77 51'0"W 77 49'0"W 77 47'0"W 77 45'0"W 77 43'0"W 77 41'0"W 77 39'0"W 77 37'0"W 77 35'0"W 34 14'0"N Additional Impacts Analyis Soils in the Modeling Domain 34 33'0"N 34 29'0"N Castle Hayne, North Carolina 78 0'0"W Carolina Cement Company 78 2'0"W 34 13'0"N 34 12'0"N DRAWING NO '0"N
APPENDIX D MODELING AND DEPOSITION ANALYSIS
 APPENDIX D MODELING AND DEPOSITION ANALYSIS Appendix D Ambient Air Quality Dispersion and Deposition Modeling Analyses Supporting a Permit to Install Application Eagle Project Located in Michigamme Township,
Single-Source Impacts on Secondary PM 2.5 Formation A Case Study
 Single-Source Impacts on Secondary PM 2.5 Formation A Case Study Midwest Environmental Compliance Conference Joe Stolle, PE, Senior Environmental Engineer Wendy Vit, PE, Senior Environmental Engineer May
STATEMENT OF BASIS. Cheney Lime & Cement Company Landmark Plant Alabaster, Alabama Shelby County Facility No
 STATEMENT OF BASIS Cheney Lime & Cement Company Landmark Plant Alabaster, Alabama Shelby County Facility No. 411-0019 This proposed Title V Major Source Operating Permit (MSOP) renewal is issued under
MODELING METHODOLOGY
 Paul Schleusener, Senior Engineer Specialist Michigan Department of Environmental Quality Air Quality Division Constitution Hall, 1 st Floor 525 West Allegan Street P.O. Box 30473 Lansing, MI 48909 7973
Technical Manual Guideline on Air Quality Impact Modeling Analysis
 New Jersey Department of Environmental Protection Division of Air Quality Bureau of Technical Services Technical Manual 1002 Guideline on Air Quality Impact Modeling Analysis November 2009 Table of Contents
SO 2 Air Dispersion Modeling Report for White Bluff Steam Electric Station. ERM Project No The world s leading sustainability consultancy
 SO 2 Air Dispersion Modeling Report for White Bluff Steam Electric Station August 2015 ERM Project No. 0268066 www.erm.com The world s leading sustainability consultancy SO 2 Air Dispersion Modeling Report
NORTH CAROLINA PSD MODELING GUIDANCE
 NORTH CAROLINA PSD MODELING GUIDANCE January 6, 2012 NORTH CAROLINA DEPARTMENT OF ENVIRONMENT AND NATURAL RESOURCES DIVISION OF AIR QUALITY PERMITTING SECTION AIR QUALITY ANALYSIS BRANCH Introduction TABLE
APPENDIX III. Air Quality Modelling of NO X and PM 10 (2007) RFI Report (Dec 2007)
 RFI Report (Dec 2007)") APPENDIX III Air Quality Modelling of NO X and PM 10 (2007) RFI Report (Dec 2007) 17 EPA Export 25-07-2013:22:32:47 Platin IPPC Licence Application Air Quality Modelling of NOx and PM (2007) EPA Export
APPENDIX III Air Quality Modelling of NO X and PM 10 (2007) RFI Report (Dec 2007) 17 EPA Export 25-07-2013:22:32:47 Platin IPPC Licence Application Air Quality Modelling of NOx and PM (2007) EPA Export
Metropolitan Transit. Prepared for. Original Submittal: May 28, Resubmitted: November 10, 2010 January 21, aq5-28
 Criteria Pollutant Air Dispersion Modeling Analysis for Metro Transit s Existing Hiawatha Light Rail Vehicle Operation & Maintenance Facility, Proposed Paint Booth, and Proposed Light Rail Support Facility
Annual Monitoring Network Plan for the North Carolina Division of Air Quality. Volume 1 Addendum 2
 2016-2017 Annual Monitoring Network Plan for the North Carolina Division of Air Quality Volume 1 Addendum 2 December 28, 2016 North Carolina Division of Air Quality A Division of the North Carolina Department
EXAMPLE AIR QUALITY ANALYSIS CHECKLIST a
 EXAMPLE AIR QUALITY ANALYSIS CHECKLIST a 1. Source location map(s) showing location with respect to:! Urban areas b! PSD Class I areas! Nonattainment areas b! Topographic features (terrain, lakes, river
PM2.5 NAAQS Implementation & Permitting in Georgia
 PM2.5 NAAQS Implementation & Permitting in Georgia Georgia Environmental Conference Jekyll Island, Georgia August 25, 2016 Brad James, P.E. Overview Current UFP Regulation (as PM 2.5 ) PM 2.5 NAAQS SIP
Technical Manual Guidance on Preparing an Air Quality Modeling Protocol
 New Jersey Department of Environmental Protection Division of Air Quality Technical Manual 1002 Guidance on Preparing an Air Quality Modeling Protocol 2018 Table of Contents 1.0 Introduction... 1 1.1
LINN COUNTY PUBLIC HEALTH DEPARTMENT
 LINN COUNTY PUBLIC HEALTH DEPARTMENT Air Quality Division M E M O R A N D U M DATE: MARCH 13, 2009 TO: FROM: RE: CC: TONY DAUGHERTY PM2.5 PREDICTED MODELING IMPACTS OF OUTDOOR WOOD BOILERS INTRODUCTION
AERMOD Modeling of PM2.5 Impacts of the Proposed Highwood Generating Station
 AERMOD Modeling of PM2.5 Impacts of the Proposed Highwood Generating Station September 10, 2007 Prepared for Montana Environmental Information Center and Citizens for Clean Energy Prepared by Khanh T.
TECHNICAL FACT SHEET September 24, 2018
 Copperwood Resources, Inc. Page 1 Purpose and Summary TECHNICAL FACT SHEET September 24, 2018 The Michigan Department of Environmental Quality (MDEQ), Air Quality Division (AQD), is proposing to act on
North Carolina Department of Environment and Natural Resources Division of Air Quality
 North Carolina Department of Environment and Natural Resources Division of Air Quality Beverly Eaves Perdue Governor B. Keith Overcash, P.E. Director Dee Freeman Secretary XXXXX, 2009 DRAFT Revision 4
Comparison of Two Dispersion Models: A Bulk Petroleum Storage Terminal Case Study
 Comparison of Two Dispersion Models: A Bulk Petroleum Storage Terminal Case Study Prepared By: Anthony J. Schroeder BREEZE SOFTWARE 12770 Merit Drive Suite 900 Dallas, TX 75251 +1 (972) 661-8881 breeze-software.com
GUIDELINES FOR EVALUATING THE AIR QUALITY IMPACTS OF TOXIC POLLUTANTS IN NORTH CAROLINA
 GUIDELINES FOR EVALUATING THE AIR QUALITY IMPACTS OF TOXIC POLLUTANTS IN NORTH CAROLINA February 2014 North Carolina Department of Environment and Natural Resources Division of Air Quality Permitting Section
AIR DISPERSION MODELING
 Click to edit Master title style AIR DISPERSION MODELING Use of AERMOD for NAAQS Area Designations and State Implementation Plan Submittals SPEAKER Stewart McCollam DATE February 10, 2016 USE OF AERMOD
Appendix 9-C Cumulative PM-10 Emissions Inventories (PSD/Major Sources and Local Sources)
") Appendix 9-C Cumulative PM-10 Emissions Inventories (PSD/Major Sources and Local Sources) 9.0 Air Quality Multi-source PSD PM 10 Modeling Inventory Development A multi-source modeling emissions inventory
Appendix 9-C Cumulative PM-10 Emissions Inventories (PSD/Major Sources and Local Sources) 9.0 Air Quality Multi-source PSD PM 10 Modeling Inventory Development A multi-source modeling emissions inventory
Sensitivity of AERMOD to Meteorological Data Sets Based on Varying Surface Roughness. Paper No A-168-AWMA
 Sensitivity of AERMOD to Meteorological Data Sets Based on Varying Surface Roughness Paper No. 2009-A-168-AWMA Prepared by: Anthony J. Schroeder, CCM Senior Consultant George J. Schewe, CCM, QEP Principal
PERMIT APPLICATION REVIEW SUMMARY
 PERMIT APPLICATION REVIEW SUMMARY New Hampshire Department of Environmental Services Air Resources Division P.O. Box 95, 29 Hazen Drive Concord, NH 03302-0095 Phone: 603-271-1370 Fax: 603-271-7053 AFS
Iowa Department of Natural Resources Title V Operating Permit
 Iowa Department of Natural Resources Title V Operating Permit Name of Permitted Facility: Lafarge North America Inc. Facility Location: 301 East Front Street Buffalo, IA 52728 Air Quality Operating Permit
Site-Specific PM 10 Ambient Air Monitoring Plan
 Site-Specific PM 10 Ambient Air Monitoring Plan Great Plains Sand Processing Facility Wenck File #2771-01 Prepared for: GREAT PLAINS SAND, LLC 15870 Johnson Memorial Drive Jordan, MN 55352 February 2012
Tips to Improve Model Results
 Tips to Improve Model Results 2019 Missouri Air Compliance Seminar Joseph Stolle, PE, Senior Environmental Engineer Wendy Vit, PE, Senior Environmental Engineer March 7, 2019 What is an Air Model? Used
Comments on Hi-Test Sand PSD Modeling Protocol Submitted by Kalispel Tribe of Indians October 2017
 Comments on Hi-Test Sand PSD Modeling Protocol Submitted by Kalispel Tribe of Indians October 2017 HiTest Sand, LLC (HiTest) proposes to construct and operate a silica smelter near Newport, WA along the
Appendix B2. Air Dispersion Modeling
 Appendix B2 Air Dispersion Modeling Contents 1.0 Introduction... 1 2.0 Estimation of Emissions Used in the Air Dispersion Modeling... 2 2.1 Emission Source Identification... 2 2.2 Derivation of Peak 1-Hour,
Annual Monitoring Network Plan for the North Carolina Division of Air Quality. Volume 1 Addendum
 2016-2017 Annual Monitoring Network Plan for the North Carolina Division of Air Quality Volume 1 Addendum September 1, 2016 North Carolina Division of Air Quality A Division of the North Carolina Department
AERMOD Modeling of SO2 Impacts of the Luminant Martin Lake Coal Plant
 AERMOD Modeling of SO2 Impacts of the Luminant Martin Lake Coal Plant Final Report June 2011 Prepared for Sierra Club San Francisco, California Prepared by Mr. Khanh T. Tran Principal AMI Environmental
Arkansas Department of pollution Control and Ecology Division of Air Pollution Control. Summary Report Relative to Permit Application
 ----- Vr%/tXJ Arkansas Department of pollution Control and Ecology Division of Air Pollution Control Summary Report Relative to Permit Application Submitted By: Nekoosa Papers, Inc. Ashdown, Arkansas (Little
Modeling For Managers. aq-ppt5-11
 Modeling For Managers aq-ppt5-11 Types of Models Near-field *Preferred: EPA AERMOD model 50km CLASS II; Increment Far-field CALPUFF 50km 100+km CLASS I; Chemical Transformation What is used at MPCA History
Review of KCBX Dispersion Modeling used to Support Their Variance Request
 Memorandum To: From: Robert Saikaly and Stephen Zemba Date: Subject: Review of KCBX Dispersion Modeling used to Support Their Variance Request CDM Smith Inc. (CDM Smith) reviewed two air dispersion modeling
GUIDANCE DOCUMENT. Engineering Guide #69 1 : Air Dispersion Modeling Guidance
 GUIDANCE DOCUMENT Division of Air Pollution Control July 1, 2003 (First Issuance) July 22, 2014 (Revised) Engineering Guide #69 1 : Air Dispersion Modeling Guidance Background: The Division of Air Pollution
Nevada Bureau of Air Pollution Control
 Nevada Bureau of Air Pollution Control General Air Dispersion Modeling Guidelines Rev. I. INTRODUCTION This document provides general guidelines to individuals preparing to submit modeling protocols and
COLACEM CANADA INC. L'ORIGNAL, ONTARIO. Version 1.0. This report documents the compliance status of the Facility as of May 3, 2016.
 May 2016 COLACEM CANADA INC. L'ORIGNAL, ONTARIO Emission Summary and Dispersion Modelling Report Version 1.0 This report documents the compliance status of the Facility as of May 3, 2016. Submitted to:
ROCK CRUSHING PLANT APPLICATIONS ADVICE
 ROCK CRUSHING PLANT APPLICATIONS ADVICE This guidance is intended to help applicants prepare applications and certifications with a reduced amount of effort, yielding clearer and more accurate applications.
NORTH CAROLINA DIVISION OF AIR QUALITY
 NORTH CAROLINA DIVISION OF AIR QUALITY PSD Preliminary Review modification 300 construction/operation permit (Draft Revision 8, July 2011 Assistant Secretary) Permit Issue Date: XXXX, XXX Facility Data
Michigan Department of Environmental Quality - Air Quality Division ADDITIONAL TECHNICAL INFORMATION FOR BOILERS
 Michigan Department of Environmental Quality - Air Quality Division ADDITIONAL TECHNICAL INFORMATION FOR BOILERS The following information will be used for the technical review of a permit to install application
NORTH CAROLINA DIVISION OF AIR QUALITY
 NORTH CAROLINA DIVISION OF AIR QUALITY PSD Preliminary Review modification 300 construction/operation permit (Revision 4, September 9, 2009) Permit Issue Date: XXXX, 2009 Draft Revision 4 Facility Data
Attachment 2. Modeling Protocol for Duke Energy Carolinas, LLC Belews Creek Steam Station
 Attachment 2 Modeling Protocol for Duke Energy Carolinas, LLC Belews Creek Steam Station Duke Energy Belews Creek Generating Station Modeling Protocol For 1-hour SO 2 National Ambient Air Quality Standard
New Source Review (NSR) Reform. Modeling Guidance: Policies and Procedures
 Reform. Modeling Guidance: Policies and Procedures") New Source Review (NSR) Reform Modeling Guidance: Policies and Procedures Prepared by: Dennis Becker Craig Thorstenson January 28, 2004 Minnesota Pollution Control Agency 520 Lafayette Road North St. Paul,
New Source Review (NSR) Reform Modeling Guidance: Policies and Procedures Prepared by: Dennis Becker Craig Thorstenson January 28, 2004 Minnesota Pollution Control Agency 520 Lafayette Road North St. Paul,
National Ambient Air Quality Standards
 Modeling Issues with the New National Ambient Air Quality Standards James Red Oris Solutions / BEE-Line Software Presented to North Texas Chapter of the Air & Waste Management Association August 24, 2010
Appendix 0 Air Dispersion Modelling Study Black Point Quarry Project Guysborough County, NS SLR Project No.:
 Appendix 0 Air Dispersion Modelling Study 2015 Black Point Quarry Project Guysborough County, NS SLR Project No.: 210.05913.00000 Black Point Quarry Air Dispersion Modelling Study Prepared for: CJ Spainhour
Additional Information to Supplement PSD Air Permit Application and State Air Facility Permit Application (# /00004)
") Stephen Tomasik Project Manager Energy Projects and Management Division of Environmental Permits NYS Department of Environmental Conservation 625 Broadway 4th Floor Albany, New York 122331750 Steven Riva
Stephen Tomasik Project Manager Energy Projects and Management Division of Environmental Permits NYS Department of Environmental Conservation 625 Broadway 4th Floor Albany, New York 122331750 Steven Riva
Air Dispersion Modeling Guidelines for Arizona Air Quality Permits
 Air Dispersion Modeling Guidelines for Arizona Air Quality Permits PREPARED BY: AIR ASSESSMENT SECTION AIR QUALITY DIVISION ARIZONA DEPARTMENT OF ENVIRONMENTAL QUALITY December 2004 TABLE OF CONTENTS Section
EMISSIONS ACTIVITY CATEGORY FORM CEMENT MANUFACTURING PLANTS
 FOR OHIO EPA USE FACILITY ID: EMISSIONS ACTIVITY CATEGORY FORM CEMENT MANUFACTURING PLANTS This form is to be completed for each cement manufacturing plant. State/Federal regulations which may apply to
Comparative Use of ISCST3, ISC-PRIME and AERMOD in Air Toxics Risk Assessment
 Comparative Use of ISCST3, ISC-PRIME and AERMOD in Air Toxics Risk Assessment KHANH T. TRAN Applied Modeling Inc., 21395 Castillo Street, Woodland Hills, CA 91364 Telephone (818) 716-5347, E-mail: kttran@amiace.com,
Recent Air Pollution Control and Permit Experience in the Lime Industry. Steven Klafka, P.E., DEE Wingra Engineering, S.C. Madison, Wisconsin
 Recent Air Pollution Control and Permit Experience in the Lime Industry Steven Klafka, P.E., DEE Wingra Engineering, S.C. Madison, Wisconsin Air Quality Permit for Lime Kiln Subject to PSD regulations.
ADEQ OPERATING AIR PERMIT
 ADEQ OPERATING AIR PERMIT Pursuant to the Regulations of the Arkansas Operating Air Permit Program, Regulation #26: IS ISSUED TO: Columbian Chemicals Company 713 Industrial Park Road El Dorado, AR 71730-6623
October 18, Multisource Modeling Addendum Clear River Energy Center Burrillville, Rhode Island
 October 18, 2016 Ms. Ruth A. Gold Supervising Air Quality Specialist Rhode Island Department of Environmental Management Office of Air Resources 2 Promenade Street Providence, Rhode Island 02908 Re: Multisource
Modeling 101: Intro to Dispersion Modeling Programs and Process
 1 Modeling 101: Intro to Dispersion Modeling Programs and Process Carolinas Air Pollution Control Association Presentation by: Pilar Johansson Trinity Consultants 2 Presentation Outline When are Models
Guidelines for Soil and Vegetation Analysis And Visibility Analysis
 Guidelines for Soil and Vegetation Analysis And Visibility Analysis December 2015 1. Introduction 1.1 Scope This document explains the requirements for performing a soil and vegetation analysis and a visibility
Draft Air Quality & Odour Net Effects Analysis & Comparative Evaluation Report
 Clean Harbors Canada Inc. Lambton Landfill Expansion Environmental Assessment Draft Air Quality & Odour Net Effects Analysis & Prepared By: JANUARY, 2014 Executive Summary Two expansion alternatives were
May 28, 2010 Project No
 May 28, 2010 Project No. 83088 4815 List Drive, Unit 115 Colorado Springs, CO 80919 p 719.632.3593 f 719.632.3593 kleinfelder.com Colorado Department of Public Health and Environment Air Pollution Control
Analysis of SO 2 Modeling Issues for Ameren Power Plants in the Greater St. Louis Area
 Analysis of SO 2 Modeling Issues for Ameren Power Plants in the Greater St. Louis Area Prepared by AECOM August 19, 2014 1. Introduction In 2010, the United States Environmental Protection Agency (EPA)
Ambient Air Quality Analysis (Attachment L)
") Ambient Air Quality Analysis (Attachment L) Killingly Energy Center May 2016 Prepared for: NTE Connecticut, LLC 24 Cathedral Place, Suite 300 Saint Augustine, FL 32084 Prepared by: Tetra Tech, Inc. 2 Lan
Ambient Air Quality Analysis (Attachment L) Killingly Energy Center May 2016 Prepared for: NTE Connecticut, LLC 24 Cathedral Place, Suite 300 Saint Augustine, FL 32084 Prepared by: Tetra Tech, Inc. 2 Lan
Energy Impact Analysis in Support of Class I Redesignation Requests. Prepared for. Fond du Lac Band of Lake Superior Chippewa Cloquet, Minnesota
 Energy Impact Analysis in Support of Class I Redesignation Requests Prepared for Fond du Lac Band of Lake Superior Chippewa Cloquet, Minnesota Prepared by August 2011 TABLE OF CONTENTS Section Page 1.0
ALABAMA DEPARTMENT OF ENVIRONMENTAL MANAGEMENT AIR DIVISION INSTRUCTIONS FOR COMPLETION OF MANUFACTURING OR PROCESSING OPERATION ADEM FORM 105
 ALABAMA DEPARTMENT OF ENVIRONMENTAL MANAGEMENT AIR DIVISION INSTRUCTIONS FOR COMPLETION OF MANUFACTURING OR PROCESSING OPERATION ADEM FORM 105 All applicable portions of this form should be completed by
Appendix C2 Dispersion Modeling of Criteria Pollutants for the Southern California International Gateway Project (Tables and figures in Appendix C2
 Appendix C2 Dispersion Modeling of Criteria Pollutants for the Southern California International Gateway Project (Tables and figures in Appendix C2 (Dispersion Modeling of Criteria Pollutants) have all
Policy for PSD Modeling District Rule 2410 Guidance for Identifying Sources to be Evaluated for Inclusion in an Increment Assessment
 San Joaquin Valley Air Pollution Control District Policy for PSD Modeling District Rule 2410 Guidance for Identifying Sources to be Evaluated for Inclusion in an Increment Assessment Approved By: Date:
EPA Air Quality Modeling Updates
 EPA Air Quality Modeling Updates Tyler Fox, EPA/OAQPS Presentation for R/S/L Modelers Workshop November 15, 2016 Presentation Overview Final Revisions to EPA s Guideline on Air Quality Models Draft SILs
APPENDIX H AIR DISPERSION MODELLING REPORT BY PROJECT MANAGEMENT LTD. (REF. CHAPTER 11 AIR QUALITY AND CLIMATIC FACTORS)
") 101050.22.RP.0001 A Environmental Impact Statement 15 th April 2005 APPENDIX H AIR DISPERSION MODELLING REPORT BY PROJECT MANAGEMENT LTD. (REF. CHAPTER 11 AIR QUALITY AND CLIMATIC FACTORS) S:\Projects\190900\101050
101050.22.RP.0001 A Environmental Impact Statement 15 th April 2005 APPENDIX H AIR DISPERSION MODELLING REPORT BY PROJECT MANAGEMENT LTD. (REF. CHAPTER 11 AIR QUALITY AND CLIMATIC FACTORS) S:\Projects\190900\101050
Intermodal Logistics Centre at Enfield Environmental Assessment CHAPTER 12 AIR QUALITY ASSESSMENT
 Intermodal Logistics Centre at Enfield Environmental Assessment CHAPTER 12 AIR QUALITY ASSESSMENT October 2005 Contents 12. 12-1 12.1 Introduction 12-1 12.2 Factors Affecting Air Quality 12-1 12.3 Air
Policy for PSD Modeling District Rule 2410 Guidance for Determining Modeling Domain
 San Joaquin Valley Air Pollution Control District Policy for PSD Modeling District Rule 2410 Guidance for Determining Modeling Domain Approved By: Date: XXXXXXXX Arnaud Marjollet, Director of Permit Services
Air Dispersion Modeling Guidelines. For Oklahoma Air Quality Permits
 Air Dispersion Modeling Guidelines For Oklahoma Air Quality Permits Prepared by the Engineering Section of the Permitting Unit Air Quality Division Oklahoma Department of Environmental Quality June 2016
PERMITTEE Seminole Electric Cooperative, Inc North Dale Mabry Highway Tampa, FL 33618
 PERMITTEE 16313 North Dale Mabry Highway Tampa, FL 33618 Authorized Representative: James R. Frauen, Project Director Air Permit No. 1070025-004-AC Units 1-2 Pollution Controls Upgrade Facility ID No.
EPNG is herein providing supplemental environmental information, including certain attachments, intended to clarify previously submitted data.
 September 19, 2018 Federal Energy Regulatory Commission 888 First Street, N.E. Washington, D.C. 20426 Attention: Ms. Kimberly D. Bose, Secretary Re: El Paso Natural Gas Company, L.L.C.; Docket No. CP18-332-000
MPCA Air Dispersion Modeling Practices Manual
 MPCA Air Dispersion Modeling Practices Manual September 20162017 Air Dispersion Modeling Practices Manual Risk Evaluation & Air Modeling Unit Air Assessment Section Environmental Analysis and Outcomes
ASA Bloomingburg, LLC. Air permit-to-install (PTI) number Public Hearing Date April 18, 2006 Comment Period End Date April 25, 2006
 number Public Hearing Date April 18, 2006 Comment Period End Date April 25, 2006") ASA Bloomingburg, LLC Air permit-to-install (PTI) number 01-01306 Public Hearing Date April 18, 2006 Comment Period End Date April 25, 2006 Summary of Comments and Ohio EPA Responses August 2006 Introduction
ASA Bloomingburg, LLC Air permit-to-install (PTI) number 01-01306 Public Hearing Date April 18, 2006 Comment Period End Date April 25, 2006 Summary of Comments and Ohio EPA Responses August 2006 Introduction
INDUSTRIAL ACCESSORIES COMPANY
 INDUSTRIAL ACCESSORIES COMPANY Industrial Accessories Company is an industrial design/build and original equipment manufacturer of baghouses, flue gas desulfurization, heavy metal mitigating sorbent injection
ADEQ MINOR SOURCE AIR PERMIT
 ADEQ MINOR SOURCE AIR PERMIT Permit No. : 2121-A IS ISSUED TO: 184 Wilson Mill Road Monticello, AR 71655 Drew County THIS PERMIT IS THE ABOVE REFERENCED PERMITTEE S AUTHORITY TO CONSTRUCT, MODIFY, OPERATE,
3 CONSTRUCTION-GENERATED CRITERIA AIR POLLUTANT AND PRECURSOR EMISSIONS
 3 CONSTRUCTION-GENERATED CRITERIA AIR POLLUTANT AND PRECURSOR EMISSIONS 3.1 INTRODUCTION Construction activities have the potential to generate a substantial amount of air pollution. In some cases, the
ADEQ MINOR SOURCE AIR PERMIT
 ADEQ MINOR SOURCE AIR PERMIT Permit No. : 1986-AR-4 IS ISSUED TO: Tyson Foods, Inc. Cobb Feed Mill 2125 Country Club Road Siloam Springs, AR 72761 Benton County THIS PERMIT IS THE ABOVE REFERENCED PERMITTEE
SWCAA Emission Inventory Instructions
 SWCAA Emission Inventory Instructions Why is an emission inventory required? Most of the emission inventory reporting requirements originated in Title 0 of the Code of Federal Regulations (0 CFR) Part
CONSTRUCTION PERMIT. PERMIT NO: 09LP0202F Final Approval
 COLORADO DEPARTMENT OF PUBLIC HEALTH AND ENVIRONMENT AIR POLLUTION CONTROL DIVISION TELEPHONE: (303) 692-3150 CONSTRUCTION PERMIT PERMIT NO: 09LP0202F Final Approval DATE ISSUED: September 3, 2013 Modification
PERMIT APPLICATION REVIEW SUMMARY
 PERMIT APPLICATION REVIEW SUMMARY New Hampshire Department of Environmental Services Air Resources Division P.O. Box 95, 29 Hazen Drive Concord, NH 03302-0095 Phone: 603-271-1370 Fax: 603-271-7053 AFS
TECHNICAL MANUAL 1002 GUIDANCE ON PREPARING AN AIR QUALITY MODELING PROTOCOL
 TECHNICAL MANUAL 1002 GUIDANCE ON PREPARING AN AIR QUALITY MODELING PROTOCOL BUREAU OF AIR QUALITY EVALUATION AIR QUALITY PERMITTING PROGRAM NEW JERSEY DEPARTMENT OF ENVIRONMENTAL PROTECTION August 1997
ENVIRONMENTAL GUIDELINES FOR PREVENTION AND CONTROL OF FUGITIVE EMISSIONS FROM CEMENT PLANTS
 ENVIRONMENTAL GUIDELINES FOR PREVENTION AND CONTROL OF FUGITIVE EMISSIONS FROM CEMENT PLANTS For achieving effective prevention and control of potential fugitive emission sources in cement manufacturing
CCR COMPLIANCE FUGITIVE DUST CONTROL PLAN. Prepared for: Tucson Electric Power Company Springerville Generating Station Springerville, Arizona
 CCR COMPLIANCE FUGITIVE DUST CONTROL PLAN Prepared for: Tucson Electric Power Company Springerville Generating Station Springerville, Arizona Prepared by: CB&I Environmental & Infrastructure, Inc. Pittsburgh,
4.4 AIR QUALITY Approach to Analysis
 4.4 AIR QUALITY Section 4.4 addresses the potential impacts to air quality as a result of the proposed action. Air quality can be affected by air pollutants produced by mobile sources, such as vehicular
APPENDIXG FUGITIVE DUST CONTROL PLAN
 APPENDIXG FUGITIVE DUST CONTROL PLAN As required by 324.5524 a fugitive dust control plan has been prepared. Pertinent sections are as follows: (1) The provisions of this section, including subsection
October 20, Revised PSD Construction Permit Application Carolinas Cement Company LLC. Dear Dr. van der Vaart:
 October 20, 2008 Dr. Donald R. van der Vaart, Ph.D, P.E. Chief, Permitting Section North Carolina Department of Environment and Natural Resources 2728 Capital Blvd. Raleigh, North Carolina 27604 Re: Revised
Localized Significance Threshold Analysis
 Localized Significance Threshold Analysis ANDORA AVENUE SUBDIVISION Tentative Tract No. 53426 Subsequent EIR Localized Significance Threshold Analysis Prepared for: City of Los Angeles, Department of City
ADEQ MINOR SOURCE AIR PERMIT
 ADEQ MINOR SOURCE AIR PERMIT IS ISSUED TO: Peterson Farms, Inc. Feed Mill 2565 North Highway 59 Decatur, AR 72722 Benton County THIS PERMIT IS YOUR AUTHORITY TO CONSTRUCT, MODIFY, OPERATE, AND/OR MAINTAIN
Regional Photochemical Modeling - Obstacles and Challenges. Extended Abstract No Prepared By:
 Regional Photochemical Modeling - Obstacles and Challenges Extended Abstract No. 33594 Prepared By: Christine L Haman, PhD Consultant Abhishek S Bhat, PhD Senior Consultant Tiffany L Gardner BREEZE Product
Air Permi>ng: A Major Piece of the Puzzle or Trying to Keep All of
 Air Permi>ng: A Major Piece of the Puzzle or Trying to Keep All of the Balls in the Air Insert then choose Picture select your picture. Right click your picture and Send to back. The world s leading sustainability
Hot Topics: Appendix W, MERPS, and SILs
 Hot Topics: Appendix W, MERPS, and SILs Richard Chet Wayland Director, Air Quality Assessment Division Office of Air Quality Planning and Standards September 14, 2016 1 Regulatory Revisions to Appendix
Naughton Power Plant. Chapter 6, Section 2 Construction Permit Application. Submitted to the Wyoming Air Quality Division And Prepared by
 Naughton Power Plant Chapter 6, Section 2 Construction Permit Application Submitted to the Wyoming Air Quality Division And Prepared by 1407 West North Temple Salt Lake City, Utah 84116 March 2008 1.0
September 14, Health Risk Assessment Report- Permanente Plant. To: Scott Lutz
 September 14, 2010 Permanente Plant 24001 Stevens Creek Boulevard Phone (408) 996-4000 Fax (408) 725-1019 www.lehighpermanente.com Scott Lutz Air Quality Engineering Manager - Toxic Evaluation Section
United Taconite Analysis of Best Available Retrofit Technology (BART)
") United Taconite Analysis of Best Available Retrofit Technology (BART) Table of Contents 1. Executive Summary...iv 2. Introduction...1 2.A BART Eligibility...3 2.B BART Determinations...3 3. Streamlined
United Taconite Analysis of Best Available Retrofit Technology (BART) Table of Contents 1. Executive Summary...iv 2. Introduction...1 2.A BART Eligibility...3 2.B BART Determinations...3 3. Streamlined
GLNG PROJECT - ENVIRONMENTAL IMPACT STATEMENT
 6 J:\Jobs\42626220\07 Deliverables\EIS\FINAL for Public Release\6. Values and Management of Impacts\6-8 Air Quality\06 08 Air Quality (Section 6.8) FINAL PUBLIC track.doc GLNG Project - Environmental Impact
Gunlake Quarry. Air Quality Management Plan
 Gunlake Quarry Air Quality Management Plan August 2015 Table of Contents 1. Introduction 3 1.1 Overview 3 1.2 Aims and Objectives 3 2. Air Quality Criteria 3 2.1 Impact Assessment Criteria 4 2.2 Sources
F3. Final Air Quality & Odour Net Effects Analysis & Comparative Evaluation Report
 F3. Final Air Quality & Odour Net Effects Analysis & Comparative Evaluation Report Clean Harbors Canada Inc. Lambton Landfill Expansion Environmental Assessment Air Quality & Odour Net Effects Analysis
NJDEP Comments on STAPPA/ALAPCO/WESTAR List of Issues to be Addressed in the PSD Reform Initiative
 Alan Dresser New Jersey DEP, Bureau of Air Quality Evaluation 12/9/04 NJDEP Comments on STAPPA/ALAPCO/WESTAR List of Issues to be Addressed in the PSD Reform Initiative Emission Inventory Issues General
Lehigh Northeast Cement Company Glens Falls, NY. Sarah Sweeney Environmental Manager
 Lehigh Northeast Cement Company Glens Falls, NY Sarah Sweeney Environmental Manager Our Responsibility To be responsible to the environment and to the health and safety of our employees and neighbors To
FOUNDATION TRANSFORMATION VALUE Analyst & Investor Day On Location. May 10, 2016 Dallas, Texas
 FOUNDATION TRANSFORMATION VALUE Analyst & Investor Day On Location May 10, 2016 Dallas, Texas www.martinmarietta.com Disclaimer Statement Regarding Safe Harbor for Forward-Looking Statements This presentation
Mittal Steel BART Report September 8, 2006
 Mittal Steel BART Report September 8, 2006 Mittal Steel BART Report September 8, 2006 Table of Contents 1. Executive Summary...iii 2. Introduction... 1 2.A BART Eligibility... 3 2.B BART Determinations...
This summary and the Report subsequently inform the recommended mitigation contained in Section 28 and will inform the Project conditions.
 18. Air The Project Air quality team prepared an Air Quality Assessment Report for the Project, which is included in Volume 3 (Part 1). The Report provides an assessment of air quality effects associated
Changes to Air Quality
 Changes to Air Quality Identifying how the Detroit River International Crossing (DRIC) study alternatives may change air quality is an important consideration in the DRIC Environmental Assessment. Air