ABSTRACT. a system for allocating resources known as the Requirements and Capabilities Analysis
|
|
|
- Margery Cox
- 6 years ago
- Views:
Transcription
1 ABSTRACT SCHWARTZ, BLAKE EVAN. An Evaluation of US Army Special Operations Command s Requirements and Capabilities Analysis System using Condition Number Analysis and Scaling of Quantized Responses. (Under the direction of Dr. Thom Hodgson). The United States Army Special Operations Command (USASOC) is currently implementing a system for allocating resources known as the Requirements and Capabilities Analysis system. The system takes survey data from USASOC units prioritizing capabilities that the units are required to possess by rating each capability at one of three levels. Using those survey responses combined with data from past missions, the system prioritizes the capabilities and Elements of Cost that support them. USASOC will use the prioritized Elements of Cost list to allocate resources. The purpose of this study is to conduct an analysis of the logic and sensitivity of the Requirements and Capabilities Analysis System, determine whether the system is constructed in a way that achieves what USASOC intends, and make recommendations for implementation and improvement. We will examine the validity and sensitivity of the system by using condition number analysis and sensitivity analysis, and by applying research methods for quantizing qualitative data to the survey responses.
2 Copyright 2013 by Blake Evan Schwartz All Rights Reserved
3 An Evaluation of US Army Special Operations Command s Requirements and Capabilities Analysis System using Condition Number Analysis and Scaling of Quantized Responses by Blake Evan Schwartz A thesis submitted to the Graduate Faculty of North Carolina State University in partial fulfillment of the requirements for the degree of Master of Science Operations Research Raleigh, North Carolina 2013 APPROVED BY: Dr. Thom Hodgson Committee Chair Dr. Russell King Dr. Jeffrey Joines
4 BIOGRAPHY MAJ Blake Evan Schwartz is a 2003 graduate of the United States Military Academy at West Point, where he double majored in Spanish and German. Blake was commissioned into the US Army as a Second Lieutenant in the Infantry upon graduation. He has served multiple combat deployments as an Infantry and Special Forces officer. In 2011, Blake was selected to join the Operations Research/ Systems Analysis branch. He then attended North Carolina State University under the Army s Advanced Civil Schooling program to earn a Master of Science degree in Operations Research. ii
5 ACKNOWLEDGMENTS For her assistance and support with research, time management, and baby-watching, I want to thank my wonderful wife, Alyssa. For giving me extensive access, time, and assistance with all kinds of issues, thanks to Drs. Thom Hodgson and Russell King. iii
6 TABLE OF CONTENTS LIST OF TABLES v LIST OF FIGURES vi I. BACKGROUND II. ANALYSIS OF THE CURRENT SYSTEM III. ISSUES WITH THE REQUIREMENTS AND CAPABILITIES ANALYSIS SYSTEM IV. METHODS: CONDITION NUMBER ANALYSIS V. METHODS: SCALING OF WEIGHTS VI. RESULTS VII. DISCUSSION OF RESULTS VIII. CONCLUSIONS AND RECOMMENDATIONS IX. AREAS FOR FURTHER STUDY X. REFERENCES APPENDICES A. OFFICE OF THE SECRETARY OF DEFENSE APPROVED JOINT CAPABILITY AREAS B. REQUIREMENTS AND CAPABILITIES ANALYSIS SYSTEM LOGIC REPLICATOR C. STATISTICS ON SURVEY RESPONSES BY USASOC COMMANDS iv
7 D. OUTPUT OF SENSITIVITY OF JOINT CAPABILITY AREA WEIGHTS E. JOINT CAPABILITY AREAS SURVEY RESULTS v
8 LIST OF TABLES Table 1: Proportions of all responses by unit Table 2: Simple Statistics of responses for Special Forces Command Table 3: Rescaled Simple Statistics of responses for Special Forces Command Table 4: Distribution of responses over commands Table 5: Responses by command Table 6: Expected Responses by command Table 7: (n ij - Ê ij ) 2 / Ê ij values Table 8: Table of Expected % Changes in Response and Standard Deviations vi
9 LIST OF FIGURES Figure 1: Illustration of Requirements and Capabilities Analysis system logic... 9 Figure 2: Goodness of Fit Testing for Command Responses against total Response Distribution Figure 3: The A matrix Figure 4: the b vector of prioritized Elements of Cost Figure 5: The A matrix and inverse of its truncated version Figure 6: The modified A matrix with its inverse and condition number Figure 7: Sensitivity Comparison of Original and Revised Data...40 Figure 8: Average % Change in Results and a Function of Condition Number vii
10 I. BACKGROUND US Army Special Operations Command (USASOC) is a subordinate command of Special Operations Command (SOCOM) in the US Army. USASOC has its headquarters at Ft. Bragg, NC. The units subordinate to USASOC include the Army s Special Operations forces: Special Forces, Military Information Support Operations units, Civil Affairs units, US Army Rangers, and others. USASOC is currently developing and seeking to implement the Requirements and Capabilities Analysis System (described in [1], which the command hopes to use to allocate resources (i.e. the USASOC budget) to most efficiently enable USASOC units to attain and maintain the capabilities they are required to have. The outputs from the Requirements and Capabilities Analysis System include a prioritized list of Elements of Cost, the many different things that USASOC units spend money on. These include weapons, training, materiel, vehicles, computer equipment, etc. This prioritized list of Elements of Cost will be used by USASOC to allocate its budget internally. Another output of the Requirements and Capabilities Analysis system is a prioritized list of the capabilities that USASOC units are required to have. This prioritized list of capabilities will be used as input to a system called the Strategy-to-Task Optimizing Resource Model, maintained at SOCOM, which uses a linear optimizer to allocate budget resources to all SOCOM units, including USASOC. As described in [2], the Strategy-to-Task Optimizing Resource Model will evaluate the most cost-effective means of meeting the requirements and capabilities for USASOC units, using the output from the Requirements and Capabilities Analysis System. This study is an evaluation of the Requirements and Capabilities Analysis System. 1
11 The Requirements and Capabilities Analysis System is a database-structured system which links Elements of Cost (such as materiel, training, weapons systems, etc.) to capabilities that USASOC units are required to have. The capabilities are defined as Joint Capability Areas published by the Department of Defense. For example, Maneuver to Engage is a Joint Capability Area. The approved Joint Capability Areas that the Requirements and Capabilities Analysis System includes are included in Appendix A. To continue with the example, each unit subordinate to USASOC, at every echelon, is evaluated to determine how important the capability to Maneuver to Engage is to performing each of their core missions. It has been determined that for every Special Forces Company, for example, Maneuver to Engage has a Critical level of importance for the Special Forces core mission of Counter-Terrorism. The three possible levels of importance, in decreasing level of importance, are Critical, Essential, and Enhancing. For other types of units, or at other echelons, Maneuver to Engage may be less important than for Special Forces Companies. The capability may also be less important for Special Forces Companies conducting a different core mission, such as Foreign Internal Defense. Each Joint Capability Area has component Tasks, and the Elements of Cost support the Tasks. Each Task is determined to be Critical, Essential, or Enhancing to its parent Joint Capability Area, and each Element of Cost is determined to be Critical, Essential, or Enhancing to the Task it supports. The contribution of each Element of Cost to enhancing each specific capability required of a unit (as defined by the Joint Capability Areas) is therefore measurable. USASOC s goal is to determine how best to allocate funding to the Elements of Cost to most efficiently meet the capability requirements of USASOC units 2
12 defined by the Joint Capability Areas. [3] defines USASOC s enduring goal of using optimization to allocate resources to enhance capabilities. Currently, the optimizer that SOCOM is implementing to allocate resources uses a Prioritized Required Capabilities List, which is a ranked list of the capabilities of each unit type at each echelon. Funding of Elements of Cost is determined using the relationship of each Element of Cost to each capability, for each unit type, core mission, and echelon. One disadvantage of this method is that the contribution of each Element of Cost to each capability is determined by imprecise means, primarily by expert assessment at SOCOM [2]. The Requirements and Capabilities Analysis System, if adopted in totality by SOCOM, would rectify this by defining the contributions of each Element of Cost, measured as the levels of importance to each Task, and each Task s level of importance to each capability. The levels for each Element of Cost and Task are determined by unit survey, so the end users of the Elements of Cost determine the response levels. The capability of the Requirements and Capabilities Analysis System to rank each Element of Cost by overall contribution to any subset of USASOC units is also critical for USASOC s allocation of its own resources, even if the system is not adopted by SOCOM. If SOCOM continues to use the Strategy-to-Task Optimizing Resource Model in its current form, USASOC would use the Requirements and Capabilities Analysis system for its own internal budgeting, and to provide the Prioritized Capabilities List for use by SOCOM and the Strategy-to-Task Optimizing Resource Model. The algorithm that the Requirements and Capabilities Analysis system uses to rank Elements of Cost to Joint Capability Areas will be defined in detail below. For a visual representation and smaller scale simulation of how the Elements of Cost are evaluated, it will 3
13 be helpful to reference the Weight Generator tab of the Requirements and Capabilities Analysis System Logic Replicator in EXCEL, attached as Appendix B. USASOC is still working to implement the Requirements and Capabilities Analysis System, and has not done an evaluation of the sensitivity or validity of the system. The purpose of this study is to conduct an analysis of the logic and sensitivity of the Requirements and Capabilities Analysis System, determine whether the system is constructed in a way that achieves what USASOC intends, and make recommendations for implementation and improvement. 4
14 II. ANALYSIS OF THE CURRENT SYSTEM The Requirements and Capabilities Analysis System has two primary outputs: relative weights for each of the capabilities that are required of USASOC units, and relative weights for each Element of Cost that USASOC units may spend money on. While the current system that SOCOM is implementing utilizes a prioritized list of capabilities, USASOC hopes that SOCOM will adopt the Requirements and Capabilities Analysis system in total, and use the prioritized list of Elements of Cost to allocate resources [1]. First, we will address the mechanism by which the Requirements and Capabilities Analysis System generates a prioritized list of capabilities. The concept is to define the capabilities required of each USASOC unit, then evaluate which capabilities are most important to the units overall mission success. We can then allocate resources to the units by determining how much each Element of Cost contributes to a capability for one of the units conducting one of its missions. This last part may be done by the Requirements and Capabilities Analysis system, using the prioritized list of Elements of Cost that it can generate, or can be done separately (as SOCOM currently intends). The capabilities evaluated are defined as the Joint Capability Areas published by the Department of Defense, available in Appendix A. The weights for each capability are calculated using the missions that USASOC units conduct. For the time cycle being considered, every mission conducted by a USASOC unit is recorded into the Requirements and Capabilities Analysis System. Each mission has the following attributes: 5
15 Attribute 1): Core Operation or Core Activity being conducted. The USASOC Core Operations are: Unconventional Warfare, Foreign Internal Defense, Counter-Weapons of Mass Destruction, Counter-Insurgency, Counter-Terrorism, Stability Operations, and Support to Major Operations and Campaigns. The USASOC Core Activities are: Civil Affairs Operations, Direct Action, Hostage Rescue and Recovery, Interdiction and Offensive Weapons of Mass Destruction Operations, Military Information Support Operations, Preparation of the Environment, Security Forces Assistance, Special Reconnaissance, Combat Support/ Combat Service Support. Each mission conducted by a USASOC unit involves one or more Core Operations and Core Activities. Every Joint Capability Area is evaluated as Critical, Essential, Enhancing, or Not Applicable for each Core Operation and Core Activity. See Appendix E for the responses for each Core Operation and Core Activity by each USASOC command. Attribute 2): Unit. This describes the echelon and type of unit conducting the mission. Attribute 3): Frequency. Many missions recur regularly, and the frequency is the number of times an identical mission occurs during the time period being evaluated. Attribute 4): Quantity. This denotes how many of the unit in question are performing the mission. For example, a mission may call for four Special Forces teams. Attribute 5): Duration. This denotes the length of the mission, in days. Attribute 6): Country. This denotes the country the unit is deploying into. Each country has a priority weight assigned to it, allowing countries that the command considers tot be more important to have a higher impact on the Capabilities requirements. 6
16 To determine the weight for each capability, the Requirements and Capabilities Analysis System identifies each instance of the capability being required for a mission during the time period under consideration. For each instance, it multiplies the Frequency * Quantity * Duration * a criticality score associated with the Critical, Essential, or Enhancing level of importance. The criticality scores are currently set to 15 for Critical, 9 for Essential, and 5 for Enhancing. If a capability is not applicable to a mission, the criticality score is zero, so the instance is not counted toward the capability s weight. There is also an optional Commander s Priority weight assigned to each mission. This value may be included in the product for each instance to allow the commander greater control in applying resources to missions that he views are the most important. The Requirements and Capabilities Analysis System then sums the products for each instance to determine the raw score for each capability. It rank orders the capabilities to produce a Prioritized Required Capabilities List, which is to be used by the optimizer to determine the relative importance of capabilities to fund. The current system that SOCOM, the higher headquarters for USASOC, is implementing uses a Prioritized Required Capabilities List to determine the relative importance of each capability to fund, but it uses a highly subjective method of determining the impact an Element of Cost will have on a capability. SOCOM currently uses surveys from units and a few analysts expertise to assign the relative weights for the impact of an Element of Cost on a capability [2]. One of the advantages of the Requirements and Capabilities Analysis System is that it generates weights for each Element of Cost using the 7
17 Prioritized Required Capabilities List, creating much more sound relative weights for each Element of Cost. The Requirements and Capabilities Analysis System evaluates each Element of Cost by determining a score for it, similar to the score for each capability. As with the capability scores, the scale of each score individually is meaningless; but the scores are compared, ranked, and each score s percentage of the total of all scores is determined. That percentage is then used to rank the Elements of Cost. The score for each Element of Cost is generated in a similar manner to the capability scores, with the added dimension of a doctrinal component. Each Joint Capability Area is doctrinally defined to contain tasks. For a unit to possess the capability defined in the Joint Capability Area, it must be able to conduct the Tasks that constitute the capability. A Task may be used in multiple Joint Capability Areas. Similarly, each Task is doctrinally defined to have Elements of Cost that support it. For example, the Joint Capability Area Maneuver to Engage may have the Task Conduct Convoy Operations. One among many Elements of Cost supporting the Task may be the Ground Mobility Vehicle. Each Task is assessed to be either Critical, Essential, or Enhancing to each Joint Capability Area where it is applicable. Similarly, each Element of Cost is assessed to be Critical, Essential, or Enhancing to each Tasks that utilizes it. The Critical, Essential, and Enhancing levels are again assigned weights of 15, 9, and 5 respectively. To determine the relative weight of the Ground Mobility Vehicle, or any other Element of Cost, the Requirements and Capabilities Analysis System assesses each mission in the current time period under consideration. It searches for each Element of Cost, and multiplies the following: 8
18 Capability j * Task j * ElementOfCost j * Freq j * Dur j * Qty j * Ctry j For illustration, Figure 1 below shows a few Tasks and supporting Elements of Cost under the Maneuver to Engage Joint Capability Area, for one echelon of Special Forces, for the Core Mission of Foreign Internal Defense. The total Element of Cost score in the last column is the sum of the products resulting from each instance of an Element of Cost supporting a Task. For the Element of Cost M4, for example, we calculate: Capability Weight (Column 5) * Task Weight (Column 8) * Element of Cost Weight (Column 11) * Frequency * Duration * Quantity * Country Weight (Column 16) = Total for first instance of M4 The final score is then the summation of the products for each instance, so the total score for each Element of Cost is given by: n j 1 Capability * Task * ElementOfCost * Freq * Dur * Qty * Ctry j j j j j j j, where n is the number of instances of an Element of Cost. We then add the totals for the two instances of M4 to get the final score in the last column. Figure 1- Illustration of Requirements and Capabilities Analysis system logic. 9
19 As shown, each Element of Cost may have multiple instances under each mission because it may support more than one Task, and more than one Capability. The products determined for each instance of an Element of Cost are then summed to yield a final score for each Element of Cost. The Elements of Cost are then ranked by percentage of the total of all scores, and this percentage becomes the relative weight for each Element of Cost. When the optimizer at SOCOM determines the best portfolio for meeting capability requirements, it will use the relative weights for each Element of Cost to measure its impact on a Joint Capability Requirement. The optimizer uses dependencies and redundancies between Elements of Cost as constraints, and other constraints may be added to enable commanders to fund capabilities and Elements of Cost they consider indispensable. It should be noted that the optimizer used by SOCOM uses a system that will not be discussed in depth here to determine the price of each Element of Cost, allowing it to determine an optimal portfolio for maximizing capabilities while meeting the budgetary constraints of SOCOM. In addition to their importance for SOCOM s optimizer, USASOC intends to use the relative weights for each Element of Cost across all Joint Capability Requirements to determine its budgetary requirements and allocation. SOCOM is currently continuing to develop its system to determine requirements and allocate resources, which is essentially a competitor to the Requirements and Capabilities Analysis System. As SOCOM and USASOC determine what course each will take, however, the Requirements and Capabilities Analysis System will remain important to USASOC because of its powerful application to USASOC s internal budget, regardless of SOCOM s decision to implement something similar or different. 10
20 For a representation and examples of the generation of ranked relative weights for Elements of Cost, see the Weight Generator tab in Appendix B. 11
21 III. ISSUES WITH THE REQUIREMENTS AND CAPABILITIES ANALYSIS SYSTEM During our evaluation of the Requirements and Capabilities Analysis System, we determined that there are two issues with the system as it currently stands. Both concern the inputs to the system; the logic that generates a prioritized list of the Elements of Cost is very sound, but the inputs to the system are flawed. Our two concerns are: 1). When prompted by survey to evaluate the importance of each Joint Capability Area to each of the USASOC core missions, many of the units rated too many of the capabilities as Critical. We will discuss the implications of this fault, and make recommendations to rectify the distribution of the responses. 2). The numerical values assigned to the importance levels (Critical, Essential, and Enhancing) are arbitrary, not based on any analysis or concrete metric. We will discuss and recommend appropriate methods for determining quantitative values for these qualitative levels. We verified that 1) is an issue with the system by determining the mean and standard deviations for values of programs, organized by type of USASOC unit. The results are attached as Appendix C. While some of the USASOC elements showed a relatively centralized distribution, with means within 10% of the scale from the middle, Essential value, other USASOC elements had responses with very right-skewed distributions. Their means 12
22 were as close as within 11% of the scale to the Critical value, much closer than to the Essential value on the scale. With the weights set at [15, 9, 5], mean response values for one element was as high as Because the data is not mound shaped, the standard deviations can not be easily used to approximate confidence intervals for the responses. For example, using the Empirical Rule, a 95% Confidence Interval for Special Forces responses would be [ ]. The upper value is completely meaningless because the highest value possible out of the three discrete choices is 15. The lower value is also of very little value, since the scale is not continuous and does not include the value This determination of the first two moments for the response data confirmed what appeared to be the case with the raw responses, i.e. that some units responded that a very high proportion of Joint Capability Areas were Critical regardless of the core mission, while other units responded with a more central distribution. However, we wanted to conduct a more explicit test of the responses, and perform a qualitative test that would divorce the response data from the scale of the values chosen for them. In order to do this, we started by performing a simple Chi-Squared Goodness of Fitness Test on the data to determine whether the proportions of the responses of each type matched an expected proportion. For the expected proportion, we used the proportions of all responses by all units, given below in Table 1. Table 1- Proportions of all responses by unit. Total All Data Total Count Proportion Critical Essential Enhancing
23 For example, as indicated above, the proportion of all responses that was Critical was The Chi-Squared test was to determine whether Special Forces units, Ranger units, and the other unit types responded in the same proportions as the overall data. The Chi-Squared test is given by Χ 2 = [(n i -E i ) 2 /E i ], with n-1 = 2 degrees of freedom. The critical value for testing at the α=.05 level is The results of the Chi-Squared tests for each of the USASOC component commands (Special Forces, JFK Special Warfare Training Center and School, Rangers, Special Operations Aviation, Military Information Support Operations, Civil Affairs, and Sustainment) are given below in Figure 2. For all 7 commands, we reject the null hypothesis and conclude that the response proportions for the command in question differ from the overall response distribution. 14
24 SF Total Count Proportion Critical Χ 2 = Essential p-value <<.001 reject H 0: At least one response proportion differs Enhancing SWCS Total Count Proportion Critical Χ 2 = Essential p-value <<.001 reject H 0: At least one response proportion differs Enhancing RGR Total Count Proportion Critical Χ 2 = Essential p-value <<.001 reject H 0: At least one response proportion differs Enhancing Aviation Total Count Proportion Critical Χ 2 = Essential p-value <<.001 reject H 0: At least one response proportion differs Enhancing MISO Total Count Proportion Critical Χ 2 = Essential p-value <<.001 reject H 0: At least one response proportion differs Enhancing CA Total Count Proportion Critical Χ 2 = Essential p-value <<.001 reject H 0: At least one response proportion differs Enhancing Sustainment Total Count Proportion Critical Χ 2 = Essential p-value <<.001 reject H 0: At least one response proportion differs Enhancing Figure 2- Goodness of Fit Testing for Command Responses against total Response Distribution. 15
25 These results led me to conclude that the different commands responded to the surveys about the importance of capabilities with a different distribution of responses. Next we wanted to determine whether a stronger conclusion could be drawn that would indicate that the commands responded to the surveys using different metrics. Simple statistics about the responses (given in Appendix C) indicate that some commands were much more likely to respond with a value of Critical than other commands were. The means and standard deviations of the responses could normally be used to conduct confidence interval analysis to determine whether the confidence intervals for expected response values from different commands would overlap. For example, for Special Forces Command, the simple statistics of responses are given below in Table 2. Table 2- Simple Statistics of responses for Special Forces Command. Mean 13.3 Variance Std Dev 3.41 This assumes, however, that the values for Critical, Essential, and Enhancing responses are (15, 9, 5) respectively. If the response values change to (3, 2, 1), the new simple statistics become the values shown below in Table 3. 16
26 Table 3- Rescaled Simple Statistics of responses for Special Forces Command. Mean 2.68 Variance 0.43 Std Dev 0.66 This dependence on the assigned values of responses led me to conclude that the responses should be evaluated using categorical, or qualitative testing. We conducted a Chi- Squared Test for Independence with the independent variable as Command and the dependent variable Response. Using the raw response data provided in Appendix C, we constructed a table showing the distribution of responses over the different commands, given below in Table 4. Table 4- Distribution of responses over commands. SF SWCS RGR AVN MISO CA SUST All Units Critical Essential Enhancing All Levels If it were true that the two variables were independent, we would expect the product of a cell s row total and column total to equal the cell s content, for each cell. For example, for 17
27 the first cell [SF, Critical] representing the proportion of all responses that were both Critical and performed by Special Forces Command, the content is The Expected value if independence were true is * = These two values are clearly not equivalent, nor are the results for the rest of the table s cells. This provides our first indication that the variables are not independent. Next we performed the actual Chi-Squared test for independence between the two variables. The null hypothesis is that the Command and Response variables are independent. The Chi-Squared value is given by: Χ 2 = ij (n ij - Ê ij ) 2 /Ê ij where n ij is the value in row i and column j of the data table of actual responses and Ê ij is the value in row i and column j of the table of expected responses. The large number of responses means that the Chi-Squared test is a valid approach, even though it is usually preferred for comparing multiple variables to an independent variable. First, we constructed the table of actual responses from the data given in Appendix C, shown below in Table 5: Table 5- Responses by Command. SF SWCS RGR AVN MISO CA SUST All Units Critical Essential Enhancing All Levels
28 Next we constructed the table of expected responses, where the value for each cell = (total number of responses at the response level/ total of all responses) * (total number of responses for the command). The resulting table is shown in Table 6 below: Table 6- Expected Responses by command. SF SWCS RGR AVN MISO CA SUST All Units Critical Essential Enhancing All Levels The Chi-Squared statistic can then be calculated. We did this by making a table of the (n ij - Ê ij ) 2 / Ê ij values, which were then easy to sum. This table is given in Figure 6 below: Table 7- (n ij - Ê ij ) 2 / Ê ij values. SF SWCS RGR AVN MISO CA SUST Critical Essential Enhancing The sum of these values is the Chi-Squared statistic, in this case
29 This is tested against the critical Chi-Squared value at α=.05 with degrees of freedom (rows- 1) * columns-1) = 12. The critical value in this case is It is clear that the test value is far greater than the critical value, so we strongly reject the null hypothesis of independence. We conclude that there is a dependency relationship between the USASOC command and the response level. This is an important conclusion, and confirms that different USASOC commands responded to the survey about Joint Capability Areas using a different scale. Some commands were much more likely than others to respond that any given capability was Critical, and had a much higher proportion of Critical responses. This causes a few problems for the system. First, if some commands respond with a higher baseline response, all the Elements of Cost that support the capabilities used by these commands will have an advantage because they will be evaluated as Critical more often. So commands that responded with primarily Critical values will be relatively better supported by the results of the Requirements and Capabilities Analysis System. For the system to work as intended, commands should not be able to gain an advantage for all of their Elements of Cost by responding that almost everything is Critical. For USASOC s Elements of Cost to be evaluated fairly, USASOC commands must respond on an even scale. The second issue that arises from some commands responding that too many capabilities are Critical is that within these commands, there is no differentiation between capabilities. Within these commands, the importance assigned by the units is essentially meaningless, since almost all of them are identical. By assigning almost all capabilities the same value, Critical, these units sacrifice their ability to prioritize their capabilities. The only 20
30 differences between the capabilities will be determined by the missions where they are used (i.e. the Frequency, Duration, Quantity, and number of missions). This issue will be further explored later, using a matrix derived from the responses of the commands. The prevalence of Critical responses leads to an ill-conditioned or singular matrix, and we will talk about the issues with the system that this indicates. 21
31 IV. METHODS: CONDITION NUMBER ANALYSIS During this study, we conducted a simple sensitivity analysis of the Requirements and Capabilities Analysis System by recreating the logic behind the system s report generator in EXCEL. Because of the massive size of the database, we limited the Replicator to only two core operations, three echelons of Special Forces, and five Joint Capability Areas. The actual database contains data for sixteen Core Operations and Core Activities, and seven types of units with two to seven echelons for each unit type. Using the smaller set for simulation, we determined the change in the prioritized list of Elements of Cost that resulted from changing the values of the weights assigned to the Critical, Essential, and Enhancing characterizations for Joint Capability Areas, Tasks, and Elements of Cost. Currently, USASOC has the weights at each level the same: Critical is always 15, Essential is 9, and Enhancing is 5. We changed each of these values for the Joint Capability Areas by 20% for each level, and evaluated the resulting changes using the Weight Generator tab of the Logic Replicator (Appendix B). The results are detailed in Appendix D, and show that 20% changes in the Joint Capability Area values result in changes in up to 29% in the percentage of total score for individual Joint Capability Areas. Changing the relationship between Critical and Enhancing had the largest effect, and it was on items that tend to be rated Enhancing. These tend to be less frequently used, so their weights have greater impact on their relative importance. There are fewer Essential programs, and they are used by other echelons at other levels, so the impact of changing only the Essential weight is lower. See Appendix D for the details of the sensitivity analysis. 22
32 We then transformed the inputs to the Requirements and Capabilities Analysis System into a matrix to further evaluate the stability of the data as currently structured. We used some of the concepts from [7] when creating the matrix from the data. The Elements of Cost label the vertical axis, and the horizontal axis is the series of weights by Joint Capability Area, Task, and Element of Cost (sometimes called programs) for each echelon, for each core mission. One effect of compressing the data into this format was that values in each column for each Element of Cost are sums of every input into the database that is applicable to that cell. In the database, for example, there are many instances of the MBITR Element of Cost supporting the SF Battalion unit-echelon performing the core mission Foreign Internal Defense. In the matrix format, these entries are compressed into three cells- the simple sums of all the applicable entries for Joint Capability Areas, Tasks, and Elements of Cost. This is because there are multiple Tasks that require the MBITR Element of Cost that support the core mission and unit-echelon. Each of these tasks may have a different response level, so the cell in the matrix pertaining to the Task response for the MBITR for an SF Battalion conducting Foreign Internal Defense is the sum of the responses for the tasks supported by the MBITR. Similarly, the multiple instances of the Element of Cost in the Requirements and Capabilities Analysis system under different Tasks mean that there are multiple entries for each Element of Cost for a given unit-echelon and core mission. The entry in the matrix is the simple sum of those applicable responses. The Joint Capability Area entries are also simple sums of the multiple entries applicable for each Element of Cost for a given unitechelon and core mission. We decided to use sums instead of the averages of responses for each cell entry in the matrix to incorporate the frequency of each Element of Cost appearing 23

33 in the database. If we had used averages, every entry in the matrix would be between the minimum and maximum weight value, and the conditioning of the matrix would not reflect the diversity of the true data very well. Including the database frequency of response by making the matrix entries sums allowed the different frequencies with which Elements of Cost appear affect the conditioning of the matrix, as they affect the prioritized list of Elements of Cost generated by the Requirements and Capabilities Analysis system. See Figure 7 below for the A matrix derived from the responses. The Logic Replicator in Appendix B shows how the fields are fully realized in the database, and Figure 3 shows the compression of the matrix form. Figure 3- The A matrix. Elements of Cost are the vertical axis, Core Missions/ Echelons/ Response Types are the horizontal axis. Call this matrix A, and the results of the report for each of the Elements of Cost on the vertical axis will be vector b, as represented in Figure 4 below. A is then the matrix of inputs to the system, and vector b is the result of the system s calculations. The operations on A that result in b are a function of the missions which use each Element of Cost. The Requirements and Capabilities Analysis System generates a report with the prioritized importance for each 24
, duration (in days), quantity (number of units in the echelon conducting the mission), and a country weight that")
34 Element of Cost (i.e. the b vector) using the A matrix and all missions which use the Elements of Cost. Each mission has a frequency (number of times a mission is conducted during the cycle), duration (in days), quantity (number of units in the echelon conducting the mission), and a country weight that allows the commander to prioritize which countries have greater import. The operations on A that yield the results b in our matrix construct are a function of these mission factors. They relate the doctrinal information in A to the computation of scores that reflect mission use as well. Figure 4- the b vector of prioritized Elements of Cost. 25
35 The advantage of transforming the database into matrix form is that we can then examine the matrix using its condition number to draw conclusions about the database system. The condition number C of a matrix is the ratio of the matrix s largest to smallest singular value, and is a measure of the matrix s sensitivity [4,5]. With the form Ax=b: if A has a high condition number, small changes in b may necessitate large changes in A. Similarly, small changes in A may result in large changes in b. For the Requirements and Capabilities Analysis system, this means that small changes in inputs of weights given to Joint Capability Areas, Tasks, or Elements of Cost may result in large differences in the results of the report. This could be very significant for the Requirements and Capabilities Analysis system because the values that constitute the A matrix are subjective. The Critical, Essential, or Enhancing characterizations for Joint Capability Areas, Tasks, and Elements of Cost are determined through surveys at the unit level and through expert estimation at USASOC. It is important for the validity of the results that the final report s values do not fluctuate greatly with small differences in these responses. Another interpretation of the condition number is also important. In general, the condition number of a matrix gives an upper bound on how much precision may be lost when solving a system of equations using the matrix. The expression log 10 (C) is a bound on the number of digits of precision that may be lost. For example, the condition number associated with the equation Ax = b gives a bound on how inaccurate the solution x will be after approximation [4,5]. The condition number is (roughly) the rate at which the solution, x, will change with respect to a change in b. Thus, if the condition number is large, even a small error in the inputs may cause a large error in the solution. On the other hand, if the condition 26
36 number is small then the error in the solution will not be much bigger than the error in the inputs. A * A -1 is a commonly accepted means of computing the condition number of a square matrix [6], and is the method we adopted for this study. We applied this method to the A matrix we derived from the Requirements and Capabilities Analysis system data, multiplying the norm of A times the norm of A -1 to find the condition number. We wanted to test the condition number of the matrix representing the inputs to the Requirements and Capabilities Analysis System in order to address Issue 1) with the system. Many of the USASOC units surveyed for the importance of Joint Capability Areas responded that almost all capabilities are Critical. This can be seen in Appendix E, Joint Capability Area Survey Responses. This uniformity of inputs leads to an ill-conditioned matrix with a very high condition number, as will be seen below. In practical terms, it presents problems for the Requirements and Capabilities Analysis System because the weights for the Joint Capability Areas are essentially meaningless, and there is no differentiation between the capabilities. The priorities are then determined solely by frequency of use and mission characteristics (quantity, duration, frequency, country importance). Since the intent of the surveys is to enable units to have input into which capabilities (and Elements of Cost, and Tasks) are most important, this uniformity of response defeats the intent. In addition, when multiple subordinate commands are included in the analysis, such as when USASOC is calculating its overall budget, the over-abundance of Critical responses skews the results. If one command responds that all Joint Capability Areas, Tasks, and Elements of Cost are Critical, the Elements of Cost that support that command s missions will end up with 27
37 relatively higher priorities than they should compared to units whose responses show a more central tendency. Therefore, a method of forcing responses to the same scale is required to maintain the validity of the Requirements and Capabilities Analysis System s results. 28
38 V. METHODS: SCALING OF WEIGHTS Issue 2) is equally important to the validity of the Requirements and Capabilities Analysis System s results. The valuations of 15, 9, and 5 respectively for the levels of Critical, Essential, and Enhancing were arbitrary and without basis in analysis [1]. The first step in assigning quantitative values to qualitative responses is to identify the metric on which we are measuring the responses [8]. In this case, we look at the definitions of the levels used in the surveys: Critical: Mission failure or operational show stopper if this element is lacking. Essential: New or improved capability or increased probability of success with this element. Enhancing: This element will enhance operational effectiveness, improve quality of life, improve efficiency; not critical or essential for mission accomplishment. These were the definitions given for the levels for the Joint Capability Areas, Tasks, and Elements of Cost, but they are most suitable for the Elements of Cost. It is not very meaningful to say that a capability (as defined by the Joint Capability Areas) will grant a unit a new or improved capability or increased probability of success in conducting a core operation such as Foreign Internal Defense. The capabilities either may be required for the core mission, or they are not. For the Joint Capability Areas, the definitions should be modified to be more relevant. If we wish to keep the current system of impact levels, however, we propose the following definitions: 29
39 Critical: Used by over 90% of units at this echelon conducting this core mission. Essential: Used by over 40% of units at this echelon conducting this core mission. Enhancing: Used by over 5% of units at this echelon conducting this core mission. With this metric, there is a clear definition of the levels that is uniformly applicable (and verifiable) across all component units of USASOC. The resulting weights should then be: Critical: 9 Essential: 4 Enhancing: 0.5 With this method, the levels are no longer a subjective judgment that units could game to try to garner the most resources for the Elements of Cost that their units want. The metric is also expandable to a continuous spectrum- if desired, units need not be constrained to three levels. The levels could simply be (percent of units utilizing the Capability) / 10. As the levels are individually read by the Requirements and Capabilities Analysis System currently, this would not add processing time or otherwise compromise the current method of prioritizing the Elements of Cost. If USASOC desires to keep the three levels for the sake of simplicity, we recommend these percentages (90%, 40%, and 5% respectively) because they preserve the intent of the original wording. Originally, Critical meant that the Capability had to be present for mission 30
40 success. Essential meant that success did not depend on the Capability, but that it provided increased probability of success or additional options. Enhancing meant that the Capability provided enhanced efficiency or quality of life, but would not effect mission success. With these definitions, Essential was closer to Enhancing than to Critical. With our new scaling, Essential is 35 percentage points from Enhancing and 50 percentage points from Critical. It makes sense that if a Capability is necessary for mission success, it should be required for nearly all missions of that type. Similarly, a Capability should only be Enhancing if it is very rarely utilized. It is important to note that the scale of the impacts is only important in a relative sense. Since every instance of each Element of Cost is multiplied by a Joint Capability Area multiplier (see the Logic Replicator in Appendix B), the values of the multipliers relative to each other are the only factor that matters. We can scale all of the values to a 0-1 scale (or any other scale) without changing the prioritized Element of Cost list that the Requirements and Capabilities Analysis System produces. We drew on the concepts in [8] to devise this scale, and experimented in the Logic Replicator to verify that changing the weights by a common factor did not alter the results. On a 0-1 scale, the values become: Original Weights: [15, 9, 5] [1.0,.600,.333] New Weights: [9, 4, 0.5] [1.0,.444,.056] This shows more clearly the difference in how the levels would apply to the Elements of Cost for the Requirements and Capabilities Analysis system s final report. Under the old scale, 31
41 Essential is 40 percentage points from Critical and 26.7 percentage points from Enhancing (when converted to a percentage point scale). Under our new scale, Essential is 55.6 percentage points from Critical and 38.8 percentage points from Enhancing (when converted to a percentage point scale). So changing to the new weights expands the difference between Critical and Essential by 15.6 / 40 = 39.0%, and expands the difference between Essential and Enhancing by 12.1 / 26.7 = 45.3%. It can be seen on the 0-1 scale that both the Essential and Enhancing values are shifted right, so the Critical level shifts farther from both. The largest absolute difference between how the two scales are evaluated is in the difference between Enhancing and Critical: 66.7 percentage points under the old scale vs percentage points under our new scale, for a difference of 27.8 percentage points between the two weighting systems. The new scale expands the difference between Enhancing and Critical by 27.8 / 66.7 = 41.7%. These changes to the weights for Joint Capability Areas make sense in that they reflect how USASOC defined the Critical, Essential, and Enhancing levels. The relative differences in percentage points between the levels reflect what the verbiage defining the levels suggests should be reasonable differences between the levels, when we use the new weights. However, using the new system of determining weights (by assessing the percentage of missions requiring the capability for each command and echelon) will also change what level is assigned for some of the Joint Capability Areas. This will address the issues with the system arising from issue 1): the uniformity of responses of some USASOC units. Since the new scale is based on past mission data, not on subjective responses, the 32
42 distribution of the responses will change. We will discuss the implications of this further in the Discussion of Results section. 33
43 VI. RESULTS In this section, we will present the results of our condition number analysis of the system, the results of forcing a better distribution on the responses for Joint Capability Areas, and the results of changing the impact level weights to the values we recommend. Let s start with a simple change to the impact level weights we propose, [9, 4, 0.5]. Using the original response data as it currently stands, we changed the impact levels to the following: Critical was 15; becomes 9 Essential was 9; becomes 4 Enhancing was 5; becomes 0.5 The rationale for these changes was explained in detail above in the Methods: Scaling of Weights section. As elaborated upon there, the new scale better conforms to the definitions of the impact levels that USASOC uses, and will be better suited to tying the responses to objective values derived from past mission data. When we performed an analysis of the effects of switching to the new weights in the Logic Replicator, we found a significant stretching effect. The Elements of Cost that tend to be rated as Enhancing are significantly lowered from the original scale, while those that tend to be rated as Critical are higher. This reflects the greater relative distance between the weights, as demonstrated in the Methods: Scaling of Weights section. Recall that when we compared the two weight schemes after scaling each to a [0-1] scale, the new scheme showed much greater distances between the 34
44 levels. The Logic Replicator results confirmed this anticipated affect. The complete sensitivity results are detailed in Appendix D. We then need to address Issue 1) with the system, the skewed and inconsistent distribution of the data. Before applying the improved scale, we must evaluate the results of the condition number analysis testing the distribution of the response data. The A matrix that results from our method of transforming the original database information is so near singular that it is non-invertible. Figure 5 below shows the A matrix. Also included in Figure 5, we calculated the inverse of a truncated version of A, meaning we did not include some of the rows and columns of the original matrix. We calculated this truncated inverse in order to find a lower bound for the condition number of A. Since A was non-invertible in its full form, we were not able to calculate the actual condition number because the norm of A s inverse does not exist. Therefore, we truncated it the matrix to the minimum extent possible that would enable it to be invertible so that we could find the norm of the (truncated) inverted matrix. Then the norm of the truncated version, A -1, must be >= the norm of the full A -1. So a lower bound for the condition number of A is given by A * A -1. This lower bound is calculated to be: C(A) = A * A -1 = * (2.05*10^15) = 3.78 * 10^18 35


45 Figure 5- The A matrix and inverse of its truncated version The huge lower bound on the condition number (3.78 * 10^18) indicates that the actual condition number C(A) is also huge. This indicates that the vector b, which represents the values in the Requirements and Capabilities Analysis System report, could vary greatly with small changes in A. Log(C), the number of digits of precision that may be lost when solving a system of equations using this matrix, was found to be for the lower bound. This is a very large number of digits, so the imprecision of solving a system of equations using the A matrix would be tremendous. In our case, however, we are not using the matrix to solve a system of equations. Rather, the matrix represents the coefficients used to generate a vector with a score for each Element of Cost. These scores are products along each row of the matrix, transformed by the x vector representing mission characteristics, so the imprecision is 36
46 not propagated the way it would be when solving a system of equations. Rather, the imprecision is more directly transferred to the solution b. Since we are not using the matrix to solve a system of equations, the log(c) measurement of precision is therefore not directly applicable, though the well-established principle of increasing imprecision with rising condition number does hold. We will further explore the exact nature of the correlation later in this paper. To address the issue of the system s poorly distributed impact ratings, we needed to alter it so that not as many Joint Capability Areas were rated as Critical. This change would be equivalent to enforcing a policy on USASOC units requiring them to limit the number of Critical responses they could allocate. After changing the response data for Joint Capabilities Areas so that it is more centrally distributed, we can then test the sensitivity to changes by altering each weight level value by 20%, as we did earlier. We made the data better distributed by altering the impact levels for individual Joint Capability Areas for unitechelons so that no more than 40% of the responses were overall were at any one level. Visual inspection of the Requirements and Capabilities Analysis System database indicates that A is nearly singular because of the preponderance of the value 15, corresponding to Critical characterizations of Joint Capability Areas. When USASOC surveyed its units to determine how important each capability was, the units responded that most (in some cases all) capabilities were Critical. To fix this, we supposed that USASOC had a policy in place limiting the number of Critical capabilities, Tasks, and Elements of Cost for each unit. Each unit could rate no more than 40% of each item as Critical. This meant changing values from Critical to either Enhancing or Essential, as the USASOC 37


47 commands that created the data would be required to do to meet a forced distribution. We modeled the new A matrix and its inverse, and computed the new condition number C. See Figure 6 below. Figure 6- The modified A matrix with its inverse and condition number. The condition number of the modified system is only 46,717, dramatically reduced from the original. Log(C ), an estimate of the digits of precision that may be lost using this 38
48 matrix, was calculated to be This is a dramatic decrease from log(c) = 18.58, and shows an extremely reduced error. We then compared the resulting changes between the original and better distributed data. The better distributed data is represented in the Weight Generator New tab of Appendix D. The results are shown below in Figure 7. All the sensitivity analysis results from the Logic Replicator are consolidated in Appendix D. 39


49 Figure 7- Sensitivity Comparison of Original and Revised Data 40
50 For most Elements of Cost, the altered weights result in smaller changes in the prioritized list using the data with a forced distribution. On the average, the changes were calculated to be decreased by 20% when using the improved data scheme. Distributing the data better results in better stability, and less dependence on the subjective user input. This corroborates the result we expected from the condition number analysis. Forcing a better distribution on the data led to a lower condition number, and we expect it to make the results of the Requirements and Capabilities system less sensitive to errors in the inputs. This result was corroborated by the Logic Replicator sensitivity analysis using the two data schemes. When we compared the changes in the final prioritized list of Elements of Cost resulting from altering the weights by 20%, one at a time, as shown in Figure 10 above, the data with the improved distribution yielded results that changed 20% less than the original data s results. This calculation can be seen in the Sensitivity tab of Appendix D. This result confirms what we expected from the Condition Number analysis: improving the distribution of the data, thereby improving the stability of the matrix and lowering its condition number, makes the resulting b vector less sensitive to variation (and therefore errors) in the A matrix of inputs. The result also confirms that this improvement in the matrix s stability is not on the magnitude predicted when using the matrix to solve a system of equations. Log(C(A)) is an estimate of the number of digits of precision lost to error when solving a system of equations using A. In this case, we want to know the difference between the logarithmic function for the original data matrix and the improved data matrix. We have a lower bound for the original matrix s condition number, using the norms determined earlier. Call this C 0. We can compare this to the condition number of the matrix resulting from the improved data, C. 41
51 C 0 and C are both calculated in the Condition Number Analysis tab of Appendix D. As seen there, C 0 = 3.78*10^18, and C = Then the improvement in stability is: log(c 0) log (C) = log(3.78 * 10^18) log(11502) = = Clearly a 20% decrease in changes resulting from altering the response weights does not correspond to an estimated 14 or 15 digits of precision improvement, so the improvement to the matrix s stability when used for our purposes is not on the order of log(c), as it would be for solving a system of equations. The rate of increase in imprecision caused by an ill-conditioned matrix is not as high as it would be when solving a system of equations, but the correlation remains true. We tested this by creating an experiment in the Logic Replicator which can be found in Appendix D, in the Weight Generator Experiment and Condition Number Experiment tabs. To conduct the experiment, we randomized the impact level for each Joint Capability Area in the Weight Generator Experiment Tab. In the Condition Number Experiment Tab, we then created the A matrix for the resulting database, and recorded the condition number. We then determined the average percent change in score for each Element of Cost when each impact score is individually altered by 20% from the original baseline. We ran this experiment on data schemes with relatively low and high condition numbers (we copied the random 42
52 responses in a pattern to create the high-condition number data schemes), and found a significant difference between the two groups. The low condition numbers ranged from 753 to 769,018, and the high condition numbers ranged from 1.87 * 10^17 to 1.55 * 10^19. Figure 8 below shows a graph of the results. Percent Change in Results as a Function of C 10 Avg Percent Change E E E E E E E E+19 C(A) Figure 8- Average % Change in Results and a Function of Condition Number Although within each of the two groups, no correlation is discernible between rising condition number and level of sensitivity of the data, there is a significant difference between the two groups. The expected value of the average change in results for the low condition number data is 5.99, whereas the expected value of the average change in results for the high condition number data is This provides evidence that the increased stability resulting 43
53 from improving the Requirements and Capabilities Analysis system data is not an anomaly. In fact, we included the actual data in the experiment. In the graph above, the original system data point appears in blue, and the improved system data point appears in green. We performed a confidence interval test to verify that, as it appears, there is a statistical difference between the two groups. The expected values and standard deviations for the low and high condition number groups are listed below in Table 8. Table 8- Table of Expected % Changes in Response and Standard Deviations. E(% change) Standard Deviation Low C High C A simple confidence interval test is illustrative of the difference between the two groups. An approximate 95% confidence interval for each group is: E(% change) +- 2*σ The two 95% confidence intervals are then: Low C: *0.578 = [4.83, 7.14] High C: *0.552 = [7.20, 9.40] 44
54 Since the confidence intervals do not overlap, we conclude that at the α 0.05 level, we reject the null hypothesis that there is independence between condition number group and % change in results. We conclude that there is a correlation between the higher condition number group and a higher expected % change in results. In addition to the instability and increased sensitivity to errors indicated above, we are also concerned that the matrix is ill-conditioned because of the practical considerations we mentioned earlier. If there are too many identical Critical responses, there is no differentiation between Elements of Cost due to the unit input, which defeats the intent of the weights. In addition, if some commands have almost all their responses as Critical, the Elements of Cost that support those commands capabilities will be rated preferentially over those that support capabilities of commands with a more central distribution of responses. To maintain a level playing field in the competition for USASOC resources, it is important that all commands evaluate their Joint Capability Areas, Tasks, and Elements of Cost using the same criteria. 45
55 VII. DISCUSSION OF RESULTS The Condition Number for the A matrix we derived from the Requirements and Capabilities Analysis system indicates that the system as it currently stands is sensitive to relatively small changes in the inputs. This means that the system is sensitive to the values chosen for the Critical, Essential, and Enhancing weight levels, and also that it is more sensitive than it should be to which level is chosen for each individual entry. As the values chosen for the levels are currently arbitrary value judgments, this sensitivity is not desired. In the case of this system, the A matrix we derived represents the inputs into the database for the Requirements and Capabilities Analysis system. Because the matrix is not used directly to solve any system of equations, the normal approximation of log(c) representing the number of digits of precision lost greatly overestimates the loss of precision. However, the sensitivity experiment we conducted confirmed that there is a statistically significant difference between the original scheme, which has a very high condition number, and the improved scheme with a lower condition number. In addition to undesirable sensitivity to inputs, symptomized by a high condition number, the preponderance of the Critical ranking leads to other issues with the Requirements and Capabilities Analysis system. The system can be used at many levels, including for allocating resources within individuals commands subordinate to USASOC. For those commands that responded that almost all Joint Capability Areas were Critical, their inputs will have almost no impact on the results. When all capabilities are rated the same, the ratings do not matter. This defeats the purpose of surveying the units for input on the importance of capabilities. 46
56 In addition, since another use of the Requirements and Capabilities Analysis system is for USASOC to internally allocate its budget, USASOC needs to require that all subordinate commands respond to the surveys using the same criteria. The commands that rate most of the Joint Capability Areas as Critical are essentially responding on a different scale from the commands who rated more of their capabilities as Essential, the middle rating. Commands may be intentionally gaming the system to benefit the capabilities and Elements of Cost pertaining to them, or they may simply be evaluating the capabilities on a different scale or in a different manner. Regardless, for the results of the Requirements and Capabilities Analysis system to be useful and accurate, this difference must be addressed. The distributions of responses for each command must be more similar, indicating that they are assessing the capabilities on the same scale. At the least, the number of Critical ratings each command can use must be limited. If a unit wants to rate more capabilities than average as Enhancing, they will disadvantage themselves in the system, which may be allowable. The other issue with the system that needs to be addressed is the arbitrary weights assigned to the impact levels. The weights of [15, 9, 5] assigned to the Critical, Essential, and Enhancing impact levels were not made based on analysis. When we assessed the definitions of the impact levels, as given to me by USASOC, and as used for the surveys of the USASOC commands, we determined that the values should be adjusted. First, the definitions had to be adjusted so that they pertained better to the Joint Capability Areas, since they appeared to be intended for Elements of Cost but were used for all elements being evaluated. We propose using the following definitions for the impact levels: 47
57 Critical: Used by over 90% of units at this echelon conducting this core mission. Essential: Used by over 40% of units at this echelon conducting this core mission. Enhancing: Used by over 5% of units at this echelon conducting this core mission. The resulting weights should then be: Critical: 9 Essential: 4 Enhancing: 0.5 This metric is better applicable to all the items being evaluated (Joint Capability Areas, Tasks, and Elements of Cost). In addition, this metric provides a clear definition of the levels that is uniformly applicable and verifiable across all component units of USASOC. USASOC has informed me that the Joint Capability Areas used by each unit for each mission are available, although the information is classified. So the data is not available for this study, but would be available for USASOC to use to implement the metric. Another advantage of this method of determining the impact weights is that it could be used to assign weights on a continuous spectrum. If USASOC wished to record the utilization of Joint Capability Areas on each mission, it could automatically calculate weights for each capability. To be quasi-continuous, the weights could simply be (percent of missions on which unit-echelon utilizes capability) / 10. Using more weight levels would not 48
58 increase computing time for the system time or otherwise compromise the current method of prioritizing the Elements of Cost or Joint Capability Areas. In order to avoid adding extra work, USASOC may wish to keep the three levels as Critical, Essential, and Enhancing. If this is the case, the percentages we recommend (90%, 40%, and 5% respectively) preserve the intent of the original wording. Originally, Critical meant that the Joint Capability Area had to be present for mission success. Essential meant that success did not depend on the capability, but that it provided increased probability of success or additional options. Enhancing meant that the capability provided enhanced efficiency or quality of life, but would not effect mission success. With these definitions, Essential was closer to Enhancing than to Critical. With our new scaling, Essential is 35 percentage points from Enhancing and 50 percentage points from Critical. It makes sense that if a Capability is necessary for mission success, it should be required for nearly all missions of that type. Similarly, a Capability should only be Enhancing if it is very rarely utilized. As discussed earlier, the scale of the impacts is only important in a relative sense. We can scale all of the values to a 0-1 scale without changing the prioritized Element of Cost list that the Requirements and Capabilities Analysis System produces. On a 0-1 scale, the values become: Original Weights: [15, 9, 5] [1.0, ] New Weights: [9, 4, 0.5] [1.0,.444,.056] 49
59 This shows more clearly the difference in how the levels would apply to the Elements of Cost for the Requirements and Capabilities Analysis system s final report. Under the old scale, Essential is 40 percentage points from Critical and 26.7 percentage points from Enhancing (when converted to a percentage point scale). Under our new scale, Essential is 55.6 percentage points from Critical and 38.8 percentage points from Enhancing (when converted to a percentage point scale). So changing to the new weights expands the difference between Critical and Essential by 15.6 / 40 = 39%, and expands the difference between Essential and Enhancing by 12.1 / 26.7 = 45.3%. It can be seen on the 0-1 scale that both the Essential and Enhancing values are shifted right, so the Critical level shifts farther from both. The largest absolute difference between how the two scales are evaluated is in the difference between Enhancing and Critical: 66.7 percentage points under the old scale vs percentage points under our new scale, for a difference of 27.8 percentage points between the two weighting systems. The new scale expands the difference between Enhancing and Critical by 27.8 / 66.7 = 41.7%. These changes to the weights for Joint Capability Areas make sense in that they reflect how USASOC defined the Critical, Essential, and Enhancing levels. The relative differences in percentage points between the levels reflect what the verbiage defining the levels suggests should be reasonable differences between the levels, when we use the new weights. However, using the new system of determining weights (by assessing the percentage of missions requiring the capability) will also change what level is assigned for some of the Joint Capability Areas. This will address the issues with the system arising from issue 1), the 50
60 uniformity of responses of some USASOC units. Since the new scale is based on past mission data, not on subjective responses, the distribution of the responses will change. The responses should show a better central tendency when tied to the mission data. Data for how often each Joint Capability Area has been used on past missions is available to USASOC, but is not releasable for this investigation due to classification issues. However, if the responses are still skewed toward the Critical response when tied to mission data, the problem will at least be mitigated. All commands will be responding according to the same guidelines and scale, so no command will garner an advantage by over-estimating the impact of capabilities, Tasks, or Elements of Cost. In addition, the scale which we suggest (90% = Critical, 40% = Essential, 5% = Enhancing) could be modified to produce a more centralized response distribution once the trends in the mission data for capability utilization are clear. If USASOC implements the changes we will recommend based on the above results, they will make the system more stable, and less sensitive to the least reliable factors in the system: the user-subjective weights. This decreased sensitivity in the system can be measured using condition number analysis of the A matrix we derived from the system. Changing and Requirements and Capabilities Analysis system so that the A matrix we derived would be more stable, with a lower condition number, would benefit the system by making it less sensitive to these least reliable inputs. We have already identified that there are problems with the way units responded to the surveys for weights. They responded using different scales, so that some rated almost all capabilities for all core missions as Critical, while others responded with most capabilities being Essential, and a more central distribution. This means that the units whose responses were predominantly Critical will 51
61 effectively receive a larger share of the budget for the Elements of Cost that support their capabilities than they would have if the units had responded using the same criteria and scale. The opposite is true for the units whose responses were more centrally distributed: they will receive fewer resources for the Elements of Cost that support their capabilities. In addition, the prevalence of Critical responses means that the Requirements and Capabilities Analysis system cannot use the Joint Capability Area weights to differentiate between many of the Elements of Cost because they all have the same weight. The preferences of the end users who responded to the surveys then are not captured because so many of the Joint Capability Areas are Critical. These problems reinforce the importance of improving the system by ensuring a better, and more universal, distribution of responses. Changing the values for the weights used so that they better reflect the intent of USASOC will also enhance the validity and utility of the results of the system. 52
62 VIII. CONCLUSIONS & RECOMMENDATIONS The results of our analysis indicate that there are two issues with the Requirements and Capabilities Analysis system that should be resolved. First, the impact weights assigned to each impact level are arbitrary, and do not match the meaning of the levels as defined by USASOC as well as they could. Second, the distribution of impact levels varies greatly between subordinate USASOC commands, with some units responding according to a very right-skewed distribution. These commands responded that almost all Joint Capability Areas for every unit-echelon was Critical. When the capabilities and Elements of Cost used by these units are evaluated by the Requirements and Capabilities Analysis system alongside those of commands who responded with a more central distribution, the right-skewed units capabilities and Elements of Cost will be rated higher than they should be. The units need to assess their capabilities and Elements of Cost using the same criteria, and be evaluated on the same scale. In addition, when these units responses are assessed alone, the impact levels will not contribute to their ranking because the levels are almost all identical. It is important to note that the condition number analysis performed on the Logic Replicator cannot be performed directly on the Requirements and Capabilities Analysis system. We constructed the Logic Replicator with the requisite number of Elements of Cost to yield a square matrix when the A matrix was built. This allowed us to find the norm and condition number of A. The Requirements and Capabilities Analysis system s data is not square, so this cannot be done directly for the system. However, this study explored the relationship between the poorly distributed responses as system inputs and sensitivity of the system s results, and this sensitivity could be tested directly. USASOC could test the 53
63 sensitivity of the prioritized list of Elements of Cost created by the system in the same manner done here, by making small changes to the weights and measuring the resulting changes in the output. We have a primary recommendation that would rectify both of the issues with the system. It would correct the arbitrary nature of the impact weights assigned to each level, and ensure a better distribution of impact levels while guaranteeing that all units assess their Joint Capability Areas using the same criteria. The impact levels for all commands would therefore be determined according to the same scale, removing the bias that is currently possible in the system. This recommendation requires a more systemic change and more work for USASOC to implement than some other options would, however, so we will include other alternatives as well below. The recommendations below are alternatives, given in the order by which we would recommend them. The first solution is the most elegant, but would require more work than the others. Recommendation 1): In order to rectify the issues with the current system, our primary recommendation is to adopt a new system of determining the weights for the Joint Capability Areas for each USASOC unit-echelon and core mission type. The weight for each would be: (percentage of missions for this unit-echelon requiring the capability)/ 10 54
64 So if 90% of Special Forces Battalion missions required the capability Maneuver to Engage, the weight would be 9. This solution would distribute the responses much better, allowing the Requirements and Capabilities Analysis system to use Joint Capability Area weights to differentiate between capabilities and Elements of Cost better. We cannot state exactly to what degree the implementation of this solution would improve the distribution of responses because the data for how frequently each Joint Capability Area is utilized on missions, while available to USASOC, is not available for the purposes of this study due to classification issues. However, the number of Joint Capability Area responses would increase dramatically from 3 to a number determined by rounding. If the weights are rounded to the nearest 10%, then the possible weights would be the integers 1 through 10. As we remarked when transitioning the weights to a 0-1 scale, there is no reason the weights must be integers, so there could be any number of possible responses, determined by the rounding of the capability percentages of utilization on missions. This great increase in the number of different values included in the database would lead to a much more stable system and an A matrix that would have a much lower condition number. For example, we tested changing the original data for the Joint Capability Area responses so that each Enhancing response was randomly valued either 1, 2, or 3; each Essential response was randomly valued 4, 5, or 6; and each Critical response was randomly valued 7, 8, or 9. From the singular A matrix that resulted from the original data, this changed the A matrix to be stable, with a condition number between approximately 1000 and 10000, depending on the random inputs. We achieved this change without changing any of the Critical, Essential, or Enhancing responses, just better distributing the values assigned to each of the response levels. This calculation 55
65 can be viewed in Appendix D, in the Condition Number Experimental2 Tab. Something similar to this would result from making the weights a continuous-style scale, where each weight is based on the utilization of the Joint Capability Area for each unit-echelon. Implementing this solution would also ensure that all responses from all units are on precisely the same scale, evaluated to the same criteria. This would eliminate the issue of bias toward capabilities of units whose responses were overwhelmingly Critical. It would also ensure that all units weight levels effect the outcome of the system s analysis, since it would eliminate the ability of units to rank too many of their Joint Capability Areas with the same response (i.e. Critical). Recommendation 2). If it would be too disruptive to implement Recommendation 1), the second is a good alternative. We would recommend that USASOC keep the three impact levels of Critical, Essential, and Enhancing, but assess each Joint Capability Area in a manner similar to in Recommendation 1). First determine the frequency with which each capability is utilized by each unit-echelon, then apply the percentages to determine if the response should be Critical, Essential, or Enhancing. The percentages should match the recommended weights we determined earlier: Critical (weight = 9): unit-echelon uses the capability on 90% or higher of missions. Essential (weight = 4): unit-echelon uses the capability on 40% or higher of missions. 56
66 missions. Enhancing (weight = 0.5): unit-echelon uses the capability on 5% or higher of Unfortunately, the data for what each response would be is not available for this study due to classification issues, although it is available to USASOC for implementation. Without this data, it is impossible to verify that implementing this solution would reform the response distributions appropriately. It would at least, however, ensure that all commands are assessing the Joint Capability Areas using the same criteria, so it should eliminate the differences in response distributions between commands. It is possible that it would result in all units having too many responses at the same level, but there should no longer be differences between commands leading to bias in the system. If it should happen that all units show a response distribution that is too right-skewed, making the results too sensitive (as shown in the condition number analysis) and minimizing the actual importance of the levels (because too many are identical), USASOC could adjust the percentages used to assess the levels in order to distribute them more centrally. This flexibility is an advantage of this recommendation. Recommendation 1) would improve the stability of the system more because it would introduce many more values to the database by using a quasi-continuous scale of weights. For the same reason, Recommendation 1) would also differentiate between more Joint Capability Areas than this option. The disadvantage to Recommendation 1) is the initial disruption to the system to change it. Recommendation 2) could be implemented more easily because the impact levels are preserved. 57
67 Recommendation 3): If it is found to be too onerous to make the impact levels dependent on the frequency of the Joint Capability Areas being used on missions, the first two recommendations will not serve. If this should be the case, we still must address the two issues with the response data. If we can t tie the responses to mission data, we recommend directly adjusting it. The weights that we recommended earlier [9, 4, 0.5] are still superior to the current weights because they better match the intent on the impact levels. The distances between the new level weights would much better reflect the differences that can be derived from USASOC s definitions of the levels. Using the new levels then, we still have to address the distribution of the responses. If the responses cannot be tied to mission data, USASOC must force its subordinate commands to respond with more central and wider distributions. The results of our condition number analysis indicate that enforcing an upper limit of 40% on the number of responses at any one level for a unit would greatly improve the system. The results would be less sensitive to subjective inputs, the responses would have the intended impact on ranking the Elements of Cost and Joint Capability Areas, and all units would be forced to respond on the same scale. There are numerous ways of enacting this requirement, including the most direct: simply requiring that no more than 40% of responses for each unit are at any level. Another option is to assign points to each response, increasing with the increasing impact level. Each unit would than have a limited number of points to allocate on all responses, thereby preventing the units from rating too many capabilities at the higher levels. One possible affect of this option might be to limit the number of Essential responses, if units 58
68 tend to allocate most of their points to capabilities they deem Critical, leaving none left for anything but Enhancing responses. If this is not desirable, the direct limit on percentages of responses may be preferred. Other mechanisms of limiting the number of responses are of course devisable, and any number of them may be very effective; it is only important that USASOC implement one of them to correct the current right-skewed and inconsistent distributions of responses. 59
69 IX. AREAS FOR FURTHER STUDY While we have examined the method for determining Joint Capability Area weights, and made recommendations to improve it, this study did not examine in detail the correct valuation of weights for Tasks or Elements of Cost. These two weights are important in determining the final relative weights for Elements of Cost, but are difficult to examine in this forum at this time for a few reasons. First, both USASOC and SOCOM are still trying to implement their systems, and do not have data available for what level of importance (Critical, Essential, or Enhancing) each task and Element of Cost will have. There are thousands of Elements of Cost, and data on what values they will be assigned may be slow to emerge. In addition, while the Joint Capability Area information is unclassified, the Tasks and Elements of Cost in some instances are classified, and not usable in this academic environment. For USASOC s purposes, however, they should better examine the implementation of these weights. We are advising USASOC that they apply the recommendations we listed above, as whichever is implemented for Joint Capability Areas would serve well for Tasks and Elements of Cost. The definitions for Critical, Essential, and Enhancing are the same for all three elements, so the new weights we recommend would improve the system for all elements. In addition, the importance of the distribution of responses holds for all three elements, and should be corrected via our recommendations if they are right-skewed or biased between commands. Another area for further study is the tool that SOCOM is using to determine the cost of each Element of Cost. The prices come from the Special Operations Research, Development, and Acquisition Center (SORDAC). SORDAC determines the price to obtain 60
70 the different Elements of Cost, whether they are training, materiel, etc., and the methods and assumptions SORDAC uses could affect the solutions found by SOCOM s optimizer. A more thorough study of how SORDAC prices the Elements of Cost could yield improvements in their validity an application in the optimization. 61
71 REFERENCES [1] United States Army Special Operations Command Enterprise Information Technology Contract. Required Capabilities Analysis Version 2.1, Software Requirements Specifications. United States Army Special Operations Command, Fort Bragg, NC, [2] US Special Operations Command Strategy to Task Optimizing Resource Model Beta Test. US Special Operations Command J8, MacDill Air Force Base, FL, [3] United States Army Special Operations Command Strategic Planning Process United States Army Special operations Command, Fort Bragg, NC, [4] Stef Graillat. Structured Condition Number and Backward Error for Eigenvalue Problems. Université de Perpignan, RR , pp [5] Weiss, N., Wasilkowski, G. W., Wozniakowski, H., and Shub, M. Average Condition Numbers for Solving Linear Equations. Linear Algebra and its Application 83 (1986). [6] Edelman, Alan. Eigenvalues and Condition Numbers of Random Matrices. SIAM J. Matrix Anal. Appl., vol. 9, no. 4 (1988), pp [7] Gower, John C. Fisher s Optimal Scores and Multiple Correspondence Analysis. Department of Data Theory, University of Leiden, RR-90-04, pp [8] Loehnert, Stephan. About Statistical Analysis of Qualitative Survey Data. International Journal of Quality, Statistics, and Reliability, vol
72 APPENDICES 63
")
73 APPENDIX A- OFFICE OF THE SECRETARY OF DEFENSE APPROVED JOINT CAPABILITY AREAS (SAMPLE ONLY) 64

74 APPENDIX B- REQUIREMENTS AND CAPABILITIES ANALYSIS SYSTEM LOGIC REPLICATOR (SAMPLE ONLY) 65


75 APPENDIX C- STATISTICS ON SURVEY RESPONSES BY USASOC COMMANDS 66
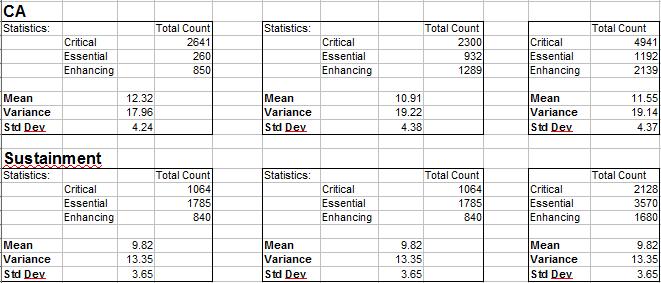

76 67

77 APPENDIX D- OUTPUT OF SENSITIVITY OF JOINT CAPABILITY AREA WEIGHTS Sensitivity Analysis Making 20% increases to each JCA Weight from Original Scale, Original Data JCA Weights: 15, 9, 5 18, 9, 5 15, 10.8, 5 15, 9, 6 Changing the relationship between Critical and Enhancing has the largest effect on items that tend to be rated Enhancing. These tend to be less frequently used, so their weights have greater impact on their relative importance. There are fewer Essential programs, and they are used by other echelons at other levels, so the impact of changing only the Essential weight is lower. 68

78 Sensitivity Analysis Making 20% increases to each JCA Weight from Original Scale, Improved Data JCA Weights: 15, 9, 5 18, 9, 5 15, 10.8, 5 15, 9, 6 In almost every instance, the altered weights result in smaller changes in the prioritized list. Distributing the data better results in better stability, and less dependence on the subjective user inputs. 69

79 Sensitivity Analysis Changing to New Weight Scale, using Original Data JCA Weights: 15, 9, 5 9, 4, 0.5 When switching to the new weights, there is a significant stretching effect. The Elements of Cost that tend to be rated as Enhancing are significantly lowered from the original scale, while those that tend to be rated as Critical are higher. This reflects the greater relative distance between the weights. 70

80 APPENDIX E- JOINT CAPABILITY AREAS SURVEY RESULTS (SAMPLE ONLY) 71
Statistics Definitions ID1050 Quantitative & Qualitative Reasoning
 Statistics Definitions ID1050 Quantitative & Qualitative Reasoning Population vs. Sample We can use statistics when we wish to characterize some particular aspect of a group, merging each individual s
OFFICE OF THE SECRETARY OF DEFENSE 1700 DEFENSE PENTAGON WASHINGTON, DC
 OFFICE OF THE SECRETARY OF DEFENSE 1700 DEFENSE PENTAGON WASHINGTON, DC 20301-1700 OPERATIONAL TEST AND EVALUATION JUN 26 2013 MEMORANDUM FOR COMMANDER, OPERATIONAL TEST AND EVALUATION FORCE (COMOPTEVFOR)
Near-Balanced Incomplete Block Designs with An Application to Poster Competitions
 Near-Balanced Incomplete Block Designs with An Application to Poster Competitions arxiv:1806.00034v1 [stat.ap] 31 May 2018 Xiaoyue Niu and James L. Rosenberger Department of Statistics, The Pennsylvania
THE LEAD PROFILE AND OTHER NON-PARAMETRIC TOOLS TO EVALUATE SURVEY SERIES AS LEADING INDICATORS
 THE LEAD PROFILE AND OTHER NON-PARAMETRIC TOOLS TO EVALUATE SURVEY SERIES AS LEADING INDICATORS Anirvan Banerji New York 24th CIRET Conference Wellington, New Zealand March 17-20, 1999 Geoffrey H. Moore,
CHAPTER VI FUZZY MODEL
 CHAPTER VI This chapter covers development of a model using fuzzy logic to relate degree of recording/evaluation with the effectiveness of financial decision making and validate the model vis-à-vis results
Transforming Projectile System Combining Lethality and Intelligence
 Proceedings of the 2010 IEEE Systems and Information Engineering Design Symposium, University of Virginia, Charlottesville, VA, USA, April 23, 2010 FPM2Dec.1 Transforming Projectile System Combining Lethality
A MATHEMATICAL MODEL OF PAY-FOR- PERFORMANCE FOR A HIGHER EDUCATION INSTITUTION
 Page 13 A MATHEMATICAL MODEL OF PAY-FOR- PERFORMANCE FOR A HIGHER EDUCATION INSTITUTION Matthew Hathorn, Weill Cornell Medical College John Hathorn, Metropolitan State College of Denver Lesley Hathorn,
GEARING FACTORS. The A FLEXIBLE SIZING APPROACH
 GEARING FACTORS The A FLEXIBLE SIZING APPROACH MB Duration (Months) DERIVING GEARING FACTORS Determining the scope of a proposed system is one of the most challenging aspects of any software estimate.
Transportation problem
 Transportation problem Operations research (OR) are concerned with scientifically deciding how to best design and operate people machine systems, usually under conditions requiring the allocation of scarce
Pre-Milestone-A Decision-Making: Can We Cost Capabilities?
 Pre-Milestone-A Decision-Making: Can We Cost Capabilities? Abstract The issue of early, rigorous evaluation of program costs for use in early decision-making is becoming more important as defense funding
Delivering Value Why Else Are You Doing The Project?
 Delivering Value Why Else Are You Doing The Project? THOUGHT LEADERSHIP WHITE PAPER In partnership with By Andy Jordan, PMP, ProjectManagement.com Research Analyst Projects are the way that an organization
Sawtooth Software. Sample Size Issues for Conjoint Analysis Studies RESEARCH PAPER SERIES. Bryan Orme, Sawtooth Software, Inc.
 Sawtooth Software RESEARCH PAPER SERIES Sample Size Issues for Conjoint Analysis Studies Bryan Orme, Sawtooth Software, Inc. 1998 Copyright 1998-2001, Sawtooth Software, Inc. 530 W. Fir St. Sequim, WA
Chapter 3. Integrating AHP, clustering and association rule mining
 Chapter 3. Integrating AHP, clustering and association rule mining This chapter presents a novel product recommendation methodology that combines group decision-making and data mining. This method has
Course notes for EE394V Restructured Electricity Markets: Market Power
 Course notes for EE394V Restructured Electricity Markets: Market Power Ross Baldick Copyright c 2009 Ross Baldick Title Page 1 of 54 Go Back Full Screen Close Quit 1 Background This review of background
BENCHMARKING BEST MANUFACTURING PRACTICES: A STUDY INTO FOUR SECTORS OF THE TURKISH INDUSTRY. Gündüz ULUSOY
 BENCHMARKING BEST MANUFACTURING PRACTICES: A STUDY INTO FOUR SECTORS OF THE TURKISH INDUSTRY Gündüz ULUSOY Faculty of Engineering and Natural Sciences, Sabancı University, Orhanlı, Tuzla, 81474 Istanbul,
Models in Engineering Glossary
 Models in Engineering Glossary Anchoring bias is the tendency to use an initial piece of information to make subsequent judgments. Once an anchor is set, there is a bias toward interpreting other information
APPLICATION OF SEASONAL ADJUSTMENT FACTORS TO SUBSEQUENT YEAR DATA. Corresponding Author
 1 2 3 4 5 6 7 8 9 10 11 12 13 14 15 16 17 18 19 20 21 22 23 24 25 26 27 28 29 30 31 32 33 34 35 36 37 38 39 40 41 42 43 44 45 46 47 48 49 50 51 52 APPLICATION OF SEASONAL ADJUSTMENT FACTORS TO SUBSEQUENT
CHAPTER 8 PERFORMANCE APPRAISAL OF A TRAINING PROGRAMME 8.1. INTRODUCTION
 168 CHAPTER 8 PERFORMANCE APPRAISAL OF A TRAINING PROGRAMME 8.1. INTRODUCTION Performance appraisal is the systematic, periodic and impartial rating of an employee s excellence in matters pertaining to
Chapter 8 Script. Welcome to Chapter 8, Are Your Curves Normal? Probability and Why It Counts.
 Chapter 8 Script Slide 1 Are Your Curves Normal? Probability and Why It Counts Hi Jed Utsinger again. Welcome to Chapter 8, Are Your Curves Normal? Probability and Why It Counts. Now, I don t want any
An Exploration of the Relationship between Construction Cost and Duration in Highway Projects
 University of Colorado, Boulder CU Scholar Civil Engineering Graduate Theses & Dissertations Civil, Environmental, and Architectural Engineering Spring 1-1-2017 An Exploration of the Relationship between
Introduction to Business Research 3
 Synopsis Introduction to Business Research 3 1. Orientation By the time the candidate has completed this module, he or she should understand: what has to be submitted for the viva voce examination; what
A Method to Quantify STAT Impact in DoD Test Design
 A Method to Quantify STAT Impact in DoD Test Design Best Practice Authored by: Sarah Burke, PhD Michael Harman Francisco Ortiz, PhD Lenny Truett, PhD Aaron Ramert Bill Rowell, PhD 15 February 2017 The
Course on Data Analysis and Interpretation P Presented by B. Unmar. Sponsored by GGSU PART 1
 Course on Data Analysis and Interpretation P Presented by B. Unmar Sponsored by GGSU PART 1 1 Data Collection Methods Data collection is an important aspect of any type of research study. Inaccurate data
Computing Descriptive Statistics Argosy University
 2014 Argosy University 2 Computing Descriptive Statistics: Ever Wonder What Secrets They Hold? The Mean, Mode, Median, Variability, and Standard Deviation Introduction Before gaining an appreciation for
A Primer. & EVFILURTION of SYSTEfYl RELlfiBILITY fwlllfibility and fnrintrinrbility. Department OF DEFENSE DIRECTOR TEST RND EVRLUFITION. DoD 3235.
 DoD 3235.1-H Department OF DEFENSE... - TEST & EVFILURTION of SYSTEfYl RELlfiBILITY fwlllfibility and fnrintrinrbility A Primer DIRECTOR TEST RND EVRLUFITION Office of the Under Secretary of Defense for
Tutorial Segmentation and Classification
 MARKETING ENGINEERING FOR EXCEL TUTORIAL VERSION v171025 Tutorial Segmentation and Classification Marketing Engineering for Excel is a Microsoft Excel add-in. The software runs from within Microsoft Excel
Examining and Modeling Customer Service Centers with Impatient Customers
 Examining and Modeling Customer Service Centers with Impatient Customers Jonathan Lee A THESIS SUBMITTED IN PARTIAL FULFILLMENT OF THE REQUIREMENTS FOR THE DEGREE OF BACHELOR OF APPLIED SCIENCE DEPARTMENT
Getting Started with OptQuest
 Getting Started with OptQuest What OptQuest does Futura Apartments model example Portfolio Allocation model example Defining decision variables in Crystal Ball Running OptQuest Specifying decision variable
Statistics and Business Decision Making TEKS/LINKS Student Objectives One Credit
 First Six Weeks Defining and Collecting of Data SBDM 8(A) The student will define the types of variables and the measurement scales of variables. SBDM 8(B) The student will understand the collecting of
Leadership Practices Inventory: LPI
 Leadership Practices Inventory: LPI JAMES M. KOUZES & BARRY Z. POSNER Group Assessment Report Prepared for Sample Group Report November 12, 2012 November 12, 2012 Group Summary by Leadership Practice This
Scheduling Resources and Costs
 Student Version CHAPTER EIGHT Scheduling Resources and Costs McGraw-Hill/Irwin Copyright 2011 by The McGraw-Hill Companies, Inc. All rights reserved. Gannt Chart Developed by Henry Gannt in 1916 is used
Submitted to the Grand Rapids Community College Provost and AGC Executive Committee.
 Oscar Neal Fall 2012 Sabbatical Report Submitted to the Grand Rapids Community College Provost and AGC Executive Committee. The main objective of my sabbatical was to complete my dissertation proposal
Capability Brief. Slide Alban Station Blvd Suite B-258 Springfield, VA Main: Fax:
 Capability Brief. Slide 1 Who we are? Knowledge Capital Associates, LLC (KCA) is a Service-Disabled Veteran-Owned Small Business (SDVOSB) founded in 2009 to uncover, harness, and apply knowledge and expertise
Defense AT&L: May-June
 28 Sizing the Supply Chain FROM THE TOP DOWN Rob Blakey Michael A. Bayer, Ph.D. Spare-part inventory has been, and continues to be, an important element of logistics support to the U.S. Air Force (USAF)
Chapter 2 Part 1B. Measures of Location. September 4, 2008
 Chapter 2 Part 1B Measures of Location September 4, 2008 Class will meet in the Auditorium except for Tuesday, October 21 when we meet in 102a. Skill set you should have by the time we complete Chapter
INTERNATIONAL STANDARD
 INTERNATIONAL STANDARD ISO/IEC 27004 First edition 2009-12-15 Information technology Security techniques Information security management Measurement Technologies de l'information Techniques de sécurité
A User s Guide for the Acquisition Workforce Projection Model
 PROJECT MEMORANDUM R A User s Guide for the Acquisition Workforce Projection Model Al Robbert & Bob Emmerichs PM-1183-OSD April 2001 Prepared for the Office of the Deputy Under Secretary of Defense for
An Application of Categorical Analysis of Variance in Nested Arrangements
 International Journal of Probability and Statistics 2018, 7(3): 67-81 DOI: 10.5923/j.ijps.20180703.02 An Application of Categorical Analysis of Variance in Nested Arrangements Iwundu M. P. *, Anyanwu C.
Audit Sampling With MindBridge. Written by: Corey Yanofsky and Behzad Nikzad
 Audit Sampling With MindBridge Written by: Corey Yanofsky and Behzad Nikzad Introduction One of the responsibilities of an auditor to their client is to provide assurance that the rate of non-compliance
Contents Getting Started... 7 Sample Dashboards... 12
 P6 Analytics Reference Manual Release 3.4 September 2014 Contents Getting Started... 7 About P6 Analytics... 7 Prerequisites to Use Analytics... 8 About Analyses... 9 About... 9 About Dashboards... 10
Multiple Regression. Dr. Tom Pierce Department of Psychology Radford University
 Multiple Regression Dr. Tom Pierce Department of Psychology Radford University In the previous chapter we talked about regression as a technique for using a person s score on one variable to make a best
A Systematic Approach to Performance Evaluation
 A Systematic Approach to Performance evaluation is the process of determining how well an existing or future computer system meets a set of alternative performance objectives. Arbitrarily selecting performance
Leadership Practices Inventory: LPI JAMES M. KOUZES & BARRY Z. POSNER
 Assessments Leadership Practices Inventory: LPI JAMES M. KOUZES & BARRY Z. POSNER Group Assessment Report Prepared for Pfeiffer Team Group Summary by Leadership Practice This page displays the average
Chapter 1 Data and Descriptive Statistics
 1.1 Introduction Chapter 1 Data and Descriptive Statistics Statistics is the art and science of collecting, summarizing, analyzing and interpreting data. The field of statistics can be broadly divided
ASSESSING THE TRADEOFF BETWEEN COST AND AVAILABILITY USING SIMULATION
 2017 NDIA GROUND VEHICLE SYSTEMS ENGINEERING AND TECHNOLOGY SYMPOSIUM SYSTEMS ENGINEERING (SE) TECHNICAL SESSION AUGUST 8-10, 2017 NOVI, MICHIGAN ASSESSING THE TRADEOFF BETWEEN COST AND AVAILABILITY USING
Establishing Requirements for Exception Handling Herbert Hecht SoHaR Incorporated
 Establishing Requirements for Exception Handling Herbert Hecht SoHaR Incorporated 1. Introduction Software for embedded systems is expected to protect the system from a wide range of conditions that can
e-learning Student Guide
 e-learning Student Guide Basic Statistics Student Guide Copyright TQG - 2004 Page 1 of 16 The material in this guide was written as a supplement for use with the Basic Statistics e-learning curriculum
Campus Outsourcing A Decision-making Model
 A HIGHER EDUCATION PRESIDENTIAL ESSAY SERIES 2006 SERIES: CREATING COMPETITIVE ADVANTAGE ESSAY 10 Campus Outsourcing A Decision-making Model Campus Outsourcing A Decision-making Model ESSAY 10 DR. JOSEPH
+? Mean +? No change -? Mean -? No Change. *? Mean *? Std *? Transformations & Data Cleaning. Transformations
 Transformations Transformations & Data Cleaning Linear & non-linear transformations 2-kinds of Z-scores Identifying Outliers & Influential Cases Univariate Outlier Analyses -- trimming vs. Winsorizing
Project Management CTC-ITC 310 Spring 2018 Howard Rosenthal
 Project Management CTC-ITC 310 Spring 2018 Howard Rosenthal 1 Notice This course is based on and includes material from the text: A User s Manual To the PMBOK Guide Authors: Cynthia Stackpole Snyder Publisher:
Selecting the best statistical distribution using multiple criteria
 Selecting the best statistical distribution using multiple criteria (Final version was accepted for publication by Computers and Industrial Engineering, 2007). ABSTRACT When selecting a statistical distribution
Introduction to Analytics Tools Data Models Problem solving with analytics
 Introduction to Analytics Tools Data Models Problem solving with analytics Analytics is the use of: data, information technology, statistical analysis, quantitative methods, and mathematical or computer-based
MODELING OF LOGISTICS IN COMPUTER ASSISTED EXERCISES
 Sławomir BYŁEŃ MODELING OF LOGISTICS IN COMPUTER ASSISTED EXERCISES Abstract: A command post exercise, supported by a computer simulation, is one of the primary training tools available to the Polish Armed
Overview of Statistics used in QbD Throughout the Product Lifecycle
 Overview of Statistics used in QbD Throughout the Product Lifecycle August 2014 The Windshire Group, LLC Comprehensive CMC Consulting Presentation format and purpose Method name What it is used for and/or
Tassc:Estimator technical briefing
 Tassc:Estimator technical briefing Gillian Adens Tassc Limited www.tassc-solutions.com First Published: November 2002 Last Updated: April 2004 Tassc:Estimator arrives ready loaded with metric data to assist
P6 Analytics Reference Manual
 P6 Analytics Reference Manual Release 3.2 December 2013 Contents Getting Started... 7 About P6 Analytics... 7 Prerequisites to Use Analytics... 8 About Analyses... 9 About... 9 About Dashboards... 10
TRIAGE: PRIORITIZING SPECIES AND HABITATS
 32 TRIAGE: PRIORITIZING SPECIES AND HABITATS In collaboration with Jon Conrad Objectives Develop a prioritization scheme for species conservation. Develop habitat suitability indexes for parcels of habitat.
Continuous Improvement Toolkit. Risk Analysis. Continuous Improvement Toolkit.
 Continuous Improvement Toolkit Risk Analysis The Continuous Improvement Map Managing Risk FMEA Understanding Performance Check Sheets Data Collection PDPC RAID Log* Risk Analysis* Fault Tree Analysis Traffic
Linear model to forecast sales from past data of Rossmann drug Store
 Abstract Linear model to forecast sales from past data of Rossmann drug Store Group id: G3 Recent years, the explosive growth in data results in the need to develop new tools to process data into knowledge
CHAPTER-IV DATA ANALYSIS AND INTERPRETATION
 CHAPTER-IV DATA ANALYSIS AND INTERPRETATION 4.1 Introduction Data analysis is a process of assigning meaning to collected data, analysing significance and determination of findings and conclusions. Data
4 : Research Methodology
 4 : Research Methodology 4.1 Introduction 4.2 Research Problem 4.3 Objectives of Research Study 4.4 Rationale of the Study 4.5 Research Design 4.6 Research Methodology 4.7 Data Processing and Analysis
3.2 Measures of Central Tendency
 3.2 Measures of Central Tendency In statistics, the three most commonly used measures of central tendency are the mean, median, and mode. Each of these measures has its particular advantages and disadvantages
MQL- vs Revenue- Based Campaign Calendar Planning
 MQL- vs Revenue- Based Campaign Calendar Planning Full Circle Insights FullCircleInsights.com 650.641.2766 877.834.4001 Copyright 2015 Full Circle Insights, Inc. All Rights Reserved. What IS Marketing
ROADMAP. Introduction to MARSSIM. The Goal of the Roadmap
 ROADMAP Introduction to MARSSIM The Multi-Agency Radiation Survey and Site Investigation Manual (MARSSIM) provides detailed guidance for planning, implementing, and evaluating environmental and facility
+? Mean +? No change -? Mean -? No Change. *? Mean *? Std *? Transformations & Data Cleaning. Transformations
 Transformations Transformations & Data Cleaning Linear & non-linear transformations 2-kinds of Z-scores Identifying Outliers & Influential Cases Univariate Outlier Analyses -- trimming vs. Winsorizing
Miles CPA Review: BEC Q Updates for 2017 Edition
 Miles CPA Review Miles CPA Review: BEC Q2 2018 Updates for 2017 Edition Summary of updates: - New version CPA exam structure (w.e.f. April 2017) Time management on the exam - BEC-1.3 Enterprise Risk Management
Higher Education Funding Council for England Call for Evidence: KEF metrics
 January 2018 Higher Education Funding Council for England Call for Evidence: KEF metrics Written submission on behalf of the Engineering Professors Council Introduction 1. The Engineering Professors Council
Online Student Guide Types of Control Charts
 Online Student Guide Types of Control Charts OpusWorks 2016, All Rights Reserved 1 Table of Contents LEARNING OBJECTIVES... 4 INTRODUCTION... 4 DETECTION VS. PREVENTION... 5 CONTROL CHART UTILIZATION...
The Institute of Chartered Accountants of Sri Lanka
 The Institute of Chartered Accountants of Sri Lanka Postgraduate Diploma in Business Finance and Strategy Quantitative Methods for Business Studies Handout 01: Basic Statistics Statistics The statistical
DOWNLOAD PDF MANUAL ON PRESENTATION OF DATA AND CONTROL CHART ANALYSIS
 Chapter 1 : ASTM manual on presentation of data and control chart analysis ( edition) Open Library tis Atmh s Manual on Presentation of Data and Control Chart Analysis is the ninth edition of the Astm
DEVELOPING AN ASSESSMENT TOOL FOR MEASURING TOTAL QUALITY MANAGEMENT: A CASE STUDY
 International Journal of Advanced Academic Research Sciences, Technology & Engineering ISSN: -99 Vol., Issue (April 1) DEVELOPING AN ASSESSMENT TOOL FOR MEASURING TOTAL QUALITY MANAGEMENT: A CASE STUDY
Starter Watch the video clip In the Field which highlights some of the challenges of collecting data in the Arctic region.
 Ocean Acidification Lesson 2: Data Analysis Key question: How can ocean acidification data be analysed and presented? Aim: To handle data collected during Dr Findlay s ocean acidification research visit
JMP TIP SHEET FOR BUSINESS STATISTICS CENGAGE LEARNING
 JMP TIP SHEET FOR BUSINESS STATISTICS CENGAGE LEARNING INTRODUCTION JMP software provides introductory statistics in a package designed to let students visually explore data in an interactive way with
Manufacturing Technology Committee Risk Management Working Group Risk Management Training Guides
 Manufacturing Technology Committee Management Working Group Management Training Guides Ranking and Filtering 1 Overview Ranking and Filtering is one of the most common facilitation methods used for Management.
Daily Optimization Project
 Daily Optimization Project Personalized Facebook Analysis 10/29/15 By Kevin DeLuca ThoughtBurner Kevin DeLuca and ThoughtBurner, 2015. Unauthorized use and/or duplication of this material without express
EFFICACY OF ROBUST REGRESSION APPLIED TO FRACTIONAL FACTORIAL TREATMENT STRUCTURES MICHAEL MCCANTS
 EFFICACY OF ROBUST REGRESSION APPLIED TO FRACTIONAL FACTORIAL TREATMENT STRUCTURES by MICHAEL MCCANTS B.A., WINONA STATE UNIVERSITY, 2007 B.S., WINONA STATE UNIVERSITY, 2008 A THESIS submitted in partial
Empirical Exercise Handout
 Empirical Exercise Handout Ec-970 International Corporate Governance Harvard University March 2, 2004 Due Date The new due date for empirical paper is Wednesday, March 24 at the beginning of class. Description
WOMEN IN INTERNATIONAL AFFAIRS NETWORK
 WOMEN IN INTERNATIONAL AFFAIRS NETWORK Application Pack HEAD OF PROGRAMMES Dear applicant, Thank you for your interest in the post of Head of Programmes with the Women in International Affairs Network.
Section 1: Introduction
 Multitask Principal-Agent Analyses: Incentive Contracts, Asset Ownership, and Job Design (1991) By Bengt Holmstrom and Paul Milgrom Presented by Group von Neumann Morgenstern Anita Chen, Salama Freed,
BRAND LOYALTY OF FEMALE CONSUMERS - STUDY CARRIED IN SFÂNTU GHEORGHE AND THE SURROUNDING AREAS
 BRAND LOYALTY OF FEMALE CONSUMERS - STUDY CARRIED IN SFÂNTU GHEORGHE AND THE SURROUNDING AREAS Assistant Ph.D Erika KULCSÁR "Babeş Bolyai" University of Cluj Napoca Email: elerhetetlen@yahoo.com Ec. Szende
Untangling Correlated Predictors with Principle Components
 Untangling Correlated Predictors with Principle Components David R. Roberts, Marriott International, Potomac MD Introduction: Often when building a mathematical model, one can encounter predictor variables
Fig.1. Project Organization Chart.
 THE PROJECT ORGANIZATION STRUCTURE A project organization is a structure that facilitates the coordination and implementation of project activities. Its main reason is to create an environment that fosters
Using Multi-chromosomes to Solve. Hans J. Pierrot and Robert Hinterding. Victoria University of Technology
 Using Multi-chromosomes to Solve a Simple Mixed Integer Problem Hans J. Pierrot and Robert Hinterding Department of Computer and Mathematical Sciences Victoria University of Technology PO Box 14428 MCMC
Why Learn Statistics?
 Why Learn Statistics? So you are able to make better sense of the ubiquitous use of numbers: Business memos Business research Technical reports Technical journals Newspaper articles Magazine articles Basic
MARKET-BASED PRICING WITH COMPETITIVE DATA: OPTIMIZING PRICES FOR THE AUTO/EQUIPMENT PARTS INDUSTRY
 WHITE PAPER By Sean Duclaux Director, Industry Marketing MARKET-BASED PRICING WITH COMPETITIVE DATA: OPTIMIZING PRICES FOR THE AUTO/EQUIPMENT PARTS INDUSTRY Unlock Your Data Unleash Your Sales EXECUTIVE
Managerial Accounting Prof. Dr. Varadraj Bapat Department of School of Management Indian Institute of Technology, Bombay
 Managerial Accounting Prof. Dr. Varadraj Bapat Department of School of Management Indian Institute of Technology, Bombay Lecture - 32 Standard Costing, Mix, Yield, Sales and Fixed Overhead Variances The
Utilizing Optimization Techniques to Enhance Cost and Schedule Risk Analysis
 1 Utilizing Optimization Techniques to Enhance Cost and Schedule Risk Analysis Colin Smith, Brandon Herzog SCEA 2012 2 Table of Contents Introduction to Optimization Optimization and Uncertainty Analysis
Inventory Systems with Transshipments and Quantity Discounts. A dissertation submitted in partial fulfillment of the requirements for the
 Inventory Systems with Transshipments and Quantity Discounts A dissertation submitted in partial fulfillment of the requirements for the degree of Doctor of Philosophy By Gregory D. Noble B.S.I.S.E., Wright
The Application of a Course-of-Action Ontology to Support OPFOR COA Selection and Assessment
 The Application of a Course-of-Action Ontology to Support OPFOR COA Selection and Assessment Timothy Darr, Richard Mayer and Perakath Benjamin Knowledge-Based Systems, Inc. 1408 University Drive East College
Glossary of Standardized Testing Terms https://www.ets.org/understanding_testing/glossary/
 Glossary of Standardized Testing Terms https://www.ets.org/understanding_testing/glossary/ a parameter In item response theory (IRT), the a parameter is a number that indicates the discrimination of a
Module - 01 Lecture - 03 Descriptive Statistics: Graphical Approaches
 Introduction of Data Analytics Prof. Nandan Sudarsanam and Prof. B. Ravindran Department of Management Studies and Department of Computer Science and Engineering Indian Institution of Technology, Madras
2016 SEO Strategy. Link Building and High Quality Content
 2016 SEO Strategy Link Building and High Quality Content Study Shows Link Building Still Highly Effective When Used With Great Content You ve seen the claims: 1. So Many New Ranking Factors! 2. Content
Definition. Name of the tool or technique Project mission statement
 Tools and Techniques Definitions (or by alphabetic order ; see below) A definition of each of the tools and techniques is provided below. The primary sources of definitions were the PMBOK Guide and Max
Operations and Supply Chain Management Prof. G. Srinivasan Department of Management Studies Indian Institute of Technology Madras
 Operations and Supply Chain Management Prof. G. Srinivasan Department of Management Studies Indian Institute of Technology Madras Lecture - 5 Aggregate Planning, Tabular Method, Linear Programming (Refer
Education Liaison: The Performance Evaluation Process (PEP)
") Education Liaison: The Performance Evaluation Process (PEP) The Performance Evaluation Process (PEP) for an Education Liaison is intended to provide an employee with valuable insight into their job performance,
Education Liaison: The Performance Evaluation Process (PEP) The Performance Evaluation Process (PEP) for an Education Liaison is intended to provide an employee with valuable insight into their job performance,
Part I: Math Review Remember to show all of your work. Also remember that calculators are not permitted on exams, so you should try these by hand.
 Economics 101 Fall 2013 Answers to Homework #1 Due Tuesday, September 17, 2013 Directions: The homework will be collected in a box before the lecture. Please place your name, TA name and section number
Phase II- Predictive Factors Report
 Phase II- Predictive Factors Report Identification, Standardization, and Weighting of Significant Predictive Factors for Inclusion in the Decision-making Tool Summary This report summarizes the procedures
Center for Demography and Ecology
 Center for Demography and Ecology University of Wisconsin-Madison A Comparative Evaluation of Selected Statistical Software for Computing Multinomial Models Nancy McDermott CDE Working Paper No. 95-01
EPSRC Centre for Doctoral Training in Industrially Focused Mathematical Modelling
 EPSRC Centre for Doctoral Training in Industrially Focused Mathematical Modelling Swarm Robotics in Bearing-Only Formations Joseph Field Contents 1. Introduction... 2 2. Formulating the Problem... 3 Glossary
The Application of a Course-of-Action Ontology to Support OPFOR COA Selection and Assessment
 The Application of a Course-of-Action Ontology to Support OPFOR COA Selection and Assessment Timothy Darr, Richard Mayer and Perakath Benjamin Knowledge-Based Systems, Inc. 1408 University Drive East College