Development of the Statistical Tool for Operating Events Database Analysis
|
|
|
- Russell Crawford
- 5 years ago
- Views:
Transcription


1 Development of the Statistical Tool for Operating Events Database Analysis Operating Events Ranking Tool OPERATE Zdenko Šimić 2014 Report EUR EN
2 European Commission Joint Research Centre Institute for Energy and Transport Contact information Zdenko Šimić Address: Joint Research Centre - IET, PO Box 2, NL-1755 ZG Petten zdenko.simic@gmail.com Tel.: Legal Notice This publication is a Science and Policy Report by the Joint Research Centre, the European Commission s in-house science service. It aims to provide evidence-based scientific support to the European policy-making process. The scientific output expressed does not imply a policy position of the European Commission. Neither the European Commission nor any person acting on behalf of the Commission is responsible for the use which might be made of this publication. All images European Union 2014 JRC91882 EUR EN ISBN (PDF) ISBN (print) ISSN (online) ISSN (print) doi: /37229 Luxembourg: Publications Office of the European Union, 2014 European Union, 2014 Reproduction is authorised provided the source is acknowledged. Abstract This report contains a specification and implementation description for the statistical tool (desktop software program) which will allow detailed reporting and flexible ranking of operational events. The program is named Operational Events Ranking Tool (OPERATE). Detail statistical reporting with a robust and consistent way of selecting most important events for more detailed investigation is very important. This provides better insight and saves the need for complete detail investigation which is neither feasible nor useful. It allows also to identify events trends and patterns across large databases. The foundation for the statistical reporting and ranking is defined by the events parameters which are the base for reporting, grouping and ranking. This requires that each event should have characterisation which allows use of selected parameters for grouping and ranking. Five parameters are used for events grouping: Activity, Direct cause, Systems, Components, and Root cause & Causal factor. Seven parameters are used for ranking: Frequency, Trend, Extension, Multiple, Safety, Category and Consequences. Some other parameters are used for statistics reports and future criteria (e.g. Vendor, Reactor type, Time of event, Status and Group of staff). An important part of the implemented method is the way how ranking indexes are calculated. This is done in a consistent way based on previous experience and new research. OPERATE allows for each ranking index to be valued on the basis of relative importance determined by the experts' judgement evaluated with analytical hierarchy process (AHP). In this way weighting is easily determined and the importance of different parameters could be consistent. The tool is capable of analysing ranking for all groupings based on the expert and AHP determined relative importance. In order to investigate the ranking confidence (uncertainty and sensitivity), the tool can analyse ranking for user-selected variations of parameters importance (e.g. ±30% weighting for all ranking indexes etc.). This is useful to determine the sensitivity of the results, which could expose the criticality of certain ranking parameters and respected weights.
3 Development of the Statistical Tool for Operating Events Database Analysis Operating Events Ranking Tool - OPERATE Zdenko Šimić EC JRC IET, 2014
4 Table of Contents Introduction Tool specification General Overview Tool's Purpose Necessary Input Results (Output) Development and Usage Requirements Application platform selection Database and other related information Use cases Tool development Statistical reports Grouping and ranking indexes determination Events characterization Ranking algorithm Ranking confidence (uncertainty and sensitivity) analysis Ranking tool application Results Selected results Discussion Further development Conclusion References Appendix Events characterisation Events parameters and attributes Database structure Tool and results illustrations Illustration for all the available statistical reports Illustration for all the groups rankings Illustration for the confidence (uncertainty and sensitivity) analysis results Implementation details Trend determination Confidence (uncertainty and sensitivity) implementation Page 1 of 64
5 List of Tables Table 1 List of events and groups parameters used for database and ranking tool... 6 Table 2 List of all attributes used for of the Activity parameter event characterization 12 Table 3 List of all event characterization attributes used for of the 'Category' parameter 12 Table 4 Example of the intermediate values for grouping based on the parameter Direct cause 13 Table 5 List of ranking indexes with definition and calculation formula Table 6 List of ranking indexes with definition and calculation formula Table 7 Ranking results top 20 groups ranking with AHP and 33% uncertainty ranking indexes weighting Table 8 Number of characterised US NRC LER data and assigned experts per quarters 29 Table 9 Number of special events not considered and other Table 10 List of special events not considered and other Table 11 Parameters for the events characterisation with respected attributes Table 12 Database parameters summary and main use Table 13 Database parameters details regarding database structure and values Table 14 Detailed list of parameters with respected sub parameters from the WANO coding scheme List of Figures Figure 1 Tables present in the MS Access database with events and coding description... 7 Figure 2 List of available statistical reports and graph showing the number of events per year Figure 3 The analytical hierarchy process (AHP) part of the tool where pairwise comparison of all ranking indexes is used in the tool. The user can change this with his knowledge of the AHP method or just use default values and proceed to the ranking Figure 4 Ranking results for Components group Figure 5 Example for Confidence part of the tool results for sensitivity of Top 20% ranking Figure 6 Ranking values for the top 20 groups (described in Table 7) with contributions from all RIs Page 2 of 64
6 1 Introduction Operation experience feedback is based on the events investigation and on the conclusion about their relevance and implications for the operational and safety improvements. One specific issue is related to the selection of events which should have priority for the investigation. Beyond the analysis of individual events, it is important to have a tool which allows to identify events trends and patterns across large database and, in a second stage, to focus the analysis efforts on these trends and patterns. A tool which will allow for different ways of ranking and prioritization is considered to be necessary. The basic idea for the prioritization which will be implemented in this tool comes from the Technical report [1] and the papers [2 and 3] with important expansion to additional events parameters which will allow their different groupings. In addition to the event groups ranking, this tool provides different ways of statistical reporting, viewing and analysing. This report presents the complete description of statistical and ranking tool development. The tool is named OPERATE (Operating Events Ranking Tool). The description includes the design of key elements, the project specification, the development description and the presentation of the demonstration results with conclusions regarding usage, limitations and future potential. Page 3 of 64
7 2 Tool specification The project specification presents a high level description of the tool. This helps as an introduction to the description of the tool development in the following section. This includes a general overview, the selection of an application platform for the tool, a database related description and examples of use (i.e. descriptions of how the tool is planned to be used). 2.1 General Overview The general overview defines the tool's purpose, development and use platform, necessary inputs, results and development requirements. This also defines boundary conditions which are important when considering further tool application and development beyond the present scope Tool's Purpose The statistical tool for operating events ranking and analysis (OPERATE) is a computer program for the operational events importance and statistical analysis which allows the following: 1. Report about numbers and time trends of events characterized according to predefined attributes. 2. Group events according to five selected criteria and respected parameters. All groups are processed further with ranking and confidence analysis. 3. Calculate events groups ranking indexes (RIs) values and weightings for all groupings based on the predefined formulas for events groups parameters and relations. The current implementation has seven different RIs. Weightings are determined on the basis of their relative importance using Analytical Hierarchy Process (AHP). The tool has initial relative RIs comparison, and allows for change. 4. Calculate total events groups ranking for all groupings, and quantified RIs weightings. The total ranking value is directly determining ranking for all event groups. 5. Calculate and compare events groups ranking for varied RIs weightings with separate uncertainty and sensitivity assessment for all grouping. This is providing insight for confidence in ranking results and allowing iterative ranking Necessary Input The tool requires a database with properly characterised events. Events data characterisation and import, if done in a different format, is done as pre-processing outside the tool. Characterised events in the database have to have the following: events with attributes for all selected predefined parameters which are used for reporting, grouping and ranking. Page 4 of 64
8 Full functionality of the tool is available even for just one year of events except that ranking index for trend requires at least two years of data. Because of the statistical and credibility confidence it is important that events are complete and cover as many years as available. Five complete years of data with hundreds of events should be considered as sufficient for meaningful and valuable assessment Results (Output) Based on the input and users interaction, the tool is able to produce a complete report which documents all information used as input, with all calculations performed and all results. The results are consisting of a statistical description for all parameters from the event characterisation and description, with all groupings ranking for selected weighting (default or user-determined) and confidence assessment (uncertainty and sensitivity with selected levels) Development and Usage Requirements In order to develop and use the tool it is necessary to: 1. Select an application platform (i.e. the spread sheet, stand-alone personal computer or web). 2. Define criteria for events grouping. 3. Develop equations for events groups ranking indexes (RIs) calculation and total ranking value calculation (i.e. AHP determined RIs weights). 4. Develop a sensitivity and uncertainty (i.e. confidence) quantification approach. 5. Implement (code) steps 2 to 4, and to develop a user interface 6. Select a representative event database, characterise it and analyse it with the tool. 2.2 Application platform selection Before the tool is implemented an application platform is selected from these possible options: 1. A Microsoft Excel spreadsheet. This is a semi-manual application with some manual steps related not only to input data preparation and import but also to the usage. Coding is required for application and for special calculations. This is a flexible approach for development but hard for usage. Development requires fewer resources. 2. A personal computer desktop application is an option where a stand-alone application is developed. Microsoft Visual Studio is the reference programming environment for coding. This means that more resources are required for the development but application is much easier others to use. 3. A web application is an option where online usage is possible. This is more challenging to develop and requires outsourcing. The benefit would be that it Page 5 of 64
9 becomes easier to share some assessments and to cooperate between users, including connectivity with existing Clearinghouse effort. The initial development started with MS Excel implementation. After the concept was proved, the use of a PC desktop application seemed to be the best solution. In the future, depending on the usage development, web online application might be the following step. Also there is enough room for further development with stand-alone implementation. Microsoft Visual Studio 2010 was selected as the development environment platform with coding in Visual Basic. This is an environment for which a licence is available at the JRC. 2.3 Database and other related information A database is going to be used for this tool as the source for all event data. The results are not stored in the database but they could be copied, printed and saved as textual files for further usage. Tables in database and reported results are later fully described as they are implemented. Even more information about database tables, computing approach and coding is available in the Appendix. The events coding was based on existing experience at the OE Clearinghouse (CH), US Nuclear Regulatory Commission (NRC), International Reporting System (IRS) and World Association of Nuclear Operators (WANO), ([5], [6], [7], [8], and [9]). Table 1 presents complete list of parameters used for statistical reports and ranking with respected number of attributes and where is used (Statistical reports, Grouping or Ranking). Table 1 List of events and groups parameters used for database and ranking tool Parameter Description (format or number of different values) Use! Plant unique plant designation S Vendor Supplier of the nuclear and steam side S Reactor Reactor type S Status of the reactors when event occurred (11) S Time time when event happened (dd.mm.yy hh:mm) S Group staff involved, or likely to learn from event (4) S Activity performed when event occurred or detected (23) G Direct cause of the event (9) G Systems malfunctioning, failed, affected and degraded (10) G3 Components malfunctioning, failed, affected and degraded (7) G3 Root cause/ Casual factor multiple characterization (20) G3 Consequences caused by event (10) R3 Category broad event categorization (8) R Multiple number of affected elements or common cause/mode (4) R Safety estimated conditional safety relevance (3) SD/O ext. duration of shutdown or outage caused by event (h) R Frequency # ratio of events in group to total (-) R Trend change of the events number over several years (-) R * Page 6 of 64


10 ! All parameters are used for Statistical reports and some of them are used for Grouping or Ranking. Number 3 means that event could have up to three parameter values, one value is always Safety relevance is important: it is judged if explicit information in the report is not available. # Frequency is characterizing number of events in the group. * Trend is not event parameter but calculated value for the group of events over time. A Microsoft Access database is used for storing data of all events and respected characterisation. Characterisation was performed using MS Excel for the initial events. Figure 1 presents all tables in the tool's database. The central table is [OPERATE] and all other tables are used as reference sources for respective characterisation and other parameters description. This approach makes central table more compact for large number of events and easier to convert data created outside (important for characterisation). The complete list of parameters and attributes is provided in the Appendix 8.2. together with the description of all the tables in the database. Relevant elements of the database and characterisation are further referenced in the report as needed. Figure 1 Tables present in the MS Access database with events and coding description Page 7 of 64
11 2.4 Use cases Before further development it is important to define so-called use cases (i.e. the way how the user will interact with the application) at high level. The tool usage is not always linear and that will be taken care of later during the implementation. A description is made for the database application. 1. Characterised events should be imported into the database. This is easiest done with MS Access by opening the database and using available functionality. It is possible to develop a special functionality inside the program but this could be implemented in the future if really necessary. Two data sources could be used: XLS or simple text (generated from XLS source). It is important that data columns and field formats match what is defined in the database (i.e. table [OPERATE]). 2. After the events are imported and the database is ready the OPERATE application could be used without any additional action from the user. The user is now able to generate statistical or ranking reports on the screen and print, copy or save them to the file. Reports stored to the file are textual and could be used for documentation and further processing (in XLS etc.). Graphics from the screen could be printed to the printer or to the file (choice of format is depending on the available drivers). 3. There are options for the user to make changes regarding the ranking. First, the user could change the relative importance of the RIs from the predefined values. Second, the user can change the level of sensitivity and uncertainty. Both these changes are influencing the ranking results and it is up to the user to navigate through all the different choices and make his conclusion about the results. All reported results contain these reference data. 4. All four modules could be used without a strict order. However, ranking depends on the RIs comparison and this is possible because of the default values. In order to better explain the approach and the most appropriate or simple way to use the tool, a so called use tree is also provided. The best way to get familiar with the tool is just to use it because it is developed as a window-based application with graphical user interface. The suggested application use tree is as follows below. 1. OPERATE started - database automatically loaded from default directory with the name shown at the bottom. If not, it should be opened by the user. 2. From the Reports menu produce Statistics, Ranking and Confidence reports. Ranking and Uncertainty is based on the default values for AHP and range, and they could be generated after the user makes changes to the AHP and range values. 3. Four application tabs (i.e. Stats, AHP, Ranking and Confidence) allow the user to view results and to see how certain changes (AHP and confidence range) influence the ranking. From each tab it is possible to make a copy or print the results. It is clear that many details could be implemented with different levels of flexibility, and that after final implementation it will be clear what is left for future improvement and development. This is related both to the use cases (i.e. flexibility and number of choices) and method (i.e. quantification approach for weightings and uncertainty) implementation questions and treated later in a separate section. Page 8 of 64
12 3 Tool development The tool development describes all aspects of the application related to the method applied. There are four different parts and each is described in separate section. This introduction explains how individual parts are connected. After the database is accessed (automatically or manually) statistical reports are available without any action from the user. Ranking is also available immediately if the user accepts the default weighting estimates for RIs. Alternatively the user could go to the AHP part and change that. The user is also able to allocate different weights to each of these ranking parameters thanks to the Analytical Hierarchy Process part where these weights are calculated from the pairwise comparison of all ranking indexes. The level of confidence in the results obtained is then evaluated with confidence (uncertainty and sensitivity) analysis. Here the user can accept the default range or set some other value separately for uncertainty and sensitivity. The tool is designed with an intuitive user interface for on-screen, text, graphical and file reporting options. The program consists of four different parts: Statistics, AHP (expert), Ranking and Confidence (expert). The Statistics part presents reports for all parameters which are used for grouping and ranking plus for the following parameters: Vendor, Reactor type, Status, Group of staff and Time of event (yearly, monthly, daily and hourly). In the AHP (expert) part of the application, the user can perform pairwise ranking comparison for the program to calculate the allocated RIs weights. The program also provides consistency ratio (CR) for resulted weighting (pairwise comparison is considered inconsistent if CR value is >0.01). Ranking is then performed on the basis of the AHP results. The Ranking part determines the total and groups ranking on the basis of the AHP and ranking weights values for five event groups, both separately and together. Finally, the Confidence (expert) part calculates the uncertainty and sensitivity for the event groups ranking, both separately and together. This is done by repeating the ranking for changed RI weighting. For each RI two additional cases were calculated with increased and decreased weighing by selected factor. Based on confidence results the user can go back on the AHP module and change the RI relative importance comparison in order to better reflect their importance and impact on the final ranking order. All results can be copied, printed and saved to the file. This allows results to be incorporated into a report or used as a basis for some additional assessment. Results from real demonstration set of five years of US NRC LERs are presented to prove that the method is working and that the tool is providing interesting and valuable results. Page 9 of 64
 Total number of events, years (Figure 2)")
13 3.1 Statistical reports The tool has 19 statistical reports available: 1. Number of events per year: a) Total number of events, years (Figure 2); and b) Number of events per plant, per vendor and per reactor type. 2. Distribution of events based on the time of occurrence: a) Monthly: the total number of events having occurred in each month during the year (for all years); b) Daily (i.e. Mon/Tue/ /Sun): the total number of events having occurred on each day in the week; and c) Hourly: the total number of events having occurred in each hour of the day (1-24). Notice: some events do not have a value for the time of the event occurrence. 3. Distribution of the shutdown/refuelling extension time duration as a number of events for certain hours duration interval: 0, >0-1, >1-4, >4-24, >24-72, >72-240, >240). Notice: some events do not have a value for this parameter and others have a value (negative value in the database) estimated during the characterisation. 4. Distribution of the total number of events for all other fields (parameters from OPERATE table): Category, Status, Group, D. cause, Dep. failure, Safety, Conseq. System, Component, RC&CF. Counting for the last four parameters is also done separately for each field since they can have one, two or three values. All 19 statistical reports are illustrated in the Appendix subsection 8.3 with screenshot from the tool. Page 10 of 64
14 Figure 2 List of available statistical reports and graph showing the number of events per year. 3.2 Grouping and ranking indexes determination The ranking method implemented in the tool requires a defined fixed scheme for events characterization and a consistent ranking algorithm. For this approach the events characteristics format in the database was defined on the basis of the accepted coding format from well-known and respected sources (IAEA IRS in Zhang et al., 2011; and WANO in Revuelta, 2004) with small changes in respect to the total number of possible values and several specific parameters. This means that the total number of possible values for all parameters is limited compared to, for example, the IRS coding format. The main reason for this was that a too big number of values for parameters is not optimal for grouping and ranking. In addition to that, it is also practically over-demanding for an events characterization. The ranking algorithm consists of ranking indexes values quantification and their relative importance determination. The relative importance is determined by the use of an analytical hierarchy process (AHP). The final ranking value is determined by the sum of ranking indexes values modified with respect to their relative importance. The details about events characterization and ranking algorithm are presented below Events characterization Based on the reference sources and the goal to optimize a number of parameters used for events characterization, a final list of parameters is determined and applied to a selected set of US NRC LERs. Table 1 (in previous section) presents all parameters used for events characterization in the ranking database. This characterization format has in total almost 120 parameters values, and the majority of them are for grouping purposes. A complete characterization of events from the database allows their groupings based on attributes for five selected grouping parameters, i.e.: Activity, Direct cause, Systems, Components, and Root cause/causal factors. Table 2 presents a complete set of values for one group. All groups have a predefined set of categories. The characterization is also the basis for values of seven ranking parameters defined as follows: Category, Multiple, Safety, Shutdown/outage extension, Frequency and Trend. Table 3 presents all values for one ranking group. All ranking parameters have a predefined set of categories except the last three. For each grouping, the respective categories are ranked on the basis of the ranking parameters (further referred to as indexes) and applied algorithm. This is further explained in the following subsection. The parameters and respective values (categories) determine the complete base for grouping and ranking.. For this analysis it was necessary to perform characterization on already collected data. Four European Commission experts of the Clearinghouse (i.e. A.L. Guerra Munoz, D. Kancev, S. El Kanbi, and R. Sanda) were engaged in the characterization process. This was important not just to prepare the demonstration and tool testing database but also to help gaining necessary experience points to the resources requirements and the need for verification (consistency etc.). For the characterizations of Page 11 of 64
15 the close to 1500 events required, resource were not insignificant (approx. 8 man-months) but if characterization is an integrated part of the data collection process then the required resources should be reduced. Characterization quality is also an important issue and it could be improved by experience and by user friendly software implementation. Table 2 List of all attributes used for of the Activity parameter event characterization 1. Not relevant 2. Normal operations 3. Shutdown operations 4. Equipment start-up 5. Planned / preventive maintenance 6. Isolating / de-isolating 7. Repair (i.e. unplanned / breakdown maintenance) 8. Routine testing (of existing equipment) with existing procedures/documents 9. Special testing one-off special procedure 10. Post-modification testing 11. Post-maintenance testing 12. Fault finding Each event could have one two or three different attributes. Human factors: 1 10; Management: 11-18; Equipment: Commissioning (of new equipment) 14. Recommissioning (of existing equipment) 15. Decommissioning 16. Fuel handling / refuelling operations 17. Inspection 18. Abnormal operation (external/ internal constraints) 19. Engineering review 20. Modification implementation 21. Training 22. Actions taken under emergency conditions 23. Other Table 3 List of all event characterization attributes used for of the 'Category' parameter 0 Cancelled, incomplete or otherwise irrelevant event 1 Severe or unusual plant transient 2 Safety system malfunctions or improper operations 3 Major equipment damage 4 Excessive radiation exposure or severe personnel injury 5 Unexpected or uncontrolled release of radioactivity that exceeds on-site or offsite regulatory limits 6 Fuel handling or storage events 7 Deficiencies of design, analysis, fabrication, construction, installation, operation, configuration management, man-machine interface, testing, maintenance, procedure, or training 8 Other events involving plant safety or reliability Equipment performance Ranking algorithm The rank for each category of events for each grouping is determined on the basis of the value and relative importance of the categories ranking indexes. Therefore the ranking is performed after following three steps: (1) events grouping, (2) ranking parameters value determination (for all groups in each category), and (3) ranking indexes importance determination. Grouping is the first step which consists of allocating events based on the selected groupings and respected categories. This means for example that events will be allocated into 23 categories for the Activity group (Table 2). The result of this step is presented as an illustration for a few parameters in the group [Direct cause]. The first row shows the total number of events for each ranking index and the following rows show ranking indexes for each attribute in the group (i.e. 0, 100,, 800). All ranking indexes Page 12 of 64
16 but trend have to be calculated from the number of events. Trend, also has to be scaled to the range between 0 and 1. Table 4 Example of the intermediate values for grouping based on the parameter Direct cause P RI_Freq RI_Trend RI_Ext RI_F.dep RI_Safety RI_Cat RI_Cons Total 942 na After events grouping for each category, seven ranking indexes values are quantified. All ranking indexes values, except for Trend, are determined as ratios between the number of events in a category and the total number of events in the group. A Trend RI is representing the measure of how the number of events changes for each category during the analysed period. It is calculated on the basis of the LSQ (Least-squares) line fit derived from minimizing the sum of the squares of the residuals (i.e. difference between line and real data). Table 5 presents all ranking indexes description and the general quantification formula. All ranking indexes have a quantified value between 0 and 1. For Trend RI this was accomplished with transformation, which makes the value 0.5 representing 'no change' of the number of events in a category during the analysed period and a higher or lower value represents an increasing or decreasing trend. This means that Trend RI values close to 1 have an increasing trend and values closer to 0 have a decreasing trend. Table 5 List of ranking indexes with definition and calculation formula Parameter Definition Formula Consequences Category Failure dependency Safety SD/O Extension Frequency Trend Ratio of the number of events in the group with selected attributes (i.e. 2, 4, 5 and 8) and total number of events with these attributes *. Ratio of the number of events in the group with selected attributes (i.e. 1, 2 and 5) and total number of events with these attributes. Sum of attribute values (0 - Unknown, 1 - Single, 2 Mult. independent, 3 Mult. dependent, common cause/mode) for events in the group divided with the total sum of these attributes for all events. Sum of attribute values (0 No safety relevance, 1 Low safety relevance, 2 High safety relevance) for events in the group divided with the total sum of these attributes for all events. Sum of all extension time for events in the group divided with sum of extension time for all events. Ratio of the number of events in the group divided with total number of events. Presented by the LSQ line fit of the change for the number of events across years in consideration. Approximation is made using leastsquares regression. Final trend index is calculated using line coefficient (k, where y is the number of events for year x) with normalization between 0 1 (0-90 o and 1 90 o ). Values smaller than 0.5 are for declining and larger for increasing number of events. k G 2,4,5,8 /T 2,4,5,8 G 1,2,5 /T 1,2,5 Group Group Group M S T All All All N Group /N All M S T = n x iy i x i y n x i 2 ( x i ) 2 Tr. = atan(k) + 1 π 2 Page 13 of 64
17 Note: all ranking indexes have a range between 0 and 1. * For categories where more than one attribute could be assigned to one event all are counted. The third step is determining the relative importance (weight) for all seven ranking indexes. Depending on the ranking purpose or the expert view different ranking indexes might be more or less important. In order to make ranking more consistent and transparent the ranking indexes weights should ideally be determined with some appropriate method for such a high number of parameters. The analytical hierarchy process (AHP) from the decision-making field presents an adequate choice. The AHP method was introduced with the main purpose to simplify the process of determining the relative importance of a large number of parameters in a multi-criterion hierarchical decision problem by reducing it to the level of pairwise comparison. Many different fields (e.g. engineering, manufacturing, industry, government, social sector and education) use AHP for various types of problems (e.g. priority and ranking, benefit-cost analysis, allocations, planning and development), (Subramanian & Ramakrishnan, 2012). Here follows a short description of the AHP method (Saaty, 2008) and the implementation used in the tool. The core of the AHP is that it determines the relative importance for an unlimited number of indexes requiring only their pairwise comparison. If we assume that we are comparing n elements (ranking indexes in our case), E 1... E n and we use value a ij to denote a priority of significance of element E i with respect to element E j then the pairwise comparison table is formed with the following constraints: a ij = 1/a ji, for i j and a ii = 1, for all i (1) This forms the reciprocal square matrix A = (a ij ) of order n where pairwise comparisons are consistent only if they are transitive, i.e. a ik = a ij a jk for all i, j, k. The usual range for comparison values is between 1/9 and 9. For a consistent matrix there is a principal eigenvalue which is the same as the matrix order, i.e. λ = n and we can find eigenvector ω such that Aω = nω. Since human judgment is expected to be inconsistent to a greater or lesser degree for a larger number of elements the transitivity relation does not hold on the pairwise comparison table. In this case the principal eigenvalue λ which belongs to eigenvector ω satisfies condition λ n. The difference between λ and n is an indication of the inconsistency in judgments and can be measured by the so called 'Consistency index' (CI) with the following formula: CI = (λ-n)/(n-1). The CI needs to be compared to completely random judgments and Saaty has calculated the CI of such random judgements for different values of n. Then the ratio between the calculated CI and the CI from Saaty's table of order n makes the 'Consistency ratio' (CR): CR = CI/CI Saaty Saaty suggested that we accept judgments about pairwise relative importance as acceptably consistent if that ratio does not exceed 0.1, otherwise the judgments may be too inconsistent to be reliable. The CR equals to zero means that the pairwise comparison table represents perfectly consistent judgments. (2) Page 14 of 64
18 The major issue in AHP calculation is the principal eigenvector determination. There are many methods for determination of the principal eigenvector and the corresponding eigenvalue. The tool uses an approximate method based on repeated squaring of the pairwise matrix and normalizing the sum of each row from the resulting matrix. At the end of this iterative process the normalized row approximates the principal eigenvector ω elements from which the principal eigenvalue may be calculated by the equation λ = Aω / ω. Finally, the elements of the principal eigenvector give us the relative weights of our ranking indexes. The final ranking value for each group RV Gi is quantified by the sum of ranking indexes values RI j derived from the data normalized and modified with weights w j from the AHP: RV Gi = 7 j=1 RI j w j Figure 3 represents the AHP part of the tool as implemented with pairwise comparison, resulting weights and relative importance matrix. It is important to note that this should be used only by someone familiar with the method and for all others default values are built in the tool (as seen on the screenshot below). (3) Page 15 of 64

19 Figure 3 The analytical hierarchy process (AHP) part of the tool where pairwise comparison of all ranking indexes is used in the tool. The user can change this with his knowledge of the AHP method or just use default values and proceed to the ranking. With defined RIs the weights ranking is determined on the basis of the total ranking value. Table 6 and Figure 4 present these results for the Components group. The textual report presents the complete information with the weight values for each RI, and the total ranking value for each member of the group. Before the final ranking value is quantified (eq. 3) all RI values are renormalized on the basis of the maximum value for each RI. This is done considering all the groupings in order to make comparable ranking values. There are certainly other ways to perform this but with this approach it is possible to make the total ranking across all groupings. The utility of this result might be debatable since these grouping are overlapping and therefore this should be viewed as with caution. The details about individual RI values for each group member provided in the Table 6 are not necessary to use the results. They are provided for someone interested in precise contributions from each RI and also as a base for a potential different way of assessment. Page 16 of 64
20 The full textual report which could be saved from the tool provides also intermediate results from the event counting (like presented in the Table 4) and this could also serve as a base for some additional different way of analysis. The results for all groups individually are presented in Appendix Table 6 List of ranking indexes with definition and calculation Components group, AHP Ranking Indexes weights: 0.Fr. 1.Ex. 2.Mu. 3.Sa. 4.Ca. 5.Co. 6.Tr CR value: # Par. TR GR RV nfr. nex. nmu. nsa. nca. nco. ntr. Group Parameters description for the Component ID Description 0 Unidentified, no specific component involved or where in-appropriate human action is the direct cause of the event. 100 Instrumentation. 200 Mechanical. 400 Electrical. 500 Lifting devices. 600 Nuclear assemblies. 700 Computers (HW / SW). 800 Civil structures. Page 17 of 64
 analysis In order to use the results from any model it is important so have an estimate about confidence.")
21 Figure 4 Ranking results for Components group 3.3 Ranking confidence (uncertainty and sensitivity) analysis In order to use the results from any model it is important so have an estimate about confidence. This could be provided with a sensitivity and uncertainty assessment. In this model uncertainty is coming from the initial events reports, their database characterization and the ranking indexes weights determination. The model results are sensitive to the ranking indexes quantification and pairwise comparison. The model described in this report has, in this phase, selected uncertainty and sensitivity, accounting true uncertainty and sensitivity quantification of ranking influenced by ranking indexes changes. This is considered sufficient to identify the robustness of the resulting ranking. Uncertainty is considered by repeating the ranking after increasing and decreasing the AHP derived weighting values for all seven ranking indexes. This also creates 14 additional rankings. If for example the uncertainty value is u (e.g. 33%) then new weights for the ranking index j are w j (1+u) and w j (1-u). Other RIs weights then have to be corrected by c following the restriction that the sum of all weights has to be equal to 1. The following equation is for the case of increased weighting value for the ranking index i, and it is similar for the decreasing case: 1 = w i (1 + u) + c w j 7 j=1,j i (4) Page 18 of 64
22 c = 1 w i (1+u) 1 w i Sensitivity of ranking order is considered by repeating the ranking after setting the AHP derived weighting values to the selected extreme value for all seven ranking indexes. These will also create 14 additional rankings. If for example the sensitivity value is s (e.g. 0.33) then the new weights for the ranking index j are s and (1-s)/10. The weights for the other ranking indexes are then set to the remaining averaged value for each case as (1- s)/6 and [1-(1-s)/10]/6 respectively. One additional ranking is performed with all RI weightings set to value 1/7 for both the uncertainty and sensitivity assessment. With the ranking based on the AHP weighting this makes a total of 16 uncertainty and sensitivity assessments. The uncertainty and sensitivity results could be at first judged only from the maximal and minimal ranking position achieved for all groups and then if needed they could be judged in detail by looking for the ranking index weighting changes with the most significant influence. This approach is perhaps sufficient at the beginning but it is clearly rather limited because the AHP consistency index is not verified for the new weightings and the number of variations is far from exhaustive. Further improvements could be planned for the future based on the results from more practical applications. Figure 5 shows the tool screen for the Top 20% ranked. The full report for one group is presented in Appendix (5) Page 19 of 64

23 Figure 5 Example for Confidence part of the tool results for sensitivity of Top 20% ranking 3.4 Ranking tool application While relying on the database with the characterized events and implementing the AHP method, a special tool is developed in order to allow interactive event groups ranking. The tool is developed using Microsoft Visual Studio and named OPERATE (Operating events ranking tool). There are four parts (i.e. Statistical, AHP, Ranking and Confidence) in the tool with many textual and graphical on-screen and reporting capabilities. The Statistics part presents 19 reports for all parameters describing the events in the database. Figure 2 illustrates this part of the tool with one report. In the 'AHP (expert)' part of the tool the pairwise comparison is performed as an input to the weighting determination with the AHP quantification. Figure 3 presents default values which the user can change, allowing to form a different judgment. If the comparison is changed so that the AHP consistency check is not satisfied, this will be visible at the bottom of the screen and the consistency ratio becomes red for values >0.10 (as described in the previous section). Here 'expert' is meant that the AHP comparison should be changed only by the user who is well aware of the whole methodology. Page 20 of 64
24 The ranking part presents results for all five groupings, separately and together, based on the AHP determined weightings for the ranking indexes. The screen and reports present numerical and graphical ranking results with background data (e.g. ranking indexes, weightings and values). Ranking is determined for each group inside the grouping and across all groups, Figure 4. The uncertainty and sensitivity assessment is presented in the 'Confidence (expert)' part. Here the user is able to see the ranking results for sixteen selected assessments, as described in the previous section, for each grouping for uncertainty and sensitivity. The default value is 33% and the user can change that between 0 and 100%. On the total level the uncertainty and sensitivity assessment is also possible for the top 20% groups (15 in total). Figure 5 presents the tool's screen illustration for this part. The uncertainty and sensitivity results are helpful to spot the potential for further refining of the ranking indexes weights or perhaps for expanding the list of the most important groups if the uncertainty is large or the sensitivity significant. Each part of the tool is accessible independently in a flexible way. However, the idea is that the user can easily go back and forth in order to improve the whole picture and make a final ranking and an overall assessment. The results from all parts of the tool are available as text and graphic in order to allow further assessment and easy reporting. In that way it is easily possible to do some additional assessment (e.g. ranking with completely arbitrary ranking indexes weights) or to present combined results in different ways which are not supported by the tool (e.g. frequency data together ranking results). The appendix contains much more examples of the tool's different parts with result from the event database used for the demonstration. Page 21 of 64
25 4 Results Five years of U.S. NRC LERs from 2007 to 2011 were used as an input for the ranking method testing (U.S. NRC, 2013). In total 1453 events were characterized, grouped and ranked. Considering the events grouping according to 5 parameters (see section 3.2.1), the uncertainty and sensitivity assessment and the large number of statistical reports available from the tool, this report presents the most important results and is at the same time an illustration of the method. The next section presents selected results and the following section provides for discussion regarding the method and the findings. 4.1 Selected results After applying the ranking method with AHP weightings, ranking results are available for all 5 grouping parameters and they can be viewed together since all the total ranking values are normalized. All the results presented are based on the default AHP values as shown on Figure 3. According to the default comparison the most important ranking index is Extension (weighting = 0.28) and the least important is Frequency (weighting = 0.05). Other ranking indexes have weightings between 0.11 and The consistency ratio is equal to 0.085, which is acceptable. The top 20 groups between all groupings are presented in Figure 6 (higher ranking = higher rank). The graph also presents the contribution from each ranking index (after applied weighting). Even though the comparison of groups ranking among different groupings is questionable, this presentation is selected because it shows a compact overview for all results. The respective grouping name and group description is provided in Table 7. The top ranked group is 0.5 (Activity - Normal operation) with ranking value 0.95, and the second top ranked group is (Components - Mechanical) with ranking value Page 22 of 64
26 Trend Consequence Category Safey Failure dependency Extension Frequency Figure 6 Ranking values for the top 20 groups (described in Table 7) with contributions from all RIs. The total ranking and the ranking values (in %) are also provided in Table 7 with additional information about ranking in the respected groupings and ranking(s) from the uncertainty assessment. Uncertainty is performed for the 33% change. The results are presented with groups together with respective grouping. All five groups are represented with respective most important groups. Only six groups have changed ranking from the uncertainty assessment for their groups ranking, in the same way as with the AHP weightings. For example group (Root cause Written procedures and documents) is ranked in respective groupings with AHP weighting as the 2 nd and uncertainty assessment is resulting with the highest rank as the 1 st and lowest as the 3 rd. Group is the 15 th in the total rank. More detailed results are available for the uncertainty assessment where ranking weighting change related to ranking change could be identified. For example Figure 3 shows a total ranking change from the same 33% uncertainty assessment. Table 7 Ranking results top 20 groups ranking with AHP and 33% uncertainty ranking indexes weighting TR RV% GR, AHP / 33% Uncertainty Grouping Group description / same 0. 5 Normal operations / same Activity 25 Routine testing with existing procedures / documents / same 200 Electrical deficiency / same 100 Mechanical deficiency / same 400 Hydraulic and pneumatic deficiency. Direct cause / same 800 Human factor / same 500 Control and Instrumentation deficiency / same 200 Reactor auxiliary systems / same 400 Electrical systems / 3-4 System 100 Primary reactor systems / Feedwater, steam, condensate and power conversion sys. Page 23 of 64
27 / same 300 Essential auxiliary systems / same 700 Instrumentation and control systems / same 200 Mechanical components / same 400 Electrical components. Component / same 100 Instrumentation components / Maintenance, testing and surveillances / 1-3 Root cause / 700 Written procedures and documents / 1-4 Causal 2300 Design configuration and analysis / 3-4 factor 2000 Equipment performance. TR Total ranking with AHP weighting values. RV Ranking value in %. GR Ranking for separate grouping with AHP and 33% uncertainty ranking indexes weighting As for insights, it could be inferred which groups are very important (Table 7). Among 23 Activity groups (i.e. Normal operation; and Routine testing, with ranking values 95% and 49% respectively) two are distinctly more important because the 3 rd ranked group has a ranking value of 26%. Four groups for Direct causes (Electrical, Mechanical, Hydraulic/pneumatic deficiencies and Human factor) are at the top with ranking values between 59% and 39%. The four groups for Systems (Reactor auxiliary, Electrical, Primary reactor and Secondary) are even more closely ranked with ranking values between 41% and 35%. The two groups of components (Mechanical and Electrical) are distinctly more important with ranking values of 87% and 59%. Finally, one Root cause (Written procedures and documents) and three Causal factors groups (Maintenance, testing and surveillance; Design configuration analysis; and Equipment performance) are more important (with ranking values between 28% and 25%) than the rest of groups (next ranked group has a ranking value of 18%). Besides the ranking results there are also some interesting results available from the statistical part derived from the characterized events database. For example the distribution of the number of events over time on different scales: during the year, week or day. During the year average number of events per month is 24 where three months (April, May and October) have ~25% more events and other three months (July, August and December) have ~25% less events than average A more detailed presentation of these results is left out of this report for brevity. 4.2 Discussion The numerical results provide transparent information about the relative importance of different event groups on the basis of the importance of selected ranking indexes. The graphical presentation of ranking results shows how close some ranking results are. For example, the first two ranked groups are clearly separated from the next three etc. (Figure 6). This might also be reflected in the ranking changes resulting from uncertainty or sensitivity assessment and a final conclusion about the group importance should reflect this. For example most of the groups from the 11 th place (for total ranking) and afterward are affected from uncertainty assessment with 1 or 2 ranks change (Table 7). Page 24 of 64
28 The uncertainty and sensitivity assessment, as implemented, shows that ranking results are stable. However, as mentioned before, an additional 15 variations are not checked for AHP consistency and they are far from being exhaustive. This remains for potential future investigation. Perhaps in the future some cross-verification between different experts might be useful for characterization or identification of critical parameters if they exist. An important issue is related to the events characterization consistency verification. This was not done in the present work. However, it seems that the distribution of dominant event groups is similar to other approaches performed independently (Revuelta, 2004). It seems promising to further develop the tool's functionality with an analysis of events which are present in more than one high-ranked group from different groupings. This way, events with potential for further investigation might be reduced and selected in a more appropriate way. All ranking results together with numerous statistical reports and tool interactivity seem to offer a rich and informative solution which can complement and enhance the operating experience feedback creation process. Page 25 of 64
29 5 Further development The method presented is applicable to any set of events from the operating experience of nuclear power plants. It is important to realise that the specification of the events characterisation has to be the same on the application as on the database side. This means that either some different database has to be adjusted or the tool has to be modified. This requires a certain effort before any analysis is possible. The level of required effort depends on the discrepancies between the characterisation currently implemented in the tool and the specification of the new database. There is a potential to further develop the tool to make it easier to adapt to a different database specification. However that should be seen as a question specific to any new potential application. The other potential change in the tool is related to the ranking method, because the current application is only one possible implementation of the base method for events grouping and ranking. The method itself could be improved and the specific implementation could be changed. This is a general source of potential future changes to the application. Some more specific potential changes for future development are listed here: 1. Options for the user to save specific settings (e.g. AHP comparison and uncertainty values). 2. Using a different uncertainty quantification approach (e.g. exhausting whole acceptable space for the RI comparison values etc.).. 3. More detailed and customised reporting (e.g. more graphics, yearly data, only the first parameter for System, Components and Root Cause & Causal Factors). 4. The events data characterisation and input could be further improved (including full WANO detailed characterisation for large database with many events) depending on the application and the user preferences and data sources (as mentioned before). 5. Weighting values for ranking indexes for more than one expert opinion with combined results. 6. Formulas for ranking indexes calculation could be changed with fixed or flexible options. 7. New parameters, ranking indexes or grouping could be introduced. This depends on the characterisation and could be useful for different databases. 8. Automatic events data import from the tool and other data processing improvements including data mining. 9. In cooperation with WANO: assessing their vast collection of events. All these potential future developments could be interrelated or separate projects which require a more detailed description and specification. They all require tool changes and some of them require database changes or even additional event characterisation. A list of statistical reports and ways of grouping could be optional, but for the first implementation the full selection is implemented. Page 26 of 64
30 6 Conclusion A statistical tool for operating events database reporting with a method for grouping and ranking event groups using AHP method for determining the importance of ranking indexes is demonstrated with five year of real experience. The statistical tool has a total of nineteen reports. The ranking approach developed provides traceable ways of prioritizing event groups on the basis of the contribution from seven ranking indexes for five different event groupings. The implemented methodology also includes uncertainty and sensitivity assessment regarding the influence of ranking indexes weighting changes on the ranking results. The results presented from the analysis and assessment of the real events from nuclear power plants operation illustrate the described ranking approach and give insight into the potential benefits for the further practical application of this tool. The future work could be oriented towards additional applications and demonstrations of the methodology on different databases and towards further methodology development. Additional demonstrations will help the operating experience feedback development and the methodology testing. The most important elements for development seem to be in the area of event characterisation and confidence. As of characterisation advancement it seems interesting to test the method on the more detailed groupings and identification of events which are at the cross-section of high ranked groups from different groupings. A more complete uncertainty and sensitivity assessment could be accomplished with consistency index checking and a more complete set of variations assessment. This effort demonstrates that more elaborate event characterisation provides numerous interesting and valuable statistical reports and that a quantitative event groups ranking application seems a promising complementary tool in the process of creating operating experience feedback. The methodology presented and the tool implementation seem to demonstrate a potential for events exploration, education and identification of the most important groups for further detailed investigation. With a developed interactive application this presents a valuable tool for learning about events and making informed conclusions and decisions regarding further investigation prioritization in the area of better and safer operation of nuclear power plants. Page 27 of 64
31 7 References [1] Zdenko ŠIMIĆ, "Operational events groups ranking with application to 20 years of French and German experience", PUBSY , Mar [2] Zdenko ŠIMIĆ, Michael MAQUA, Didier WATTRELOS, "A model-based approach to operational event groups ranking." Kerntechnik 79, no. 2 (2014): [3] Zdenko ŠIMIĆ, "Operational Events Groups Ranking Sensitivity Analysis", ESREL 2013, PUBSY , May [4] Zdenko ŠIMIĆ, Benoit ZERGER, Reni BANOV"Uncertainty Analysis of Methodbased Operating Event Groups Ranking ", Science and Technology of Nuclear Installations, [5] U.S. Nuclear Regulatory Commission [U.S. NRC] Licensee Event Report Search (LER Search), (July 2013) [6] IRS Guidelines, Joint IAEA/NEA International Reporting System for Operating Experience, Services Series 19, IAEA, Vienna, March 2010 [7] Revuelta, R, Operational experience feedback in the World Association of Nuclear Operators (WANO). Journal of hazardous materials, 111(1), [8] International Atomic Energy Agency [IAEA] Best Practice in Identifying, Reporting and Screening Operating Experience at Nuclear Power Plants, TECDOC 1581, Vienna, Austria [9] Zhang, B., Chen, R., Sun, G., Xiao, Z., and Yang, D An Overview of IAEA Incident Reporting System. Nuclear Safety 1 (2011): 007. [10] Subramanian, N., Ramakrishnan, R A review of applications of Analytic Hierarchy Process in operations management. International Journal of Production Economics,, 138.2, Page 28 of 64
32 8 Appendix Additional more detailed information for different parts of methodology and tool development and results is provided in this Appendix. 8.1 Events characterisation This section provides some details about the process of events characterisation. Data source for first demonstration set of events was chosen based on the availability, completeness and significance. Suitable and dependable source was found in the US NRC LER database which is available online. Five years of nuclear power plants LER events was selected for characterisation and use in the OPERATE. The following is practical description of characterisation process. Selected years are from 2007 to Characterisation was performed by four EC JRC IET NRSA experts with parallel approach (i.e. each year was split in four parts). Table 8 Number of characterised US NRC LER data and assigned experts per quarters Year / Quarter st 64, R 64, A 79, A 79, A 81, A 2 nd 65, D 65, D 80, D 80, D 85, D 3 rd 65, R 66, R 80, S 80, S 79, S 4 th 70, R 67, R 82, R 78, R 79, R Total A Arcadio; D Dusko; R Radian; S Samir Characterisation was managed in the way that all events were listed in the MS Excel spread sheet with columns for each parameter. Attribute code was incorporated as dropdown list with checking capability for validation. However, validation was not covering missing entries. Cancelled events were assigned with 0 value for the Category column. Two tables bellow are documenting characterisation results in this regard. First one provides total level statistics, and second table lists specific events which are identified for reconsideration. These quarterly characterisation tables were first checked for problems, aggregated in to the respected year table, integrated for all years in to the final table which is imported in to the database. Events in 2007 which happened before (i.e. 6 LERs in 2006) were disregarded. The same was for all other years. This is because only five years is characterised and these events are in the year which is not characterised. This issue will be resolved fully after characterisation expands to the years before So, all LERs before 2007 were just deleted from the database for this initial evaluation. Counting of irregularities was done for each years table at the bottom of respected column. There was ten events which were outside the scope of analysed time frame (i.e. before 2007). All but two were from 2006, and one from 2002 and They were not included in the database. This is not significant. Page 29 of 64
33 Total considered number might not be precise because of these events before Table 9 Number of special events not considered and other Year Total Not considered Events before 6/6 0/4 2/13 0/12 0/18 WO Time W0&"" SD_OE W- SD_OE WO SD_OE WO RC_CF Total considered (?) (?) Check what to do about some root causes and causal factors characterisation missing for some LERs (e.g Arcadio, 9 events). Table 10 Event Expert Issue List of special events not considered and other Arcadio Dummy values left in! Missing info for the Humboldt Bay. (USPlantsNew4DB.xls) Arcadio Dummy values left in! Arcadio Missing component! (-> temporary set to 0!) Arcadio Assigned component 300 does not exist Arcadio 'cause unknoown' Arcadio 'cause unknoown' Arcadio 'root cause unknoown' Arcadio 'root cause not identified' Arcadio Assigned component 300 does not exist Dusko Cancelation letter Dusko 'cancelation letter' Arcadio Assigned component 300 does not exist Dusko Assigned component 300 does not exist Arcadio 'root cause not identified' Dusko 'non-existent' Arcadio 'root cause unknoown' Dusko Missing info for the Zion-1. This is Arcadio 'root cause unknoown' updated from new table Arcadio 'root cause unknoown' USPlantsNew4DB.xls Arcadio ' cause not identified' Dusko Missing Component designation! (-> Arcadio 'root cause not identified' temporary set to 0!) Arcadio 'root cause not be determined' Dusko Missing Component designation! (-> Arcadio 'root cause unclear' temporary set to 0!) Arcadio Missing component! (-> temporary set to 0!) Arcadio Missing Component designation! (-> temporary set to 0!) Arcadio 'root cause not identified' Arcadio 'root cause unclear' Arcadio 'lack of info' Missing component! (-> temporary set to 0!) Arcadio Missing component! (-> temporary set to 0!) Arcadio Assigned component 300 does not exist Arcadio 'root cause not identified' Arcadio 'root cause unknoown' Arcadio Component1 empty with filled in other two components designations! Arcadio 'root cause not identified' Arcadio No data -> set to 0 category Arcadio No data -> set to 0 category Arcadio 'root cause not identified' Arcadio 'root cause not identified' Arcadio 'root cause unknoown' Arcadio 'root cause not identified' Arcadio 'root cause not identified' Arcadio Changed category from 8 to 0 because this is Japan Thoku earthquake warning Arcadio 'LER not found' -> assigned 0 Category Arcadio 'LER not found' Arcadio 'root cause not identified' Arcadio 'root cause unknoown' Arcadio 'root cause not identified' Arcadio 'root cause not identified' Arcadio 'root cause not identified' Arcadio 'root cause under investigation' Dusko 'Not available' -> assigned 0 Category Dusko Assigned component 300 does not exist Dusko 'Cancellation letter' -> assigned 0 Category Dusko 'Cancellation letter' -> assigned 0 Category Dusko 'Not available' -> assigned 0 Category Samir 'cancelation letter' Samir 'not relevant' Samir Assigned component 300 does not exist Radian Assigned component 300 does not exist Radian 'cancelled' but category was 7 -> changed to Radian 'cancelled' but category was 7 -> changed to Radian Assigned component 300 does not exist Radian 'cancelled' but category was 7 -> changed to 0 Several LERs Arcadio root cause not identified with filled in value!? Page 30 of 64
34 8.2 Events parameters and attributes Different sources could be used for the event database and it is important to determine and select a preferable set of parameters with defined attributes. These parameters provide consistent event information and are used for different processing. The final list of parameters is presented here, with all the attributes as implemented in the OPERATE database and application. The main source for this list was the Clearinghouse experience, the WANO coding scheme, IRS [5] and NRC LER system. This list is neither comprehensive nor ideal because there are many different questions and possible applications, and therefore any solution has certain advantages for main objectives/purposes but might also unavoidably lack something. Therefore this list is made having in mind different views, flexibility for applications and real practical possibility to find respected values for most of attributes. It is clear that similarity of the coding scheme with the other most respectable systems (i.e. IRS and WANO) allows data exchange. However, because of certain differences regarding some values and format, direct exchange of data is not possible without developing an additional application functionality. It is important also to recognise multiple attributes assignment and some overlap between parameters. This is resolved partly by allowing for selected parameters to have multiple entry, e.g. up to three entries for: Consequence, System, Component, and Root cause/causal factors. The final number of attributes was reduced to the most important subgroups in order to make them not too detailed and therefore easier for characterisation. This has resulted in a compromise solution for some parameters with a too large number of attributes in referenced systems (i.e. IRS and WANO) where only a subgroup level of attributes is applied, i.e. for: Group, Direct cause, Consequences, System, Component, Root cause/causal factor. It is very important to fill all parameters because further processing depends on this. For all parameters with a possibility of multiple (up to three) values at least one should be entered. Page 31 of 64
35 Table 11 Parameters for the events characterisation with respected attributes Parameter Attributes Multy. Event Unique event id in the database: LER NUMBER 1 Title Event title from the source or created (about 10 words) - Plant CODE from the PLANTS tab (e.g. US-222) 1 Vendor B&W, CE, GE, WH, FRAM, 1 Reactor type BWR, PWR, 1 Op. Commercially Date when commercially operation started (auto filled) Country US, FR, GE, RU, GB, FI, (filled in automatically) Description Available from the source (filled in automatically) - Date Local date when event occurred with format (filled in autom.) 1 Time Local time when event occurred with 24h format: hh:mm:ss 1 SD/O ext. duration Category Broad event categorization. Status (of the reactor at the time the event occurred or was detected) Activity (that was being performed at the time the event occurred or was detected) Number of hours of shutdown or outage extension caused by event in fractions (e.g. 8.3). Negative sign is used when this value is not known and only roughly judged (e.g. -120). 0 Cancelled, incomplete or otherwise irrelevant event 1 Severe or unusual plant transient 2 Safety system malfunctions or improper operations 3 Major equipment damage 4 Excessive radiation exposure or severe personnel injury 5 Unexpected or uncontrolled release of radioactivity that exceeds onsite or offsite regulatory limits 6 Fuel handling or storage events 7 Deficiencies of design, analysis, fabrication, construction, installation, operation, configuration management, man-machine interface, testing, maintenance, procedure, or training 8 Other events involving plant safety or reliability 110 Steady power operation 120 Start up operations - reactor critical but < 30% power 130 Increasing power - 30% to 100% 135 Decreasing power - 100% to 0% 140 Hot standby - sub critical and coolant temperature at normal operating temperature 150 Hot shutdown - sub critical coolant temperature < normal operating temperature 155 Cold shutdown- sub critical and coolant temp. < 93 C 160 Refuelling op. or open vessel - all or some fuel inside the core 165 Refuelling operations or open vessel -fuel out of the core 170 Mid loop operation (PWR) 180 Not relevant 0 Not relevant 5 Normal operations 6 Shutdown operations 8 Equipment start-up 10 Planned / preventive maintenance 15 Isolating / de-isolating 20 Repair (i.e. unplanned / breakdown maintenance) 25 Routine testing (of existing equipment) with existing procedures/documents 30 Special testing one-off special procedure 31 Post-modification testing 35 Post-maintenance testing 40 Fault finding 45 Commissioning (of new equipment) 50 Recommissioning (of existing equipment) 55 Decommissioning 60 Fuel handling / refuelling operations 65 Inspection 70 Abnormal operation (external/ internal constraints) 71 Engineering review 75 Modification implementation 90 Training 95 Actions taken under emergency conditions 99 Other Page 32 of 64
36 Parameter Attributes Multy. Group (of staff most involved in, or likely to learn from the event, Table) Direct cause Multiple (failure/error/ plant) Safety (relevance) Consequences (of the event, see table with some examples) Systems (malfunctioning, failed, affected and degraded, see table with detail list of all systems) Components (malfunctioning, failed, affected, degraded) Root/Casal (Root causes/ Causal factors. Human perf. rel.: Managmnt related: Equipment rel.: ) 100 Maintenance, general. 200 Operations, general. 300 Technical and engineering, general. 400 Management and administration, general 0 Unknown. 100 Mechanical deficiency. 200 Electrical deficiency. 300 Chemical or core physics deficiency. 400 Hydraulic and pneumatic deficiency. 500 Control and Instrumentation deficiency. 600 Environmental - inside the plant, abnormal conditions. 700 Environmental - external the plant, abnormal conditions. 800 Human factor. 0 Unknown dependency, 1 Single independent, 2 Multiple independent, 3 Multiple dependent, common cause/mode 0 No safety relevance 1 Low safety relevance 2 High safety relevance 1 Degraded plant operating conditions 2 Plant transient 3 Equipment damage; Fires; Steam generator tube leak 4 Degradation of safety systems 5 Uncontrolled release of radioactivity 0 None of the specified or unidentified. 100 Primary reactor systems. 200 Reactor auxiliray systems. 300 Essencial auxiliary systems. 400 Electrical systems. 500 Feedwater, steam, condensate and power conversion systems. 100 Instrumentation. 200 Mechanical. 400 Electrical. 500 Lifting devices. 600 Nuclear assemblies. 700 Computers (HW / SW). 100 Verbal communication. 200 Personnel work practices. 300 Personnel work scheduling. 400 Environmental conditions. 500 Man-machine interface. 600 Training / qualification. 700 Written procedures and documents. 800 Supervisory methods. 900 Work organization Personal factors Management direction Communication or coordination Management monitoring and assessment. 6 Unforeseen personnel exposure 7 Personal injuries 8 Degradation of a safety barrier 9 Other 10 Non-consequential or near miss 600 Heating, ventilation and air conditioning systems. 700 Instrumentation and control systems. 800 Service auxiliary systems. 900 Structural systems. 950 Waste management systems. 800 Civil structures. 0 Unidentified, no specific component involved or where in-appropriate human action is the direct cause of the event Decision process Allocation of resources Change management Organisational / safety culture Management of contigencies Design configuration and analysis Equipment specification, manufacture, and construction Maintenance, testing and surveillances Equipment performance. & WC Coding from WANO Operating Experience Programme Reference Manual * Group(s) are treated as multiple parameter in the WANO reporting. 1* Y up to 3 Y up to 3 Y up to 3 Y up to 3 Page 33 of 64
37 Table 12 Parameter Database parameters summary and main use Description Group Used to Event unique event id - - Plant Code of the plant - - Vendor Supplier of the nuclear and stem side - - Reactor type - - Comm. Op. Date when commercial operation started - Y^ Date when event happened - Y * Time time when event happened - - SD/O ext. duration of shutdown or outage caused by event - Y Category broad event categorization, 1-8 (8) - Y Status of the reactors when event occurred, (11) - - Activity performed when event occurred or detected, 0-99 (23) Y - Group staff involved, or likely to learn from event, (4) - - Dir. cause of the event, (9) Y - Multiple number of affected plants/ comp./systems/functions (4) - Y Safety estimated conditional safety relevance after event (3) - Consequences caused by event, 1-10 (10) - Y3 Systems malfunctioning, failed, affected and degraded, (10) Y3 - Components malfunctioning, failed, affected and degraded, (7) Y3 - Root cause/ Casual factor multiple characterisation, (20) Y3 - Frequency Calculated ratio of events in group to total Y # Description~ of the event - - Country~ Location - - Rank # The calculated frequency from the number of related events, after grouping, is also used for ranking. & The reactor type would be used for subgrouping (i.e. to select only one type). * The date is going to be used for trending calculation which is used for The safety relevance is important: it should be judged if explicit information is not available. ^ The age of a plant is could be used as a ranking factor (older worse or similar) ~ Not included in the OPERATE application. Available from the database for future use. Note: All parameters are used for sorting and reporting. Page 34 of 64
38 Table 13 Database parameters details regarding database structure and values Parameter Values Type Event e.g. " " nchar 12 Plant e.g. "US-219" nchar 6 Vendor i.e. "B&W", "CE", "GE", "WH" nchar 8 Rtype i.e. "BWR", "PWR" nchar 4 OpCom e.g. " " *?date Date i.e. "22/11/2011" date Time i.e. "14:50" time SD_O_ext e.g. 8.3, -120 real Category 0, 1, 2, 3, 4, 5, 6, 7, 8 tinyint Status 110, 120, 130, 135, 140, 150, 155, 160, 165, 170, 180 tinyint Activity 0, 5, 6, 8, 10, 15, 20, 25, 30, 31, 35, 40, 45, 50, 55, 60, 65, 70, 71, 75, 90, 95, 99 tinyint Group 100, 200, 300, 400 smallint D_cause 0, 100, 200, 300, 400, 500, 600, 700, 800 smallint Multiple 0, 1, 2, 3 tinyint Safety 0, 1, 2 tinyint Cons1, Cons2, Cons3 1, 2, 3, 4, 5, 6, 7, 8, 9, 10 tinyint SYS1, SYS2, SYS3 0, 100, 200, 300, 400, 500, 600, 700, 800, 900, 950 smallint Comp1, Comp2, Comp3 0, 100, 200, 400, 500, 600, 700 smallint RC_Case1, RC_Case2, RC_Case3 100, 200, 300, 400, 500, 600, 700, 800, 900, 1000, 1100, 1200, 1300, 1400, 1500, 1600, 1700, 1800, 2000, 2100, 2200, 2300 smallint Page 35 of 64
39 Table 14 Detailed list of parameters with respected sub parameters from the WANO coding scheme Direct Cause (The failure, action, omission or condition which immediately produced, or led to, the event, WANO 5.8) 0100 MECHANICAL DEFICIENCY 0101 Deformation, distortion, spurious movement, loosening, displacement, loose parts, 0102 Corrosion, erosion, fouling 0103 Overloading (including mechanical stress and overspeed) 0104 Fatigue 0105 Leak 0106 Break, rupture, crack, weld failure 0107 Blockage, restriction, obstruction, binding, foreign material 0108 Wear, fretting, lubrication problem 0109 Vibration 0200 ELECTRICAL DEFICIENCY 0201 Short circuit, arcing 0202 Overheating 0203 Over voltage 0204 Under voltage, voltage breakdown 0205 Failure to change state 0206 Bad contact, disconnection 0207 Circuit failure, open circuit 0208 Ground fault 0209 Faulty insulation 0300 CHEMICAL or CORE PHYSICS DEFICIENCY 0301 Uncontrolled chemical reaction 0302 Core physics problems 0303 Poor chemistry or inadequate chemical control 0304 Chemical contamination, deposition 0400 HYDRAULIC AND PNEUMATIC DEFICIENCY 0401 Water hammer, abnormal pressure, pressure fluctuations, over pressure 0402 Loss of pressure 0403 Loss of fluid flow 0404 Cavitation 0405 Gas binding 0406 Vibration due to fluid flow 0407 Moisture in air systems 0500 CONTROL AND INSTRUMENTATION DEFICIENCY 0501 Oscillation 0502 False response, loss of signal, spurious signal 0503 Set point drift, parameter drift 0504 Computer hardware deficiency (including auto control loops) 0505 Computer software deficiency (including auto control loops) 0600 ENVIRONMENTAL (ABNORMAL CONDITIONS INSIDE THE PLANT) 0601 Fire, burning, smoke, explosion 0602 Dropped load, high energy impacts, missiles 0603 Water ingress, flooding 0604 High temperature 0605 Radiation, contamination and irradiation of parts 0606 Pressure 0607 Humidity 0608 Low temperature (including freezing) 0700 ENVIRONMENTAL (EXTERNAL TO THE PLANT) 0701 Lightning strikes 0702 Flooding 0703 Wind loading I storm 0704 Earthquake 0705 Ambient temperature high 0706 Ambient temperature low (freezing) 0707 Heavy rain or snow 0800 HUMAN FACTORS (* See definitions below) 0801 Slip or lapse 0802 Mistake 0803 Violation 0804 Sabotage 0000 UNKNOWN 0001 Unidentifiable 0002 Not yet identified * Human Factors Definitions Slip or lapse - Unconscious unintended action or failure to act, resulting from attention failure or memory failure in routine activity. In spite of a good understanding of the system, the process, the procedure, the specific context, and the intention to perform the task correctly, an unconscious, unintended action or failure to act occurs, or a wrong reflex or inappropriate instinctive action took place. Mistake - Intended action resulting in undesired outcome in the problem solving activity. The person made wrong action because he did not understand the system, the procedure, the specific context, the prescribed task etc. Page 36 of 64
40 Violation - In spite of a good understanding of the system, the process, the procedure and the specific context the person intentionally breaks known rules, prescriptions,... without malevolent intention. Sabotage - Intentional breaking of known rules, prescriptions,... with malevolent intention. Consequences of the event (WANO 5.2) Code Description Definition/Examples 01 Degraded plant operating conditions Dilution transients, Breach of Technical Specifications 02 Plant transient The number of which is limited in plant life such as scrams, safety injection etc. 03 Equipment damage; Fires; Steam Major or safety related equipment generator tube leak 04 Degradation of safety systems Reactor protection systems, Shutdown cooling systems, Safeguard systems, Emergency power systems, Ultimate heat sink systems, Fire protection systems 05 Uncontrolled release of radioactivity 06 Unforeseen personnel exposure 07 Personal injuries 08 Degradation of a safety barrier Fuel cladding, Primary boundary *, Containment integrity 09 Other Availability of the plant 10 Non-consequential or near miss For precursor occurrences nuclear safety or plant reliability consequences * Excluding steam generator tube leaks classified under equipment damage. Tube ruptures are classified under 08. Systems (malfunctioning, failed, affected and degraded, WANO 5.3 Code Description 100 PRIMARY REACTOR SYSTEMS 110 Reactor core 120 Control rod (including drives and special power supply 130 Reactor vessel and internals 140 Moderator and auxiliaries (PHWR) 150 Reactor coolant system 160 Pressure control (includes primary safety r 170 Recirculation (BWR) 180 Steam generator, boiler, steam drum 190 At power fuel handing systems (PHWR, GCR, RBMK) 195 Annulus gas systems (PHWR, RBMK) 200 REACTOR AUXILIARY SYSTEMS 210 Reactor core isolation cooling (BWR) 215 Auxiliary and emergency feedwater 220 Emergency poisoning function Stand-by liquid control (BWR) Residual heat removal Chemical and volume control (PWR) Emergency core cooling Main steam pressure safety I relief valves (for reactors with secondary loops) Core flooding accumulator (PWR) Gas clean-up system (PHWR, RBMK, LMFBR) Failed fuel detection 300 ESSENTIAL AUXILIARY SYSTEMS Component cooling water Essential raw cooling or service water Essential auxiliary steam (GCR) C02 injection and storage (GCR) Essential compressed air Borated or refuelling water storage Condensate storage Spent fuel pool or refuelling pool cooling and cleanup Containment isolation Main stearn/feedwater isolation function Containment spray and ice condenser Containment pressure suppression (not including spray) Containment combustible gas control Page 37 of 64
41 400 ELECTRICAL SYSTEMS High voltage AC (greater than 15kV including off-site power) Medium voltage AC (600 V to 15 kv) Low voltage AC (less than 600 V, mainly 480 V) AC & DC supplies to vital instrumentation, control and computers DC power supplies Emergency power generation and auxiliaries Security and access control Communication and alarm annunciation 500 FEEDWATER, STEAM, CONDENSATE AND POWER CONVERSION SYSTEMS Main steam and auxiliaries (including auxiliary steam) Turbo-generator and auxiliaries Main condenser and auxiliaries (including off gas systems) Turbine by-pass Condensate and feedwater Condensate demineraliser Circulating water or condenser cooling water (including raw & service water cooling) 600 HEATING, VENTILATION AND AIR CONDITIONING S 10 Primary reactor containment building HVAC ventilation 15 Primary containment vacuum and pressure relief 20 Secondary containment recirculation, exhaust and gas treatment 25 Dry well or wet well ventilation, purge and inerted 30 Nuclear or reactor auxiliary building ventilation 35 Control building ventilation, main control room ventilation 40 Fuel building ventilation 45 Turbine building ventilation 50 Emergency generator building ventilation 60 Miscellaneous structures ventilation 65 Chilled water 70 Plant stack 75 Seismic I bunkered emergency control building ventilation 700 INSTRUMENTATION AND CONTROL SYSTEMS 10 Plant I process com2uter (including main and auxiliary computer 15 Fire detection 20 Environment monitoring 25 Turbo-generator instrumentation and control 30 Plant monitoring (including main control room equipment & rem functions) 35 In-core and ex-core neutron monitoring 40 Leak monitoring 45 Radiation monitoring (in the plant and of workers) 50 Reactor power control 51 Reactor protection 55 Recirculating flow control (BWR) 60 Feedwater control 65 Engineered safety features actuation (including emergency system 70 Non-nuclear instrumentation 800 SERVICE AUXILIARY SYSTEMS 10 Sampling 20 Control and service air (non-essential), compressed gas 30 Demineralised water 40 Material and equipment handling (including cranes, tools & lifting 50 Nuclear fuel handling and storage 60 Fire protection 70 Chemical additive injection and make-up 80 Sodium heating systems 900 STRUCTURAL SYSTEMS 910 Primary reactor containment building 915 Secondary reactor containment building or vacuum building (PHWR) 920 Reactor or nuclear auxiliary building 922 Control building 925 Emergency generator building 928 Fuel building (including wet and dry storage buildings) 930 Turbine building 932 Waste management building 935 Pumping stations 938 Back-up ultimate heat sink building 940 Cooling towers 945 Switchyard (open I enclosed) 946 Seismic I bunkered emergency control building 950 WASTE MANAGEMENT SYSTEMS 955 Liquid radwaste 960 Solid radwaste 962 Gaseous radwaste 965 Non-radioactive waste (liquid, solid and gaseous) 968 Steam generator blowdown (secondary side) 970 Plant drainage (floor, roof, etc.) 972 Equipment drainage (including vents) 975 Suppression pool cleanup (BWR) 980 Reactor water cleanup (BWR) 000 NONE of the above systems or unidentified Page 38 of 64
42 Components (malfunctioning, failed, affected, degraded, WANO 5.4) Code Description 100 INSTRUMENTATION 110 Neutron flux (detectors, ion chambers, associated components) 120 Pressure 121 Temperature 122 Level 123 Flow 124 Speed measurement 130 Radiation I contamination 140 Concentration 150 Position 160 Dew point, moisture 170 Fire detectors 180 Hydrogen detectors 190 Electrical (current, voltage, power... ) 200 MECHANICAL 210 Pumps, compressors, fans 220 Turbines (steam, gas, hydro), engines (diesel, petrol, etc.) 230 Valves (incl. safety, check, relief & solenoid), valve operators, controllers, dampers (incl. fire dampers), seals and packing, flanges, orifices, drain traps, diaphragm rupture disks 240 Heat exchangers (heaters, coolers, condensers, boilers), heat exchanger tube plugs 250 Tanks, pressure vessels, accumulators (e.g. reactor vessel and internals, accumulators) 260 Tubes, pipes, ducts 270 Fittings, couplings (incl. transmissions & gearboxes), hangers, supports, bearings, snubbers 280 Strainers, screens, filters, ion exchange columns 290 Penetrations/doors (personnel and equipment access, fuel handling) 295 Fuel storage racks, fuel storage casks and fuel transport containers 400 ELECTRICAL 410 Switchyard equipment (switchgear, transformers, buses, reactors, arresters, line isolators) 420 Circuit breakers, power breakers, fuses 430 Motors (for pumps, fans, compressors, motor generators,... ) 440 Generators of emergency and standby power 450 Main generator and auxiliaries 460 Relays, connectors, hand switches, push buttons, contacts 470 Wiring, logic circuitry, controllers, starters, cables 480 Alarms 500 LIFTING DEVICES 600 NUCLEAR ASSEMBLIES 610 Absorber assemblies 620 Fuel assemblies (block type, cluster type and spherical fuel elements are included) 630 Breeder assemblies 640 Flow restrictor (assemblies) 650 Burnable absorber assemblies 660 Reflector assemblies 665 Moderator assemblies 670 Neutron sources 680 Shielding equipment 685 Special assemblies 690 Control rods 700 COMPUTERS 710 Computer hardware 720 Computer software 000 UNIDENTIFIED or no specific component involved (This code to be used where inappropriate human action is the direct cause of the event). Page 39 of 64
43 Groupe (of staff most involved in, or likely to learn from the event, WANO 5.7) Code Description 100 MAINTENANCE general 110 Shift 120 Electrical 130 Instrument 140 Mechanical 150 Fuel route 160 Civil 170 Work planning or scheduling 200 OPERATIONS general 210 Shift - Control room operators 220 Shift- Field operators 230 Day 240 Fuel route 300 TECHNICAL AND ENGINEERING general 301 System engineering 302 Project engineering 310 Chemistry 320 Plant performance 330 Reactor physics 340 Mechanical 350 Instrument 360 Electrical 370 Health physics 380 Emergency planning 390 Industrial safety 400 MANAGEMENT AND ADMINISTRATION general 410 Planning 420 Contractors 430 QA 440 Training 450 Document production 460 Security 470 Procurement 480 Stores 490 All groups Root Cause and Causal Factor Codes (WANO 5.9) ROOT CAUSE: The fundamental cause(s) that, if corrected, will prevent recurrence of an unusual event or adverse condition. CAUSAL FACTOR: Causes that, if corrected, would not of themselves have prevented the event, but are important enough to be recognised as needing corrective action to improve the quality of the process or the product. HUMAN PERFORMANCE RELATED (OJ** TO 10**), MANAGEMENT RELATED (11** TO 19**), EQUIPMENT RELATED (20 **TO 23 **) 0100 VERBAL COMMUNICATIONS 0101 Shift hand-over inadequate 0102 Pre-job briefing inadequate I not performed 0103 Message misunderstood I misinterpreted 0104 Communications equipment inadequate or not available 0105 Receiver not listening 0106 Communications incorrect I inadequate 0107 Internal team communication inadequate 0108 Inter-team communication inadequate 0109 Supervisor not notified of problem 0200 PERSONNEL WORK PRACTICES 0201 Self checking not used or ineffectively applied 0202 System alignment I isolation not verified 0203 Required procedures, drawings, or other references not used 0204 Administrative controls circumvented or intentionally not performed 0205 Conditions not verified prior to work 0206 Task not adequately researched prior to start 0207 Unauthorised material substitution 0208 Inadvertent bumping, stepping on, or damage to equipment 0209 Radiological I ALARA work practices not followed 0210 Inattention to detail 0211 Independent checking not used or ineffectively applied 0212 Unsafe working practices applied 0213 Personal protective equipment not used I worn 0214 Improper tools I equipment used 0215 Failure to maintain written logs 0216 Inappropriate habits developed through group pressure I culture 0217 Lack of questioning attitude 0300 PERSONNEL WORK SCHEDULING 0301 Excessive overtime 0302 Called in during unsociable hours 0303 Working continuously for considerable number of hours 0304 Working without rest day for considerable time 0305 Frequent changes of shift 0306 Time pressure to complete task 0307 Unfamiliar work cycle 0400 ENVIRONMENTAL CONDITIONS 0401 Lighting inadequate 0402 Housekeeping inadequate 0403 Temperature too hot I cold 0404 Excessive noise level 0405 High humidity 0406 High radiation Page 40 of 64
44 0407 Cramped work space 0408 Distractions 0500 MAN-MACHINE INTERFACE 0501 Label missing I inadequate 0502 Interface design inappropriate for task 0503 Controls provided not adequate 0504 Alarms provided not adequate 0505 Alarm masking I cancelling 0506 Too many standing alarms 0507 Too many incoming alarms 0508 Indications provided not adequate 0600 TRAINING I QUALIFICATION 0601 Training not provided on how to perform a task 0602 Training not provided on how to use special equipment or tools 0603 Training not provided on relevant system(s) I components 0604 Training not based on current plant requirements 0605 Demonstration of task proficiency not required prior to qualification 0606 Insufficient refresher training 0607 Training not attended 0608 Training standard not adequate 0609 Training not provided to required level of competence for task 0610 Training not provided in personnel work practice 0611 Shortfall in on-iob training I experience 0612 Inadequate definition of required qualifications 0700 WRITTEN PROCEDURES AND DOCUMENTS 0701 No document available 0702 Technically incorrect 0703 Technically incomplete 0704 Cautionary information not included 0705 Not up to date with plant design 0706 Not formally stated 0707 Unclear or complex wording 0708 Format deficiencies 0709 User aids deficient I not provided 0710 Inadequate technical review process 0711 Responsibility for following procedure not stated 0712 Inadequate safety assessment provided 0800 SUPERVISORY METHODS 0801 Duties and tasks not clearly explained 0802 Progress not adequately monitored 0803 Supervision levels not decided prior to task 0804 Supervisor too involved in tasks 0805 Inappropriate balance between timescale and standards 0806 Standards not adequately communicated 0807 Control of contractors inadequate 0808 Frequent task re-allocation 0809 Inappropriate selection of staff for task 0810 Safety aspects of task not emphasised 0900 WORK ORGANISATION 0901 Planning done without site visit 0902 Special conditions or requirements not identified 0903 Co-ordination of all relevant on-site departments not achieved 0904 Work initiated prior to ensuring all skills, parts, tools, instruments, etc., are available 0905 Job walk through not performed 0906 Work package did not address all administrative requirements 0907 Scheduling conflicts not identified 0908 Task or routine not assigned 0909 Too few workers allocated to task 0910 Too few workers of the correct trade I specialisation 0911 Co-ordination of relevant on-site and off-site departments not achieved 0912 Planning of parallel tasks inadequate 1000 PERSONAL FACTORS 1001 Fatigue 1002 Stress I perceived lack of time I boredom 1003 Skill of the craft less than adequate I not familiar with job performance standards 1100 MANAGEMENT DIRECTION 1110 Policies, official guidance (standards), expectations, administrative controls:- not developed 1120 Policies, official guidance (standards), expectations, administrative controls:- not enforced 1130 Policies, official guidance (standards), expectations, administrative controls:- not adequate (not strict enough, confusing or incomplete) 1200 COMMUNICATION OR CO-ORDINATION 1210 Policies, official guidance (standards), expectations, administrative controls not communicated effectively within the organisation 1220 Familiarity of workers with relevant policies and/or official guidance not verified 1230 Inadequate coordination/communication between departments 1240 Coordination/communication not sufficiently promoted by management 1250 Inadequate communication between management and plant staff, inadequate feedback from plant staff to management, employee concerns fail to reach management attention 1260 No prompt responses to employee concerns 1300 MANAGEMENT MONITORING AND ASSESSMENT 1310 Inadequate level of management involvement 1320 Inadequate establishment/support of programs or processes 1330 Inadequate monitoring of the effectiveness of programs or processes 1340 Inadequate monitoring of results of decisions/assignments 1350 Inadequate assessment of the effectiveness of corrective actions 1360 Inadequate assessment of personnel behaviour and performance 1400 DECISION PROCESS 1410 Officially designated responsibilities and accountabilities unclear 1420 Decision process too lengthy/time consuming 1430 Decisions based on insufficient information 1440 Risks and consequences of decision not identified or assessed before decision made 1450 Management objectives did not encompass known problems 1460 Management objective did not reflect a relevant constraint 1470 Inadequate operating experience feedback process (corrective actions not defined, Page 41 of 64
45 Inadequate or not implemented promptly, root causes of known problems not addressed) 1480 Improvement campaigns ineffective 1500 ALLOCATION OF RESOURCES 1510 Insufficient resources allocated for identified objectives (includes resources such as training, supervision, documentation, tools, materials, and equipment) 1600 CHANGE MANAGEMENT 1610 Need for change, further change not identified 1620 Change not implemented in adequate timescale 1630 Inadequate resourcing of change 1640 Consequences of change not adequately assessed 1650 Change-related training/briefing inadequate 1660 Change-related documentation alteration inadequate 1670 Change-related equipment provision inadequate 1680 Results of change not monitored for correctness 1700 ORGANISATIONAL/SAFETY CULTURE 1710 Punitive responses to genuine slips or mistakes 1720 Lack of blame-free reporting culture 1730 Staff do not have "do it right the first time" attitude 1740 Taking of short-cuts allowed/tolerated 1750 Low morale among plant staff 1760 Recurrent violation of rules 1770 General lack of questioning attitude 1780 Lack of conservative approach in control room 1790 Lack of teamwork in control room 1800 MANAGEMENT OF CONTINGENCIES 1810 Organisation unprepared to handle unforeseen events 1820 No management oversight of problem-solving by workers for unforeseen events 1830 Weaknesses in emergency preparedness 1840 Weaknesses in contingency planning 2000 DESIGN C ONFIGURATION AND ANALYSIS 2001 Original design inadequate 2002 Design documentation I prints inadequate 2003 Design analysis deficiency 2004 Component selection inadequate 2005 Material selection inadequate 2006 Unauthorised or unreviewed modification 2007 Inadequate review of design changes 2008 Field walk through input to design inadequate 2009 Historical design does not meet current requirements 2010 Inappropriate reliance on human action 2011 Deficiency in engineering of modification 2100 EQUIPMENT SPECIFICATION, MANUFACTURE, AND CONSTRUCTION 2101 Material used inadequate 2102 Manufacturer fabrication I construction inadequate 2103 Specifications provided to manufacturer inadequate 2104 Substitute parts I material used during installation 2105 Lack of proper tools I materials used do not meet specifications 2106 Installation workmanship inadequate 2107 QA requirements not used or met during procurement process 2108 Equipment installed does not meet all codes I requirements 2109 Post procurement requirements not used I performed 2200 MAINTENANCE I TESTING I SURVEILLANCES 2201 Corrective maintenance did not correct problems 2202 Other problems noted during the performance of maintenance I testing not corrected 2203 Preventive maintenance inadequate 2204 Maintenance performed incorrectly 2205 Testing not performed as required 2206 Post-maintenance testing inadequate 2207 Post-modification testing inadequate 2208 Retest requirements not specified 2209 Retest delayed 2210 Test acceptance criteria inadequate 2211 Test results review inadequate 2212 Surveillance schedule not followed 2213 Situational surveillance not performed 2214 Required surveillance I test not scheduled 2215 Equipment outside acceptance criteria 2216 Incorrect parts I consumables installed I used 2217 Failure to exclude foreign material 2218 Incorrect restoration of plant following maintenance I isolation I testing 2300 EQUIPMENT PERFORMANCE 2301 Equipment operated outside of design specifications 2302 Ageing of component 2303 Known problems not corrected 2304 Degraded sub-component contributed to failure 2305 Component monitoring inadequate 2306 Component beyond expected lifetime 2307 Externally damaging condition not properly evaluated or correlated 2308 Equipment erosion I corrosion 2309 Failed within expected lifetime Page 42 of 64
46 8.3 Database structure This section provides the detailed description of the Microsoft Access database. H:\Desktop\OPERATE_DBx.accdb 12 June 2014 Table: OPERATE Properties DatasheetGridlinesTh -1 DateCreated: 03/09/ :06:15 DefaultView: 2 DisplayViewsOnShar 1 FilterOnLoad: False GUID: {guid {0BB49770-ECDA-4C98-AA75- HideNewField: False LastUpdated: 24/01/ :29:05 NameMap: Long binary data OrderBy: [OPERATE].[Date] OrderByOn: True OrderByOnLoad: True Orientation: Left-to-Right PublishToWeb: 1 RecordCount: 1479 ThemeFontIndex: -1 TotalsRow: False Updatable: True Columns Name Type Size LER Text 12 Plant Text 6 Vendor Text 8 Rtype Text 4 OpComm Text 8 Date Date/Time 8 Time Date/Time 8 SD_O_ext Double 8 CATEGORY Integer 2 STATUS Integer 2 ACTIVITY Integer 2 GROUP Integer 2 D_CAUSE Integer 2 MULTY Integer 2 SAFETY Integer 2 CONS1 Integer 2 Cons2 Integer 2 Cons3 Integer 2 SYS1 Integer 2 SYS2 Integer 2 SYS3 Integer 2 COMP1 Integer 2 COMP2 Integer 2 COMP3 Integer 2 RC_C1 Integer 2 RC_C2 Integer 2 RC_C3 Integer 2 Table Indexes Name Number of LER 1 Fields: LER Ascending Table: Activity Page 43 of 64
47 Properties PublishToWeb: 1 RecordCount: 23 ThemeFontIndex: 1 TotalsRow: False Updatable: True Columns Name Type Size ID Byte 1 Description Text 124 Table Indexes Name Number of PrimaryKey 1 Fields: ID Ascending Table: Category Properties PublishToWeb: 1 RecordCount: 9 ThemeFontIndex: 1 TotalsRow: False Updatable: True Columns Name Type Size ID Byte 1 Description Text 124 Table Indexes Name Number of PrimaryKey 1 Fields: ID Ascending Table: Component Properties PublishToWeb: 1 RecordCount: 8 ThemeFontIndex: 1 TotalsRow: False Updatable: True Columns Name Type Size ID Integer 2 Description Text 124 Table Indexes Name Number of PrimaryKey 1 Fields: ID Ascending Table: Consequence Properties PublishToWeb: 1 RecordCount: 10 ThemeFontIndex: 1 TotalsRow: False Updatable: True Columns Name Type Size ID Byte 1 Description Text 124 Table Indexes Name Number of Page 44 of 64
48 PrimaryKey 1 Fields: ID Ascending Table: D_Cause Properties PublishToWeb: 1 RecordCount: 9 ThemeFontIndex: 1 TotalsRow: False Updatable: True Columns Name Type Size ID Integer 2 Description Text 124 Table Indexes Name Number of PrimaryKey 1 Fields: ID Ascending Table: Group Properties PublishToWeb: 1 RecordCount: 4 ThemeFontIndex: 1 TotalsRow: False Updatable: True Columns Name Type Size ID Integer 2 Description Text 124 Table Indexes Name Number of PrimaryKey 1 Fields: ID Ascending Table: Multiple Properties PublishToWeb: 1 RecordCount: 4 ThemeFontIndex: 1 TotalsRow: False Updatable: True Columns Name Type Size ID Byte 1 Description Text 124 Table Indexes Name Number of PrimaryKey 1 Fields: ID Ascending Page 45 of 64
49 Table: Plant Properties PublishToWeb: 1 RecordCount: 118 ThemeFontIndex: -1 TotalsRow: False Updatable: True Columns Name Type Size ID Integer 2 Description Text 255 ID0 Text 255 Plant Text 255 Type Text 255 Model Text 255 COUNTRY Text 255 Pt_MW Double 8 Pe_MW Double 8 Peg_MW Double 8 Status Text 255 Vendor Text 255 Grid Date/Time 8 Commercial Date/Time 8 Shutdown Date/Time 8 Table Indexes Name Number of Grid 1 Fields: Grid Ascending ID 1 Fields: ID Ascending ID0 1 Fields: ID0 Ascending Table: RC_Causal Properties PublishToWeb: 1 RecordCount: 22 ThemeFontIndex: 1 TotalsRow: False Updatable: True Columns Name Type Size ID Integer 2 Description Text 124 Table Indexes Name Number of PrimaryKey 1 Fields: ID Ascending Table: Safety Properties PublishToWeb: 1 RecordCount: 3 ThemeFontIndex: 1 TotalsRow: False Updatable: True Columns Name Type Size ID Byte 1 Description Text 124 Table Indexes Name Number of Page 46 of 64
50 PrimaryKey 1 Fields: ID Ascending Table: Status Properties PublishToWeb: 1 RecordCount: 11 ThemeFontIndex: 1 TotalsRow: False Updatable: True Columns Name Type Size ID Integer 2 Description Text 124 Table Indexes Name Number of PrimaryKey 1 Fields: ID Ascending Table: System Properties PublishToWeb: 1 RecordCount: 11 ThemeFontIndex: 1 TotalsRow: False Updatable: True Columns Name Type Size ID Integer 2 Description Text 124 Table Indexes Name Number of PrimaryKey 1 Fields: ID Ascending Table: Vendor Properties Orientation: Left-to-Right PublishToWeb: 1 RecordCount: 6 ThemeFontIndex: 1 TotalsRow: False Updatable: True Columns Name Type Size Code Text 8 Vendor Text 25 ID Long Integer Description Text Table Indexes Name Number of ID 1 Fields: ID Ascending PrimaryKey 1 Fields: Code Ascending Page 47 of 64
 results for one event group. 8.4.")
51 8.4 Tool and results illustrations This section is presenting more detailed results and tool illustrations. The following subsections are illustrating all the statistical reports, all the groups ranking results, and the complete confidence (uncertainty and sensitivity) results for one event group Illustration for all the available statistical reports This is the illustration for all the available reports. For the attributes where an ID description is not visible on the figure it can be found in this Appendix inside the previous subsection. Page 48 of 64


52 Page 49 of 64


53 Page 50 of 64


54 Page 51 of 64


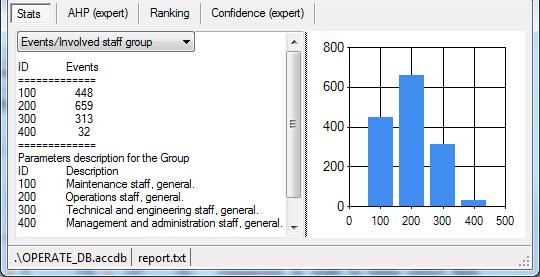
55 Page 52 of 64


56 Page 53 of 64


57 Page 54 of 64


58 Page 55 of 64
59 8.4.2 Illustration for all the groups rankings This is the illustration for all the groups ranking reports. For the attributes where an ID description is not visible on the figure it can be found in this Appendix inside the previous subsection. Page 56 of 64


60 Page 57 of 64

61 Page 58 of 64

62 Page 59 of 64

63 Page 60 of 64
64 8.4.3 Illustration for the confidence (uncertainty and sensitivity) analysis results This is the illustration for one whole ranking confidence analysis report. The uncertainty report comes first and then the sensitivity report for the Components grouping with a 33% Components group, U/S Event Groups ranking for uncertainty (with +-33% to the base RI weight): # ID HiRank lorank AHP Avrg minfr maxfr minex maxex minmu maxmu minsa maxsa minca maxca minco maxco mintr maxtr Group : : : Parameters description for the Component ID Description 0 Unidentified, no specific component involved or where in-appropriate human action is the direct cause of the event. 100 Instrumentation. 200 Mechanical. 400 Electrical. 500 Lifting devices. 600 Nuclear assemblies. 700 Computers (HW / SW). 800 Civil structures. List of all RI weights used for the uncertainty ranking: # Case 0.Fr. 1.Ex. 2.Mu. 3.Sa. 4.Ca. 5.Co. 6.Tr. 0 AHP Avrg minfr maxfr minex maxex minmu maxmu minsa maxsa minca maxca minco maxco mintr maxtr Page 61 of 64
65 @Rank Components group, U/S Event Groups ranking for sensitivity (with min=.067 max=.33 RI weight): # ID HiRank lorank AHP Avrg minfr maxfr minex maxex minmu maxmu minsa maxsa minca maxca minco maxco mintr maxtr Group : : : Parameters description for the Component ID Description 0 Unidentified, no specific component involved or where in-appropriate human action is the direct cause of the event. 100 Instrumentation. 200 Mechanical. 400 Electrical. 500 Lifting devices. 600 Nuclear assemblies. 700 Computers (HW / SW). 800 Civil structures. List of all RI weights used for the sensitivity ranking: # Case 0.Fr. 1.Ex. 2.Mu. 3.Sa. 4.Ca. 5.Co. 6.Tr. 0 AHP Avrg minfr maxfr minex maxex minmu maxmu minsa maxsa minca maxca minco maxco mintr maxtr Page 62 of 64
66 8.5 Implementation details This section provides some additional details regarding trend ranking index determination and confidence coding implementation Trend determination Usually time series data are not immutable; mostly they reveal various kinds of trends, cycles, and seasonal patterns. Approximating time series data by a single value like mean or median is not suitable. A more suitable strategy for time series data is to derive an approximating function that fits the data without restriction to match the points. In order to remove the subjectivity, some strict criterion must be derived for the fit. The simplest way to do this is to derive a curve that minimizes the misalignment between the data points and the curve. A technique for accomplishing this goal is called least-squares regression. The simplest example of a least-squares approximation is fitting a straight line to a set of paired data: (x 1, y 1 ), (x 2, y 2 ),, (x n, y n ). The equation for the straight line is y = q + px where q and p are coefficients representing the intercept and slope, respectively. The error, or residual, between the model and the real data, is represented by equation: e = y q px. Thus, the residual, is the difference between the true value of y and the approximate value predicted by the straight line equation. A strategy for fitting a best line is to minimize the sum of the squares of the residuals. n 2 e i = (y i q px i ) 2 i=1 n i=1 This strategy has many advantages, including the fact that it yields a unique line for a given set of data. Using the standard technique (differentiation with respect to q and p) for determination of values q and p which minimize the sum of the residuals we get formulas: p = n x iy i x i y i n x i 2 ( x i ) 2, q = y px where x and y are means of y and x. Any line other than the one computed in a such way results in a larger sum of the residuals. This straight line is unique and in terms of chosen criterion is a best line through the points, and a best linear trend model. The linear trend model is applied on collected data arranged in groups. For each distinguishing parameter value within the grouping criterion a specific linear trend model is calculated. The first year with parameter data is used as a reference and a linear trend model is calculated as time series data at yearly points after this year. This way we ensure that the value of parameter q is count of events in reference year for thrspecific parameter, and the slope of the linear trend model is trend slope as is expected. Page 63 of 64
67 8.5.2 Confidence (uncertainty and sensitivity) implementation The uncertainty about the relative ranking indexes (RIs) importance was selected as a mean to explore the uncertainty of the event groups ranking. This was implemented in a way to find the boundaries of the RIs relative importance and to calculate the ranking for all relevant combinations. Initially the idea is to have one expert select the RIs relative importance and calculate the min-max relative importance. Presenting all this could provide uncertainty of ranking. This is somehow boundary result which could demonstrate robustness of ranking or it could point to most sensitive assumptions for further expert judgment tuning in order to produce final results and conclusions about event groups importance. This could be done in the following process: For all combinations of RI relative importance calculate AHP and for consistent (i.e. CR<0.1) calculate ranking. First all the ranking could be evaluated and later only the extreme RI relative importance should be selected in order to calculate the uncertainty on a continuous basis (i.e. in the application). One way of selecting could be to take 14 combinations with maximum and minimum weight value for each RI. How adequate this approach is can be judged only after comparison of uncertainty result is made with complete quantification by propagating uncertainty of all pairwise comparison with acceptable consistency ratio.. Obviously this is a mathematical question, but it might be easier to answer after the results are produced and reviewed. However, this is a very demanding exercise and an initial solution should be much more practical. Therefore the first implementation will make in addition to the expert based just 15 additional rankings. One ranking will be by using the average (all weights equal, 1/7 weight). Two additional rankings will be made for each ranking index with experience based minimal and maximal weights, keeping other ranking indexes on average. Minimal weights were selected as 0.05 with respected average weights as Maximal weight is selected as 1/3 with respected average weights as 1/9. Inputs: minriw maxriw - 1/3 m4ri - 7x7 mirror matrice with RI relative ratios and methods for dominant eigenvector (i.e. weight) and consistency ratio (CR) calculation. RIw - 7 vector with RI weights: 0Fr, 1Co, 2Ca, 3Sa, 4Mu, 5Ex, 6Tr RIwU - 16x7 matrice with RI weights for all uncertainty rankings m4rank - 73x12 matrice with rankig for all groups with respected parameters: 0Fr, 1Co, 2Ca, 3Sa, 4Mu, 5Ex, 6Tr, 7Parameter, 8Group, 9RankValue, 10TotalRank, 11GroupRank RI values are normalised without weighting factors. Weighting is applied only to quantify total ranking value (9) m4runk - 73x32 matrice with total and group ranking for all uncertainty cases: 0-15 for total and (16-31) groups, as follows: 0(16)expert, 1(17)average, 2(18)minFr, 3(19)maxFr, 4(20)minCo, 5(21)maxCo, 6(22)minCa, 7(23)maxCa, 8(24)minSa, 9(25)maxSa, 10(26)minMu, 11(27)maxMu, 12(28)minEx, 13(29)maxEx, 14(30)minTr, 15(31)maxTr, Page 64 of 64
68 Page 65 of 64
69 Europe Direct is a service to help you find answers to your questions about the European Union Freephone number (*): (*) Certain mobile telephone operators do not allow access to numbers or these calls may be billed. A great deal of additional information on the European Union is available on the Internet. It can be accessed through the Europa server How to obtain EU publications Our priced publications are available from EU Bookshop ( where you can place an order with the sales agent of your choice. The Publications Office has a worldwide network of sales agents. You can obtain their contact details by sending a fax to (352) European Commission EUR EN Joint Research Centre Institute for Energy and Transport Title: Development of the Statistical Tool for Operating Events Database Analysis Author: Zdenko Šimić Luxembourg: Publications Office of the European Union pp x 29.7 cm EUR Scientific and Technical Research series ISSN (online), ISSN (print) ISBN (PDF) ISBN (print) doi: /37229

70 LD-NA EN-N JRC Mission As the Commission s in-house science service, the Joint Research Centre s mission is to provide EU policies with independent, evidence-based scientific and technical support throughout the whole policy cycle. Working in close cooperation with policy Directorates-General, the JRC addresses key societal challenges while stimulating innovation through developing new methods, tools and standards, and sharing its know-how with the Member States, the scientific community and international partners. Serving society Stimulating innovation Supporting legislation doi: /37229 ISBN
Use of AHP Method in Efficiency Analysis of Existing Water Treatment Plants
 International Journal of Engineering Research and Development ISSN: 78-067X, Volume 1, Issue 7 (June 01), PP.4-51 Use of AHP Method in Efficiency Analysis of Existing Treatment Plants Madhu M. Tomar 1,
MULTIPLE-OBJECTIVE DECISION MAKING TECHNIQUE Analytical Hierarchy Process
 MULTIPLE-OBJECTIVE DECISION MAKING TECHNIQUE Analytical Hierarchy Process Business Intelligence and Decision Making Professor Jason Chen The analytical hierarchy process (AHP) is a systematic procedure
Application of AHP in Education Legislation Project. Ying-ying YAO and Yong-sheng GE *
 2017 3rd International Conference on Applied Mechanics and Mechanical Automation (AMMA 2017) ISBN: 978-1-60595-479-0 Application of AHP in Education Legislation Project Ying-ying YAO and Yong-sheng GE
A Stochastic AHP Method for Bid Evaluation Plans of Military Systems In-Service Support Contracts
 A Stochastic AHP Method for Bid Evaluation Plans of Military Systems In-Service Support Contracts Ahmed Ghanmi Defence Research and Development Canada Centre for Operational Research and Analysis Ottawa,
E-Commerce Logistics Mode Selection Based on Network Construction
 Modern Economy, 2019, 10, 198-208 http://www.scirp.org/journal/me ISSN Online: 2152-7261 ISSN Print: 2152-7245 E-Commerce Logistics Mode Selection Based on Network Construction Hanlin Qian School of Business
SUMMARY REPORT ON EVENTS RELATED TO LOSS OF OFFSITE POWER AND STATION BLACKOUT AT NPPs
 SUMMARY REPORT ON EVENTS RELATED TO LOSS OF OFFSITE POWER AND STATION BLACKOUT AT NPPs European Clearinghouse on Operating Experience Feedback for Nuclear Power Plants Andrija Volkanovski Antonio Ballesteros
Using the Analytic Hierarchy Process in Long-Term Load Growth Forecast
 Journal of Electrical Engineering 5 (2017) 151-156 doi: 10.17265/2328-2223/2017.03.005 D DAVID PUBLISHING Using the Analytic Hierarchy Process in Long-Term Load Growth Forecast Blagoja Stevanoski and Natasa
USING AHP TO ANALYZE THE PRIORITY OF PERFORMANCE CRITERIA IN NATIONAL ENERGY PROJECTS
 USING AHP TO ANALYZE THE PRIORITY OF PERFORMANCE CRITERIA IN NATIONAL ENERGY PROJECTS Hsin-Pin Fu, Department of Marketing and Distribution Management, National Kaohsiung First University of Science and
IT portfolio management template User guide
 IBM Rational Focal Point IT portfolio management template User guide IBM Software Group IBM Rational Focal Point IT Portfolio Management Template User Guide 2011 IBM Corporation Copyright IBM Corporation
TDWI Analytics Principles and Practices
 TDWI. All rights reserved. Reproductions in whole or in part are prohibited except by written permission. DO NOT COPY Previews of TDWI course books offer an opportunity to see the quality of our material
Keywords- AHP, Operating System, MCDM, Linux, Mac, Windows.
 Volume 4, Issue 5, May 2014 ISSN: 2277 128X International Journal of Advanced Research in Computer Science and Software Engineering Research Paper Available online at: www.ijarcsse.com Operating System
SELECTING A PROFOUND TECHNICAL SERVICE PROVIDER TO PERFORM A TECHNICAL FIELD DEVELOPMENT STUDY FROM GIVEN MULTIPLE CRITERIA
 SELECTING A PROFOUND TECHNICAL SERVICE PROVIDER TO PERFORM A TECHNICAL FIELD DEVELOPMENT STUDY FROM GIVEN MULTIPLE CRITERIA Slamet Riyadi, Lokman Effendi and Rafikul Islam Department of Business Administration,
Analytical hierarchy process (AHP) approach to the selection of heritage building element
 approach to the selection of heritage building element") Analytical hierarchy process (AHP) approach to the selection of heritage building element Siti Nor Fatimah Zuraidi 1, Mohammad Ashraf Abdul Rahman 2, Zainal Abidin Akasah 3 1,2 Facutly of Engineering Technology,
Analytical hierarchy process (AHP) approach to the selection of heritage building element Siti Nor Fatimah Zuraidi 1, Mohammad Ashraf Abdul Rahman 2, Zainal Abidin Akasah 3 1,2 Facutly of Engineering Technology,
A MODIFIED AHP ALGORITHM FOR NETWORK SELECTION
 Proceedings of the 11th International Conference on Manufacturing Research (ICMR2013), Cranfield University, UK, 19th 20th September 2013, pp 501-506 A MODIFIED AHP ALGORITHM FOR NETWORK SELECTION Xin
The Use of AHP (Analytical Hierarchy Process) as Multi Criteria Decision Tool for the Selection of Best Water Supply Source for Benin City
 as Multi Criteria Decision Tool for the Selection of Best Water Supply Source for Benin City") Nigerian Journal of Environmental Sciences and Technology (NIJEST) www.nijest.com Vol 1, No. 1 March 2017, pp 169-176 The Use of AHP (Analytical Hierarchy Process) as Multi Criteria Decision Tool for the
Nigerian Journal of Environmental Sciences and Technology (NIJEST) www.nijest.com Vol 1, No. 1 March 2017, pp 169-176 The Use of AHP (Analytical Hierarchy Process) as Multi Criteria Decision Tool for the
Product quality evaluation system based on AHP fuzzy comprehensive evaluation
 Journal of Industrial Engineering and Management JIEM, 2013 6(1):356-366 Online ISSN: 2013-0953 Print ISSN: 2013-8423 http://dx.doi.org/10.3926/jiem.685 Product quality evaluation system based on AHP fuzzy
Submitted to the Grand Rapids Community College Provost and AGC Executive Committee.
 Oscar Neal Fall 2012 Sabbatical Report Submitted to the Grand Rapids Community College Provost and AGC Executive Committee. The main objective of my sabbatical was to complete my dissertation proposal
Chapter 3. Integrating AHP, clustering and association rule mining
 Chapter 3. Integrating AHP, clustering and association rule mining This chapter presents a novel product recommendation methodology that combines group decision-making and data mining. This method has
IAEA-TECDOC Probabilistic safety assessments of nuclear power plants for low power and shutdown modes
 IAEA-TECDOC-1144 Probabilistic safety assessments of nuclear power plants for low power and shutdown modes March 2000 The originating Section of this publication in the IAEA was: Safety Assessment Section
Group Decision Support System for Multicriterion Analysis A Case Study in India
 Group Decision Support System for Multicriterion Analysis A Case Study in India K. Srinivasa Raju Department of Civil Engineering, S.E.S.College of Engineering, Kopargaon 423 603, Maharashtra, India D.Nagesh
Product Evaluation of Rijal Tashi Industry Pvt. Ltd. using Analytic Hierarchy Process
 Proceedings of IOE Graduate Conference, 2016 pp. 239 244 Product Evaluation of Rijal Tashi Industry Pvt. Ltd. using Analytic Hierarchy Process Rojan Shrestha 1, Shree Raj Sakya 2 1,2 Department of Mechanical
VENDOR RATING AND SELECTION IN MANUFACTURING INDUSTRY
 International Journal of Decision Making in Supply Chain and Logistics (IJDMSCL) Volume 2, No. 1, January-June 2011, pp. 15-23, International Science Press (India), ISSN: 2229-7332 VENDOR RATING AND SELECTION
The Multi criterion Decision-Making (MCDM) are gaining importance as potential tools
 are gaining importance as potential tools") 5 MCDM Methods 5.1 INTRODUCTION The Multi criterion Decision-Making (MCDM) are gaining importance as potential tools for analyzing complex real problems due to their inherent ability to judge different
5 MCDM Methods 5.1 INTRODUCTION The Multi criterion Decision-Making (MCDM) are gaining importance as potential tools for analyzing complex real problems due to their inherent ability to judge different
Energy Advisor. Introduction. Energy Advisor. Product Data Sheet October 2014
 Product Data Sheet Energy Advisor Reduce energy consumption and increase energy visibility with Energy Advisor Manage energy targets with up-to-the minute information across multiple Energy Account Centers
Supply Chain MICROSOFT BUSINESS SOLUTIONS DEMAND PLANNER
 Supply Chain MICROSOFT BUSINESS SOLUTIONS DEMAND PLANNER DEMAND PLANNING FOR BUSINESSES Demand planning is the first step towards business planning. As businesses are moving towards a demand-centric environment
INSIGHTS. Demand Planner for Microsoft Dynamics. Product Overview. Date: November,
 INSIGHTS Demand Planner for Microsoft Dynamics Product Overview Date: November, 2007 www.microsoft.com/dynamics Contents Demand Planning for Business... 1 Product Overview... 3 Multi-dimensional Data Visibility...
PRIORITISATION OF ROAD CORRIDORS BY DEVELOPING COMPOSITE INDEX
 ISSN (Online) : 2319-8753 ISSN (Print) : 2347-6710 International Journal of Innovative Research in Science, Engineering and Technology An ISO 3297: 2007 Certified Organization, Volume 2, Special Issue
Analytic Hierarchy Process (AHP) in Ranking Non-Parametric Stochastic Rainfall and Streamflow Models
 in Ranking Non-Parametric Stochastic Rainfall and Streamflow Models") Analytic Hierarchy Process (AHP) in Ranking Non-Parametric Stochastic Rainfall and Streamflow Models Masengo Ilunga Department of Civil & Chemical Engineering, University of South Africa, Pretoria, South
Analytic Hierarchy Process (AHP) in Ranking Non-Parametric Stochastic Rainfall and Streamflow Models Masengo Ilunga Department of Civil & Chemical Engineering, University of South Africa, Pretoria, South
The Importance-Weights Determination of the Safety Factors of Fishing Ports in Zhuhai via the AHP Method
 Advances in Computer Science Research, volume nd International Conference on Computer Engineering, Information Science & Application Technology (ICCIA 0) The Importance- Determination of the Safety Factors
The Analytic Hierarchy Process: A Tutorial for Use in Prioritizing Forest Road Investments to Minimize Environmental Effects
 International Journal of Forest Engineering 51 The Analytic Hierarchy Process: A Tutorial for Use in Prioritizing Forest Road Investments to Minimize Environmental Effects ABSTRACT Elizabeth Dodson Coulter
Guidance on the Use of Deterministic and Probabilistic Criteria in Decision-making for Class I Nuclear Facilities
 DRAFT Regulatory Document RD-152 Guidance on the Use of Deterministic and Probabilistic Criteria in Decision-making for Class I Nuclear Facilities Issued for Public Consultation May 2009 CNSC REGULATORY
DECISION SUPPORT FOR SOFTWARE PACKAGE SELECTION: A MULTICRITERIA METHODOLOGY
 5-03-30 INFORMATION MANAGEMENT: STRATEGY, SYSTEMS, AND TECHNOLOGIES DECISION SUPPORT FOR SOFTWARE PACKAGE SELECTION: A MULTICRITERIA METHODOLOGY Farrokh Mamaghani INTRODUCTION Software selection is a critical
Presentation Program Outline
 Presentation Program Outline MASTERPLAN PROCESS EFFECTIVE PLANNING ELEMENTS DECISION MAKING PROCESS ANALYTICAL HIERARCHY PROCESS (AHP) HOW TO APPLY AHP SIMPLE EXAMPLE CASE STUDY APPLICATION WHDS MDP Decision
The Enterprise Systems Engineering Center Requirements Management Guide - Analysis
 The Enterprise Systems Engineering Center Requirements Management Guide - The Enterprise Requirements Management Guide - Introduction Innumerable studies have concluded that requirements problems are the
Cloud adoption decision support for SMEs Using Analytical Hierarchy Process (AHP)
") Cloud adoption decision support for SMEs Using Analytical Hierarchy Process (AHP) ROBERT WILSON, Berlin Mano, KHAZAEI, Babak and HIRSCH, Laurence Available from Sheffield
Cloud adoption decision support for SMEs Using Analytical Hierarchy Process (AHP) ROBERT WILSON, Berlin Mano, KHAZAEI, Babak and HIRSCH, Laurence Available from Sheffield
Fuzzy AHP approach for the Selection of Groundwater Recharge Alternative: Sensitivity Analysis
 Fuzzy AHP approach for the Selection of Groundwater Recharge Alternative: Sensitivity Analysis Masengo Ilunga, Department of Civil Engineering and Chemical Engineering, University of South Africa, Pretoria,
QUANTIFICATION OF HUMAN ERROR RATES USING A SLIM-BASED APPROACH
 QUANTIFICATION OF HUMAN ERROR RATES USING A SLIM-BASED APPROACH Shan H. Chien Andrew A. Dykes John W. Stetkar Dennis C. Bley Pickard, Lowe and Garrick, Inc. 2260 University Drive Newport Beach, CA 92660
Introduction. Analytical Hierarchy Process. Why AHP? 10/31/2011. The AHP is based on three principles: Decomposition of the decision problem
 Introduction A multi-criteria decision making process. Analytical Hierarchy Process The analytical hierarchy process (AHP) is a comprehensive, logical and structured framework. 56:134 Process Engineering
Abstract Number: Abstract Title: Supplier Selection with Component Commonality
 Abstract Number: 007-0144 Abstract Title: Supplier Selection with Component Commonality R Samuel Sale Louisiana Tech University 407 Kennon Lane Apt 39 Ruston LA, 71270 rssale@hotmail.com POMS 18 th Annual
Integrated Process Risk Management (IPRM) for Refineries and Petrochemical Complexes
 for Refineries and Petrochemical Complexes") Integrated Process Risk Management (IPRM) for Refineries and Petrochemical Complexes Keivan Torabi, Babak Karimi, Ranbir Parmar, Marcello Oliverio, and Keith Dinnie Nuclear Safety Solutions (NSS) Ltd.
Integrated Process Risk Management (IPRM) for Refineries and Petrochemical Complexes Keivan Torabi, Babak Karimi, Ranbir Parmar, Marcello Oliverio, and Keith Dinnie Nuclear Safety Solutions (NSS) Ltd.
ERP Reference models and module implementation
 ERP Reference models and module implementation Based on Supporting the module sequencing decision in the ERP implementation process An application of the ANP method, Petri Hallikainen, Hannu Kivijärvi
ESTABLISHING RELATIVE WEIGHTS FOR CONTRACTOR PREQUALIFICATION CRITERIA IN A PRE-QUALIFICATION EVALUATION MODEL
 ESTABLISHING RELATIVE WEIGHTS FOR CONTRACTOR PREQUALIFICATION CRITERIA IN A PRE-QUALIFICATION EVALUATION MODEL N. El-Sawalhi 1*, D. Eaton 2, and R. Rustom 3 1, 2 Research Institute for the Built and Human
Analytic Hierarchy Process, Basic Introduction
 Analytic Hierarchy Process, Basic Introduction **Draft 2009-08-12** This tutorial uses a common situation to illustrate how to handle a multilevel decision question using a method called the AHP (Analytic
2013, IJARCSSE All Rights Reserved Page 392
 Volume 3, Issue 11, November 2013 ISSN: 2277 128X International Journal of Advanced Research in Computer Science and Software Engineering Research Paper Available online at: www.ijarcsse.com Risk Analysis
USING AHP TO PRIORITIZE PROCESS CHANGE REQUESTS IN SOFTWARE PROCESS IMPROVEMENT 1
 ISAHP 2001, Berne, Switzerland, August 2-4, 2001 USING AHP TO PRIORITIZE PROESS HANGE REQUESTS IN SOFTWARE PROESS IMPROVEMENT 1 Ipininder S. Monga Wipro Infotech ipininder@hotmail.com Shivraj Kanungo Department
Tutorial Segmentation and Classification
 MARKETING ENGINEERING FOR EXCEL TUTORIAL VERSION v171025 Tutorial Segmentation and Classification Marketing Engineering for Excel is a Microsoft Excel add-in. The software runs from within Microsoft Excel
A Decision Support System for Performance Evaluation
 A Decision Support System for Performance Evaluation Ramadan AbdelHamid ZeinEldin Associate Professor Operations Research Department Institute of Statistical Studies and Research Cairo University ABSTRACT
LIMA. Maintenance Manager User Manual. Microsoft Dynamics NAV LIMA 1
 LIMA Maintenance Manager User Manual Microsoft Dynamics NAV LIMA 1 contents 1 Introduction... 3 2 Maintenance Menu... 4 3 Set-up... 7 4 Defining preventive plans... 11 5 Planning Preventive Maintenance...
Evaluation method for climate change mitigation instruments
 Evaluation method for climate change mitigation instruments Popi A. Konidari* National and Kapodistrian University of Athens Department of Informatics and Telecommunications pkonidar@kepa.uoa.gr Abstract.
Format and Content of the Safety Analysis Report for Nuclear Power Plants - Core Set -
 Format and Content of the Safety Analysis Report for Nuclear Power Plants - Core Set - 2013 Learning Objectives After going through this presentation the participants are expected to be familiar with:
Darshan Institute of Engineering & Technology for Diploma Studies
 RESPONSIBILITY OF SOFTWARE PROJECT MANAGER Job responsibility Software project managers take the overall responsibility of project to success. The job responsibility of a project manager ranges from invisible
Determining and ranking essential criteria of Construction Project Selection in Telecommunication of North Khorasan-Iran
 Determining and ranking essential criteria of Construction Project Selection in Telecommunication of North Khorasan-Iran Majid Mojahed, Rosnah bt Mohd Yusuff, Mohammad Reyhani Abstract Economy project
IT Business Management Standard Edition User's Guide
 IT Business Management Standard Edition User's Guide VMware IT Business Management Suite 1.0.1 This document supports the version of each product listed and supports all subsequent versions until the document
Supplier Selection Using Analytic Hierarchy Process: An Application From Turkey
 , July 6-8, 2011, London, U.K. Supplier Selection Using Analytic Hierarchy Process: An Application From Turkey Betül Özkan, Hüseyin Başlıgil, Nergis Şahin Abstract Decision making is one of the most activities
Models in Engineering Glossary
 Models in Engineering Glossary Anchoring bias is the tendency to use an initial piece of information to make subsequent judgments. Once an anchor is set, there is a bias toward interpreting other information
Getting Started with OptQuest
 Getting Started with OptQuest What OptQuest does Futura Apartments model example Portfolio Allocation model example Defining decision variables in Crystal Ball Running OptQuest Specifying decision variable
Use of PSA to Support the Safety Management of Nuclear Power Plants
 S ON IMPLEMENTATION OF THE LEGAL REQUIREMENTS Use of PSA to Support the Safety Management of Nuclear Power Plants РР - 6/2010 ÀÃÅÍÖÈß ÇÀ ßÄÐÅÍÎ ÐÅÃÓËÈÐÀÍÅ BULGARIAN NUCLEAR REGULATORY AGENCY TABLE OF CONTENTS
Linguistic Quality Assurance (LQA) as One of the Key Parts of the Localization Process
 as One of the Key Parts of the Localization Process") Linguistic Quality Assurance (LQA) as One of the Key Parts of the Localization Process An Inside Look Leonid Glazychev, Localization World Seattle, 2010. Corp. What is LQA LQA refers to assessing Linguistic
Linguistic Quality Assurance (LQA) as One of the Key Parts of the Localization Process An Inside Look Leonid Glazychev, Localization World Seattle, 2010. Corp. What is LQA LQA refers to assessing Linguistic
Mechanism Engineering College, Heping West Road NO.97th, Shijiazhuang , China
 2nd International Conference on Advances in Mechanical Engineering and Industrial Informatics (AMEII 206) Weight Calculation and Index Ranking Study of MADM Based on AHP Optimized by Topsis Chen Ran,2,a,
C. Wohlin, P. Runeson and A. Wesslén, "Software Reliability Estimations through Usage Analysis of Software Specifications and Designs", International
 C. Wohlin, P. Runeson and A. Wesslén, "Software Reliability Estimations through Usage Analysis of Software Specifications and Designs", International Journal of Reliability, Quality and Safety Engineering,
THE LEAD PROFILE AND OTHER NON-PARAMETRIC TOOLS TO EVALUATE SURVEY SERIES AS LEADING INDICATORS
 THE LEAD PROFILE AND OTHER NON-PARAMETRIC TOOLS TO EVALUATE SURVEY SERIES AS LEADING INDICATORS Anirvan Banerji New York 24th CIRET Conference Wellington, New Zealand March 17-20, 1999 Geoffrey H. Moore,
Implementation of Analytic Network Process Method for Decision Support System on Library Services Quality Assurance Based on ISO 9001
 Implementation of Analytic Network Process Method for Decision Support System on Library Services Quality Assurance Based on ISO 9001 M. Nishom* Research Scholar, Master of Information Systems, University
Safety Performance Indicators Program. Vidal, P.G.
 Safety Performance Indicators Program Vidal, P.G. Presentado en: Technical Meeting on NPP Safety Performance Indicators for Use by the Regulatory Organizations. Viena, Austria, 17-21 noviembre 2003 SAFETY
European Union Reference Laboratory for Genetically Modified Food and Feed
 Report on the Verification of the Performance of MON 87751, MON 87701, MON 87708 and MON 89788 Event-specific PCR-based Methods Applied to DNA Extracted from GM Stack MON 87751 x MON 87701 x MON 87708
Quarterly report on NPP events
 Quarterly report on NPP events January March 2017 Peinador Veira, M. Commission 2017 This publication is a Technical report by the Joint Research Centre (JRC), the European Commission s science and knowledge
Risk Management User Guide
 Risk Management User Guide Version 17 December 2017 Contents About This Guide... 5 Risk Overview... 5 Creating Projects for Risk Management... 5 Project Templates Overview... 5 Add a Project Template...
Quarterly report on NPP events
 Quarterly report on NPP events July September 2018 Peinador Veira M. 2018 This publication is a Technical report by the Joint Research Centre (JRC), the European Commission s science and knowledge service.
Chapter 4 Fuzzy Analytic Hierarchy Process of Green Supply Chain Management in the Pharmaceutical Industry
 Chapter 4 Fuzzy Analytic Hierarchy Process of Green Supply Chain Management in the Pharmaceutical Industry 4.1 Introduction During the past decade with increasing environmental concerns, a consensus, the
Introduction. Key Words: Analytic Hierarchy Process (AHP), Fuzzy AHP, Criteria weightings, Decisionmaking
, Fuzzy AHP, Criteria weightings, Decisionmaking") Application of AHP and Fuzzy AHP to Decision-Making Problems in Construction Sangwook Lee, Ph.D. University of Wisconsin-Platteville Platteville, Wisconsin The approach to selecting key factors has been
Application of AHP and Fuzzy AHP to Decision-Making Problems in Construction Sangwook Lee, Ph.D. University of Wisconsin-Platteville Platteville, Wisconsin The approach to selecting key factors has been
Table of content. B1 Time Task Manual
 Table of content Table of content... 1 Overview... 2 Configuration... 2 Prerequisites... 2 Configuration Task... 3 Configuration Time Registration... 4 Configuration Billing... 5 Configuration Permissions...
Probabilistic Risk Assessment and Management in the Nuclear Industry: Overview and Applications
 Probabilistic Risk Assessment and Management in the Nuclear Industry: Overview and Applications Mohammad Modarres Department of Mechanical Engineering Presentation at the Meeting on Nuclear Energy and
Technical Support Organization - Organization and Interfaces -
 Technical Support Organization - Organization and Interfaces - IAEA Technical Meeting TM-45318 Vienna, 15-17 May, 2013 Scientific Secretary: A. N. Kilic What is TSO? TSO is an organization with the mission
A Systematic Approach to Performance Evaluation
 A Systematic Approach to Performance evaluation is the process of determining how well an existing or future computer system meets a set of alternative performance objectives. Arbitrarily selecting performance
The Potential Utilization of the Analytical Hierarchy Process (AHP) for the Selection of a Tenure Track Faculty Position
 for the Selection of a Tenure Track Faculty Position") The Potential Utilization of the Analytical Hierarchy Process (AHP) for the Selection of a Tenure Track Faculty Position Raida Abuizam Purdue University Calumet John J. Lucas Purdue University Calumet
The Potential Utilization of the Analytical Hierarchy Process (AHP) for the Selection of a Tenure Track Faculty Position Raida Abuizam Purdue University Calumet John J. Lucas Purdue University Calumet
An Approach of Contractor Selection By Analytical Heirarchy Process
 An Approach of Contractor Selection By Analytical Heirarchy Process Multi Criteria Decision Making System Meghalkumar I Zala (PG Student) Master of Engineering in Construction Eng. & Management Birla Vishvakarma
The Grey Clustering Analysis for Photovoltaic Equipment Importance Classification
 Engineering Management Research; Vol. 6, No. 2; 2017 ISSN 1927-7318 E-ISSN 1927-7326 Published by Canadian Center of Science and Education The Grey Clustering Analysis for Photovoltaic Equipment Importance
D2M2 USER S MANUAL USACE ERDC, March 2012
 D2M2 USER S MANUAL USACE ERDC, March 2012 Content Content... 2 Glossary... 3 Overview of D2M2... 5 User Interface... 6 Menus... 6 File Menu... 6 Edit Menu... 7 View Menu... 7 Run Menu... 7 Tools Menu and
RESEARCH ON DECISION MAKING REGARDING HIGH-BUSINESS-STRATEGY CAFÉ MENU SELECTION
 RESEARCH ON DECISION MAKING REGARDING HIGH-BUSINESS-STRATEGY CAFÉ MENU SELECTION Cheng-I Hou 1, Han-Chen Huang 2*, Yao-Hsu Tsai 3, Chih-Yao Lo 4 1 Department of Leisure Management, Yu Da University of
Validation Report. Elena Nardini Marco Mazzara Joachim Kreysa. Report EUR EN
 Report on the Verification of the Performance of MS8, RF3 and GT73 Event-specific PCR-based Methods Applied to DNA Extracted from GM Stack MS8xRF3xGT73 Oilseed Rape Validation Report Elena Nardini Marco
PERFORMANCE MEASUREMENT OF DISTRIBUTION CENTRE COMBINING DATA ENVELOPMENT ANALYSIS AND ANALYTIC HIERARCHY PROCESS
 Advances in Production Engineering & Management 6 (2011) 2, 117-128 ISSN 1854-6250 Scientific paper PERFORMANCE MEASUREMENT OF DISTRIBUTION CENTRE COMBINING DATA ENVELOPMENT ANALYSIS AND ANALYTIC HIERARCHY
A STUDY OF EFFECTIVE PROCEDURAL PRACTICES IN REFINING AND CHEMICAL OPERATIONS 1
 A STUDY OF EFFECTIVE PROCEDURAL PRACTICES IN REFINING AND CHEMICAL OPERATIONS 1 Peter T. Bullemer Human Centered Solutions Independence, MN pbullemer@hcsapply.com John R. Hajdukiewicz Honeywell Advanced
TABLE OF CONTENTS DOCUMENT HISTORY
 TABLE OF CONTENTS DOCUMENT HISTORY 5 UPDATE 17D 5 Revision History 5 Overview 5 Optional Uptake of New Features (Opt In) 6 Update Tasks 6 Feature Summary 7 Demand Management 9 Forecast Unique Demand Segments
Regulatory Guide Monitoring the Effectiveness of Maintenance at Nuclear Power Plants
 Regulatory Guide 1.160 Revision 2 Page 1 of 14 Revision 2 March 1997 Regulatory Guide 1.160 Monitoring the Effectiveness of Maintenance at Nuclear Power Plants Publication Information (Draft issued as
Microsoft Excel or Microsoft Project? Why Microsoft Office Project 2007 is Easier and More Effective for Managing Projects
 Microsoft Excel or Microsoft Project? Why Microsoft Office Project 2007 is Easier and More Effective for Managing Projects Summary: Using the right tool gives project managers a distinct advantage when
Employee Performance Appraisal to Determine Best Engineer Candidates with Analytical Hierarchy Process Approach
 IOP Conference Series: Materials Science and Engineering PAPER OPEN ACCESS Employee Performance Appraisal to Determine Best Engineer Candidates with Analytical Hierarchy Process Approach To cite this article:
Improved Technical Specifications and Related Improvements to Safety in Commercial Nuclear Power Plants
 Congreso Internacional Conjunto Cancún 2004 LAS/ANS-SNM-SMSR/International Joint Meeting Cancun 2004 LAS/ANS-SNM-SMSR XV Congreso Anual de la SNM y XXII Reunión Anual de la SMSR/XV SNM Annual Meeting and
Oracle Utilities Work and Asset Management
 Compatible Units Compatible Units Oracle Utilities Work and Asset Management Volume 3 Compatible Units User Guide Release 1.9.0.4.6 E26186-02 October 2012 Oracle Utilities Work and Asset Management Compatible
Comparative Study of Risk Assessment Value against Risk Priority Number
 Comparative Study of Risk Assessment Value against Risk Priority Number Karthik. S 1, Sivakumar. A 2, Sevvel. P 3 Professor, Dept of Mechanical Engineering, Magna College of Engineering, Magaral, Chennai,
Evaluation of Software Testing Techniques Through Software Testability Index
 Evaluation of Software Testing Techniques Through Software Testability Index Ajay Kumar Assistant Professor's, Ajay Kumar Garg Engineering College, Ghaziabad Email: ajaygarg100@gmail.com Abstract : Software
Open Issues Associated with Passive Safety Systems Reliability Assessment
 International Conference on Opportunities and Challenges for Water Cooled Reactors in the 21 st Century Vienna, 27-30 October 2009 Open Issues Associated with Passive Safety Systems Reliability Assessment
Parallel Cloud Computing Billing Model For Maximizing User s Utility and Provider s Cost-Efficiency
 Parallel Cloud Computing Billing Model For Maximizing User s Utility and Provider s Cost-Efficiency ABSTRACT Presented cloud computing billing model is designed for maximizing value-adding throughput of
ENGG1811: Data Analysis using Excel 1
 ENGG1811 Computing for Engineers Data Analysis using Excel (weeks 2 and 3) Data Analysis Histogram Descriptive Statistics Correlation Solving Equations Matrix Calculations Finding Optimum Solutions Financial
Integrated Reliability Index Concepts
 Integrated Reliability Index Concepts The development of an integrated reliability index aims to inform, increase transparency, and quantify the effectiveness of risk reduction and/or mitigation actions.
AN INTEGRATED OPTIMIZATION MODEL FOR DISTRIBUTION CENTER LOCATION WITH CONSIDERATIONS OF POPULATION AND INCOME
 AN INTEGRATED OPTIMIZATION MODEL FOR DISTRIBUTION CENTER LOCATION WITH CONSIDERATIONS OF POPULATION AND INCOME Aditi Dwivedi, Department of Industrial and Systems Engineering Ohio University, Athens, Ohio
April Microsoft Corp. All rights reserved
 Select the right tools for today and tomorrow. Microsoft Project 2010 offers flexibility and choice by providing tailored work management solutions for individuals, teams and the enterprise. April 2010
NICE UPTIVITY REPORTS REFERENCE GUIDE. August
 NICE UPTIVITY REPORTS REFERENCE GUIDE August 2017 www.incontact.com Introduction NICE UPTIVITY REPORTS REFERENCE GUIDE Version: This guide should be used with NICE Uptivity (formerly incontact WFO Premise)
Demo Script. Quality Assurance Classification: Internal and for Partners. SAP Business ByDesign Reference Systems. Version:
 ) Demo Script Classification: Internal and for Partners Version: 20180131 SAP Business ByDesign Reference Systems Disclaimer This demo script is based on the ByD Reference System for the Almika model company.
Training/User Manual Work Orders
 Training/User Manual Work Orders Table of Contents Work Orders... 3 Overview... 3 Work Order Numbering... 3 Custom Work Order Numbering... 4 Details... 4 Target... 5 Attaching an Asset to a Work Order...
IAEA-TECDOC Living probabilistic safety assessment (LPSA)
") IAEA-TECDOC-1106 Living probabilistic safety assessment (LPSA) August 1999 The originating Section of this publication in the IAEA was: Safety Assessment Section International Atomic Energy Agency Wagramer
IAEA-TECDOC-1106 Living probabilistic safety assessment (LPSA) August 1999 The originating Section of this publication in the IAEA was: Safety Assessment Section International Atomic Energy Agency Wagramer
DRAFT Regulatory Document RD 337 Design of New Nuclear Power Plants Issued for Internal Review and External Stakeholder Consultation October 2007
 DRAFT Regulatory Document RD 337 Design of New Nuclear Power Plants Issued for Internal Review and External Stakeholder Consultation October 2007 Draft release date: 18/10/07 CNSC REGULATORY DOCUMENTS