LEAN-MOD: AN APPROACH TO MODULAR CONSTRUCTION MANUFACTURING PRODUCTION EFFICIENCY IMPROVEMENT
|
|
|
- Madlyn Craig
- 6 years ago
- Views:
Transcription
1 University of Alberta LEAN-MOD: AN APPROACH TO MODULAR CONSTRUCTION MANUFACTURING PRODUCTION EFFICIENCY IMPROVEMENT by Mansooreh Moghadam A thesis submitted to the Faculty of Graduate Studies and Research in partial fulfillment of the requirements for the degree of Doctor of Philosophy in Construction Engineering and Management Department of Civil and Environmental Engineering Mansooreh Moghadam Spring 2014 Edmonton, Alberta Permission is hereby granted to the University of Alberta Libraries to reproduce single copies of this thesis and to lend or sell such copies for private, scholarly or scientific research purposes only. Where the thesis is converted to, or otherwise made available in digital form, the University of Alberta will advise potential users of the thesis of these terms. The author reserves all other publication and other rights in association with the copyright in the thesis and, except as herein before provided, neither the thesis nor any substantial portion thereof may be printed or otherwise reproduced in any material form whatsoever without the author's prior written permission.
2 ABSTRACT Modular construction manufacturing (MCM) is superior to the current on-site construction system which is hampered by inefficiency and material and process waste. Modular buildings are potentially built through a more efficient and costeffective method, but in the current manufacturing-based approach, a gap still exists between design and production. The increased interest in modular buildings demands special methods of design and manufacturing to support effective production operation. MCM provides opportunity to apply Lean for production efficiency in the plant. Lean is a concept first developed in the manufacturing industry which has been since adapted to the construction industry. Although the focus of Lean in both industries is the same, Lean principles vary between manufacturing and construction since these two industries differ in nature. Lean as the concept is applicable to any industries, taking into consideration that MCM has characteristics of both manufacturing and construction yet is distinct and should be seen in the class of its own. Given the distinct nature of MCM, the technical elements in Lean production and Lean construction are not sufficient to achieve the Lean goals for MCM industry, necessitating a modified framework by which to exploit the potential benefits of modular building. The focus of this research is to develop a framework that supports manufacturers needs for design and which encompasses the integration of Lean into production process. In this research, Lean is adopted for the MCM industry in order to improve production process efficiency which is introduced as Lean-Mod. To apply the proposed Lean-Mod strategies on a factory production line, an enhanced
3 integrated approach of Building Information Modeling (BIM), Lean, and simulation is proposed. Integrating these concepts involves transferring generated data from a BIM model to the manufacturing phase, where Lean strategies are applied, and evaluating the production process scenarios through simulation modeling. The simulation model of production flow evaluates improvement from the Lean point of view and provides assessment of potential scenarios. The proposed methodology is validated by a case study a residential modular factory located in Edmonton, Canada and illustrates the effectiveness of the proposed methodology.
4 ACKNOWLEDGEMENTS Undertaking this PhD has been truly a life-changing experience for me and it would not have been accomplished without appreciated support from people who have helped and inspired me during this journey. It has been a great privilege to spend several years in the Department of Civil and Environmental Engineering at the University of Alberta. First and foremost, I would like to express my sincere gratitude and respect to my supervisor, Professor Mohamed Al-Hussein, for his continuous support and encouragement. His immense knowledge, valuable advice, and insightful guidance accompanied me throughout the years of my research. His vision and dedication was invaluable and indispensable in my efforts towards finishing this research work. It was a great honor to work under his supervision. Special thanks go to Tarry Tweed, president of Igloo Prebuilt Homes, for his guidance and support. He provided me the opportunity to work with his team and gave access to Igloo s factory as testing grounds for this research. I also acknowledge the assistance of Jonathan Tomalty for his continuous support in proofreading my work. I would like to express my deep appreciation to my loving husband, Reza, for his love, patience, understanding, and sacrifice which gave me motivation to finish my research work. I would like to thank him for his constant support and for being there for me at all times. He has been always a true and great supporter. I would not have made it this far without him. I owe special thanks and appreciation to my parents, for their unconditional love and endless encouragement throughout my life. They taught me the spirit of perfection and gave me strength to chase my dreams. Their patience and sacrifice will remain my inspiration. I could never thank them enough and I always appreciate everything they have done for me. My deepest love and thanks goes to my lovely sister and my kind brother for their constant motivation.
5 TABLE OF CONTENTS 1. Introduction Research Motivation Research Objectives Organization of Dissertation Literature Review Background in Building Information Modeling (BIM) BIM Application in Construction Barriers to BIM Application Background in Lean Production The Toyota Production System Concepts Lean Production Concepts and Techniques Value Stream Mapping (VSM) Background in Lean Construction Industrialization of Construction Modular Construction Manufacturing (MCM) Factory Production Line BIM and Lean Integration Data Exchange in Construction Industry Products Variety in Construction Manufacturing Lean Strategies for Products with Variation Scheduling for Products with Variation Simulating the Production Process... 44
6 2.9. Post-Simulation Visualization Proposed Methodology: Lean-Mod Defining an Enhanced Paradigm of Lean for Modular Construction Manufacturing Comparison of Manufacturing and Construction Characteristics Comparison of Lean Production and Lean Construction Strategies Lean for Modular Construction Manufacturing Strategies for Adopting Lean-Mod Production Leveling Customization and Standardization Scheduling Production Flow Material Ordering and Material Handling Quality Lean-Mod Integrated Tool Phase I - Generating Data from the BIM Model Phase II - Production Line Assessment through Time Study Phase III - Production Process Analysis to Propose Improvements Phase IV - Developing Simulation Model Phase V - Developing Post-Simulation Visualization Model Implementation IN Case Study Introduction Phase I - Generating Data from the BIM Model... 97
7 Current Practice Defects of Case Study BIM Implementation Advantages for Case Study BIM Implementation Objectives and Challenges for Case Study Generating Data from the BIM Model Phase II - Production Line Assessment through Time Study Process Flow Study Production Process Assessment Phase III - Production Process Analysis to Propose Improvements Lean Transformation Recommendations for Efficiency Improvement Phase IV - Developing Simulation Model Current-State Simulation Future-State Simulation Phase V - Developing Post-Simulation Visualization Model D Animation and Process Evaluation Dynamic Visualization of the Simulation Results Conclusion and Recommendations Summary and Concluding Remarks Research Limitations Research Contributions Recommendations for Future Research Bibliography Appendix A: Glossary
8 Appendix B: Value stream map symbols and definition Appendix C: Simphony simulation elements and definitions
9 LIST OF TABLES Table 1: Resource plan allocation for scheduling Table 2: Case-studies: manufacturing level and produced module Table 3: Case study project specifications Table 4: Door schedule Table 5: Window schedule Table 6: Room schedule Table 7: Wall Schedule Table 8: Sample wall properties Table 9: Goodness of fit test for man-hour data distribution for exterior wall Table 10: Goodness of fit test for man-hours data distribution for interior wall Table 11: Goodness of fit test for productivity data distribution for exterior wall Table 12: Goodness of fit test for productivity data distribution for interior wall Table 13: Total man-hours for sample modules in time-study Table 14: Current-state simulation results Table 15: Labor requirements and labor fluctuation at floor station for different scenarios Table 16: Labor requirements for scenario 3 with 8-hour Takt time Table 17: Calculation parameters of the simulation model Table 18: Scenario analysis for future-state production process
10 LIST OF FIGURES Figure 1: Research methodology... 6 Figure 2: BIM viewed as a sociotechnical system (WSP 2013) Figure 3: Toyota Production System house Figure 4: Five Lean principles according to Womack and Jones (1996) Figure 5: Typical production task layout of a modular building Figure 6: Modular factory production line driven mainly by human-performed tasks Figure 7: Semi-automated modular factory production line Figure 8: Labor requirements of production tasks for two modules Figure 9: Labor requirement for production of succeeding modules Figure 10: Labor requirements for flooring station Figure 11: Balancing labor requirement using flexible crew size Figure 12: Sample schedule to fabricate a module Figure 13: Production line schedule for sample modules Figure 14: Ideal production line schedule for sample modules Figure 15: Typical task flow chart for modular construction manufacturing Figure 16: Current-state VSM of a residential modular factory Figure 17: Process mapping through stick notes on the wall Figure 18: Sample process map for one station Figure 19: Proposed research methodology Figure 20: Schemata for the process of generating data from the BIM model Figure 21: Production line flow analysis through time study process Figure 22: Process by which to identify and present improvement recommendations Figure 23: Sample collected information for one module Figure 24: Hand sketch value stream map for the case study... 89
11 Figure 25: Process for generating and evaluating the future-state through simulation Figure 26: A snapshot of the PSV model developed in 3ds Max Figure 27: Snapshot of the PSV model developed in Navisworks Figure 28: 3D view of the model Figure 29: 3D view and section view of the model Figure 30: Structural framing view of the model Figure 31: Sample production drawing Figure 32: Floor joint plan for production Figure 33: Wall panel layout for production Figure 34: Wall framing detail for production Figure 35: Product flow through the production line Figure 36: Material and information flow through the production line Figure 37: Wall framing station Figure 38: Correlation of total number of components in walls and required man-hours Figure 39: Correlation of converted wall length and required man-hours Figure 40: Probability Density Function of exterior wall man-hour requirement Figure 41: Probability Density Function of interior wall man-hour requirement Figure 42: Probability density function of exterior wall productivity rate Figure 43: Probability density function of interior wall productivity rate Figure 44: Floor station Figure 45: Correlation of converted floor length and required man-hour Figure 46: Roof/Ceiling station Figure 47: Correlation of roof/ceiling converted length and required man-hours Figure 48: Wall set and cubing station Figure 49: Correlation of cubing converted factor and required man-hours
12 Figure 50: Developed interface to automate production assessment Figure 51: Current-state value stream map of the case study Figure 52: Storage area before 5S event Figure 53: Storage area after 5S event Figure 54: Portable work-carts and material staging point Figure 55: Proposed future process map to move wall assembly activities upstream Figure 56: Current process duration Cubing of a module at an early station Figure 57: Propose process duration Cubing of a module at a later station Figure 58: Floor station prior to implementation of proposed improvement Figure 59: Floor station process map prior to implementation of proposed improvement Figure 60: Floor station after implementation of proposed improvement Figure 61: Floor station process map after implementation of proposed improvement. 143 Figure 62: Roof station existing platform to frame roof/ceiling Figure 63: Roof station deficiencies Figure 64: Current-state simulation model Figure 65: Output chart from the simulation module for processing time Figure 66: Processing hours for different modules at the floor framing station Figure 67: Processing hours for different modules at the roof framing station Figure 68: Total processing hours for sample modules in the current-state Figure 69: Processing time variation for sample modules in current-state Figure 70: Future-state VSM simulation model Figure 71: Sample output chart of future-state simulation model Figure 72: Further analysis by means of PSV model Figure 73: Plant model for layout configuration PSV Figure 74: PSV model of scenario 3 with 8-hour Takt time
13 LIST OF ABBREVIATIONS BIM Building information modeling CPM Critical path method DES. Discrete event simulation JIT.. Just in time LPS... Last planner system LSM Linear scheduling method MCM. Modular construction manufacturing PDF.. Probability density function PSV Post simulation visualization TPS. Toyota production system VSM. Value stream mapping WIP... Work in progress
14 1. INTRODUCTION 1.1. RESEARCH MOTIVATION The current on-site (stick-built) construction process is hampered by inefficiency and material and process waste. The process also limits opportunities for technological and productivity innovations. Modular buildings are potentially built through a more efficient and cost-effective engineering method that can deliver market requirements for increased construction speed, improved quality, and rapid return on investment, but in current manufacturing-based approach to construction a gap still exists between drafting and the production line (Moghadam and Al-Hussein 2013). Meanwhile, interest in a manufacturing approach to building is increasing, which necessitates improvement in production efficiency to meet growing market demand. Improving the modular industry requires special techniques and tools for design and manufacturing of modular buildings. Currently planning and scheduling tools are mainly tailored to supporting traditional (on-site stick-built) construction, without considering the unique characteristics and demands of the modular construction manufacturing (MCM) process (Moghadam et al. 2011). In order to facilitate accurate planning from the early stages of a project, there is a need to adopt advanced tools and concepts for MCM. There are two concepts that can be adopted for the MCM industry to improve the efficiency of design and production processes: Building Information Modeling (BIM) and Lean. BIM and Lean are two distinct concepts in the construction industry and each impacts the construction process differently. Although the two areas are independent and are separately applied to the construction process, the benefits can be maximized by integrating BIM and Lean. BIM provides new capabilities in construction and supports the creation of an integrated design and construction process that increases quality while reducing the cost and duration of a project (Eastman et al. 2008). In addition, MCM provides opportunities to apply 1
15 Lean for production efficiency in the plant, thereby eliminating waste and supporting the delivery of products in a shorter time and at a lower cost. Integrating BIM and Lean brings about even more benefits to the design and manufacturing process. BIM provides the basic data which can be used as input for Lean application throughout production process. It is applicable to all of the project stages and helps reduce waste from the conceptual design stage to construction (Arayici et al. 2011). BIM also provides benefits particularly in applying Lean and supporting the construction phase. Once a model is created in BIM, it is front-loaded with information, including the building components schedules, material take-offs, and fabrication elements. Such information is used throughout the production and construction phase. Moreover, in order to support manufacturers needs for design and drafting, which involves the incorporation of Lean into construction, the integration of BIM with Lean is required. Lean production is a concept first developed for Toyota Production System (TPS) to reduce waste from the production process in order to improve the production process (Singh et al. 2010). Lean production has been widely used in the manufacturing industry as the foundation for efficiency improvement in manufacturing. More recently, potential applications of Lean production for construction process improvement have been identified (Winch 2003), and Lean has since been adapted to the construction industry as a new production philosophy referred to as Lean construction. Although the focus of Lean in both industries is the same, to reduce waste, increase value for the customer, and achieve continuous improvement (Howell 1999), Lean principles vary between manufacturing and construction since these two industries differ in nature. Modular manufacturing construction provides opportunities to apply Lean strategies for production efficiency in the plant, taking into consideration that MCM has characteristics of both manufacturing and construction yet is distinct from both and should be seen in a class of its own. The technical elements in Lean production or Lean construction, however, are not sufficient to achieve the Lean goals of MCM, thereby necessitating a new framework by which to capitalize 2
16 more fully on the capabilities brought by modular building. The unique characteristics of the MCM industry require adapted strategies which can adequately fulfill the production efficiency demands of modular building. In this research, based on the characteristics of MCM, Lean principles are modified accordingly and proposed as Lean-Mod to satisfy production efficiency requirements. Fundamental changes in the production process must be made in order to transfer the system from a traditional process to a Lean-implemented process, which complicates Lean implementation. A tool to facilitate the decision making process by quantifying the expected benefits of Lean application at the planning and evaluation stages is required (Detty and Yingling 2000). Simulation is a technique to facilitate identification of the changes and benefits of Lean. On the other hand, to make improvements on a production line within the context of Lean, the integration of simulation tools and Lean strategies brings about a more effective approach for process management. A simulation model of the production process is able to challenge the impacts of Lean on line balancing and predict the results (Shararah et al. 2011). In addition to component interaction, product variation is inevitable in process management of MCM due to the fact that customer demands affect the process must be considered in the future-state. Current tools in Lean do not consider variability in evaluation of the process, thus necessitating plans to improve the future-state considering variability. Therefore simulation of the future-state can be used to evaluate and quantify the potential benefits of Lean prior to the transformation process (Marvel and Standridge 2009). In summary, a model which defines rules to balance the production flow considering product variation as an inevitable element in MCM is required. The scope of this research is the fabrication of modular buildings in a factory environment. Several alternative terms are used within the construction industry to refer to factory-based production techniques, such as industrialization, modular building, structural panel construction, modern methods of construction, and offsite construction. In this research, Modular Construction Manufacturing (MCM) 3
17 and modular buildings are the terms used to refer to the method of construction and the product, respectively. Modular buildings are made of components prefabricated in a factory. The structure of a given modular building may vary from a single box to a more complex configuration of adjoining boxes. Modular buildings can be constructed for a variety of applications, such as residential housing, high-rise buildings, and commercial facilities. The focus of this research is on improving factory production efficiency for MCM. The factory production line consists of a series of workstations where specific tasks with defined resources are carried out on parts of a module as it passes through each station. The entire production process is divided into small work packages which are assigned to stations along the line. The challenge in creating work flow and balancing the production lies in the assignment of work packages to stations considering the activity precedence network and plant physical constraints. In some modular factories, the entire process is performed by humans while, in some of the more industrialized factories, many of the tasks are performed by machines. Either way the production tasks are the same, but the time spent at each station varies. The modular manufacturing process is a complex operation due to product variation caused by customers demands, which in turn affects production efficiency by requiring deviations from a standard work process. In this research, the effect of variety on efficiency of the production process is investigated RESEARCH OBJECTIVES This research is built upon the following hypothesis: Integrating production requirements for work flow balancing with the BIM model within the Lean-Mod strategies will improve the production efficiency of modular construction manufacturing. 4
18 This research proposes a new approach to apply Lean within the modular building industry, and a set of principles are introduced as Lean-Mod strategies. To apply these strategies on a factory production line, an enhanced integrated approach of BIM, Lean, and simulation is proposed which improves the productivity of the modular building industry. The research objectives are outlined as follows: To provide a deeper understanding of MCM and the difference between the manufacturing, construction, and MCM industries, as well as to compare Lean manufacturing to Lean construction. To identify challenges in MCM industry and adopt Lean principles which can adequately fulfill the production efficiency demands based on particular characteristics of MCM. To develop an integrated tool which gains the advantage of BIM model in manufacturing phase, quantifies resource requirements, and simulates the future-state of the production process for potential scenario evaluation before actual implementation. To achieve the research objectives, it is required to develop both an underlying management theory and process control technique. The first section of this research methodology focuses on the adoption of Lean for MCM and proposes Lean-Mod strategies. In the following section, an enhanced integrated approach of BIM, Lean, and simulation is presented and its application to a factory production process is discussed. With respect to this approach, several procedures are implemented to achieve the research objective as presented in Figure 1. In the proposed integrated model, the components schedule and material take-offs are extracted from the BIM model by means of a BIM platform. The methodology provides an effective method of estimating resource requirements for component fabrication by performing a time study and analyzing collected data. Also, the production process is studied in order to identify process deficiencies. A number of recommendations are then proposed to improve production efficiency based on current Lean principles and the proposed Lean-Mod strategies. A simulation 5
19 model is subsequently generated in order to evaluate the proposed future-state. As a result, the resource requirements to complete various modules can be determined, along with potential scenarios for work flow balancing. In order to facilitate the decision making process, a post-simulation visualization model is developed to evaluate near-optimum scenarios. The methodology of this research is examined by means of a case study of a modular manufacturing company. Criteria Module s dimension Available equipment Sustainability Constructability Time Study Study production process Study individual activities Record task duration Record resources requirements Input Architectural / Structural / MEP Modularity / Framing method Building Information Modeling 3D Model and design drafts Material quantity takeoff list Dimensional properties Standards ISO standards Material specification City bylaw National building code Lean Implementation Study production flow and work sequence Create current product, material, and information flow Production Line Assessment Analyze data to find correlation between effective variables Define proper distributions and associated parameters Quantify activities probabilistic and actual resource requirement Production Line Analysis Find bottlenecks, waste and none-value adding activities Calculate current cycle, lead, and Takt time and yield rate Create current state value stream map of production process Inputs Module s dimension Building design Various resource requirements Production flow Production rate and duration Integrated Process Developing simulation model of production process Evaluating the simulation results and repeat the process to find a near optimum solution Developing post simulation visualization model of optimum production scenarios Result Criteria Factory layout Available resources Factory working hours Customer demand schedule Target value and Schedule Processing time Takt time Lead time Resource utilization Productivity rate Optimized scenario Figure 1: Research methodology 6
20 1.3. ORGANIZATION OF DISSERTATION This thesis consists of five chapters. Chapter 1 describes the research motivation and objectives and outlines the organization of the thesis. Chapter 2 provides a background on BIM and Lean and reviews existing research on the integration of BIM with Lean, as well as studying factory-based production practices. This chapter also discusses the effect of product variation on productivity, considers recent attempts toward interoperability and data exchange, and introduces relevant mathematical and quantification models developed to increase productivity in the production line. Finally, the application of simulation and post-simulation visualization and the supportive effects on Lean are discussed. Chapter 3 outlines the research methodology. The first section looks at adoption of Lean production and Lean construction for MCM, and the proposed Lean-Mod strategies are discussed. The second section introduces an integrated tool by which to apply these strategies on a factory production line. The process to develop this tool is divided into five main phases: (1) generating of data from the BIM model; (2) assessment of production line by means of a time study; (3) analysis of production process and propose improvements; (4) development and evaluation of a simulation model; and (5) development of a post-simulation visualization model and evaluation of near-optimum scenarios. Chapter 4 describes the implementation of the research methodology on the case study. In this research the production processes of various MCM plants are studied in order to gain a thorough understanding of processes for different types of MCM. The construction processes of a number of sample modules are monitored through a time study in a residential modular factory in order to define a quantification model for estimating resource requirements. A BIM model of one of the sample modules is generated to extract the components schedule and 7
21 quantity take-off list. Recommendations for efficiency improvement are then discussed. Finally, simulation and post-simulation visualization models of the proposed changes are developed for evaluation purposes. Chapter 5 concludes the research with a summary and comments concerning the value of the proposed methodology based on the findings and deliverables of this research. This chapter also outlines the research contributions and limitations, and proposes some recommendations for future research. 8
22 2. LITERATURE REVIEW The literature review for this research is driven by the hypothesis and based on an examination of the tools needed to achieve the objectives. As such, the literature review focuses on the application of the following tools and concepts within the construction industry BACKGROUND IN BUILDING INFORMATION MODELING (BIM) The concept underlying building information modeling (BIM) has existed in the design and construction fields since the 1970s (Eastman 1974), and serves to discriminate architectural 3D modeling with rich information from traditional 2D drawings. The term, building information model, first was introduced in a paper by van Nederveen and Tolman (1992). BIM can be viewed as both the product and the process. BIM as a process represents the process of generating a digital model to represent the design, constructability, and operation of a facility. The resulting model as the product is a simulated version of a facility which is intelligent, parametric, and data-rich. Users with different needs in terms of data requirements extract related information from the model to facilitate decision making and to support the construction process (Azhar et al. 2008). All information pertaining to the facility, such as the physical and functional features of all components, is included in BIM, along with the project s life cycle information, which is stored in a series of smart objects (CRC 2007). The ultimate goal of BIM is to integrate and exchange all information generated for a project in a single database to be used by all the project stakeholders from design to construction throughout the project life cycle. The anticipated result of a BIM model is 3D imaging of the facility with related physical and performance data included in all the components in the model (Holness 2007). 9
23 BIM Application in Construction Implementing and transferring the generated information through a project life cycle is of significant concern in the construction industry, and this task should encompass improving the efficiency and effectiveness of construction projects through the project lifetime and across various trades and disciplines (Jung and Joo 2011). BIM is capable of maintaining and supporting different functions in a project; however, its application is relative in nature and dependent on the features of each project and the disciplines involved in modeling particular projects. BIM in construction has a variety of purposes and benefits, of which the following are used in this research (Azhar et al. 2008; Ashcraft 2008; Kreider et al. 2010): Single data entry with multiple uses: in construction practice, generated data must be multiple times by multiple disciplines and organizations. Application of BIM significantly reduces the probability of errors during data entry, data exchange, or versioning since the consolidated data is being drawn from a unified data source. Visualization: the 3D model can be generated in-house and used for sequencing and constructability reviews. It enables understanding of the challenges involved in construction, evaluation and optimization of the construction sequence, and evaluation of the effect of construction delays. Design efficiency: BIM can reduce rework, especially when design is changing rapidly. Conflict and interference detection: a BIM model allows users to explore the model visually, detecting physical conflicts and interferences, and resolving issues in the context of an active model. Take-offs and estimating: the required data to generate material lists, dimensional properties, productivity analysis, material costs, and related estimating information is included in the model based upon project 10
24 demands. The links among generated information support automated production of material take-offs and revision of the information after any changes to design, thereby reducing the error and misinterpretation caused by manual estimation. Fabrication and shop drawings: BIM reduces the detailing effort to generate shop or fabrication drawings. Since conflicts are resolved during design, fabrication accuracy is increased and delivery of accurate prefabricated material is assured. Alternative scenario visualization: BIM enables evaluation of alternatives to determine best the solution benefiting the entire design. Reduced fabrication costs and errors: since data is included in the model, dimensional errors, conflicts, and integration errors can be avoided or significantly reduced. Furthermore, lessons learned from previous errors encountered during design can be archived through the BIM clash detection database to avoid repetition of errors. A BIM model is generated by transferring data from the design tools to a graphical 3D representation of the building. The model is capable of adding further dimensions such as the fourth dimension of time (duration) for scheduling and the fifth dimension of cost for estimating. A BIM model generates automatically a bill of materials and shop drawings which makes the design process more efficient. The challenge to implement and benefit from a BIM model is in creating an integrated tool which facilitates sharing and transferring the produced data through the entire project life cycle and among all project stakeholders from design to construction. For this purpose, not only is advanced technology needed, but also a cultural change is an important element of achieving this objective. Since there is a requirement for both technological and cultural change, BIM is identified as a sociotechnical system. An approach to work design which involves recognition of the interaction between technology and its application in society is called a sociotechnical system 11

25 (STS). BIM is considered a system because of its characteristics as a unified entity containing many physical and non-physical interacting parts. It is also sociotechnical because of its technical core with related social aspects. The progression of the technical core through feedback loops is impacted by the social segments, while the 3D modeling and data supervision is done by the software at the technical core of BIM. The more the software is used, the more comprehensive an understanding of the technical core will be achieved. This will be more obvious as the technical core initiates from social practices by expanding the possibilities (Figure 2). Although primarily it implies more intense collaboration between different disciplines, ultimately it will generate an entirely new institutional and cultural environment (WSP 2013). Figure 2: BIM viewed as a sociotechnical system (WSP 2013) Barriers to BIM Application Despite BIM s advantages, its adoption faces significant barriers. Some of the barriers observed in this research are listed below: People: the largest latent barrier to the application of BIM is the allocation of time and human resources to the training process and to changing the work process and work flow (Yan and Damian 2008). 12
26 Tools and technology: different disciplines, such as architectural, structural, procurement, and fabrication, use different models. There is no single tool that can satisfy all participants needs. Also, despite the fact that there are several BIM tools and software applications in the market, there are relatively few best practice projects. In this respect, organizations typically are not confident about these technologies until they put them into practice. Data exchange and interoperability: there are usually a number of different BIM models utilized throughout the life cycle of a project. In current practice, there are differences in capability between BIM software and the ability to have a round-trip translation of generated data (Ashcraft 2008). Collaborative framework: all project participants are required in the creation and use of the model to contribute to the success of the BIM initiative (Eastman et al. 2008). However, there is no standard collaborative framework and, hence, organizations need to develop procedures of their own to support the process. Knowledge management: Although in current practice BIM is capable of avoiding error repetition by archiving previous errors in a clash detection database, this ability is not open for regular users and requires experts who are familiar with software architecture. In this research, BIM technology is used to generate the required data for design and production of modular buildings and transfer the generated data to the procurement and construction phase in order to leverage the benefits of BIM BACKGROUND IN LEAN PRODUCTION Lean Production is a management philosophy derived from the Toyota Production System (TPS) developed at Toyota by Taiichi Ohno, Shigeo Shingo, and Eiji Toyoda between 1948 and 1975 to facilitate waste reduction in the TPS (Ohno 13
27 1988 and Shingo 1988). The TPS manages manufacturing and logistics for the automobile manufacturer, as well as collaborations with suppliers and customers, with an emphasis on waste identification and elimination by means of particular tools and techniques. The term Lean production was first used by Krafcik (1988) and; later, Womack et al. (1990) used the term, Lean production, to contrast Toyota with the western mass production system in his book, The Machine that Changed the World (Holweg 2007). Describing the development and growth of Lean production in the automobile industry, this book has become one of the most widely cited references in operations management. The term, Lean, is used with regard to Lean production because fewer resources are used in production when compared to mass production (Koskela 2000). Eliminating waste from the production system in order to respond effectively to customer needs while manufacturing high quality products as efficiently and economically as possible is the focus of Lean production (Singh et al. 2010). Waste takes many forms, consuming resources without adding any value to the product. A key step in Lean and TPS is the identification of which steps in the process add value and which do not. To be able to improve the value-added activities and eliminate waste, all process activities should be allocated into one of these two categories. Toyota has identified seven major types of waste as follows (Liker 2004): 1. Transportation: unnecessary movement of parts between processes which does not make any transformation to the product that the customer is willing to pay for. 2. Inventory: any form of inventory, including raw materials, work-inprogress (WIP), and finished goods, that has not yet produced value to the customer. 3. Motion: unnecessary movement by individuals, such as looking for materials, reaching for tools, or asking for information. 14
28 4. Waiting: both people and parts that wait for a work cycle of upstream activity in order to be completed. 5. Over-processing: processing beyond the standard required by the customer either spending more time on a piece than is required or using components that are more precise, higher quality, or more expensive than required. 6. Over-production: producing products earlier, faster, or in greater quantities than demanded by the customer. 7. Defects: rework and replacement, which entail extra costs and rescheduling The Toyota Production System Concepts The Toyota Production System (TPS) was established based on two concepts: (1) preventing production of defective products by stopping the equipment instantly after a problem appears, which is called Jidoka and is translated to automation with a human touch; and (2) Just-in-Time (JIT), which means production of only what is needed by the next process, and right when it is needed, in a continuous flow (Liker and Morgan 2006). Figure 3 depicts the TPS house as originally presented by Fujio Cho in the 1970s (Glenday 2011). 15
29 House of Toyota Production System Goal: highest quality, lowest cost, shortest lead time Just-in-Time Continuous flow Takt time Pull system Kanban Jidoka Stop and notify of abnormalities Separate human work and machine work Heijunka Standardized work Kaizen Stability Figure 3: Toyota Production System house Just-in-Time means producing exactly what is needed, exactly when it is needed, at the exact required volume. The JIT philosophy is built upon the underlying goal of eliminating inventory waste and any other non-value-added processes. In particular, in a production system where JIT is implemented, pulled materials in the system are delivered to each production step exactly when they are needed. To control the flow of product, materials, and information, JIT is implemented in the system through elimination of all types of waste and continuous improvement (Benton 2011). The basic condition of a JIT system is to implement a continuous flow (Ohno 1988). Flow in Lean means the raw material is ordered just for the customer s needs, when the customer s order is received. The raw material is then received immediately at the manufacturing plant and flows throughout the system, and the final product is delivered immediately to the customer afterwards (Liker 2004). Various types of waste, such as over-production, waiting, and inventory, are eliminated through a smooth, continuous, JIT production flow. The strategy used in Toyota when continuous flow is not possible is an inventory buffer called Kanban or supermarket. This process is basically an inventory 16
30 control system within the context of JIT production practice to prevent overproduction by eliminating inventory. The Kanban process uses a Kanban card to line up inventory volume with the real raw material usage. When a raw material is used up in the production line a signal will be sent via a Kanban card to produce and deliver a new shipment of the material. A tracking system over the replacement cycle tracks the Kanban signals to ensure the visibility and traceability of the orders to both the material provider and the consumer. Kanban supports production leveling, also known as Heijunka, in which each stage needs to be able to manufacture the volume needed at the time it is needed. The production leveling technique is implemented to meet customer demand by determining appropriate quantities. This technique helps the organization to maintain a daily schedule of production based on customer needs in a smooth work flow while minimizing inventory and interruption. The goal is to keep the demand and supply at the same level to eliminate both under-production and overproduction by maintaining Takt time as the key to scheduling and, hence, leveling the production. Takt in lean production is the rate of customer demand and Takt time is the production cycle time to meet the customer s demand rate. The quality control tool used by Toyota in TPS is called Jidoka, and this controls the quality of the product in every step of the process. Jidoka supports identification of defects as soon as they occur by making the process visible. In this system, each team member is in charge of performing quality checks on the product in their step before delivering it to the next step through the production line. Defects are required to be resolved instantly, even if the production line needs to be stopped. Jidoka addresses basics to ensure delivery of foolproof product and quality maintenance through the production process, including: (1) going to the source: identifying the source of the problem and resolving it, normally leading to significant improvements by providing thorough understanding of the problem; (2) standardization: using standardized procedures to guarantee quality, maintains the production pace, and enable continuous improvement; and (3) mistake-proofing: using mechanisms to prevent users from 17
31 making any mistakes (Poka-yoke), thereby eliminating product defects and errors by preventing, correcting, or drawing attention to human errors Lean Production Concepts and Techniques According to Womack and Jones (1996), thinking in a Lean way enables companies to specify value, create the best sequence to deliver value, create uninterrupted flow of activities based on customer demand, and explore avenues for continuous improvement. Five principles of Lean follow from the aforementioned statement, as illustrated in Figure 4 and described in greater detail in the section below: Value, Value Stream, Flow, Pull, and Perfection. Identify value Seek perfection Map the value stream Establish pull Create flow Figure 4: Five Lean principles according to Womack and Jones (1996) 1. Specify the value from the customer point of view for specific products: The definition of value is to fulfill a need as defined by the customer at the right time at an appropriate price. While value can only be defined by the end customer, it is vital to the initiation of Lean. 2. Map the value stream: a value stream can be drawn by identifying and defining of the sequence of occurrences to the product at each step, from design, to order, to raw material, to delivery. Three types of activities are defined in the value stream: (1) value-added: activities that clearly add 18
32 value; (2) type one Muda or non-value-added: these are the activities that clearly do not add value but cannot be avoided due to the given restraints or current technologies; (3) type two Muda or waste: these are activities that clearly do not add any value to the product and can be instantly removed from the stream. 3. Create continuous flow for value through the value stream: Flow is defined as continuous and progressive movement of activities to deliver a product from the initial state as a raw material and from the design phase to a finished product in the hands of the customer. To promote flow, the organization can make immediate alterations to the tools and machines being used in production and put all sequential steps and processes in the production line one after another. 4. Pull the value from the value stream by the end-customer: a pull system is achieved when the product is delivered through the production flow from a downstream workstation to an upstream workstation once the downstream customer signals a need to upstream. This is the opposite approach of pushing products through a production system, in which the system keeps manufacturing products independent of the customer needs, eventually leading to over-production and extra inventory. 5. Pursue perfection: perfection is the desired end-state of Lean when all types of Muda are eliminated and all activities create value through the entire production process. Lean is a never-ending process due to the fact that there will always be some kind of Muda in the system, therefore full elimination of Muda is an ultimate goal in Lean. Over the years, various Lean tools and techniques have been developed to provide significant productivity improvement for companies. Once companies identify waste in their process, they can then match the sources of manufacturing waste with appropriate Lean tools. Some of the Lean tools used in this research are as follows: 19
33 Cellular manufacturing: The challenge in creating a smooth production flow through the process is to categorize groups of individual activities into families; allocate machines and materials to proper workstations, also known as cells; and assign qualified operators to particular cells. The application of cellular manufacturing reduces significantly set-up time, WIP inventory, throughput time, material handling costs, and also improves product quality through a simplified scheduling approach (Pattanaik and Sharma 2009). Process map: the complexity of the production process is simplified through a process map by measuring specific elements such as duration, quantity, cost, and resource utilization. The process map ensures participation of all appropriate stakeholders to demonstrate the work process and define the starting and finishing points of activities in order to create an efficient and useful tool (Morrow and Main 2008). Facility layout diagrams: this tool supports identification of waste activities caused by space and machine inefficiency within the production line and cell, and through the entire process, including management, inspection, transportation, and storage of inventory in the form of raw materials, WIP, and finished goods (Pavnaskar et al. 2003). 5S: this technique results in a well-organized workplace complete with visual controls and order by ensuring that there is a place for everything and that everything is in its place. There are five primary 5S phases: (1) sort: eliminate all unnecessary tools and keep only essential items; (2) set in order: arrange the tools in such a way that they are readily accessible and the work in a way that it flows free of waste; (3) shine: sweep and clean the work area and keep tools clean, tidy, and organized; (4) standardize: define the normal condition of the work area and uniform procedures and set-ups throughout the operation; and (5) sustain: implement solutions to address the root causes of work area organization 20
34 issues. For successful implementation of this approach, all employees must be properly trained and use visual management techniques. Value Stream Mapping (VSM): mapping the entire production process, including both material and information flow is a tool by which to identify all activities and categorize them as either value-added or waste, with the goal of eliminating the latter. (Rother and Shook 2003). This tool is known as the language of Lean, since it provides a common language for describing the manufacturing process, and is the most commonly used tool in Lean Value Stream Mapping (VSM) One of the most powerful tools in Lean is VSM, which is basically a pencil-andpaper technique. The value stream map graphically represents the flow of materials and information through the production line as value is added to the product (MHRA 2007). Mapping the process helps give a clear picture of the production process and assists in the identification of hidden problems and existing waste. Using VSM, the Lean team is able to assess and optimize the entire production process and not only individual tasks. VSM also creates a map by which to identify the future-state of the system, called the future-state map, which provides a picture of the Lean transformation process. The required improvements to the current state and an overall concept of how the factory should ideally operate are identified and presented in a future-state value map (Marvel and Standridge 2009). Lean production focuses on continually adding value, as defined by the customer, to a product through the VSM process. Two types of value streams are mapped in Lean: product flow and production flow. Production flow considers different stages and steps of designing flow from concept to delivery, while product flow is the flow of the product itself from raw material to finished good. In Lean, material and information flow are mapped through the two types of value streams, facilitating finding the value-added and waste activities through the processes. 21
35 Once the waste is identified, the Lean team can step in to eliminate them from the process in order to increase safety, quality, and productivity while reducing cost (MHRA 2007). While there could be changes in the display format and work steps of VSM according to different aspects of the organization, such as the technology, culture, and the skill level, the mapping process remains the same, following six basic steps (Tapping et al. 2002): 1. Choose the value stream: A value stream is a series of activities from raw material to finished product capable of spanning continuous production flow within a plant or even among different facilities. 2. Map the current state: Mapping the current value stream, with current, precise and first-hand data, shows the existing production process and non-value-added activities. The material and information flow is mapped through specific formats, including special icons and symbols, data boxes, and different types of arrows. 3. Determine Lean metrics: Identifying Key Performance Indicators (KPI) helps the organization to identify waste and eliminate it while implementing continuous improvement. It also shows the workers how they as members of the organization, and also the whole system are doing, by presenting these metrics. There are some common KPI in Lean metrics, such as inventory turns, defective sigma level, total work-in-progress (WIP), total cycle time or total value-added time (VAT), total lead-time, uptime, on-time delivery, overall equipment efficiency, and first-timethrough capacity. 4. Map the future-state: Based on studying the current state, an organization can map the future-state which would be its ideal state, which it seeks to gain after a certain period of time. The following procedure, introduced by Rother and Shook (2003), helps to map the new flow: (1) produce according to the specified Takt time; (2) create continuous flow whenever possible; (3) where continuous flow is not possible, use a supermarket to 22
36 level production; (4) create a pull system; and (5) level a mix of products at the pacemaker operation. 5. Develop Kaizen plans: A Kaizen plan provides a reliable and stable plan as a vital element in Lean, with a comprehensive schedule for tasks with detailed description of tasks describing how the work should be done, when it should be done, what tools are needed, and who should perform it. 6. Implement Kaizen plans: People are naturally resistant to change, even change for the better. Implementing Kaizen could constitute a major change in an organization affecting everyone involved in the production process. Lean is only successful if all stakeholders, at all levels of the organization, are committed to it, and communication is a key in ensuring this. With regard to Lean, all stakeholders should be well aware of what is happening and why. Workers at the frontline are the best able to be responsible for Lean initiatives. VSM is not a flow analysis for the process of designing and creating the finest product flow, but simply a tool which assists operation managers in better understanding the current state of their facility flow, guiding them through the process of analyzing and improving their current state and building an improved one for the future. A fundamental limitation of VSM is that it is a manual method for mapping and analysis of the flows of products, materials, people, and information in manufacturing facilities (Rother and Shook 2003). There are more limitations in VSM once it is implemented in a typical high-variety low-volume facility with complex production assembly line, since VSM does not provide information regarding the effect of variety on the work flow. Another major shortcoming regarding the application of VSM is that it only proposes improvements and does not validate the performance of the system before actual implementation. In the absence of validation, the chance that the proposed system will not meet the performance objectives increases. This research focuses on 23
37 addressing these major issues in order to increase the competence of the futurestate map for MCM BACKGROUND IN LEAN CONSTRUCTION The complexities in construction projects necessitate a new management system. Although manufacturing has been a reference point of innovation and productivity growth in construction for many decades (Koskela 1992), the construction industry has rejected many ideas from manufacturing because of the belief that construction is distinct from manufacturing and thus that manufacturing techniques do not apply to it. Although manufacturing produces standardized products, construction involves unique and complex projects being completed in environments with unknown constraints, tight budgets, and schedules fundamentally different from those for manufacturing products (Howell 1999). Once Lean production emerged as the basis of best practice in manufacturing, some mutual elements were identified between Lean and construction practices in production organizations, such as make-to-order and one-piece flow. Given that Lean production was first established within manufacturing industry, there are some inherent limitations due to the divergent processes of construction and manufacturing inhibiting direct implementation of Lean for construction (Winch 2003). One of the first studies to adapt the Lean production concept to the construction industry was carried out by Koskela (1992). In that study, Koskela presented a new production philosophy and examined the traditional production philosophy applied in manufacturing. Koskela has explained three different points of views on production: (1) the transforming of inputs to outputs; (2) the flow of information and materials; and (3) the generation of value to customers. He has discussed the challenges of implementing the proposed philosophy within the construction industry and presented an initial set of design and improvement principles. In a later study, Koskela (2000) formulated detailed guiding principles, 24
38 after nearly ten years of work, which could serve as implementation guidelines to create flow processes in construction. Besides the theoretical stream of Lean construction development, the actual application stream was implemented in 1995 when Howell and Ballard observed a facility where just half of the tasks in a weekly plan got realized as planned on site. In a later study in 2000, Ballard established a new methodology, called the Last Planner System (LPS), which was applied to control production (Bertelsen and Koskela 2004). Lean construction had a profound impact on the construction industry, particularly with the establishment of the Lean Construction Institute (LCI) led by Greg Howell and Glenn Ballard, formed in 1997 to improve the project production management. The focus for Lean construction, as for TPS, is on reducing waste, increasing value for the customer, and achieving continuous improvement. Waste in Lean construction, it should be noted, is also related to performance from the customer point of view (Howell 1999). While many of the principles and tools of TPS are applicable in construction, though, a number of principles and tools have also been developed specifically for the application of Lean in construction (Sacks et al. 2009a). Lean construction management is different from traditional project management and addresses the following points: (1) objectives are clearly set for the project delivery process; (2) the goal is to increase project performance from the customer point of view; (3) product and process are designed simultaneously; and (4) production control is applied throughout the entire project life cycle (Howell 1999). Lean is summarized in 11 principles according to Koskela, as cited by Pheng and Fang (2005). 1. Reduce the share of non-value-added activities (waste). Non-value-added activities, according to Koskela, are those activities which consume time, resources, including time, cost, space, labor, and machine utilization, but do not add value from the customer s point of view, whereas value-added 25
39 activities convert and transfer materials and information through the customer-desired flow. 2. Increase output value through systematic consideration of customer requirements. It is important to meet customer demands in order to generate value for the project from their perspective. However, often customer needs are not identified or clearly defined. 3. Reduce variability. According to Koskela, reducing variability in the process serves to reduce the number of non-value-added activities. Therefore, uniform products with no process variability maximize value for the customer. 4. Reduce cycle times. The implementation of JIT techniques to minimize stock inventory along with application of decentralization of the organizational hierarchy eventually reduces cycle times. 5. Simplify by minimizing the number of steps, parts, and linkages. Simplifying the construction process, according to Koskela, can be achieved by decreasing the amount of elements in a product and the number of steps in a material or information flow. 6. Increase output flexibility. Koskela suggested that to increase output flexibility, the organization should use product modularization design, which reduces the difficulty of set-up, changeover, and training of a multiskilled workforce. 7. Increase process transparency. In order to enable all employees in the organization to control and improve the construction process, the process needs to be transparent and visible. 8. Focus control on the complete process. Koskela suggested that work flow be optimized by enabling autonomous teams to take control of the process and establish long-term collaboration with suppliers. 26
40 9. Build continuous improvement into the process. Continuously adding activities which are value-added and minimizing waste from the production process provides continuous improvement of the construction process. 10. Balance flow improvement with conversion improvement. Better flows result in a lesser amount of investment in equipment, which in turn provides the company with better control of the conversion technology. 11. Benchmark. Strengths, weaknesses, opportunities, and threats of the organization are revealed through benchmarking. The goal in benchmarking is achieved by promoting familiarity within the organization with the best practices in industry, incorporating the best practices into the organization, and combining internal strengths with the best external practices. There are three specific tools and methods that have been developed for Lean construction: the Last Planner System (LPS), target value design, and the Lean Project Delivery System (LPDS). The focus of this research, due to the scope of work, is on LPS. The LPS was established by the Lean Construction Institute as a production control system to provide a preferred future-state, mitigating the variance between plan and actual common with traditional project control systems. LPS is basically a Should-Can-Will-Do system for project planning that incorporates work flow control through a look-ahead process, and production unit control through weekly work planning. Before planning the detailed schedule for a project, it is required to plan the project events. Assigned work with associated planned progress, along with crew assignments, seldom follows the master schedule prepared at the beginning of the project. LPS creates a 6-8 week lookahead schedule along with detailed weekly plans determined by the last person who performed the work (i.e., the last planner). Assignments to perform the work are allocated to workers based on what they promised, which prevents workers being overloaded and keeps track of productivity by means of the percent planned 27
41 complete factor (PPC). LPS supports the pull system in terms of workable backlog, which utilizes the JIT tool. Also, LPS supports process continuous improvement by creating the look-ahead schedule through discussion with all the project participants, which removes the uncertainties in the construction process (Bhatla and Leite 2012). Various new management methods and principles have been developed for construction industry resulting from the different points of view in Lean construction versus manufacturing. In this research, Lean construction principles, tools, and implementation are studied in order to gain a better understanding of the similar roots between construction and MCM INDUSTRIALIZATION OF CONSTRUCTION The influence on society of the automotive industry s moving from craft-based production to mass production has gone beyond manufacturing to change fundamental ideas about production in general (Crowley 1998). Inspired by the development of a standard production line for car manufacture by Henry Ford, the construction industry has sought to gain similar benefits of manufacturing technologies for factory-based house production (Gann 1996). The construction industry has made various attempts to follow the precedent of industrialization within the manufacturing sector with the associated trends of increased efficiency, control, quality, productivity, and overall decrease in cost per unit (Fernandez- Solis 2008). The idea of industrialization in the 1960s resulted in new methods of construction with advanced systems of building. Three main principles supported the industrialization of construction: (1) standardization of building components; (2) pre-fabrication and production under factory conditions; and (3) systems building with dimensional co-ordination (Crowley 1998). Early attempts at industrialization were seen as a failure because the focus was on producing certain building components off-site which led to a lack of customer-diversified demand. Also, on-site construction remained dependent on crafts for foundation, assembly, 28
42 and finishing work and this combination of industrialized and craft-based components caused structural defects, reduced quality, and building performance problems (Partouche et al. 2008). By the 1990s, the industrialization of construction had garnered more attention with the introduction of Lean production to the construction industry (Yu 2010). The challenges in large-scale production of standardized products were solved through an organizational structure with extreme labor specialization. However, the solution was not suitable for the industrialized construction process, given the need for small-scale production of customized products. Lean production provided a balance in system integration, suggesting products that are partially specialized, with final assembly of prefabricated components provided by various suppliers (Crowley 1998). Later, the aforementioned approaches were combined and modularization was developed. In this new system, modules are individually designed, fabricated in a plant, and assembled on site with the vision of achieving efficiency through industrialization (Bertelsen 2005). Since then, modular buildings have been produced through a manufacturing approach, but the potential benefits of modularization have not been fully leveraged. The process of modular construction does not fully exploit the advantages of modern manufacturing and design technologies, which can markedly improve the production process efficiency (MHRA 2005) Modular Construction Manufacturing (MCM) Volumetric manufacture, modular building, sectional building, modern methods of construction, panelized building, structural panel construction, and off-site construction are all terms in use within the construction industry to describe construction processes taking place in factory-based environments. The main idea underlying these terms is to minimize the production work taking place on site, instead performing the majority of building construction processes at off-site factories (MHRA 2006). Modular construction manufacturing (MCM) is the general term used in this research to refer to the method of construction described 29
43 above, and modular building is the general term used to refer to the final product produced by this method, whether a single-family residential home, a high-rise building, or a commercial facility. Modular buildings can be built from prefabricated components made in a factory, or the entire construction process of the building can occur indoors in a factory environment. The customer can order a modular building with a customized plan layout or choose from among existing plans offered by the company. After modules are fully or partially fabricated in the off-site manufacturing plant, they are transferred to the site and installed on the foundation, which has been prepared prior to module installation. Modules are then connected to one another, as well as to the foundation. Modules are structurally independent and are totally finished inside, containing all components, including roofing and electrical wiring. Modular buildings require minimal foundation and both module and foundation are typically prepared simultaneously; as a result, construction time is considerably low, the end product is less expensive, and the construction process is more environmentally-friendly compared to the traditional stick-built method. Furthermore, reduced waste, defects, and accidents; better quality; and a more sustainable end-product are achieved as a result of building modules in a controlled environment by means of an efficient production management system (Yu 2010). In general, modular buildings are built through a more efficient and cost-effective engineering method that can deliver market requirements for increased construction speed, improved quality, and rapid return on investment. Furthermore, there is a strong motivation for owners and developers to use modular building where speed of construction will positively affect the production economy of scale Factory Production Line A factory production line consists of a series of workstations, where operators perform defined tasks on part of the product as it passes the station. The entire production task is divided into small work elements which must be distributed 30

.")


44 among the stations of the line as presented in Figure 5. In some modular manufacturing factories, the entire process is performed by human resources (Figure 6), while, in some industrialized factories, the processes in many of the stations are performed automatically by machines (Figure 7). In both types of factories the production tasks are the same, although the time spent at each station varies. The assignment of these elements to stations based on technological and economic criteria constitutes the line balancing problem. Frame Wall Component Wall Framing, Sheathing Roof & Sheathing Floor & Preliminary MEP Cubing Walls Assemble Roof Insulation & Drywall Doors & Windows Installation Taping & Roofing Wrapping Load-Out Quality Control & Full Clean Finishing MEP & Painting Cabinet & Flooring Sanding & Painting Exterior Walls Finishing Figure 5: Typical production task layout of a modular building Figure 6: Modular factory production line driven mainly by human-performed tasks 31
 is a line balancing technique that supports the")

 precedence network")
 minimize the number of required workstations for a given production processing")


45 Figure 7: Semi-automated modular factory production line Matching the cycle time of various activities through the production line to the Takt time (the rate at which the customer requires products) is a line balancing technique that supports the achievement of continuous flow. The operation times are assumed to be fixed durations in the traditional method of production line balancing, whereas in real situations durations vary and are defined in terms of random variables (Nkasu and Leung 1995). Line balancing problems generally have several sets of constraints, including, but not limited to: (1) precedence network constraints; (2) fixed facility constraints; (3) task duration constraints; and (4) positional and physical constraints. Production line balancing is used either to (1) minimize the number of required workstations for a given production processing time by assigning the optimum number of activities and leveling the workloads at the workstations; or (2) minimize the production processing time for a given number of workstations by assigning the optimum number of activities and operators at the workstations. The objective in both problems is the same: to balance the workloads through the production line. Line balancing, accordingly, improves production process efficiency by implementing strategies which consider variability of processing times through the production line. Hillier and Boling (1966) have presented a strategy which suggests that optimal productivity can be achieved by assigning 32
46 less workload to the stations located near the center of the production line, and more workload to the stations located close to the beginning and end of the production line (Das et al. 2010). Related to this, one of the research objectives of this thesis is to balance the production line through a continuous flow. To reach this objective, a comprehensive time study is conducted to estimate the operation time for individual tasks at each station in order to quantify statistically the productivity rate and probabilistic duration of each task. A line balancing strategy that meets MCM needs is then introduced to achieve continuous flow BIM AND LEAN INTEGRATION BIM and Lean are two distinct concepts in the construction industry and each impacts the construction process differently. Although the two areas are independent and are separately applicable to the construction process, the benefits can be maximized by integrating BIM and Lean principles. In the following section, each concept is briefly introduced, with an emphasis on characteristics which highlight the potential interaction between Lean and BIM. Today, many organizations are familiar with the concept of BIM, and they attempt to utilize it to some extent based on the collective knowledge/expertise in this area of their personnel as well as on their given needs. Still, the application of BIM is generally limited in current practice to the design phase, even though the full benefits of BIM can be reaped only when the generated information is used through all phases of the project. This ought to be considered in light of the fact that manufacturing organizations need to continuously improve their production processes in order to reduce operational costs and survive in the competitive construction market (Garza-Reyes et al. 2012). BIM provides the basic data which can be used as input for the application of Lean to the production process. Additionally, based on the definition in the BIM Handbook, BIM provides requirements for new capabilities in construction and supports the creation of an integrated design and construction process that increases quality while reducing 33
47 the cost and duration of a project (Eastman et al. 2008). BIM is applicable to all of the project stages and helps reduce waste from the conceptual design stage, to construction, to operation (Arayici et al. 2011). There are additional benefits of using BIM, particularly in applying Lean to the construction process. The procedure of generating shop drawings is simpler for any building type once the model has been completely generated. First, a model is created in BIM, and then the building components schedule, material ordering, fabrication elements, and delivery processes are developed (Azhar et al. 2008). The idea of integrating Lean and BIM is not new; Rischmoller et al. (2006) used Computer Advanced Visualization Tools (CAVT) to improve value generation in the design and construction processes. They used Lean as the theoretical framework within which to evaluate the impact of CAVT in terms of waste reduction and improved customer value and construction flow. Khanzode et al. (2006) introduced and applied the concepts of Virtual Design and Construction (VDC) to represent aspects of BIM in the Lean Project Delivery Process (LPDS). They explained which specific VDC tools and methods can be applied to each phase in LPDS in order to achieve the objectives of a Lean production system. Sacks et al. (2009b) discussed a synergy between BIM and Lean, generating 3D visualizations of a construction process for two case studies within the context of BIM in order to facilitate the creation of a process flow and to reduce variety in the process. In another effort to integrate Lean and BIM, Sacks et al. (2009a; 2010) introduced a conceptual framework for identifying the interconnections between Lean and BIM, identifying 56 through their developed matrix. The findings from the proposed conceptual framework proved that BIM is an essential element in achieving Lean outcomes, and must be considered by any organization willing to implement Lean. In a similar manner, Ningappa (2011) used three different methods in his research to determine how BIM helps to achieve a Leaner construction process. The first method, which was an analysis based on literature on BIM and Lean, verified that using BIM significantly reduces waste in the 34
48 application of Lean. The second method was derived from data gathered from a general contractor which had implemented both Lean and BIM. The results verified overall cost savings and change orders. The third method was an analysis based on interviews with experts in construction with BIM experience, and the results suggested that experts do recognize the advantages of using BIM in the application of Lean, and particularly in waste reduction. Sacks et al. (2010) compiled a set of requirements based on the LPS in order to implement a BIM-based Lean production management system called KanBIM. The KanBIM concept provides visualization of the status of a construction product as well as of the production process, which assists construction managers in focusing on maintaining process flow and continuous improvement. The goal of this KanBIM research is to develop and test a BIM-enabled system that supports production planning and day-to-day production control on construction sites. In the same manner, Bhatla and Leite (2012) established a framework for incorporating BIM functionalities into the LPS to improve work flow reliability at the construction stage. They developed the framework through a case study which involved 3D visualization and MEP clash detection during look-ahead and weekly work planning. The purpose of implementing this method was to decrease the requests for information (RFIs) and change orders issued, which in return resulted in more value for the customer. In another effort, Tiwari and Sarathy (2012) adopted the pull planning process as a mechanism for collaboration between the design team and the construction team to prepare a constructible set of design drawings of a case study. In this research, implementation of pull planning reduced the post-permit design changes due to cost, constructability, or coordination issues. In another study, Alwisy (2010) developed an automated design system that produces design aspects needed for construction manufacturing and facilitates information communication. He developed an integrated computer tool for design and drafting for the MCM process, called MCMPro that generates sets of shop drawings. For the purpose of fully automating design and drafting for MCM, 35
49 scenario-based analysis and BIM have been used as an integrated computer design tool using 2D CAD and parametric modeling. Moghadam et al. (2012a) expanded the application of MCMPro to generate building components schedule and fullydetailed sets of shop drawings. Lean was utilized to optimize the work flow in the production line based on the work to be performed at each station through the production line. For this purpose, a project component schedule was developed to create a VSM through an integrated process improvement (IPI) method. The results proved the effectiveness of the model in reducing waste, time, and resource utilization. A number of research studies have been carried out to integrate BIM and Lean in order to maximize the benefits of both, but with respect to MCM in particular a gap still exists between drafting and the production line. The increased interest in manufacturing of the building construction process demands special methods of design and manufacturing to support automated production operations. Manufacturing provides opportunities to apply Lean strategies for production efficiency in the plant. To support the manufacturer s needs for design and drafting, a task which encompasses the incorporation of Lean into production, an integration of BIM with Lean is proposed in this research DATA EXCHANGE IN CONSTRUCTION INDUSTRY The construction process in general begins at the design phase of the built environment. There are a number of considerations at this phase which can lead to major cost savings: advancement of automated design to increase cost efficiency; improvement in terms of the life cycle value of the project; and interoperability amongst the various phases of a project s life cycle (Neelamkavil 2009). Interoperability is achieved through flawless data sharing with respect to a building s development between multiple tools and applications over the project lifecycle of the (CRC 2007). The ability of different tools to use, share, revise, and generate information depends on standards to define construction elements in 36
50 a universal format (Ashcraft 2007). In the past, transferring data among various applications was carried out by customized translators for limited tools, or was performed manually often leading to data loss or alteration was common. A study in the United States by McGraw Hill revealed that 8 out of 10 users believed the obstacle in capitalizing fully on the benefits of BIM tools is the absence of interoperability among applications (Young et al. 2009). In the construction industry, the work process, technological development, and produced data differ markedly among the various disciplines in the design process, the many construction trades specialized for specific work, and the various suppliers. Due to the lack of sufficient interoperability, data entry is performed and results are generated separately for these various entities in what is known as the multiple models problem (Holness 2007). There are three current approaches to this problem, as outlined below: 1. Data exchange through BIM: The benefits of BIM are established through shared utilization and value-added creation of a model with integrated data (CRC 2007). In complex construction projects generally one single BIM model does not provide all types of required information for the various disciplines and phases. Through the design phase, architects create a design model, whereas structural engineers develop an analysis model. Through the construction phase, contractors produce a planning model, and fabricators generate shop drawings and component specification lists (Ashcraft 2007). A project design team is responsible to ensure successful BIM implementation through the entire project life cycle by creating a fully integrated design model with capability to add, edit, exchange, and generate required data by all the stakeholders in different disciplines and phases (Holness 2007). However, even advanced and high-tech BIM models with the ability to include large portions of project information are not able to produce all the required outputs through the project life cycle, the result being the development of highly complicated programs. Essentially there are different models within a single project which are 37
51 adjusted for a specific task, since applications are developed to be optimal for a particular area of expertise (Ashcraft 2007). Despite the ability of BIM to develop an integrated model by creating object-oriented tools, there are still barriers to the widespread use of BIM models, such as the difficulty of effectively involving the entire project team and integrating the generated information. Accurate communication between different specialists across disciplines, and over the project life cycle, requires standardized approaches (Howard and Björk 2008). All the elements that affect information sources, such as facts, figures, designs, and analyses, must be updated continuously in order to ensure that decisions are made based on accurate and updated information. Therefore, automating the data exchange process through the use of BIM plays a major role in achieving construction automation (Neelamkavil 2009). 2. Standards: Standards are adopted to provide universal definitions for construction elements and systems. Development of standardized descriptions through the Industry Foundation Classes (IFC) and IFC/xml common model in construction industry is carried out by buildingsmart (formerly the International Alliance for Interoperability). The need for a standard IFC framework is better understood when one considers that, in current models, there are differences in the capability of different BIM software; thus data need to be translated, but a translator may not transmit all data from one model to another. Also many translators are unable to perform a round trip, which involves transferring data from one framework to another, and then turning it back to the first application after modification without losing data. If the host platform uses some functions that are not supported in the IFC class, data loss may occur, resulting in inconsistent models during the translation process (Ashcraft 2007). 3. Adjacent models: To support inter-organizational project collaboration which addresses different project phases, numerous information technology (IT) systems integrating different application areas have been 38
52 developed (Gökçe et al. 2013). To take advantage of purpose-built modeling systems and minimize the issues and problems caused by various models, Autodesk Revit has been developed using adjacent models constructed on a shared platform that are separate but closely linked. This method is successful in producing the desired result when a shared engine is in use, although it may be challenging and cause issues when different models are being merged on engines from different software platforms (Ashcraft 2007). The integration of data in a construction project is generally dependent on the internal data of the component system and is not applicable in general, and therefore cannot be achieved through standardized data models. All these characteristics serve to considerably decrease flexibility, multi-stakeholder collaboration, and inter-enterprise cooperation. (Gökçe et al. 2011). The ultimate goal of this research is to advance the science of construction automation in order to reduce the gaps between engineering, manufacturing, and the production line for prefabricated buildings. Although the concept of incorporating Lean and BIM is not new, automating the process of generating and exchanging data from design to production for MCM will increase production efficiency. The potential benefits of BIM are leveraged once the generated information is transferred through all phases of the project to be used by all stakeholders. There is no single tool or application that can produce all requirements for all project phases. Hence, it is necessary to integrate different application domains through the project life cycle to facilitate the data exchange process. In essence, this work encompasses the development of a BIM model which captures features related to the resources and processes required to design, fabricate, and build a facility. The BIM-based 3D model is information-intensive, to allow for the evaluation of project information through mathematical models in order to minimize material and process waste, utilizing Lean in order to assess the construction method in terms of efficiency, cost, and schedules. This information is added to the 3D model during the design stage and throughout the progression 39
53 of the project, making the 3D model a dynamic entity of an intelligent-repository of project information PRODUCTS VARIETY IN CONSTRUCTION MANUFACTURING Customers requesting modular-built facilities have the same demands as those in the market for traditional stick-built facilities, which is for unique buildings that are individually customized to accommodate customer needs. This affects production efficiency since it involves deviating from a standard work flow process (Nahmens and Mullens 2009). In addition, customization necessitates frequent change and reconfiguration of the production line. Meanwhile, the key to succeeding in today s competitive industry is speed in innovation, production performance, and adoption to change. Furthermore, the design of extremely flexible and re-configurable production line layouts ensures a company s competitive edge in the marketplace. To assure its long-term economic success, an organization must be able to produce customized products at the cost of standard production (Qiao et al. 2002) Lean Strategies for Products with Variation A number of researchers have argued that Lean is an effective approach by which to manage the trade-off of delivering a building which fulfills customer demands with minimum effect on production efficiency and within a reasonable price and time. Mullens (2004) has defined unique characteristics for mass customization to design and manufacture customized products at mass production efficiency and speed. He used Lean to define these characteristics, and suggested a similar objective for both mass customization and Lean, which is to reach mass production efficiencies. Tu et al. (2001) and Da Silveira et al. (2001) have advanced the notion that Lean is an effective approach to support mass customization efficiency. Chandra and Grabis (2004), similarly, have argued that Lean is an efficient strategy by which to deliver customized products (Nahmens and Mullens 2009). Notable Lean principles which enable manufacturers to 40
54 produce a high variety of products to meet customer demands are described below: 1. The key in implementing a pull production system is to start manufacturing the product after receiving a signal from the downstream customer. In this system the customer and the production line are linked together. In the same manner, for customized products, the finished product is built to order and produced only when the order from the customer is received. 2. To level out the variation in day-to-day order flow, it is required to perform mixed model assembly rather than batch manufacturing. For this purpose a production leveling technique (Heijunka) is utilized. 3. Visual control provides up-to-date conditions. Although they can be readily implemented in most manufacturing environments, as the degree of customization and customer involvement increases, visual control tools become more helpful in visualization of waste. In a different manner, some researchers have argued that Lean is inadequate for customized manufacturing, and that other strategies must be considered to be integrated with Lean. Slomp et al. (2009), for instance, have asserted that Lean control principles can be used in production control systems to create a highvariety/low-volume production unit, and they translated these principles into a concise production control system for a make-to-order manufacturing system. They implemented these principles on a case study, which led to a reduction in flow times and an increase in the service level achieved, with on-time delivery performance improving from 55 to 80%. Stump and Badurdeen (2012) have presented a framework that integrates Lean with other strategies, such as Quick Response manufacturing, Theory of Constraints, and Flexible/Reconfigurable Manufacturing Systems to make customized manufacturing more efficient. They asserted that some Lean principles are in contrast with customized manufacturing, as outlined below: 41
55 1. In a pull production system, each step fulfills the requirements of its immediate downstream customers, rather than the end-customer as required in customized production systems. In addition, the production line receives multiple pull signals from different costumers, considerably affecting operations. The effect of received pull signals depends on the degree of customization implemented by the organization. 2. The concept of Takt time is not applicable on a production line with product variation due to the high variability of demand and difficulty of accurately forecasting duration, especially when the factory is producing modules with a higher level of customization. Maintaining Takt time and production leveling are thus complicated tasks, such that they would seem impractical for customized manufacturing plants. 3. Source quality (Jidoka) is also increasingly difficult to adapt to customized manufacturing because, as products become increasingly customized and variety increases, quality control on the shop floor becomes more difficult to achieve. While self- and successor checks could still be implemented with much lower degrees of standardization in the product and process, these checks become less efficient. However, some degree of source quality can be used in any customized manufacturing environment. In this research, the effect of product variety on efficiency of the production line and the application of Lean to customized manufacturing is studied. Also, to present a theoretical framework by which to apply Lean and other strategies in the system, various strategies are studied to identify their strengths and weaknesses when applied to a customized manufacturing environment. Ultimately the aim of this framework is to establish a productive production line flow for customized products and demands. 42
56 Scheduling for Products with Variation In traditional scheduling methods, a fixed duration is assumed for each activity and as a result there is, theoretically, a fixed duration for total work. In actual cases, however, task durations are not fixed and instead duration can be represented by an independent random variable based on probability distributions. Accurate activity duration plays an important role in creating the schedule when it comes to customized manufacturing, where production scheduling is not easily predicted. A number of research studies have been presented on schedule estimation with probabilistic duration of construction projects, but only a few studies have focused on activities in a production line. Beck and Wilson (2007) have developed a job shop scheduling framework and combined Monte Carlo simulation with deterministic scheduling algorithms. In their technique, models of uncertainty were combined with an offline, predictive schedule. Van Mulligen (2011) has performed a time study on five modules to determine the production times of two stations in the production line, including wall fabrication and wall erection. He analyzed the data from a time study and formulated statistical productivity and probabilistic durations for activities in those stations. In another study, a decision support system for coordinated prefabrication scheduling has been described by Chan and Zeng (2003). Key components of production scheduling are promoted by their research, such as conflict detection, determination of the priority for conflict resolution, generation and evaluation of alternatives for conflict resolution, and ranking of outcomes for negotiation. To define scheduling parameters and conflict resolution priorities, their research collaborates using an explicit constraints-based scheduling model and genetic algorithms (GA). The factory production line in customized manufacturing cannot be run at a steady pace since the activities taking place at each station are contingent upon individual design in fulfillment of customer demand. In order to measure the effect of product variety on the production line pace, a time study is conducted in this research. Data is collected from a time study and analyzed for each activity in 43
57 order to determine and formulate the statistical representation of the required resources, including labor, time, material, and space to complete an activity. The time study assists in identifying the key elements that affect duration based on the predefined tasks taking place at a particular station SIMULATING THE PRODUCTION PROCESS The decision to implement Lean is complicated because of the substantial differences between a traditional system and a Lean system. What is needed is a tool to assist organizations considering Lean to quantify, at the planning and evaluation stage, the benefits they can expect from applying Lean. This tool should be adaptable to the specific circumstances of the organization, and should be capable of generating resource requirements and performance statistics for both the proposed Lean system and the existing system (Detty and Yingling 2000). Simulation is an effective technique to facilitate identifying changes and benefits of Lean transformation. Simulation is a computer-based tool that represents realworld objects and processes in order to effectively evaluate and examine various scenarios prior to implementation and facilitate the decision-making process (Moghadam et al. 2012b). The impact of Lean transformation can be analyzed to determine where valuable resources should be applied before actual implementation. This increases confidence and is likely to hasten the rate of adoption of Lean, as it provides a visual and dynamic illustration to management of how the new system would work (Detty and Yingling 2000). On the other hand, to make improvements on a production line within the context of Lean, the integration of simulation tools and Lean brings about a more effective approach for process management. A simulation model of the production line stream map is able to challenge the impacts of Lean application on line balancing, as well as the results (Shararah et al. 2011). Significant impact from random variation in the nature of modular manufacturing, as well as system element interactions, is expected for the future-state of the system. Currently there 44
58 is no tool in Lean which contains variability data and provides performance evaluation of the system. Therefore, incorporating simulation modeling into the Lean transformation process is able to provide a quantitative conception of the potential benefits (Marvel and Standridge 2009). In some recent studies, process flow in manufacturing has been evaluated by means of simulation. Velarde et al. (2009) have used simulation to improve the time and cost efficiency of flow in MCM operations based on time and process studies. They used Arena 5.0 as a simulation tool, and the results revealed alternative operation scenarios in order to increase the production level by almost 40% and reduce considerably the labor cost per module. Das et al. (2010) have developed a computer simulation model by which to evaluate a number of line balancing theories, including bowl phenomenon and performance evaluation criteria. They applied the model to a six-station assembly line and evaluated the minimization of the total elapsed time, maximization of the average percentage of working time, and minimization of the average time in the system. Gregg et al. (2011) have modeled manufacturing process flow using a database-driven simulation design based on general-purpose simulation software. The Lean+ Process Analysis Simulation (LPAS+) is a modeling approach for simulating scheduled task sequencing and execution. Gregg et al. incorporated LPAS+ with work flow scheduling to model cycle time and resource usage, considering task sequencing, task duration variability, resource requirements, maximum capacity, and conflicts. A number of researchers have used simulation modeling to evaluate and analyze VSM. Abdulmalek and Rajgopal (2007) have developed a simulation model of Lean transformation in a process sector to contrast the before and after scenarios. They created a current-state VSM to map the existing operation of the case study and identify sources of waste. They then developed a future-state VSM of the system with Lean tools applied to it. Simulation of the proposed recommendations assisted the managers to quantify the potential benefits of Lean against the cost and time of implementing it. Marvel and Standridge (2009) have validated future- 45
59 state VSM using simulation modeling to ensure that it effectively addresses the current-state gap. They considered evaluation of component interactions, structural variability, random variability, and time dependencies, along with identification of alternatives which are not achievable by traditional Lean assessments. They applied this process to a number of industrial projects and the result proved the effectiveness of the validation of future-states before implementation. Gurumurthy and Kodali (2010) have developed a simulation model using the Queuing Event simulation tool for a case organization in order to demonstrate improvement in performance from the current state to the future-state as a result of Lean implementation. The simulation model showed significant improvement in the productivity, with reduction in such resources as inventory, cycle time, floor space, and manpower. Moreover, such approaches provide managers and engineers with information about manufacturing process improvements prior to the actual design of the Lean transformation system. Shararah et al. (2011) have developed a component-based modeling tool that combines the designing power of VSM with the analytic power of simulation. They introduced the VSM Simulator, using ExtendSim (VSMSx) as a tool designed to facilitate the implementation of Lean by simulating the VSM map. Their developed model provides scenario analysis on lead time differences and their relation to value-adding times, varying set-up times and cycle times and the corresponding effects on inventory, and effect of altered buffer sizes and batch sizes on the system. Simulation tools play an important role in the application of simulation in different industries. Simulation in construction had been limited to research applications before AbouRizk and Hajjar (1998) presented a framework that customized simulation for the construction industry. They used Special Purpose Simulation (SPS) as a tool to build systems for specific purposes. Later, they improved their approach and developed a construction simulation system, called Simphony, which provides a set of predefined elements representing construction requirements (Hajjar and AbouRizk 2002). Simphony.NET is a construction- 46
60 oriented, general-purpose discrete event simulation (DES) software application developed at the University of Alberta using process interaction concepts to create a model. A general template with predefined element functionality enables the user to select elements based on a required function for a specific simulation model. In this research, Simphony.NET 4.0 is used to develop a simulation model for the production process. The simulation model provides results for different production scenarios, including resource allocation, crew selection, plant space and layout configuration, equipment and material utilization, module fabrication duration, and productivity analysis. Evaluation of potential scenarios and comparison of the results assists management teams to find optimum production scenarios prior to actual implementation POST-SIMULATION VISUALIZATION Although the simulation tool is considered to be efficient in evaluating construction processes, the project management team often views it as a black box that can only be understood by highly skilled managers. The gap between the specialist and the management team leads to misunderstandings regarding simulation results, and may result in incorrect interpretations (Al-Hussein et al. 2006). The project management team is unwilling to make decisions based on current simulation outputs, such as statistics-based charts and diagrams, because they do not provide adequate information related to construction process requirements (Kamat and Martinez 2000). The results and analysis are difficult to understand, and translation of the data must be done by experts (Zhong and Shirinzadeh 2005). Still, visualization is widely accepted in construction since it promotes better understanding of process and performance of the construction system. However, the model needs to be associated with the project data in order to be effective and valuable for decision making purposes. The key aspect that is added to the output analysis of the simulation process is visualization, leading to post-simulation analysis. The produced results from a simulation model are interpreted and visualized for further analysis, which is a popular and widespread 47
61 decision making technique (Telea 2000). In this regard, Kamat and Martinez (2001) have developed a general-purpose 3D text file-driven visualization system, Dynamic Construction Visualizer (DCV), which allows visualization of construction operations and enables construction planners to obtain more realistic feedback from simulation analysis. Studies by Huang et al. (2007) and Li et al. (2008) contributed a Construction Virtual Prototyping (CVP) system that integrates visualization and simulation. The system can generate and modify 3D models of building components, construction equipment and labor, and temporary work. Although collecting input data for this virtual prototyping (VP) system is a time consuming process, it allows project teams to check constructability through visualized 3D models of projects. Li et al. (2009) have used VP to optimize construction planning schedules by analyzing resource allocation and planning with integrated construction models, resource models, construction planning schedules, and site-layout plans. Russell et al. (2009) have described a two-way relationship between 3D CAD software and software implementation of linear planning, and have described the consistency of product representation in CAD and scheduling models. They improved project scheduling by modifying construction sequences through a 4D CAD model, and validated the project completeness by connecting the model to 3D objects and activities. The MCM industry is a growing industry that seeks innovative approaches to increase profitability. To improve the production efficiency in the plant, an enhanced tool is required to present the statistical results of changes in production sequencing and crew selection in a visualized model to facilitate decision making. The application of visualization to construction in general differs from its application to MCM in terms of production flow of multiple projects, product movement through the production line, work cell design, precedence network lead time, plant physical constraints, and crew selection. Also, with MCM the production progress is not measured based on the physical project progress, but instead is determined based on the total work performed in all stations, and can be calculated as the sum total of man-hours. Numerous studies have investigated the 48
62 integration of simulation and visualization for on-site construction, but only a few have accomplished this for modular manufacturing. Therefore, research in the area of on-site construction is being carried out to develop and advance an integrated tool for MCM production process analysis. A number of studies have contributed to the development of visualization of construction sites via the fourdimensional (4D) geometric model (Golparvar-Fard and Peña-Mora 2007; Golparvar-Fard et al. 2009; Kamat et al. 2011). They developed an automated vision-based approach that monitors as-built progress and compares it to the asplanned construction progress. The system matches as-planned and as-built views with a selection of features, where the as-built photographs are enhanced and augmented with the 4D as-planned model. In a different manner, Zhong and Shirinzadeh (2005) presented a new methodology for building a virtual factory by integrating 3D visualization with discrete simulation, intended to link disconnected event simulations with 3D animations and support rapid development of 3D animations from simulation outcomes. The presented methodology was applied to an electronics assembly factory to visualize the assembly processes. They asserted that the visualization system does not require its users to have any special knowledge of computer graphics. Nasereddin et al. (2007) have described an automated approach for developing discrete event simulation (DES) models for the modular housing industry using ProModel and Microsoft Visual Basic. They developed an animated model that produces processing time and labor data. The model was tested on a case study, and enabled the research team to propose several improvements in the design. The complicated result from the simulation model of the work process provided monitoring of both the visualization and the simulation parameters simultaneously by providing additional perception through visualization, and also provided the immediate visualized or statistical results of making changes to the model. In this research, the simulation results of near optimum scenarios are run to simulate the process and visualize the production constraints. This integrated method is a post-simulation visualization model for 49
63 MCM, with an emphasis on production efficiency. The model capitalizes on the advantages of both simulation and visualization, where critical information such as the 3D model, time constraints, and resource demand are incorporated into the system. 50
64 3. PROPOSED METHODOLOGY: LEAN-MOD Modular construction manufacturing (MCM) is superior to the current on-site construction system in terms of efficiency and cost-effectiveness, but current MCM practices utilize the same techniques and methodology as traditional construction sector to design, plan, build, and control the process. Although MCM reflects some of the characteristics of both manufacturing and construction industries, yet is distinct from both and should be seen in the class of its own industry. Since the products of these industries vary considerably as well as production techniques, the first step is to study their differences which are presented in the first section. The second step is to involve theories and practices from construction, manufacturing, and modular building industries in order to develop new paradigms for MCM. In this research, Lean production and Lean construction strategies are adopted for MCM industry to improve the efficiency and productivity of production process. These adopted strategies are discussed in the second section as Lean-Mod strategies. The application of proposed strategies is presented through an enhanced integrated approach of BIM, Lean, and simulation modeling in the third section. The proposed integrated tool fills the existing gap between the design and production phases, and evaluates proposed improvements prior to actual implementation through a simulation model DEFINING AN ENHANCED PARADIGM OF LEAN FOR MODULAR CONSTRUCTION MANUFACTURING Manufacturing has been a reference point and a vital source for innovation and competitiveness in construction for several decades, having contributed disproportionately to research, development, and productivity growth. Some ideas in construction come directly from manufacturing, such as industrialization and repetitive process scheduling, while others have their origin in manufacturing, including computer integration and automation (Koskela 1992). The term, Lean production was first coined by Ohno (1988), whose research focused on waste 51
65 reduction in the Toyota Production System (TPS) and introduced a new form of production which is neither craft-based nor mass production. One of the first studies to adapt the Lean production concept to the construction industry was carried out by Koskela (1992). This study challenged the implementation of Lean production philosophy within the construction industry and presented an initial set of principles as implementation guidelines to create flow processes in construction Comparison of Manufacturing and Construction Characteristics There are basic similarities between manufacturing and construction. Both are production industries that make products. In manufacturing units of the same product are manufactured continually, while in traditional construction unique products are constructed one at a time. Also, in both industries stakeholders seek to thrive in challenging markets, making profits by delivering high quality products to customers. These similarities provide opportunities to share innovations, experience, and findings between the two industries (McCrary et al. 2006). However, despite these similarities, construction and manufacturing are distinct business processes, as the points below demonstrate: 1. Working environment: Construction projects usually take place outdoors, where unavoidable uncertainty exists related to weather and soil conditions, whereas in manufacturing the impact of on-site physical conditions is eliminated by working under a controlled and safe indoor environment, which increases control over the process. 2. Product: Manufacturing in general consists of a standardized production method for a group of similar products. Construction, in contrast, generally involves one-of-a-kind and unique projects such as buildings, bridges, or roadways. 3. Organization: Construction typically involves various contractors which are contracted by private individuals or government. Therefore each 52
66 project is completed by a temporary association of multiple organizations. Manufacturing companies, on the other hand, are permanent organizations employ workers who typically work each in a particular division of the production line. 4. Customization: In general manufacturing takes advantage of a standardized production method to produce standardized units with a limited level of customer-driven customization. In construction, customers play a key role in defining their demands as well as the product requirements and features. 5. Resources: Manufacturing relies heavily upon equipment, and manufacturers seek to procure advanced equipment to improve production efficiency, considering the trade-off between future growth and machine depreciation. In construction, typically the majority of work performed manually by workers using hand tools. The decision of whether to purchase or rent large equipment, such as cranes and trucks, for projects is based on time-value analysis to minimize ownership and operation costs. 6. Supply chain: Material ordering in manufacturing takes place based on the activity sequence, which is defined by the design of the product and is limited to the plant layout. Product detail and scope is precise and therefore material requirement calculation is simple and arithmetic in nature, based on the master production schedule, inventory records, and product component lists. In construction, materials constitute a major expense in construction, so procurement is handled by competitive bidding; this process does not allow sufficient time for prefabrication. The quantity take-offs are not completely precise, and material requirement calculations usually account for variance due to inaccurate estimation and waste. Material ordering in construction is based on the project schedule and contractors scopes of work, since materials are used by specific crafts. 53
67 7. Quality: A quality management system in manufacturing is supported by a permanent organization in the plant, whereas, in construction projects, quality requirements are generally defined by a number of stakeholders and the final requirements are approved by the owner within legal bounds. Quality in manufacturing is related more to process control and rework is generally avoided. In some cases, defective parts are discarded rather than repaired. In contrast, quality in construction is more related to product compliance with the given specifications. Also, rework is a common practice since only one final product will be delivered. 8. Work flow: In manufacturing, work begins and moves through the production line based on the plant layout and predefined workstations. The utilization of material and equipment is clearly defined. In construction, work occurs throughout the jobsite based on the construction plan. Since there are no physical workstations on construction sites, overlap detracts from efficient material usage and work flow. 9. Schedule: In construction, different contractors are responsible for different aspects of the project, and each creates a work plan in their own interest to minimize risk for their organization. As a result, localized scheduling leads to overlapping activities performed by contractors, which disrupts the overall project schedule. As such in construction it is difficult to maintain a fixed schedule which aligns the interests of all stakeholders. The repetitive work process in manufacturing provides a reliable work sequence which helps to ensure completion of all requirements before starting a task so that schedule constraints are satisfied Comparison of Lean Production and Lean Construction Strategies As discussed above, the term, Lean, was first coined to refer to the waste reduction of TPS and to contrast TPS s novel approach with craft-based and mass forms of production. Later, Lean implementation within the construction industry emerged as a new challenge for researchers. A few researchers believed in the 54
68 generic applicability of Lean and proposed to directly apply Lean production principles to construction, whereas a number of other efforts were made to interpret Lean production strategies and define construction as flow to in order to develop alternative Lean strategies for construction. Similar to that for Lean production, the focus in Lean construction is on reducing waste and improving the process continuously by considering construction projects as temporary production flow. However, although Lean production and Lean construction share this common basis, some strategies are developed specifically for the application of Lean in either construction or manufacturing: 1. Lean production is involved with repetitive runs in the stable condition of factories. Activities and resource allocation at stations along the production line are predictable, which facilitates achieving a process flow. Since Lean construction deals with production of units of a single product, limited historical data is available pertaining to the activities and resource allocation plan from previous projects. Also, the construction environment is not dividable physically to individual stations with assigned tasks and resources. Process flow management is a more difficult task on construction projects, where various contractors with different schedules and points of interest are involved. Therefore improving the flow of work in Lean construction is defined using altered tools such as visual control of process. 2. Production leveling in Lean production controls the flow variability caused by fluctuating demand. In manufacturing, level of production is controlled by minimizing produced batch sizes in order to manage demand variability. A small batch size demands small adjustments to the sequence of products and resource allocation to optimize the production volume. In construction, production leveling addresses the impact of trade completion time on the overall completion time of a project. Lean construction controls flow variability by ensuring on-time completion of individual assignments at the operational level. 55
69 3. In Lean production, standardized work is a baseline for continuous improvement and the emphasis is on both product and process standardization. Standardization includes single production rate for each process as Takt time with no variability, a precise work sequence performed repeatedly in the same manner, standard product design to reduce set-up time and process time variation, and standard inventory to create a continuous production process. In Lean construction, since each product is unique, the project is adopted as the production system. Standardization includes visual management (posting project information such as schedule and cost); workplace organization, such as the organization of jobsite resources for efficient project execution; and definition of work processes based on documentation. 4. Material delivery systems in Lean production ensure efficient material movement by integrating the supply chain to the value stream and facilitate continuous flow. They also improve production process efficiency by eliminating waste such as material transportation and waiting time for material arrival. One strategy is Just-in-time (JIT), which ensures the necessary parts are obtained at the required time and in the proper quantities. The JIT system is primarily designed for repetitive manufacturing processes with relatively stable product demand. Lean construction creates strategies to smooth the flow of materials to the jobsite, and involves creating short-term schedules for project tasks based on resource constraints. Material delivery planning requires visible material availability through the supply chain and jobsite inventory, and short response times that ensure the lowest cost for materials from suppliers. 5. Jikoda is a strategy in Lean production in which a preventive action is taken to avoid defects at the source so that they do not flow through the process. For this system to be effective, every machine and worker must be completely capable of producing repeatable, perfect-quality output at 56
70 the exact time required. Workers are responsible for checking quality as the product is produced. In construction, design and drafting has a major impact on the overall performance and efficiency of construction projects. Lean construction concentrates efforts on defect prevention during the design process and on the job site to ensure first-time quality compliance on all tasks, since defects are difficult to resolve after they occur. Planning at the assignment level should target the production line, which is the point at which to stop and ensure that no defective assignments are released downstream. 6. In Lean production, a task starts after completion of preceding tasks in the production line. The schedule is presented in VSM and controlled by lead time and Takt time, which is the production rate at which tasks must be completed in order to meet demand. The developers of Lean construction invented the Last Planner System (LPS), which is a high-level planning technique that addresses project variability in construction. LPS is a reverse-phase schedule which relies upon the completion of tasks and pulls assignments. A task is started when all prerequisites are at hand, whereas in traditional practice a task starts according to master schedule Lean for Modular Construction Manufacturing Modular construction is capable of achieving high productivity improvements due to the benefits of the manufacturing environment. Currently MCM still utilizes the same techniques and methodology as the traditional construction sector to design, plan, build, and control the process. It is thus required to modify production strategies for MCM to accommodate its unique characteristics. MCM reflects some of the characteristics of both the manufacturing and construction industries; therefore, it cannot be understood to be exclusively either manufacturing or construction. Since the products of these industries vary considerably, as do the production techniques, the first step is to study their differences, then to bring 57
71 together theories and practices from these industries in order to develop new paradigms for MCM. Products of MCM have the same characteristics as products in the traditional construction industry, but the production process garners the same benefits as manufacturing: (1) usually products are unique and customized to satisfy customers demand; (2) the construction process takes place under a controlled environment and a complete module is transported to the site to be assembled; (3) the layout of the factory provides the opportunity to divide construction tasks into small work packages with defined resources which are assigned to workstations along the production line; (4) a permanent management team deals with the production process and the involvement of temporary trades in the process is reduced; (5) resource requirements, including equipment, machinery, and human efforts, depend on the task during the process; (6) supply chain management supports effectively the manufacturing process productivity, considering mutually the sequence of the tasks and the target time as key decision milestones; (7) although the life cycle of each module is limited to its duration, the repetitive manufacturing production process provides capabilities in terms of research and training; (8) each product leads to one final product which cannot be replaced if defective; (to prohibit rework, quality control focuses on both process and product, supported by repetitive design of the production process to eliminate defects); and (9) although estimated scheduling is predictable for each product, overall scheduling is required in order to consider the consequences of individual schedules through the entire production line, where gaps or overlapping may occur. In the past decade, due to increased interest in manufacturing of modular buildings, there has been recognition within the MCM industry that it is essential to make improvements to the production process in order to meet market demand. In seeking to reach this goal, the benefits of Lean production have been recognized by the MCM industry and Lean principles have been implemented to some degree. The benefit brought by Lean to the MCM industry, however, has 58
72 been limited due to the inconsistent and incomplete application of Lean principles and tools. Many argue that existing Lean principles are applicable in any industry, including MCM, despite the differences among manufacturing, construction, and MCM. Nevertheless, Lean principles are taken as a whole and the basis remains the same. However, technical elements in Lean production or Lean construction are not sufficient to achieve the Lean goals for MCM, thereby demanding a new framework to exploit the capability brought by modularity. The MCM industry needs an approach that links adopted Lean principles to associated tools in order to achieve the Lean goals STRATEGIES FOR ADOPTING LEAN-MOD Currently there is no specific strategy for Lean implementation in MCM, although one could argue that existing Lean principles can be applied to any industry. It is important to have a thorough understanding of the production environment of modular construction, as well as its differences and similarities to the manufacturing and construction industry. The unique characteristics of MCM necessitate improved principles which can adequately fulfill the production efficiency demands of modular construction. In this research, Lean production and Lean construction principles are thoroughly studied and based on the unique characteristics of the MCM industry, Lean principles are modified accordingly to satisfy production efficiency requirements. The adopted Lean-Mod strategies are discussed below Production Leveling An important concern within Lean is production leveling, whereby work flows are created between production workstations. Leveling the production and creating a continuous flow depend directly on the quantity of demand, which is determined by the market, and type of demand, which has to do with customer preference. Currently, MCM fulfills a small but growing percentage of the total construction industry market demand. Although demand for modular buildings is subject to 59
73 consistent change caused by economic conditions, existing building stock, land availability, financing, and customer preference, the MCM market is still nascent. In addition, modular buildings are bulky, and the process of transporting them from factory to site is constrained by module dimensions, routes, roadway regulations, permitting fees, truck capacity, and cost for long distance transportation. Therefore, the limited MCM market does not benefit from continuous and secured demands, and products that enter production vary in size, structure, layout, feature, and finishing based on the market and customer demands. The job sequence to manufacture modules is based on a first-in / firstout model due to limited demand, a condition which limits the opportunity to optimize the sequence of job. Demand variation causes deviation in the production rate and affects continuous flow of production. The production rate needs to reach a demand satisfaction level. A low production rate increases lead times and threatens the market which depends on rapid construction and thus, faster return on investment over site-built competitors. A high production rate causes over-production and increases inventory level and, hence, overall cost. Furthermore, a high production rate with limited demand leaves resources idle, which is a form of waste and an uneconomical behavior caused by unleveled production. MCM provides the opportunity for Lean application and implementation of Lean tools and techniques, including pull system to avoid over-production and pull from the end-customer (including both internal and external customers); supermarkets to control inventory; and visual control tools such as Kanban cards or Heijunka box to eliminate under-production and over-production. In MCM, because of fluctuations in customer demand, the production rate must be designed in such a way as to deliver a wide range of products in a continuous production flow. For this purpose in addition to current Lean strategies, the production leveling is required to be combined with resource leveling technique. Since different product has different Takt time, the challenge is to balance the resource 60
74 requirements including labor, equipment, space, and material through the production line. Labor requirements vary widely from module to module due to product fluctuations. For example, a residential module in a second floor that comes with roof requires roof insulation and shingle installation, whereas a module in a first floor does not require roof activities but requires cabinet installation. Figure 8 shows labor requirements for two modules that vary in size and layout. The total labor requirement for a 1,584 sq ft module is 729 man-hours, whereas the total labor requirement for a 665 sq ft module is 334 man-hours. The number of labor personnel at each station is the same for both modules, but production rates varies due to module size variation. Also, the labor requirement for each activity varies for the two modules; for example, drywall boarding is recorded to require 56 and 24 man-hours for the two respective modules. Labor requirement fluctuations also affect production continuous flow: (1) Takt time varies station to station and also module to module; and (2) the station with higher labor demand is a bottleneck in the production line, whereas the station with a lower labor demand stays idle. Figure 9 shows the labor requirements of six modules fabricated back-to-back. As two examples: (1) the labor requirements in the taping station for six modules are recorded to vary from 24 to 64 man-hours, and (2) the labor requirements for two succeeding stations such as insulation and drywall boarding, for one module are recorded to be 22 and 60 man-hours, respectively. 61

75 Man Hours Floor MEP Roof Ceiling Wall frame Wall set Rough-in Electrical Insulation Drywalls Taping Roof ins Ext finish Texture Int finish 1 Paint 1 Cabinet Hardwood Tile,Carpet Int finish 2 Mech finish Paint 2 Cleaning Load Out Man Hours Module sqft Module2-665 sqft Figure 8: Labor requirements of production tasks for two modules Figure 9: Labor requirement for production of succeeding modules This study shows the effect of demand variation on labor requirements at different stations through the production line. To level the production of modular construction, it is required to balance labor requirements and define the Takt time and labor requirement plan based on each product specification. Labor personnel are divided into groups that are each responsible for a specific task, such as drywall boarding or taping. Groups are restricted to a specific workstation on the line but, based on the labor requirement plan, multi-skill labor personnel are free to migrate upstream to increase the production rate of a module being 62
76 bottlenecked. Figure 10 presents required time for 11 modules at the flooring station with two labor personnel. The assignment of work is based on the given activity and not a schedule. For example, for preparation, activities such as measuring, marking, and nailing hangers are assigned to labor-1 and cutting joists to size is assigned to labor-2. Work is in not necessarily divided equally in terms of duration. On the other hand, duration varies from module to module depending on size and layout. To balance the labor requirements, the near optimum Takt time for flooring station is found to be 14 days. Figure 11 shows the balanced crew assignment; in this case two permanent labor personnel are required for the flooring station, and based on module requirements a multi-skill laborer may join the crew to catch up the Takt time by increasing the production rate Labor2 Labor Figure 10: Labor requirements for flooring station Labor3 Labor2 Labor Figure 11: Balancing labor requirement using flexible crew size 63
77 Customization and Standardization MCM customers have the same interest as those in the market for traditional stick-built facilities in buildings that are individually customized to reflect their needs. The challenge in MCM is to leverage the benefits of standardization that facilitate production line operation, while considering product customization and delivering a wide range of customer choice. This, in turn, affects production consistency and causes the process to deviate from standard practice. Although in modular construction products are not as precise as products in manufacturing, the fact that modules are assembled through a production line entails the opportunity to apply the Lean strategy of creating one-piece flow. In MCM the organization of production stations to create one-piece flow is a critical process because the line stations must be balanced and meet the labor targets in order to complete tasks in different stations simultaneously. In the Lean transformation process for modular construction, controlling the level of customization is a formidable challenge when the effect of line balancing on the future state is not known. Therefore, it is suggested that the manufacturing process streamline the type of products and standardize the tasks that are taking place in each station in order to create a onepiece flow and control the production speed until a steady-state production process is reached. Once the culture of a given plant is shifted toward embracing the application of Lean, a higher level of customization can be considered for the production process. In manufacturing organizations that rely heavily upon human resources for building production, data about the unique design of each building assists with estimating the required time and cost for labor at each station. The estimated required time needs to match the target time, which is planned based on a balanced production through a one-piece flow process. For this purpose, different production process scenarios are analyzed by moving labor around the line station to match the different labor components of products of varying scopes. The goal is to find the optimum line balancing scenario which meets the target labor time and cost, such that the production line is set-up based on buildings unique design 64
78 requirements. The adopted Lean-Mod strategies to meet the customization requirement suggested in this research are as follows: 1. Leverage the advantages of BIM for each unique design: The information about the building components properties can be extracted from the BIM model and be used to estimate the resource requirements for each specific building. In order to meet the production balancing goals, the production line must be reconfigured based on the optimum resource allocation scenario for the unique specifications of each building. On the other hand, creating standardized components to be used in all types of products helps to reduce deviation in production. Since the goal is to meet customer demand, the level of standardization is limited to a small set of components to be prefabricated off the line and assembled through the production process. The BIM model supports the challenge in designing assembly parts with ease of assembly in the production process. 2. Design components as standard sub-assemblies: Although standardization cannot be applied to every aspect of a the process for a given MCM product due to product variation, prefabricated components are required to be designed as standard sub-assemblies that fit to any module. Interchangeability leads to higher productivity and improves work performance. The level of interchangeable sub-assemblies depends on plant capacity, module type, and manufacturing technology. Subassemblies vary from small components such as prefabricated HVAC and plumbing pipes joined together, to prefabricated modules, such as washrooms and kitchens. 3. Design flexible resource arrangements incorporating labor, equipment, and space: For this purpose it is suggested to (1) train a number of multiskilled labor personnel who can move between various workstations in order to balance the labor load and reduce the labor requirement variance resulting from production reconfiguration. The use of multi-skilled labor 65
79 provides a flexible labor arrangement by which to move resources into the workstation with more complex tasks, which makes it possible for complicated products to be moved at the same pace as simpler products; (2) develop flexible equipment to facilitate layout rearrangement and reduce set-up time and balance production time; (for example, a flexible roof jig and platform that can be adapted quickly to mimic the exterior walls of any building to be produced will reduce the set-up time for different roof designs); and (3) arrange the plant layout and workstation area to occupy flexible space which can be increased or decreased in size and also can be combined with another station if necessary. 4. Standardize the process by documenting a Standard Operating Procedure (SOP): A standard approach is identical through the entire process and for every module fabrication. The advantage of process standardization is that uniform terminology can be developed to improve communication and ensure mutual understanding. SOPs are documented and displayed on a board at each workstation. One particular task is required to be performed in a unique procedure for multiple times when specifications are the same. Process variation caused by different module specifications must be described through the SOPs. The work procedure of SOP includes the sequence of activities taking place in the workstation with detailed techniques by which to perform each task; required materials and tools along with their locations; hazard and safety concerns; and required number of labor personnel, along with their specific responsibilities Scheduling In traditional scheduling methods, a fixed duration is assumed for each activity and as a result there would be a fixed duration for total work. In the real world, alternatively, task durations are not fixed and instead duration can be represented by an independent random variable based on probability distributions. The probabilistic duration is defined with individual data distributions for each 66
80 workstation, such that it defines the most probable duration and man-hour requirements through the production line. The probabilistic duration is useful for cost estimation purposes and overall production evaluation. Generally, management teams focus on target man-hour requirements calculated using historical data or ideal-state estimation; therefore, the use of probabilistic duration results in more precise cost control information. On the other hand, accurate activity duration plays an important role in creating the schedule when it comes to developing production flow for customized manufacturing where the production schedule is not easily predicted. Scheduling is therefore required in order to reflect exact work duration for labor allocation planning and production leveling purposes. There are various scheduling methods in construction and manufacturing practices. In Lean production practices, scheduling is done through value stream mapping (VSM) and Takt time calculation for working cells in the production line. In Lean construction practice, LPS is a production control technique by which to predict work flow. In traditional construction practices, Critical Path Method (CPM) creates a schedule based on the work breakdown structure of the defined scope. In projects with repetitive tasks, the Linear Scheduling Method (LSM) focuses on continuous resource utilization. According to MCM scheduling requirements, the combination of the four methods brings about a more effective scheduling plan. In MCM the product is fabricated and assembled through the workstations of the production line, which define the Takt time for the production and must be finished on time in order to deliver the product on time. A resource allocation plan fulfills these activities requirements to guarantee on-time delivery of the product. These activities are thus placed in the critical path of the production. There are also secondary activities taking place simultaneously, including supporting activities such as material handling and off-line activities such as component assembly to feed the line station which are not critical and have float to be completed. A sample module schedule is given in Figure 12 showing on-line, off-line, and critical tasks. 67

81 Figure 12: Sample schedule to fabricate a module The challenge in modular production is achieving continuous work at each station. In this regard, a schedule must be generated for all individual modules to be fabricated through the entire production line considering production constraints such as activity sequence, location (workstation), equipment and material requirements, and labor utilization. Figure 13 shows a schedule of four sample modules which vary in size and layout but which are fabricated back-to-back in the production line. In this linear scheduling graph, the horizontal axis plots time, the vertical axis plots workstation progress based on the moving module through the production line, and the sloping lines represent production rate. The technological predecessor is based on the sequence of activities, and the crew must have completed work on a given module before the next module moves to the station. Since products vary in size and layout, the production rates vary for each module at each station. For example, the work on module 1 at station 3 starts at day 38 and ends at day 40; this module then moves to station 4 and module 2 moves to station 3 (A). After work completion on module 2 at station 3 it moves to station 4 and module 3 68
82 moves to station 3 immediately (B). The work on module 3 at station 3 is completed at day 56 and it is ready to move to station 4, but the work on module 2 at this station finishes at day 61, so module 3 has to wait 5 days until station 4 becomes available (C). Meanwhile, following work completion on module 3 at station 3 at day 56, the crew cannot start work on the next module, module 4, because this module is still at the previous station, station 2, and work completes at day 59. The crew must wait for 3 days until the next module moves to the station (D). In order to eliminate crew idle time, all activities on previous modules can be delayed so the crew works continuously (E). Although this option temporary solves the problem, in order to find the most effective scheduling technique for MCM a combination of existing techniques is proposed. In this strategy individual tasks are ranked to use the total float in order to optimize resource utilization. The combination of CPM, LPS, LSM, and VSM provides an informative plan by which to define pull intensity, work float, production progress, and percent planned complete calculation. 69
83 Figure 13: Production line schedule for sample modules 70
84 CPM scheduling provides the flexibility that Lean practice requires in order to meet the demands of project stakeholders and to deliver value to teams with different required delivery targets. Therefore project stakeholders negotiate for duration and work sequence considering overall production plan and downstream trades by the look-ahead schedule in LPS, which shapes the sequence and rate of work. A detailed work plan specifies handoffs between modules at each station and the backlog of ready work. Milestones are defined for non-critical activities such as just-in-time delivery dates. A logical plan is then assembled based on stakeholders opinions through stream mapping sessions, as well as on calculated start and finish dates based on relationships which detail the crew requirements. After calculating the lead time and Takt time for the critical activities through the production line, total float is calculated in order to level resources where needed, and production constraints are defined for repeated activities in LSM. As presented in Figure 14, the ideal production schedule is obtained when stations have equal Takt time and production rate, such that within a certain period of time each module can be completed regardless of variation in size, layout, or specifications. Figure 14: Ideal production line schedule for sample modules In the real world it is not practical or rational to force activities to take place with equal production rates since this increases labor requirements in addition to creating high variation in labor utilization. Instead, imposing an equal Takt time 71
85 No. Station On-line Critical Work Station No. Labor Module sqft Module 431A 660 sqft Module 431B 609 sqft Module sqft Takt time Module 432 Module 431A Module 431B Module 433 No. Labor Module 432 Module 431A Module 431B Module 433 for all the on-line critical stations is a more effective and practical means by which to create a continuous flow through the production line. In this practice, a group of multi-skilled labor is required to work in any stations where needed. Table 1 presents the number of required labor for each module at each station in order to achieve a uniform Takt time throughout the production line. To schedule and arrange labor to best suit the increased man-hours at any time while minimizing total number of labor personnel, the objective function for labor balance is defined in Equation 1. Equation 1: Labor balance objective function where: W = Number of multi-skilled labor, i = {1,, W}; S = Number of available stations to travel between, j = {1,, S}; and X ij = Number of multi-skilled labor personnel assigned to stations. Table 1: Resource plan allocation for scheduling Hr Mhr Hr Mhr Hr Mhr Hr Mhr Hour No. Labor Labor balance 1 Wall set-cubing Rough-in Insulation Boarding drywalls Taping Texture & Prime Interior finishing Paint Cabinet Hardwood Tile & Carpet & Vinyl Interior finishing Mechanical finishing Paint Wrapping & cleaning QC & Load Out
86 In Lean practice, the VSM is a tool by which to control the production rate and product delivery time. VSM becomes complicated after adding sub-assembly stations and supporting milestones. Sub-assemblies are supposed to occur simultaneously and end at the same time in order to be fed to the production line, but in real situations they have different yield times and error rates. In order to combine sub-assemblies to the main stream in VSM, it is required to consider a default production rate for feeding the production line which reduces the work flexibility and leads to inventory in sub-assemblies. The statistical calculations of Lean tools alone are in this regard inadequate for MCM, since it is necessary for judgments and probability rates to be generated in addition to the outputs of these tools. The adoption of VSM for MCM is discussed further in the following section Production Flow The production line in MCM typically follows a straight line, U- or L-shape, double parallel, or a combination of these. Workstations vary in number from 15 to 30 stations and consist of a broad range of construction and fabrication activities. There are typically 20 to 30 key activities, with each broken down to a number of sub-activities. Each group of activities is performed by a separate crew at an individual station. Some activities require special equipment or facilities, such as an assembly that requires the use of an overhead crane, or a door installation that requires painting an area prior to installation. Other activities are constrained to job sequence. The production process in the plant starts with framing sub-assemblies such as wall, floor, roof, and ceiling, which take place on off-line workstations. Sub-assemblies are fed to on-line workstations that typically start with setting walls on the floor and assembling the roof/ceiling on top of the walls. Precedence networks between activities are complex in terms of creating balance between job sequence and time constraints. A typical production flow is displayed in Figure 15. In Lean practice activity boxes indicate a continuous product flow and tasks are divided at the places where the product flow stops, and the process is plotted as a VSM. 73

87 Figure 15: Typical task flow chart for modular construction manufacturing VSM was first developed in the automobile industry and has been used extensively and effectively in manufacturing for a limited family of products. However, in the context of MCM, utilization of VSM is complicated by the high product variation and low volume demands, making the current VSM method impractical in creating continuous flow. Also, the production process consists of hundreds of activities, each with a complex predecessor activities network, which barely fit on one single map. Dividing the entire production process into a number of phases with individual VSM, makes the process a complicated one for the VSM team and other stakeholders to handle, and the fragmented flow makes it difficult to synchronize the Takt time. Furthermore, the current definition of some of the statistical measures used in VSM, such as cycle time, up-time, available time, and inventory are not applicable to MCM. Figure 16 shows the current state of a residential modular factory fitted into a value stream map. Durations in the manufacturing of modular buildings, due to the high variation throughout the production process, are displayed with data distributions best fitted for each workstation, which is in contrast to typical VSM, wherein attributes are presented in constant value. There is no inventory of product between workstations since modular buildings are generally made to order and also due to the physical constraints of fabrication plants and the limited space available for bulky modules. The production schedule is generated once the design department 74
88 releases the job start notification to the plant, and the production manager arranges the upcoming schedule. Figure 16: Current-state VSM of a residential modular factory A set of icons and symbols are used to represent process and flow in generating VSMs, as summarized in Appendix B. In MCM, due to the large number of activities during the production process, it is required to assign different types of parallel group activities to one workstation such that multiple crews work on the same module concurrently. In VSM every station therefore needs to be divided into a number of sub-stations to reflect associated attributes, including process time, number of labor personnel, and yield throughput. On the other hand, due to the duration variation of activities in the process for different modules, it is common that some activities extend to subsequent workstations. The production line moves according to Takt time or based on the push system; a module therefore leaves a workstation regardless of activity completion. Otherwise, if an activity is not completed on a module, then neither the module nor any upstream modules move. Further activity completion forces a crew to float over multiple 75

89 workstations carrying necessary material and equipment with them in order to finish the job; this makes measuring processing times accurately a difficult task. In order to increase the level of control over the production flow, the VSM is modified in order to map the production process in such a way as to reflect two types of duration fixed and variable in terms of man-hours. Fixed durations remain consistent throughout the production of different modules, while variable durations depend on modules specifications and change from module to module. In each individual station, various numbers of activities that differ in duration type are performed on a module. Therefore, all production activities must be reviewed once to categorize activities to ensure accurate production planning. For this purpose, one useful technique is process mapping using stick notes, as presented in Figure 17. Process mapping displays the sequence of activities which occur within the production process and identifies the responsibilities of work crews. In this approach, every individual worker is involved in process mapping, presenting their tasks on sticky notes with arranged sequences. After this step, the process map is documented for future planning as presented in Figure 18. In this process activities that have fixed durations regardless of modules specifications are specified as the baseline for labor allocation. Other sets of activities with variable durations are estimated by means of quantification rules based on modules dimensional properties. The total duration of both sets of activities define a proper resource allocation plan. Figure 17: Process mapping through stick notes on the wall 76
90 Figure 18: Sample process map for one station Material Ordering and Material Handling An efficient supply chain management system, including material ordering and material handling through the production process, supports continuous work flow and increases production efficiency. For this purpose, it is required to identify types of materials being used in the modular fabrication process and the associated requirements for the ordering schedule. There are two types of material and components which need to be purchased for production: stock inventory and stream inventory. Stock inventory includes materials, components, and consumables that are common for all modules and could be purchased in bulk and are kept in the warehouse. Stream inventory refers to materials and items that are ordered and loaded-out at the staging point of each station according to its consumption schedule. The production strategy to create a continuous and smooth material flow and reduce in-process inventory is the use of just-in-time material ordering throughout the production process. The material ordering schedule for stock inventory is defined using the inventory planning technique, which involves analysis of cost 77
91 versus quantity to optimize min-max inventory system with enhanced replenishment rules. The ordering schedule for stream inventory is based on lead time arrival calculation and inventory planning in order to find the most efficient point of ordering. Material lead time is the time between initiation point, which is the time at which an order is placed, and execution point, which is the time at which material is received at the plant ready to be used. Lead time calculation must be integrated with the BIM model to automate estimation of ordering time based on material take-offs and component schedules. Material ordering for stream inventory occurs in three stages: Long lead time items take weeks to arrive in the plant, so they should be ordered in the early stages of the project. Job start purchasing items have a predictable lead time arrival, so they should be ordered based on the station schedule. These can be stored at the station a day in advance to be checked for quality and confirmed for a job the following day. Through-stage purchasing items include items and materials that are required for an on-site job. Site job materials are extracted from the BIM model and ordered based on estimated ordering schedule. Another strategy to support the maintenance of continuous flow in production is material handling throughout the process. Efficient material handling requires a standardized procedure for receipt, checking, storing, controlling, protection, and issue of material for production. In order to control material flow, a Kanban inventory control system is used to replenish materials. A Kanban is a visual signal indicating a need for replacement or refill of material. Kanban cards must be filled out indicating a reason code with job number for future reference for load out and estimating purposes. The material handler picks up Kanban cards daily from each workstation and performs the necessary replenishments. Extra material left after job completion are tagged on a Kanban card as estimated error and are used for future estimating purposes. Material handlers check workstations 78
92 for Kanban signals, move required material to workstations, and locate inventory. A workstation foreman ensures that received material is tagged, organized, and adequate for jobs according to the receiving date, and posts the Kanban card upon receipt of the materials in order to adjust the inventory Quality Quality control in MCM is focused on process control and product conformance. Since the MCM process produces unique products which cannot be discarded if defective, rework is generally accepted in current practice in order to prohibit defects and deliver a foolproof product. The challenge in MCM is to eliminate this rework from the production process while maintaining the quality demanded by the customer. The adopted strategies to meet the quality requirement are as follows: 1. To prevent design defects and clashes through the design process, quality needs to be targeted at the evaluation level. Value engineering (VE) is a method by which to improve the value of a product, and can be used to review the design process and improve production efficiency by reducing rework and defects. The new product must be reviewed in the early stages of the design process by the VE team, including all stakeholders who are involved in the production process. The design is reviewed through the first VE meeting to confirm the constructability and cost effectiveness of the product. Another VE meeting is held after producing the design drawings with the objective of reviewing the production process in detail at the workstation level and visualizing the production using BIM prior to actual implementation in the plant. 2. To prevent product defects through the production process, quality also needs to be targeted at the tool level within the organization. It is the responsibility of every person involved through the entire process to deliver a set of guidelines and standards for quality for the job to be performed. Developed standard practices and instructions for tasks taking 79
93 place, from the design phase to fabrication and assembly, must involve quality control and safety components in the job description. Since quality in construction can be translated to different levels of satisfaction by different trades, measurable standards must be defined, such as ratios of variances, which are practical for a defined pace of production. These standards are required to be measured repeatedly during the production process in order to build in quality. 3. To prevent the flow of defective parts through the production process, quality also needs to be maintained at the control level. Quality checklists and visual inspection devices at each workstation are tools to ensure quality at the control level. Quality checklists are prepared by internal customers of downstream processes, include work specifications for a ready job, and are enforced through review at upstream processes to confirm delivery of foolproof products the first time. Checklists are a useful tool by which to continuously improve and update the quality standards for the performance of tasks and product specifications at each station. 4. Quality needs to be addressed at the organization level by building a culture in which standards are measured during and after production. In order achieve the desired quality the first time, the process must be stopped (if the quality standards are not met) to fix problems as they occur LEAN-MOD INTEGRATED TOOL A set of so-called Lean-Mod strategies are proposed in this research. In order to apply these strategies on a factory production line, an enhanced integrated approach of BIM, Lean, and simulation is proposed. In this technique, several procedures are implemented to achieve the research objective to improve the production efficiency of the MCM industry. The proposed methodology and 80
94 associated components are presented in Figure 19. The main methodology process is divided into five major phases. In Phase I, a BIM model of the case study as a modular building is developed with detailed design drawings of the building structure. For this purpose, Autodesk Revit is used. Next, the material quantity take-off lists and component schedule of a module are categorized and extracted from the BIM model in order to quantify resource requirements based on module dimensional properties. In Phase II, the modular construction processes of several factories are studied and a time study is performed on the fabrication of a number of residential modules. The time study is performed in order to determine the production time and resource requirements of component fabrication at each station considering product variation. The data from this time study is analyzed to estimate probabilistic duration, productivity rate, and actual man-hour requirements for each activity. In Phase III, the production process is studied thoroughly and the current process flow is mapped to find defects and process deficiencies. Then, based on current Lean strategies and proposed Lean-Mod strategies, a number of recommendations are proposed in order to improve the production process efficiency. In Phase IV, a simulation model of production flow is developed in Simphony.NET 4.0 in order to depict the production line layout, schedule, and resource requirements. The inputs for this model consist of information extracted from the BIM-generated 3D model, the resource requirements, and proposed improvements. The simulation model delivers results for different production scenarios and provides the opportunity to evaluate the proposed future-state in order to optimize the production process. In Phase V, a post-simulation visualization model of evaluated production scenarios is developed which can be used by management teams as a more efficient tool for production flow analysis. As a result, the resource requirements to complete various modules are determined, along with potential scenarios for work flow balancing. 81
95 Input Module s dimension Building design Various resource requirements Production flow Production rate and duration Criteria Factory space layout Available resources Factory working hours Customer demand schedule Target value and Schedule Main Process (I) Generating data from the BIM model (II) Production Line Assessment through Time Study (III) Production Process Analysis to Propose Improvements (IV) Developing and Analyzing Simulation Model (V) Developing Post Simulation Visualization Model Processing time Takt time Lead time Output Resource utilization Production rate Production flow scenario Figure 19: Proposed research methodology The methodology of this research is examined by means of a case study of a modular manufacturing company. Current- and future-state maps of the factory production line are compared to prove the effectiveness of the proposed methodology. In this research, advanced methods and techniques in productivity efficiency are integrated into a new methodology created for MCM Phase I - Generating Data from the BIM Model In modular manufacturing, the gap between the design and drafting phase and the production phase in the current practice limits the ability of companies to achieve potential efficiency and cost-effectiveness offered by a manufacturing-based approach to modular construction. A link between design and production in MCM is essential due to the following factors: (1) once the construction stage of a 82
96 modular building has started, changes to the design and construction plan are costly. Accurate design that reflects production demands provides a means by which to evaluate constructability during the design phase and serves to reduce rework; (2) customer demand for unique buildings that are individually customized to reflect their needs entails the deviation of the work flow process from a standard one and affects production efficiency. In order to create a smooth work flow, the production line must be set-up based on the given project s unique requirements and specifications, which can be transferred from the design phase; and (3) a detailed design provides the basic data which can be used during production, including resource requirements and associated costs. The proposed improvements to the manufacturing process begin with a changeover from traditional 2D drafting to a much more robust BIM platform. The construction begins at the design phase, where the advancement of automated design can lead to increased cost efficiency and can offer interoperability amongst the phases of a project s life cycle. The solutions being used in this research to facilitate interoperability are drawn from a BIM model, particularly through Autodesk Revit, which uses a common engine that provides integration among related models. BIM helps to create intelligent models for building elements and systems, including walls, beams, columns, and Mechanical, Electrical, and Plumbing (MEP) systems. BIM models have the capacity for extensive information related to component properties, such as geometry, associated components, location, suppliers, cost, building codes, and production schedules. To accommodate the proposed integration methodology requirements in this research, the Autodesk Revit Structure add-on, which is a tool for the design of wood framing structures, is used to generate the BIM model and building component schedules. The methodology for Phase I is presented in Figure
97 Criteria Module s dimension Available equipment Sustainability Constructability Standards ISO standards Material specification City bylaw National building code Input Architectural/Structural/MEP Modularity / Framing method Building Information Modeling 3D Model and design drafts Material quantity takeoff list Dimensional properties Figure 20: Schemata for the process of generating data from the BIM model The BIM model inputs include wall, floor, ceiling, door, window, and MEP information, along with information related to the modular concept and the selected framing method. The BIM model is generated considering: (1) criteria including module dimensions, available equipment, sustainability, and constructability; and (2) standards including International Organization for Standardization (ISO) standards, material specifications, city bylaws, and national building code requirements. Architectural components are represented by the 2D layout of the project based on the production resources specified in building codes (i.e., the National Building Code of Canada, issued by the Institute for Research in Construction). The structural requirements specified in building codes are used to define the components for each wall, floor, ceiling, door, and window. The modular concept, meanwhile, defines a set of rules for modules dimensions as well as for the layout and division into modular units based on road regulations as they pertain to the transporting of fabricated modules, acceptable dividing elements, and the lifting capacities of cranes. In the main process, the BIM model is developed to generate a 3D model of the building, material quantity take-offs, building component schedules, dimensional properties, sections, elevations, and 84
98 shop drawings. The data related to component properties that are extracted from the model, including the linear length, surface area, number of windows, columns, doors, are also used as inputs for the simulation model Phase II - Production Line Assessment through Time Study In traditional scheduling methods, a fixed duration is assumed for each activity and as a result there would be a fixed duration for total work. In the real world, alternatively, task durations are not fixed and instead duration can be represented by an independent random variable based on probability distributions. Accurate activity duration plays an important role in creating the schedule when it comes to customized manufacturing, where the production schedule is not easily predicted. The factory production line in customized manufacturing cannot be run at a steady pace since the activities taking place at each station are contingent upon individual designs tailored to fulfilling customers demands. In order to measure the effect of product variety on the production line pace, a time study is conducted in this research. Data is collected from a time study and analyzed for each activity in order to determine and formulate the statistical representation of the required resources, including labor, time, material, and space, to complete an activity. The time study assists in identifying the key elements that affect duration based on the predefined tasks performed at a particular station. In a modular manufacturing factory, the construction process is divided into a number of stations where specific tasks are taking place, and modules are moved along from station-to-station as they progress through the construction process. As such, an accurate time study requires familiarity with the entire procedure, as well as of the partial procedures at each station. The procedure of this phase is shown in Figure 21. For this purpose, the production processes of several MCM organizations are studied, including Igloo Prebuilt Homes ( Igloo ), Fortis LGS Structures ( Fortis ), PTI Group Inc. ( PTI ), and Landmark Group of Builders ( Landmark ). Some modular manufacturing factories rely heavily on human resources to perform jobs through the entire process, while in industrialized 85
99 factories many of the tasks are performed by machines. Either way the production tasks are the same, but the time spent at each station varies and still is a function of components dimensional properties. Become familiar with the whole process Identify the operation in individual stations Define specific schedule to do the time study Define sample modules for observation Record idle time for next station Record buffer time between stations Record required time and resource at each station Define tasks are done at each station Calculate Takt time and compare with operation time Calculate manhours and Production rate Define objective function, constraints and decision variable Define proper distributions and parameters Test and validate the result Formulate a set of general rules Quantify activities actual duration Quantify stations probabilistic duration Figure 21: Production line flow analysis through time study process In the next step, the construction of a number of sample modules is monitored through a time study to record the duration and resource requirements, including labor, time, space, and material for each activity completed in every station. The duration and production rate are calculated for different tasks, and proper distributions and trends are generated for each activity accordingly. The data analysis is used to formulate a set of general rules to quantify probabilistic duration, productivity rate, and actual man-hour requirements at each station based on module specifications. Module specifications are extracted from the BIM model into spreadsheets and a user-friendly interface is developed in order to automate estimation of activity durations. The generated data is then sorted into a database which is linked to the simulation model. 86
100 Phase III - Production Process Analysis to Propose Improvements In this phase, after detailed and accurate analysis of the production process of the case study, several recommendations are proposed in order to improve production efficiency. The proposed recommendations consist of two main sections. One is general recommendations based on current Lean strategies and proposed Lean- Mod strategies that are applicable in any MCM organization. The other set of suggestions are proposed particularly to improve and reduce existing defects and deficiencies in the current production practice of the case study. The process by which to identify and present improvement recommendations is presented in Figure 22. Collect information Map current VSM Identify value Challenge current state Identify improvement Map future state process Figure 22: Process by which to identify and present improvement recommendations As the first step, the required information to create the current-state VSM of the factory production line is collected based on a detailed process review in order to find how work is performed. Required data include activity cycle times, set-up time, down time, idle time, material and equipment requirements, number of labor personnel, inventory and material information flow, customer demands, and yield rate. The process of gathering information begins with a quick walk along the entire production line to provide familiarity with the work flow and sequence of activities. Next, data is gathered for each process from end module shipping to upstream stations to find the direct links among activities. Figure 23 shows a sample table of collected information for one studied module. Cycle times for individual tasks are recorded using a stop watch and are used to compare the total cycle times and scheduled Takt times. Potential areas of improvement are also recorded to be referenced later. 87
101 Figure 23: Sample collected information for one module The next step is to create product flow through a current-state VSM that starts with a rough hand sketch right on the shop floor, as presented in Figure 24. The value stream is identified and mapped for each group of activities and flow of material and information. Critical path, bottlenecks, and flow obstructions are defined. The current-state map is analyzed and challenged from the current Lean point of view as well as from the proposed Lean-Mod perspective in order to identify problem areas and opportunities for improvement. A critical step in finding areas of improvement is to specify value as perceived by the endcustomer, (i.e., what the customer is paying for). The VSM identifies where value is added in the process as well as other activities that are non-value-added. 88
102 Figure 24: Hand sketch value stream map for the case study The final step is to compile a future-state map based on the current-state and the critiques in order to visualize the ideal and realistic future-state. The map reflects changes that can be realistically achieved through the defined timeline. In this step two types of kaizen are considered: (1) flow kaizen, which is value stream improvement, with a focus on material and information flow; and (2) process kaizen, which is waste elimination at the workstation level, with a focus on people and process flow. A number of general and specific potential kaizen opportunities are recommended for the case study. After calculating Takt time based on the specifications of modules arriving at the production line, a resource plan allocation is generated to define the number of operators at each station. The overall production flow map of the future state remains the same, but the 89
103 production rate and labor requirements are dynamic parameters that are optimized by means of simulation Phase IV - Developing Simulation Model The process to develop the simulation model is shown in Figure 25. The currentstate VSM and future-state VSM of the production process are modeled in Simphony.NET 4.0. In this research, discrete event simulation (DES) in a general template is used to collect and link elements in order to represent production activities and processes in one domain. The elements functionalities are predefined in the general template, such that the user is able to select elements based on required function, drag and drop them on the modeling environment, and link them together to create a model with only basic knowledge of computer programming required. The user does need knowledge about the elements functions in order to create the model in Simphony and skill to translate the outputs. Simphony.NET 4.0 was developed to provide a more flexible environment for modeling purposes and consists of services to facilitate DES, as well as templates within a graphical user interface. In the simulation model, the value stream map of the factory is created to show the product family, information and material flow, work cells, inventory amount, daily customer demand, supplier and shipping schedule, and production volume. The simulation model involves two input types: Fixed and random variable. The values of fixed variables, such as number of entities, change over time, yield rate, value-added time, and transportation time between stations, remain constant during a simulation run. These fixed inputs are defined by the user according to the factory and project specifications. The values of random variable inputs, such as process time and number of operators, change according to a predefined data distribution during a simulation run. These random variable inputs are fed from the developed database in a Microsoft Access file where probabilistic distributions of various activities are generated based on the module specifications 90
104 in the BIM model. The Simphony elements used in the simulation model to represent process and flow are summarized in Appendix C. Inputs Current state VSM Future state VSM Task duration distributions Resource plan allocation Criteria Factory layout Available resources Available working hours Customer demand schedule Simulation model Developing simulation model of current and future state of production flow in Simphony Feed components dimensional properties from Access file generated from BIM model Evaluating the simulation results and repeat the process to find a near optimum solution Processing time Takt time Lead time Output Resource utilization Production rate Production flow scenario Figure 25: Process for generating and evaluating the future-state through simulation Generated outputs from the simulation model include total processing time, lead time, Takt time, labor utilization, production rate, and potential production flow scenarios. The model is also capable of producing information about cost of fabricating various modules, but this is beyond the scope of this research. Simphony is able to provide output charts and reports that can either be read in Simphony or exported to a Microsoft Excel file for further analysis. The simulation model outputs of various scenarios are evaluated in order to find a near optimum result. The optimum result addresses the following goals: (1) increased productivity, (2) balanced labor allocation, (3) satisfied customer demand in terms of schedule, (4) reduced or eliminated waste, (5) reduced delays, (6) eliminated bottlenecks and unnecessary material handling, (7) addressed defects and problems, and (8) optimized space usage. 91
105 Phase V - Developing Post-Simulation Visualization Model The proposed post-simulation visualization (PSV) is the 3D visualization of the DES model, representing physical working environments with 3D graphical objects. The model depicts the simulation of the production process in detail, producing and displaying production flow information simultaneously such as lead time, production rate, and resource utilization for evaluation purposes. The proposed system has the capacity to be linked to all possible production information. The model needs to be flexible in order to deal with changes in process caused by module variation and to present a complex production process in a simple way. Visualization of the simulated process is proven to be an effective tool in communicating the value and simplicity of the minute-by-minute schedule. The simulation result comparison between the initial model before applying PSV and the final version after running PSV several times shows significant improvements in terms of eliminating waste, smoothing the production flow, leveling resources, and reducing idle time. A comparison is also conducted among various scenarios, by which the management team confirms the considerable impact of the PSV model in terms of decreasing activity durations, eliminating errors and rework, and identifying the best potential production scenarios using visualization of the simulated process during the planning phase. In this research, two approaches are performed to create a PSV model. The first approach integrates animation with statistical outputs of simulation model and provides a lifelike image of the process. The second approach is more dynamic, capable of responding instantly to changes made to the process. In the first approach, to create a real-time abstract simulation model by means of computer animation, a visual presentation of production scenarios is developed. After evaluating and comparing results among various potential production scenarios, a scenario with near optimum results is selected for visualization. A 3D model of the production process is also developed in Autodesk 3D Studio Max (3ds Max) showing certain activities at all the stations in the production line. The processing times of all the stations are imported from the simulation model output 92

106 in the form of an ASCII file, which is a binary text file, and are linked to the 3D animation semi-automatically. Within the 3D animation environment the highlevel simulation model is transformed to a micro-level representation in frames/minute. To develop the PSV model, 3ds Max s scripting language, MAXScript, is used. As inputs of the PSV model, two sources are required: (1) the 3D model library of PSV; and (2) the simulation model output that stores the spatial configuration of the construction process, along with performance time. The PSV model imports 3D models from the 3D library, including models of the equipment, modules, resources, and the 3D factory, and assembles them in 3ds Max. Then the 3D animation engine uses the data from the simulation output file in order to create the key frames. A snapshot of the generated PSV model is presented in Figure 26. The model s outputs are production processing time, labor utilization, safety and quality control, and evaluation of potential scenarios for construction operations. Figure 26: A snapshot of the PSV model developed in 3ds Max 93

107 The second approach is pursued to create a more dynamic visualized model from simulation results which can be modified by any user with no special software skills required. For this purpose Autodesk Navisworks Manage is selected, which combines clash finding analysis and interface management with 4D schedule simulation. The 3D model of the factory is developed in Revit and then, along with 3D models of modules generated in the design phase, is imported into Navisworks. The imported outputs from the simulation model for existing modules in the production line and coming modules to be visualized include the processing times at all stations, resource allocation plan, and work sequence, as presented in Figure 27. In order to analyze different scenarios for plant layout configuration with automatic clash detection, more information is added to the model, including overhead crane capacity, factory space limitations, and labor safe work area. In this model, the relationships among components are defined through parametric modeling rules and constraints, such that the model responds automatically to any changes immediately. Figure 27: Snapshot of the PSV model developed in Navisworks 94


108 4. IMPLEMENTATION IN CASE STUDY This research was studied and implemented on four different modular factories which manufacture in different levels. Table 2 presents the levels of manufacturing and site assembly at each factory, as well as definition of the modules being produced. Since factories are manufacturing in different levels, validating the methodology on all the case-studies is not reasonable. Therefore the focus of this chapter is on the implementation of the proposed Lean-Mod concept through the proposed enhanced tool to integrate building information modeling (BIM), Lean, simulation, and visualization on a main case study, which is Igloo Prebuilt Homes ( Igloo ), a residential manufacturing company in Edmonton, Canada, that illustrates the effectiveness of the proposed methodology. The validation is defined by acceptance and testing of the methodology by stakeholders. Table 2: Case-studies: manufacturing level and produced module Factory Module Manufacturing level Module Igloo Wood structure Homes Assemble the building in factory and ship complete module to site PTI Wood structure commercial, residential, and temporary buildings Assemble the building in factory and ship complete module to site Fortis Steel structure panels, and bathroom units Ship and assemble panels on-site Landmark Wood structure Panels Ship and assemble panels on-site 95
109 4.1. INTRODUCTION In phase I of this research, the main focus of implementing BIM and generating information from the BIM model is on Igloo, which fabricates wood structure residential modular homes. Similar approaches are also employed at PTI Group ( PTI ) and Fortis LGS Structures ( Fortis ) to verify general application of the methodology. PTI fabricates wood structure commercial, residential, temporary, and permanent modular buildings. Fortis fabricates light gauge steel structure (LGS) walls as well as complete bathroom module. Although the methodology is verified through all the case studies, it is the results from the main case study, Igloo, which are presented in this research. In phase II, the production processes of several modular construction manufacturing (MCM) organizations are studied, including those of Igloo, Fortis, PTI, and Landmark Group of Builders ( Landmark ). Landmark produces wood structure panels and many of the tasks are performed by machines whereas other factories rely heavily upon human resources to perform tasks throughout the entire process. As a result of the process study, it is noted that in either case the production tasks are the same, but the time spent at each station varies and is a function of components dimensional properties. In the next step, the construction of 11 sample modules is monitored through a time study at the main case study, Igloo, in order to record required data for this phase. In phase III, two sets of recommendations are proposed. General recommendations are proposed based on current Lean strategies and proposed Lean-Mod strategies that are applicable in any MCM organization. Specific recommendations are proposed particularly to improve and reduce existing defects and deficiencies in the current production process at Igloo. In phases IV and V, the methodology is validated through the main case study, Igloo. It should also be noted that a similar approach has already been tested on a different project which involved the construction of a 34-storey building in Brooklyn, New York, USA. Simulation visualization of the process proved to be 96
110 effective in communicating the value and simplicity of a minute-by-minute schedule, including a separate production clock for all the resources that were automated and updated for each simulation run. Based on the output information, the most efficient solutions were generated. The use of post-simulation visualization was effective in analyzing the construction methods of the project, which consisted of 950 structural steel modules. Issues related to construction activity productivity were synchronized in order to achieve a plan for on-site installation of the project in only 56 working days. Igloo Prebuilt Homes prefabricates residential modules under environmentallycontrolled conditions in a 125,000 sq ft facility and transports them to sites. MCM provides opportunity for the company to offer time efficiency, cost effectiveness, and superior quality compared to traditional stick-built construction. All houses are built to building code for the given region, and are transported and installed in urban, rural, or remote areas. Igloo fabricates custom-designed homes that vary in features, layout, and size between 600 sq ft and 1,600 sq ft. Also, Igloo is pioneering the industry by making near net-zero homes that are affordable and environmentally conscious PHASE I - GENERATING DATA FROM THE BIM MODEL There are two major advantages associated with the application of BIM during the design phase: (1) it increases the productivity and flexibility of the design process; and (2) it supports the production line by creating detailed design requirements for manufacturing. Some of the main challenges through the design process are to improve the efficiency, automate the process to a certain extent, and reduce the rework among different disciplines that increases time and cost of design. Another challenge within the MCM industry is to generate design information which can support the manufacturing process with accurate production drawings and exact material and labor estimations for individual designs. 97
111 Current Practice Defects of Case Study Igloo s current process poses a number of specific deficiencies: 1. The first sketch of a model is created for preliminary analysis in a particular software, and cannot be subsequently altered by other users; the model is passed to the architectural, structural, and mechanical/electrical/plumbing (MEP) designers, and they then transfer it to different software applications by manually inputting information, which increases the probability of data entry and versioning errors. 2. The generated 2D model contains many conflicts and interferences since the current system is not capable of exploring the model visually. Also, inputting of framing details needs to be performed manually for every single wall existing in the model. In addition, this process is timeconsuming and error-prone. Some of the undetected clashes are passed from design to construction after the release of the production drawings, which increases time and cost due to rework during construction. 3. In the case of change orders in design, all the information related to the change must be revised, necessitating additional effort to apply changes to each of the details, which are distributed among numerous separate drawings. 4. Material cost estimations, material ordering lists, labor requirements, and labor costs are generated manually using shop drawings which are not thoroughly accurate, containing errors and miscalculations. 5. Current detailing efforts to generate various sets of drawings for production, permits, and site assembly are not cost-efficient or timeefficient. 6. There is a gap between the design and production phases in current practice. The generated model does not support understanding of the 98
112 challenges involved in the production and fabrication sequences in the plant BIM Implementation Advantages for Case Study In this research, Autodesk Revit is selected as the BIM tool, and the application of BIM bringing the following advantages for the aforementioned case-studies: Through the use of BIM, once the model is created for the first sketch and preliminary analysis it can be used by multiple users subsequently. The model is passed to the architectural, structural, and MEP designers so that multiple disciplines are able to work in parallel on one model. The model is saved on the server, which reduces the probability of data entry errors, data translation demand, and versioning errors, since the information is combined into a unified source. The generated 3D model is used to detect conflicts and interferences, facilitating visual exploration of the model to resolve these issues immediately. BIM also provides detection clashes during design so construction issues are resolved before releasing production drawings to the plant for construction, which reduces time and cost and increases quality. BIM provides the foundation by which to automate the design process to a certain extent. The specific design rules and details which are used in every design for a particular organization are stored in Revit templates or as an add-on to facilitate automation of design and drafting. Also, lessons learned from previous errors encountered during design are archived through the BIM clash detection database and reviewed automatically to avoid any error repetition. The BIM model reduces rework in different ways. In case of change orders in design, once the 3D model is updated all information related to the model is revised without any further effort required in order to apply 99
113 changes to every detail in the model. BIM also reduces rework in producing multiple sets of information for different disciplines. The 3D model is used to generate production drawings, permit drawings, site and assembly drawings, material quantity take-offs, and component schedules. The model created in Revit contains information related to materials and components, including material quantity take-offs and component dimensional properties, which are extracted to generate material cost estimations, material ordering lists, labor requirements, and labor costs. Since the material take-offs are generated automatically, errors and miscalculations are reduced. BIM reduces the detailing effort needed to generate various sets of drawings for production, permits, and site assembly. Since conflicts are resolved through the design, production accuracy and quality are increased and the probability of material waste occurring is reduced. The BIM model facilitates understanding of the challenges involved in production by evaluating and optimizing the fabrication sequence in the plant during process mapping sessions. Visualizing the model enables all the stakeholders to review the production process, work sequence, and requirements at each stage. BIM also enables evaluation of alternative scenarios to determine solutions which will benefit the entire process, from design to production. Visualizing the model helps to compare different design layouts and features so users can choose among a variety of design options. Furthermore, the generated 3D model is used to evaluate different plant layout scenarios and facilitate the decision making process to find an optimum configuration of production line stations. The extracted information from the BIM model is used to estimate probabilistic man-hour requirements for individual products at each line 100
114 station. The labor estimation helps to level resources through the entire production line and increase productivity BIM Implementation Objectives and Challenges for Case Study To implement BIM application and eliminate deficiencies in the design process, the research addresses the following objectives: (a) creating design procedures in order to eliminate rework from the design process; (b) developing a building information modeling (BIM) platform to replace the process of 2D drafting; (c) automating the framing method to increase productivity; (d) transitioning from AutoCAD 2D modeling to BIM n-dimensional modeling; (e) conducting material and cost estimation to assist the generating of accurate cost estimation; (f) automating data generation to support the fabrication process based on a direct feed from a BIM model. To achieve these objectives, the following activities are performed: 1. Preparing design procedures: A documented procedure for the design process is missing in the current practice. The first step toward making improvements and eliminating rework from the design process is to follow a standard procedure. This objective is achieved by reviewing the current process, outlining required inputs and outputs for each discipline, eliminating rework and repetition of data production among different phases, and documenting a procedure to be followed by the entire design team. Challenge: The challenge is to prepare a procedure that matches current practice in the company so there is no disturbance in the design process while eliminating defects and proposing improvements. 2. Creating a BIM library using Autodesk Revit software: This objective is achieved by (1) creating a database of typical 2D fabrication details which are common in design and also families of products which are ordered from suppliers; and (2) developing a design/drafting template, which can 101
115 play an important role in improving efficiency, quality, clarity, and consistency of projects. These families and templates are stored in the Revit Server database and are used by architects, drafters, engineers, and builders during design/drafting with no extra effort. Challenge: Currently a comprehensive list of details and families is missing, with this information instead spread out among various projects. Therefore all the details and families must be reviewed to create a systematic coding library with potential future extensions. The challenge in creating the template is to define accurate and inclusive content, including annotations, schedules, and sheets, which requires good understanding of company s projects and design/drafting demands. 3. Automating a framing method: The ultimate goal of this phase is to develop an integrated system for the design process in order to automatically provide the required production information and drawings for the fabrication process. In order to eliminate manual effort, an add-on to Autodesk Revit, MWF (Metal Wood Framer) from StrucSoft Solutions, is selected. This task involves identifying the specific design requirements of the company and developing assistive tools. Challenge: The add-on is still under development and hence contains many errors and is missing requirements. The first step is to study different types of joints and framing techniques used in the manufacturing process and determine the rules required to define all framing details. These rules are sorted in the add-on to generate stud, joist, and all other framing components automatically. The next step is to program the missing requirements, such as hangers, and add them as a package to automate the framing process and create an error-proof process. 4. Transitioning from AutoCAD to a BIM platform: The current 2D design tools and software being used by the company limit opportunities for technological advancement and productivity improvement. However, a 102
116 BIM model is capable of carrying information related to the building through the project life cycle, including physical and functional characteristics of components, and is also able to incorporate the company s specific demands into a 3D model. For this purpose, Autodesk Revit is selected to replace the current software (AutoCAD). A pilot study is conducted prior to transition of the entire design department. Challenge: Training is required for specific areas of the new software which are specifically developed for the company. The challenge in conducting the pilot study is to consider every essential detail and step in the transition process to successfully produce the drawings and information required by the company. 5. Conducting material and cost estimation: A BIM model produces material quantity take-off lists and component schedules automatically, which assist collaborating companies in generating exact material ordering lists and accurate cost estimations during the design phase. The difference between component schedule and material take-off is that the component schedule provides information about the component as a whole, while the material take-off provides the quantities of all the sub-components and materials that are placed in a component within the 3D model. Challenge: Thorough research is required to bridge the gap between current material take-offs and what is needed to automate the process, such as the assignment of cost codes and unit prices. 6. Automating data generation to support fabrication: The existing gap between design/drafting and production in modular manufacturing limits the efficiency of the manufacturing-based approach. This task focuses on automating production in the manufacturing facility based on direct feed from the BIM software. This task requires a thorough time study in the plant and statistical analysis of data related to task duration, labor requirements, space limitations, material and equipment requirements, and 103
117 productivity analysis through the production line. At this juncture the potential and requirements of implementing this option from a BIM model are evaluated and the goal is pursued through the next phases. Challenge: The challenge is to propose an improvement plan which effectively incorporates Lean principles throughout the company production process Generating Data from the BIM Model The BIM application in performing a pilot study at Igloo Prebuilt Homes is described in the following sections. To generate the BIM model, the preliminary drawings of the case study are used to create a 3D model of the building. The preliminary drawings include structural framing information, material specifications, first- and second-floor architectural plans, roof and flooring layout, and elevations. The project specifications are presented in Table 3. Table 3: Case study project specifications Type of building: Occupancy: Living area: Structure type: Residential 2-storey 1,330 sq ft Wood framing Autodesk Revit Structure is selected for this research as the BIM-based platform. Although Revit is capable of creating architectural and structural plans, a generated wood framing structure complete with stud and joist details is still missing. Metal Wood Framer (MWF), an add-on from StrucSoft Solutions, is used in order to frame the floor and walls. After generating the structural framing, component properties are defined to represent materials used for the building. Accordingly, the 3D model of the building is generated as presented in Figure 28, Figure 29, and Figure


118 Figure 28: 3D view of the model Figure 29: 3D view and section view of the model Figure 30: Structural framing view of the model Sequentially, production drawings are generated which satisfy the following design requirements: (1) to reflect standards, by-laws, building codes, and regulation requirements for the building system and components; (2) to present 105
119 the level of detail required in the plant for fabrication; and (3) to include information required to be confirmed by customers. The goal is to keep the overall format for the new set of production drawings the same as the previous set, since the same fabrication method is being used in the plant, while at the same time improving the content in order to add missing details and remove redundant information. Figure 31 presents a sample production drawing generated for the case study. Figure 31: Sample production drawing A floor joint plan created using the MWF add-on is shown in Figure 32 in the production format. Figure 33 shows the wall panel layout, which reflects the information required in order to cut and mark wall plates. Plates are transferred to the wall framing station to add studs and headers of doors and windows using the set of wall framing details shown in Figure
120 Figure 32: Floor joint plan for production Figure 33: Wall panel layout for production 107
121 Figure 34: Wall framing detail for production To create a schedule or material take-off, the desired category of the take-off, with certain fields for which quantities are required, is specified. Revit has the ability to group the components based on different attributes; schedules, meanwhile, are automatically updated once there is a change within the 3D model. Table 4 and Table 5 show the available attributes for doors and windows, respectively, and this schedule is used in cost estimating and material ordering. The room schedule and wall schedule presented in Table 6 and Table 7, respectively, give dimensional properties of components, which are also used in productivity improvement analysis as well as in cost estimating and material ordering. Table 4: Door schedule Door No. Door Type Door Schedule Door Size Manufacturer Model '-8"x6'-8" Out-Swing Karona, Inc. K3750Mission (2) 2'-0"x6'-8" Igloo Building Supplies '-4" x 6'-8" TruStile TS '-4" x 6'-8" TruStile TS '-4" x 6'-8" TruStile TS '-6" x 6'-8" TruStile TS
122 Door No. Door Type Door Schedule Door Size Manufacturer Model '-6" x 6'-8" TruStile TS (2) 2'-0"x6'-8" Igloo Building Supplies (2) 2'-0"x6'-8" Igloo Building Supplies (2) 2'-6"x6'-8" Igloo Building Supplies '-8" x 6'-8" TruStile TS '-6" x 6'-8" TruStile TS2060 Table 5: Window schedule Window Schedule Type mark Rough opening Width Height 38 2' - 0" 4' - 0" Double Hung with Trim 107 3' /4" 112 4' - 11" 121 5' /8" 3' - 3 3/8" 3' - 3 3/8" 4' - 11" Type Manufacturer Model Envoy Vinyl Double Panel Equal Glider picture Envoy Vinyl Double Panel Equal Glider picture Envoy Vinyl Double Panel Equal Glider picture 134 2' - 0" 5' - 0" Fixed with Trim All Weather Window All Weather Window All Weather Window 135 7' - 6" 5' - 0" Triple Panel Glider Picture PLY GEM TITAN 6500 TITAN 6500 TITAN 6500 Head height 7' - 6 1/2" 8' - 4 3/4" 6' /8" 6' /8" 7' - 3 3/4" Table 6: Room schedule Room Schedule Level Number Name Area Floor Finish T.O. Main Floor 101A REAR FOYER 10 SF Tile T.O. Main Floor 101B REAR FOYER 35 SF Tile T.O. Main Floor 102 HALF BATH 30 SF Tile T.O. Main Floor 103A FOYER 11 SF Tile T.O. Main Floor 103B FOYER 25 SF Tile T.O. Main Floor 104 STAIRCASE 45 SF Carpet T.O. Main Floor 105 COVERED VERANDA 132 SF T.O. Main Floor 106 LIVING ROOM 168 SF Hardwood T.O. Main Floor 107 DINING ROOM 106 SF Hardwood 109
123 Room Schedule Level Number Name Area Floor Finish T.O. Main Floor 108 KITCHEN 154 SF Hardwood T.O. Second Floor 201 ENS 34 SF Tile T.O. Second Floor 202 W.I.C. 34 SF Carpet T.O. Second Floor 203 MASTER BEDROOM 170 SF Carpet T.O. Second Floor 204A BEDROOM#2 9 SF Carpet T.O. Second Floor 204B BEDROOM#2 85 SF Carpet T.O. Second Floor 205 STAIRCASE 40 SF Carpet T.O. Second Floor 206A LOBBY 7 SF Vinyl T.O. Second Floor 206B LOBBY 61 SF Vinyl T.O. Second Floor 207 MAIN BATH 46 SF Tile T.O. Second Floor 208A BEDROOM#3 9 SF Carpet T.O. Second Floor 208B BEDROOM#3 85 SF Carpet Table 7: Wall Schedule Wall Schedule Type Floor Wall ID Width Window Length Height Door (ft) (ft) (inch) (ft) (ft) W H W H Exterior Wall - 6" 1st M1E Interior Wall - 3 1/2" 1st M1I Exterior Wall - 6" 1st M2E Exterior Wall - 6" 1st M3E Exterior Wall - 6" 1st M4E Interior Wall - 3 1/2" 1st M4I Exterior Wall - 6" 1st M5E Interior Wall - 3 1/2" 1st M5I Exterior Wall - 6" 1st M6E Interior Wall - 3 1/2" 1st M6I Interior Wall - 3 1/2" 1st M7I Exterior Wall - 6" 1st M8E Interior Wall - 3 1/2" 1st M8I Interior Wall - 3 1/2" 1st M12I Interior Wall - 3 1/2" 1st M13I Interior Wall - 5 1/2" 1st M14I Exterior Wall - 6" 2nd S1E Interior Wall - 3 1/2" 2nd S1I Exterior Wall - 6" 2nd S2E
124 Wall Schedule Type Floor Wall ID Width Window Length Height Door (ft) (ft) (inch) (ft) (ft) W H W H Exterior Wall - 6" 2nd S3E Interior Wall - 3 1/2" 2nd S3I Interior Wall - 3 1/2" 2nd S5I Exterior Wall - 6" 2nd S6E Exterior Wall - 6" 2nd S7E Interior Wall - 3 1/2" 2nd S7I Exterior Wall - 6" 2nd S8E Interior Wall - 3 1/2" 2nd S8I Interior Wall - 3 1/2" 2nd S9I Interior Wall - 3 1/2" 2nd S11I Interior Wall - 3 1/2" 2nd S12I Interior Wall - 5 1/2" 2nd S15I The application of extracted quantity take-off data from the BIM model for the cost estimation and material ordering is beyond the scope of this research. Briefly, the design department generates material quantity take-off and component schedule lists and passes them to the procurement department to issue material recipes for both plant and field. In the plant, workstation leads review the material recipe for both module moves and module starts at the final drawing stage and either approve or ask for revision. The construction manager reviews the field material recipe and approves or asks for revision. After approval, the job start notification is sent to the procurement department, plant manager, and material supervisor. Where inaccuracies are identified, revision requests are sent to the design department to revise the BIM model and generate new sets of lists. The other application of extracted quantity take-off data from the BIM model, which is to support the production line stream mapping, is discussed through the next phases of this research. 111
125 4.3. PHASE II - PRODUCTION LINE ASSESSMENT THROUGH TIME STUDY The first and one of the most important steps to improve the current process is to collect detailed and real-time data related to the production flow. A common practice is to bring a stopwatch while walking the process, and to rely only on information obtained firsthand. Standard times rarely reflect the current reality, particularly with product variation where duration varies for different products. The data collection starts with following a product through the process, starting at the beginning to identify the materials and information. After a brief walkthrough, data is gathered for each process, from end-module shipping to upstream stations, in order to find the direct links between activities. Based on the data collected through observation of the production process, a data analysis tool to calculate probabilistic man-hour requirements is developed Process Flow Study In traditional scheduling methods, a fixed duration is assumed for each activity and, as a result, there would be a fixed duration for total work. In the real world, task durations are not fixed and instead duration can be represented by an independent random variable based on a probability distribution. In order to achieve this objective, a comprehensive time study is conducted by which to estimate the operation time for individual tasks at each station. The construction of 11 residential modules prefabricated at Igloo is monitored in a time study to determine the duration and labor requirements for each activity in each station. Similar to with on-site construction, a customer can choose from among existing floor plans or provide their own customized floor plan which accommodates their needs and lot size. As a result, the factory production line cannot be run at a steady pace, since the activities taking place at each station are contingent upon individual design. The time study is conducted in order to measure the effect of product variety on the production line pace. In the time study, duration and resource usage of sample modules, including bungalow and two-storey, are 112
126 collected as they progress through 16 workstations in the plant. The goal is to select modules that vary in terms of design layout, dimensions, floor number, and material specifications in order to record the required time and resources for a variety of products. The time study assists in identifying the key elements that affect duration based on the predefined tasks taking place at a particular station. This phase proposes a set of quantification rules to optimize resource usage, including time and labor. The project component schedules and quantity take-off lists are extracted from the BIM model and used to estimate the probabilistic duration along with the resource usage for different tasks. The factory production line consists of a series of workstations where specific tasks with defined resources are carried out on parts of a module as it passes through each station. The entire production process is divided into small work packages which are assigned to 16 workstations, and the products move through these stations along the production line as presented in Figure 35. Material and information flow through the production line are shown in Figure 36. The challenge in creating work flow and balancing the production line lies in the assignment of work packages to stations and optimization of the station layouts to minimize material flow and travel distance to reach the material. Data collection to create a smooth and continuous product flow is a challenge due to product variation, which affects process time and is associated with long production cycle times. Therefore, it is required to quantify statistically the productivity rate and probabilistic duration for each workstation in order to forecast the most probable Takt time and cycle time. In the following section, the detailed estimation process by which to calculate probabilistic duration and man-hour requirements of each workstation is presented. 113
127 On-line flow Off-line flow Station 1A Wall Framing Station 1C Roof & Ceiling Painting Doors & Windows Station 1B Station 1 Station 2 Station 3 Station 4 Station 5 Floor & Mechanical, Wall Set Rough-in & Installing Boarding Taping & Plumbing & Cubing Electrical Insulation Drywalls Roofing Station 11 Station 10 Station 9 Station 8 Station 7 Station 6 Flooring Flooring Exterior Installing Tile, Carpet, Sanding & Interior Hardwood Finishing Cabinets Vinyl Painting Finishing2 & Texture Station 12 Station 13 Station 14 Station 15 Station 16 Quality Interior Finishing Final Wrapping Control & Finishing2 MEP Painting Load-Out Full Clean Figure 35: Product flow through the production line Head Office Production Manager Supervisor Divisional Storage Station 1A Wall Framing Station 1C Roof & Ceiling Material Load-in Painting Doors & Windows Station 1B Station 1 Station 2 Station 3 Station 4 Station 5 Floor & Mechanical, Wall Set Rough-in & Installing Boarding Taping & Plumbing & Cubing Electrical Insulation Drywalls Roofing Station 11 Station 10 Station 9 Station 8 Station 7 Station 6 Flooring Flooring Exterior Installing Tile, Carpet, Sanding & Interior Hardwood Finishing Cabinets Vinyl Painting Finishing2 & Texture Station 12 Station 13 Station 14 Station 15 Station 16 Quality Interior Finishing Final Wrapping Control & Finishing2 MEP Painting Load-Out Full Clean Main Warehouse Sub assembly/product flow Material flow Information flow Internal information flow External information flow Figure 36: Material and information flow through the production line 114
128 Module 434 Module 443B Module 433 Module 443B Module 443A Module 443A Module 431B Module 431A Module 432 Module 432 Module 420B Module 420A Module Panel No. Duration (min) manhour s (min) Duration (min) manhour s (min) men manhours (min) Length (ft) No. Studs No. Doors No. Windows No. Plates Total No. Components Converte d Length Module Panel No. Duration (min) men manhour s (min) Length (ft) No. Studs No. Doors No. Plates Total No. Compone Production Process Assessment The production process starts at three parallel framing stations: (1) wall framing; (2) floor framing; and (3) roof or ceiling framing. In the wall framing station, exterior and interior walls are fabricated. To frame a wall, studs are placed between the top and bottom plates, along with pre-built components including door and window framing components, as shown in Figure 37. Wall framing duration entails a considerable amount of variability based on such key elements as number of studs, doors, windows, and joint walls. Table 8 presents a sample of wall properties extracted from the original design drawings for 11 modules, including 34 exterior walls and 65 interior walls. Analysis of the collected data from the time study reveals that the required man-hours to frame each wall, whether interior or exterior, depends on the total number of components, including studs, headers, and plates, that exist in the wall. The graph of total number of wall components and corresponding framing time are presented in Figure 38 for exterior walls (a) and interior walls (b). Table 8: Sample wall properties Framing Exterior Wall Framing Sheating Interior Wall Framing M E M22I M4-5E M10I M9-10E M6I M3-6-8E M21I S4-5E M38I S E M27I S7-8E M3I M2-3-10E M15I M E M31I M1-4E M25I M1E M30I M4E M13I M2-3-5E M2I S1E M33I S4E M5I S2-3-5E M19I M6-7E M26I M1-2E M1I M E M4I S6-7E M9I S1-2E M1I S E M13I M4-5-10E M6I M E M12I M6-7E S2I M2-3-10E S10I M E S11I M1-4E S8I S3I S5I


129 Figure 37: Wall framing station Interior Wall Framing Duration (min) 35 Interior Panels Total number of wall components Figure 38: Correlation of total number of components in walls and required man-hours The required man-hours for other tasks taking place in the exterior wall framing station, including sheathing and installation of vapor barrier, depend on the linear length of the wall. Therefore, a correlation between linear length of wall and 116
130 required man-hours to frame the wall based on data analysis is identified. The length of the wall is converted to an effective length considering the effect of key elements, which are the total number of components and the linear length of the wall. The converted length of the exterior wall is calculated satisfying Equation 2. To determine the effective length, the correction coefficients α and β are determined using a linear optimization model. The goal is to adjust the coefficients to optimize a curve of best fit through the data point while achieving as close to a steady production as possible. The graph of converted wall length and corresponding framing time for exterior walls is presented in Figure 39. Equation 2: Exterior wall converted length CL(E) = α*c + β*l where: CL(E) = Wall Converted Length [ft.]; C = Total number of Components; L = Linear length of wall [ft.]; α = 0.87 = Wall converting coefficient; and β = 0.2= Wall converting coefficient. Duration (min) Exterior Wall Framing and Sheathing Exterior Panels Wall Converted Length Figure 39: Correlation of converted wall length and required man-hours Wall framing duration is effectively changing with a significant variance due to the wall converted length. Therefore, the collected data is tested with a number of 117


131 distributions in order to find a fitted data distribution to express target man-hour requirements. Selected data distributions, including Beta, Gamma, Log-Normal, Triangle, and Normal distribution, are fitted to the wall framing duration data set. The Probability Density Function (PDF) of data distribution is shown in Figure 40 for exterior walls and in Figure 41 for interior walls. Kolmogorov Smirnov, Anderson Darling, and Chi-Squared tests are used to find the most fitted distribution as presented in Table 9 and Table 10 for exterior and interior walls, respectively. According to the presented ranking, Log-Normal distribution is a better fit to estimate both exterior and interior wall framing probabilistic manhour requirements with the presented parameters. Figure 40: Probability Density Function of exterior wall man-hour requirement Figure 41: Probability Density Function of interior wall man-hour requirement 118
132 Table 9: Goodness of fit test for man-hour data distribution for exterior wall Exterior Wall Duration Fitting Results Goodness of Fit - Summary Distribution Parameters Kolmogorov Anderson Distribution Smirnov Darling Chi-Squared Beta a1= a2= Statistic Rank Statistic Rank Statistic Rank a=30.0 b=190.0 Lognormal Gamma a= b= Triangular Lognormal s= m= Gamma Normal s= m= Beta Triangular m= a=24.0 b=190.0 Normal Table 10: Goodness of fit test for man-hours data distribution for interior wall Interior Wall Duration Fitting Results Goodness of Fit - Summary Distribution Parameters Kolmogorov Anderson Distribution Smirnov Darling Chi-Squared Gamma a= b= Statistic Rank Statistic Rank Statistic Rank Lognormal s= m= Lognormal(3P) Lognormal(3P s= m= g= Gamma Normal s= m= Lognormal Normal The labor productivity rate by which to measure the hourly productive output is calculated satisfying Equation 3. A probabilistic distribution is fitted to represent the productivity rate at the wall framing station, as shown in Figure 42 for exterior and in Figure 43 for interior walls. According to the goodness of fit test ranking as presented in Table 11 and Table 12, Log-Normal distribution and Gamma distribution are best fitted to estimate the exterior and interior wall framing probabilistic productivities, respectively. Equation 3: Productivity rate calculation where: Pr = Productivity rate PO = Productive target Output [(ft.), (sq. ft.)...]; and TMhr = Total man-hour requirement [mhr]; 119


133 Figure 42: Probability density function of exterior wall productivity rate Figure 43: Probability density function of interior wall productivity rate Table 11: Goodness of fit test for productivity data distribution for exterior wall Distribution Fitting Results Parameters Exterior Wall Productivity Goodness of Fit - Summary Distribution Kolmogorov Smirnov Anderson Darling Chi-Squared Beta a1= a2= Statistic Rank Statistic Rank Statistic Rank a= b= Lognormal Gamma a= b= Beta Lognormal s= m= Gamma Normal s=8.269 m= Triangular Triangular m= a= b= Normal
134 Table 12: Goodness of fit test for productivity data distribution for interior wall Distribution Fitting Results Parameters Interior Wall Productivity Goodness of Fit - Summary Distribution Kolmogorov Smirnov Anderson Darling Chi-Squared Beta a1= a2= Statistic Rank Statistic Rank Statistic Rank a= b=132.0 Gamma Gamma a= b= Lognormal Lognormal s= m= Normal Normal s= m= Beta On the other hand, as previously mentioned, in order to obtain an accurate labor allocation plan, the actual man-hour requirements must be estimated based on each module s dimensional properties. For this purpose, a trend analysis is performed to extract the underlying pattern of required man-hours as they change based on module specifications. The actual probabilistic distribution to represent the total time to complete exterior and interior wall framing based on walls dimensional properties is calculated satisfying Equation 4 and Equation 5, respectively. Equation 4: Exterior wall man-hour requirement h [α CL(E)] β where: TMhr = Total man-hour requirement [mhr]; CL(E) = Wall Converted Length [ft.]; α = 2.7 = Productivity rate [mhr/ft.]; and β = 47.2 = Statistical constant. Equation 5: Interior wall man-hour requirement h α ( β C ) where: TMhr = Total man-hour requirement [mhr]; C = Total number of wall Components; α = 0.98 = Productivity rate [mhr/c]; and β = 0.21 = Coefficient of variation. 121

135 The probabilistic and actual man-hour requirements for the activities in each workstation are calculated using the same methodology. The final results for actual required man-hours for framing stations are discussed below. In the floor station, as shown in Figure 44, first the joist spacing is marked on the lumber on the length side of the floor in order to nail the hangers. Then the joists are located and nailed to the hangers and lumber. After securing the joist positions with restraint straps, lumber for the width side of the floor is nailed, and all lumber is covered with plastic vapour barrier. Finally, the floor is covered by board sheathing. Analysis of the collected data from the time study reveals that the required man-hours to frame a floor depend on the total number of single- and double-joists in the floor. The graph illustrating the number of joists and length of floor with corresponding framing time is presented in Figure 45: Correlation of converted floor length and required man-hour. The converted length of the floor is calculated satisfying Equation 6. The actual total required number of man-hours to complete framing of the floor based on its dimensional properties is calculated satisfying Equation 7. Figure 44: Floor station 122
136 Duration (mhr) 22 Floor 20 Floor Framing Floor Converted length (ft) Figure 45: Correlation of converted floor length and required man-hour Equation 6: Floor converted length CL(F) = α*dj + (β + δ)*sj where: CL(F) = Floor Converted Length [ft.]; DJ = Total number of Double Joists; SJ = Total number of Single Joists; α = 1.11 = Double joist converting coefficient; β = 0.76= Single joist converting coefficient; and δ = spacing between joist = 16. Equation 7: Floor framing man-hour requirement h α ( β CL(F) ) where: TMhr = Total man-hour requirement [mhr]; CL(F) = Floor Converted Length [ft.]; α = 5.05 = Productivity rate [mhr/ft]; and β = = Coefficient of variation. In the roof station, as shown in Figure 46, first a platform is built based on the roof/ceiling layout in order to frame trusses on top. Then the roof trusses and hip jacks are placed between the designed spacing and secured with ridge boards and plywood. Then, structural fascia and fly rafters are assembled. Finally, the roof is 123


137 covered partially by board sheathing in order to spray insulation in a later station. To frame a ceiling for lower floors, first side plates are placed and joists are located between the designed spacing. After installing insulation, bracelet plates are nailed in a curve position as a temporary guard which will be removed after on-site assembly. Analysis of the collected data from the time study reveals that the required number of man-hours to frame a roof depends on the total number of trusses and hip jacks in the roof. Also, the required number of man-hours to frame a ceiling is a function of the ceiling area. The graph illustrating roof/ceiling converted length and corresponding framing time is presented in Figure 47. The converted length of the roof and the actual total required man-hours to complete framing of the roof based on its dimensional properties are calculated satisfying Equation 8 and Equation 9, respectively. Also, the converted length of the ceiling and actual total required man-hours to complete framing of the ceiling based on its dimensional properties are calculated satisfying Equation 10 and Equation 11, respectively. Figure 46: Roof/Ceiling station 124
138 Duratin (mhr) 50 Roof 40 Roof Farming Duration (mhr) 18 Ceiling 16 Ceiling Framing Converted length (ft) converted length (ft) Figure 47: Correlation of roof/ceiling converted length and required man-hours CL(R) = T*(1+ α) +H where: CL(R) = Roof Converted Length [ft.]; T = Total number of Trusses; SJ = Total number of Hip jacks; and α = Spacing between joist = 2 ft. Equation 8: Roof converted length Equation 9: Roof framing man-hour requirement h α ( β CL(R) ) where: TMhr = Total man-hour requirement [mhr]; CL(F) = Roof Converted Length [ft.]; α = 2.8 = Productivity rate [mhr/ft]; and β = = Coefficient of variation. Equation 10: Ceiling converted length CL(C) = CJ *β where: CL(C) = Ceiling Converted Length [ft.]; CJ = Total number of Ceiling Joists; and β = Spacing between joist =
139 Equation 11: Ceiling framing man-hour requirement h α CL(C) where: TMhr = Total man-hour requirement [mhr]; CL(C) = Ceiling Converted Length [ft.]; and α = 0.7 = Productivity rate [mhr/ft.]. The on-line production starts with the station where walls are assembled on the floor, after which the structure is squared, as shown in Figure 48. After the floor structure moves to this station, the remaining sheathing is completed and the floor is marked for wall locations. The exterior walls that are compiled between the framing table and cubing station are lifted with an overhead crane, placed on top of the floor, and then are nailed. After cubing the building with exterior walls, interior walls are put in place, nailed together, and then nailed to the floor. Workers square the corners and check the height balance to make sure the cube is right-angled. 126


140 Figure 48: Wall set and cubing station The results of analysis of the collected data from the time study reveal that the required number of man-hours to cube and set the walls depends on the total number of exterior and interior walls on the given floor. The graph related to number of walls and corresponding time to cube the structure is presented in Figure 49. The converted factor for cubing and the actual total required man-hours to complete cubing based on the module s dimensional properties are calculated satisfying Equation 12 and Equation 13, respectively. 127
141 Duration Wall set and cubing (mhr) 35 Wall set Wall set and cubing converted factor Figure 49: Correlation of cubing converted factor and required man-hours Equation 12: Cubing converted factor CF = (α*w E ) + (β *W I ) where: CF = Cubing converted factor; W E = Total number of exterior walls; W I = Total number of interior walls; α = 5.1 = Exterior walls converting coefficient; and β = 1.15 = Interior walls converting coefficient. Equation 13: Cubing man-hour requirement h α ( β CF) ) where: TMhr = Total man-hour requirement [mhr]; CF = Cubing converted factor; α = 3.42 = Productivity rate [mhr/cf]; and β = 0.03 = Coefficient of variation. The probabilistic and actual man-hour requirements for the activities at all the workstations through the production line are calculated using the same methodology according to the performed time-study data as presented in Table 13. In order to prevent errors caused by manual calculation during the quantification phase, an interface is developed in Microsoft Excel as presented in 128

142 Figure 50, where extracted data from the BIM model is stored and categorized to quantify probabilistic and actual man-hour requirements, assign a proper distribution, and export the distribution to the a Microsoft Access database which is used as a bridge to transfer data to the simulation model. Figure 50: Developed interface to automate production assessment 129
143 Table 13: Total man-hours for sample modules in time-study Module 420A Module 420B 420 Module 432 Module 433 Module 434 Module 442A Module 442B 442 Module 443A Module 443B 443 Module 431A Module 431B 431 Station Tasks Man 706 sqft 698 sqft 1584 sqft 1320 sqft 1584 sqft 665 sqft 665 sqft 665 sqft 665 sqft 660 sqft 609 sqft D MHR Hour MHR MHR Hour MHR Hour MHR Hour MHR Hour MHR Hour MHR MHR Hour MHR Hour MHR MHR Hour MHR Hour MHR MHR Floor Mechanical & plumbing Roof Ceiling Wall framing Wall set-cubing Rough-in Electrical installation Insulation Boarding drywalls Taping Roof insulation & shingle Exterior finishing Texture & Prime Interior finishing Paint Cabinet Hardwood Tile & Carpet & Vinyl Interior finishing Mechanical finishing Paint Wrapping & cleaning QC & Load Out Total (MHR)
144 4.4. PHASE III - PRODUCTION PROCESS ANALYSIS TO PROPOSE IMPROVEMENTS In this phase, the current production process of the case study is analyzed and a current-state VSM of the production process is developed to find existing defects and opportunities for future improvement. Next, based on existing Lean strategies and proposed Lean-Mod strategies, a number of recommendations are proposed to improve the efficiency of the production process Lean Transformation Currently the production process at Igloo has transformed from traditional stickbuilt construction operation within an enclosed indoor environment to Lean practice. Igloo is now on the second phase of its Lean journey, with the foundation of Lean implementation having been built; however, the process still is hampered by several deficiencies. Lean is a continuous improvement practice targeting opportunities for improvement and production efficiency. The Lean transformation practice of the case study is discussed below. 1. Lean helps organizations to contemplate the move to a production system with greater capacity. The first step is to analyze the capacity of the existing system by mapping the current-state which in the case study was stick-building under a roof through a stall-built system. This system consisted of a series of numbered bays with each house built in one bay. The capacity was limited by the number of bays, and it was required to look for the availability of a free bay to build a new house. The construction process of houses was similar to the stick-built construction process; and the concept of a production line was not present in this process and resources were moving to one house to complete an activity. The production capacity prior to Lean implementation was equal to the number of bays (18), and the cycle time varied between one month to eight months depending on the house size and complexity, since the 131
145 process was not standardized and the sequence of activities was dependent on sub-contractor arrangements. The capacity of the current-state map did not match the organization s capacity requirements, so there was a need to increase the capacity. 2. After calculating the existing capacity and estimated required capacity, preliminary planning of various types of production lines, possible layouts of the buildings were proposed in order to come up with an optimum size and layout, and different configurations in the plant were considered to determine the optimum number of physical production line workstations. For this purpose the most probable building size was analyzed to design the physical size of line spots and, consequently, to design different plant configurations. In order to find the optimum number of production line stations, it was necessary to understand the production process; job sequence; activity cycle times; required resources, including labor, equipment, and material; and process time, including activity durations, waiting times, and setting times. 3. VSM as a Lean tool gives a snapshot of the process, bringing stakeholders together in one room to walk through the process using sticky notes on the wall. This tool helps new personnel in the organization to understand how things are done. Also, this is an effective communication tool for the people who are already involved in the organization since many of them are not aware of other people s responsibilities and how they are connected to one another. It thus provides stakeholders with a snapshot of the reality of what is happening in the process compared to the theoretical written procedure. This practice helps to define actual duration and resource requirements for activities as defined by personnel actually involved in the activities who thus realistic measures. The next step after defining resource requirements is to balance resource usage through the production line by breaking down activities into VSM and moving the scope of the work to balance resources throughout production line. 132
146 4. The initial goal of VSM is to reduce non-value-added activities and waste. Obstacles, defects, and errors were identified by value mapping the process, and people were assigned to solve the identified problems. Then, a process map for the future-state was developed based on the assumption that the identified problems from the current state have been solved. Such information helps to have a target by which to solve problems and create a development plan. VSM is a complicated technique, but the mapping process and communication among all stakeholders it facilitates make it the most useful tool in Lean application, since it provides a clear view of the process and problems, as well as giving a practical understanding of Lean which validates the theoretical advantages of Lean. 5. The next step was to implement the future-state process map and execute outputs from the mapping sessions. The challenge was to find champions to implement the future-state map and organize resources at particular workstations in order to achieve 5S as part of Lean, and create standard work tasks for each station. In order to level the production line with respect to different products with varied Takt times, inventory was used to hold some of the products. Although the inventory helps to keep the current lead time and balance the labor requirements for different products, inventory stock must be reduced and ultimately eliminated by leveling the production rate. The current-state value stream map of the case study is generated sequentially in order to depict the production line layout and schedule as presented in Figure 51. The value stream is identified and mapped for each group of activities and flow of material and information. Critical path, bottlenecks, and flow obstructions are defined. The current-state map is analyzed and challenged from the current Lean point of view as well as from the proposed Lean-Mod standpoint in order to determine problem areas and opportunities for improvement. 133
147 Figure 51: Current-state value stream map of the case study Recommendations for Efficiency Improvement Following detailed and accurate analysis of the production process of the case study, several recommendations are proposed in order to improve production efficiency. The first set of proposed recommendations is general improvements based on current Lean strategies and proposed Lean-Mod strategies that are applicable to any MCM organization. General recommendations are discussed in the following section. 134


148 S Implementation 5S is one of the basic and essential techniques in Lean practice, which is basically organization and housekeeping program. This technique must be implemented across all stations and working areas. The studied area for the case study is the storage area, which constantly affects production flow due to the difficulty in locating tools, materials, and components, as presented in Figure 52. The 5S method includes five primary steps: sort, set in order, shine, standardize, and sustain. Additional steps such as safety and security are other helpful aspects to be considered. The 5S event is initiated by area workers mainly for the purpose of eliminating disorganization and keeping the work area neat and clean, as presented in Figure 53. The 5S target is achieved through the following changes: removing unnecessary tools and materials from the area, building racks and storage cabinets with associated controlling visual labels to organize materials, creating checklists and colored tags to facilitate material replenishment, and sweeping and cleaning the area as an everyday practice. Figure 52: Storage area before 5S event 135


149 Figure 53: Storage area after 5S event The 5S implementation effectively improves downtime to locate tools and materials. The new clean and spacious storage area reduces instances of defects and damaged tools. Material inspection is also performed more easily with fewer mistakes with respect to quality check, inventory level, and consumption level Resource Allocation Plan To level the production of modular construction, it is required to balance labor requirements and define Takt time, along with a labor allocation plan, based on each product s specifications. Labor requirements vary widely from module to module due to product fluctuation. In the existing practice, exact numbers of workers are assigned to each workstation who are responsible for specific tasks. Therefore, based on module specifications, labor personnel remain idle or overloaded from time to time. For example the main floor and upper floor of a 2- storey module are built back-to-back in the production line. The main floor module comes with kitchen and bathroom cabinets, whereas the upper floor module only requires bathroom cabinet installation. Therefore the cabinet crew stretches their workers in order avoid idle time, which constitutes a case of poor labor utilization. In a different manner, larger modules require more time for most activities, such as exterior finishing. Since line pulls happen at Takt time regardless of whether siding and soffit are installed, workers follow the module downstream, carrying required tools and material to complete exterior finishing. 136
150 To reach the ideal production pace through a continuous flow, the production line must run with equal production rates for all workstations in order to complete modules within the Takt time regardless of variation in size, layout, or specifications. In the real world it is not practical and rational to force activities to take place with equal production rates since this increases labor requirements as well as creating high variation in labor utilization. Instead, imposing an equal Takt time for all the on-line critical stations is a more effective and practical way of creating a continuous flow throughout the production line. In this practice, a group of multi-skilled labor personnel is required who are able to work in any station along the production line as needed. To develop a proper resource allocation plan in order to complete activities at all stations and pull the production line at Takt time, a simulation model of the production process is able to challenge the impact of labor requirements on line balancing based on module properties. In this regard, the development of a simulation model and analysis of potential scenarios are discussed in a later section Justify Material and Tools Staging In order to justify material handling, a Kanban inventory control system must be used to load-out and replenish materials at each station. The material handler picks up Kanban cards daily from each workstation and performs the necessary replenishments and material staging. The material staging location must be located close to the point of use. Also, the necessary tools must be available at each station and located in a place as close to the point of use as practical so that workers do not need to leave their workstation to obtain a required tool. For this purpose, portable work-carts are provided for each station containing necessary tools for specific tasks taking place in the stations. Figure 54 shows portable work-carts and the material staging point at the case study plant. 137


151 Figure 54: Portable work-carts and material staging point The other set of recommendations is proposed particularly to improve and reduce existing defects and deficiencies in the existing production practice of the case study. Specific recommendations are discussed in following section Moving Work Upstream One of the major challenges identified in investigating the production process of the case study is the assignment of activities to various stations. The walls are set on the floor and the roof is assembled on walls at the first station in the production line. Cubing the module at the beginning of the process creates issues such as the following: (1) a cubed module occupies a large space, therefore reducing the production capacity and limiting the number of modules that can fit in the plant; (2) the existing columns and facilities (e.g., washrooms, storage spaces) in the plant serve to limit the movement of modules through the production line. This issue causes problems for modules of a larger size than regular products. To solve this problem, the layout of workstations in the plant must be reconfigured and the process simulated before modules actually enter the production line. Depending on the module size, the issue may remain unsolved due to a likely collusion between the module and columns or facilities within the plant; (3) modules are transported from station to station using air jacks by five workers, with this process taking an average of 15 minutes. The size and variation of modules limits 138
152 utilization of advanced transportation techniques; (4) many activities are occurring on-line through the production line, which limits the assignment of activities to the workstations based on the number of labor personnel available to simultaneously on a given module. To address this problem, other activities must migrate upstream with the result that cubing occurs at the very end of production line, as presented in the proposed future process map in Figure 55. A preliminary investigation of the prospect of spreading activities upstream and simulating the process shows a 15% reduction in module fabrication time compared to the existing practice of manufacturing. Further investigation is required to evaluate the future work sequence, manufacturing techniques, and advanced equipment needed to achieve the efficiency improvement objective. The proposed layout provides the opportunity to optimize sub-assembly scheduling, including the optimum sequence of framing panels to reduce time, and the optimum cutting pattern for plywood and drywall to reduce waste. Figure 56 shows the existing process, where the module is assembled at an early station in the production line. The module can be fabricated in hours within a 95% level of confidence. Figure 57 shows the results of simulating the proposed change to move the cubing downstream and set the walls later in the production line. In this state, the module can be fabricated in hours within a 95% level of confidence. 139

153 Figure 55: Proposed future process map to move wall assembly activities upstream Figure 56: Current process duration Cubing of a module at an early station 140

154 Figure 57: Propose process duration Cubing of a module at a later station Balance Activities at Workstations The production process starts at three parallel stations: floor framing, roof/ceiling framing, and wall framing stations. Once the floor and walls are ready, the module s walls are assembled and the roof is lifted on to walls. At the time of the study, the existing practice was to build the floor on the mezzanine and then lift it to the first floor to set the walls. The floor sheathing would be left incomplete at the floor framing station both to facilitate listing and to accommodate the limited crane capacity. The floor would be sheathed partially, lifted down, moved to the cubing station, and then the sheathing would be completed at the cubing station, along with marking and measuring of wall locations, as presented in Figure 58. The activity duration in the cubing station would be longer than at the previous stations, which made the cubing station a bottleneck that would disrupt the schedule, as presented in Figure 59. The proposed recommendation involves moving the floor framing station to the first floor, finishing the sheathing, and also transferring the layout marking activity from a downstream station to floor framing station, as presented in Figure 60. Although the process time for the floor 141


155 station is increased by the proposed change, the floor framing capacity is increased and consequently the Takt time is reduced. Also, the Takt time at the cubing station is reduced and matched to the previous stations to create a continuous flow, as presented in Figure 61. Figure 58: Floor station prior to implementation of proposed improvement Figure 59: Floor station process map prior to implementation of proposed improvement 142


156 Figure 60: Floor station after implementation of proposed improvement Figure 61: Floor station process map after implementation of proposed improvement Jig and adjustable roof platform In the existing practice the roofs are built on a platform which must be arranged for different sizes of roofs, as presented in Figure 62. To configure the platform 143


157 size, first the roof plan is measured and marked on the platform. Since the platform is heavy, pieces are lifted with an overhead crane, which involves hooking up, moving, and unhooking the pieces. The locations of trusses are then measured and marked on the platform. In order to improve the roof framing process, an adjustable roof platform with roof jig is required which can be adapted quickly to mimic the exterior walls of any module, is stable and rigid when set in place, and can be set at a comfortable height for framing; with this improvement, several corner sections could be fabricated, and set for different spacing of trusses. Figure 62: Roof station existing platform to frame roof/ceiling Advanced Tool Utilization The existing process involves various numbers of non-value-added activities and waste which are related to improper and low-efficiency tools and equipment. The application of high-tech tools depends on the company s budget and vision and may not be a solution for every company. However, current tools and equipment 144
158 can be modified in-house to improve the process. The following suggestions improve work efficiency, increase productivity, advance ergonomics, and remove waste from activities. 1. Modify wall framing table to reflect advanced features, such as a holding fixture which ensures walls are square with no extra manual effort by workers to square it; the ability to tilt up walls after framing and stack them on the proper rack, flexible length that can be adjusted for any wall length, the ability to permit further production increases by adding more manpower to work on the table, the capability to allow installation of insulation and drywall board under the studs for adhesive connection to the wall, and the capacity to lift the wall from the table without the use of a crane. In the existing system walls are built on a table with no jig such that ensuring a square wall is the responsibility of the worker and is contingent upon their skill. After walls are framed, they are removed from the table by an overhead crane and stacked on the floor area between the wall framing and cubing stations. 2. Add a fixture, such as a radial arm, to the stud cutter saw with metric abilities to cut studs and plates to size. In the existing process, every single stud is measured and marked, and then cut. The pre-measured fixture reduces the cutting component duration. 3. Create racks for roof/ceiling station on the mezzanine to place studs and plates in order to improve organization of the space while resolving ergonomic issues. In the existing process, studs are located on the floor and occupy a large space; also, workers have to repeatedly move to pick up studs or trusses and carry them to the framing area, as presented in Figure 63. The area is disorganized, the process contains waste, and the worker performance raises ergonomic issues. These problems needs to be addressed by creating a new staging area for roof and ceiling components 145


159 close to the point of use, and by facilitating components transportation by means of rolling stands. Figure 63: Roof station deficiencies 4.5. PHASE IV - DEVELOPING SIMULATION MODEL In this phase, simulation models of the current and future states of the production process are generated in Simphony.NET 4.0. The current-state production process is generated based on the developed current-state VSM. Numbers of labor personnel are constant variables and activity durations are defined based on the determined data distributions. The future-state production process is generated based on the proposed recommendations. The simulation model depicts the production line layout; individual and overall production schedules through the production line for 10 modules that vary in size and specifications; resource requirements based on each module s dimensional properties; and the optimum Takt time to reach an optimum resource allocation plan. The inputs for this model are frontloaded from information in the BIM-generated 3D model, which is extracted and sorted into a spreadsheet, and man-hours requirements are calculated based on quantification rules. Man-hour requirements are then imported into a database which is linked to the simulation model. The simulation model delivers results for different production scenarios and provides the opportunity to evaluate the proposed future state in order to optimize the production process. 146
160 Current-State Simulation The current-state simulation model of the factory production line is shown in Figure 64. All activities and their sequences in each station are generated and proper data distributions for the processing time of each activity are defined. In this model, the current-state of the production process is simulated based on the developed current-state VSMs for 10 sample modules. The numbers of assigned labor personnel are fixed at each station and there is no cross-training through the production line. Modules vary slightly in size and specifications, entailing that processing times for modules are not uniform. The variation range is limited in order to identify defects in situations in which the source of deficiency is not obvious. The results of the simulation model comprise processing time for sample modules to be fabricated at each station, total processing time, idle time, and total man-hour requirements for the current-state production process. A sample output chart of simulation for processing time of modules is presented in Figure 65. Variations in processing time at each station for different modules are plotted in output charts as presented in Figure 66 and Figure 67 for floor station and roof station, respectively. Total processing times for all the sample modules are presented in Figure 68. Processing hours to complete each module at different stations and overall are presented in Table 14, and duration variation is given in Figure


161 Figure 64: Current-state simulation model Figure 65: Output chart from the simulation module for processing time Figure 66: Processing hours for different modules at the floor framing station 148


162 Figure 67: Processing hours for different modules at the roof framing station Figure 68: Total processing hours for sample modules in the current-state 149
163 Table 14: Current-state simulation results Workstation Processing hours Module1 Module2 Module3 Module4 Module5 Module6 Module7 Module8 Module9 Module10 Station #1A - Wall framing Lift walls to floor Station #1B - Floor Lift floor to next station Station #1C - Roof Lift floor to next station Station #1 - Wall set Complete floor sheathing Move module to next station Station #2 - Rough-in Roof assembly Rough-in Electrical installation Move module to next station Station #3 - Insulation Move module to next station Station #4 - Boarding drywalls Move module to next station Station # Taping, Mudding Roof insulation, Shingle Move module to next station Station # Exterior finishing Texture & Prime Move module to next station Station #7 - Interior finishing Move module to next station Station #8 - Paint Move module to next station Station #9 - Cabinet Move module to next station Station #10 - Hardwood Move module to next station Station #11 - Tile & Carpet & Vinyl Move module to next station Station #12 - Interior finishing Move module to next station Station #13 - Mechanical finishing Move module to next station Station #14 - Paint Move module to next station Station #15 - Wrapping & cleaning Move module to next station Station #16 - QC & Load Out Total processing hours The results of the simulation model demonstrate the variation in module completion duration at each station. When a larger module enters the production line, it is returned to the bottleneck of the production line, keeping upstream stations idle. Also, modules in the downstream stations are unable to move since the work on the previous module is not complete. As a result, the production capacity is decreased and the scheduled target based on customer demand cannot be reached. 150
164 Hours Processing time variation Total processing hours Module number Figure 69: Processing time variation for sample modules in current-state Future-State Simulation The future-state of the production process is generated based on the proposed recommendations as follows: The number of labor personnel at each workstation is not fixed. Takt time is defined in such a way as to move the line at a steady space and create continuous flow. Different scenarios are therefore run in order to find the near optimum result for the Takt time at which an optimum resource allocation plan is reached with the least fluctuation in labor requirements for different modules. The layouts of the off-line framing stations (floor framing, roof/ceiling framing, and wall framing) and cubing station are changed. The floor framing station is moved to the ground floor of the plant, and all sheathing is to take place at the same station. Also, the layout marking activity from downstream station is transferred to the floor framing station. The proposed layout eliminates three waste activities from the process: lifting the floor with the overhead crane; undoing the air-jacks before lifting and replacing them afterwards; and carrying necessary tools and material to the next station to complete sheathing. 151
165 The required time to manually square the walls is eliminated by means of jigs at the wall framing table. The required time to cut wall components is reduced to half by means of a radial arm saw with measuring ability to cut several pieces to size at once. The required time to prepare a platform for roof/ceiling is reduced by 60% by means of an adjustable work platform to set up the roof for various layouts. The idle time associated with material delivery delay is eliminated through the use of just-in-time delivery for stream inventory along with Kanban cards for material replenishment. The future-state simulation model, as shown in Figure 70, determines resource allocation plan scenarios of the future-state production process. This model runs the simulation for a series of Takt times and calculates man-hour requirements for a number of sample modules at all the stations through the production line. Then, the best match for number of labor personnel at each station is defined, and, based on this the man-hour fluctuation caused by module variation at individual stations is measured as displayed in Figure 71. The model then calculates for each station and for the entire production line (1) total labor idle time due to earlier completion of a module; and (2) additional man-hour requirements due to late completion of a module. The total required time that is covered by idle labors defines the required number of labor personnel in the multi-skill worker crew that is cross-trained through the production line to increase production rate at stations which are behind the scheduled Takt time. The model is run to find the scenario with the minimum man-hours not covered by the multi-skill worker crew. Table 15 presents the required number of labor personnel and labor fluctuations at the floor station for sample modules for different scenarios, with Takt times ranging from 6 to 11 hours. In Table 16, total man-hour requirements and associated number of labor personnel at each station are presented for scenario number (3), which has a Takt time of 8 hours. 152

166 Figure 70: Future-state VSM simulation model 153

167 Takt time = 7 hours Unleveled hours = 28 Takt time = 6 hours Unleveled hours = 17 Figure 71: Sample output chart of future-state simulation model Table 15: Labor requirements and labor fluctuation at floor station for different scenarios Run Labor personnel requirements Labor fluctuation
168 Module Area Station0A Station0B Station0C Station1 Station2-1 Station2-2 Station3 Station4 Station5-1 Station5-2 Station6-1 Station6-2 Station7 Station8 Station9 Station10 Station11 Station12 Station13 Station14 Station15 Station16 wall Floor Roof Cubing Rough-in Electrical Insulation Boarding Taping Roofing Exterior Texture Interior1 Paint1 Cabinet Hardwood Tile Carpet Interior2 Mech. Paint2 Wrapping QC Load Takt time= 11 hours Unleveled hours= 5 Takt time = 10 hours Unleveled hours = 13 Takt time = 9 hours Unleveled hours = 8 Takt time = 8 hours Unleveled hours = 15 Run Labor personnel requirements Labor fluctuation Table 16: Labor requirements for scenario 3 with 8-hour Takt time Module Module Module Module Module Module Module Module Module Module Total man-hours Labor personnel
169 Table 17 presents the calculation parameters of the simulation model. A number of scenarios offered by the simulation model are presented in Table 18. Based on a selected Takt time, which varies between 6 and 11 hours, the number of fixed labor personnel and multi-skill labors change. The results provide various options from which to select according to company strategies. For example, in scenario 1 with 6-hour Takt time, 71 labor personnel are required in total, including 67 stationary labor personnel and 4 multi-skill labor personnel, whereas in scenario 6 with 11-hour Takt time, 37 labor personnel are required in total, all of which are stationary. Although the total number of labor personnel required in scenario 6 is half of that required in scenario 1, due to the long Takt time the production rate is 21 modules per month, whereas the production rate in scenario 1 is 40 modules per month. A moderate scenario (scenario 3) is presented in which the total number of labor personnel is balanced with production rate. A decision on resource allocation can therefore be made by the management team based on the strategic vision of the company. Table 17: Calculation parameters of the simulation model Total fixed labor number Required hours at all stations Cross-training hour at station Uncovered hours Multi-skill labor number Required average labor number for various modules Required hours which are not covered by fixed labor Required hours which are covered by multi-skill workers Hours which are not covered by multi-skill workers Uncovered hours divided / (Takt time * number of stations * number of modules on production line) 156
170 Scenario Takt time (hour) Total fixed labor personnel number Cross-training hours at stations Requiring hours at all stations Uncovered hours Multi-skill labor personell number Total labor personnel number Production rate (module/month) Table 18: Scenario analysis for future-state production process PHASE V - DEVELOPING POST-SIMULATION VISUALIZATION MODEL In this phase, a post-simulation visualization model of the evaluated production scenarios is developed which facilitates production flow analysis and decision making for the management team. This model visualizes the results of the simulation model and provides the opportunity to compare near-optimum production scenarios, not only through charts and statistical data, but also by means of visualizing the ideal process prior to actual implementation of the proposed changes D Animation and Process Evaluation The proposed method integrates 3D visualization of a process with the statistical results of the simulation. The generated post-simulation visualization (PSV) model visualizes the simulation of the production process in detail, presenting process information such as modules fabrication schedule (both individually and in total) throughout the production line for evaluation purposes, whereas the proposed technique has the capacity to be linked to all statistical production information. For this purpose, a general visual representation of the production process is developed in Autodesk 3D Studio Max (3ds Max), showing certain 157

 overhead crane examination as presented in Figure 72(a) for proper lifting at wall")
171 activities at all stations in the production line. After evaluating and comparing simulation results between various production scenarios, a scenario with a near optimum result is selected to be visualized. The processing times of all the stations are imported from the simulation model output and linked to the 3D animation semi-automatically. The visualization of the model also provides opportunity for further analysis, such as the following tasks: (1) overhead crane examination as presented in Figure 72(a) for proper lifting at wall station to find optimum distance between framing table and cubing station, and at roof station to find lifting points for roof and ceiling; (2) 5S implementation as presented in Figure 72(b) to develop proper layout and space in order to achieve the 5S goals; (3) review of ergonomic and safety issues arising throughout the process, as presented in Figure 72(c), and proposing of a solution; ergonomics and safety issues are out of the scope of this thesis, so the results are not discussed; (4) visualization of any required changes prior to implementation, as illustrated in Figure 72(d); this task includes both presenting the module features, specifications, and appearance to customers, and also presenting the proposed factory layout configuration to the management team, such as the improved layout for the warehouse area; and (5) evaluation of truck capacity considering module size in order to ensure proper transportation of modules, and selection of suitable trucks based on module width and weight, as displayed in Figure 72(e). (a) Examination of overhead crane for proper lifting 158
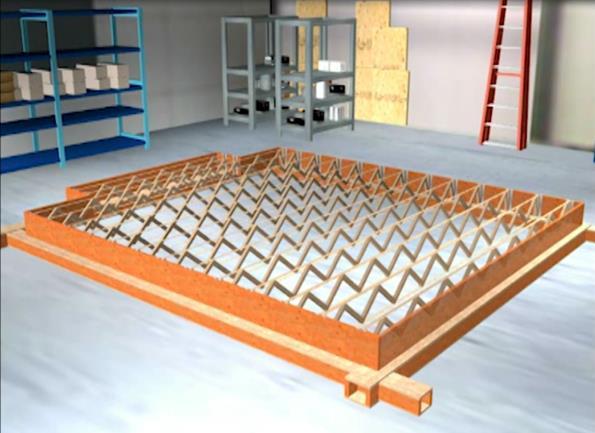


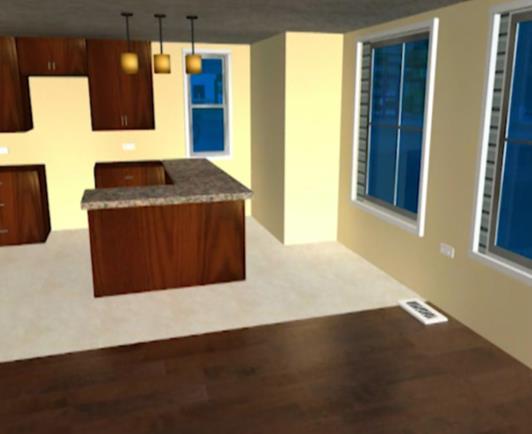
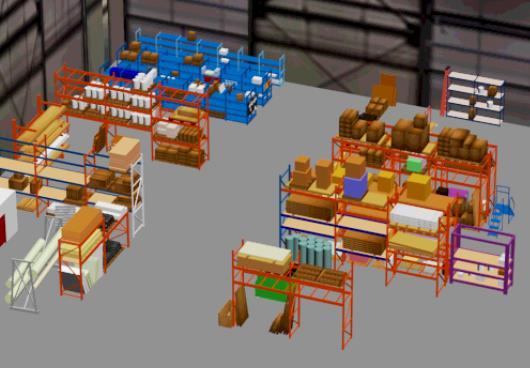
172 (b) 5S implementation and evaluation of proper layout (c) Ergonomic and safety issues (d) Module and factory presentation 159


173 (e) Truck capacity analysis to load-out modules Figure 72: Further analysis by means of PSV model Dynamic Visualization of the Simulation Results A complex module production process which includes various constraints such as time, predecessor activity networks, space, continuous flow, labor assignments, and product variation, requires a flexible evaluation model to deal with changes in process and present the future-state in a simple way. For this purpose, another approach is pursued to create a more dynamic visualized model of the simulation results in Autodesk Navisworks Manage. The 3D model of the factory is developed in Revit as presented in Figure 73, and then, along with the 3D models of modules generated in the design phase, is imported into Navisworks. Required information pertaining to modules currently in the production line and coming modules, including the processing times at all the stations, resource allocation plan, and work sequence, are imported from the simulation output for different scenarios. In order to analyze different plant layout configuration scenarios with automatic clash detection, more information is added to the model, including overhead crane capacity, factory space limitations, and labor safe work area. In this model, a minute-by-minute schedule of the production process is generated and various layout configurations are analyzed for optimum scenarios. The developed PSV model capitalizes both on the advantages of the simulation as well as on the simplicity of the visualized minute-by-minute schedule. Figure 74 shows a snapshot from the model s output for the case study that presents the process for 160

174 scenario 3 with 8-hour Takt time. The model reveals a number of clashes due to space limitation for module transportation. In order to reach the production capacity, the number of produced modules is not changed, but the layout of the workstation arrangement changes until no clash is detected. Furthermore, an investigation is carried out considering various production process scenarios in order to compare the resource allocation plans and identify the best potential scenario for the given number of labor personnel at each station. The result of comparing the initial simulation model before generating PSV and the final version after running PSV indicates significant improvements in the production schedule and resource allocation. Figure 73: Plant model for layout configuration PSV Figure 74: PSV model of scenario 3 with 8-hour Takt time 161
RESOURCE OPTIMIZATION FOR MODULAR CONSTRUCTION THROUGH VALUE STREAM MAP IMPROVEMENT
 RESOURCE OPTIMIZATION FOR MODULAR CONSTRUCTION THROUGH VALUE STREAM MAP IMPROVEMENT ABSTRACT Mana Moghadam 1 and Mohamed Al-Hussein 2 Implementation of Lean manufacturing begins with the development of
Finished goods available to meet Takt time when variations in customer demand exist.
 Delaware Valley Industrial Resource Center 2905 Southampton Road Philadelphia, PA 19154 Tel: (215) 464-8550 Fax: (215) 464-8570 www.dvirc.org Term Batch-and-Queue Processing Buffer Stock Catchball Cell
Integrated BIM/Lean Base Production Line Schedule Model for Modular Construction Manufacturing
 ASCE 2012 1271 Integrated BIM/Lean Base Production Line Schedule Model for Modular Construction Manufacturing Mansooreh MOGHADAM 1, Aladdin ALWISY 2, Mohamed AL-HUSSEIN 3 1 PhD Candidate, Construction
Ch 26 Just-In-Time and Lean Production. What is Lean Production? Structure of Lean Production System. Activities in Manufacturing.
 Ch 26 Just-In-Time and Lean Production Sections: 1. Lean Production and Waste in Manufacturing 2. Just-in-time Production Systems 3. Autonomation 4. Worker Involvement What is Lean Production? Lean production
PLUS VALUE STREAM MAPPING
 LEAN PRINCIPLES PLUS VALUE STREAM MAPPING Lean Principles for the Job Shop (v. Aug 06) 1 Lean Principles for the Job Shop (v. Aug 06) 2 Lean Principles for the Job Shop (v. Aug 06) 3 Lean Principles for
OM (Fall 2016) Outline
 Outline") Lean Operations Outline Global Company Profile: Toyota Motor Corporation Lean Operations Lean and Just-in-Time Lean and the Toyota Production System Lean Organizations Lean in Services 2 Toyota Motor Corporation
Lean Operations Outline Global Company Profile: Toyota Motor Corporation Lean Operations Lean and Just-in-Time Lean and the Toyota Production System Lean Organizations Lean in Services 2 Toyota Motor Corporation
Lecture 9 MBF2213 Operations Management Prepared by Dr Khairul Anuar. L9: Lean synchronization
 Lecture 9 MBF2213 Operations Management Prepared by Dr Khairul Anuar L9: Lean synchronization 1 Lean operations Operations strategy Design Improvement Lean operations Planning and control The market requires
Lean Operations. PowerPoint slides by Jeff Heyl. Copyright 2017 Pearson Education, Inc.
 Lean Operations 16 PowerPoint presentation to accompany Heizer, Render, Munson Operations Management, Twelfth Edition Principles of Operations Management, Tenth Edition PowerPoint slides by Jeff Heyl 16-1
Lean Gold Certification Blueprint
 The Lean Certification Blueprint provides additional useful information beyond the Body of Knowledge. The Body of Knowledge specifies the competencies, topics, and subtopics required by different types
IT 470a Six Sigma Chapter X
 Chapter X Lean Enterprise IT 470a Six Sigma Chapter X Definitions Raw Materials component items purchased and received from suppliers WIP work in process, items that are in production on the factory floor
Historical Phases of Production
 Lean 101 Overview Lean Background Taiichi Ohno and Shigeo Shingo developed Lean Manufacturing at Toyota over a period of 20-30 years. Their intention was not to develop some sort of unified field theory
CHAPTER 1 INTRODUCTION
 1 CHAPTER 1 INTRODUCTION 1.1 MANUFACTURING SYSTEM Manufacturing, a branch of industry, is the application of tools and processes for the transformation of raw materials into finished products. The manufacturing
APPLICATION OF LEAN METHODS FOR IMPROVEMENT OF MANUFACTURING PROCESSES
 APPLICATION OF LEAN METHODS FOR IMPROVEMENT OF MANUFACTURING PROCESSES György KOVÁCS 1,a ABSTRACT: Changing market environment, increasing global competition and fluctuating customer demands require efficient
A PM on Lean Production Randel Ltd.
 A PM on Lean Production Randel Ltd. RANDEL LTD. INDUSTRY STREET 8 38267 WOMANCHESTER ENGLAND Written by: Tobias Reith, BSc Course: Lean Production (2016) Linköping University, Sweden A PM ON LEAN PRODUCTION
Five Tips to Achieve a Lean Manufacturing Business
 Five Tips to Achieve a Lean Manufacturing Business Executive Overview Introduction The more successful manufacturers today are those with the ability to meet customer delivery schedules while maintaining
Glossary of Lean Terminology
 Glossary of Terminology Term Definition Use 5S: Used for Improving organization of the workplace: Sort > Set in order > Shine > Stardize > Sustain Create an organized work area A3 Thinking: Affinity Diagram:
INTRODUCTION. LEAN SHIPBUILDING is the building process of Ships and Offshore Units, ruled and performed by LEAN PRINCIPLES.
 INTRODUCTION LEAN SHIPBUILDING is the building process of Ships and Offshore Units, ruled and performed by LEAN PRINCIPLES. Like in many other industries, current shipbuilding in most shipyards is full
Outline. Pull Manufacturing. Push Vs. Pull Scheduling. Inventory Hides Problems. Lowering Inventory Reveals Problems
 Outline Pull Manufacturing Why Pull Manufacturing? The Problem of Inventory Just In Time Kanban One Piece Flow Demand / Pull Standard Work & Takt Time Production Smoothing 1 2 Why Pull Manufacturing? Push
Profit = Price - Cost. TAKT Time Map Capacity Tables. Total Productive Maintenance. Visual Control. Poka-yoke (mistake proofing) Kanban.
 Kanban.") GPS Mod 1 Introduction MUDA MUDA Cost Reduction By Eliminating Waste Just-in-Time Profit = Price - Cost GPS Depth Study NVA/VA- Functions/Mgrs Quality Cost Delivery Safety Measures Morale TAKT Time Map
GPS Mod 1 Introduction MUDA MUDA Cost Reduction By Eliminating Waste Just-in-Time Profit = Price - Cost GPS Depth Study NVA/VA- Functions/Mgrs Quality Cost Delivery Safety Measures Morale TAKT Time Map
Real Lean vs Pretend Lean
 Real Lean vs Pretend Lean What s the Difference? Roger Olson January 10, 2006 SYSTEMS Quality Consulting 1 Agenda History of Real Lean What is Real Lean Where does pretend lean come from? (Case Studies)
Learning Objectives. 1. Explain how lean systems improve internal and supply chain operations
 CHAPTER EIGHT Lean Systems McGraw-Hill/Irwin Copyright 2011 by the McGraw-Hill Companies, Inc. All rights reserved. Learning Objectives 1. Explain how lean systems improve internal and supply chain operations
IARJSET. International Advanced Research Journal in Science, Engineering and Technology AGNI-PANKH 16
 Concept of Heijunka Akshay M. Ramekar 1, Vivek D. Muneshwar 2, Ajinkya S. Kute 3, Ashish M. Choube 4 1, 2, 3 Student, Mechanical Engineering, JDIET, Yavatmal, India Assistant Professor, Mechanical Engineering
Lean Principles and Applications
 Lean Principles and Applications Pawley Institute School of Business Administration School of Education & Human Services School of Engineering & Computer Science Fall 2006 1 What Happens During the Course
The Toyota Way. Using Operational Excellence as a Strategic Weapon. Chapter 1 9/11/ Ps. September 11, 2014
 The Toyota Way September 11, 2014 1 Using Operational Excellence as a Strategic Weapon Chapter 1 2 Philosophy Long-term thinking Process Eliminate waste People and Partners Respect Challenge Grow them
INTRODUCTION 1. When manufacturing processes of products being examine through customer s perspective, we will be able to identify 2 types of processe
 INTRODUCTION 1. When manufacturing processes of products being examine through customer s perspective, we will be able to identify 2 types of processes, the Value-Added and Non-Value Added. 2. The later
Flow and Pull Systems
 Online Student Guide Flow and Pull Systems OpusWorks 2016, All Rights Reserved 1 Table of Contents LEARNING OBJECTIVES... 4 INTRODUCTION... 4 BENEFITS OF FLOW AND PULL... 5 CLEARING ROADBLOCKS... 5 APPROACH
Outline. Push-Pull Systems Global Company Profile: Toyota Motor Corporation Just-in-Time, the Toyota Production System, and Lean Operations
 JIT and Lean Operations Outline Push-Pull Systems Global Company Profile: Toyota Motor Corporation Just-in-Time, the Toyota Production System, and Lean Operations Eliminate Waste Remove Variability Improve
JUST IN TIME. Manuel Rincón, M.Sc. October 22nd, 2004
 JUST IN TIME Manuel Rincón, M.Sc. October 22nd, 2004 Lecture Outline 1. Just-in-Time Philosophy 2. Suppliers Goals of JIT Partnerships Concerns of Suppliers 3. JIT Layout Distance Reduction Increased Flexibility
LEAN CERTIFICATION BODY OF KNOWLEDGE RUBRIC VERSION 3.0
 MODULE 1 LEAN CERTIFICATION BODY OF KNOWLEDGE RUBRIC VERSION 3.0 1. Cultural Enablers 15% 20% 25% 1.1. Principles of Cultural Enablers 3% 4% 5% 1.1.1. Respect for the individual 1.1.2. Humility 1.2. Processes
Just-In-Time (JIT) Manufacturing. Overview
 Manufacturing. Overview") Just-In-Time (JIT) Manufacturing Overview The Just-in-Time (JIT) Manufacturing Philosophy Prerequisites for JIT Manufacturing Elements of JIT Manufacturing Benefits of JIT Manufacturing Success and JIT
Just-In-Time (JIT) Manufacturing Overview The Just-in-Time (JIT) Manufacturing Philosophy Prerequisites for JIT Manufacturing Elements of JIT Manufacturing Benefits of JIT Manufacturing Success and JIT
Optimizing Inplant Supply Chain in Steel Plants by Integrating Lean Manufacturing and Theory of Constrains through Dynamic Simulation
 Optimizing Inplant Supply Chain in Steel Plants by Integrating Lean Manufacturing and Theory of Constrains through Dynamic Simulation Atanu Mukherjee, President, Dastur Business and Technology Consulting,
An Application of Lean Manufacturing to Enhance the Runtime in the Machine Shop
 An Application of Lean Manufacturing to Enhance the Runtime in the Machine Shop SAMIR SAMA PG Student, Department of Mechanical Engineering, S. P. B. Patel Engineering collage, Linch Mehsana Gujarat (India)
Operations Management - 5 th Edition
 Chapter 15 Lean Production Operations Management - 5 th Edition Roberta Russell & Bernard W. Taylor, III Copyright 2006 John Wiley & Sons, Inc. Beni Asllani University of Tennessee at Chattanooga Lecture
CHAPTER 1 INTRODUCTION
 1 CHAPTER 1 INTRODUCTION Nowadays, manufacturing firms are in the position to redefine and redesign their manufacturing systems in order to meet the competitive demands raised by market challenges. The
MIT SCALE RESEARCH REPORT
 MIT SCALE RESEARCH REPORT The MIT Global Supply Chain and Logistics Excellence (SCALE) Network is an international alliance of leading-edge research and education centers, dedicated to the development
Integrating Big Island Layout with Pull System for Production Optimization
 Integrating Big Island Layout with Pull System for Production Optimization M. H. M. Rusli, A. Jaffar, M. T. Ali, and S. Muhamud @ Kayat Abstract Lean manufacturing is a production philosophy made popular
Level & Stable Operations
 Getting Started with Lean Manufacturing Principles in Flexible Substrate Coating and Converting Dave Schoellerman Tollcoating.com by Carestream Health, Incorporated info@tollcoating.com Abstract Lean manufacturing
International Lean Manufacturing Lessons National Localization Indaba Balázs Németh, Phd. Kvalikon Consulting
 International Lean Manufacturing Lessons National Localization Indaba Balázs Németh, Phd. Kvalikon Consulting DAC Annual Grand Meeting 5 June 2014 Competition 2 Competing for Resources (Capital, Raw Material,
5.3 Supply Management within the MES
 Technical 6x9 / Manufacturing Execution Sytems (MES): Design, Planning, and Deployment / Meyer / 0-07-162383-3 / Chapter 5 Core Function Production Flow-Oriented Planning 85 Customer data (e.g., customer
LEARNING TO SEE an introduction to lean thinking
 LEARNING TO SEE an introduction to lean thinking 2 Why Lean? Customer satisfaction Market share Costs 3 Where did Lean come from? Henry Ford First flow production line 1960s The term Lean originated International
SIMULATION MODEL OF PREFABRICATED HOUSE FROM MANUFACTURING TO ON-SITE INSTALLATION
 SIMULATION MODEL OF PREFABRICATED HOUSE FROM MANUFACTURING TO ON-SITE INSTALLATION Mohammed Sadiq Altaf (a), Mohamed Al-Hussein (b) (a) Post-Doctoral Fellow, Civil and Environmental Engineering, University
"Value Stream Mapping How does Reliability play a role in making Lean Manufacturing a Success " Presented by Larry Akre May 17, 2007
 "Value Stream Mapping How does Reliability play a role in making Lean Manufacturing a Success " Presented by Larry Akre May 17, 2007 LAKRE 2007 1 Lean Manufacturing What is Lean Manufacturing? A philosophy
Lean and Agile Systems. Rajiv Gupta FORE School of Management October 2013 Session 6
 Lean and Agile Systems Rajiv Gupta FORE School of Management October 2013 Session 6 Module 1 Recap of Session 5 Module 2 Pull Production Rules of Kanban Module 3 Small Batch Production Level Production
Lean Manufacturing 1
 Lean Manufacturing 1 Definitions Value - A capability provided to a customer at the right time at an appropriate price, as defined in each case by the customer. Features of the product or service, availability,
Lean Manufacturing Implementation in Small and Medium Industry
 Advances in Smart Systems Research ISSN 2050-8662 Vol. 5. No. 1 : pp.17-29 : isrp16-004 Lean Manufacturing Implementation in Small and Medium Industry N.H.Zakaria 1, N.M.Z.N.Mohamed 1,2 *, A.N.M.Rose 1,
James P omack Womack Chairman L, ean Lean Enterprise Institute
 Lean Tools to Lean Management James P. Womack Chairman, Lean Enterprise Institute 1 2 ASh Short thistory of flean Elements of Any Value Creating Enterprise 1. Product and process development, from concept
Profit = Price - Cost. TAKT Time Map Capacity Tables. Total Productive Maintenance. Visual Control. Poka-yoke (mistake proofing) Kanban.
 Kanban.") GPS Mod 15 Jidoka MUDA MUDA Cost Reduction By Eliminating Waste Just-in-Time Profit = Price - Cost GPS Depth Study NVA/VA- Functions/Mgrs Quality Cost Delivery Safety Measures Morale TAKT Time Map Capacity
GPS Mod 15 Jidoka MUDA MUDA Cost Reduction By Eliminating Waste Just-in-Time Profit = Price - Cost GPS Depth Study NVA/VA- Functions/Mgrs Quality Cost Delivery Safety Measures Morale TAKT Time Map Capacity
Just In Time (JIT) Quality and Reliability Engg. (171906) H I T. Hit suyo na mono O Iru toki iru dake Tasukuran
 Quality and Reliability Engg. (171906) H I T. Hit suyo na mono O Iru toki iru dake Tasukuran") Just In Time (JIT) H I T Hit suyo na mono O Iru toki iru dake Tasukuran (What is needed) (When it is needed and in what quantity) (Make) The crux is, if you cannot use it now do not make it now. Quality
Just In Time (JIT) H I T Hit suyo na mono O Iru toki iru dake Tasukuran (What is needed) (When it is needed and in what quantity) (Make) The crux is, if you cannot use it now do not make it now. Quality
Lab Quality Confab LEAN Principles. 4 Fundamental LEAN Tools to Transform your Laboratory. Rita D Angelo, Bonnie Messinger, Bill Krzisnik
 Lab Quality Confab 2018 LEAN Principles 4 Fundamental LEAN Tools to Transform your Laboratory Rita D Angelo, Bonnie Messinger, Bill Krzisnik Learning Objectives The Learner will be able to: 1. Understand
SCM 302 OPERATIONS MANAGEMENT JIT
 SCM 302 OPERATIONS MANAGEMENT JIT 2 Agenda for this Module 1. Define just-in-time, TPS, and lean operations 2. Define the seven wastes and the 5Ss 3. Explain JIT partnerships 4. Determine optimal setup
These tend to be sequential, and offer increasing levels of efficiency to an organisation.
 3 Forms of Waste There are 3 forms of waste in any organisation; muda (tasks with no value add), mura (where things are done inconsistently) and muri (where excessive effort is used). Benefit of thinking
Engaging Staff in Daily Improvement
 Engaging Staff in Daily Improvement 2 2016 Virginia Mason Medical Center World-Class Management Management by Policy Aligning Vision with Resources The World-Class Management System is a leadership system
LEAN MANUFACTUING-CONCEPT, LIMITATION, APPLICATIONS: AN OVERVIEW
 LEAN MANUFACTUING-CONCEPT, LIMITATION, APPLICATIONS: AN OVERVIEW Submitted By Ms. PUNAM NIVRUTTI PATIL DPGD/OC13/1243 SPECIALIZATION: OPERATIONS WELINGKAR INSTITUTE OF MANAGEMENT DEVELOPMENT & RESEACH
Chapter 11. In-Time and Lean Production
 Chapter 11 Just-In In-Time and Lean Production What is JIT? Producing only what is needed, when it is needed A philosophy An integrated management system JIT s mandate: Eliminate all waste Basic Elements
Generic Case Study. Initial Condition. 1. Stability
 Generic Case Study This example is based on an actual project. Names of people and details about processes have been hidden. To achieve the current state it took 25 months, 1 fulltime kaizen leader, dedicated
TPS Basics. What defines worth? Value: The key focus. Delivery. Worth Value= Cost. Functionality: what the product will do Performance Features
 TPS Basics Value: The key focus. Worth Value= Cost Eyes of customer Incurred during production Toyota s strategy is achieve total quality and maximum cost reduction through variation and waste elimination
JIT and Lean Operations. JIT/Lean Operations
 5/7/2011 16 JIT and Lean Operations By : Sa Ed M. Salhieh, Salhieh, Ph.D. 16-1 JIT/Lean Operations Good production systems require that managers address three issues that are pervasive and fundamental
Logistics Strategy Leagile Thinking
 Logistics Strategy Leagile Thinking Kate Hughes & John Whiteley 1 Managing the Lead Time Frontier Time is a simple measure By following the flow through a process we can see where is lost. data can be
CASE STUDY: LEAN SUPPLY CHAIN MANAGEMENT IN CONSTRUCTION PROJECTS
 CASE STUDY: LEAN SUPPLY CHAIN MANAGEMENT IN CONSTRUCTION PROJECTS ABSTRACT Eric Zimmer 1, Ossama Salem 2, Ashraf Genaidy 3 and Richard Shell 4 Researchers and construction professionals have adopted lean
Value Stream Mapping in the Converting Industry. Lance Cullen October 22 nd, 2012
 Value Stream Mapping in the Converting Industry Lance Cullen October 22 nd, 2012 Topics to be Covered 2 1. Why VSM? 2. VSM Overview and Basics 3. VSM in Action 4. Conclusion 5. Questions? Traditional Supply
Unit WorkBook 1 Level 5 ENG U48 Manufacturing Systems Engineering UniCourse Ltd. All Rights Reserved. Sample
 Pearson BTEC Levels 5 Higher Nationals in Engineering (RQF) Unit 48: Manufacturing Systems Engineering Unit Workbook 1 in a series of 1 for this unit Learning Outcome LO1 to LO4 Manufacturing Systems Engineering
Actionable enterprise architecture management
 Enterprise architecture White paper June 2009 Actionable enterprise architecture management Jim Amsden, solution architect, Rational software, IBM Software Group Andrew Jensen, senior product marketing
Tecnomatix Plant Simulation
 Value Stream Mapping Library Benefits Increase productivity of existing production facilities by as much as 20 percent Reduce investment in planning for new production by as much as 20 percent Reduce inventories
Lean Flow Enterprise Elements
 "Lean Flow" describes the performance of organizations that are effective enough to win consistently in the competitive global marketplace. To understand how to get there, it s useful to focus on Lean
Application of the Lean Manufacturing principles to an Injection Moulding Industry
 Application of the Lean Manufacturing principles to an Injection Moulding Industry Miguel Seixas Barroso miguel.barroso@tecnico.ulisboa.pt Instituto Superior Técnico, Universidade de Lisboa, Portugal June
South Central. Course Catalog
 Contents Lean Operations Solutions... 1 Principles of Lean Manufacturing 4 hr... 1 Value-Stream Management & Mapping - 4 hr, 24 hr... 1 5S: Workplace Organization 4 hr, 40 hr... 1 Total Productive Maintenance
JUST IN TIME (JIT), LEAN, AND TOYOTA PRODUCTION SYSTEM (TPS)
, LEAN, AND TOYOTA PRODUCTION SYSTEM (TPS)") JUST IN TIME (JIT), LEAN, AND TOYOTA PRODUCTION SYSTEM (TPS) Dr. Mahmoud Abbas Mahmoud Al-Naimi Assistant Professor Industrial Engineering Branch Department of Production Engineering and Metallurgy University
JUST IN TIME (JIT), LEAN, AND TOYOTA PRODUCTION SYSTEM (TPS) Dr. Mahmoud Abbas Mahmoud Al-Naimi Assistant Professor Industrial Engineering Branch Department of Production Engineering and Metallurgy University
Ashvath Sharma (Correspondence) +
 +") Lean manufacturing is a manufacturing system which was started by Toyota and is now used by many manufacturers throughout the world. Lean Manufacturing is a way to notice and remove waste i.e. non-profit
Lean manufacturing is a manufacturing system which was started by Toyota and is now used by many manufacturers throughout the world. Lean Manufacturing is a way to notice and remove waste i.e. non-profit
Process Mapping What It Means for You. FAQs. Desired Results. 5) What are Fastenal s objectives? 1) What is a process mapping?
 What are Fastenal s objectives? 1) What is a process mapping?") Process Mapping What It Means for You At Fastenal, we do much more than just ship products out of a catalog; we can work closely with you to uncover hidden sources of supply chain waste and provide total
Process Mapping What It Means for You At Fastenal, we do much more than just ship products out of a catalog; we can work closely with you to uncover hidden sources of supply chain waste and provide total
Lean Six Sigma Black Belt Week 3
 Lean Six Sigma Black Belt Week 3 Chapter 3-1: Lean Re-Entry and Process Institute of Industrial Engineers 3577 Parkway Place Suite 200 Norcross, GA 30092 Lean Six Sigma Black Belt Week 3 Agenda Day 1 Day
Online Course Manual By Craig Pence. Module 12
 Online Course Manual By Craig Pence Copyright Notice. Each module of the course manual may be viewed online, saved to disk, or printed (each is composed of 10 to 15 printed pages of text) by students enrolled
SALES PROSPECTING KIT
 Distributed by: SALES PROSPECTING KIT LEAN MANUFACTURING LAST UPDATED 4/2009 What is Lean Manufacturing? Lean manufacturing is an improvement methodology designed to eliminate waste and improve operational
CHAPTER 7 Building Information Modeling
 CHAPTER 7 Building Information Modeling Dr Nabil Elsawalhi Associate Professor of Construction Management 1 Information and Communication Technology/ Building Information Modeling New approaches to construction
Proceedings of the 2012 Winter Simulation Conference C. Laroque, J. Himmelspach, R. Pasupathy, O. Rose, and A. M. Uhrmacher, eds.
 Proceedings of the 2012 Winter Simulation Conference C. Laroque, J. Himmelspach, R. Pasupathy, O. Rose, and A. M. Uhrmacher, eds. A SIMULATION-BASED LEAN PRODUCTION APPROACH AT A LOW-VOLUME PARTS MANUFACTURER
The Book of Value Stream Maps II
 The Book of Value Stream Maps II Plant Level Maps for Process Industries Solutions to common value stream mapping problems with example maps Supplier Process Customer By: Dilesh Patel, Herman Ranpuria,
SIMUL8-PLANNER FOR COMPOSITES MANUFACTURING
 Proceedings of the 2006 Winter Simulation Conference L. F. Perrone, F. P. Wieland, J. Liu, B. G. Lawson, D. M. Nicol, and R. M. Fujimoto, eds. SIMUL8-PLANNER FOR COMPOSITES MANUFACTURING Kim Hindle Project
Operations Management
 Operations Management Chapter 16 JIT and Lean Operations PowerPoint presentation to accompany Heizer/Render Operations Management, 11ed Some additions and deletions have been made by Ömer Yağız to this
International Journal of Recent Advances in Multidisciplinary Research Vol. 01, Issue 03, pp , September, 2014
 sz International journal Journal of of Research Recent and Advances Review in in Health Multidisciplinary Sciences, July -14 Research, September -14 International Journal of Recent Advances in Multidisciplinary
An Introduction to Lean. Heidi Maier Sagstad
 An Introduction to Lean Heidi Maier Sagstad Agenda Objective: Provide you with a basic understanding of key lean principles and tools. Topics: Lean defined Waste Value Stream Mapping 5S Balanced Flow 2
Dennis Bricker Dept of Mechanical & Industrial Engineering The University of Iowa. JIT --Intro 02/11/03 page 1 of 28
 Dennis Bricker Dept of Mechanical & Industrial Engineering The University of Iowa JIT --Intro 02/11/03 page 1 of 28 Pull/Push Systems Pull system: System for moving work where a workstation pulls output
Business Improvement Lean Manufacturing Toolkit
 Business Improvement Lean Manufacturing Toolkit Lean Introduction. Lean is an influential and established set of principles and methods which can be used in any environment and setting. Lean is essentially
Lean Basics Overview. EMC 2011 Training. NCDENR April Copyright 2010 EMC Corporation. All rights reserved.
 Lean Basics Overview EMC 2011 Training NCDENR April 2011 1 Topics Lean Six Sigma defined Why Lean Six Sigma? What s a process? Interrogating the process by identifying Value & Waste Brief overview of some
International Journal of Technical Research (IJTR) Vol. 5, Issue 1, Mar-Apr 2016
 Vol. 5, Issue 1, Mar-Apr 2016") Experimental Study For Assembly Line Balancing Using Largest Candidate Rule Algorithm In Automoblie Lighting Industries A Case Study Ankur Malik 1, Umed Khod 2 1 M.Tech, Scholar, 2 Assistant Prof. Department
Experimental Study For Assembly Line Balancing Using Largest Candidate Rule Algorithm In Automoblie Lighting Industries A Case Study Ankur Malik 1, Umed Khod 2 1 M.Tech, Scholar, 2 Assistant Prof. Department
TEN STEPS to Lean Electrical Controls
 Complements of: TEN STEPS to Lean Electrical Controls EXECUTIVE SUMMARY Globalization is forcing companies to constantly become more efficient. To drive efficiencies, many companies are implementing Lean
Lean Manufacturing. Introduction & Background to Lean
 Lean Manufacturing Introduction & Background to Lean Professor Trevor Spedding P160 t.spedding@gre.ac.uk 01634 883425 Grahame Baker P237 g.baker@gre.ac.uk 01634 883302 Sam Berkhauer P345 BS983@gre.ac.uk
Virtual Pull Systems. Don Guild, Synchronous Management INTRODUCTION
 INTRODUCTION Have you implemented kanban yet? Have you been unable to roll it out or just abandoned it? Most companies who begin kanban implementation struggle to finish the job. In too many cases, the
CHAPTER 4 INTEGRATING LEAN TOOLS AND TECHNIQUES IN PLANT MAINTENANCE FUNCTION
 CHAPTER 4 INTEGRATING LEAN TOOLS AND TECHNIQUES IN PLANT MAINTENANCE FUNCTION Chapter Summary The Integrating Lean tools and techniques in Plant Maintenance function explains the identification of lean
Achieving Operational Excellence Using Lean. Paul Gilbarg September 25, 2015
 Achieving Operational Excellence Using Lean Paul Gilbarg September 25, 2015 Purpose To provide attendees with an overview of Lean thinking and methods that will illustrate its potential for improving organization
In general, a model is used to understand a system. It is only a representation of a more complicated original system based on mutual
 In general, a model is used to understand a system. It is only a representation of a more complicated original system based on mutual characteristics, that is used for a specific exercise by a third system.
turning data into dollars
 turning data into dollars Tom s Ten Data Tips August 2012 Kanban Kanban is a relatively new party to the Agile family, a process improvement method aimed at making work flow more efficiently. You enhance
1. Does lean operation rely on implicit or explicit production planning? 2. Is a lean operation considered a push or a pull system?
 1. Does lean operation rely on implicit or explicit production planning? 2. Is a lean operation considered a push or a pull system? 3. Does lean operation rely more on precise calculations or reaction
Lean Thinking - Doing More With Less
 Setpoint Systems, Inc. Authored By: Malorie Rasmussen Lean Thinking - Doing More With Less www.setpointusa.com info@setpointusa.com 801-621-4117 Lean Thinking - Doing More With Less Page 1 Setpoint provides
Extending Lean Initiatives Across the Organization:
 A White Paper by Exact Software Extending Lean Initiatives Across the Organization: How greater efficiencies can extend beyond the manufacturing floor and back-office Business Unified Executive Overview
Lean Principles. Jerry D. Kilpatrick. This article was originally written for and published by MEP Utah in 2003 (
 Lean Principles By Jerry D. Kilpatrick This article was originally written for and published by MEP Utah in 2003 (www.mep.org) Page 1 of 6 Introduction Lean operating principles began in manufacturing
April 11, In Sherman workflow inventory or Work- In- Progress was on the equipment or be transported to the next work station.
 April 11, 2012 My experiences with Lean Manufacturing began at Texas Instruments, Sherman which was a highly efficient semiconductor manufacturing division building the highest volume bipolar integrated
Beyond Lean Manufacturing
 PRODUCT CONFIGURATION MANAGEMENT Beyond Lean Manufacturing www.infor.com/solutions/pcm 1 Agenda State of discrete manufacturing productivity Strategies for competitive advantage Suggestions for getting
Session III. LEAN Enterprise and Six Sigma
 Session III LEAN Enterprise and Six Sigma LEAN Enterprise Is a methodology that relies on a collaborative team effort to improve performance by systematically removing waste; combining Lean Manufacturing,
Production Management and Scheduling
 Production Management and Scheduling Meet Your Due Dates Your production process can be simple or complex, time consuming or quick, but one thing remains constant the drive to meet your customer s delivery
Lean Implementation challenges in Discrete manufacturing Industries
 4D International Journal of Management and Science ISSN No: 2250-0669 @4D Crossconnect.com, Inc, 2012 www.4dinternationaljournal.com Vol. 4, Issue3,-2014 Purpose: Lean Implementation challenges in Discrete