Energy Supply Costs Information Paper
|
|
|
- Shon Floyd
- 6 years ago
- Views:
Transcription
1 An Coimisiún um Rialáil Fóntas Commission for Regulation of Utilities Energy Supply Costs Information Paper 0 Information Paper Reference: CRU17291 Date Published: 11 th October
2 Public/ Customer Impact Statement This information note is a follow on to the CRU s review of competition in the electricity and gas retail markets (CER/17019), published in February The CRU took an action based on the findings of this paper to review and further understand the components of supplier costs. The paper is split into three sections. The first section of the paper looks at the breakdown of Supply Costs between 2015 and 2016 for both electricity and gas while the second section of the paper looks in detail at a number of elements of supplier costs and the breakdown of obligatory costs faced by suppliers. Retail margins are also considered separately here. The last section of the paper presents the CRU s retail model in terms of the components of the final retail bill including wholesale costs, network costs, supply costs, taxes and levies and how these cost components appear to have changed over time. These cost components are compared to the cost components provided by suppliers. Key findings The main findings of this Information paper are as follows. Supply Costs Supply costs refer to supplier s operating costs for their businesses. These operating costs include for example obligatory costs from regulations and government policies, facilities and insurance costs and sales and advertising costs. Supplier margins and taxes and levies are not included here. The supply component of total costs (including fuel and network costs) amounts to approximately 9% of total costs. The majority of costs relate to acquiring and retaining customers (3%), bad debt (1%), PAYG costs (1%) and costs of running supplier businesses including facilities, insurance, buildings etc (4%). 1
3 Detailed Supply Cost Analysis The lowest and highest advertising spend of suppliers differs on a per customer basis by a factor of 3, and larger suppliers generally spend less per customer than suppliers with less than 5% market share, which indicates benefits of scale for larger suppliers. The total weighted average cost of bad debt across suppliers decreased between 2015 and 2016.This may reflect improvements in economic conditions as shown in the falling numbers of disconnections and financial hardship Pay as You Go installs, as reported in the CRU s Retail Market Monitoring Reports. On a weighted average basis across suppliers, Obligatory costs accounted for 1% of total costs (including fuel and network costs). The CRU has also inferred Supplier margins from the data submitted by Suppliers. Whilst the average retail margin is higher than when Supplier margins were regulated, they are not a cause of concern. Nonetheless, the CRU will continue to monitor margins in line with its market monitoring duties. The majority of obligatory costs relate to the Energy Efficiency Obligation Scheme (76%), Meter Tampering & Revenue protection (16%), Regulation Human Resources (4%) and the CRU s Supplier Handbook (3%). CRU Final Bill breakdown The CRU has updated its retail tariff model to reflect the latest changes in wholesale prices and updated network cost assumptions for gas. The CRU s Retail Model estimates that the supply cost component of total costs for both electricity and gas total costs have risen between 2012 and Between 2016 and 2017 the electricity supply cost component of total electricity costs appears to have decreased. 2
4 Process of review The CRU conducted an in-depth review of the development of competition in the electricity and gas retail markets in order to assess the extent to which competition is providing beneficial outcomes for consumers and what further policy actions may be required in each of the areas considered in the review. This review was a result of an action in the 2015 White Paper on energy policy published by the Department of Communications, Climate Action and Environment. This information note specifically focuses on the findings of Chapter 5 of the review of competition which looked at the development of retail prices in the market. The CRU took an action based on the finding of this chapter that supply costs appear to have increased over time, to further understand the components and drivers of supply costs and identify whether any new policies are required to ensure that all customers benefit from competition. The specific action taken by the CRU was to Conduct an examination to understand the components of supplier costs and the responsiveness of the energy component of retail prices to changes in wholesale market, and how reductions in wholesale prices are passed on to all final customers. This action is addressed in Section 5 of this paper. On the 15 th of May 2017 the CRU issued a Request for Information to Electricity and Gas suppliers seeking a further breakdown of the total costs faced by suppliers. This information note presents a summary of the analysis carried out regarding supply costs in order to provide a clearer picture of the final components of bills for electricity and gas customers. The aim of the analysis presented in this information note is to inform consumers about the cost components of their energy bills and the cost drivers of supply costs, in order to increase understanding and transparency in the energy market. 3
5 Contents 1 Introduction Background... 5 Related Documents Supply Costs Analysis Total Energy Costs (including wholesale and Network Costs) Supply Cost Components Detailed supply cost analysis Sales, Advertising, Customer Retention and Acquisition Costs Bad debt Obligatory Costs Drivers of change Energy Efficiency Obligations Scheme Future Obligatory Costs Retail Margins Components of a final retail bill Final Price Components Wholesale costs Network costs Supply Costs Taxes and Levies CRU Electricity Model Updates to Electricity Model CRU Gas Model Updates to Gas Model Conclusions Appendix Appendix
6 1 Introduction 1.1 Background The Commission for Regulation of Utilities (CRU) is Ireland s independent energy and water regulator. The CRU was established in 1999 and now has a wide range of economic, customer protection and safety responsibilities in energy. The CRU is also the regulator of Ireland s public water and wastewater system. One of the functions of the CRU is retail market monitoring, which entails monitoring the electricity and gas retail markets to ensure that they are functioning in the interests of energy consumers. Information on the CRU s role and relevant legislation can be found on the CRU s website at On the 9th February 2017 the CRU published its Review of Competition in the Electricity and Gas Retail Markets (CER/17/019). As part of this review the components of final retail prices were considered, specifically wholesale, network and supply costs. Taxes and levies were excluded from this analysis. In the Review of Competition, the difference between the combination of wholesale costs plus network costs and the final retail price represented supply costs, including the net profit margin earned by suppliers. The review noted that supply costs are not the same as profits, as suppliers have additional operating costs separate from wholesale commodity costs and network costs that need to be paid from the total revenue of final retail prices. Therefore, the CRU undertook an action to conduct additional analysis to better understand the components and cost drivers of supply costs. This information note is the outcome of analysis that the CRU has undertaken in this area over the last number of months. The purpose of this document is to increase transparency on the Supply Costs that make up part of all energy customers bills. 5
7 This paper is split into three main areas; Action 1 The first part of this report presents supply cost information submitted by suppliers at an aggregate level. This considers supply costs in the context of total costs (including wholesale and network costs). Action 2 The second part of this report looks at a number of supply cost components in detail, including sales, advertising, customer retention and acquisition costs, bad debt and obligatory costs. Information on supplier margins is also presented separately in this section. Action 3 The CRU has updated the analysis presented in Chapter 5 of the Review of Competition to reflect updated assumptions and recent movements in cost components such as wholesale costs. This gives rise to a breakdown of the costs of a customer s final retail bill, based on the CRU s internal retail tariff methodology. This includes estimated wholesale costs, network costs, supply costs and taxes and levies. Related Documents CER17019 Review of Competition in the Electricity and Gas Retail Markets CER17060 Review of the Supplier s Handbook Decision Paper CER14344 Market Monitoring Framework 2014 Decision Paper CER16014 Debt Management Decision Paper CER15205 Green Source Products Decision Paper CER15181 Fuel Mix and CO2 Emissions Disclosure CER17042 Review of Typical Consumption Figures Decision Paper Ireland s Energy Efficiency Obligation Scheme Consultation Paper and Annual Report Energy Efficiency Obligation Scheme Consultation Decision Paper OFGEM Energy Companies Consolidated Segmental Statements (CSS) 6
8 2 Supply Costs Analysis This section of the paper is focused on the Supply Costs element of the final retail bill. Overall costs include wholesale/fuel costs, network costs and supplier s operating costs, excluding retail margins. Wholesale and network costs are broadly outside of the control of suppliers 1 and thus the focus of this section is on supplier s operating costs. We use the term Supply Costs in this paper when referring to these costs. The term total energy costs refers to the sum of wholesale (electricity or gas), network and supply costs faced by Suppliers. The aim of the analysis presented in this chapter is threefold; Total Energy Costs: The sum of wholesale, network and supply costs. 1. Understand what is driving changes in supply costs across each year, in particular by focusing on a breakdown of supply costs. 2. Analyse what element of Supply Costs is composed of obligatory costs, either those required by the CRU as the energy regulator or by government or European policies. 3. Increase overall understanding for energy customers of the components of their final retail bill so as to increase transparency in the electricity and gas markets. This is further addressed in chapter 5 which focuses on the CRU s model of final retail prices and the estimated components of electricity and gas prices. As part of the Supply Cost analysis presented in this paper the CRU undertook a Request for Information (RFI) with Suppliers in the market. As all energy Suppliers must hold a license from the CRU, this permits the CRU to request information from Suppliers where such information is required for the CRU to fulfil its statutory functions. Detail on a range of cost components was requested from suppliers, including gross operating costs (including wholesale, network and supply costs). Further breakdowns were requested for obligatory policy costs 2 and for sales & advertising 3. 1 However suppliers may hedge against wholesale price volatility, in particular in gas. 2 Examples specified included the CER Supplier Handbook, Supplier Audits, Energy Efficiency Scheme 3 This includes aspects such as discounts, renegotiations and acquisitions 7

9 Table 1 of the appendix details all categories of costs requested from Suppliers. This includes information submitted separately for electricity and for gas. Some Suppliers are only active in one market i.e. electricity or gas. Additionally, a number of operating costs are incurred by suppliers as a total business rather than split between electricity and gas so the focus of the CRU s analysis is at this level. 2.1 Total Energy Costs (including wholesale and Network Costs) The percentage contribution of wholesale, network and supply costs to total costs is presented below. Readers should note that these percentages will be different from the CRU s model presented in chapter 4 which focuses on domestic customers because this is based on supplier data that was submitted to the energy markets division on costs only for domestic and non-domestic customers and does not include margins, taxes or levies. A comparison between the CRU s model and a breakdown of costs as reported by suppliers is presented in Chapter 4. Figure 2.1 presents blended total costs reported by suppliers across electricity and gas for 2015 and Total energy costs(electricity and gas) Supply Costs refer to the operating costs of a supplier, excluding wholesale and network costs. This excludes any margin % 42.20% 46.60% 48.20% 8.10% 9.50% WHOLESALE COSTS NETWORK COSTS SUPPLY COSTS Figure 2.1 total energy cost components 8


10 As shown in figure 2.1, based on supplier submissions the majority of total costs faced by suppliers relate to network and fuel costs. Analysis of information provided from suppliers in terms of the average costs across suppliers for electricity and gas is presented in figure 2.2. Cost have been compared based on the weighted average across suppliers which takes account of the number of customers per supplier and the different scales Margin is a measure of profitability. It refers to the difference between the operating costs and the total revenues of a Supplier. of suppliers in terms of total revenue. The supply component of total costs amounts to approximately 9%, excluding any margin. Figure 2.2 presents a breakdown of supplier cost components for electricity and gas for Network costs account for 49.98% of electricity costs, compared to 39.56% of gas costs, while fuel costs account for 41.16% of electricity costs compared to 47.37% of gas costs. Summary of total electricity costs % Summary of gas costs % 39.56% 49.98% 41.16% 47.37% Network Costs Fuel Costs Supply Costs Network Costs Fuel Costs Supply Costs Figure 2.2, electricity and gas total costs, Supply Cost Components A further breakdown of supply costs (which exclude fuel and network costs) is presented in figure 2.3 below. Business related costs refer to the operating business costs. This includes facilities, rent, insurance etc. 9

11 In 2016, 38.5% of supply costs were comprised of business related costs (which include facilities, rent and insurance for example), with 35.7% of costs accounted for by sales, advertising, customer retention and acquisition costs. Obligatory costs and Obligatory costs refer to regulatory and government costs which include customer protection, energy efficiency and market audits and monitoring. bad debt each accounted for just under 10% of supply costs while costs of installing PAYG meters accounted for 6.5% of costs (however this cost only applies to suppliers that offer PAYG as a lifestyle choice option). PAYG costs here refer to the costs of PAYG installations and maintenance for suppliers offering these as lifestyle choice options. Pay as You Go costs are only incurred by suppliers offering this as a lifestyle choice option however as all costs are presented as a weighted average across suppliers they are included here. Total Supply Costs Components (electricity and gas) 45.0% 40.0% 35.0% 36.9% 35.7% 38.5% 35.8% 30.0% 25.0% 20.0% 15.0% 10.0% 5.0% 8.9% 9.7% 5.6% 6.5% 12.7% 9.6% % Obligatory Sales & advertising, customer acquisition and retention and discounts PAYG Bad Debt Business Related Costs Figure 2.3 Total supply cost components (electricity and gas) for 2015 and 2016 A breakdown of supply cost components was requested from suppliers in the following areas; Obligatory costs: These include costs imposed through regulatory or government policy decisions. Sales and advertising, customer acquisition and retention costs: These include the costs which suppliers, according to their specific commercial strategies, may spend on acquiring and retaining electricity and gas customers. 10

12 PAYG costs: The cost of installing and maintaining PAYG meters for suppliers that offer this as a lifestyle choice option. Bad debt: The cost associated with customers in arrears and on payment plans or for non-payment of bills. Business Related Costs: The day to day costs associated with supply businesses including facilities, insurance etc. Table 2.1 looks at some of the changes in supply cost drivers between 2015 and On a weighted average basis across suppliers, Obligatory costs increased by 0.8% between 2015 and Bad debt decreased by 3.1%. Overall total supply costs decreased by 8.4% (in terms of the weighted average total figure for supply costs as reported by suppliers) from 2015 to Table 2.1, % change in energy costs between 2015 and 2016 Key Points and Summary of Findings This chapter has presented weighted average costs for electricity and gas across suppliers, including fuel costs, network costs, operating costs and obligatory costs. 11
13 Supply costs comprise approximately 9% of total faced by suppliers. Wholesale costs account for circa 42% and network costs account for 48% of these total costs. Focusing on supply costs (which include obligatory, sales and advertising and customer retention and acquisition, PAYG, bad debt and business related costs), these costs have reduced by 8.4% between 2015 and

14 3 Detailed supply cost analysis This section presents detailed information on a number of areas related to the supply costs presented in chapter 2, including sales and advertising and customer retention and acquisition costs, bad debt and obligatory costs. 3.1 Sales, Advertising, Customer Retention and Acquisition Costs Sales, advertising, customer retention and acquisition costs accounted for 3% of total supplier costs in 2015 and 3.4% in Of supply specific cost components (excluding network costs and fuel costs) they accounted for 37% in 2015 and 36% in

15 The CRU has conducted analysis on the total spend of suppliers based on their market share, in order to try to ascertain how economies of scale in advertising may impact on smaller supplier s ability to compete. As with any market, a larger supplier may have a better ability to spread costs over a larger customer base. Sales, advertising customer retention and acquisition costs 2015 ratio between lowest and highest cost 2016 ratio between lowest and highest cost % Difference between lowest and highest advertising spend (2016) Electricity /customer 1:3 1:2 63% Gas /customer 1:3 1:3 67% Table 3.1 Table 3.1 presents the ratio between the lowest reported spend on a per customer basis versus the highest reported spend on a per customer basis across suppliers in gas and electricity combined. The highest spend was 3 times as much as the lowest spend on sales, advertising, customer retention and acquisition on a per customer basis in electricity and is similar is gas. However, in terms of monetary spend it is observed that supplier s per customer spend in gas is generally higher. This may be due to the lower number of gas customers than electricity customers. Sales, advertising customer retention and acquisition costs covers both the cost of acquiring new customers as well as retaining current customers. This may include a mix of advertising, branding and discounts offered to customers. However, it should be noted that differences in electricity and gas may be due to apportionment of costs between suppliers electricity and gas customers, and many suppliers internally recognise such costs as one total spend rather than split between each market. For example, many suppliers offer dual fuel (both electricity and gas) and so costs in this area would be incurred at a total energy customer level. In order to look at economies of scale in sales and advertising costs, we have split suppliers into those with market shares in terms of customer numbers (for both electricity and gas) of less than 5%, between 5% and 20% and greater than 20%. 14
16 An Coimisiún um Rialáil Fóntas Commission for Regulation of Utilities Sales, advertising, customer retention and acquisition costs per customer <5% 5%-20% >20% Market Share Figure 3.1 From figure 3.1, on average suppliers with greater than 5% market share in terms of customer numbers in electricity and gas have a lower spend per customer on sales, advertising, customer retention and acquisition costs per customer than those with less than 5% market share. Due to the nature of the breakdown of costs in this area however it is difficult to draw general conclusions on the correlation between a supplier s size and spend in each particular area on a per customer basis. However, the CRU notes the following; 1. Suppliers may focus their spending in this area on providing high discounts to acquire customers, or on marketing and branding. For example, if data was available showing the split between sales and advertising and customer retention and acquisition costs further trends across different sizes of suppliers might be available. 2. The CRU has considered the data available in terms of customer numbers, the length of time suppliers have been in the electricity and gas retail markets, the switching and renegotiations rate per year for each supplier and the total revenue of each supplier but has not drawn any significant conclusions in this area. 3. Sales, advertising, marketing and indeed the strategies suppliers adopt to acquire and retain customers can be dynamic and as such budgets and costs 15

17 Q Q Q Q Q Q Q Q Q Q Q Q Q Number of disconnections An Coimisiún um Rialáil Fóntas Commission for Regulation of Utilities in each area can change over time. The information presented here only presents a snapshot of information that the CRU has used to present the cost drivers of supply. 3.2 Bad debt Bad debt accounted for 12.7% of total supply costs in 2015 and 9.6% of total costs in The total weighted average cost of bad debt decreased by 3.1% between 2015 and This may reflect improvements in economic conditions, as shown in the falling number of disconnections and financial hardship PAYG installs as published in the CRU s quarterly market monitoring reports. Bad debt refers to debt that cannot be recovered from customers. Bad debt may either be carried as a cost or written off. It should be noted that some of bad debt cost reported by supplier is associated with CRU energy customer protection in terms of debt management, debt transfer and debt flagging. 7,000 6,000 5,000 4,000 3,000 2,000 1,000 Total Number of PAYG Installs Electricity PAYG Installs Gas PAYG Installs 20,000 15,000 10,000 Total (Domestic and Business) NPA disconnections Electricity Gas 0 5, Figure 3.2 Research from the UK energy market indicates that there has been an increase in overall bad debt in the UK energy market, from 400m in 2011 to 640m in 2015 with UK Water firms showing a similar trend from 263m to 379m. Only the Telecom sector showed a marginal improvement with debt levels dropping by 20m to 560m over the same period. 16
18 per customer An Coimisiún um Rialáil Fóntas Commission for Regulation of Utilities Bad debt per customer Bad debt per customer Electricity Gas Table 3.2 As such, it appears that the level of bad debt per customer is lower in Ireland than the UK based on 2015 data. Bad debt per customer Ireland & UK Bad Debt per customer ( IRL) 2015 Year Bad Debt per customer ( UK) Figure 3.3 Arrears refers to monies that are owed from energy customers to Suppliers. However, the level of bad debt across Suppliers is only one indicator that illustrates whether energy customers have difficulty in paying their bills. CRU market monitoring data shows that while 9-14% of customers were in arrears in Q1 2017, only 1% of customers in electricity and gas were on payment plans at this time. 17
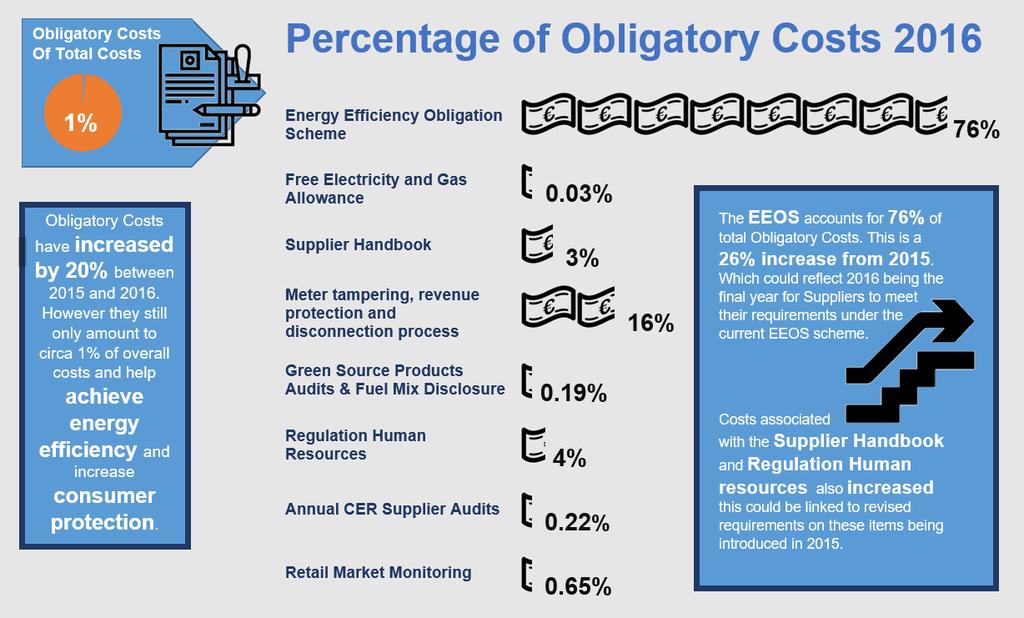
19 3.3 Obligatory Costs A key objective of this information paper is to increase understanding and transparency in the energy market, by detailing and explaining the nature of supply cost drivers. As part of this understanding the CRU is interested in the financial impact associated with the implementation of statutory and regulatory policy obligations. As part of deeper analysis a number of these obligations were identified for the purposes of identifying specific costs associated with either requirements imposed on Suppliers either as a result of regulatory or government policy. Each Supplier was requested to submit the project costs e.g. installation of IT hardware and ongoing costs such as personnel so that a full analysis of costs could be conducted. Each category of costs reported on for this RFI is outlined below with an indication of whether the obligatory cost is driven by regulatory or government policy. A full description is found in Appendix 2. Energy Efficiency Obligation Scheme Free Electricity and Gas Allowance Supplier Handbook Meter tampering, revenue protection and disconnection process Green source products, Audits and Fuel Mix Regulation Human Resources Annual CRU Audits Market Monitoring Government Government Regulatory Regulatory Regulatory Regulatory Regulatory Regulatory Obligatory costs are presented in figure 3.4 as a total across electricity and gas supply businesses. Although information was provided broken down into electricity and gas obligatory costs based on direct and indirect apportionment methods, a number of these costs have been incurred across the entirety of each business so it is important to compare obligatory costs at a total level. 18
20 The majority of obligatory costs in 2015 and 2016 related to the Energy Efficiency Obligations Scheme, which increased from 72% to 76% of total obligatory costs. Costs associated with meter tampering, revenue protection and the disconnection process were also significant, accounting for just under 16% of obligatory costs in 2016 but these costs have decreased since The CRU requires compliance with a number of regulatory requirements, including direct obligatory costs through the Supplier Handbook, Green Source Products Audits and Fuel Mix, Supplier Audits, which together amounted to 8% of obligatory costs in Requirements for customer protection as set out in the Supplier Handbook also contribute to costs associated with the disconnection process. Total Obligatory Costs 2015 and % 70.00% 75.62% 71.95% 60.00% 50.00% 40.00% 30.00% 20.00% 10.00% 0.00% Energy Efficiency Obligation Scheme 0.04% 20.28% 0.03% 2.82% 15.82% Electricity & Gas Allowance 2.59% Supplier Handbook Meter Tampering, Revenue Protection & disconnection process 0.06% 0.19% Green Source Products Audits & Fuel Mix Disclosure 3.39% 4.13% Regulation Human Resources 0.22% 0.65% 0.34% 0.27% 0.97% 0.39% Annual CER Supplier Audits Retail Market Monitoring Long term Consumption Adjustment (LTCA) Figure 3.4, Total Obligatory Costs 19
21 As shown in figure 3.5 below, there are a number of differences between obligatory costs reported for gas and electricity. This may be due to the allocation of costs different suppliers have submitted based on internal cost reporting across each business. For the purposes of anonymity of supply costs the majority of figures in this paper are also presented in terms of percentages and on an aggregate basis, which does not give a complete picture of the scale of cost differences between gas and electricity For example, the cost associated with the EEOS amount to 86% of obligatory costs in electricity and 38% of costs in gas. Disconnections and revenue protection accounts for 9% of obligatory costs in electricity and 45% of costs in gas. This may also demonstrate different procedures that may apply due to safety differences between both energy sources. The total cost reported for disconnections and revenue protection for 2016 across all suppliers was 2,762,000 for electricity compared to 4,233,000 for gas. 0.24% 1.48% 0.00% 2.12% Obligatory Electricity Costs % 8.98% 0.40% 0.29% 0.29% 86.09% EEOS Electricity Allowance Supplier Handbook Disconnection & revenue protection Green Source Products & Fuel Mix Regulation Human Resources CER Supplier Audits Retail Market Monitoring LTCA PAYG certificate 0.09% 45.15% 1.14% Obligatory Gas Costs % 9.12% 0.03% 38.18% 0.16% 5.62% EEOS Gas Allowance Supplier Handbook Disconnections & revenue protections Green Source Products & Fuel Mix Regulation Human Resources CER Supplier Audits Retail Market Monitoring LTCA Figure 3.5, Obligatory Electricity and Gas Costs Overall obligatory costs have increased by 0.8% between 2015 and While these costs have increased, total obligatory costs amount to circa 1% of the overall costs (0.7% in 2015 and 0.9% in 2016). The table below illustrates how these Supply Costs have changed between both years. 20
22 Category % of obligatory costs 2016 % change between 2015 and 2016 EEOS 76% 3.67% Electricity & Gas Allowance 0.03% -0.01% Supplier Handbook 3% 0.23% Meter Tampering, Revenue Protection & disconnection 16% -4.46% process Green Source Products Audits & Fuel Mix Disclosure 0.19% 0.13% Regulation Human Resources 4% 0.75% CRU Supplier Audits 0.22% -0.04% Retail Market Monitoring 0.65% -0.33% LTCA 0.34% -0.05% PAYG certificate 0.18% 0.11% Table 3.3, % change in energy costs between 2015 and 2016 Drivers of change Below we outline some of the principle areas where costs have changed between both years in addition to the CRU s understanding of what may have driven such changes in costs between years was the final year for Suppliers to meet their requirements under the current EEOS scheme. As such, the increased costs may be reflective of a ramping up by Suppliers in order to meet their requirements. Between 2015 and 2016 a review and consultation process of the Supplier Handbook took place, during which time suppliers took part in a number of workshops and responded to consultations as part of this process A decision on green source products was made in 2015 requiring suppliers to complete an audit on any green source products they offer. Revised retail market monitoring requirements were introduced in 2015 and the project costs associated with this would mainly have been incurred by suppliers in this year, explaining the decrease in cost between 2015 and Between 2015 and 2016 there was an increase in the costs of PAYG meters for suppliers who provide such meters as a business model. This was due to a requirement for safety certification of the meter installs imposed on Suppliers. It should be noted that as not all Suppliers operate such a business model, this cost was faced only by some Suppliers. 21


23 Energy Efficiency Obligations Scheme The EEOS requires all energy distributors and suppliers with sales above a certain volume to achieve a defined amount of energy savings each year by working with energy users in the residential, commercial or public sector. The purpose of the Energy Efficiency Obligation Scheme is to help Ireland meet its obligations under Article 7 of the Energy Efficiency Directive 4 in a cost-effective way. Ireland has opted to use a combination of a supplier obligation scheme and a suite of alternative policy measures to satisfy its overall target. The Energy Efficiency Obligations Scheme places obligations on energy suppliers to deliver energy savings. It is administered by SEAI and applies across all energy types including electricity, gas and solid fuel. As noted in the preceding sections of this paper, the Energy Efficiency Obligations Scheme accounts for the majority of obligatory costs, which together account for approximately 1% of total supply cost components. However, Obligatory costs account for approximately 10% of supplier specific costs excluding fuel and network costs. Analysis of the ratio of cost per KWh of the EEOS based on supplier submissions from 2015 and 2016 is shown below. This shows the ratio between either end of the cost scale in terms of delivery of energy efficiency. However, it should be noted that this illustration is based on an inferred supplier s share of the total energy target within a year (550 GWh). This does not take into account any over-delivery of savings that may have been made in the two years for which the CRU has Supplier data. EEOS per MWh Overall 1 : 2 1: 4 Table 3.4 The average cost per kwh of the EEOS scheme was 4.4c per kwh in 2015 and 5.6c per kwh in 2016, an increase of 27% overall. However, from the data provided to the CRU there is a large range in the cost of the EEOS scheme across different suppliers. In inferring this average cost the CRU has divided the total costs provided by suppliers for the EEOS scheme by its inferred supplier shares of the EEOS targets for obligated parties. Obligated parties include those in the oil, peat, electricity and 4 Available at: 22
24 gas energy areas. As such, suppliers in the gas and electricity market only make up a proportion of the total obligations across energy distributors. Again it should be noted that this does not take into account any savings that may have been made above the targets for electricity/gas suppliers. Sectoral targets A total obligation of 550GWh annual savings target applies across all obligated parties. This target is sub-sectoralised as 75% non-residential, 20% residential and 5% energy poverty residential, with cumulative targets being applied. The average EEOS costs per kwh saved, calculated above, do not distinguish between the three targets. It is the CRU s understanding that energy efficiency savings can generally be achieved at a lower costs in the non-domestic sector, and this is reflected in the buyout prices for each sector. While the cost of delivering energy savings is typically higher in the domestic sector and higher again in the energy poverty sector, energy suppliers can choose to achieve some or all of these targets by working in partnership with existing government grant schemes, such as Better Energy Homes and Better Energy Communities. These grant schemes provide up to 30% of the funding towards residential measures and up to 95% of the funding for homes in energy poverty. Any obligated party can choose to purchase up to An obligated party refers to a 30% of their required energy savings by paying supplier or distributor of energy into a fund operated by the Minister for selling more than 600 GWh of Communications, Climate Action and Environment. energy per year. The buy-out price for each category of energy savings 5 is set at the approximate cost borne by the Government in delivering energy savings directly through the SEAI-administered, Better Energy Programme. These buy-out prices act as a price ceiling, since any obligated party faced with a higher cost of delivery could choose to avail of the buy-out price. To date, no obligated party has decided to buy-out any of their energy savings target. From the CRU s analysis it appears that all suppliers are able to deliver the required energy savings below the buy-out price in each category. 5 6c per kwh of energy saved in the non-domestic sector, 20.4c per kwh in domestic, 88c per kwh in energy poverty. 23
25 24
26 3.4 Future Obligatory Costs One of the key aims of this paper is to understand what element of Supply Costs is composed of Obligatory Costs, either those required by the CRU as the regulator or by government or European policies. Increasing transparency and understanding the costs associated with policy decisions helps to inform policy decisions. A number of Obligatory Costs have been discussed in this chapter and there are a range of areas where additional costs may be imposed on suppliers based on future policies or the implementation of recent decisions. As such, the CRU may be interested in tracking the cost impact of implementing these policy decisions in future. Three policy areas where future obligatory costs may arise for suppliers are detailed below. Smart Metering The National Smart Metering Programme (NSMP) is a plan for transforming how electricity and gas retail markets operate. It involves the roll out by ESB Networks and Gas Networks Ireland of new meters, a communications network to support them, and investment in new IT systems by ESBN, GNI and Electricity and Gas Suppliers. Supplier Handbook The review of the Suppliers Handbook began in 2015 and the CRU published a consultation paper on proposed changes in February After an open consultation process, the CRU published a Supplier Handbook Decision and a further Consultation paper in November 2016 (CER/16/287). That paper set out the CRU s policy decisions while also outlining some further decision areas, primarily related to implementation. The final Decision Paper published in April 2017 followed an extensive process of engagement with stakeholders including suppliers, consumer interest groups and external agencies such as the Consumer & Competition Protection Commission, the Economic & Social Research Institute (ESRI) Price Lab and the Central Bank of Ireland. Implementation of a number of these decisions may have associated costs in terms of the additional information suppliers will be required to provide to consumers. The CRU is interested in potentially monitoring specific costs associated with Supplier Handbook implementation. 25
27 EEOS In 2016, the Department of Communications, Climate Action and Environment (DCCAE) ran a public consultation on the Energy Efficiency Obligation scheme. The consultation sought input on whether the Department should consider any changes to the operation of the next phase of the Energy Efficiency Obligation Scheme. As a result of this consultation, three main changes are being made to the scheme as of These are to: Increase the collective energy savings target from 550GWh per annum to 625GWh in 2017, rising to 700GWh for each year ; Reduce the threshold for participation in the scheme from 600GWh annual final energy sales to 240GWh annual final energy sales; & Lengthen the next phase from 3 to 4 years. These changes may also have an impact on supplier costs. Key Points and Summary of findings Sales, advertising, customer acquisition and retention costs form a significant part of total supplier costs, and depending on the supplier these costs can be focused on branding, acquiring new customers through discounted price plans or retaining customers. The information presented in this paper on these costs is only a snapshot in time and this is a dynamic and constantly changing area for suppliers. It appears from the CRU s analysis that there are economies of scale for sales and advertising costs, with suppliers with less than 5% market share spending more on a per customer basis as they try to gain new customers. Bad debt accounted for 12.7% of total supply costs in 2015 and 9.6% of total supply costs in The total weighted average cost of bad debt decreased by 3.1% between 2015 and This may reflect improvements in economic conditions, as shown in the falling number of disconnections and financial hardship PAYG installs as published in the CRU s quarterly market monitoring reports. Obligatory costs account for just under 10% of supply costs and approximately 1% of total costs and appear to have increased between 2015 and These increased costs are associated with energy efficiency and increased customer protection, both measures which are required to ensure Ireland meets its climate change targets as well as 26
28 ensure that customers disconnections are undertaken in a standardised process across all suppliers. Obligatory costs have increased by 0.8% between 2015 and The Energy Efficiency Obligations Scheme accounts for 76% of total obligatory costs and increased by 3.67% between 2015 and Meter tampering, revenue protection and the disconnection process accounts for 16% of obligatory costs followed by regulation human resources (4%) and the Supplier Handbook (3%). 27

29 4 Retail Margins As part of the request for information from suppliers, the CRU has received information on total revenues and total costs of electricity and gas. From this data the CRU can calculate an inferred margin across suppliers. The weighted average margins across all suppliers are indicated below for the two years of submitted data. Inferred Retail Margins 2015 average 2016 average Total 2.32% 3.48% Table 4.1 In addition to the RFI, the CRU also receives audited accounts from Suppliers and data on retail margins from suppliers with above 5% market share. The CRU has compared inferred margins calculated for 2015 and 2016 across suppliers to audited accounts from suppliers on retail margins for 2014 and Data for 2016 is not yet available. Broadly, the inferred margins for 2015 fall within the same range as the audited accounts submitted by Suppliers above a 5% market share. Inferred margins refer to the difference between total revenue and total costs of Suppliers using a weighted average across all Suppliers. CRU analysis In order to conduct analysis the CRU has compared the inferred margins against regulated margins seen in either Ireland or in other jurisdictions. Before full deregulation of the gas and electricity retail markets, the CRU was responsible for setting the final tariff that gas and electricity customers paid, which included a regulated margin. In addition, we have assessed the inferred margins against margins seen in the UK energy market, and against data available from the services industry. Prior to price deregulation, the regulated margins for Bord Gáis Energy (gas) and ESB Public Electricity Supply were 2% and 1.3% respectively. At the time of these margins the CRU considered that this was an appropriate margin, given that there was no volume risk associated with being regulated i.e. if the company did not recover its full costs within a year then it would be recovered in future periods. Comparative retail margins in Northern Ireland (UR) and the UK are also shown below to illustrate the range of comparable regulated margins in the water and energy sectors. 28
30 Margin/Turnover Water Industry Commission ( (2005) UR ( 2009) UR ( 2011) CER ( 2012) 0.00% 0.50% 1.00% 1.50% 2.00% 2.50% 3.00% 3.50% Margin/Turnover Figure 4.1 In contrast, in a competitive market a Supplier does face competitive pressures. This is because they face an element of volume risk in the market i.e. forecasts may not match actual demand, leaving a shortfall in expected revenue. For example, the CRU has compared the margins seen with those in the UK energy market and in other (non-energy sectors). In the UK, Ofgem (the UK energy regulator) requires the Big six energy suppliers to publish yearly reports indicating, amongst other things their supply margins. The average margins across the Big 6 was 3.06%, with a range between -1.6% and 5.7% margin 6. The inferred margins from Irish suppliers is at a level that is not dissimilar to the average UK margin. Energy retail margins (in percentage terms) are lower than other sectors, but are based on high volume transactions. For example, the Office of National Statistics (ONS) in the UK indicates that the margin in the UK services industry in 2016 is c. 17%. However, there are large differences in other sectors. For example, the UK Oil & gas average margin in 2016 was 4.2%. 6 A simple average has been applied, as opposed to a weighted average 29
31 In summary, the CRU concludes the following; The inferred retail margins are, on average across Suppliers at a level that is higher than previously regulated margins. Given that we might expect margins in a competitive market to differ from those of a highly regulated market, this is not of itself a cause for concern at this point. However, the CRU does note that the inferred margin did increase between 2015 and 2016 from 2.3% to 3.4%.The CRU recognises that margins vary over time depending on the timing of changes in prices and costs and it is important to note that the data set is short. However, the CRU has compared the data set to the margins received from Suppliers through its current market monitoring function which are currently available for Broadly speaking the inferred and actual margins are comparable. From the data presented there is a marked difference between electricity and gas with a higher inferred margin growth in gas, particularly in the dual fuel sector. It appears that the margin on electricity is lower. Indications from the CRU s own retail model which has been updated for the purposes of this paper indicate that supply costs, and potentially margins were reduced in the year compared to 2016, underlining the need to monitor this trend over a longer period of time. Where such monitoring indicates that changes in prices are not reflective of underlying cost changes, then the CRU will take action to ensure customer s interests are protected. This will include monitoring differences in margin levels between electricity and gas retail markets. Key Points and Summary of findings Average margins were 2.32% in 2015 and 3.48% in 2016 and have been compared to regulated retail margins in electricity and gas and margins across other industries. CRU data has been compared to inferred margins for 2015 and 2016 calculated from supplier submissions of total revenues and total costs as part of this RFI. Whilst these margins are not a cause for concern at this time, the CRU will continue to monitor changes in final retail prices, to ensure they are reflective of underlying cost changes. 30

32 5 Components of a final retail bill This chapter presents information on the components of a final customer s retail bill based on the CRU s model. Updates to this model since the Review of Competition are also published here. All final retail bills are made up of a number of components (wholesale gas or electricity, network charges and supply costs). Wholesale costs continuously change as they are impacted by movements in the market, such as the trading price for natural gas in a given period. In the CRU s Review of Competition a breakdown of electricity and gas cost components over time was presented based on the CRU s internal Retail tariff model. Analysis conducted for both electricity and gas found that there appeared to be an increase in the difference between the total wholesale and network costs and the average retail price between 2013 and For the purposes of this information note, the CRU has updated the gas and electricity models to reflect suggestions for improvements received from stakeholders in responses to the review of Competition and to present analysis over a longer time period. This aspect is covered by Action 3 of this Information Note. The CRU also concluded that more work was required to understand the components of supply costs separate to wholesale and network costs. This aspect is covered by Action 1 and Action 2 of this Information Note. The calculations presented in this model are also compared to a breakdown of weighted average components of the final retail bill inferred from submissions from suppliers. 31
33 5.1 Final Price Components Before electricity or gas is delivered to the final customer s home it passes through a number of stages. Therefore, the final retail price seen on a bill reflects the generation or extraction Final Price components relates of energy, the selling of that energy on wholesale to wholesale, networks, supply markets, the cost of delivery to a household costs and margin for a Supplier. (network costs) and the cost to serve the customer (supply costs). In addition, a margin is included. Below illustrates the various stages in the energy supply chain. Wholesale Cost Network Costs Supply Costs Levies and Taxes Final Retail Price Upstream Wholesale Market Networks Suppliers Gas Gas is extracted from production fields globally and within Ireland. It can be transported via pipelines or LNG ships. A virtual hub where gas is bought and sold for delivery. Gas Shippers pay the network operator to enter and exit gas onto the transmission and distribution systems. The supply chain ends when Suppliers compete to sell the gas to customers. Electricity Electricity is generated from a number of sources including coal, gas, wind and hydro. Ireland also imports and exports electricity to Britain via interconnectors. Generators bid their costs into the SEM and half hourly prices are formed. Suppliers pay the network operator to transmit energy through the wires in the network. The supply chain ends when Suppliers compete to sell electricity to customers. 32
. Wholesale costs One of the primary components of final retail prices is the cost of wholesale energy.")

34 Wholesale costs refer to the commodity price for gas traded in the wholesale market. For electricity, wholesale refers to the price set by the mandatory pool where all generation must bid their costs. This price is known as the System Marginal Price (SMP). Wholesale costs One of the primary components of final retail prices is the cost of wholesale energy. The variation in wholesale market prices is outside the control of suppliers and the CRU. As the Irish energy mix is highly dependent on natural gas, this is a major factor in determining final retail prices as the price of electricity will often reflect movements in the natural gas price. Up until the end of 2015 Ireland imported circa. 95% of all gas requirements from Britain via subsea interconnectors with the remainder coming from the Kinsale gas fields off the coast of Cork. Therefore the wholesale price of gas in Ireland was set by reference to the wholesale price at the trading hub in Britain (National Balancing Point or NBP) plus the cost of transport to Ireland via the interconnectors. In December 2015, commercial gas from the Corrib gas fields in Mayo began production and now provides up to 60% of peak day gas demand in Ireland. Although Ireland is now primarily supplied by indigenous gas sources, the wholesale price has continued to be set by reference to the wholesale price at the NBP. The map below illustrates the three points where gas enters the Irish gas network. Hedging Gas can be sold at the trading hub for delivery at different times. This can include Month Ahead, Day Ahead and Within Day gas products. For example, a Supplier may wish to purchase part of its customers demand for the forthcoming year based on patterns of consumption from previous years. This is called hedging and can help to reduce price volatility for customers. An example is shown below where a percentage of the gas requirements for delivery in each month is bought gradually ahead of the month in which the gas will be required. This hedging strategy is a simplified example, as it illustrates a 10 33
 or even beverages (coffee). month strategy, with equal amounts of gas requirements bought each month.")

35 Hedging is a purchasing strategy used by Suppliers whereby some or all future energy requirements are bought ahead of delivery time. Similar strategies can be seen in other sectors such as aviation (oil) or even beverages (coffee). month strategy, with equal amounts of gas requirements bought each month. This is known as a laddered approach to hedging, as illustrated by the green shaded area. Suppliers develop different hedging strategies which aim to smooth the impact of buying gas at different prices and allow price stability for customers. Oct-16 Nov-16 Dec-16 Jan-17 Feb-17 Mar-17 Apr-17 May-17 Jun-17 Jul-17 Oct % 90% 80% 70% 60% 50% 40% 30% 20% 10% Nov % 90% 80% 70% 60% 50% 40% 30% 20% Dec % 90% 80% 70% 60% 50% 40% 30% Jan % 90% 80% 70% 60% 50% 40% Feb % 90% 80% 70% 60% 50% Mar % 90% 80% 70% 60% Apr % 90% 80% 70% May % 90% 80% Jun % 90% Figure 5.2 As a large proportion of electricity requirements are generated from natural gas there is a correlation between natural gas prices and SMP in electricity. In addition, the Single Electricity Market (SEM) has interconnection (interconnectors are the physical links which allow the transfer of electricity across borders) with the British wholesale market via the Moyle Interconnector and the East West Interconnector (EWIC) which can influence the price. Network costs Network costs relate to the charges that the CER sets for use of the electricity and natural gas networks. Network providers in Ireland are monopoly service providers, meaning they do not face competition from other operators. Therefore, the revenues they are permitted to earn and the tariffs they may charge are the subject of regulation by the CRU. This ensures that the investments made are efficient and in the interest of all energy customers. Network activities such as electricity transmission and distribution are considered to be natural monopolies requiring price regulation. 34


36 Company Responsibility Transmission System Operator Plans the development of the transmission network A subsidiary within ESB Group Finances, builds and maintains the transmission system Finances, builds operates, maintains and develops the distribution system Transmission System Operator Distribution System Operator Develops, plans and operates the transmission and distribution systems How their revenues are recovered? Transmission Use of System (TUoS) Charges Distribution Use of System ( DUoS) charges Capacity Charges Commodity Charges The CRU undertakes revenue reviews known as Price Controls or Price Reviews for EirGrid and ESB Networks in electricity, and for Gas Networks Ireland in gas. These revenue reviews consider the costs of developing, maintaining and operating the electricity and gas systems. On the basis of these five yearly revenue controls, the CRU approves the level of charges that the network operators may levy. Each supplier is charged on a per customer basis for access to the electricity or gas networks. Each supplier has discretion in terms of how they pass these costs through to their final customers. In the last number of years for electricity there has been an increase in the network component of the final retail bill. Between 2015 and 2016 the network element increased by 5%. This reflects additional investment in the network, in particular to facilitate increasing levels of renewable generation. 35

37 Gas distribution tariffs increased marginally by 0.2% between 2015 and 2016, whereas gas transmission tariffs fell by 1.3% in the same period. Supply Costs There are a number of operating costs faced by Suppliers including obligatory costs such as government policy and regulatory costs. In addition, there are costs to serve customers for aspects such cost as advertising, customer care and billing. This is the focus of this Information Note. Taxes and Levies In addition to recovering the costs associated with wholesale, network and supply costs, there are other taxes and levies that suppliers are required to levy on customers. This includes the PSO levy, carbon tax and VAT. The PSO for example, is a subsidy charged to all electricity customers in Ireland. It is designed by the Irish government and consists of various subsidy schemes to support national policy objectives related to renewable energy, indigenous fuel (peat) and security of energy supply. The proceeds of the levy are used to Taxes and levies include the Public Service Obligation (PSO), Carbon tax and VAT. The PSO is a support mechanism to support national energy policy objectives such as renewable energy, security of supply and indigenous fuel. contribute to the additional costs incurred by PSO-supported electricity generators which are not recovered in the electricity market. The Carbon tax was introduced in 2010 and applies to mineral oils, natural gas and solid fuels supplied for combustion in Ireland. All gas suppliers must apply this tax to customer s bills. This energy tax was introduced as a means to incentivise manufacturers and suppliers to provide low carbon services and products to the household consumer market. 36
38 5.2 CRU Electricity Model Previous Electricity Model assumptions The assessment carried out for the Review of Competition used a bottom up calculation of the costs to serve a customer. This included data collected on the System Marginal Price (SMP) per MWh of electricity between 2013 and 2016, and the annual average bill of electricity customers based on 5,300 7 KWh of consumption to estimate the wholesale energy cost component of the average annual bill. The weighted average SMP price based on a half hourly domestic consumption profile was calculated to give the price for 5,300 KWh of consumption over one year, and the wholesale price was estimated by including market operator costs, capacity costs, imperfection costs, and taking into account distribution loss adjustment factors for distribution connected customers. Network costs were calculated by including transmission charges and distribution charges between 2013 and The weighted average retail price for each year was calculated based on the average annual standard bill of all suppliers, excluding PSO and VAT, taking into account the number of customers per supplier for each year, taken from a point in time each year between 2013 and Updates to Electricity Model The CRU has updated the electricity model since the publication of its review of competition paper. The changes made to the model are outlined below; The typical consumption value for electricity has been updated to 4,200kWh, as per the CRU s decision paper published in March 2017 (CER17042) which introduced revised typical annual consumption figures for electricity and gas. The weighted average SMP price per year (weighted according to a domestic customer demand profile over a year) has been updated up to August 2017, reflecting increases in wholesale prices at the end of 2016 and in the first part of The weighted average SMP is now taken from October to October rather than on a calendar year basis to reflect changes in network tariffs which are introduced at this time each year. This has been updated and the average 7 5,300 KWh as an average has since been updated. 37
39 SMP price across the tariff year is weighted according to a typical domestic consumption profile. In contrast to the previous CRU retail model, the estimated bill was based on a standard tariff only. As a range of customers are on discount plans, this is not representative of the market as a whole. Therefore, to better represent a supplier s mix of customers, the CRU has taken three retail bill scenarios. The first scenario is for a 100% standard plan. This will give rise to the highest retail bill. The second scenario is a blended 70:30 standard to discount plan. The final scenario is based on the best available discount plan across all suppliers 8. Cost components for VAT and the PSO have been included per year, in order to present a typical final retail bill for customers. The results of these three scenarios are outlined below for 2016/ % 2016/17 Electricity Cost Components (CER model) 35.00% 30.00% 33.73% 34.06% 31.33% 31.63% 30.40% 30.69% Standard Tariff Calculation 25.00% 20.00% 11.89% 19.60% 17.51% Discount Tariff Calculation 15.00% 10.00% 5.00% 8.23% 7.41% 7.64% 11.89% 11.89% 12.08% 70% standard and 30% discount Calculation 0.00% Wholesale estimate Transmission & Distribution costs PSO Tax Supply Component Figure 5.3 As each retail bill will differ the difference between the combination of wholesale and network ( which remains static across all retail bill scenarios) will give rise to 8 Standard tariffs are based on the weighted average standard plan offered by suppliers, while discount tariffs are based on the weighted average of the best available discount plan across suppliers. 38

40 different percentages of Supply costs ranging from c.12% ( 100% discount) to c. 20% for a standard plan. In the CRU s view, analysis from retail market monitoring indicates that a blend of 30% of customers on a discount tariff and 70% of customers on a standard tariff is broadly representative of suppliers in the market. Electricity Model Cost Components 2016 ( 70:30 retail bill) Wholesale Network Supply Taxes and levies 31.33% 31.63% 17.51% 19.53% Figure
41 Electricity Cost components (5 years) Having considered the retail tariff using a range of tariff scenarios, and having concluded that the 70:30 standard to discount ratio is broadly representative of the market, Figure 5.5 presents electricity cost components (in monetary terms) from the 2012/13 tariff year to the 2016/17 tariff year Electricity Bill Cost Components / / / / /17 Wholesale estimate Transmission and Distribution costs Supply Component PSO Tax Figure 5.5 As can be seen above the Supply component in 2015 is larger than previous years. From the analysis of information submitted by Suppliers it appears that Supply Costs did increase marginally between 2015 and 2016 (8.10% in 2015 and 9.50% in 2016). However, in the CRU model supply costs in 2015/16 are significantly higher than 2014/15. This may suggest that although wholesale prices began to decrease from 2014 the corresponding decrease in the final retail tariff may have initially (across all suppliers) been conservative in 2015, potentially due to some of the energy costs having been hedged at higher prices. In 2016, as wholesale prices continued to be lower it would appear that retail prices continued to decline and were passed through to customers. The observations from the CRU model are also premised on a comparatively blunt hedging strategy of the daily SMP price, whereas some of the difference may also be attributable to different hedging strategies e.g. some suppliers may have contracts purchased in a forwards market i.e. before delivery, to cover some of their customer demand. As shown in Chapter 2 of this information note, the wholesale and network cost components as reported by suppliers are not directly comparable to the figures 40
42 presented in figure 5.4 in terms of their percentage breakdown. This is because the CRU model as updated in this paper presents all components of a final retail bill (including taxes, levies and margins within supply costs), whereas Chapter 2 presents the costs directly attributable to suppliers only i.e. it does not include taxes, levies and margins. In addition, components of a domestic customer s bill are presented here while Chapter 2 presents costs for domestic and non-domestic customers. Comparison with Supplier s submissions In order to assess the validity of the CRU retail model and the results presented in Figures 5.3 to 5.5 we have taken the total cost components as submitted by Suppliers, including wholesale, network and supply costs (including margin). These total costs have been related back to the CRU model of the final retail bill, by taking each component (as submitted by Suppliers), working out a cost per unit (kwh) and then multiplying a weighted average cost per unit to an average customer of 4,200 kwh. This is compared to supplier s submissions for 2015 and 2016 below for two reasons; 1. To validate the range of costs submitted by suppliers at a high level against the CRU s data. 2. To understand where there are differences between the CRU s model and supplier s data and the drivers for these. The differences are outlined below, with an indication of why there may be differences between the CRU model and Supplier data. Final Components of a domestic electricity retail bill for 4,200kWh of consumption CRU Model Supplier Data Rationale for difference Wholesale costs 31.33% 26.54% Different hedging strategies Transmission and Distribution Costs Supply Component 31.63% 38.57% CRU model optimises network costs whereas Suppliers with a portfolio are likely to have fluctuating network charges dependent on customer profiles/numbers % 17.93% The CRU model includes an implicit margin, whereas Supplier data here includes a combination of reported supply costs and inferred margins. 41
43 PSO 7.64% 7.7% No difference Taxes and Levies 11.89% 11.89% No difference Table 5.1 As can be seen from table 5.1, the main difference between the CRU s model of cost components and the costs reported by suppliers relates to the breakdown of wholesale costs and transmission and distribution costs and the main differences may be due to the CRU s assumptions around hedging for electricity suppliers. The CRU s model only concludes that there is an inferred CRU Supply Costs (and margin) of 17.51%. Cross validating the results against the Supplier submitted data indicates that Supply Costs and inferred margins amount to 15.29%. This difference in percentages could again be attributed to the CRU model s limitations in terms of capturing the hedging strategies for different suppliers as well as limitations in terms of inferring the margin of Suppliers. 5.3 CRU Gas Model A similar assessment was also conducted for the gas market. Wholesale costs are based on the National Balancing Point (NBP) 9 price of gas, which was converted to Euros per MWh, as the NBP price is set in Sterling. Consumption for a typical customer was split out across each month based on Gas Network Ireland s NDM 10 profile for domestic customers 11, which sets out the yearly profiles for gas consumption. For gas, transmission tariffs consist of capacity and commodity charges that apply for the use of the high pressure transmission natural gas network systems. All natural gas in Ireland flows through the transmission system, and some gas customers such as power generation plants are directly connected to the transmission system. 9 The NBP is the virtual trading hub in Britain where gas is traded. 10 Non Daily Metered is the meter type applicable to a domestic gas customer 11 See the following link for details of Gas Networks Ireland s NDM Profile Model Methodology; 20Industry%20Documents/GNI%20Files/Capacity%20Register_FAR%20Procedure/BGN%20NDM%20Profile%2 0Model%20v8.0.pdf 42
44 Distribution tariffs also consist of capacity and commodity charges, and are for the use of the lower pressure system where all domestic dwellings are connected. An (arbitrary) hedge of 50% of consumption for a customer for a particular month bought a year in advance and 50% bought based on the average NBP price within the month of delivery was assumed for the purpose of the calculation of the estimated wholesale price, based on 13,800 kwh 12 of consumption annually. Network costs were added to this to estimate the total wholesale and network price. The final retail price of gas is based on the CRU s market monitoring of supplier prices over time, and was calculated as a weighted average of the prices of all standard plans at a point in time each year, excluding Carbon Tax and VAT, based on the customer numbers of each supplier over time. Updates to Gas Model The CRU has updated the gas model to reflect suggestions for improvements received from stakeholders in response to the review of Competition, outlined below as well as to reflect the changes in the application of tariffs to derive the final retail price, consistent with the electricity model. National Balancing Point (NBP) is the trading hub where gas is traded in Britain. The typical consumption value for gas has been updated to 11,000kWh, as per the CRU s decision paper published in March which introduced revised typical annual consumption figures for electricity and gas. The weighted average NBP price has been updated to August 2017 and is based on Gas Network Ireland s NDM 14 consumption profile during the year for domestic customers. Simply put this shows how gas customer typically consume gas month-to-month. The assumed hedge for gas has been changed to 80% of gas bought one year in advance, with 20% bought at the day ahead price. While the CRU realises that in reality hedges may be more complex than presented in the 12 This consumption figure is currently used on price comparison websites. However, the CER is currently in the process of revising this consumption figure. 13 CER Non Daily Metered is the meter type applicable to a domestic gas customer 43
45 CRU model, suppliers all have different hedging strategies which cannot be captured here. Analysis of both day ahead and month ahead NBP prices has been included. Network cost data has been updated to reflect network tariffs across each year 15. Previously the CRU used ACER/CEER data on network cost components which the CRU feeds into. Cost components for Carbon Tax and VAT have been included per year. The CRU has compared the components of costs based on a weighted average standard price bill, a weighted average discount price bill, and a combination of both in order to see the effect on inferred supply costs. Data on the components of costs as submitted by suppliers has also been compiled for comparison with the CRU model. Based on these changes, an updated breakdown of the components of the final gas bill for a customer with typical consumption of 11,000kWh in 2016 is shown below. This is based on the estimated cost components for a standard tariff, a discount tariff 16 and a combination of both. 15 For transmission this includes entry commodity and capacity charges, exit commodity and capacity charges and for distribution this includes commodity and capacity charges. 16 Standard tariffs are based on the weighted average standard plan offered by suppliers, while discount tariffs are based on the weighted average of the best available discount plan across suppliers. 44

46 40.00% 35.00% 30.00% 24.94% 2016/17 Gas Cost Components (CER Model) 36.41% 35.32% 35.64% Standard Tariff Calculation 25.00% 20.00% 24.20% 24.42% 23.21% 22.63% 21.21% Discount Tariff Calculation 15.00% 10.00% 5.00% 5.38% 5.54% 5.42% 11.89% 11.89% 11.89% 70% standard and 30% discount Calculation 0.00% Wholesale estimate Transmission & Distribution costs Carbon Tax Tax Supply Component Figure 5.6 Gas Model Cost Components 2016 ( 70:30 retail bill) Wholesale Network Supply Taxes and levies 24.42% 35.64% 22.63% 17.32% Figure
Electricity and Gas Retail Markets Report Q3 2017
 An Coimisiún um Rialáil Fóntas Commission for Regulation of Utilities Electricity and Gas Retail Markets Report Q3 2017 Information Paper Reference: CRU 17354 Date Published: 20/12/2017 Public/ Customer
2017 Electricity and Gas Retail Markets Annual Report
 An Coimisiún um Rialáil Fóntas Commission for Regulation of Utilities 2017 Electricity and Gas Retail Markets Annual Report Information Paper Reference: CRU18126 Date Published: 06/07/2018 An Coimisiún
Electricity and Gas Retail Markets Report Q3 2018
 An Coimisiún um Rialáil Fóntas Commission for Regulation of Utilities Electricity and Gas Retail Markets Report Q3 2018 Information Paper Reference: CRU19014 Date Published: 14/02/2019 An Coimisiún um
Electricity and Gas Retail Markets Report Q1 2018
 An Coimisiún um Rialáil Fóntas Commission for Regulation of Utilities Electricity and Gas Retail Markets Report Q1 2018 Information Paper Reference: CRU18210 Date Published: 26/09/2018 An Coimisiún um
Pass Through Costs for Business Electricity Customers from 1st October 2017
 An Coimisiún um Rialáil Fóntas Commission for Regulation of Utilities Pass Through Costs for Business Electricity Customers from 1st October 2017 Information Paper Reference: CRU 18083 Date Published:
Green Source Product Verification Report 2017
 An Coimisiún um Rialáil Fóntas Commission for Regulation of Utilities Green Source Product Verification Report 2017 Information Paper Reference: CRU18204 Date Published: 14/09/2018 Closing Date: N/A www.cru.ie
Review of Typical Domestic Consumption. Values for Electricity and Gas Customers. Consultation Paper
 Review of Typical Domestic Consumption Values for Electricity and Gas Customers Consultation Paper Reference: CER/17003 Date Published: 11/01/2017 Closing Date: 13/02/2017 Executive Summary The CER currently
Electricity & Gas Retail Markets Annual Report 2012
 Electricity & Gas Retail Markets Annual Report 2012 DOCUMENT TYPE: REFERENCE: Information Paper CER/13/120 DATE PUBLISHED: 4 June 2013 QUERIES TO: Adrienne Costello acostello@cer.ie The Commission for
Supplier of Last Resort in Prepayment Electricity. Consultation Paper. An Coimisiún um Rialáil Fóntas Commission for Regulation of Utilities
 An Coimisiún um Rialáil Fóntas Commission for Regulation of Utilities Supplier of Last Resort in Prepayment Electricity Consultation Paper Consultation Paper Reference: CRU17333 Date Published: 07/12/2017
Process for entry to. the Irish Retail Gas. Market
 Process for entry to the Irish Retail Gas Market Executive Summary This document outlines and provides information on what is required to enter the Irish retail gas market ( the Market ). Undertakings
Update on the Smart Meter Upgrade
 Update on the Smart Meter Upgrade Information Paper Reference: CER/17/279 Date Published: 21 September 2017 Closing Date: N/A Smart meters are the next generation of electricity and gas meter and are being
Review of the Suppliers Handbook
 Review of the Suppliers Handbook Decision Paper Reference: CER/17/059 Date Published: 13 April 2017 Closing Date: N/A Executive Summary Promoting Competition and Strengthening Consumer Protection The liberalisation
Gas Transmission Charging Methodology Statement. Gas Year 2016/17
 Gas Transmission Charging Methodology Statement Gas Year 2016/17 Contents 1. Introduction... 3 Part A - POSTALISED CHARGES... 6 2. Process for setting Forecast Postalised Charges... 6 3. Calculation of
E.ON s UK Consolidated Segmental Report for the year ended 31 December 2013
 E.ON s UK Consolidated Segmental Report for the year ended 31 December 2013 Introduction In accordance with the Electricity Generation Licence Condition 16 - Financial Information Reporting, and the Electricity
Electric Ireland response to CER/15/272 Proposed Decisions on Empowering & Protecting Customers
 Smart Metering Programme Office Commission for Energy Regulation, The Exchange, Belgard Square North, Tallaght, Dublin 24. 22 nd January 2016 response to CER/15/272 Proposed Decisions on Empowering & Protecting
Counties Power Limited
 Counties Power Limited Electricity Distribution Business Pricing Methodology Disclosure 1 April 2018 to 31 March 2019 Pursuant to Electricity Information Disclosure Information for compliance with Part
Gas Transmission Charging Methodology Statement. Gas Year 2017/18
 Gas Transmission Charging Methodology Statement Gas Year 2017/18 Contents 1. Introduction... 3 Part A - POSTALISED CHARGES... 6 2. Process for setting Forecast Postalised Charges... 6 3. Calculation of
Renewable Energy Transition in the EU, with a Case Study on the Irish Market
 Renewable Energy Transition in the EU, with a Case Study on the Irish Market Andrew Ebrill, Secretary General, CEER VI CEER-ARIAE Meeting 20 April 2017, Panama CEER: Fostering energy markets, empowering
CER National Smart Metering Programme Policy Implementation Roadmap
 CER National Smart Metering Programme Policy Implementation Roadmap DOCUMENT TYPE: REFERENCE: Information Paper CER/15/055 DATE: 31 March 2015 The Commission for Energy Regulation, The Exchange, Belgard
Quick Guide to the I-SEM
 Quick Guide to the I-SEM 1 Contents 1 BACKGROUND... 3 2 THE NEW MARKET THE I-SEM... 6 3 HOW I-SEM WORKS... 7 4 IMPACT ON CONSUMERS... 9 5 I-SEM KEY BENEFITS... 10 Glossary of Key Terms... 11 2 1 BACKGROUND
Establishing Irish Water s Non-Domestic Tariff Framework
 An Coimisiún um Rialáil Fóntas Commission for Regulation of Utilities Establishing Irish Water s Non-Domestic Tariff Framework Information Note Information Note Reference: /17/287 Date Published: 06/10/2017
National Energy Action s Northern Ireland response to the Consultation on extension to programme and reallocation of costs between customer groups
 National Energy Action s Northern Ireland response to the Consultation on extension to programme and reallocation of costs between customer groups May 2015 National Energy Action Northern Ireland (NEA
What are your general views on the idea of a Scottish publicly owned energy company (POEC)?
?") ECONOMY, ENERGY AND FAIR WORK COMMITTEE PUBLICLY OWNED ENERGY COMPANY INQUIRY SUBMISSION FROM SSE What are your general views on the idea of a Scottish publicly owned energy company (POEC)? SSE is one
ECONOMY, ENERGY AND FAIR WORK COMMITTEE PUBLICLY OWNED ENERGY COMPANY INQUIRY SUBMISSION FROM SSE What are your general views on the idea of a Scottish publicly owned energy company (POEC)? SSE is one
Victoria s Electricity and Gas Retail Markets Review
 Summary of Stakeholder Forum The Panel for the Review of Electricity and Gas Retail Markets in Victoria invited stakeholders to attend a Stakeholder Forum on Wednesday, 8 February 2017. A discussion paper
Gas Networks Ireland Renewable Natural Gas Connections Policy Proposals
 An Coimisiún um Rialáil Fóntas Commission for Regulation of Utilities Gas Networks Ireland Renewable Natural Gas Connections Policy Proposals Commission for Regulation of Utilities Consultation Decision
Reverse Charge Gas, Electricity, Gas and Electricity Certificates
 Reverse Charge Gas, Electricity, Gas and Electricity Certificates This document should be read in conjunction with section 16(6) and 16(7) of the Value-Added Tax Consolidation Act 2010 (VATCA 2010) Document
Annual Audit of Compliance for Electricity & Gas Suppliers 2017
 An Coimisiún um Rialáil Fóntas Commission for Regulation of Utilities Annual Audit of Compliance for Electricity & Gas Suppliers 2017 Information Paper Reference: CRU17355 Date Published: 20/12/2017 0
Ibec response to consultation on EEOS
 Ibec response to consultation on EEOS 2017-2019 September 2016 Ibec response to the Department of Communications, Climate Action & Environment (DCCAE) consultation on the Energy Efficiency Obligation Scheme
Audit of Compliance with Deposit Requirements in the Electricity & Gas Supplier Handbook 2016
 Audit of Compliance with Deposit Requirements in the Electricity & Gas Supplier Handbook 2016 Information Paper Reference: CER17052 Date Published: 21/03/2017 Closing Date: N/A 1 P a g e Executive Summary
CER National Smart Metering Programme Status Update
 CER National Smart Metering Programme Status Update DOCUMENT TYPE: REFERENCE: Information Paper CER/16/126 DATE PUBLISHED: QUERIES TO: 15 April 2016 smartmetering@cer.ie The Commission for Energy Regulation,
Irish Water Capital Investments
 An Coimisiún um Rialáil Fóntas Commission for Regulation of Utilities Irish Water Capital Investments Monitoring Report January to June 2017 Information Paper Reference: CRU/18/057 Date Published: 04/04/2018
Retail and Reducing Energy Costs: a Working Group of the Retail Consultation Forum Submission in response to CER Consultation CER/16/031
 Retail and Reducing Energy Costs: a Working Group of the Retail Consultation Forum Submission in response to CER Consultation CER/16/031 Review of the Electricity and Gas Supplier s Handbook 25 April 2016
Findings from 2016 research on attitudes and experiences in the domestic and SME electricity and gas markets in Ireland
 Findings from 2016 research on attitudes and experiences in the domestic and SME electricity and gas markets in Ireland Prepared by Behaviour & Attitudes and The Research Perspective On behalf of the CER
GUIDANCE PAPER: CALCULATION METHODOLOGY FOR DISTRIBUTION LOSS FACTORS (DLFs) FOR THE VICTORIAN JURISDICTION
 FOR THE VICTORIAN JURISDICTION") Level 2, 35 Spring St Melbourne 3000, Australia Telephone +61 3 9651 0222 +61 3 1300 664 969 Facsimile +61 3 9651 3688 GUIDANCE PAPER: FOR DISTRIBUTION LOSS FACTORS (DLFs) FOR THE N JURISDICTION 14 FEBRUARY
Level 2, 35 Spring St Melbourne 3000, Australia Telephone +61 3 9651 0222 +61 3 1300 664 969 Facsimile +61 3 9651 3688 GUIDANCE PAPER: FOR DISTRIBUTION LOSS FACTORS (DLFs) FOR THE N JURISDICTION 14 FEBRUARY
CER s Decision. ESB Networks. Updated PSO Levy Cost Allocation. Methodology
 CER s Decision on ESB Networks Updated PSO Levy Cost Allocation Methodology Decision Paper Reference: CER/17/073 Date Published: 31/03/2017 Executive Summary This paper presents the CER s decision following
Jemena Gas Networks (NSW) Ltd. Jemena's revised 5-year plan: 2015/ /20
 Ltd. Jemena's revised 5-year plan: 2015/ /20") Jemena Gas Networks (NSW) Ltd Jemena's revised 5-year plan: 2015/16-2019/20 CUSTOMER overview february 2015 1 An appropriate citation for this paper is: Customer Overview of JGN s Revised 5-year plan:
Jemena Gas Networks (NSW) Ltd Jemena's revised 5-year plan: 2015/16-2019/20 CUSTOMER overview february 2015 1 An appropriate citation for this paper is: Customer Overview of JGN s Revised 5-year plan:
Staff Paper 12. Update on value chain analysis Introduction
 Staff Paper 12 Update on value chain analysis This staff paper has been produced by our office to assist stakeholders in responding to the Draft Determination. The material reflected in this staff paper
Pricing Methodology for Gas Distribution Services. From 1 October 2018
 Pricing Methodology for Gas Distribution Services From 1 October 2018 Pursuant to: The Gas Distribution Information Disclosure Determination 2012 - Consolidated in 2015 1 INTRODUCTION Vector owns and operates
ScottishPower Consolidated Segmental Statement for the year ended 31 December 2016
 ScottishPower Consolidated Segmental Statement for the year ended 31 December 2016 Required under Standard Condition 16B of Electricity Generation Licences and Standard Condition 19A of Electricity and
2006/07 Annual Performance Report Electricity Retailers
 2006/07 Annual Performance Report Electricity Retailers January 2008 Important Notice This document has been compiled in good faith by the Economic Regulation Authority (the Authority). The document contains
Winter outlook: Energy cost forecast for 2018 and beyond
 Winter outlook: Energy cost forecast for and beyond INTRODUCTION Businesses are facing the tenth successive year of rising energy costs, largely due to the increase in taxes, levies and network non-commodity
Your budgeting companion
 Your budgeting companion October 2018 r Get in touch Page 08001056 of 29 8101 customer_services@orsted.co.uk orstedbusiness.co.uk Page 1 of 29 Budget with confidence Inside this new report, you ll find
Notice of LDZ Transportation Charges
 Notice of LDZ Transportation Charges Effective from 1 st April 2014 1. Introduction This publication sets out the Local Distribution Zone (LDZ) transportation charges which apply from 1 April 2014 for
Meeting the energy audit requirement of the Energy Efficiency Directive
 Meeting the energy audit requirement of the Energy Efficiency Directive & introducing other headline elements of the implementing legislation including CHP provisions Enda Gallagher and Errol Close, Department
Gas Networks Ireland Connections Policy Proposals
 An Coimisiún um Rialáil Fóntas Commission for Regulation of Utilities Gas Networks Ireland Connections Policy Proposals Commission for Regulation of Utilities Consultation Consultation Paper Reference:
REPORT ON CONSULTATION ON DRAFT TRANSMISSION DEVELOPMENT PLAN
 REPORT ON CONSULTATION ON DRAFT TRANSMISSION DEVELOPMENT PLAN 2016-2026 Table of Contents Abbreviations... 3 Glossary... 4 Introduction... 5 Description of Consultation Process... 5 Purpose of the Transmission
22 February 2017 Cork
 VRF Workshop 22 February 2017 Cork 1 Agenda 1. Introduction and EU Context 2. Review of Existing VRF Product Processes Usage to date 3. Industry Views on VRF Tariffing Structure 4. Discussion 5. Next Steps
Ovo Energy Consolidated Segmental Statement
 Ovo its long-term commitment to remain open, fair, and transparent. We believe that all energy companies should be publishing this data so that we can start to rebuild consumer trust in the industry. The
CitiPower Amended Revised Proposed Tariff Structure Statement
 CitiPower Amended Revised Proposed Tariff Structure Statement 2017 2020 This page is intentionally left blank. 2 CitiPower Amended Revised Proposed Tariff Structure Statement 2017 2020 Table of Contents
ESB Networks. New update to the PSO Levy Allocation Methodology
 ESB Networks New update to the PSO Levy Allocation Methodology Version 1.3 March 2017 Table of Contents 1.0 Related Documents... 3 2.0 Summary... 3 3.0 Legal Basis... 3 4.0 Regulatory Requirement... 4
Water Services Innovation Fund
 An Coimisiún um Rialáil Fóntais Commission for Regulation of Utilities Water Services Innovation Fund Report 2017 Information Paper Reference: CRU/17/345 Date Published: 20/12/2017 Closing Date: N/A 0
Energy Retailers Association of Australia. South Australian Energy Market Reform one year on
 Energy Retailers Association of Australia South Australian Energy Market Reform one year on 11 February 2014 This page left intentionally blank 2 Contents Executive summary 4 1 Introduction 7 1.1 Competition
ScottishPower Consolidated Segmental Statement for the year ended 31 December 2014
 Consolidated Segmental Statement for the year ended 31 December 2014 Required under Standard Condition 16B of Electricity Licences and Standard Condition 19A of Electricity and Gas Supply Licences 01 Contents
Newsletter. Roadmap on Electricity Price De-regulation. August 2010
 August 2010 Newsletter The Commission for Energy Regulation (CER) is the independent body responsible for regulating the natural gas and electricity markets in Ireland. To keep our stakeholders informed,
Gazprom Marketing and Trading Retail
 Gazprom Marketing and Trading Retail Gazprom Marketing and Trading Retail (GM&TR) is the energy retail subsidiary of Gazprom Marketing & Trading (GM&T), a 100% subsidiary of OAO Gazprom, the leading global
ALL ISLAND GRID STUDY STUDY OVERVIEW. January 2008
 ALL ISLAND GRID STUDY STUDY OVERVIEW January 2008 1 Study Overview The All Island Grid Study is the first comprehensive assessment of the ability of the electrical power system and, as part of that, the
BUY ASSETS INVENTORY BUSINESSES
 HOW WE BUY ASSETS INVENTORY BUSINESSES AND EXCESS FROM WE WOULD LIKE TO PURCHASE YOUR ASSETS AND COMPLETE PRODUCT INVENTORY AND PAY YOU IN 24 HOURS. Dear friend, We are interested in purchasing your complete
Regulatory Approach to Maintaining Local Security of Supply in Electricity
 An Coimisiún um Rialáil Fóntas Commission for Regulation of Utilities Regulatory Approach to Maintaining Local Security of Supply in Electricity Information Paper Reference: CRU17346 Date Published: 18/12/2017
Electricity Power System Planning
 Chapter 1 Section 1.05 Ministry of Energy Electricity Power System Planning Follow-Up on VFM Section 3.05, 2015 Annual Report Chapter 1 Follow-Up Section 1.05 RECOMMENDATION STATUS OVERVIEW # of Status
Bord Gáis Éireann. Response to CER Strategic Plan
 Bord Gáis Éireann Response to CER Strategic Plan 2014 2018 1 Response to CER Strategic Plan Introduction Bord Gáis Éireann (BGE) welcomes the opportunity to respond to the consultation paper issued by
Gas Networks Ireland Customer Performance Indicators Consultation Paper
 Gas Networks Ireland Customer Performance Indicators Consultation Paper Reference: CER/16243 Date Published: 22/08/2016 Closing Date: 19/09/2016 0 Executive Summary The Commission for Energy Regulation
COMBINED HEAT AND POWER IN IRELAND Update
 COMBINED HEAT AND POWER IN IRELAND 2018 Update COMBINED HEAT AND POWER IN IRELAND December 2018 3 Sustainable Energy Authority of Ireland SEAI is Ireland s national energy authority investing in, and
Improving the way we price our network services. Consultation paper
 Improving the way we price our network services Consultation paper October 2015 Table of Contents 1 Overview... 4 2 Background... 6 3 Purpose... 7 4 Network tariff strategy... 7 4.1 Network tariff reform
CER National Smart Metering Programme Steady State Model BGN Response to CER/13/151 Consultation
 CER National Smart Metering Programme Steady State Model BGN Response to CER/13/151 Consultation Table of Contents 1. Introduction... 3 2. BGN Responses to Consultation Questions:... 4 BGN Response to
Western Australia electricity price trends
 EMBARGOED UNTIL 12.01AM (AEST) ON 14 DECEMBER 2016 Western Australia electricity price trends 2016 Residential Electricity Price Trends report Average residential electricity prices in Western Australia
Principles of implementation and best practice regarding the application of Retail Minus pricing methodologies IRG (05) 39
 39") Principles of implementation and best practice regarding the application of Retail Minus pricing methodologies IRG (05) 39 IRG PUBLIC CONSULTATION DOCUMENT Principles of Implementation and Best Practice
Principles of implementation and best practice regarding the application of Retail Minus pricing methodologies IRG (05) 39 IRG PUBLIC CONSULTATION DOCUMENT Principles of Implementation and Best Practice
Solar feed-in tariff
 Determination 2018 19 Solar feed-in tariff May 2018 Queensland Competition Authority 2018 The Queensland Competition Authority supports and encourages the dissemination and exchange of information. However,
REVIEW 2018 RESIDENTIAL ELECTRICITY PRICE TRENDS REVIEW FINAL REPORT 21 DECEMBER Australian Energy Market Commission
 FINAL REPORT 2018 RESIDENTIAL ELECTRICITY PRICE TRENDS REVIEW 21 DECEMBER 2018 REVIEW INQUIRIES Australian Energy PO Box A2449 Sydney South NSW 1235 E aemc@aemc.gov.au T (02) 8296 7800 F (02) 8296 7899
Review of Typical Domestic Consumption Values for Electricity and Gas Customers CER/17703
 Review of Typical Domestic Consumption Values for Electricity and Gas Customers CER/17703 Review of Typical Domestic Consumption Values for Electricity and Gas Customers CER/ 17703 Consultation response
Further electricity interconnection is needed to exploit the high generation capacity.
 Romania Key Issues Correct and complete transposition of the Third Energy Package and its practical application needs to continue. Romania should complete the corporate governance reform of state-owned
Notice of LDZ Transportation Charges for Northern Gas Networks. To Apply from 1 April 2013
 Notice of LDZ Transportation Charges for Northern Gas Networks To Apply from 1 April 2013 1. Introduction This publication sets out the Local Distribution Zone (LDZ) transportation charges which apply
LDZ Transportation Charges for East of England Distribution Network. Effective from 1 st April 2013
 LDZ Transportation Charges for East of England Distribution Network Effective from 1 st April 2013 Issued 1 st April 2013 Contents Page No 1 INTRODUCTION 2 2 LDZ SYSTEM CHARGES 4 3 LDZ CUSTOMER CHARGES
Engineering, Economics and Regulation of the Electric Power Sector TERM PAPERS
 Engineering, Economics and Regulation of the Electric Power Sector Spring term 2010 Instructor: Ignacio J. Pérez-Arriaga Course number: ESD.934, 6.974 TERM PAPERS Logistics Papers can be prepared individually
EAI Response to CER National Smart Metering Programme, Smart Metering High Level Design proposed decision paper
 EAI Response to CER National Smart Metering Programme, Smart Metering High Level Design proposed decision paper Electricity Association of Ireland Retail Working Group 127 Baggot Street Lower Dublin 2
CRU Report to the Minister: Review of Demand for Water Services
 An Coimisiún um Rialáil Fóntas Commission for Regulation of Utilities CRU Report to the Minister: Review of Demand for Water Services Report to the Minister Reference: CRU/17/339 Date Published: 15/12/2017
ELECTRICITY TRADE AGREEMENT. An Assessment of the Ontario-Quebec Electricity Trade Agreement
 ELECTRICITY TRADE AGREEMENT An Assessment of the Ontario-Quebec Electricity Trade Agreement Spring 2018 About this Document Established by the Financial Accountability Officer Act, 2013, the Financial
GLOSSARY OF DEFINITIONS
 Disclaimer: This document representing the glossary of definitions has been prepared for information purposes only. While every effort has been made to attain complete accuracy herein, the user of this
What is Hourly Pricing?
 What is Hourly Pricing? Hourly Pricing (HP) is a variable rate that changes every hour based on several factors, including: 1. Weather 2. Time of day 3. Season 4. Wholesale power market conditions 5. Other
Reverse Charge Gas, Electricity, Gas and Electricity Certificates
 Reverse Charge Gas, Electricity, Gas and Electricity Certificates This document should be read in conjunction with section 16 of the VAT Consolidation Act 2010 (VATCA 2010) Document last Reviewed October
Costs and benefits of introducing competition to residential customers in England A response to Ofwat s emerging findings
 Costs and benefits of introducing competition to residential customers in England A response to Ofwat s emerging findings Consumer Council for Water Response August 2016 1. Introduction 1.1 The Consumer
Pricing Methodology for Gas Distribution Services. From 1 October 2016
 Pricing Methodology for Gas Distribution Services From 1 October 2016 Pursuant to: The Gas Distribution Information Disclosure Determination 2012 TABLE OF CONTENTS 1 Introduction... 2 2 Regulatory context...
DANISH ENERGY REGULATORY AUTHORITY RESULTS AND CHALLENGES
 1 DANISH ENERGY REGULATORY AUTHORITY RESULTS AND CHALLENGES 20 13 DANISH ENERGY REGULATORY AUTHORITY RESULTS AND CHALLENGES 2013 1 CONTENTS PROFILE OF THE DANISH ENERGY REGULATORY AUTHORITY 2 FOREWORD
Scoping paper. Solar feed-in tariff report
 Scoping paper Solar feed-in tariff report 2016 17 July 2017 Queensland Competition Authority 2017 The Queensland Competition Authority supports and encourages the dissemination and exchange of information.
IRISH WATER A NEW NATIONAL UTILITY
 IRISH WATER A NEW NATIONAL UTILITY UCC: Law and the Environment Conference 2014 Integrated Approaches to Environmental Law and Regulation 3 April 2014 Orla Joyce, Solicitor Irish Water CONTENTS 1. Government
A look at the Irish Gas Market
 A look at the Irish Gas 1 Natural gas plays a vital role in Ireland s energy mix and economic progress. Gas Networks Ireland provides safe, reliable and efficient transportation of natural gas through
What next for retail competition in energy?
 What next for retail competition in energy? Regulatory Policy Institute Annual Competition & Regulation Conference 7 September 2009 Philip Davies Director of Regulatory Affairs British Gas Overview Market
P315 Publication of Gross Supplier Market Share Data
 Publication of Gross Supplier Market Share Data aims to increase transparency of Suppliers Metered Volumes and MPAN counts to give industry participants more equal access to basic market share information.
Incentives to make the right decision: Policy measures to enhance consumer decarbonisation
 Incentives to make the right decision: Policy measures to enhance consumer decarbonisation Lisa Ryan 25 th October 2018 ESIPP Symposium, UCD Future energy systems: how to decarbonise? Policy targets: Renewable
RE: Enhancing Victoria s Economic Performance and Productivity Discussion Paper
 9 August 2017 Premier s Jobs and Investment Panel Submitted electronically via Engage Victoria EnergyAustralia Pty Ltd ABN 99 086 014 968 Level 33 385 Bourke Street Melbourne Victoria 3000 Phone +61 3
Findings from 2013 research on attitudes and experience in the domestic and SME electricity and gas markets in Ireland
 Findings from 2013 research on attitudes and experience in the domestic and SME electricity and gas markets in Ireland Prepared by The Research Perspective Ltd On behalf of 1 P a g e (c) 2013 The Research
KOSOVO ENERGY CORPORATION J.S.C. TARIFF APPLICATION FOR 2010
 KOSOVO ENERGY CORPORATION J.S.C. TARIFF APPLICATION FOR 2010 February 2010 Page 1 08 February 2010 Table of Contents: 1. Introduction,... 3 2. Focus on Privatization... 5 3. Tariff Strategy,...... 5 4.
1 The Modification Proposal
 Workstream Report Update of the default System Marginal Buy Price and System Marginal Sell Price Modification Reference Number 0333 Version 1.0 This Workstream Report is presented for the UNC Modification
CHAPTER 6 - Load Forecast & Resource Plan
 CHAPTER 6 - Load Forecast & Resource Plan Introduction This Chapter describes the electric resource portfolio that may be acquired to meet the energy requirements of MBCP customers. The following overarching
PacifiCorp Renewable Portfolio Standard Oregon Implementation Plan 2011 through 2015
 Oregon Administrative Rule (OAR) 860-038-0300 Electric Company and Electricity Service Suppliers Labeling Requirements (1) The purpose of this rule is to establish requirements for electric companies and
Regulated Price Plan. Manual
 Regulated Price Plan Manual Ontario Energy Board Issued February 16, 2016 (Replacing version issued on November 5, 2013) NOTE TO READERS: The February 16, 2016 revisions update the time of use pricing
Insights and Positions on Regulated Retail Prices. Nektaria Karakatsani, RAE, Greece
 Insights and Positions on Regulated Retail Prices Nektaria Karakatsani, RAE, Greece 2 nd CSEE Energy Policy Forum, Budapest, 30.5.2017 CEER: Fostering energy markets, empowering consumers Independent voice
ELEXON response to National Grid s consultation of its System Needs and Product Strategy 18 July 2017
 ELEXON response to National Grid s consultation of its System Needs and Product Strategy 18 July 2017 ELEXON sent the following responses to National Grid in relation to its System Needs and Product Strategy
Economic Development Attributes
 Economic Development Attributes OVERVIEW This summary provides a brief overview of the economic development attributes and their application in relation to the potential resource options considered in
Calculation of MIC for General Purpose Customers
 Calculation of MIC for General Purpose Customers Issued by: Distribution System Operator ESB Networks CER/03/033 February 2003, Page 1 of 10 Contents 1.0 ABOUT THIS DOCUMENT...3 2.0 ANALYSIS...4 3.0 ROLL-OUT
Calculation of MIC for General Purpose Customers
 Calculation of MIC for General Purpose Customers Issued by: Distribution System Operator ESB Networks CER 03/068 Page 1 of 10 Contents 1.0 ABOUT THIS DOCUMENT...3 2.0 ANALYSIS...4 3.0 ROLL-OUT OF THE DEEMED