Biennial user and non user survey FINAL REPORT
|
|
|
- Bruno Fields
- 6 years ago
- Views:
Transcription
1 Calgary Transit Customer Satisfaction - Biennial user and non user survey FINAL REPORT Prepared for The City of Calgary by: NRG Research Group th Avenue SW, Suite 405 Calgary, AB Canada T2T 5R6
2 Table of contents Background 3 Quantitative Methodology 4 Qualitative Methodology 5 Executive summary 6 Main survey findings Key transit user profile changes to note 13 Overall satisfaction and customer commitment 15 Attitudes towards Calgary Transit 18 Importance and satisfaction with service attributes (including penalty/reward analysis and drivers analysis) 23 The role of Calgary Transit in the life of its user base 32 Interactions with Calgary Transit 37 Satisfaction with the quality of information provided by Calgary Transit 42 Calgary Transit momentum and future improvements 50 Non user survey results 58 Appendices Detailed Qualitative results user segments 64 Detailed Qualitative results non user segments 71 Questionnaire 76 Historical satisfaction comparisons 98 Penalty reward analysis overview 102 Segmentation analysis overview 114 Regressions analysis overview for key drivers 122 Page 2
3 Background Calgary Transit is the public transit service which is owned and operated by The City of Calgary and has served The City for over 100 years. Ridership peaked at million passenger trips in 2014 but the downturn in the economy had a negative impact on 2015 numbers. Passenger trips were down for the first time in 5 years dropping from million rides in 2014 to million trips in In spite of this, The City and Calgary Transit continue to plan for future growth of the transit system, which is about to benefit from a $68.5 million dollar injection to support expansion and refurbishment projects. In addition, further updates and improvements are on the way for the Calgary Transit app launched in Calgary Transit has been conducting annual customer satisfaction surveys since 1993, and every other year since 1998 the survey has included non-users as well. Since inception, the customer satisfaction survey has been a telephone survey of 500 regular Calgary Transit customers with the biennial non-user study surveying an additional 500 non-users. The responses to the customer survey inform Caga Calgary Transit st of customer experiences, e behaviour, sats satisfaction, acto perceptions, cepto loyalty oyaty and priorities tes for service provisions, o s, and provide contextual information to frame the data. The objectives of the non-user survey include measuring prior transit usage, understanding their preferred mode and travel choices and their potential for making Calgary Transit their mode of choice. Calgary Transit uses the survey findings to remain responsive to Calgarians transit needs. 3
4 Quantitative Methodology The 2016 Calgary Transit Customer Satisfaction Survey was conducted using a telephone survey. The sampling frame consisted of both users and non users. For the purposes of this survey, a user is defined as someone who takes an average of at least one trip a week on Calgary Transit. Non users either do no use transit at all or use it to make an average of less than one trip per week. The user sample size was n=500, with an average survey length of 24 minutes The non user sample size was n=500 users, with an average survey length of 9 minutes All data were collected via telephone using random digit dialling (RDD) and numbers from both landlines and cell phones were included in order to obtain an objective, randomly selected and statistically representative measure of the opinions of Calgarians. A total of 30% of the sample used came from cell phones. NRG ensured sample representativeness ti by setting completion quotas by age category, gender and quadrant to ensure the survey sample reflects that of the general population of The City of Calgary aged 15 and older. Data were then weighted to the 2016 Civic census for age and gender. Note: For a general population sample of 500, the maximum margin of error at the 95% level of confidence is +/- 4.4%; this is based on 50/50 split on any given question. As consensus on a question increases, the margin of error decreases. For instance, if the results are split 90/10 on a subgroup sample of 100, the margin of error at the 95% level of confidence narrows from +/- 9.8% to +/- 5.9%. 4
5 Qualitative Methodology NRG used the quantitative survey results to develop a behavioural segmentation that was used to help inform the framework for the focus groups (a full breakdown of the methodology used can be found on page 56, while further SPSS outputs are contained in Appendix D) In consultation with The City of Calgary, a total of 5 user groups and 3 non user groups were decided upon as follows; Regular users: Multi purpose transit users: Use transit for a variety of trips including work, social/recreational and medical/dental (20% of the user base) Singular purpose transit users: Use transit with a singular focus in mind i.e. commuting to work or school (25% of the user base) Captive riders: Use transit as they don t have a car available to them or do not drive (23% of the user base) Park n Ride transit users: Use transit and park their car in a Park n Ride facility or park nearby a transit stop (21% of the user base) Older predominantly non rush hour transit users: Older commuters who predominantly use transit during non rush hour periods and whose trips are not work related (10% of the user base) Non regular users: Lapsed users: Used Calgary Transit regularly in the past but not currently regular users (55% of the non regular user base) Occasional users: Never used Calgary Transit regularly, currently use only occasionally (26% of the non regular user base) Non users: Never been a regular Calgary Transit user and don t currently use Calgary Transit (19% of the non regular user base) A screener questionnaire was developed to confirm 1-2 key characteristics of each of these groups and recruitment took place between 16 th and 22 nd November. Ten participants were recruited for each of the eight groups. Focus groups were conducted between November 28 th and December 1 st.the number of final participants per group were as follows; Multi purpose transit users: 9 participants Singular purpose transit users: 9 participants i Captive riders: 6 participants Park n Ride transit users: 4 participants Older predominantly non rush hour transit users: 10 participants Lapsed users: 9 participants Occasional users: 9 participants Non users: 10 participants 5
6 Executive summary Overall satisfaction and performance on customer commitment elements In 2016, total satisfaction is significantly higher compared to 2015, with a third (32%) feeling very satisfied and a further 49% feeling satisfied (vs. 25% very satisfied and 47% satisfied in 2015). In 2015, Calgary Transit launched its Customer Commitment. The commitment is for Calgary Transit to be safe, reliable, clean, helpful, informative, and easy-to-use. In 2016, Calgary Transit users were asked to provide ratings for each of these 6 areas. The strongest performing area is ease of use, where 23% rate performance as extremely good. The weakest area is being informative where 28% rate performance as less than 7 out of 10. Qualitative feedback from Calgary Transit users offers ways in which improvements can be made on informative. Some transit users feel it s not widely known where to turn to for information regarding unplanned disruptions. Here the use of multi modal approaches was put forward (i.e. online via Twitter and offline via station announcements). In addition, the rationale behind fare changes was not always felt to be wholly understood. As such, Calgary Transit needs to ensure strong awareness between fare increases and the reasons behind them (i.e. greater transparency) and that the reasons provided are in fact visible within the community. Aside from Customer Commitment, attitudes are measured across a range of areas. Performance is currently strong for Calgary Transit drivers with respect to their safety, knowledge and friendliness. In addition Calgary Transit users are very happy with their general transit experience and feelings of safety on transit vehicles. Calgary Transit is also seen to be doing well in regard to providing stops/stations that are in close proximity to user s needs. Adapting to service disruptions quickly and arriving at stops on time are two areas requiring attention based on lower top box scores (38% strongly agree that Calgary Transit vehicles are punctual and 32% strongly agree that Calgary Transit adapts to service disruptions quickly). However, it should be noted that attitudes towards punctuality have seen significant improvements in the last 5 years, so the trend is heading in the right direction. 6
7 Executive summary Key satisfaction drivers and penalty/reward/performance p factors Overall satisfaction with Calgary Transit depends on a number of various service attributes, To better understand the relationship between overall satisfaction and these service attributes, both Penalty-Reward and Key Driver analyses were run. A Penalty-Reward Analysis (PRA) shows whether scoring low (or high) on a specific attribute is more strongly gy associated with a low or high score on an overall measure. The PRA produces a Penalty and a Reward score for each attribute and compares the difference between these scores. The difference score is used to categorize attributes into one of three types: Penalty, Reward, and Performance as follows; Penalty: an attribute that is expected. Failing to provide this service results in decreased satisfaction, but provision of the service does not increase overall satisfaction. Reward: an attribute that is unexpected but appreciated. Failing to provide this service does not decrease satisfaction, but provision of the service increases overall satisfaction. Performance: an attribute which increases satisfaction if provided, however it can also decrease satisfaction if not provided. Key Drivers identifies service attributes that have the highest impact on overall satisfaction. Combining these two analyses yields 5 key focal areas for Calgary Transit. All of these attributes have a significant impact on overall satisfaction and their Penalty-Reward scores indicate that an increase in attribute satisfaction will lead to an increase in overall satisfaction. Being on time (punctuality); Value for money; Convenience and connection of transfers; Length of travel time; Not being overcrowded. 7
8 Executive summary Key satisfaction drivers and penalty/reward/performance p factors - continued In addition there are 3 service areas classified as penalty attributes. Calgary Transit needs to ensure they maintain a good performance level on these as customers expect to have this as part of their transit experience. Failing to provide this service results in decreased satisfaction, but provision of the service does not increase overall satisfaction. Having courteous and helpful staff; Convenience of purchasing tickets and passes; Information made available about changes to Calgary Transit service and fares. Additional qualitative insight on two focal areas value for money and length of travel time One third of transit users (33%) are unsatisfied with the length of travel time and the same proportion are currently unsatisfied with Calgary Transit s value for money. Qualitatively, transit users in the focus groups echoed some degree of dissatisfaction with travel times (unsurprisingly this was stronger amongst non regular users). Here this dissatisfaction stems from; The number of connections/transfers that can be involved in a trip; The perception that similar distances can be covered in substantially quicker time via private vehicle, and; The current transit network structure of buses feeding into CTrain stations can be perceived as overcomplicated and leading to longer travel times. Qualitatively, when it comes to value for money, more regular users can rationalise the cost savings provided by transit, however, there are factors which lower value for money perceptions; Paying the same price irrespective of distance, resulting in feelings of lower value on shorter trips; Journeys can involve multiple connections/transfers so there is some sense of paying money to wait ; Monthly reserved parking fees perceived as a grudge purchase for Park n Ride users. Offers convenience and security but can be seen as a penalty charge rather than something that actively encourages transit use. 8
9 Executive summary Reasons for using Calgary Transit and the role it plays in the life of its users In 2016 the main reason for using Calgary Transit is convenience. Here this relates mainly to having a service that takes users to/from work/school, helps avoid parking fees and the drive downtown. Other factors include cost and circumstance (i.e. don t drive/have no car available). Calgary Transit not only plays a strong role in the lifestyle of its user base but over time this role is growing bigger. This is evidenced by a significant positive shift in top box agreement that Calgary Transit is an important choice in my life and lifestyle and Calgary Transit availability influences where I live or move to. Calgary Transit does play a slightly lesser role in journey decisions ( I consider Calgary Transit for each trip I make and I use Calgary Transit to go to multiple places on my journey ) but over time the strength of conviction here is becoming more positive. Opportunities exist to increase consideration and shift the dial on usage of Calgary Transit for multiple locations. Here some insights were provided by single use transit users (i.e. those who use transit to just get to/from work/school) who indicated that; Consideration for social trips could be positively impacted by an increase in service hours (i.e. to accommodate closing time for bars or special events/concerts); Smaller, short incidental trips could benefit from the introduction of smaller fares as there was some aversion towards the same fare being charged for a long commute and a short 3-4 stoptrip trip 9
10 Executive summary Interactions with Calgary Transit In 2016 Calgary Transit began measuring the different types of interactions users have with them. A high proportion (76%) did not make any contact with Calgary Transit or 311 in the past 12 months. Concerns/complaints were twice as prevalent as compliments (11% have been in contact for a concern/complaint while 5% have been in contact with a compliment). Calgary Transit is also interested in the frequency of usage of various information sources. In 2016, online information sources prove more popular than their offline counterparts, particularly the Calgary Transit Smartphone app. The TeleRide system is the most frequently used offline information source. alerts and the customer call centre are much lower down the radar as sources of information for Calgary Transit users. In terms of usage frequency, Calgary Transit is making the most traction on Google Transit and Twitter. Meanwhile, usage of the Calgary Transit website and alerts remains relatively static. Usage of the TeleRide system is in decline and this may be in response to Calgary Transit users turning more to online methods i.e. Google Transit and Twitter. 10
11 Executive summary Satisfaction with the quality of information provided by Calgary Transit Calgary Transit users are quite satisfied with the quality of information provided from offline sources. In particular Calgary Transit users are becoming increasingly satisfied with the quality of information provided by Calgary Transit drivers. Over time, more Calgary Transit users are turning to Twitter and Google Transit to find out information from Calgary Transit. As such it is pleasing to see that there are strong levels of satisfaction with the quality of information provided by these two sources. The area requiring more attention is the Calgary Transit website, as satisfaction here continues to be weaker. In terms of communication around various issues, Calgary Transit performs well on communication around planned disruptions and how to use the Transit system. However, there are improvements to be made, particularly with regard to fare change communication and communication around unplanned disruptions. Calgary Transit momentum and future improvements Momentum for Calgary Transit has fluctuated in recent years however the long term trend is positive, growing g from 27% positive momentum in 2011 to 35% in This positive momentum is driven mainly by positive attitudes towards service frequency however other contributing factors include services being on time and provisions for safety and security. In regard to improvements desired by Calgary Transit users, service design continues to top the list. This includes actions such as more frequent service, expanded service and better punctuality. Routes/planning is another key area to address, and within this Calgary Transit users are seeking expanded services and improved bus routes. As part of these improvements, Calgary Transit continually seeks feedback from users in terms of how these should be funded. In 2016 and historically, at least 1-in-2 Calgary Transit users are positive towards fare increases and funding improvements. 11
12 Executive summary Non regular transit user results In 2016, most non regular users have either never been a regular user (45%) or stopped being a regular user over a year ago (49%). In the last 4 years there has been a slight (but not significant) rise in the proportion of lapsed users (those who used Calgary Transit regularly in the past but are no longer regular users). A private vehicle is the most common form of transportation used by non regular transit users/non transit users and regardless of status (i.e. driver or passenger), the general consensus is that there are many good reasons to continue using a private vehicle as a method of transport (i.e. there is a high level of commitment to private vehicles). Qualitatively, there were several reasons provided for wanting to use private vehicles; More efficient/convenient/faster: Driving allows for more direct routes so this is seen as faster and more efficient. Transit is perceived as lengthy and involves too many connections or transfers (and to a degree this comes down to the trade off made around the choice of community lived in and access to transit routes). The network design is perceived as buses feeding into Ctrains, therefore if you are not near a CTrain station the journey becomes off-putting. Greater flexibility/control: A private vehicle puts you in control vs. transit which requires more pre planning Calgary Transit is interested in finding out more about the different user types, particularly lapsed users. Lapsed users currently have the greatest propensity to use transit again, relative to non users or occasional users. This is due to the fact that 74% of lapsed users can identify at least one thing Calgary Transit could do to increase their patronage (vs. 59% for occasional and 51% for non users). In addition, circumstantial reasons are more common than service related areas as a reason for becoming a lapsed user (circumstantial reasons here relate to a location change or the acquisition of a vehicle). 12
13 Key transit user profile changes to note 13
14 Transit user profile key changes over last 3 years Q. In an AVERAGE week, that includes all 7 days, how many times would you normally ride Calgary Transit buses AND/OR CTrains? Average number of weekly transit trips regular users Q. Do you mainly use the bus, the CTrain, or both? Transit methods used Mean % 43% 46% 50% 29% 37% 37% 28% 22% 19% 17% 22% Both CTrain Bus Q. For what type of trips do you mainly use Calgary Transit? Do you use Transit for...[total MENTIONS] Transit trip types Work 58% 60% 59% 64% School 27% 18% 20% 26% Social/recreational 16% 19% 25% 24% Shopping 14% 16% 12% 18% Medical, dental, personal business 12% 13% 11% 17% Calgary Transit users are now taking a higher average number of weekly trips compared to There has also been a significant positive shift in the proportion using transit for purposes outside of work/school. Encouraging multi purpose trip usage is a way in which Calgary Transit can grow the average number of weekly transit trips. Qualitatively, ti l some transit users (particularly l lapsed or single purpose users) indicated d that t an increase in service hours would help them consider transit for more trips (i.e. to accommodate social occasions such as concerts/events or closing times for bars). 14
15 Overall satisfaction and customer commitment 15
16 Overall satisfaction with Calgary Transit Q. Based on your own experience in the last seven days, how satisfied or dissatisfied are you with the overall service provided by the transit system in Calgary? Overall satisfaction with Calgary Transit %4% 14% 49% 32% Top 2 box 81% Very dissatisfied Dissatisfied Neither nor Satisfied Very satisfied Base (valid responses) n=495 Overall satisfaction with Calgary Transit historical comparisons Top 2 box % 23% 47% 25% 72% %3% 20% 44% 31% 75% Very dissatisfied Dissatisfied Neither nor Satisfied Very satisfied Based on their recent experience, a high proportion of Calgary Transit users are satisfied with the overall service provided by the transit system in Calgary. In 2016 total satisfaction is significantly higher compared to the last 2 years, with a third (32%) feeling very satisfied and a further 49% feeling satisfied. Those aged 55 years and over are significantly more likely to be very satisfied with the overall service provided by Calgary Transit (40% of those aged 55 or older are very satisfied vs. 29% of those aged under 55). Those who only use the bus are also significantly more likely to be very satisfied (the top box score amongst bus only users is 40% vs. 23% for those who only use the CTrain). 16
17 2016 Customer Commitment Q. Please rate how Calgary Transit is doing on each of the following elements of Customer Commitment. Calgary Transit Customer Commitment 2016 Easy to use 5% 12% 60% 23% 8.0 Safe 6% 13% 62% 18% 7.7 MEAN Helpful 6% 15% 63% 16% 7.6 Clean 7% 17% 65% 10% 7.3 Reliable 7% 19% 60% 13% 7.3 Informative 7% 21% 57% 15% Extremely poor Extremely good Base (valid responses) n=500 A new measure for 2016, Customer Commitment measures how well Calgary Transit is seen to be performing across six areas. Currently performance is strongest for ease of use, where almost a quarter (23%) rate this as extremely good. The lowest performing area is being informative, as such moving in to 2017 this is an element that Calgary Transit should focus making improvements on. Those aged 55 years and older are more likely to perceive Calgary Transit as reliable (the mean rating amongst this age group is 7.77 vs. 7.2 for those aged under 55). Qualitative feedback from Calgary Transit users may offer some areas for where improvements can be made to perceptions the informative priority. Some transit users feel that it s not widely known where to turn to for information regarding unplanned disruptions. Here the use of multi modal approaches was put forward (i.e. online via Twitter and offline via station announcements). In addition, the rationale behind fare changes was not always felt to be wholly understood. As such Calgary Transit needs to ensure strong awareness between the fare increase and the reasons behind it (i.e. greater transparency) and ensuring that the reasons provided are in fact visible within the community. 17

18 Attitudes towards Calgary Transit 18
19 Calgary Transit attitudes towards drivers, the experience, station locations, punctuality and service restorations Q. I'd like to ask you how strongly you agree or disagree with a few statements about Calgary Transit. For each of the following statements, please tell me if you strongly agree, somewhat agree, somewhat disagree or strongly disagree Drivers Transit experience Other attributes Calgary Transit drivers operate their vehicles safely My experience while travelling on Calgary Transit is usually pleasant A bus stop/ctrain station is within a reasonable distance of my origin/destination Total agreement: 96% Total agreement: 96% Total agreement: 94% 67% 29% Strongly agree Agree 53% 43% Strongly agree Agree 64% 30% Strongly agree Base (valid responses): n=498 Base (valid responses): n=499 Base (valid responses): n=495 Agree Bus drivers are knowledgeable about the service they provide Total agreement: 95% 61% 34% Strongly agree Agree I feel safe when traveling on transit Total agreement: 93% 56% 37% Strongly agree Agree Calgary Transit vehicles normally arrive at my stop on time Total agreement: 87% 38% 49% Strongly agree Agree Base (valid responses): n=438 Base (valid responses): n=500 Base (valid responses): n=493 The bus drivers usually greet me in a friendly manner Other passengers are usually wellbehaved Calgary Transit restores service or adapts to service disruptions quickly Total agreement: 90% 54% 36% Total agreement: 87% 35% 52% Total agreement: 85% 32% 53% Strongly agree Agree Strongly agree Agree Strongly agree Agree Base (valid responses): n=446 Base (valid responses): n=498 Base (valid responses): n=485 On the whole attitudes towards Calgary Transit are positive for drivers as well as the transit experience as a whole. When it comes to Calgary Transit s provision of stops/stations that are in close proximity to users needs, ratings are also strong. The two focus areas, based upon weaker ratings, are punctuality and adaptation/restoration around service disruptions. Adapting to service disruptions is an area currently weaker amongst CTrain only users (77% agree that CT adapts to service disruptions quickly vs. 87% agreement amongst bus only users). Those who only use buses are also more likely to agree that they feel safe when using transit (97% vs. 89% amongst those who only use Ctrains). 19
20 Calgary Transit attitudes towards drivers Q. I'd like to ask you how strongly gy you agree or disagree with a few statements about Calgary Transit. For each of the following statements, please tell me if you strongly agree, somewhat agree, somewhat disagree or strongly disagree Calgary Transit drivers operate their vehicles safely 67% 60% 64% 56% 49% 51% Strongly agree 29% 35% 31% 40% 46% 44% Somewhat agree 96% 95% 95% 96% 95% 95% Base (valid responses): n=498 Bus drivers are knowledgeable about the service they provide Attitudes towards Calgary Transit drivers are becoming increasingly more positive, as evidenced by a significant increase in top box agreement scores for their vehicle operation, service knowledge and friendly greeting % 52% 50% 46% 42% 42% Strongly agree 34% 38% 41% 47% 48% 51% Somewhat agree 95% 90% 91% 93% 90% 93% Base (valid responses): n=438 The bus drivers usually greet me in a friendly manner % % 85% % % % 41% 47% 44% 39% 42% Strongly agree 36% 45% 38% 44% 47% 46% Somewhat agree 88% Base (valid responses): n=446 20
21 Calgary Transit attitudes towards the experience Q. I'd like to ask you how strongly gy you agree or disagree with a few statements about Calgary Transit. For each of the following statements, please tell me if you strongly agree, somewhat agree, somewhat disagree or strongly disagree My experience while travelling on Calgary Transit is usually pleasant % 46% 48% 44% 35% 37% Strongly agree 43% 47% 43% 50% 54% 56% Somewhat agree 96% 93% 91% 94% 89% 92% 2016 Base (valid responses): n=499 I feel safe when traveling on transit Attitudes towards the Calgary Transit experience are becoming increasingly more positive. As is the case with Calgary Transit drivers, this is evidenced by a significant increase in top box agreement scores for overall experience, feelings of safety and good behaviour of other passengers % 48% 51% 49% 42% 42% Strongly agree 37% 46% 39% 44% 50% 49% Somewhat agree 93% 94% 90% 93% 92% 91% 2016 Base (valid responses): n=500 Other passengers are usually well-behaved % 52% 87% % 30% 57% 56% 86% 86% % 60% 88% % 62% 84% % 61% 83% Strongly agree Somewhat agree 2016 Base (valid responses): n=498 21
22 Calgary Transit attitudes towards station locations and punctuality Q. I'd like to ask you how strongly gy you agree or disagree with a few statements about Calgary Transit. For each of the following statements, please tell me if you strongly agree, somewhat agree, somewhat disagree or strongly disagree Since 2011, there has been a significant shift in the proportion of Calgary Transit users who strongly agree that a bus stop/ctrain station is located within a reasonable distance from their origin/location. Throughout this same time period, Calgary Transit users are becoming increasingly more positive towards the punctuality of Calgary Transit vehicles. A bus stop/ctrain station is within a reasonable distance of my origin/destination % 30% 94% % 61% 35% 30% 91% 91% % 48% 37% 44% 94% 92% % 40% 90% Strongly agree Somewhat agree Speaking directly to Calgary Transit users in a qualitative setting, most could agree that transit stops were in close proximity to their origin/destination. However proximity is only Calgary Transit vehicles normally arrive at my stop on time one side of the coin for transit users, as perceptions will change depending on what type of stop is close by and the % 49% 87% purpose of the trip. For example, being in close proximity to a CTrain station is great when you need to commute downtown, but living near a bus stop may have more negative perceptions if that means catching a bus to a CTrain station or even another bus connection in order to % 38% 34% 26% 29% 49% 42% 46% 53% 47% 82% 80% 80% 79% 76% complete your intended d trip. Strongly agree Somewhat agree 2016 Base (valid responses): n= Base (valid responses): n=493 No historical data available for Calgary Transit restores service or adapts to service disruptions quickly as this is a new measure in
23 Importance and satisfaction with service attributes (including Penalty/Reward and Key Driver analysis) 23
24 Claimed importance factors Q. Thinking of the factors we have just discussed, what, from your point of view, would you say is the one most important service factor? And what is the second most important? t? (TOTAL MENTIONS) Most commonly claimed importance factors Being on time 46% Service frequency Providing for customer safety and security 22% 21% Other claimed important factors Not being overcrowded Length of travel time Cleanliness Value for money Convenience of connections and transfers Providing scheduling and route information Directness of trip (number of transfers) 10% 9% 8% 8% 8% 7% 7% Base (valid responses): n=495 Punctuality, service frequency and provision for customer safety/security all rank high in the minds of Calgary Transit users in terms of claimed importance. However, to help prioritise iti these factors attention ti should be given to the relationship between current satisfaction on each service factor and overall satisfaction with Calgary Transit. Here Penalty/Reward analysis and Key Driver analysis can help provide further insight (the results of these analyses are covered on pages 26 to 29, and in more detail in Appendix C). 24
25 Historical comparisons of service factors Q. Thinking of the factors we have just discussed, what, from your point of view, would you say is the one most important service factor? And what is the second most important? t? (TOTAL MENTIONS) Most important service factors (historical comparison based on top 10 factors in 2016) Being on time 50% 52% 55% 38% 41% 46% Service frequency 28% 31% 32% 28% 26% 22% Providing for customer safety and security 16% 14% 13% 17% 20% 21% Not being overcrowded 16% 19% 16% 13% 11% 10% Length of travel time 8% 10% 9% 9% 9% 9% Cleanliness 8% 6% 6% 10% 7% 8% Value for money 10% 9% 10% 11% 11% 8% Convenience of connections and transfers 6% 9% 5% 11% 11% 8% Providing scheduling and route information 5% 3% 2% 3% 3% 7% Directness of trip (number of transfers) 10% 11% 6% 6% 9% 7% 2016 Base (valid responses) n=495 In the minds of Calgary Transit users, punctuality, service frequency and provision for customer safety/security continually rank highest on claimed importance. Providing for customer safety and security has increased in importance over the last 4 years and is now significantly higher than it was in Providing scheduling and route information is also now considered to be significantly more important relative to the last 4 years. 25
26 Satisfaction with Calgary Transit elements Q. I would like you to tell me how satisfied or dissatisfied you were with each service aspect. Directness of trip (number of transfers) 37% Start/stop times for the transit service routes 33% Satisfaction with Service to places I want to go 32% Transit journey Length of travel time 27% attributes Service frequency 23% Being on time 25% Convenience of connections and transfers 23% 36% 38% 39% 40% 42% 40% 41% 73% 71% 71% 67% 65% 65% 64% Compared to those who use both buses and CTrains, those who only use the CTrain are significantly more satisfied with the directness of trips (85% vs. 68%), length of travel time (79% vs. 64%) and service frequency (73% vs. 62%). Providing scheduling and route information 32% 38% 70% Satisfaction with communications Providing real-time bus and CTrain information 28% 37% 65% attributes Communication on changes to CT services 25% 37% 62% Communication about CT service disruptions 24% 33% 58% Those who have been classified as older/non rush hour travel users are significantly more satisfied with transit being value for money (92%) and not being overcrowded (64%). Satisfaction with other attributes Convenience of purchasing tickets and passes 47% 33% 80% (For historical comparisons on these Providing for customer safety and security 35% 42% 77% attributes please refer to Having courteous and helpful staff 37% 39% 76% Appendix B). Having access to bus stops / CTrain stations 41% 34% 75% Further analysis on these Cleanliness 25% 46% 71% attributes has been Value for money 34% 33% 67% conducted using Not being overcrowded 14% 27% 41% Penalty/Reward analysis (results of which are outlined on the following pages) 26
27 Drivers of satisfaction for Calgary Transit Elements with a significant impact on satisfaction ratings for Calgary Transit A regression model looking at all satisfaction attributes identified the following key focal areas: Satisfaction is positively impacted when: Transit vehicles are on time Transit vehicles are not overcrowded Transit is perceived to be good value for money There are convenient connections and transfers in place There are high levels of satisfaction with the length of travel time i.e. transit users are happy with the travel time for their journey Based on a linear stepwise regression where variables were transformed to account for multi-collinearity regression model chosen accounts for 47% of the variation in the overall satisfaction rating for Calgary Transit see Appendix E for further information 27
28 Some areas for improvement value for money and length of travel time Qualitative insights on length of travel time: There is room for improvement with regards to travel time perceptions. Quantitatively, 67% are satisfied with the length of travel time (and since 2014, this proportion has remained unchanged). Transit users spoken to echo a degree of dissatisfaction with travel times (unsurprisingly this was stronger amongst non regular users). Here this dissatisfaction stems from; The number of connections/transfers that can be involved in a trip; The negatively framed comparisons between transit travel times and private vehicle travel: The perception that similar distances can be covered in substantially ti quicker time via private vehicle, and; The network construction that facilitates buses feeding into CTrain stations: Seen by some as overcomplicating the system and leading to longer travel times. These are all factors that Calgary Transit needs to be mindful of in terms of what is negatively impacting satisfaction with travel times. Qualitative insights on value for money There is also room for improvement with regards to value for money perceptions. Quantitatively, 67% are satisfied with value for money (and since 2014, this proportion has remained unchanged). Frequent users are more adept at rationalising the cost savings transit offers over driving (i.e. parking, gas, maintenance, tax rebates). However there are factors which lower value for money perceptions; Time rather than distance based ticket prices: Paying the same price irrespective of distance, resulting in feelings of lower value on shorter trips Time as a cost factor: Also linked to perceptions around travel time, some journeys can involve multiple connections/transfers to there is some sense of paying money to wait Monthly reserved parking fees: Somewhat of a grudge purchase for Park n Ride users. Offers convenience and security but can be seen as a penalty charge rather than something that actively encourages transit use These are all factors that Calgary Transit needs to be mindful of in terms of value for money perceptions. 28
 helps to determine whether scoring low (or high) on a specific attribute is more strongly gy associated")


: an attribute that is unexpected but appreciated.")

29 Penalty reward analysis - introduction If attribute provided If attribute provided A Penalty-Reward Analysis (PRA) helps to determine whether scoring low (or high) on a specific attribute is more strongly gy associated with a low or high score on an overall measure. Depending on this association, PRA categorizes each attribute into one of three categories: Penalty Attribute (red arrow in diagram): an attribute that is expected. Failing to provide this service results in decreased satisfaction, but provision of the service does not increase overall satisfaction. OVERALL SATISFACTION LEVEL Reward Attribute (green arrow): an attribute that is unexpected but appreciated. Failing to provide this service does not decrease satisfaction, but provision of the service increases overall satisfaction. Performance Attribute (purple arrows): an attribute which increases satisfaction if provided, however it can also decrease satisfaction if not provided. Unlike Penalty or Reward attributes, Performance attributes can positively or negatively influence overall satisfaction. If attribute not provided If attribute not provided 29
30 Penalty-Reward and Key driver analysis Overall findings PERFORMANCE ATTRIBUTES ALSO CLASSIFIED AS KEY DRIVERS For the following 4 attributes, overall satisfaction will increase if customers feel their needs are being met on this attribute but will decrease if this is not the case. As these attributes are also key satisfaction drivers, they have the most impact on overall satisfaction. As such, these areas need to be a priority for Calgary Transit. Being on time Value for money Convenience of connections and transfers Length of travel time [Note: Throughout h the qualitative ti component of this study, further insight i was gained around value for money perceptions of transit. This is covered off on pages for users, and for non users] THE REWARD ATTRIBUTE ALSO CLASSIFIED AS A KEY DRIVER Not being overcrowded is a reward attribute, which means that it is unexpected but appreciated. Failing to provide this service does not decrease satisfaction, but provision of the service increases overall satisfaction. As this is also a key driver, it has deemed to have a large impact on overall satisfaction. 30
31 Penalty-Reward and Key driver analysis Overall findings PENALTY ATTRIBUTES The following attributes have been identified as penalty attributes by Calgary Transit. Customers expect all of these aspects as part of their transit experience. Therefore, in order to ensure that strong customer satisfaction, Calgary Transit should ensure that these service attributes are delivered to Calgary Transit users. Having courteous and helpful staff Convenience of purchasing tickets and passes Information made available about changes to Calgary Transit service and fares PERFORMANCE ATTRIBUTES For the following 10 attributes, overall satisfaction will increase if customers feel their needs are being met on this attribute but will decrease if this is not the case. As these attributes have not also been identified as key satisfaction drivers they should be considered a secondary priority for Calgary Transit (behind those performance attributes also identified as key drivers). Service frequency Having access to bus stops / CTrain stations Cleanliness Communication about disruption to CT services Directness of trip (number of transfers) Providing real-time bus and CTrain information Providing scheduling and route information Service to places I want to go Providing for customer safety and security Start/stop times for transit service routes 31
32 The role of Calgary Transit in the life of its users 32

 404 501 500 Main")

33 Reasons for using Transit 69% 68% 64% 79% 77% 77% 31% 32% 36% 21% 23% 23% Captive riders Choice riders The proportion of captive riders remains stable from 2015 but is down significantly from Q. What is your one main reason for using Calgary Transit instead of alternative forms of transportation? One main reason for using transit Convenient service 20% 3% 26% Less expensive 13% 19% 17% Don t drive 11% 11% 13% Avoid parking 20% 20% 12% No car available 10% 12% 10% Avoid traffic 6% 10% 5% Save Gas/High gasoline prices 4% 5% 3% Faster travel time 5% 12% 3% Bus stop close by/on a route - - 2% No alternative option available - - 2% Base (valid responses) Main reasons why transit is convenient % Takes me to/from work 6% Don t have to pay parking fees 3% For getting downtown/avoids the downtown drive 3% Takes me to/from school 3% Easier/better to use 3% In 2016 the main reason for using Calgary Transit is convenience. Here this relates mainly to having a service that takes users to/from work/school, helps avoid parking fees and the drive downtown. Other factors include cost and circumstance (i.e. don t drive/have no car available). Males are more inclined to use transit due to cost reasons s and issues with parking (21% of males claim less expensive as their main reason vs. 12% of females while 16% of males use transit to avoid parking vs. 9% of females). 33
34 Calgary Transit s role in journey decisions and lifestyle Q. Calgary Transit is interested in how Calgary Transit fits into your life. For each of the following statements, please tell me if you strongly gy agree, somewhat agree, somewhat disagree, or strongly disagree Calgary Transit is an important choice in my life and lifestyle The choice of where I live or will move to is influenced by the availability of Calgary Transit services Calgary Transit s lifestyle role Total agreement: 86% Total agreement: 78% 49% 37% 51% 27% Strongly agree Agree Strongly agree Agree Base (valid responses): n=491 Base (valid responses): n=481 Calgary Transit s role in journey decisions For each trip I make I consider using Calgary Transit Total agreement: 73% 38% 35% Strongly agree Agree Base (valid responses): n=486 I use Calgary Transit to go to multiple places on my journey Total agreement: 65% 35% 30% Strongly agree Agree Base (valid responses): n=462 Calgary Transit plays a relatively strong role in the lifestyle of its regular user base however, there is room for improvement to increase its role in journey decisions i.e. consideration of Calgary Transit for each trip and using Calgary Transit to get to multiple places. There are opportunities to increase consideration and in turn shift the dial on usage of Calgary Transit for multiple locations. Here some insights were provided by single use transit users (i.e. those who use transit to just get to/from work/school) who indicated that; Consideration for social trips could be positively impacted by an increase in service hours (i.e. to accommodate closing time for bars or special events/concerts); Smaller, short incidental id trips could benefit from the introduction ti of smaller fares as there was some aversion towards the same fare being charged for a long commute and a short 3-4 stop trip. 34
35 Calgary Transit s role on lifestyle and journey decisions Demographic differences Q. Calgary Transit is interested in how Calgary Transit fits into your life. For each of the following statements, please tell me if you strongly agree, somewhat agree, somewhat disagree, or strongly disagree Segment User type Age Ge nder % agreement CT is an important choice in my life and lifestyle Choice of where I live or will move to is influenced by the availability of CT services For each trip I make I consider using CT I use CT to go to multiple places on my journey Total 86% 78% 73% 64% Male 83% 72% 70% 60% Female 89% 84% 76% 69% <35 years 82% 77% 73% 73% years 90% 77% 68% 55% 55+ years 86% 82% 80% 64% Use both CTrain and buses 89% 81% 84% 79% Use CTrain only 80% 71% 58% 41% Use bus only 85% 80% 67% 58% Multi use 87% 79% 87% 86% Single use 87% 73% 62% 43% Park n ride 75% 67% 44% 35% Captive users 90% 88% 91% 84% Older non rush hour commuters 94% 91% 90% 80% Significantly ifi higher h relative to counterparts t Significantly lower relative to counterparts Females are more engaged with Calgary Transit, as evidenced by their significantly higher agreement scores on most lifestyle/journey related statements. Park n Ride transit users (those who park near train stations or use park n ride facilities) are the least engaged segment of transit users conversely, older non rush-hour commuters have higher engagement levels. 35
36 Calgary Transit s role on lifestyle and journey decisions Historical comparisons Q. Calgary Transit is interested in how Calgary Transit fits into your life. For each of the following statements, please tell me if you strongly agree, somewhat agree, somewhat disagree, or strongly disagree Calgary Transit s lifestyle role Calgary Transit s role in journey decisions Calgary Transit is an important choice in my life and lifestyle For each trip I make I consider using Calgary Transit % 37% 86% % 35% 73% 38% 43% 81% % 37% 68% 46% 37% 83% % 32% 73% 44% 43% 87% % 40% 75% 36% 49% 85% % 41% 67% 36% 47% 83% % 41% 68% Strongly agree Somewhat agree Strongly agree Somewhat agree 2016 Base (valid responses): n= Base (valid responses): n=486 The choice of where I live or will move to is influenced by the availability of Calgary Transit services I use Calgary Transit to go to multiple places on my journey % 27% 47% 33% 56% 24% 47% 37% 47% 32% 43% 36% Strongly agree Somewhat agree 78% % 30% 65% 80% 80% 84% 79% % 31% 28% 22% 28% 30% 34% 33% 56% 61% 62% 55% 79% % 36% 59% Strongly agree Somewhat agree 2016 Base (valid responses): n= Base (valid responses): n=462 Calgary Transit not only plays a relatively strong role in the lifestyle of its user base but over time this role is growing bigger. This is evidenced by a significant positive shift in top box agreement that Calgary Transit is an important choice in my life and lifestyle and Calgary Transit availability influences where I live or move to. Calgary Transit does play a slightly lesser role in journey decisions but over time the strength of conviction here is becoming more positive. 36
37 Interactions with Calgary Transit 37
38 Interaction with Calgary Transit/311 for questions, complaints. compliments or other Q. In the past 12 months, have you contacted Calgary Transit or 311 to do any of the following concerning transit service: Interaction/contact with Calgary Transit/311 in past 12 months [2015/2016] 76% made no contact in the past 12 months Bases (valid responses): n=499 14% have contacted Calgary Transit to ask a question 5% have registered a concern or complaint about a transit operator 8% have registered a concern or complaint about a another aspect of transit 4% have registered a compliment about a transit operator 3% have registered a compliment about a another aspect of transit Net concern/complaint Net compliment 11% 5% Concerns/compliments outnumber compliments 2-to-1, however most have not made any contact with Calgary Transit/311 in the past 12 months. Captive Riders (those who primarily use Calgary Transit as they don t drive or have a car available to them) are more likely to have registered a concern or complaint about a transit operator in the last 12 months. Females are more likely to have contacted transit for the purpose of asking a question about transit or transit service (17% vs. 11% amongst males). No historical data is available for this question as it was introduced in
39 Frequency of access/usage with Calgary Transit across various touch points Q. Calgary Transit provides information to customers in a number of ways. In an average month, how many times would you access/use the following information sources: Usage frequency - online information sources Calgary Transit Smartphone app Calgary Transit on Google Transit Calgary Transit website 45% 60% 68% 38% 6% 20% 26% 20% 17% Bases (valid responses): Twitter; n=496, Google Transit; n=494; Smartphone app; n=493, Website; n=496; alerts; n=496 Calgary Transit on Twitter Calgary Transit alerts 88% 94% 6% 7% 4% 2% Usage frequency - offline information sources None 1-3 times 4+ times MEAN TeleRide system 70% 14% 15% 2.6 Calgary Transit drivers 61% 31% 8% 1.2 Bases (valid responses): Drivers; n=497, TeleRide; n=486, Call centre; n=495 Customer call centre 85% 12% 3% 0.4 Online information sources prove more popular than their offline counterparts, particularly the Calgary Transit Smartphone app. The TeleRide system is the most frequently used offline information source. alerts and the customer call centre are much lower down the radar as sources of information for Calgary Transit users. The CT Smartphone app is used more frequently by females (average of 7.1 times per month vs. 3.9 for males), those under 35 years (average of 9.1 times per month vs. 3.2 for those aged over 35 years) and those who only use buses (average 7.8 times per month vs. those who only use Ctrains 2.0). 39
40 Usage of online information sources Historical comparisons Q. Calgary Transit provides information to customers in a number of ways. In an average month, how many times would you access/use the following information sources: Calgary Transit on Google Transit Calgary Transit on Twitter % 20% 20% % 6% 7% % 16% 24% % 6% 9% % 19% 21% % 5% 6% % 17% 15% % 5% 6% % 10% 17% % 2% 4% % 10% 10% % 1% 3% 2016 Base (valid responses): n= Base (valid responses): n=496 Calgary Transit website Calgary Transit alerts % 38% 17% % 4% 2% % 36% 22% % 2% 2% % 38% 18% % 5% 3% % 36% 21% % 2% 1% % 33% 20% % 2% 2% % 32% 23% % 2% 1% 2016 Base (valid responses): n= Base (valid responses): n=496 Over the last 5 years, Calgary Transit has seen the greatest traction on Google Transit and Twitter. Meanwhile, usage of the Calgary Transit website and alerts remains relatively static. (NB: No historical i data is available for the Smartphone App as this was only launched in 2015). 40
41 Interaction with offline information sources Historical comparisons Q. Calgary Transit provides information to customers in a number of ways. In an average month, how many times would you access/use the following information sources: TeleRide system % 69% 67% 56% 59% 51% 14% 15% 13% 18% 14% 19% 14% 30% 11% 30% 14% 35% % 2016 Base (valid responses): n=486 31% 8% Usage of the TeleRide system is in decline. In 2011, 1-in 2 Calgary Transit users were accessing this information source at least once a month, now just under 1-in-3 (29%) claim to be using to the same extent. Calgary % Transit drivers % Customer call centre % 33% 8% 6% 72% 21% 6% 85% 88% 85% 87% 89% 87% 2016 Base (valid responses): n=497 12% 10% 10% 12% 8% 10% 3% 2% 5% 2% 3% 4% 2016 Base (valid responses): n=495 The decline in usage for the TeleRide system may be due in part to Calgary Transit users turning to more online methods such as Google Transit and Twitter. Though usage of Calgary Transit drivers and the customer call centre is fluctuating, neither is seeing any consistent year on year increases or declines. 41
42 Satisfaction with the quality of information provided by Calgary Transit 42
43 Satisfaction with quality of information from various sources Q. How satisfied or dissatisfied are you with the quality of information provided by the information sources that you use? Satisfaction with quality of information provided from online sources Calgary Transit on Twitter Calgary Transit on Google Transit 37% 47% 44% 38% 81% 85% Calgary Transit Smartphone app 39% 39% 78% Calgary Transit website 34% 39% 73% Bases (valid responses): Twitter; n=59, Google Transit; n=189; Smartphone app; n=157, Website; n=269; alerts; n=28 *Caution low base Satisfaction with quality of information provided by offline information sources Calgary Transit alerts* 30% 36% 66% Very satisfied Satisfied Calgary Transit drivers 48% 34% 82% TeleRide system 48% 33% 81% Bases (valid responses): Drivers; n=193, TeleRide; n=141, Call centre; n=74 Customer call centre 46% 34% 80% When it comes to the quality of information provided from offline sources, Calgary Transit users are quite satisfied, with little separating the three offline sources available. Over time more and more Calgary Transit users are turning to Twitter and Google Transit to find out information from Calgary Transit. As such it is pleasing to see that there are strong levels of satisfaction with the quality of information provided by these two sources. 43


44 The Smartphone App additional qualitative learnings FEEDBACK IS MOSTLY POSITIVE BUT THERE IS STILL ROOM FOR IMPROVEMENT: Qualitative feedback around the Smartphone App is mostly positive, the more regular transit users are quite familiar with it in terms of the information on offer and how to navigate it. However, there is still room for improvement as not all users are aware of its full functionality or how to fully navigate the information on offer. THERE IS AN OPPORTUNITY TO INCREASE MARKET WIDE AWARENESS: Unsurprisingly, non regular users are less aware of the app and its functions, so there is a market wide opportunity to a) increase app awareness and b) improve awareness of the functionality and features on offer. THERE IS AN OPPORTUNITY FOR CALGARY TRANSIT TO ASSIST THOSE LESS TECH SAVVY USERS: As not all users feel tech savvy there is an opportunity for Calgary Transit to potentially offer workshops to help facilitate knowledge around the app (and even the website). 44
45 Satisfaction with quality of information provided by online information sources - historical comparisons Q. How satisfied or dissatisfied are you with the quality of information provided by the information sources that you use? Calgary Transit on Twitter % 38% 85% % 43% 87% % 41% 85% 2016 Base (valid responses): n=59 Calgary Transit on Google Transit % 44% 81% % 45% 86% % 30% 75% 2016 Base (valid responses): n=189 Historically, the quality of information provided by Calgary Transit on Twitter remains the strongest amongst online information sources. The area requiring more attention is the Calgary Transit website here satisfaction continues to be weaker % 39% 73% Calgary Transit % 41% 74% Website % 34% 67% 2016 Base (valid responses): n=269 Very satisfied Satisfied Bases too low to show historical comparisons for alerts 45
46 Historical comparison - satisfaction with quality of information provided by offline information sources Q. How satisfied or dissatisfied are you with the quality of information provided by the information sources that you use? Calgary Transit drivers % 34% 82% % 33% 74% % 38% 69% 2016 Base (valid responses): n= % 33% 82% TeleRide system % 48% 2016 Base (valid responses): n=141 39% 32% 78% 80% Calgary Transit users are becoming increasingly satisfied with the quality of information provided by Calgary Transit drivers. A trend that Calgary Transit should ensure is maintained going into % 34% 80% Customer % call centre 48% 77% % 25% 71% 2016 Base (valid responses): n=74 Very satisfied Satisfied 46
47 Satisfaction with the quality of information made available from Calgary Transit on various issues Q. How satisfied or dissatisfied are you with the quality of information being made available from Calgary Transit on the following issues? Disruptions Service and fare changes Other issues Planned disruptions Service changes How to use the Transit system Total satisfaction: 72% Total satisfaction: 64% Total satisfaction: 72% 31% 41% 23% 41% 31% 41% Very satisfied Satisfied Very satisfied Satisfied Very satisfied Satisfied Base (valid responses): n=490 Base (valid responses): n=491 Base (valid responses): n=482 Unplanned disruptions Fare changes Future plans Total satisfaction: 58% 22% 36% Total satisfaction: 55% 24% 31% Total satisfaction: 62% 25% 37% Very satisfied Satisfied Very satisfied Satisfied Very satisfied Satisfied Base (valid responses): n=490 Base (valid responses): n=492 Base (valid responses): n=489 Calgary Transit performs well on communication around planned disruptions and how to use the Transit system but there are improvements to be made, particularly with regard to fare change communication and communication around unplanned disruptions. 47
48 Satisfaction with the quality of information made available from Calgary Transit on various issues historical comparisons Q. How satisfied or dissatisfied are you with the quality of information being made available from Calgary Transit on the following issues? Disruptions Service and fare changes Other issues Planned disruptions Service changes How to use the Transit system % 41% 72% % 41% 64% % 41% 72% % 36% 63% % 36% 55% % 41% 70% % 36% 64% % 34% 54% % 36% 66% Very satisfied Satisfied Very satisfied Satisfied Very satisfied Satisfied 2016 Base (valid responses): n= Base (valid responses): n= Base (valid responses): n=482 Unplanned disruptions Fare changes Future plans % 36% 58% % 31% 55% % 37% 62% % 33% 52% % 32% 51% % 36% 59% % 32% 51% % 34% 52% % 30% 54% Very satisfied Satisfied Very satisfied Satisfied Very satisfied Satisfied 2016 Base (valid responses): n= Base (valid responses): n= Base (valid responses): n=489 Over the last 3 years there have been some minor improvements with regard to communication on fare changes and unplanned disruptions, however there remains further room for improvement. 48
49 Better dissemination of information What additional qualitative insights were found in speaking directly to users? Communication around unplanned disruptions While unplanned disruptions can pose a challenge, feedback from Calgary Transit users suggests that not all users know where to turn to for this information and that multi modal approaches need to be used. So enhancing communication comes down to creating greater awareness of where to turn to and ensuring a multi modal approach to disseminate the information (i.e. online and offline). Some suggested methods may require additional mechanisms and structures to be put in place i.e. greater announcements on platforms and in transit vehicles (both audio and visual to ensure both the vision and hearing impaired are catered to). Online platforms such as Twitter and the website are already in existence so in this regard Calgary Transit needs to ensure that a) users are aware that these are options available to them and b) the necessary information is disseminated in a timely manner. Communication around fare changes Calgary Transit users (and non users) rationalize that the costs of living are always on the rise and as such the costs associated with the running of Transit vehicles (including staff, maintenance and gas) increase over time. With this in mind, there is an expectation that fares will increase from time to time. What Calgary Transit needs to carefully manage is the communication around any fare changes. While information is disseminated to the public with the rationale behind these changes, Calgary Transit needs to ensure two things; 1) strong awareness between the fare increase and the reasons behind it (i.e. greater transparency) and 2) ensuring that the reasons provided are in fact visible within the community i.e. fares may be increased to provide enhanced service but without strong awareness or transparency around what this enhanced service entails, the public will be left to devise their own interpretation and hence this increases the risk of disconnect and displeasure at what is delivered vs. what is perceived will be delivered. To an extent communication around future plans links into this, especially if fare increases are proposed in order to fund improvements to the service (i.e. expansion of routes, increased service frequency etc). 49
50 Calgary Transit momentum and future improvements 50
51 Perceived service level changes Q. Thinking of the overall level of Calgary Transit service in your community during the past year, would you say it has become better, worse, or stayed the same compared with previous years? Total better 3%4% 58% 22% 13% Al lot worse A little worse Stayed the same A little better Al lot tbetter 35% 2016 Base (valid responses): n=500 Why is a little/lot worse? % Lack of service frequency 33% No access to bus stops / CTrain stations 19% Being overcrowded 16% Not being on time 15% Lack of service to places I want to go 11% Inconvenience of connections and transfers 8% Not having courteous & helpful staff 6% Base (valid responses): n=30* Why is it a little better? % Being on time 20% Service frequency 19% Bus and CTrain vehicle upgrades 12% Expansion of CTrain service/ctrain line extension 11% Having access to bus stops / CTrain stations 9% Not being overcrowded 9% Providing real-time bus and CTrain information 8% Service to places I want to go 6% Base (valid responses): n=105 Why is it a lot better? % Service frequency 30% Being on time 14% Providing for customer safety and security Providing real-time bus and CTrain information Having access to bus stops / CTrain stations Expansion of CTrain service/ctrain line extension 13% 9% 8% 7% Having courteous & helpful l staff 7% Base (valid responses): n=63 A third of regular Calgary Transit riders (35%) feel that Transit service has seen improvements in the past year, relative to previous years. This stems predominantly from service frequency however other contributing factors include services being on time and provisions for safety and security. Although lack of serviced frequency is a common concern for those who feel service has worsened, in relative terms service frequency is seen to be helping to improve perceptions rather than weaken them. 51
52 Perceived service level changes Historical comparisons Q. Thinking of the overall level of Calgary Transit service in your community during the past year, would you say it has become better, worse, or stayed the same compared with previous years? Total better % 4% 58% 22% 13% 35% % 5% 62% 19% 11% 30% % 5% 57% 22% 13% 35% % 3% 63% 19% 12% 31% % 6% 64% 18% 7% 25% % 5% 65% 19% 8% 27% A lot worse A little worse Stayed the same A little better A lot better 2016 Base (valid responses): n=500 Overall service has fluctuated in recent years however the long term trend is positive growing from 27% positive momentum in 2011 to 35% in In 2016, those under 35 years of age are more likely to feel that the overall level of Calgary Transit service has become better (41%) vs. those aged over 35 (31%). Slightly more people in the Northwest feel that Calgary Transit service has worsened compared to previous years. In the Northwest, 11% currently feel that service has worsened, compared to 4-6% feeling the same way in other regions. Momentum is highest for Captive Riders and those using transit for multiple uses (42% and 45% respectively feel that Calgary Transit service is getting better relative to previous years, this is significantly higher relative to older/non rush hour users, 24%, and those using transit for a singular purpose, 27%). 52
53 Main improvements wanted by Calgary Transit users Q. In your opinion what is the one most important thing you would like to see Calgary Transit change or improve? (CODED - TOTAL MENTIONS) Service design: 35% Routes/planning: 19% Fleet/infrastructure: 13% More frequent service 14% Expanded service times (earlier/later) 11% Expanded service in general 7% Expand CTrain line 6% Improve maintenance of fleet 4% More/bigger CTrains/buses 3% More on time service 10% Improve bus routes 4% More parking available at CTrain stations Reduce overcrowding 4% Green Line LRT 2% Others all 1%: Improve shelter/station facilities Improve cleanliness of fleet Public awareness: 12% Age/new vehicles 2% More current service information (disruptions, etc.) 6% Improve information services 4% In 2016, the most commonly cited improvement area is service design. This includes actions such as more frequent service, expanded service and better punctuality. Routes/planning is another key area to address, and within this Calgary Transit users are seeking expanded services and improved bus routes. Base (valid responses): n=451 53
54 Other improvements wanted by Calgary Transit users Q. In your opinion what is the one most important thing you would like to see Calgary Transit change or improve? (CODED - TOTAL MENTIONS) Cost of fares: 9% Safety/security: 6% Staff: 5% Lower fares/don t increase fares 6% Electronic fare payment system 2% More/better security 6% More friendly/courteous drivers 2% Better training for drivers 2% Free parking/reduced rates at CTrain stations 1% Improve customer service 1% Base (valid responses): n=451 Lower down the radar for Calgary Transit users are fare costs, safety security and staff. The low proportions here indicate that these issues are far less top of mind as areas requiring improvement. Qualitatively, similar improvements were cited by transit users, particularly around service design (frequency, punctuality and expanded service hours). Some additional feedback included; Consideration of smaller fares for short trips: To alleviate some feelings around inequality whereby a 3-4 stops journey is the same as a cross town journey. Wifi on board: This stems from the perception of a social trade off. There is an understanding that the trip takes a long time but if there were ways in which this time could be mitigated to make better use of it (i.e. working, connecting on social media etc) this would help make the journey more entertaining. Better luggage storage on transit vehicles: Transit that can better accommodate luggage on airport routes or potential for storage of shopping bags. [A full breakdown of improvements by transit user segment can be found in the Transit Users Qualitative Appendix, and in the Non Transit User Qualitative Appendix there are further qualitative findings from non users in terms of what might encourage them to use transit] 54
55 Improvements/changes suggested by Calgary Transit users Historical comparisons Most commonly suggested improvements Service design 30% 30% 39% 32% 34% 35% Routes/planning 14% 17% 16% 19% 19% 19% Fleet/infrastructure 24% 26% 17% 13% 17% 13% Public awareness 5% 4% 3% 8% 11% 12% Cost of fares 2% 3% 6% 9% 6% 9% Safety/security 10% 7% 4% 9% 5% 5% Staff 3% 2% 3% 3% 4% 5% 2016 Base (valid responses) n=451 Service design continues to be the main improvement Calgary Transit users want, however there have been some shifts seen across other priorities. Fleet/infrastructure and safety/security are now less of a priority compared to 5 years ago. On the other hand, public awareness and fare cost are growing in priority amongst Calgary Transit users. 55


56 Funding for improvements Q. Since it would take additional revenue to fund the priorities you mentioned above, would Q. In your opinion, do you think better transit service should be paid for by an increase in you be in favour of a fare increase if the funds generated were directly applied to these property taxes or by increases in transit fares? improvements? In favour of a fare increase to fund improvements? How should better transit service be funded? 38% 55% % % 2% 9% 27% 5% 4% Yes Conditional yes Maybe No Increase in property taxes Base (valid responses): n=498 Increase in transit fares Both Neither Other Base (valid responses): n=475 Around 1-in-2 (51%) support a fare increase to fund improvements and a further 11% are open to the idea. When given the choice between increasing property taxes or transit fares to fund transit improvements, Calgary Transit users are more in favor of a fare increase. 56
57 Funding for improvements Historical comparisons Q. Since it would take additional revenue to fund the priorities you mentioned above, would Q. In your opinion, do you think better transit service should be paid for by an increase in you be in favour of a fare increase if the funds generated were directly applied to these property taxes or by increases in transit fares? improvements? In favour of a fare increase to fund improvements? How should better transit service be funded? 56% 54% 50% 51% 66% 60% 48% 52% 52% 55% % 22% 30% 27% 13% 18% 13% 9% 13% 7% 2% 4% 5% 5% Base (valid responses): n=498 % Yes/Contional yes Increase transit fares Both Neither Increase property taxes Other 2016 Base (valid responses): n=475 In 2016 and historically, at least 1-in-2 Calgary Transit users are positive towards fare increases funding improvements. 57
58 Non regular users - survey results 58


.")
59 Usage of Calgary Transit - amongst those who are non regular users Q. Have you ever used Calgary Transit on a regular basis that is, at least once a week? Q. How long ago did you stop using Calgary Transit regularly? Was it Q. Do you currently use Calgary Transit occasionally for example, for sports events, during Stampede, New Year s Eve or other special events Ever used Calgary Transit? Usage status Occasional user? 45% 45% 62% % % 2016 Yes No 55% 6% Never used Calgary Transit regularly Stopped using CT on a regular basis less than a year ago Yes No 2016 Base (valid responses): n=500 Stopped using CT on a regular basis more than a year ago 19% 100% 80% 60% 49% 50% 55% In 2016, most non regular users have either never been a regular user or stopped being a regular user over a year ago. 26% % 40% 20% 0% 32% 30% 26% 19% 20% 19% Over the last 4 years there has been a slight (but not significant) rise in the proportion of lapsed users (those who used Calgary Transit regularly in the past but are no longer regular users) Base (valid responses): n=500 Lapsed users: Used Calgary Transit regularly in the past but not currently regular users Occasional users: Never used Calgary Transit regularly, only use occasionally Non users: Never been a regular Calgary Transit user and don t currently use Calgary Transit 59
60 Transportation methods used by non regular transit users/non transit users Q. What one method of transportation do you use most often for travelling within the city of Calgary? Method used most often for travelling within the City of Calgary Car/motorcycle (driver): 58% 2016 Bases (valid responses): n=498 Car (passenger/ carpool): 32% Bike: 1% Taxi: 1% Walk: 1% Other: 5% (Non regular bus/train or Car2Go) Q. Please tell me the one statement that best describes your feelings? 2016 disposition to alternative transportation (most common methods) 100% 80% 60% 40% 20% 0% 62% 63% 65% 31% 33% 26% 6% 4% 8% Total (across all Vehicle (driver) Vehicle (passenger) methods) 2016 Bases (valid responses): Total; n=498; Vehicle (driver); n=290, Vehicle (passenger); n=162 A private vehicle is the most common form of transportation used by non regular transit users/non transit users. Regardless of status (i.e. driver or passenger), the general consensus is that there are many good reasons to continue using a private vehicle as a method of transport. Qualitatively, there were a number of reasons provided for wanting to use private vehicles; More efficient/convenient/faster: Driving allows for more direct routes so is seen as faster and more efficient. Transit is perceived as lengthy and involves too many connections or transfers (and to a degree this comes down to the trade off made around the choice of community lived in and access to transit routes). The network design is perceived as buses feeding into CTrains therefore if you are not near a CTrain station the journey becomes off-putting. Greater flexibility/control: A private vehicle puts you in control vs. transit which requires more pre planning. 60

61 Reasons for becoming a lapsed transit user Q. For what reasons did you stop using Calgary Transit buses or CTrains on a regular basis? Net change in situation: 46% Net car related/other transportation: 44% Net transit service: 18% Location change (work transfer etc.) 24% Stopped working 12% Purchased a car 31% Use other means of transportation 5% Transit too slow 10% Transit not convenient 5% Stopped going to school 7% Car more convenient 3% No transit service (destination/home) 4% Require car for work 3% 2016 Base lapsed regular users (valid responses): n=267 In 2016, circumstantial ti reasons are more common than service related areas as a reason for becoming a lapsed user. These reasons are predominantly related to location change and acquisition of a vehicle. Given their change in circumstance, transit is not seen to best service their current commuting needs. This was uncovered qualitatively, as lapsed users feel that transit can be slower and less efficient than driving. Driving has the advantage of more direct routes. In addition, lapsed users are quite conscious of the time cost involved in using transit. These users understand that potential savings can be made over driving (gas, vehicle maintenance) but these are outweighed by the length of the journey (including getting g to the first transit stop, any connections and the routes on offer). 61
62 How can Calgary Transit encourage non regular users to become regular users? Q. In your opinion, what should Calgary Transit do to increase the likelihood of you becoming a regular transit user? Total Lapsed users Occasional users Non users Nothing 34% 26% 41% 49% Extended routes 16% 16% 22% 9% More frequent service 12% 14% 7% 12% Faster, more direct, express service 12% 14% 11% 7% Reduced fare 11% 14% 9% 7% Closer stops 10% 12% 7% 8% Transit schedule better aligned to my work hours 3% 4% 1% 4% Provide convenient parking spaces 3% 3% 4% 1% Better security 2% 2% 2% 2% Base Significantly higher relative to counterparts Significantly lower relative to counterparts Lapsed users: Used Calgary Transit regularly in the past but not currently regular users Occasional users: Never used Calgary Transit regularly, only use occasionally Non users: Never been a regular Calgary Transit user and don t currently use Calgary Transit The greatest opportunity for conversion lies within the lapser user group, here 74% can identify at least one thing Calgary Transit could do to increase their patronage. This is in line with their reasons for lapsing linked mainly to circumstantial rather than service related issues. For non users, only half (51%) could identify something Calgary Transit could do. The most commonly cited actions are extending routes, providing more frequent service as well as a faster, more direct service. 62
63 Encouraging more regular usage further qualitative insights Aside from enhancements to routes and any major network changes, there are some other potential ways to engage with non users/non regular users. Lapsed users Occasional users Non users Ticket changes: Accommodate group travel: Group/family passes Bundle up transit passes alongside event tickets: Brings transit more on the radar for social/recreational travel A seniors discounted day rate or travel pass: For those who don t wish to purchase an annual pass Longer transit hours: To accommodate social occasions (events/concerts) and closing times for bars Wifi on board Increasing the transfer time: There are perceptions of current journey times exceeding current transfer times (due to connections etc) Communication and promotion of safety to consumers: Transparency on Calgary Transit s performance here and where this is improving/what further improvements are being planned Ticket changes: Accommodate group travel: Group/family passes Bundle up transit passes alongside event tickets: Brings transit more on the radar for social/recreational travel Transit explorer pass options: Allow people to be tourists in their own city Raise awareness and profile of Calgary Transit using the app: Showcase how it can help plan journeys and facilitate connections and transfers. App can also be used to promote Calgary Transit passes and travel options Ticket changes: Staff transit subsidies/promotions (creating buy in from organizations) Communication on how to best navigate the current network: To mitigate the time/cost perception as much as possible Awareness of the app and website as well as Google Transit to assist in journey planning Real time boards on stops to assist in managing expectations and journey planning Wider community transit promotions: Help dial up awareness and engagement in the community bring some attention to Transit in a positive community focused way Provision of amenities at stations: Convenience stores or other similar facilities) 63
64 Appendix A Detailed qualitative transit user results Who are our user segments and what have we have learned from them qualitatively? 64
65 Introduction to how segments were developed In order to identify ways in which to split up the user segments NRG took the approach of a hierarchical cluster analysis using Ward s method. This method was chosen as it seeks to maximise the differences between groups. This cluster analysis was used as an exploratory tool, with the purpose of identifying key behavioral characteristics that could be used to separate out the groups. The variables entered into the cluster classification analysis were: QC7A Agreement with Calgary Transit is an important choice in my life and lifestyle QC7B Agreement with The choice of where I live or will move to is influenced by the availability of Calgary Transit services QC7C Agreement with For each trip I make I consider using Calgary Transit QC7D - Agreement with I use Calgary Transit to go to multiple places throughout my journey QC6A Overall satisfaction with Calgary Transit QC14 Level of commitment with Calgary Transit Both th3 and d4 cluster solutions were saved and dthe results of fthese solutions was cross-tabbed against the results of other survey data including demographic information (age, income, gender), reasons for using Calgary Transit, time periods Calgary Transit used, frequency of Calgary Transit usage, method for getting to Calgary Transit stops, purpose of Calgary Transit trips and types of tickets used. This information was then used to identify key behavioral attributes that were separating out the clusters. In total, 4 the following behavioral themes were identified; Usage of Park n Ride facilities or parking nearby a stop./station vs. walking Singular vs. multi purpose use of transit Rush hour vs. non rush hour patronage Using transit due to being a captive rider vs. cost vs. convenience This led to the final decision on segmenting g users according the following groups: Multi purpose transit users: Use transit for a variety of trips including work, social/recreational and medical/dental (20% of the user base) Singular purpose transit users: Use transit with a singular focus in mind i.e. commuting to work or school (25% of the user base) Captive riders: Use transit as they don t have a car available to them or do not drive (23% of the user base) Park n Ride transit users: Use transit and park their car in a Park n Ride facility or park nearby a transit stop (21% of the user base) Older predominantly non rush hour transit users: Older commuters who predominantly use transit during non rush hour periods and whose trips are not work related (10% of the user base) 65
66 Multi purposes riders key qualitative learnings Value for money perceptions These users are fairly heavy patrons of transit (quantitatively they take an average of 9 transit trips per week and a third use it more than 10 times per week), as such they rationalize that transit is good value for a variety of reasons; Less stressful than driving There are cost savings to make relative to driving parking, gas, maintenance and insurance Can get a lot out of one pass if you plan your journey right Monthly passes can be rebated on taxes What attracts this group to transit? MAIN BENEFITS: Offers benefits over driving: Avoids parking costs, less stressful, less wear and tear on your vehicle and yourself (e.g. avoids traffic jams). Network coverage: The network has extensive coverage across the city and while the journey times are long you can get to where you need to go, it is possible to survive without a car. OTHER BENEFITS: Health benefits: More walking/more active Environmental benefits: Less cars on the road What improvements do this group want to see? Service reliability: Both reliability in terms of time (punctuality) and consistency (mechanical reliability, i.e. the bus/train won t break down) o Within this Calgary Transit can look to strengthen communications around this area by providing information on where improvements have been made and what are they looking to address in the future. Wifi on board: This stems from the perception of a social trade off. There is an understanding that the trip takes a long time but if there were ways in which this time could be mitigated to make better use of it (i.e. working, connecting on social media etc) this would help make the journey more entertaining o Wifi can help people make use of the transit app while on board to further assist in planning journeys and keeping up to date on any changes/service disruptions o There is a feeling that trips can be painful and require patience, so this is one method to counter this 66
67 Singular purposes riders key qualitative learnings Value for money perceptions and perceived benefits Quantitatively, cost and convenience are the main reasons singular purpose riders take transit and qualitatively this is echoed in value for money rationalizations; Transit is seen as cheaper than driving Faster and less stressful Time on the journey becomes useable time i.e. can multi task with other things when using transit DETRACTORS: Value for money can be negatively impacted when the service is overcrowded and you can t make alternative use of your time. Regardless of distance, ticket prices are constant so therefore when travelling shorter distances this reduces value for money perceptions. What could make them consider transit for more trips (i.e. any improvements that would increase usage)? Longer transit operating hours: To accommodate social occasions (events/concerts) and closing times for bars (and also potentially shift workers). Working in with closing hours for bars helps to dial up social responsibility by discouraging drinking and driving. o This could involve a night rider service that operates on a lower frequency on select routes and can help save the cost of a taxi fare home (as currently underway in other cities across Canada and internationally) Better luggage storage on transit vehicles: Transit that can better accommodate luggage on airport routes or potential for storage of shopping bags. o While storage may not be an option on the entire network it might be worth considering on routes that service major shopping hubs Consideration of smaller fares for short trips: Those who are only travelling 3-4 stops are currently having to pay the same as those who are using transit to cross town. As such could this be improved by moving to a zoning type approach where costs are based on journey length and location rather than time. Improving station comfort: Increasing the comfort level at stations by provision of shelters to accommodate the severe cold during Calgary s winters. 67
68 Park n ride users key learnings Impact of Park n Ride usage on value for money perceptions Monthly reserved parking fees are a seen as somewhat of a grudge purchase, and there are waitlists to contend with. On the one hand they provide the guarantee and convenience of securing a parking spot and allowing more flexibility in the morning commute (i.e. I don t have to worry if not there by 6am and miss out on a spot ). Conversely, the cost is not something that tries to encourage the use of transit, rather this is perceived as a penalty fee. So all in all, this additional fee can detract from value for money perceptions. [Quantitatively, compared to the total user base, Park n Ride users have a significantly lower top box satisfaction score for Calgary Transit s value for money 22% vs. 34% across all regular transit users] What attracts this group to transit? MAIN BENEFIT: Avoids downtown parking costs and traffic congestion/ accidents (quantitatively this is in with their transit usage behavior, relative to the total user base, Park n Ride users are significantly more likely to be using transit for work) OTHER BENEFITS: Tax rebates on monthly passes / Environmentally friendly What do these users see as potential barriers for others? Perceived as downtown commute focused : Might not cater to all as not all work downtown if you re not working downtown then transit is not the best option Lack of flexibility and freedom: Cars = more freedom Some routes involve long journey : The wait time for transit connections/transfers can make the commute longer vs. hopping in a car. Waitlists for reserved parking spots: A pain point for these users, and while there might be alternative stations available this might involve an even longer commute. So then the value equation becomes further degraded by both time and financial cost. What improvements do this group want to see? More parking options at transit stops: For these users this is the key focal point and there is some degree of rationalization that this may involve more costs. Some also feel that addressing the parking issue will be seen as future proofing (i.e. planning ahead for future growth and ensuring that current and future needs are met) [Note that it is likely that further research is needed here to look at the cost benefit analysis for various future options as this goes beyond the scope of the current research.] 68
69 Older non rush hour users key qualitative learnings Value for money perceptions and perceived benefits Quantitatively, for these users the choice of where they live or move to is strongly influenced by the availability of Calgary Transit services (91% would agree with this sentiment). Qualitatively, value for money perceptions are linked to the convenience of the network as it relates to them (living near main routes), as well as the low annual fee. In addition, the journey is seen as relatively comfortable as supported by feedback on the vehicles being clean, maintained and heated in winter. Transit use also helps to avoid the costs associated with trying to park downtown. What improvements do this group want to see? Provide better communication around the network: Where it can take you and how to use it o There is some degree of knowledge around the website and app but there are varying degrees of computer literacy that need to be taken into consideration. Calgary Transit could look to address this by offering workshops to help facilitate awareness and knowledge around the app and website, for those keen on learning how this works. Provide shuttles or services that can help to better accommodate travel patterns of seniors: Assisting seniors with travel to recreational activities or essential services o Again, part of this might be facilitated by better communication and knowledge dissemination to this group in terms of how they can plan some of these journeys (some may already be well catered to by current routes) Improving station comfort and safety: Increasing the comfort level at stations (i.e. shelters to accommodate the cold and wind) and within the vicinity of stops (i.e. measures that can be taken to increase the safety on sidewalks leading to transit stops) 69
70 Captive riders key learnings Value for money perceptions? These users rationalize Calgary Transit as being good value for money due to the cost savings offered over private vehicles, especially when buying monthly passes that allow unlimited travel across the city. The time factor can detract somewhat i.e. if your home and destination are at opposing ends of the city then your travel time can be very long and you re paying money to wait. There is also a sense within this group that the needs of lower income families and individuals could be better met and this could help raise value for money perceptions. What do these users see as the attractions of using transit? MAIN BENEFITS: Save money parking fees, gas, car insurance etc Avoid the hassles and stresses of driving/traffic OTHER BENEFITS: Environmental benefits (less cars on the road) / social interaction What improvements do this group want to see? Consideration of smaller fares for short trips: Those who are only travelling 3-4 stops are currently having to pay the same as those who are using transit to cross town. As such this could be improved by moving to a zoning type approach where costs are based on journey length and location rather than time. Provide reduced fares for those on lower income/experiencing financial hardship: Calgary Transit may consider providing more fare options to address those on lower incomes; or, if this is planned, it could be better communicated. (Quantitatively, as context, 44% of those in this group have a household income of under $40K). Improvements that relate to safety/comfort factors: These users would like to see improvements to cleanliness and maintenance of transit vehicles as well as security on platforms and on CTrains. Service design/frequency: A more reliable service (linked back to maintenance to help ensure reliability), more frequent service and better punctuality of service (areas that were also more commonly cited by this group quantitatively). 70
71 Appendix B Detailed qualitative non transit user results Who are our non user segments and what have we have learnt from them qualitatively? 71
72 Introduction to how the non regular user segments were developed In order to identify the different non regular user segments a couple of key behavioral questions were taken into consideration; Previous usage with Calgary Transit [regular user/non regular user] Current level of usage with Calgary Transit [occasional user/non user] From here three groups fell out which were as follows; Lapsed users: Used Calgary Transit regularly in the past but not currently regular users (55% of the non regular user base) Occasional users: Never used Calgary Transit regularly, currently use only occasionally (26% of the non regular user base) Non users: Never been a regular Calgary Transit user and don t currently use Calgary Transit (19% of the non regular user base) 72
73 Lapsed users key qualitative learnings and insights Value for money As lapsed users this group has greater appreciation for the potential cost savings that transit can offer over private vehicles (i.e. vehicle maintenance/gas) However there is a perception p that these cost savings can be outweighed by the time cost. The length of the journey, including getting to the transit stop, connections and convenience of service routes. The cost also starts to add up for families all buying their own individual tickets, so the choice to drive is mitigated t dby both thtime and cost tfactors. Barriers Service hours: If socializing downtown it s hard to use transit for the journey home as bars close after transit service has ended for the day. Perceived as less efficient/convenient than driving: Driving allows you to use more direct routes and therefore is seen to be faster and more efficient. In addition, there is a perception that the current network better facilitates commuters and is less focused on social/recreational users. The network is also regarded as too complex and this slows down the journey. Reduced feelings of safety and comfort vs. driving: Transit experiences mean having to be in close proximity to other passengers whose behaviours are out of your control. These feelings are stronger on platforms at night and on CTrains where drivers are less visible. Breaking down the barriers what hooks might help encourage this group to use transit? Communication and promotion of safety to consumers: Transparency on Calgary Transit s performance here and where this is improving/what further improvements are being planned o Past negative experiences may be reducing trust on safety/security so there is work to be done here to remedy this Accommodate group travel: Group/family passes Bundle up transit passes alongside event tickets: Brings transit more on the radar for social/recreational travel A seniors discounted day rate or travel pass: For those who don t wish to purchase an annual pass Increasing the transfer time: Linked to perceptions of long journey times (i.e. if a journey time on the app reads over 1.5 hours due to connections/transfers this won t suffice) Longer transit hours to accommodate social occasions (events/concerts) and closing times for bars Wifi on board 73
74 Non users key qualitative learnings and insights Value for money perceptions Time is a substantial cost factor for non users. There is an understanding that transit can help to mitigate the costs associated with driving (gas, insurance, depreciation) but the additional time taken to use the system can be seen to undermine that. Here the value equation is related to how amiable your chosen route is. Too many connections and transfers starts to offset the value provided by eliminating parking and other costs. So here value for money perceptions are linked to better, faster more direct routes. Barriers Current network construction: The way buses are designed to feed into CTrains creates the perception that the journey of getting there is too difficult and inconvenient if not near a CTrain station, so this is off-putting. Lack of flexibility: Private vehicles can offer more flexibility as you are in control of the journey. Transit requires more pre planning and again this creates a sense of inconvenience as it takes away from the comfort zone. Journey time: Too many connections or transfers required (and to a degree this comes down to the trade off made around the choice of community lived in and access to transit routes). Bus route planning: Multiple stops means transit users are well catered too but on the reverse side this leads to longer more complicated journeys. Breaking down the barriers what hooks might help encourage this group to use transit? Aside from enhancements to routes and the network, there are some other potential ways to engage with this group. However, their reduced potential to switch means this group should be a lower priority compared to lapsed users or occasional users. Communication on how to best navigate the current network: To mitigate the time/cost perception as much as possible o Awareness of the app and website as well as Google Transit to assist in journey planning o Real time boards on stops to assist in managing expectations and journey planning Create buy in from organizations for staff transit travel i.e. subsidies, promotions? Wider community transit promotions: Help dial up awareness and engagement in the community bring some attention to Transit in a positive community focused way Provision of amenities at stations: Convenience stores or other similar facilities) 74
75 Occasional users key qualitative learnings and insights Value for money perceptions Occasional users rationalize value for money in a few ways; Group size: Transit perceived as good value when travelling alone but worse when travelling in a group (friends or family). Proximity to a CTrain station and intended destination: Value for money is perceived as better if a CTrain station is close by and links you to your intended destination. Ability to accommodate large crowds effectively and efficiently: Overcrowding issues lower value for money perceptions after large events. Barriers Lack of awareness and consideration: Some don t even see it as an option on their radar (lack of awareness -> lack of consideration). Information on trip lengths can make them unfavorable: While the website is informative it might not be palatable the information on the website is great but I don t like what it tells me the wait time and transit trip length is too long. Not time efficient and therefore less convenient: Perceptions that transit is lengthy if you re not in proximity to a station. Feeling that there is a lack of respect for my time. Breaking down the barriers what hooks might help encourage this group to use transit? Time and inconvenience are substantial barriers to this group so aside from major network changes there are few potential options to help engage with them. These factors take into consideration the current behavioral profile of occasional users and their willingness to use transit for events and other non regular instances. Raise awareness and profile of Calgary Transit using the app: Showcase how it can help plan journeys and facilitate connections and transfers o App can be used to promote Calgary Transit passes and travel options Accommodate group travel: Group/family pass Raise the profile of Calgary Transit via promotion of destination travel: Leave the car at home and explore your city by transit o Transit explorer options allow people to be tourists in their own city o Bundle up transit passes alongside event tickets or attraction tickets to encourage social/recreational travel 75
76 Appendix C- Questionnaire 76
77 77
78 78
79 79
80 80
81 81
82 82
83 83
84 84
85 85
86 86
87 87
88 88
89 89
90 90
91 91
92 92
93 93
94 94
95 95
96 96
97 97
98 Appendix D Historical comparisons of satisfaction attributes 98
99 Historical comparisons satisfaction with information and communication attributes Providing scheduling and route information % 38% 70% % 38% 70% % 32% Very satisfied 64% Satisfied 2016 Base (valid responses): n=498 Communication on changes to Calgary Transit services and fares Communication about Calgary Transit service disruptions % 37% 62% % 33% 57% % 32% 56% % 31% 55% % 36% 61% % 36% 61% Very satisfied Satisfied Very satisfied Satisfied 2016 Base (valid responses): n= Base (valid responses): n=495 99
100 Satisfaction with Transit journey attributes Directness of trip (no. of transfers) Start/stop times for transit service routes Service to places I want to go % 36% 73% % 38% 71% % 39% 71% % 36% 72% % 31% 67% % 38% 69% % 35% 73% % 30% 71% % 38% 72% Very satisfied Satisfied Very satisfied Satisfied Very satisfied Satisfied 2016 Base (valid responses): n= Base (valid responses): n= Base (valid responses): n=499 Length of travel time Service frequency Being on time % 40% 67% % 42% 65% % 40% 65% % 36% 62% % 36% 59% % 36% 58% % 39% 67% % 32% 57% % 36% 59% Very satisfied Satisfied Very satisfied Satisfied Very satisfied Satisfied 2016 Base (valid responses): n= Base (valid responses): n= Base (valid responses): n=498 Convenience of connections and transfers % 41% 64% % 35% 64% % 40% Very satisfied 68% Satisfied 2016 Base (valid responses): n=
101 Satisfaction with other attributes Convenience of purchasing tickets/passes Providing for customer safety and security Having courteous and helpful staff % 33% 80% % 42% 77% % 39% 76% % 32% 81% % 38% 72% % 37% 73% % 35% 82% % 39% 69% % 37% 74% Very satisfied Satisfied Very satisfied Satisfied Very satisfied Satisfied 2016 Base (valid responses): n= Base (valid responses): n= Base (valid responses): n=486 Having access to bus stops / CTrain stations Cleanliness Value for money % 34% 75% % 46% 71% % 33% 67% % 35% 74% % 46% 69% % 33% 61% % 38% 76% % 42% 69% % 33% 67% Very satisfied Satisfied Very satisfied Satisfied Very satisfied Satisfied 2016 Base (valid responses): n= Base (valid responses): n= Base (valid responses): n=499 Not being over crowded % 27% 41% % 25% 37% % 23% 37% Very satisfied Satisfied 2016 Base (valid responses): n=
102 Appendix E - Penalty Reward Analysis 102
103 Penalty-Reward Method Transit users overall satisfaction with Calgary Transit depends on a various service attributes provided and the level of expectation surrounding these attributes. A Penalty-Reward Analysis (PRA) shows whether scoring low (or high) on a specific attribute is more strongly associated with a low or high score on an overall measure. The PRA produces a Penalty and a Reward score for each attribute and compares the difference between these scores. The difference score is used to categorize attributes into one of three types: Penalty, Reward, and Performance. Categorization depends on the magnitude and direction of the difference between the Penalty and the Reward score. Various aspects of service delivery have different effects on customers views of a company (or product) depending on customer expectations. There are three broad categories of service attributes: Performance Attributes These attributes have equal penalty and reward characteristics. Companies will be rewarded for good performance, and penalized for poor performance. Penalty Attributes Attributes that are expected by customers ( cost of entry ). If the attribute is not present, customers will penalize the company for its absence, but they will not reward the company for its presence. o E.g., customers expect that a new car will start when they turn the key. If it does not, they will think less of the manufacturer, but if it does start they would not reward the manufacturer. Reward Attributes Attributes that are not expected by customers ( delight attributes ). Customers will reward a company for delivering these attributes, but they will not penalize the company for failing to deliver these attributes. o E.g., car purchasers would be delighted by having a voice activated navigation system, but they would not think less of the car if it did not include this feature. 103
104 Penalty-Reward Method Performance Attributes 10 9 The relationship between a Performance attribute and higher-level dependent variables is straightforward low X performance is associated with low Y outcomes, and high X performance is associated with high Y outcomes. The relationship is the same regardless of whether it is modelled using a linear equation or nonlinear equations (i.e., quadratic and cubic). Depende ent variable (Highe er level attribute) Independent variable (Lower level attribute) 104
105 Penalty-Reward Method Penalty Attributes 10 Reward attributes have similar curves performing well does not net gains in Y 9 until other needs are met. The relationship between the independent 8 and dependent variables is thus curved at the bottom-end of the scale, where 7 low X values do not relate to particularly low Y values (i.e., there is 6 no penalty for not performing), but performing well results in increased Y values. 5 Depende ent variable (Highe er level attribute) 4 To relate this to the car example, imagine that X ratings are the inclusion 3 of various hi-tech car features and Y ratings are overall ratings of the car. Low ratings of the features (1-5) do not 2 result in deflated Y scores (all 5 here), but high ratings (6-10) are associated 1 with increasing scores Independent variable (Lower level attribute) 105
106 10 Penalty attributes have a ceiling on performance gains in this example ratings up to 6 yield increases in Y scores, but then there are no further gains past this point. The relationship between the independent and dependent variables is thus curved at the top- end of the scale, where X values continue to increase but Y values reach a ceiling. To relate this to the previous example, if ratings of car starting (X) to not reach a minimum threshold (6 out of 10 in this case), overall ratings (Y) will suffer correspondingly. If car starting ratings are 6 or higher, overall ratings do not increase. ent variable (Highe er level attribute) Depend Independent variable (Lower level attribute) 106


107 Penalty-Reward Method The Penalty-Reward results show whether scoring low (or high) on an attribute is more strongly associated with a low (or high) on the Overall measure. Attributes that have a consistent relationship on the low and high-end are Performance attributes. Those that have stronger relationships on the low-end compared to the high-end are Penalty attributes, and attributes that have stronger relationships on the high-end compared to the low-end are Reward attributes. The Penalty and Reward attributes have non-linear relationships to measures of overall satisfaction. The Penalty-Reward analysis assesses the strength of the non-linear relationship between an independent variable and a dependent variable. As seen in many surveys, variables in the survey often have at least a moderate linear relationship with all other variables, as well as related Overall measures, and typically with the highest-level Overall Satisfaction measure. An example: In theory, the non-linear relationship between two variables can be identified by using curve estimates. Unfortunately, customer satisfaction data is often so skewed that a curve model is not a significantly better fit than a linear model. In the example, you can see the linear, cubic, and quadratic curve estimations for reliability and overall satisfaction in a utility provider s data. Although visually we can clearly see the curved pattern this data yields, the model r 2 values do not differ sufficiently to call the curve models better than the linear model and characterize the attributes as Penalty or Reward attributes. This is because there are so few cases on the lower end of the scales (i.e., the positive skew). 107
108 Penalty-Reward Method Calculations NRG has developed a non-parametric technique to characterize variable relationships. All attributes, including lower- and higher-level variables, were re-coded into 3-box groupings. The boxes are based on the distribution of the data; for, the low-box is 1 to 2, mid-box is 3, and top-box is 4 and 5. The relationships between the 3-box proportions of independent (lower-level) and dependent (higher-level) variables were then assessed. This is accomplished by calculating a Penalty score and a Reward score, and then comparing them. A Penalty score is defined d (mathematically) ti as the probability bilit of obtaining i a dissatisfactory t (i.e., low-box) rating on the dependent d variable if the independent variable is rated poorly (i.e., low-box). That is, it is the strength of association between poor independent variable (IV) ratings and poor dependent variable (DV) ratings. The Reward score is the opposite it is the probability of obtaining a positive (i.e., top-box) rating on the dependent variable if the independent variable is rated positively (i.e., top-box). That is, it is the strength of association between good independent variable (IV) ratings and good dependent variable (DV) ratings. The most straightforward relationship is that of a Performance attribute. Performance attributes will demonstrate a relationship between a lower-level and higher-level variable that are about even low scores on the independent variable are associated with low scores on the dependent variable, and high scores will be associated with high scores. That is, the Penalty and Reward scores will be about equal. Performance attributes can be strong or weak depending on the values of the Penalty and Reward; when the scores are higher the Performance relationships are stronger, and when the scores are lower the Performance relationship is weaker. Penalty attributes are those with significantly higher proportions of low-low participants compared to the proportion of high-high participants (calculated based on the difference between the Penalty and Reward scores). That is, a low score on the independent variable is strongly associated with a low score in the dependent variable, but a high score on the independent variable is comparably less associated with a high score in the dependent variable. This is because high independent variable scores on a Penalty attribute could result in any dependent variable score after meeting the minimum requirement there is no predictable added gain (the flat- lining of gains in the previous example). Reward attributes are those with significantly higher proportions of high-high participants compared to the proportion of low-low participants. That is, a high score on the independent variable is associated with a high score in the dependent variable, but alow score on the independent variable is comparably less associated with a low score on the dependent variable. This is because low independent variable scores on a Reward attribute could result in any dependent variable score doing well on a superfluous attribute will not result in gains in overall satisfaction unless other requirements are met first. 108
109 Penalty-Reward Method Interpreting the Results After obtaining the Penalty and Reward scores, the difference between them indicates whether an attribute is a Penalty or Reward attribute. If the Penalty score is statistically significantly higher than the Reward score, then the attribute is a Penalty attribute. If the Reward score is significantly higher than the Penalty score, then the attribute is a Reward attribute. If the difference between the scores is low or nil, then the attribute is more of a Performance-related attribute than a Penalty or Reward attribute, where poor scores will make customers unhappy and high scores will make customers happy. The detailed results of the Overall Penalty-Reward Analysis for the Calgary Transit data are presented on the following pages. These results include all participants. p 109
110 KEY FOCAL AREAS: Performance attributes and drivers of overall satisfaction Penalty Reward Difference Being on time -57% 1% 58% Value for money -61% -5% 56% Convenience of connections and transfers -53% 3% 56% Length of travel time -60% -13% 47% A total t of 4 attributes t (above) have been identified d as both a key performance attribute t and a key driver. For each of the attributes shown above, there is no significant difference between the Penalty and Reward scores, hence satisfaction will increase if customers feel their needs are being met on this attribute but will decrease if this is not the case. As they are also considered key satisfaction drivers, they also have the most impact on overall satisfaction. As such, the data suggest these as top priorities for Calgary Transit.. 110
111 Reward attribute and key driver of satisfaction for Calgary Transit users Penalty Reward Difference Not being overcrowded -39% 20% 59% Results indicate that amongst Calgary Transit users there is only one reward attribute and that is lack of overcrowding. As this has been classified as a reward attribute it might not be something that is expected, but given it has also been identified as a key driver, it has strong potential to add value and satisfaction. 111
112 Penalty attributes for Calgary Transit users Penalty Reward Difference -70% Having courteous and helpful staff 43% -26% Convenience of purchasing tickets and passes -59% 42% -18% Information made available about changes to Calgary Transit service and fares -64% -17% 48% For each of the attributes shown above, the Penalty score significantly exceeds the Reward score, indicating that Calgary Transit customers expect all of these aspects as part of their transit experience. The strength of the Penalty scores shows the importance of delivering on these factors to the perception of overall satisfaction. Therefore, in order to ensure that strong customer satisfaction, Calgary Transit should ensure that these service attributes are delivered d to Calgary Transit users. 112
113 SECONDARY FOCAL AREAS: Performance attributes that are not key drivers Penalty Reward Difference Service frequency Communication about disruption to CT services Directness of trip (number of transfers) Providing real-time bus and CTrain information Providing Scheduling and Route Information Having access to bus stops / CTrain stations Service to places I want to go Providing for customer safety and security Cleanliness Start/stop times for transit service routes -63% -61% -50% -45% -51% -60% -49% -52% -57% -46% -8% -8% -3% -4% -14% -3% -6% -12% -6% 2% 55% 53% 47% 47% 47% 46% 46% 46% 45% 40% For each of the attributes shown above, there is no significant difference between the Penalty and Reward scores, hence satisfaction will increase if customers feel their needs are being met on this attribute but will decrease if this is not the case. However, given that t these attributes t are not key drivers, these should be addressed d as a secondary priority. it 113
114 Appendix F Segmentation exploratory SPSS output 114
115 115
116 116
117 117
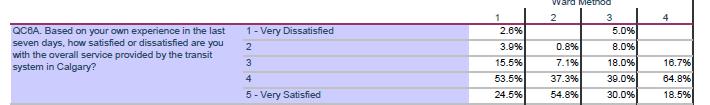
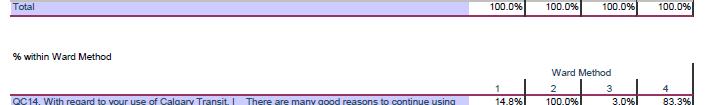

118 118
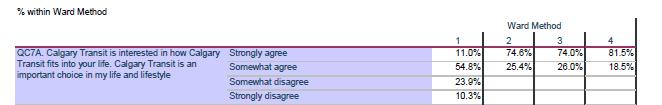
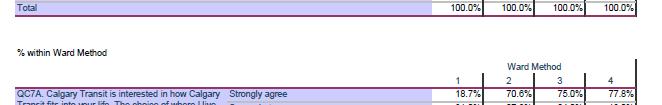

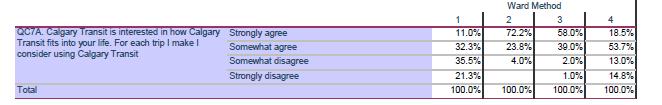
119 119
120 120
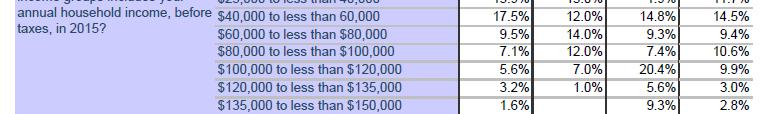
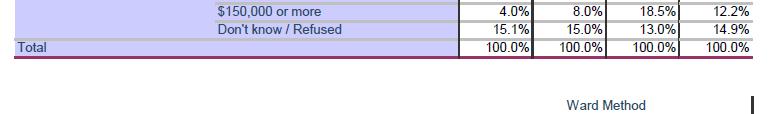

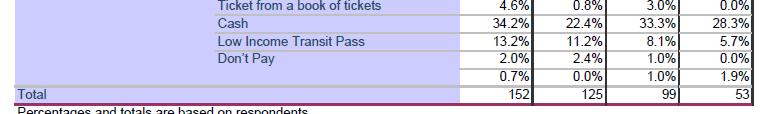
121 121
122 Appendix G - Regression outputs from key driver analysis 122
123 Model summary and collinearity diagnostics Model Summary Std. Error of the Estimate Change Statistics R Square Change F Change df1 df2 Model R R Square Adjusted R Square Sig. F Change a b c d e e. Predictors: (Constant), Zscore: QC4. I would like you to tell me how satisfied or dissatisfied you were with each service aspect. Being on Time, Zscore: QC4. I would like you to tell me how satisfied or dissatisfied you were with each service aspect. Convenience of Connections and Transfers, Zscore: QC4. I would like you to tell me how satisfied or dissatisfied you were with each service aspect. Value for Money, Zscore: QC4. I would like you to tell me how satisfied or dissatisfied you were with each service aspect. Not Being Overcrowded, Zscore: QC4. I would like you to tell me how satisfied or dissatisfied you were with each service aspect. Length of Travel Time Coefficients a nstandardized Coefficien ardized Coef Correlations Collinearity Statistics Model B Std. Error Beta t Sig. Zero-order Partial Part Tolerance VIF 5 (Constant) Zscore: QC Zscore: QC Zscore: QC Zscore: QC Zscore: QC a. Dependent Variable: QC6A. Based on your own experience in the last seven days, how satisfied or dissatisfied are you with the overall service provided by the transit system in Calgary? 123

124 SPSS syntax 124
Calgary Transit Annual Customer Satisfaction Survey
 January 2016 Calgary Transit Annual Customer Satisfaction Survey 2015 Prepared for Calgary Transit by: HarGroup Management Consultants Inc. Phone: 403 261 7999 Email: admin@hargroup.ca P.O. Box 91118 Calgary,
CALGARY TRANSIT. Customer Satisfaction Survey 2013 O CTOBER HarGroup M anagement Consultants
 CALGARY TRANSIT Customer Satisfaction Survey 2013 O CTOBER 2013 HarGroup M anagement Consultants Table of Contents Executive Summary... i 1.0 INTRODUCTION... 1 1.1 Survey Specifications... 1 1.2 Respondent
CUSTOMER SATISFACTION SURVEY. Nevin Grinnell Marketing January 10, 2012
 CUSTOMER SATISFACTION SURVEY Nevin Grinnell Marketing January 10, 2012 2 Agenda Methodology Customer Profile Survey Results Overall Ratings Key Factors Timing and Connections Communication Customer Service
REGIONAL TRANSPORTATION AUTHORITY: 2016 CUSTOMER SATISFACTION STUDY
 FINAL REPORT REGIONAL TRANSPORTATION AUTHORITY: 2016 CUSTOMER SATISFACTION STUDY 6.21.2017 PREPARED FOR: REGIONAL TRANSPORTATION AUTHORITY 55 Railroad Row White River Junction, VT 05001 802.295.4999 www.rsginc.com
2001 CUSTOMER SATISFACTION RESEARCH TRACKING STUDY
 2001 CUSTOMER SATISFACTION RESEARCH TRACKING STUDY FINAL REPORT Prepared For: Newfoundland & Labrador Hydro Hydro Place, Columbus Drive P.O. Box 12400 St. John s, NF A1B 4K7 Prepared By: www.marketquest.ca
Transportation Report to SPC on Transportation and Transit 2017 March 15. ISC: UNRESTRICTED TT Page 1 of 7 ROUTEAHEAD UPDATE
 Page 1 of 7 EXECUTIVE SUMMARY This report provides Council with an update on the status of implementation of RouteAhead, a 30-year strategic plan for public transit in Calgary. The report also highlights
BC Transit Customer Satisfaction Survey Results. Prepared by TransPro Consulting July
 BC Transit Customer Satisfaction Survey Results Prepared by TransPro Consulting July 21 2016 County Population: 214,405 ppen i r G. M y h t o Tim utive c e x E y t n u o C Arthur j. Shafer Chair of the
SPRING 2012 EMPLOYEE OUTLOOK PART OF THE CIPD OUTLOOK SERIES
 SPRING 2012 EMPLOYEE OUTLOOK PART OF THE CIPD OUTLOOK SERIES EMPLOYEE OUTLOOK PART OF THE CIPD OUTLOOK SERIES Summary of key findings 2 Job satisfaction and engagement 4 Employee attitudes towards managers
Madison Metro Transit: Transfer Point Centers. Summary: Description:
 Madison Metro Transit: Transfer Point Centers Summary: It took nine years of planning, but on July 19, 1998, the Madison Metro Transit changed overnight into the timed transfer departure system. The Madison
UAF Administrative Services Work Environment Survey. Prepared for: University of Alaska, Fairbanks Administrative Services
 UAF Administrative Services Work Environment Survey Prepared for: University of Alaska, Fairbanks Administrative Services July 2009 UAF Administrative Services Work Environment Survey Prepared for: University
'Safer Speeds Enforcement' campaign An independent review by TNS New Zealand March 'Safer Speeds Enforcement' campaign
 An independent review by TNS New Zealand March 2015 TNS Prepared March 2015 Contents 1 5 Background & approach 3 2 Key findings & insights 7 3 Current attitudes to road policing 9 4 Campaign creative impact
EUROPE ONLINE: AN EXPERIENCE DRIVEN BY ADVERTISING SUMMARY RESULTS
 EUROPE ONLINE: AN EXPERIENCE DRIVEN BY ADVERTISING SUMMARY RESULTS 1 CONTENTS 1 KEY TAKEAWAYS 3 2 MOST EUROPEAN INTERNET USERS ARE ONLINE DAILY, USING A VARIETY OF DEVICES 3 2.1 European internet users
Dealer. Consumer Attitude Survey
 Dealer Consumer Attitude Survey Autumn 2017 Contents Introduction.. 3 Regional breakdown...... 4 Experience at the dealership. 5 Safety........ 6 Actual cost vs perception... 7 What is the perception of
Carnet proposition Research Debrief
 Carnet proposition Research Debrief PREPARED BY ILLUMINAS a global team based in London, New York and Austin Prepared in compliance with the International quality standard covering market research, ISO
The Rules of Engagement
 The Rules of Engagement An industry report card based on Advisor Impact s Economics of Loyalty research February 2013 Created by: Sponsored by: The Rules of Engagement When we get it right, measurement
TRANSIT SERVICES Business Plan
 TRANSIT SERVICES 2015-2018 Business Plan TABLE OF CONTENTS Vision 1 Operating Philosophy 1 Key Services 1 Focus One: Optimizing Exisiting Resources 2 Focus Two: Exploring New Directions 4 Focus Three:
Comparison of Skilled Workers and Businesses
 Comparison of Skilled Workers and Businesses Business for the Arts (Ontario) submitted by Nanos to Business for the Arts, April 2016 (Submission 2016-733) About the project The research was commissioned
SHOPPING HABITS REPORT. how the recession has impacted consumer shopping habits
 2009 SHOPPING HABITS REPORT how the recession has impacted consumer shopping habits 1 table of contents Introduction...3 1. Key Findings...4 2. Respondent Profile...6 Demographic Characteristics...6 Shopper
WIND FARM OPINION POLL. Conducted 11th 13th May 2015
 WIND FARM OPINION POLL Conducted 11th 13th May 2015 Abstract An insight into opinions regarding renewable energy and the environment in the Bournemouth area, and the feasibility of the Navitus Bay Wind
ImageTrac. Customer Satisfaction and Loyalty Index Average Industry Results. Seek Opportunities.
 1 ImageTrac Customer Satisfaction and Loyalty Index 2013 Average Industry Results Seek Opportunities www.crossfinancial.com 2 2013 ImageTrac Industry Results Overview The ImageTrac Customer Satisfaction
Communicating employee benefits. Driving the value of reward
 Communicating employee benefits Driving the value of reward Introduction When people are financially invested, they want a return. When people are emotionally invested, they want to contribute. - Simon
Bus Information Strategy
 Bus Information Strategy 2012-2017 www.wyltp.com INDEX Page 1 Vision 3 2 Background 3 3 Context 4 4 Meeting current and future expectations 5 5 Consultation feedback 6 6 Strategic approach to information
Barometer. Findings in the United States. A research report prepared for:
 2011 Global Customer Service Barometer Findings in the United States A research report prepared for: Research Method This research was completed online among a random sample of consumers aged 18+. A total
Results of other surveys may differ from NRPS as the timing, questions asked, weighting and sample size may be different and produce different data.
 The National Rail Passenger Survey Methodology What is the National Rail Passenger Survey? Since 1999 the National Rail Passenger Survey (NRPS) has measured customer satisfaction consistently between different
2017 AFFLUENT CONSUMER RESEARCH REPORT
 2017 AFFLUENT CONSUMER RESEARCH REPORT RELATIONSHIP MANAGEMENT/RELATIONSHIP MARKETING NEXUS The Oechsli Institute (800) 883-6582 info@oechsli.com www.oechsli.com RELATIONSHIP MANAGEMENT/ RELATIONSHIP MARKETING
South Eastern rail franchise: Consultation response. June 2017
 South Eastern rail franchise: Consultation response June 2017 1 Contents 1. Transport Focus... 6 2. Introduction... 6 2.1 Franchise consultation response... 7 3. South Eastern rail franchise passenger
2009 First Nations Client Survey
 TOP-LINE REPORT 2009 First Nations Client Survey Prepared for: Prepared by: Malatest & Associates Ltd. CONTENTS SECTION 1: INTRODUCTION..... 1 1.1 Project Background... 1 1.2 Survey Objectives... 1 1.3
Customer satisfaction research. Fieldwork: July - August 2016
 1 Customer satisfaction research Fieldwork: July - August 01 Background and methodology Background and methodology The Switching Tracker is Ofcom's key data source on switching levels, attitudes and experiences
research report Fall 2012 Report Revealing Key Practices For Effective Recognition
 research report Fall 2012 Report Revealing Key Practices For Effective Recognition EXECUTIVE SUMMARY Workforce Mood Tracker Fall 2012 Report // 2 Recognition at work has emerged over the past decade as
General Population Survey Summary
 General Population Survey Summary A short online survey was used to get input from general population users of the Highway 169 corridor. The survey was promoted through a press release, email blast, social
Report LUAS After Study Employers & Retailers April - May 2006
 Report After Study Employers & Retailers ---------------------------------- April - May 2006 By 19-21 Upper Pembroke Street Dublin 2 Tel +353 (1) 6761196 Fax +353 (1) 6760877 info@imsl.ie www.imsl.ie 41105631/EW/SMc/SS/NN
Expectations & Experiences Channels and New Entrants. September 2017
 Expectations & Experiences Channels and New Entrants September 2017 Life made easier People choose financial services options that make their lives easier. From person-to-person payments and voice activation
2016 Acquisition and Retention Study. Drivers of customer retention
 2016 Acquisition and Retention Study Drivers of customer retention 2016 Acquisition and Retention Study Drivers of customer retention 2 About the 2016 Acquisition and Retention Study The Nokia 2016 Acquisition
Social Media Is More Than a Popularity Contest
 Capturing Attention, Building Relationships, and Making Sales in a Digital World Social media doesn t sell cars is still a common perception in the automotive industry. The truth? It doesn t, directly
2015/16 Public Transport Passenger Satisfaction Survey
 Report number Date File Committee Author 16.368 10 August 2016 CCAB-20-186 Sustainable Transport Committee Brendan Cody, Marketing Adviser, People and Customer Group 2015/16 Public Transport Passenger
Does Gen Y want the keys to the car? The changing nature of mobility
 Does Gen Y want the keys to the car? The changing nature of mobility Eric Desomer EMEA Automotive Industry Leader Deloitte Touche Tohmatsu Limited Roularta Media Group February 12, 2015 Five years of exploring
The Close to the Customer Project (541) Oregon State University BEBC. Service Satisfaction Survey: A Sample Report
 Oregon State University BEBC. Service Satisfaction Survey: A Sample Report") The Close to the Customer Project C2C@bus.oregonstate.edu (541) 713-8041 Oregon State University BEBC Service Satisfaction Survey: A Sample Report Updated: December 30, 2010 Table of Contents Table of
The Close to the Customer Project C2C@bus.oregonstate.edu (541) 713-8041 Oregon State University BEBC Service Satisfaction Survey: A Sample Report Updated: December 30, 2010 Table of Contents Table of
Customer Satisfaction Surveys for Public Transport Companies Greater Efficiency through more Demand-Orientated Methods
 Customer Satisfaction Surveys for Public Transport Companies Greater Efficiency through more Demand-Orientated Methods Workshop 1d: Public transport: How can public transport meet the increased mobility
2016 UPS How to Click with High-Tech Online Shoppers
 2016 UPS How to Click with High-Tech Online Shoppers INTRODUCTION High-tech online purchasers are plugged in across all stages of the shopping experience from research and purchase to delivery and returns.
2014 Talent Acquisition Survey
 2014 Talent Acquisition Survey September 2014 2014 Jibe. All Rights Reserved. 1 Job Seeker & Talent Acquisition Challenges Every day, millions of Americans are searching for work. And in today s techenabled
2016 Kelowna Regional Transit Customer Satisfaction Survey Project Update
 2016 Kelowna Regional Transit Customer Satisfaction Survey Project Update 1.0 Introduction As part of the Central Okanagan Transit Future Action Plan process, BC Transit, in collaboration with the local
A guide to using the Common Measurements Tool
 A guide to using the Common Measurements Tool This guide contains material from the Common Measurements Tool, used under licence and reproduced with the permission of the Institute for Citizen- Centred
Content of the module
 Content of the module Methodology approach Planning process Definition of working area Population and territorial context Supply Infrastructure Transport service Demand On board / at the stations or bus
OneBusAway. Sharing real-time transit info
 OneBusAway Sharing real-time transit info The Challenge Custom mobile apps are expensive Some estimates > $150,000k for a single platform [7] Doesn t include maintenance cost Implementing and maintaining
Clackamas County Diversity and Inclusion Assessment Report Phase II
 Clackamas County Diversity and Inclusion Assessment Report Phase II Prepared by: The Center for Public Service Mark O. Hatfield School of Government Portland State University Masami Nishishiba, Ph.D. Jillian
An Empirical Research on the Penetration Levels for a Call-a- Cab Service in Mumbai
 Reflections Journal of Management (RJOM) Volume 5, January 2016 Available online at: http://reflections.rustomjee.com/index.php/reflections/issue/view/3/showtoc An Empirical Research on the Penetration
2016 ACI WORLDWIDE MASS TRANSIT PAYMENTS SURVEY
 sdfsdf 2016 ACI WORLDWIDE MASS TRANSIT PAYMENTS SURVEY Two critical elements to keeping customer satisfaction levels high EXECUTIVE SUMMARY Customer satisfaction is an extremely vital element to mass transit
The State of the UK Ticketing Industry 2013: Analysing the trend towards direct, online ticket buying
 The State of the UK Ticketing Industry 2013: Analysing the trend towards direct, online ticket buying Table of contents Introduction... Methodology... Digital ticketing is here... People want to purchase
THE DRIVE TO DECIDE. Italy // IT //
 THE DRIVE TO DECIDE Italy. 2017. Follow the Route. 01 02 03 04 It s time for a new car The Modern Auto Shopper Online Video From Digital to the Dealership The decision making process is complex and requires
Retaining Employers for Work Placement Students
 Retaining Employers for Work Placement Students Action Research Project by Jennifer Boyce Introduction The purpose of this research is to establish why employers very rarely continue to participate in
Smart energy outlook. February 2017
 Smart energy outlook February 2017 Smart energy outlook February 2017 1 2 Contents Executive summary 4 Smart meters - 6 the verdict from those who already have one Case study - Eve Ogden 14 Understanding
Performance Level Analyses of Public Transportation Using Importance- Performance Analysis Method
 Performance Level Analyses of Public Transportation Using Importance- Performance Analysis Method Nursyamsu HIDAYAT Civil Engineering Diploma Program, Gadjah Mada University, Yogyakarta, Indonesia E-mail:
Giving More Than Money.
 Giving More Than Money. 2015 Wells Fargo/BoardSource study of nonprofit board leadership. Wells Fargo Philanthropic Services endeavors to help nonprofit boards and board members gain the most from board
UK BLOGGERS SURVEY 2017 UK BLOGGERS SURVEY SURVEY
 1 UK BLOGGERS SURVEY SURVEY 201 2017 2 1. Overview Blogging is now a well-established media for consumers who turn to their favourite writers for news, advice, inspiration or information on a particular
2009 National Pharmacy Study SM
 Mass Merchandiser Performance September 2009 Healthcare Practice Table of Contents Topic Page # Overview of Findings... MM-3 Overall Customer Satisfaction...MM-5 Non-Pharmacist Staff MM-8 Store Convenience
Catch and Keep Digital Shoppers How To Deliver Retail Their Way (Brazil Survey Findings)
") Catch and Keep Digital Shoppers How To Deliver Retail Their Way (Brazil Survey Findings) Summary Digital influence has captured the mass shopper market, with 72 percent of all consumers using digital sources
Catch and Keep Digital Shoppers How To Deliver Retail Their Way (Brazil Survey Findings) Summary Digital influence has captured the mass shopper market, with 72 percent of all consumers using digital sources
OREGON ELECTRICITY SURVEY
 OREGON ELECTRICITY SURVEY by Stephen M. Johnson, Ph.D., Associate Director with the assistance of Kimberlee Langolf January 1999 OREGON SURVEY RESEARCH LABORATORY UNIVERSITY OF OREGON EUGENE OR 97403-5245
Possible ways to improve public bus transportation in Itaperuna, Rio de Janeiro, Brazil
 205 Possible ways to improve public bus transportation in Itaperuna, Rio de Janeiro, Brazil D. I. De Souza1,2, R. Rocha2 & P. Duarte1 1 Civil Engineering Department, Fluminense Federal University, Brazil
The Attractiveness and Sustainability of Print and Paper The U.S. Consumer s view
 The Attractiveness and Sustainability of Print and Paper The U.S. Consumer s view A Two Sides Survey of U.S. Consumers conducted by Toluna Inc., June 2016 As the world of communication continually shifts
Awareness and Use of Real-Time Travel Information: A Panel Study of the Dallas US-75 and San Diego I-15 Corridors
 Awareness and Use of Real-Time Travel Information: A Panel Study of the Dallas US-75 and San Diego I-15 Corridors Authors: Joseph Luna* Volpe National Transportation Systems Center 55 Broadway Cambridge,
Mobility on Demand for Improving Business Profits and User Satisfaction
 Mobility on Demand for Improving Business Profits and User Satisfaction Takuro Ikeda Takushi Fujita Moshe E. Ben-Akiva For a sustainable society, we need to design a mobility management system that does
West Midlands rail franchise consultation Transport Focus response. March 2016
 West Midlands rail franchise consultation Transport Focus response March 2016 1 Contents 1. Transport Focus... 6 2. Introduction... 6 2.1 Franchise consultation response... 7 3. Passenger research and
INTRODUCTION TO SOCIAL MARKETING AND SEGMENTATION
 INTRODUCTION TO SOCIAL MARKETING AND SEGMENTATION Event: Social Marketing Training Workshop Date: 17th-18th May, 2011 Location: Toulouse (France) Speaker: Michael Carreno, Transport Research institute/
PROTECTING Our Quality of Life... Why the Capital Region Needs to Invest in Mass Transit NOW
 PROTECTING Our Quality of Life... Why the Capital Region Needs to Invest in Mass Transit NOW The Challenge... Traffic congestion in the Capital Region has doubled over the last decade. $86M Total cost
The Changing Attitudes of Canada s Frequent Business Traveller. Presented by: Dave Pierzchala
 The Changing Attitudes of Canada s Frequent Business Traveller Presented by: Dave Pierzchala October 2008 Introduction The Canadian Business Travel Study is a yearly syndicated study that has been running
Manukau City Council. Measuring Progress: Minimum Requirements. Improving BID performance using Key Performance Indicators.
 Manukau City Council Measuring Progress: Minimum Requirements Improving BID performance using Key Performance Indicators June 2005 This document provides the minimum requirements for the creation and maintenance
METRO SYSTEM PERFORMANCE REPORT. PERFORMANCE INDICATORS AND CUSTOMER SATISFACTION Customer Service, Operations and Safety Committee February 16, 2006
 METRO SYSTEM PERFORMANCE REPORT PERFORMANCE INDICATORS AND CUSTOMER SATISFACTION Customer Service, Operations and Safety Committee February 16, 2006 PURPOSE Review Metro System Performance Results for
Diagnostic Study of the Implementation and Demand for New Technologies in Road and Rail
 Diagnostic Study of the Implementation and Demand for New Technologies in Road and Rail Ángel Cabo Astudillo Head of Projects Directorate General of Land Transport Ministry of Development 8th June 2012
Service Quality and Consumer Behavior on Metered Taxi Services
 Service Quality and Consumer Behavior on Metered Taxi Services Nattapong Techarattanased Abstract The purposes of this research are to make comparisons in respect of the behaviors on the use of the services
Bruce K. Berger, Ph.D., Juan Meng, Ph.D., and William Heyman
 1 Gender Differences Deepen, Leader-Employee Gap Remains and Grades Slide --Plank Center Report Card 2017 on PR Leaders-We need to be bigger leaders to close the gaps. Bruce K. Berger, Ph.D., Juan Meng,
Licence Application Decision
 Licence Application Decision (Taxi - New) Application # 349-15 Applicant Express Taxi Ltd. Principals Address Application Summary YOUNIS, Najih Ahmed 2142 Meadowlark Dr., Comox, BC V9M 3P4 Special Authorization:
How do your customers find a bed and breakfast?
 How do your customers find a bed and breakfast? During the last week of February, 2013, we surveyed a representative sample of about 1300 American adult internet users that were 18 and older to better
EMPLOYEE SATISFACTION SURVEY VOICE OF EMPLOYEE - ANALYSIS & RESULTS. SpiceJet Employee Satisfaction Survey
 EMPLOYEE SATISFACTION SURVEY VOICE OF EMPLOYEE - ANALYSIS & RESULTS SpiceJet Employee Satisfaction Survey Executive Summary 1 The main objective of conducting Employee Satisfaction Survey was to set a
The New Hotel Booking Path to Purchase: The Mobile, Social, and Online Journey
 The New Hotel Booking Path to Purchase: The Mobile, Social, and Online Journey 2012 August 2014 About this study 2 For many products and services, the explosion of digital and mobile platforms has created
Customer Satisfaction Tracker
 Customer Satisfaction Tracker 11 th May 2012 Crowne Plaza Hotel www.sboresearch.co.ke Background The Customer Delight System is an industry wide measure of service delivery It is an initiative steered
1.201 / / ESD.210 Transportation Systems Analysis: Demand and Economics. Assignment 2
 1.201 / 11.545 / ESD.210 Transportation Systems Analysis: Demand and Economics Assignment 2 Question 1 Elasticities and Consumer Surplus In April of 1973, the Massachusetts Bay Transportation Authority
Consumer Resistance to Green Innovations: The Case of Natural Gas Vehicles
 Institut > Prof. Dr. Klaus-Peter Wiedmann Consumer Resistance to Green Innovations: The Case of Natural Gas Vehicles Klaus-Peter Wiedmann, Nadine Hennigs, Lars Pankalla, Martin Kassubek, Barbara Seegebarth
Advocacy and Advancement A Study by the Women s Initiatives Committee of the AICPA
 Advocacy and Advancement A Study by the Women s Initiatives Committee of the AICPA February 19, 2013 By: Louise E. Single, PhD Stephen G. Donald, PhD In July 2012 the Women s Initiatives Executive Committee
Opening the Door to. Customer. Engagement
 Customer Satisfaction Surveys Opening the Door to Customer Engagement Over 1/4 of adults have completed a customer satisfaction survey - most respond somewhat frequently Completed Satisfaction Survey Frequency
MSP Marketing Engine. Ready-to-Go Programs
 Ready-to-Go grams Introduction MSP owners understand the increasing importance of digital marketing to help with business growth. What is less clear however, is where to start. Between social media, email
Better Business Bureau
 Better Business Bureau BBB/Gallup Trust in Business Index Executive Summary: Consumers Rating of Companies They Regularly Deal With October 25, 2007 Prepared by: THE GALLUP ORGANIZATION 502 Carnegie Center
AMB201: MARKETING & AUDIENCE RESEARCH
 AMB201: MARKETING & AUDIENCE RESEARCH Assessment 3: Predictors of Online Retail Shopping Student name: Jenny Chan Student number: n8738254 Tutor name: Jay Kim Tutorial time: Friday 2pm-3pm Due Date: 3
Customer service. Chartered Institute of Internal Auditors. 26 October What is customer service? 1 Chartered Institute of Internal Auditors
 26 October 2017 Customer service Chartered Institute of Internal Auditors Everyone in the organisation is either directly or indirectly involved with customer service. It is very important that world class,
Bus Passenger Survey - spring 2016 results
 Bus Passenger Survey - spring 2016 results West Midlands area National Express Contact: Robert Pain, Insight Team, Transport Focus Fleetbank House, 2-6 Salisbury Square, London, EC4Y 8JX Tel: 0300 123
Chapter 4. Review Questions. Amy Hissom. Homework #5 Focusing On Customers. TECH Quality Standards. Monday, February 07, 2011
 Amy Hissom Homework #5 Focusing On Customers TECH 50000 - Quality Standards Monday, February 07, 2011 Chapter 4 Review Questions 1. Explain the difference between satisfaction and loyalty. Why is loyalty
Catch and Keep Digital Shoppers How To Deliver Retail Their Way (Mexico Survey Findings)
") Catch and Keep Digital Shoppers How To Deliver Retail Their Way (Mexico Survey Findings) Summary With the second-largest Internet and mobile populations in Latin America, Mexico presents a great opportunity
Catch and Keep Digital Shoppers How To Deliver Retail Their Way (Mexico Survey Findings) Summary With the second-largest Internet and mobile populations in Latin America, Mexico presents a great opportunity
2015 Global State of Multichannel Customer Service Report
 2015 Global State of Multichannel Customer Service Report 1 Table of Contents 2015 Global State of Multichannel Customer Service Report Introduction 3 Methodology 4 Changing Channels 5 Hold the Phone 7
EMS and Fire Services Regionalization Study: Telephone Survey Report May 8, 2006
 EMS and Fire Services Regionalization Study: Telephone Survey Report May 8, 26 Mark Mattern, Ph.D. Department of Political Science Baldwin Wallace College Berea, OH 4417 mmattern@bw.edu 44-826-247 1 Contents
Salon Experience 2011 Survey Results
 Executive Summary: Salon Experience 2011 Survey Results Listening to the feedback of beauty salon clients is critical to maintain and to improve client retention rates. Salon owners must have a firm understanding
SEEK Intelligence Survey of Employee Satisfaction and Motivation in New Zealand
 SEEK Intelligence 2004 Survey of Employee Satisfaction and Motivation in New Zealand The second SEEK Intelligence Survey of Employee Satisfaction and Motivation in New Zealand has collected responses from
The Next Next Generation Customer Information System
 SFMTA Municipal Transportation Agency The Next Next Generation Customer Information System Customer Information System Citizens' Advisory Council (CAC) April 6, 2017 October 15, 2016 San Francisco, CA
Findings from 2016 research on attitudes and experiences in the domestic and SME electricity and gas markets in Ireland
 Findings from 2016 research on attitudes and experiences in the domestic and SME electricity and gas markets in Ireland Prepared by Behaviour & Attitudes and The Research Perspective On behalf of the CER
Calgary Transit Funding and Fare Strategy Calgary Transit 2011 June
 Calgary Transit Funding and Fare Strategy Calgary Transit 2011 June LPT2011-xx Overview of Calgary Transit Fares.docx Page 1 of 37 LPT2011-xx Overview of Calgary Transit Fares.docx Page 2 of 37 Calgary
Mass Transportation in Central Indiana
 Mass Transportation in Central Indiana Research Overview August 2008 Conducted for: The Greater Indianapolis Chamber of Commerce & Metropolitan Indianapolis Board of REALTORS Background & Objectives The
ANSON COUNTY TRANSPORTATION SYSTEM P.O. BOX 672 WADESBORO, NC
 COME RIDE WITH US!! ACTS ANSON COUNTY TRANSPORTATION SYSTEM P.O. BOX 672 WADESBORO, NC 28170 (704)694-2596 CLEAN. SAFE. RELIABLE TRANSPORTATION ACTS MISSION STATEMENT IT IS THE GOAL OF THE ANSON COUNTY
2016/2017 MOBILE AND LOYALTY SURVEY LOYALTY REWARDS
 2016/2017 MOBILE AND LOYALTY SURVEY LOYALTY REWARDS WHY THE SURVEY? Veoo wanted to survey loyalty card holders to understand what the future holds for mobile wallet adoption, to understand what customers
Striking a Healthy Balance. What Employees Really Want Out Of Workplace Benefits Communication
 Striking a Healthy Balance What Employees Really Want Out Of Workplace Benefits Communication Striking a Healthy Balance What Employees Really Want Out Of Workplace Benefits Communication Digital technology
March 2017 USING PRESTO ON GO TRANSIT
 March 2017 USING PRESTO ON GO TRANSIT Welcome to PRESTO! Enjoy the convenience of bypassing line-ups for GO Transit tickets, the flexibility of reloading money online and the ease of travelling between
Psychographic Segmentation
 Psychographic Segmentation By Jim Mintz, Managing Partner, CEPSM Psychographics marketing Psychographics marketing may be a concept that you are not fully aware of, but it is an essential part of marketing.
Workplace Health Improvement Project: PILOT EVALUATION REPORT
 Workplace Health Improvement Project: PILOT EVALUATION REPORT Workplace Health Improvement Project: Pilot Evaluation Report Prepared for Workplace Wellness Unit Health Promotion, Disease and Injury Prevention