Predictive Analytics
|
|
|
- Samuel Hubbard
- 5 years ago
- Views:
Transcription
1 Predictive Analytics Mani Janakiram, PhD Director, Supply Chain Intelligence & Analytics, Intel Corp. Adjunct Professor of Supply Chain, ASU October 2017 "Prediction is very difficult, especially if it's about the future." --Nils Bohr, Nobel laureate in Physics

2 Training Objective Data Analytics is now becoming the game changer in the industry and it is much more relevant for supply chain functions. Predictive Analytics is an advanced Data Analytics that leverages historical data and combines it with forecasting models to predict future outcomes. It can be used across the entire gamut of supply chain such as Plan, Source, Make, Deliver and Return. In this session, we will focus on the what, where and how predictive analytics can be used. Some of the techniques covered in this session include: Regression, Time Series Forecasting, Basic Machine Learning Algorithms (Clustering, Cart) and Decision Trees. Through use cases, we will demonstrate application of predictive analytics in supply chain functions. 2


3 What if you were able to. Predict the outcome of your new product launch? Evaluate the impact of your marketing campaigns hourly and make inventory adjustments in real-time? Predict potential failure of your critical equipment and plan contingencies? Predict the market sentiments and buying behavior of your consumers in real-time? Predict the outcome of the US Presidential elections? 3


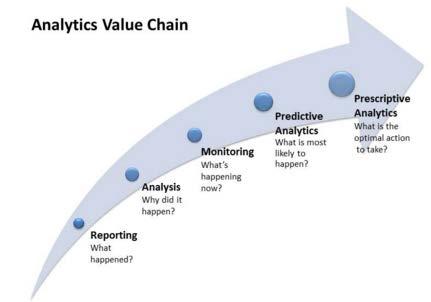
4 Data to Insights: Driving Industry 4.0 Cognitive Analytics 4 4

5 Supply Chain Analytics 5 5
6 Predictive Modeling Data History Correlated Variables (x1, x2, x3,, y) Build Model Y = f(x1,x2,x3 ) Predict Future Y Given Xs, calc Y Learn the model based on historical data Correlation is used to understand strength of linear relationship. Beware causation versus correlation Predictive techniques (y=f(x)) such as Regression, Time Series Forecasting, Machine learning, Decision Tree are used to build models Terms such as data mining and machine learning are often used 6
7 Predictive Model Algorithms (y=f(x)) Supervised Learning Unsupervised Learning Y = Numeric Y = Categorical No Y Regression or Regression Classification Clustering Classification Linear Regression Linear Discriminant Analysis Decision Trees Neural Networks Hierarchical Best Subsets Lasso Stepwise Ridge Logistic Regression Time Series Forecasting Random Forests Bayesian Networks Gradient Boosting Support Vector Machines K Nearest Neighbors K Means Principal Components Analysis = we will look at these today 7
8 Better Prediction Better Model! y Three models: Under fit: bias Over fit: variance Just right! x Balance accuracy of fit on training data and generalization of future or test data to get a better model! 8
9 Predictive Modeling Regression Analysis Time Series Forecasting Machine Learning & Decision Trees 9
10 Regression and Correlation Regression analysis is a tool for building statistical models that characterize relationships between a dependent variable and one or more independent variables, all of which are numerical. A regression model that involves a single independent variable is called simple regression. A regression model that involves several independent variables is called multiple regression. Correlation is a measure of a linear relationship between two variables, X and Y, and is measured by the (population) correlation coefficient. Correlation coefficients will range from 1 to +1. Scatter plot evaluates the relationship between two variables. 10
11 Linear Regression Find the line to minimize the squared error of the fit (least squares loss function) Y Error of fit to this point This is called a residual Fit Y = β 0 + β 1 x (note model can extend to any number of x s) x Predictive Model Y = x 11

12 Watch out for Nonsense Correlations! Beware lurking variables! Correlation does not mean Causation NOTE: images captured from the web 12
13 Simple Linear Regression ŷ= b0 + bx 1 Example: Keith s Auto Sales Reed Auto periodically has a special week-long sale. As part of the advertising campaign Reed runs one or more television commercials during the weekend preceding the sale. Based on a sample of 5 previous sales, determine whether number of cars sold is influenced by number of TV Ads. Number of TV Ads (x) Number of Cars Sold (y) Σx = 10 Σy = x = 2 y = 20 See Excel output 13

14 Simple Linear Regression Excel Output 14
15 Multiple Regression Model ^y = b 0 + b 1 x 1 + b 2 x b p x p Example: Programmer Salary Survey A software firm collected data for a sample of 20 computer programmers. A suggestion was made that regression analysis could be used to determine if salary was related to the years of experience and the score on the firm s programmer aptitude test. The years of experience, score on the aptitude test, and corresponding annual salary ($1000s) for a sample of 20 programmers is shown in the table. See Excel output Exper. Score Salary Exper. Score Salary

16 Multiple Linear Regression Excel Output 16
17 Predictive Modeling Regression Analysis Time Series Forecasting Machine Learning & Decision Trees 17
18 Time Series Forecasting? Forecasting is an estimate of future performance based on past/current performance Qualitative and Quantitative technique can be used for forecasting Forecasting can be used to get insight into future performance for better planning and managing the future activities Forecasting examples: Revenue forecasting Product demand forecasting Equipment purchase Inventory planning, etc. 18

")
19 Forecasting Inputs Sources: Internal: Performance history Experience Methods: Qualitative: Judgment Intuition Expectations External: Economy Market Customers Competition Quantitative: Data Statistical analysis Models Factors: Promotions Price changes Seasonal changes Trends / cycles Customer tastes Gov t regulations Forecast model should be better than Naïve models (which use Average or last period values) Forecast! 19

20 Forecasting Methods Graphical Techniques Life Cycle Models Combination of qualitative and quantitative techniques can be used for better forecasting.. 20
21 Qualitative Models Field Sales Force Bottom-Up Aggregation of Salesmen s Forecasts (subjective feel). Surveys are also used very often to get a feel for what the future holds. Jury of Executives A forecast developed by combining the subjective opinions of the managers and executives who are most likely to have the best insights. We use it internally (called as Forecast Markets) for product forecast and transition. Users Expectations Forecast based on users inputs (mostly subjective) Delphi Method Similar to Jury of Jury of Executives but the process is recursive until consensus among the panel members is reached. 21
22 Quantitative Time Series Models Naïve Forecast Simple Rules Based upon Prior Experience Trend Linear, Exponential, S-Curve and Other Types of Pattern Projection Moving Average Un-weighted Linear Combination of Past Actual Values Filters Weighted Linear Combination of Past Actual Values Exponential Smoothing Forecasts Obtained by Smoothing and Averaging Past Actual Values Decomposition Time Series Broken Into Trend, Seasonality, Cyclicality, and Randomness Data mining Mostly CART and Neural Network techniques are used for forecasting 22
23 Causal/Explanatory Models Regression Models: Modeling the value of an output based on the values of one or more inputs. Also called causal models (can have multiple inputs). Econometric Models: Simultaneous Systems of Multiple Regression Equations Life Cycle Models: Diffusion-based approach, used to predict market size and duration based on product acceptance behavior ARIMA Models: Class of time series models that take into consideration, various behavior of the response in question based on past time series data. Transfer Function Models: Class of time series models that take into consideration, various behavior of the response along with causal factors based on past time series data. 23
24 Simple Moving Average (or UWMA) The Simple Moving Average, or Uniformly Weighted Moving Average (UWMA) for a time period t, with a range span of k, is described as: First 3 data points averaged SMA t k i= = 1 k x t i The forecasted value for time t+1 becomes: SMA k = i= 1 t+ 1 x ( t+ 1) i k 24
25 Exponentially Weighted Moving Average (EWMA) In contrast to Simple Moving Average, Exponentially Weighted Moving Average (EWMA) for a time period t, uses all of previously observed data, instead of just a fixed range. Smoothed value for a time period, t, indicated by Z t. Z Z t t = α y = Z t 1 t 1 + (1 α) Z + α ( y t 1 Z t 1 t 1 ) or Each previous observation receives different weight, with more recent observations being weighted more heavily, and weights decreasing exponentially. How these weights decrease determined by smoothing parameter, α. Normally it ranges from 0.2 to 0.4. When α approaches 0, all prior observations have equal weight When α approaches 1, most weight is given to more recent observations Smoothing method should be done on stationary time series without seasonality. 25
26 Forecasting Scenario* Process: Sets of 10 coin flips What s the naïve model? Can you beat it? If so, how? 26

27 Forecasting: Common Pitfalls Good-fitting model accurate forecast Standard modeling methods can be (ab)used to over-fit the data Forecast Fitting a model to history is easy good forecasting is not. (SAS Institute) 27
28 Example: Regression vs. Time Series Time series: Collection of observations made over equally spaced time intervals E.g.: cost, inventory levels, shipment times, weekly forecast values Time Series Example: Monthly CO 2 concentrations from Mauna Loa captured for 14 years Estimate CO 2 data for next 2 years Intuitively, we could do better than the simple linear regression, right? Bivariate Fit of CO2 By Year/Month Forecast CO / / / / / / /1979 Simple linear regression model shows overall trend of data, but it is not a best representation of all patterns in data! 01/ / /1982 Year/Month 01/ / / / / / / /1990 Predicted Value Row Linear Fit Time Series Models can yield better predictive models! It takes advantage of correlation (s) between the current value and other responses that occurred previously in time 28
 Jul Aug Sep Oct Poly. (Trend) Nov 3 2.5 2 1.")
29 Components of a Time Series The time series data can mainly have the following components: Level Trend Cyclical Seasonal Irregular Dec Jan Feb Mar Apr May Jun Jul Level Aug Sep Oct Nov Dec Jan Feb Mar Apr May Jun Linear (Trend) Jul Aug Sep Oct Poly. (Trend) Nov Dec Jan Feb Mar Apr May Jun Jul Aug Seasonality Sep Oct Nov Level: Absence of trend, seasonality, or noise. Also, check for stability (Stationary vs. Nonstationary Trend: Continuing pattern of increase or decrease, either straight-line or curve Seasonal: A repeating pattern of increases and decreases that occurs with a regular frequency First plot your data chart to understand any behavior and relationships 29
30 Models to Account for Seasonality Think of creating model to account for Seasonality as extension of the exponential smoothing. There are 3 terms to estimate in a seasonal model, the Level, the Trend, and the Seasonal components. Seasonal Trend Level Forecast Now look at this CO 2 data from this perspective! Predicted Value Row 30


31 Sample Size Guidance observations recommended. More is better. 1 to 2 years of weekly data. 4 to 8 years of monthly data. 12 to 24 years of quarterly data. 31
32 Predictive Modeling Regression Analysis Time Series Forecasting Machine Learning & Decision Trees 32
33 Machine Learning (ML)/Data Mining (DM) Set clear business goal Get the right data Pre-processing Presentation ML/DM follows the problem solving methodology Model/Result New data Mine the data Determine what is interesting Training data Testing data 33
34 Decision Trees (Classification) Finds the best factor split points to minimize the classification error Y = x2 Or Model classification error x1 Y is a 2 level categorical variable < 3 Predictive Model If x1< 4.5 and x2 < 3 Then Y = Else Y = < 4.5 x2 x1 The model is a piecewise constant function 34


35 Iris data Clustering Analysis Iris data first published by geneticist and statistician Ronald Fisher in 1936 is widely used in machine learning for benchmarking. The sepal length, sepal width, petal length, and petal width are measured in mm on fifty Iris specimens from each of three species: 1. Iris Setosa 2. Iris Versicolor 3. Iris Virginica Machine learning goal is to classify the species based on the flower characteristics 35

36 Iris data Y: 1=Setosa, 2=Versicolor & 3=Virginica; X: Sepal Length, Sepal Width, Petal Length and Petal Width Scatterplot Matrix Sepal length Species setosa versicolor virginica Sepal w idth 5 3 Petal length Petal w idth

37 Tree building Scatterplot Matrix Sepal length Species setosa versicolor virginica Sepal w idth 1 OPTIMAL Petal length Petal w idth
38 Tree building virginica Species 0.50 versicolor 0.25 setosa 0.00 All Row s Split virginica Species 0.50 versicolor 0.25 setosa 0.00 Petal w idth>=0.8 All Row s Petal w idth< virginica Species 0.50 versicolor 0.25 setosa 0.00 Petal w idth<1.8 Petal w idth>=1.8 Petal w idth>=0.8 All Row s Petal w idth<0.8 38


39 Single tree: Classification vs. regression Classification Categorical Response: Species Regression Continuous Response: Species Number Output: Classification counts, and Misclassification % Output: mean and variance for each node. 39
40 Gartner Magic Quadrant - Data Science 40


41 Business Analytics 41
42 Questions? 42
Copyr i g ht 2012, SAS Ins titut e Inc. All rights res er ve d. ENTERPRISE MINER: ANALYTICAL MODEL DEVELOPMENT
 ENTERPRISE MINER: ANALYTICAL MODEL DEVELOPMENT ANALYTICAL MODEL DEVELOPMENT AGENDA Enterprise Miner: Analytical Model Development The session looks at: - Supervised and Unsupervised Modelling - Classification
Choosing the Right Type of Forecasting Model: Introduction Statistics, Econometrics, and Forecasting Concept of Forecast Accuracy: Compared to What?
 Choosing the Right Type of Forecasting Model: Statistics, Econometrics, and Forecasting Concept of Forecast Accuracy: Compared to What? Structural Shifts in Parameters Model Misspecification Missing, Smoothed,
Preface to the third edition Preface to the first edition Acknowledgments
 Contents Foreword Preface to the third edition Preface to the first edition Acknowledgments Part I PRELIMINARIES XXI XXIII XXVII XXIX CHAPTER 1 Introduction 3 1.1 What Is Business Analytics?................
Electric Forward Market Report
 Mar-01 Mar-02 Jun-02 Sep-02 Dec-02 Mar-03 Jun-03 Sep-03 Dec-03 Mar-04 Jun-04 Sep-04 Dec-04 Mar-05 May-05 Aug-05 Nov-05 Feb-06 Jun-06 Sep-06 Dec-06 Mar-07 Jun-07 Sep-07 Dec-07 Apr-08 Jun-08 Sep-08 Dec-08
Getting the Most out of Statistical Forecasting!
 Getting the Most out of Statistical Forecasting! Author: Ryan Rickard, Senior Consultant Published: July 2017 About SCMO 2 Founded in 2001, SCMO2 Specializes in High-End Supply Chain Consulting Work Focused
Data Science Training Course
 About Intellipaat Intellipaat is a fast-growing professional training provider that is offering training in over 150 most sought-after tools and technologies. We have a learner base of 600,000 in over
FORECASTING INDICES FOR CONSTRUCTION ACTIVITIES IN THE HEAVY CIVIL ENGINEERING INDUSTRY: A JOINT APPROACH METHODOLOGY
 FORECASTING INDICES FOR CONSTRUCTION ACTIVITIES IN THE HEAVY CIVIL ENGINEERING INDUSTRY: A JOINT APPROACH METHODOLOGY N Dawood and W Bates School of Science and Technology, University of Teesside, Middlesbrough,
Technical note on seasonal adjustment for Non oil exports
 Technical note on seasonal adjustment for Non oil exports July 1, 2013 Contents 1 Non oil exports 2 1.1 Additive verus multiplicative seasonality...................... 2 2 Steps in the seasonal adjustment
Forecasting Seasonal Footwear Demand Using Machine Learning. By Majd Kharfan & Vicky Chan, SCM 2018 Advisor: Tugba Efendigil
 Forecasting Seasonal Footwear Demand Using Machine Learning By Majd Kharfan & Vicky Chan, SCM 2018 Advisor: Tugba Efendigil 1 Agenda Ø Ø Ø Ø Ø Ø Ø The State Of Fashion Industry Research Objectives AI In
Semester 1 Session 9a Planning and Forecasting Nature and purpose Objectives
 Management and Planning SEMESTER 1 September 2009 Semester 1 Session 9a Planning and Forecasting Nature and purpose Objectives To be able to describe and discuss What a Forecast is Reasons for Forecasting
Demand Forecasting for Materials to Improve Production Capability Planning in BASF
 Demand Forecasting for Materials to Improve Production Capability Planning in BASF Team 6 Raden Agoeng Bhimasta, Dana Tai, Daniel Viet-Cuong Trieu, Will Kuan National Tsing-Hua University About BASF BASF
Chapter 5 Demand Forecasting
 Chapter 5 Demand Forecasting TRUE/FALSE 1. One of the goals of an effective CPFR system is to minimize the negative impacts of the bullwhip effect on supply chains. 2. The modern day business environment
Managers require good forecasts of future events. Business Analysts may choose from a wide range of forecasting techniques to support decision making.
 Managers require good forecasts of future events. Business Analysts may choose from a wide range of forecasting techniques to support decision making. Three major categories of forecasting approaches:
Sales Forecast for Rossmann Stores SUBMITTED BY: GROUP A-8
 Sales Forecast for Rossmann Stores SUBMITTED BY: GROUP A-8 Executive Summary: a. Problem description: Business Problem: Rossman is Germany s second largest drug store chain with more than 1000 stores across
Leveraging Smart Meter Data & Expanding Services BY ELLEN FRANCONI, PH.D., BEMP, MEMBER ASHRAE; DAVID JUMP, PH.D., P.E.
 ASHRAE www.ashrae.org. Used with permission from ASHRAE Journal. This article may not be copied nor distributed in either paper or digital form without ASHRAE s permission. For more information about ASHRAE,
The MMM Playbook. Cartesian Consulting
 The MMM Playbook Cartesian Consulting Introduction Marketing Mix Modeling (MMM) decomposes sales into two main components: baseline sales (mainly driven by factors such as seasonality, brand awareness
Chapter 3 Sales forecasting
 Chapter 3 Sales forecasting Nature and purpose of sales forecasting It would not be hard to be a successful business person if you had a crystal ball and could look into the future. If you knew which products
Lucas Finco NY INFORMS October 2014
 Lucas Finco NY INFORMS October 2014 1 Table of Contents I. Leading Indicators II. Previous Analysis III. New Direction IV. Limitations and Future Directions 2 Table of Contents I. Leading Indicators II.
Analytics for Banks. September 19, 2017
 Analytics for Banks September 19, 2017 Outline About AlgoAnalytics Problems we can solve for banks Our experience Technology Page 2 About AlgoAnalytics Analytics Consultancy Work at the intersection of
COMPILED BY 10/09/2014 JMP/LOGISTICS/UNIT I/RADHA IYER
 DEMAND FORECASTING COMPILED BY RADHA IYER 1 What is demand forecasting? It is a tool which attempts to cope up with the uncertainty of the future. Starts with certain assumptions based on experience, knowledge
Forecasting With History
 Forecasting With History Santiago Gallino Tuck School of Business Toni Moreno Kellogg School of Management January 2017 July 2013 LBS London, UK Learning Modules 1. Demand forecasting 2. Inventory Decisions
In-depth Analytics of Pricing Discovery
 In-depth Analytics of Pricing Discovery Donald Davidoff, D2 Demand Solutions Annie Laurie McCulloh, Rainmaker LRO Rich Hughes, RealPage Agenda 1. Forecasting Forecasting Model Options Principles of Forecasting
How it really works! Advanced streaming and edge analytics methods in industry 4.0 Dr. Nicole Tschauder, SAS DACH Industry of Things World 2018,
 How it really works! Advanced streaming and edge analytics methods in industry 4.0 Dr. Nicole Tschauder, SAS DACH Industry of Things World 2018, Berlin IoT-Projects are like building a house It only succeeds
Applying Regression Techniques For Predictive Analytics Paviya George Chemparathy
 Applying Regression Techniques For Predictive Analytics Paviya George Chemparathy AGENDA 1. Introduction 2. Use Cases 3. Popular Algorithms 4. Typical Approach 5. Case Study 2016 SAPIENT GLOBAL MARKETS
Forecasting Survey. How far into the future do you typically project when trying to forecast the health of your industry? less than 4 months 3%
 Forecasting Forecasting Survey How far into the future do you typically project when trying to forecast the health of your industry? less than 4 months 3% 4-6 months 12% 7-12 months 28% > 12 months 57%
and Forecasting CONCEPTS
 6 Demand Estimation and Forecasting CONCEPTS Regression Method Scatter Diagram Linear Regression Regression Line Independent Variable Explanatory Variable Dependent Variable Intercept Coefficient Slope
Forecasting models for short and long term gas price
 Forecasting models for short and long term gas price A Data Science point of view 2nd AIEE Energy Symposium, Rome, Italy November 3, 2017 Introduction Macroeconomic, Energy Analysis and Forecasting (MEAF)
Professor Dr. Gholamreza Nakhaeizadeh. Professor Dr. Gholamreza Nakhaeizadeh
 Statistic Methods in in Mining Business Understanding Understanding Preparation Deployment Modelling Evaluation Mining Process (( Part 3) 3) Professor Dr. Gholamreza Nakhaeizadeh Professor Dr. Gholamreza
Machine Learning Models for Sales Time Series Forecasting
 Article Machine Learning Models for Sales Time Series Forecasting Bohdan M. Pavlyshenko SoftServe, Inc., Ivan Franko National University of Lviv * Correspondence: bpavl@softserveinc.com, b.pavlyshenko@gmail.com
Linear model to forecast sales from past data of Rossmann drug Store
 Abstract Linear model to forecast sales from past data of Rossmann drug Store Group id: G3 Recent years, the explosive growth in data results in the need to develop new tools to process data into knowledge
CHAPTER Activity Cost Behavior
 3-1 CHAPTER Activity Cost Behavior Objectives 3-2 1. Define cost behavior After studying for fixed, this variable, and mixed costs. chapter, you should 2. Explain the role be of the able resource to: usage
Building the In-Demand Skills for Analytics and Data Science Course Outline
 Day 1 Module 1 - Predictive Analytics Concepts What and Why of Predictive Analytics o Predictive Analytics Defined o Business Value of Predictive Analytics The Foundation for Predictive Analytics o Statistical
Classification and Regression Trees (CART)
") Classification and Regression Trees (CART) Revised: 10/10/2017 Summary... 1 Data Input... 4 Analysis Options... 6 Tables and Graphs... 7 Analysis Summary... 8 R Tree Diagram... 10 Tree Diagram... 11 R
Classification and Regression Trees (CART) Revised: 10/10/2017 Summary... 1 Data Input... 4 Analysis Options... 6 Tables and Graphs... 7 Analysis Summary... 8 R Tree Diagram... 10 Tree Diagram... 11 R
From Fraud Analytics Using Descriptive, Predictive, and Social Network Techniques. Full book available for purchase here.
 From Fraud Analytics Using Descriptive, Predictive, and Social Network Techniques. Full book available for purchase here. Contents List of Figures xv Foreword xxiii Preface xxv Acknowledgments xxix Chapter
SYNCHRONY CONNECT. Making an Impact with Direct Marketing Test and Learn Strategies that Maximize ROI
 SYNCHRONY CONNECT Making an Impact with Direct Marketing Test and Learn Strategies that Maximize ROI SYNCHRONY CONNECT GROW 2 Word on the street is that direct marketing is all but dead. Digital and social
5 Star London Hotels - Example Report
 5 Star London Hotels - Example Report January 2018 CONTENTS Your Benchmark Report Website Traffic Conversion Rates Ecommerce Performance AdWords Spend Your Traffic Index Your Conversion Rate Index Your
DATA ANALYTICS WITH R, EXCEL & TABLEAU
 Learn. Do. Earn. DATA ANALYTICS WITH R, EXCEL & TABLEAU COURSE DETAILS centers@acadgild.com www.acadgild.com 90360 10796 Brief About this Course Data is the foundation for technology-driven digital age.
ANNUAL QUALITY REPORT
 REPUBLIC OF SLOVENIA ANNUAL QUALITY REPORT FOR THE SURVEY MONTHLY REPORT ON SERVICE ACTIVITIES AND MONTHLY REPORT ON WHOLESALE TRADE FOR Prepared by: Barbara Troha Ažbe, Rudi Seljak Date: March 2014 1/12
Code Compulsory Module Credits Continuous Assignment
 CURRICULUM AND SCHEME OF EVALUATION Compulsory Modules Evaluation (%) Code Compulsory Module Credits Continuous Assignment Final Exam MA 5210 Probability and Statistics 3 40±10 60 10 MA 5202 Statistical
POST GRADUATE PROGRAM IN DATA SCIENCE & MACHINE LEARNING (PGPDM)
") OUTLINE FOR THE POST GRADUATE PROGRAM IN DATA SCIENCE & MACHINE LEARNING (PGPDM) Module Subject Topics Learning outcomes Delivered by Exploratory & Visualization Framework Exploratory Data Collection and
OUTLINE FOR THE POST GRADUATE PROGRAM IN DATA SCIENCE & MACHINE LEARNING (PGPDM) Module Subject Topics Learning outcomes Delivered by Exploratory & Visualization Framework Exploratory Data Collection and
Administration Division Public Works Department Anchorage: Performance. Value. Results.
 Administration Division Anchorage: Performance. Value. Results. Mission Provide administrative, budgetary, fiscal, and personnel support to ensure departmental compliance with Municipal policies and procedures,
Learn What s New. Statistical Software
 Statistical Software Learn What s New Upgrade now to access new and improved statistical features and other enhancements that make it even easier to analyze your data. The Assistant Let Minitab s Assistant
A Comparative Study of Different Statistical Techniques Applied to Predict Share Value of State Bank of India (SBI)
") A Comparative Study of Different Statistical Techniques Applied to Predict Share Value of State Bank of India (SBI) Hota H.S., Sahu Pushpanjali Abstract. Prediction of share value is one of the critical
A Comparative Study of Different Statistical Techniques Applied to Predict Share Value of State Bank of India (SBI) Hota H.S., Sahu Pushpanjali Abstract. Prediction of share value is one of the critical
Woking. q business confidence report
 Woking q1 business confidence report Woking q1 report headlines saw a new record in company registrations in Woking when compared to any previous. was a record quarter for company registrations in Woking
SPM 8.2. Salford Predictive Modeler
 SPM 8.2 Salford Predictive Modeler SPM 8.2 The SPM Salford Predictive Modeler software suite is a highly accurate and ultra-fast platform for developing predictive, descriptive, and analytical models from
Masters in Business Statistics (MBS) /2015. Department of Mathematics Faculty of Engineering University of Moratuwa Moratuwa. Web:
 /2015. Department of Mathematics Faculty of Engineering University of Moratuwa Moratuwa. Web:") Masters in Business Statistics (MBS) - 2014/2015 Department of Mathematics Faculty of Engineering University of Moratuwa Moratuwa Web: www.mrt.ac.lk Course Coordinator: Prof. T S G Peiris Prof. in Applied
Masters in Business Statistics (MBS) - 2014/2015 Department of Mathematics Faculty of Engineering University of Moratuwa Moratuwa Web: www.mrt.ac.lk Course Coordinator: Prof. T S G Peiris Prof. in Applied
Predictive Modeling Using SAS Visual Statistics: Beyond the Prediction
 Paper SAS1774-2015 Predictive Modeling Using SAS Visual Statistics: Beyond the Prediction ABSTRACT Xiangxiang Meng, Wayne Thompson, and Jennifer Ames, SAS Institute Inc. Predictions, including regressions
Salford Predictive Modeler. Powerful machine learning software for developing predictive, descriptive, and analytical models.
 Powerful machine learning software for developing predictive, descriptive, and analytical models. The Company Minitab helps companies and institutions to spot trends, solve problems and discover valuable
Do Customers Respond to Real-Time Usage Feedback? Evidence from Singapore
 Do Customers Respond to Real-Time Usage Feedback? Evidence from Singapore Frank A. Wolak Director, Program on Energy and Sustainable Development Professor, Department of Economics Stanford University Stanford,
Sample Report Market Sensitivity 30 Year, Fixed, Conforming Mortgages
 Sample Report Market Sensitivity 30 Year, Fixed, Conforming Mortgages DATA is for informational purposes and is not specific to any bank 2010 Heitman Analytics 1 Executive Summary Determine the relationship
IBM SPSS Statistics: What s New
 : What s New New and enhanced features to accelerate, optimize and simplify data analysis Highlights Extend analytics capabilities to a broader set of users with a cost-effective, pay-as-you-go software
Adaptive Time Series Forecasting of Energy Consumption using Optimized Cluster Analysis
 Adaptive Time Series Forecasting of Energy Consumption using Optimized Cluster Analysis Peter Laurinec, Marek Lóderer, Petra Vrablecová, Mária Lucká, Viera Rozinajová, Anna Bou Ezzeddine 12.12.2016 Slovak
SOCIAL MEDIA MINING. Behavior Analytics
 SOCIAL MEDIA MINING Behavior Analytics Dear instructors/users of these slides: Please feel free to include these slides in your own material, or modify them as you see fit. If you decide to incorporate
AUSTIN AREA SUMMARY REPORT ON BUSINESS February 2018
 INSTITUTE FOR SUPPLY MANAGEMENT- ISM AUSTIN, INC. P.O. Box 26155 Austin, Texas 78755-0155 Steven Leatherwood, CPSM, MCIPS Econ-report@ism-austin.org AUSTIN AREA SUMMARY REPORT ON BUSINESS Region Economy
GOVERNMENT ANALYTICS LEADERSHIP FORUM SAS Canada & The Institute of Public Administration of Canada. April 26 The Shaw Centre
 GOVERNMENT ANALYTICS LEADERSHIP FORUM SAS Canada & The Institute of Public Administration of Canada April 26 The Shaw Centre Ottawa Artificial Intelligence Algorithms Automation Deep Learning Machine Learning
THE VALUE OF DISCRETE-EVENT SIMULATION IN COMPUTER-AIDED PROCESS OPERATIONS
 THE VALUE OF DISCRETE-EVENT SIMULATION IN COMPUTER-AIDED PROCESS OPERATIONS Foundations of Computer Aided Process Operations Conference Ricki G. Ingalls, PhD Texas State University Diamond Head Associates,
Week 1 Business Forecasting
 Week 1 Business Forecasting Forecasting is an attempt to foresee the future by examining the past, present and trends Forecasting involves the prediction of future events or future outcomes of key variables.
Getting the best out of forecasting software
 Getting the best out of forecasting software Robert Fildes Professor, Department of Management Science Centre for Marketing Analytics and Forecasting Nikolaos Kourentzes Professor, Department of Management
Predictive Modeling using SAS. Principles and Best Practices CAROLYN OLSEN & DANIEL FUHRMANN
 Predictive Modeling using SAS Enterprise Miner and SAS/STAT : Principles and Best Practices CAROLYN OLSEN & DANIEL FUHRMANN 1 Overview This presentation will: Provide a brief introduction of how to set
Finding Hidden Intelligence with Predictive Analysis of Data Mining
 Finding Hidden Intelligence with Predictive Analysis of Data Mining Rafal Lukawiecki Strategic Consultant, Project Botticelli Ltd rafal@projectbotticelli.com Objectives Show use of Microsoft SQL Server
Aggregate Planning (session 1,2)
") Aggregate Planning (session 1,2) 1 Outline The Planning Process The Nature of Aggregate Planning Aggregate Planning Strategies Capacity Options Demand Options Mixing Options to Develop a Plan Methods for
Aggregate Planning (session 1,2) 1 Outline The Planning Process The Nature of Aggregate Planning Aggregate Planning Strategies Capacity Options Demand Options Mixing Options to Develop a Plan Methods for
Getting the best out of forecasting software
 Getting the best out of forecasting software Robert Fildes Professor, Department of Management Science Centre for Marketing Analytics and Forecasting Nikolaos Kourentzes Professor, Department of Management
OLAP Technologies and Applications
 OLAP Technologies and Applications James Waite SAS Training Specialist Objectives Define Business Intelligence Identify role of OLAP in the BI Platform Discuss cube structure Demo SAS OLAP Applications
Business Analytics & Data Mining Modeling Using R Dr. Gaurav Dixit Department of Management Studies Indian Institute of Technology, Roorkee
 Business Analytics & Data Mining Modeling Using R Dr. Gaurav Dixit Department of Management Studies Indian Institute of Technology, Roorkee Lecture - 02 Data Mining Process Welcome to the lecture 2 of
EquilibriumSolver Fact Sheet
 EquilibriumSolver Fact Sheet EquilibriumSolver (EQS) is an Excel/VBA application that simultaneously computes a history and forecast of Unit Shipments, Installed Base, and the Rate at which installed base
Digital Behavior Analytics. Combining deep analysis, experience and judgement to enable meaningful marketing actions
 Digital Behavior Analytics Combining deep analysis, experience and judgement to enable meaningful marketing actions 1 Data doesn t just come from surveys anymore The modern advertising landscape has seen
Statistics 712: Applied Statistical Decision Theory Spring 1999 Syllabus
 1 Statistics 712: Applied Statistical Decision Theory Spring 1999 Syllabus Robert Stine stine@wharton.upenn.edu Department of Statistics 3014 Steinburg Hall-Dietrich Hall / 6302 Overview This course describes
Deep Dive into High Performance Machine Learning Procedures. Tuba Islam, Analytics CoE, SAS UK
 Deep Dive into High Performance Machine Learning Procedures Tuba Islam, Analytics CoE, SAS UK WHAT IS MACHINE LEARNING? Wikipedia: Machine learning, a branch of artificial intelligence, concerns the construction
Chapter 6 Planning and Controlling Production: Work-in-Process and Finished-Good Inventories. Omar Maguiña Rivero
 Chapter 6 Planning and Controlling Production: Work-in-Process and Finished-Good Inventories Learning Objectives At the end of the class the student will be able to: 1. Describe the production budget process
DEPARTMENT OF QUANTITATIVE METHODS & INFORMATION SYSTEMS
 DEPARTMENT OF QUANTITATIVE METHODS & INFORMATION SYSTEMS Time Series and Their Components QMIS 320 Chapter 5 Fall 2010 Dr. Mohammad Zainal 2 Time series are often recorded at fixed time intervals. For
Practice Final Exam STCC204
 Practice Final Exam STCC24 The following are the types of questions you can expect on the final exam. There are 24 questions on this practice exam, so it should give you a good indication of the length
QUARTERLY FORECAST REPORT 2ND QUARTER
 QUARTERLY FORECAST REPORT 2ND QUARTER 216 77 Sundial Ave. Suite 51 W. Manchester, NH 313 E-mail: itr@itreconomics.com Quarterly Forecast Report Table of Contents Definitions & Methodology... 3 MTI Average
Marketing & Big Data
 Marketing & Big Data Surat Teerakapibal, Ph.D. Lecturer in Marketing Director, Doctor of Philosophy Program in Business Administration Thammasat Business School What is Marketing? Anti-Marketing Marketing
METHOD FOR VALIDATION OF STATISTICAL ENERGY MODELS. Department of Mechanical Engineering, Dalhousie University Halifax.
 METHOD FOR VALIDATION OF STATISTICAL ENERGY MODELS Miroslava Kavgic 1, Trent Hilliard 1, Lukas Swan 1, Zheng Qin 2 1 Department of Mechanical Engineering, Dalhousie University Halifax. NS, Canada 2 Green
Continuous Improvement Toolkit. Graphical Analysis. Continuous Improvement Toolkit.
 Continuous Improvement Toolkit Graphical Analysis The Continuous Improvement Map Managing Risk FMEA Understanding Performance Check Sheets Data Collection PDPC RAID Log* Risk Assessment* Fault Tree Analysis
Forecasting. Managerial Economics: Economic Tools for Today s Decision Makers, 4/e
 Forecasting Chapter 6 Managerial Economics: Economic Tools for Today s Decision Makers, 4/e By Paul Keat and Philip Young Forecasting Introduction Subjects of fforecasts Prerequisites for a Good Forecast
Progress Report: Predicting Which Recommended Content Users Click Stanley Jacob, Lingjie Kong
 Progress Report: Predicting Which Recommended Content Users Click Stanley Jacob, Lingjie Kong Machine learning models can be used to predict which recommended content users will click on a given website.
Predicting and Explaining Price-Spikes in Real-Time Electricity Markets
 Predicting and Explaining Price-Spikes in Real-Time Electricity Markets Christian Brown #1, Gregory Von Wald #2 # Energy Resources Engineering Department, Stanford University 367 Panama St, Stanford, CA
Optimal Pricing & Market Positioning. Innovations in RM to maximise sales & optimise revenue
 Optimal Pricing & Market Positioning Innovations in RM to maximise sales & optimise revenue Starting off on the right path Setting off on the right path Copyr i g ht 2013, SAS Ins titut e Inc. All rights
Methods and Applications of Statistics in Business, Finance, and Management Science
 Methods and Applications of Statistics in Business, Finance, and Management Science N. Balakrishnan McMaster University Department ofstatistics Hamilton, Ontario, Canada 4 WILEY A JOHN WILEY & SONS, INC.,
SOLUTIONS. available on OLAT; else go to the library or to the department [at the secretary, or ask Stefan]):
![SOLUTIONS. available on OLAT; else go to the library or to the department [at the secretary, or ask Stefan]):](/thumbs/83/87448235.jpg "SOLUTIONS. available on OLAT; else go to the library or to the department [at the secretary, or ask Stefan]):") SOLUTIONS 1.2 Operations Management/Research Basics (see chapter 1-3 of Buzacott et al. 2013; parts are available on OLAT; else go to the library or to the department [at the secretary, or ask Stefan]):
SOLUTIONS 1.2 Operations Management/Research Basics (see chapter 1-3 of Buzacott et al. 2013; parts are available on OLAT; else go to the library or to the department [at the secretary, or ask Stefan]):
WEEKLY WHEAT REPORT 25 SEPTEMBER 2018
 18/01/02 18/01/16 18/01/30 18/02/13 18/02/27 18/03/13 18/03/27 18/04/10 18/04/24 18/05/08 18/05/22 18/06/05 18/06/19 18/07/03 18/07/17 18/07/31 18/08/14 18/08/28 18/09/11 18/09/25 WEEKLY WHEAT REPORT 25
DASI: Analytics in Practice and Academic Analytics Preparation
 DASI: Analytics in Practice and Academic Analytics Preparation Mia Stephens mia.stephens@jmp.com Copyright 2010 SAS Institute Inc. All rights reserved. Background TQM Coordinator/Six Sigma MBB Founding
What is a Successful Company
 Welcome 15 Things All Successful Companies Have in Common! We have trained over 14,000 contractors, from coast-to-coast, how to run profitable companies! Bill Kinnard, Vice President What is a Successful
KnowledgeSTUDIO. Advanced Modeling for Better Decisions. Data Preparation, Data Profiling and Exploration
 KnowledgeSTUDIO Advanced Modeling for Better Decisions Companies that compete with analytics are looking for advanced analytical technologies that accelerate decision making and identify opportunities
Distinguish between different types of numerical data and different data collection processes.
 Level: Diploma in Business Learning Outcomes 1.1 1.3 Distinguish between different types of numerical data and different data collection processes. Introduce the course by defining statistics and explaining
CHAPTER. Activity Cost Behavior
 3-1 CHAPTER Activity Cost Behavior 3-2 Objectives 1. Define cost behavior After for fixed, variable, and studying this mixed costs. chapter, you should 2. Explain the role of be the resource usage model
DATA MINING AND BUSINESS ANALYTICS WITH R
 DATA MINING AND BUSINESS ANALYTICS WITH R DATA MINING AND BUSINESS ANALYTICS WITH R Johannes Ledolter Department of Management Sciences Tippie College of Business University of Iowa Iowa City, Iowa Copyright
Advanced Quantitative Research Methodology, Lecture Notes: Text Analysis: Supervised Learning
 Advanced Quantitative Research Methodology, Lecture Notes: Text Analysis: Supervised Learning Gary King Institute for Quantitative Social Science Harvard University April 22, 2012 Gary King (Harvard, IQSS)
Econometric Forecasting in a Lost Profits Case
 Econometric Forecasting in a Lost Profits Case I read with interest the recent article by A. Frank Adams, III, Ph.D., in the May /June 2008 issue of The Value Examiner1. I applaud Dr. Adams for his attempt
The Outlook for Advertising AdWatch 2004
 The Outlook for Advertising AdWatch 2004 TNS Media Intelligence/CMR Advertising and Marketing Intelligence Across Brand, Media, Industry and Market Leading provider of strategic advertising and marketing
Data Mining. Textbook:
 Data Mining Textbook: DATA MINING: Practical Machine Learning Tools and Techniques, 2nd Edition, by Ian H. Witten and Eibe Frank, Morgan Kaufmann Publishers, 2005. Chapter 1: What s it all about? 1 Chapter
Getting the Most out of Statistical Forecasting!
 Getting the Most out of Statistical Forecasting! Author: Ryan Rickard, Senior Consultant Published: June 2017 About SCMO 2 Founded in 2001, SCMO2 Specializes in High-End Supply Chain Consulting Work Focused
Planning and Sourcing
 Planning and Sourcing Sales Forecast Accuracy A Lot of Talk, but Is There Enough Action? Facilitated by Matt Wilkerson and Colin Maxwell September 9-10, 2008 New Orleans, LA Session Content Analysis of
Effective CRM Using. Predictive Analytics. Antonios Chorianopoulos
 Effective CRM Using Predictive Analytics Antonios Chorianopoulos WlLEY Contents Preface Acknowledgments xiii xv 1 An overview of data mining: The applications, the methodology, the algorithms, and the
USES THE BAGGING ALGORITHM OF CLASSIFICATION METHOD WITH WEKA TOOL FOR PREDICTION TECHNIQUE
 USES THE BAGGING ALGORITHM OF CLASSIFICATION METHOD WITH WEKA TOOL FOR PREDICTION TECHNIQUE 1 POOJA SHRIVASTAVA, 2 MANOJ SHUKLA 1 Computer Science and Engineering, Jayoti Vidyapeeth Women s University,
Who Are My Best Customers?
 Technical report Who Are My Best Customers? Using SPSS to get greater value from your customer database Table of contents Introduction..............................................................2 Exploring
Data-Driven Decision Making in HR: Where the Rubber Meets the Road
 Data-Driven Decision Making in HR: Where the Rubber Meets the Road April 26, 2016 Facilitator: Madhura Chakrabarti, Ph.D., Research Manager Bersin by Deloitte, Deloitte Consulting LLP Andrew Biga, Ph.D.
Rethinking branding metrics: how to turn brand consideration into a performance metric
 Rethinking branding metrics: how to turn brand consideration into a performance metric Rethinking branding metrics: how to turn brand consideration into a performance metric Many companies struggle with
AP Statistics Scope & Sequence
 AP Statistics Scope & Sequence Grading Period Unit Title Learning Targets Throughout the School Year First Grading Period *Apply mathematics to problems in everyday life *Use a problem-solving model that