Elastohydrodynamic Lubrication with Polyolester Lubricants and HFC Refrigerants. Final Report
|
|
|
- Patricia Baldwin
- 6 years ago
- Views:
Transcription
1 DOE/CE/ Elastohydrodynamic Lubrication with Polyolester Lubricants and HFC Refrigerants Final Report Volume I April 1999 Selda Gunsel Michael Pozebanchuk Pennzoil Products Company Technology Center 1520 Lake Front Circle The Woodlands, TX USA Prepared for: The Air Conditioning and Refrigeration Technology Institute under ARTI MCLR Project Number This research project is supported, in whole or in part, by U.S. Department of Energy grant number DE-FG02-91CE23810: Materials Compatibilities and Lubricants Research (MCLR) on CFC-Refrigerant Substitutes. Federal funding supporting the MCLR program constitutes 93.57% of allowable costs. Funding from the air-conditioning and refrigeration industry supporting the MCLR program consists of direct cost sharing of 6.43% of allowable costs and significant in-kind contributions.
2 DISCLAIMER The U.S. Department of Energy s and the air-conditioning industry s support for the Materials Compatibility and Lubricants Research (MCLR) program does not constitute an endorsement by the U.S. Department of Energy, nor by the air-conditioning and refrigeration industry, of the views expressed herein. NOTICE This report was prepared on account of work sponsored by the United States Government. Neither the United States Government, nor the Department of Energy, nor the Air Conditioning and Refrigeration Technology Institute, nor any of their employees, nor any of their contractors, subcontractors, or their employees, makes any warranty, expressed or implied, or assumes any legal liability or responsibility for the accuracy, completeness, or usefulness of any information, apparatus, product or process disclosed or represents that its use would not infringe privatelyowned rights. DISCLAIMER This report was prepared by Pennzoil Products Company for the Air Conditioning and Refrigeration Technology Institute. The material in it reflects Pennzoil Products Company s best judgment in light of the information available to it at the time of preparation. Any use which a third party makes of this report, or any reliance on or decisions to be made based on it, are the responsibility of such third party. Pennzoil Products Company accepts no responsibility for damages, if any, suffered by any third party as a result of decisions made or actions taken based on this report. ACKNOWLEDGEMENT The authors would like to express their thanks to Glenn Hourahan (ARTI) for his support and assistance throughout this study. The authors also thank Richard Ernst (Trane), Robert Doerr (Trane), Arthur Butterworth (Trane), Phillip Johnson (Frick), Alex Lifson (Carlyle Compressor Co.), S. Ganesan Sundaresan (Copeland Corporation), Thomas E. Watson (McQuay International), Robert Yost (ICI), Mirjam Wilson (ICI), Aditi Mulay (Copeland), Victor Cheng (Mobil), and Lori Homolish (Idemitsu-Kosan) for solubility, viscosity and density information and helpful discussions. The authors appreciate the assistance of Sylvia Reneau in preparing this report. ii
3 TABLE OF CONTENTS VOLUME I Section Title Page 1.0 EXECUTIVE SUMMARY INTRODUCTION BACKGROUND Changes in Refrigerant Technology Impact on Lubrication Elastohydrodynamic Lubrication Film Thickness Measurements Pressure-Viscosity Coefficient SCOPE AND TECHNICAL APPROACH TEST METHOD Ultrathin Film Interferometry Method Lubricant Film Thickness Measurements Film Thickness Measurements for Lubricant/Refrigerant Mixtures Pressurized Test Rig Test Procedure and Conditions Test Fluids RESULTS Film Thickness Measurements on Lubricants Under Air Naphthenic Mineral Oils Polyolesters Polyvinyl Ethers Repeatability of Measurements Effective Pressure-Viscosity Coefficients Film Thickness Measurements on Mixtures of Naphthenic Mineral Oils and R ISO 32 Naphthenic Mineral Oil/R ISO 68 Naphthenic Mineral Oil/R Effect of Refrigerant Concentration (R-22) on Effective Pressure-Viscosity Coefficients of Naphthenic Mineral Oils 59 iii
4 6.4 Film Thickness Measurements on Mixtures of Polyolesters and R-134a ISO 32 Polyolester/R-134a ISO 68 Polyolesters/R-134a Effect of Refrigerant Concentration (R-134a) on Effective Pressure-Viscosity Coefficients of Polyolesters Film Thickness Measurements on Mixtures of Polyvinyl Ethers and R-134a ISO 32 Polyvinyl Ether/R-134a ISO 68 Polyvinyl Ether/R-134a Effect of Refrigerant Concentration (R-134a) on Effective Pressure-Viscosity Coefficients of Polyvinyl Ethers Film Thickness Measurements on Mixtures of Polyolesters and R-410A ISO 32 Polyolester/R-410A ISO 68 Polyolester A/R-410A Effect of Refrigerant (R-410A) Concentration on Effective Pressure-Viscosity Coefficients of Polyolesters Film Thickness Measurements on Mixtures of Polyvinyl Ethers and R-410A ISO 32 Polyvinyl Ether/R-410A ISO 68 Polyvinyl Ether/R-410A Effect of Refrigerant Concentration (R-410A) on Effective Pressure-Viscosity Coefficients of Polyvinyl Ethers Comparison of Different Lubricant/Refrigerant Systems Polyolesters/R-134a vs. Mineral Oils/R Polyvinyl Ethers/R134a vs. Polyolesters/R-134a and Mineral Oils/R Polyolesters/R410A vs. Mineral Oils/R Polyvinyl Ethers/R-410A vs. Polyolesters/R-410A and Mineral Oils/R R-410A vs. R-134a Effective Pressure-Viscosity Coefficients CONCLUSIONS FUTURE WORK 206 COMPLIANCE WITH AGREEMENT 208 PRINCIPAL INVESTIGATOR EFFORT 208 iv
5 REFERENCES 209 APPENDICES: Appendix A RI Determination for Lubricant/Refrigerant Mixtures 215 Appendix B RI Correction for Contact Pressure 216 Appendix C Commercial Identification 217 VOLUME II Raw Data Note: Raw Data is contained in a separate volume (Volume II). v
6 LIST OF TABLES Table Title Page 1 Test Conditions and Materials 25 2 Lubricants and Refrigerants Used 29 3 Physical Properties of Lubricants 30 4 Effective Pressure-Viscosity Coefficients of Lubricants 46 5 Percent Reduction in Film Thickness for Mixtures of ISO 32 Naphthenic Mineral Oil and R-22 at a constant rolling speed of 0.8 m/s 58 6 Percent Reduction in Film Thickness for Mixtures of ISO 68 Naphthenic Mineral Oil and R-22 at a constant rolling speed of 0.8 m/s 59 7 Dynamic Viscosity Data on Mixtures of ISO 32 Naphthenic Mineral Oil and R-22 obtained from various references 60 8 Effective Pressure-Viscosity Coefficients for Mixtures of ISO 32 Naphthenic Mineral Oil and R Dynamic Viscosity Data for Mixtures of ISO 68 Naphthenic Mineral Oil and R Effective Pressure-Viscosity Coefficients for Mixtures of ISO 68 Naphthenic Mineral Oils and R Comparison of Effective Pressure-Viscosity Coefficients for ISO 68 NMO and R-22 Mixtures Percent Reduction in Film Thickness for Mixtures of ISO 32 Polyolester and R-134a at a constant rolling speed of 0.8 m/s Percent Reduction in Film Thickness for Mixtures of ISO 68 Polyolester and R-134a at a constant rolling speed of 0.8 m/s Dynamic Viscosity Data for Mixtures of ISO 32 Polyolester and R-134a Effective Pressure-Viscosity Coefficients for Mixtures of ISO 32 Polyolester and R-134a Dynamic Viscosity Data for Mixtures of ISO 68 Polyolester and R-134a Effective Pressure-Viscosity Coefficients for Mixtures of ISO 68 Polyolester and R-134a Comparison of Effective Pressure-Viscosity Coefficients for ISO 68 Polyolester and R-134a Mixtures Percent Reduction in Film Thickness for Mixtures of ISO 32 Polyvinyl Ether and R-134a at a constant rolling speed of 0.8 m/s 109 vi
7 20 Percent Reduction in Film Thickness for Mixtures of ISO 68 Polyvinyl Ether and R-134a at a constant rolling speed of 0.8 m/s Dynamic Viscosity Data for Mixtures of ISO 32 Polyvinyl Ether and R-134a Effective Pressure-Viscosity Coefficient for Mixtures of ISO 32 Polyvinyl Ether and R-134a Dynamic Viscosity Data for Mixtures of ISO 68 Polyvinyl Ether and R-134a Effective Pressure-Viscosity Coefficients for Mixtures of ISO 68 Polyvinyl Ether and R-134a Percent Reduction in Film Thickness for Mixtures of ISO 32 Polyolester and R-410A at a constant rolling speed of 0.8 m/s Percent Reduction in Film Thickness for Mixtures of ISO 68 Polyolester A and R-410A at a constant rolling speed of 0.8 m/s Dynamic Viscosity Data for Mixtures of ISO 32 Polyolester and R-410A Effective Pressure-Viscosity Coefficients for Mixtures of ISO 32 Polyolester and R-410A Dynamic Viscosity Data for Mixtures of ISO 68 Polyolester A and R-410A Effective Pressure-Viscosity Coefficients for Mixtures of ISO 68 Polyolester A and R-410A Percent Reduction in Film Thickness for Mixtures of ISO 32 Polyvinyl Ether and R-410A at a constant rolling speed of 0.8 m/s Percent Reduction in Film Thickness for Mixtures of ISO 68 Polyvinyl Ether and R-410A at a constant rolling speed of 0.8 m/s Dynamic Viscosity Data for Mixtures of ISO 32 Polyvinyl Ether and R-410A Effective Pressure-Viscosity Coefficients for Mixtures of ISO 32 Polyvinyl Ether and R-410A Dynamic Viscosity Data for Mixtures of ISO 68 Polyvinyl Ether and R-410A Effective Pressure-Viscosity Coefficients for Mixtures of ISO 68 Polyvinyl Ether and R-410A 139 vii
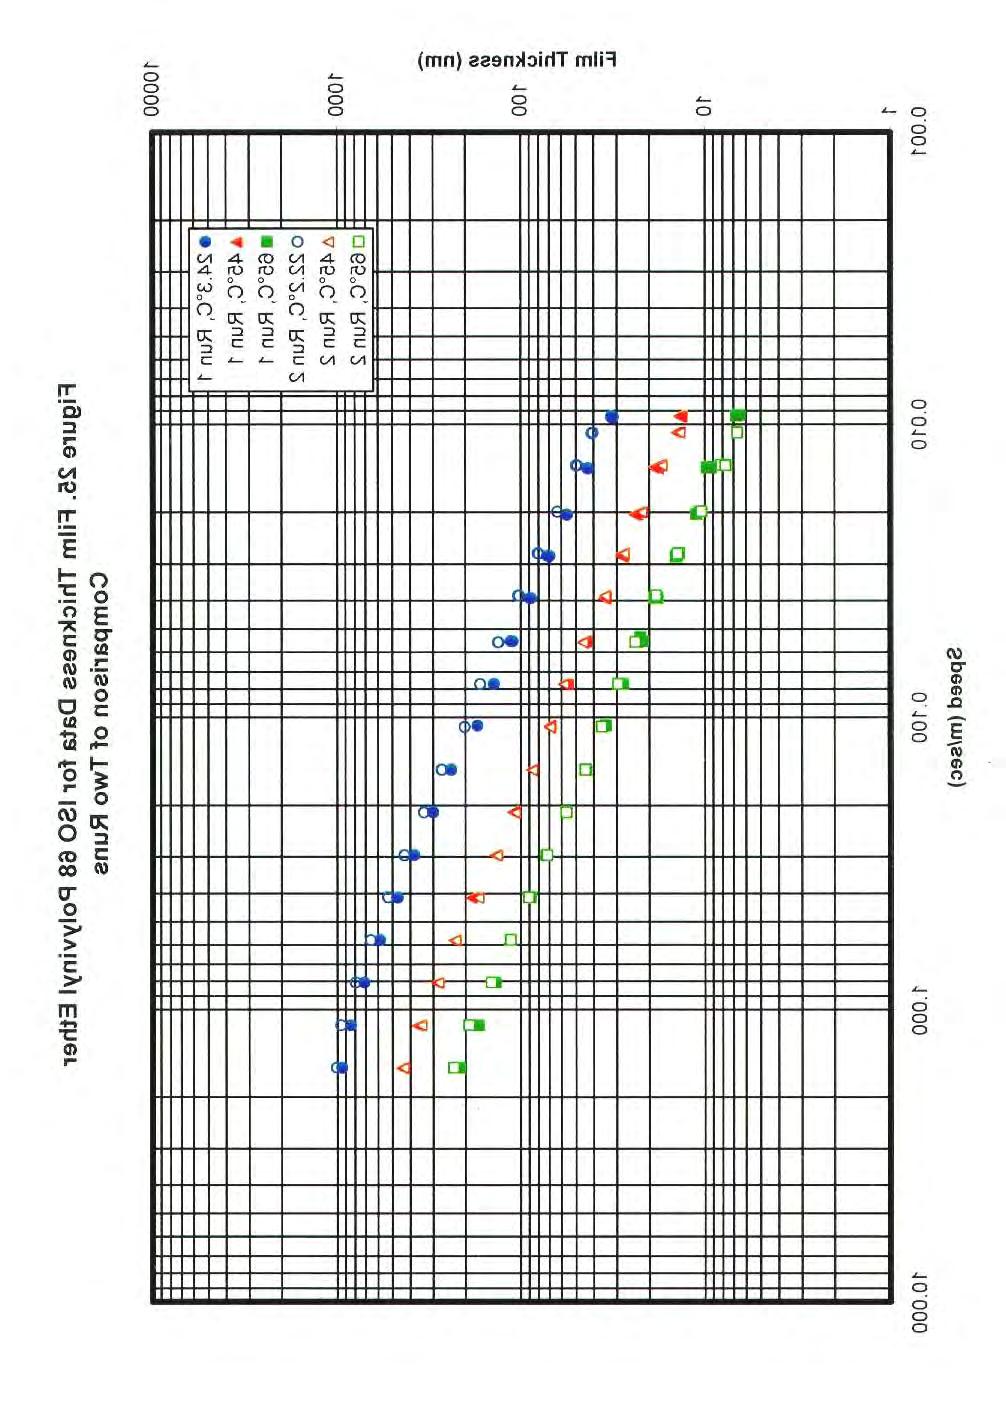
8 LIST OF FIGURES Figure Title Page 1 Principle of optical interferometry 14 2 Schematic set-up for ultrathin film interferometry 20 3 Principle of ultrathin film interferometry 22 4 Pressurized Ultrathin Film Interferometry Rig 24 5 Pressurized Ultrathin Film Interferometry Rig 27 6 Film Thickness Data for ISO 32 Naphthenic Mineral Oil 32 7 Film Thickness Data for ISO 68 Naphthenic Mineral Oil 33 8 Comparison of Film Thickness Data for ISO 32 and ISO 68 Naphthenic Mineral Oils Effect of Viscosity on Film Thickness 34 9 Film Thickness Data for ISO 32 Polyolester Film Thickness Data for ISO 68 Polyolester A Film Thickness Data for ISO 68 Polyolester B Film Thickness Data for ISO 68 Polyolester C Comparison of Film Thickness Data for ISO 32 and ISO 68 Polyolesters Effect of Viscosity on Film Thickness Comparison of Film Thickness Data for ISO 68 Polyolesters Film Thickness Data for ISO 32 Polyvinyl Ether Film Thickness Data for ISO 68 Polyvinyl Ether Comparison of Film Thickness Data for ISO 32 and ISO 68 Polyvinyl Ethers Effect of Viscosity on Film Thickness Film Thickness Data for ISO 32 Naphthenic Mineral Oil Comparison Between Old and New Test Chamber Film Thickness Data for ISO 68 Naphthenic Mineral Oil Comparison Between Old and New Test Chamber Film Thickness Data for ISO 32 Polyolester Comparison Between Old and New Test Chamber Film Thickness Data for ISO 68 Polyolester A Comparison Between Old and New Test Chamber Film Thickness Data for ISO 68 Polyolester B Comparison of Two Runs Film Thickness Data for ISO 68 Polyolester C Comparison of Two Runs 52 viii
9 24 Film Thickness Data for ISO 32 Polyvinyl Ether Comparison of Two Runs Film Thickness Data for ISO 68 Polyvinyl Ether Comparison of Two Runs Effective Pressure-Viscosity Coefficients vs. Temperature for ISO 32 Fluids Effective Pressure-Viscosity Coefficients vs. Temperature for ISO 68 Fluids Comparison of Film Thickness Data for ISO 32 Naphthenic Mineral Oil at Ambient Temperature as a Function of R-22 Concentration Comparison of Film Thickness Data for ISO 32 Naphthenic Mineral Oil at 45 C as a Function of R-22 Concentration Comparison of Film Thickness Data for ISO 32 Naphthenic Mineral Oil at 65 C as a Function of R-22 Concentration Film Thickness vs. R-22 Concentration for ISO 32 Naphthenic Mineral Oil Comparison of Film Thickness Data for ISO 68 Naphthenic Mineral Oil at Ambient Temperature as a Function of R-22 Concentration Comparison of Film Thickness Data for ISO 68 Naphthenic Mineral Oil at 45 C as a Function of R-22 Concentration Comparison of Film Thickness Data for ISO 68 Naphthenic Mineral Oil at 65 C as a Function of R-22 Concentration Film Thickness vs. R-22 Concentration for ISO 68 Naphthenic Mineral Oil Effect of Refrigerant Concentration on Effective Pressure-Viscosity Coefficient and Dynamic Viscosity for Mixtures of ISO 32 Naphthenic Mineral Oil and R Alpha Value vs. Dynamic Viscosity for ISO 32 Naphthenic Mineral Oil in R Effect of Refrigerant Concentration on Effective Pressure-Viscosity Coefficient and Dynamic Viscosity for Mixtures of ISO 68 Naphthenic Mineral Oil and R Alpha Value vs. Dynamic Viscosity for ISO 68 Naphthenic Mineral Oil in R Comparison of Film Thickness Data for ISO 32 Polyolester at Ambient Temperature as a Function of R-134a Concentration Comparison of Film Thickness Data for ISO 32 Polyolester at 45 C as a Function of R-134a Concentration Comparison of Film Thickness Data for ISO 32 Polyolester at 65 C as a Function of R-134a Concentration Film Thickness vs. R-134a Concentration for ISO 32 Polyolester Comparison of Film Thickness Data for ISO 68 Polyolester A at Ambient Temperature as a Function of R-134a Concentration 87 ix
10 45 Comparison of Film Thickness Data for ISO 68 Polyolester A at 45 C as a Function of R-134a Concentration Comparison of Film Thickness Data for ISO 68 Polyolester A at 65 C as a Function of R-134a Concentration Film Thickness vs. R-134a Concentration for ISO 68 Polyolester A Comparison of Film Thickness Data for ISO 68 Polyolester B at Ambient Temperature as a Function of R-134a Concentration Comparison of Film Thickness Data for ISO 68 Polyolester B at 45 C as a Function of R-134a Concentration Comparison of Film Thickness Data for ISO 68 Polyolester B at 65 C as a Function of R-134a Concentration Film Thickness vs. R-134a Concentration for ISO 68 Polyolester B Comparison of Film Thickness Data for ISO 68 Polyolester C at Ambient Temperature as a Function of R-134a Concentration Comparison of Film Thickness Data for ISO 68 Polyolester C at 45 C as a Function of R-134a Concentration Comparison of Film Thickness Data for ISO 68 Polyolester C at 65 C as a Function of R-134a Concentration Film Thickness vs. R-134a Concentration for ISO 68 Polyolester C Comparison of Film Thickness Data for ISO 68 Polyolesters A, B and C at 23 C as a Function of R-134a Concentration Comparison of Film Thickness Data for ISO 68 Polyolesters A, B and C at 45 C as a Function of R-134a Concentration Comparison of Film Thickness Data for ISO 68 Polyolesters A, B and C at 65 C as a Function of R-134a Concentration Effect of Refrigerant Concentration on Effective Pressure-Viscosity Coefficient and Dynamic Viscosity for Mixtures of ISO 32 Polyolester and R-134a Alpha Value vs. Dynamic Viscosity for ISO 32 Polyolester in R-134a Effect of Refrigerant Concentration on Effective Pressure-Viscosity Coefficient and Dynamic Viscosity for Mixtures of ISO 68 Polyolester A and R-134a Effect of Refrigerant Concentration on Effective Pressure-Viscosity Coefficient and Dynamic Viscosity for Mixtures of ISO 68 Polyolester B and R-134a Effect of Refrigerant Concentration on Effective Pressure-Viscosity Coefficient and Dynamic Viscosity for Mixtures of ISO 68 Polyolester C and R-134a 106 x
11 64 Alpha Value vs. Dynamic Viscosity for ISO 68 Polyolesters A, B and C in R-134a Comparison of Film Thickness Data for ISO 32 Polyvinyl Ether at Ambient Temperature as a Function of R-134a Concentration Comparison of Film Thickness Data for ISO 32 Polyvinyl Ether at 45 C as a Function of R-134a Concentration Comparison of Film Thickness Data for ISO 32 Polyvinyl Ether at 65 C as a Function of R-134a Concentration Film Thickness vs. R-134a Concentration for ISO 32 Polyvinyl Ether Comparison of Film Thickness Data for ISO 68 Polyvinyl Ether at Ambient Temperature as a Function of R-134a Concentration Comparison of Film Thickness Data for ISO 68 Polyvinyl Ether at 45 C as a Function of R-134a Concentration Comparison of Film Thickness Data for ISO 68 Polyvinyl Ether at 65 C as a Function of R-134a Concentration Film Thickness vs. R-134a Concentration for ISO 68 Polyvinyl Ether Effect of Refrigerant Concentration on Effective Pressure-Viscosity Coefficient and Dynamic Viscosity for Mixtures of ISO 32 Polyvinyl Ether and R-134a Alpha Value vs. Dynamic Viscosity for ISO 32 Polyvinyl Ether in R-134a Effect of Refrigerant Concentration on Effective Pressure-Viscosity Coefficient and Dynamic Viscosity for Mixtures of ISO 68 Polyvinyl Ether and R-134a Alpha Value vs. Dynamic Viscosity for ISO 68 Polyvinyl Ether in R-134a Comparison of Film Thickness Data for ISO 32 Polyolester at Ambient Temperature as a Function of R-410A Concentration Comparison of Film Thickness Data for ISO 32 Polyolester at 45 C as a Function of R-410A Concentration Comparison of Film Thickness Data for ISO 32 Polyolester at 65 C as a Function of R-410A Concentration Film Thickness vs. R-410A Concentration for ISO 32 Polyolester Comparison of Film Thickness Data for ISO 68 Polyolester A at Ambient Temperature as a Function of R-410A Concentration Comparison of Film Thickness Data for ISO 68 Polyolester A at 45 C as a Function of R-410A Concentration Comparison of Film Thickness Data for ISO 68 Polyolester A at 65 C as a Function of R-410A Concentration Film Thickness vs. R-410A Concentration for ISO 68 Polyolester A 133 xi
12 85 Effect of Refrigerant Concentration on Effective Pressure-Viscosity Coefficient and Dynamic Viscosity for Mixtures of ISO 32 Polyolester and R-410A Alpha Value vs. Dynamic Viscosity for ISO 32 Polyolester in R-410A Effect of Refrigerant Concentration on Effective Pressure-Viscosity Coefficient and Dynamic Viscosity for Mixtures of ISO 68 Polyolester A and R-410A Alpha Value vs. Dynamic Viscosity for ISO 68 Polyolester A in R-410A Comparison of Film Thickness Data for ISO 32 Polyvinyl Ether at Ambient Temperature as a Function of R-410A Concentration Comparison of Film Thickness Data for ISO 32 Polyvinyl Ether at 45 C as a Function of R-410A Concentration Comparison of Film Thickness Data for ISO 32 Polyvinyl Ether at 65 C as a Function of R-410A Concentration Film Thickness vs. R-410A Concentration for ISO 32 Polyvinyl Ether Comparison of Film Thickness Data for ISO 68 Polyvinyl Ether at Ambient Temperature as a Function of R-410A Concentration Comparison of Film Thickness Data for ISO 68 Polyvinyl Ether at 45 C as a Function of R-410A Concentration Comparison of Film Thickness Data for ISO 68 Polyvinyl Ether at 65 C as a Function of R-410A Concentration Film Thickness vs. R-410A Concentration for ISO 68 Polyvinyl Ether Effect of Refrigerant Concentration on Effective Pressure-Viscosity Coefficient and Dynamic Viscosity for Mixtures of ISO 32 Polyvinyl Ether and R-410A Alpha Value vs. Dynamic Viscosity for ISO 32 Polyvinyl Ether in R-410A Effect of Refrigerant Concentration on Effective Pressure-Viscosity Coefficient and Dynamic Viscosity for Mixtures of ISO 68 Polyvinyl Ether and R-410A Alpha Value vs. Dynamic Viscosity for ISO 68 Polyvinyl Ether in R-410A ISO 32 Polyolester/R-134a vs. ISO 32 Naphthenic Mineral Oil/R-22 Mixtures Film Thickness as a Function of Refrigerant Concentration at 23 C ISO 32 Polyolester/R-134a vs. ISO 32 Naphthenic Mineral Oil/R-22 Mixtures Film Thickness as a Function of Refrigerant Concentration at 45 C ISO 32 Polyolester/R-134a vs. ISO 32 Naphthenic Mineral Oil/R-22 Mixtures Film Thickness as a Function of Refrigerant Concentration at 65 C 159 xii
13 104 ISO 68 Polyolester/R-134a vs. ISO 68 Naphthenic Mineral Oil/R-22 Mixtures Film Thickness as a Function of Refrigerant Concentration at 23 C ISO 68 Polyolester/R-134a vs. ISO 68 Naphthenic Mineral Oil/R-22 Mixtures Film Thickness as a Function of Refrigerant Concentration at 45 C ISO 68 Polyolester/R-134a vs. ISO 68 Naphthenic Mineral Oil/R-22 Mixtures Film Thickness as a Function of Refrigerant Concentration at 65 C ISO 32 Polyolester/R-134a, ISO 32 Polyvinyl Ether/R134a and ISO 32 Naphthenic Mineral Oil/R-22 Mixtures Film Thickness as a Function of Refrigerant Concentration at 23 C ISO 32 Polyolester/R-134a, ISO 32 Polyvinyl Ether/R-134a and ISO 32 Naphthenic Mineral Oil/R-22 Mixtures Film Thickness as a Function of Refrigerant Concentration at 45 C ISO 32 Polyolester/R-134a, ISO 32 Polyvinyl Ether/R-134a and ISO 32 Naphthenic Mineral Oil/R-22 Mixtures Film Thickness as a Function of Refrigerant Concentration at 65 C ISO 68 Polyolester/R-134a, ISO 68 Polyvinyl Ether/R-134a and ISO 68 Naphthenic Mineral Oil/R-22 Mixtures Film Thickness as a Function of Refrigerant Concentration at 23 C ISO 68 Polyolester/R-134a, ISO 68 Polyvinyl Ether/R134a and ISO 68 Naphthenic Mineral Oil/R-22 Mixtures Film Thickness as a Function of Refrigerant Concentration at 45 C ISO 68 Polyolester/R-134a, ISO 68 Polyvinyl Ether/R-134a and ISO 68 Naphthenic Mineral Oil/R-22 Mixtures Film Thickness as a Function of Refrigerant Concentration at 65 C ISO 32 Polyolester/R-410A vs. ISO 32 Naphthenic Mineral Oil/R-22 Mixtures Film Thickness as a Function of Refrigerant Concentration at 23 C ISO 32 Polyolester/R-410A vs. ISO 32 Naphthenic Mineral Oil/R-22 Mixtures Film Thickness as a Function of Refrigerant Concentration at 45 C ISO 32 Polyolester/R-410A vs. ISO 32 Naphthenic Mineral Oil/R-22 Mixtures Film Thickness as a Function of Refrigerant Concentration at 65 C ISO 68 Polyolester/R-410A vs. ISO 68 Naphthenic Mineral Oil/R-22 Mixtures Film Thickness as a Function of Refrigerant Concentration at 23 C ISO 68 Polyolester/R-410A vs. ISO 68 Naphthenic Mineral Oil/R-22 Mixtures Film Thickness as a Function of Refrigerant Concentration at 45 C 175 xiii
14 118 ISO 68 Polyolester/R-410A vs. ISO 68 Naphthenic Mineral Oil/R-22 Mixtures Film Thickness as a Function of Refrigerant Concentration at 65 C ISO 32 Polyolester/R-410A, ISO 32 Polyvinyl Ether/R-410A and ISO 32 Naphthenic Mineral Oil/R-22 Mixtures Film Thickness as a Function of Refrigerant Concentration at 23 C ISO 32 Polyolester/R-410A, ISO 32 Polyvinyl Ether/R-410A and ISO 32 Naphthenic Mineral Oil/R-22 Mixtures Film Thickness as a Function of Refrigerant Concentration at 45 C ISO 32 Polyolester/R-410A, ISO 32 Polyvinyl Ether/R-410A and ISO 32 Naphthenic Mineral Oil/R-22 Mixtures Film Thickness as a Function of Refrigerant Concentration at 65 C ISO 68 Polyolester/R-410A, ISO 68 Polyvinyl Ether/R-410A and ISO 68 Naphthenic Mineral Oil/R-22 Mixtures Film Thickness as a Function of Refrigerant Concentration at 23 C ISO 68 Polyolester/R-410A, ISO 68 Polyvinyl Ether/R-410A and ISO 68 Naphthenic Mineral Oil/R-22 Mixtures Film Thickness as a Function of Refrigerant Concentration at 45 C ISO 68 Polyolester/R-410A, ISO 68 Polyvinyl Ether/R-410A and ISO 68 Naphthenic Mineral Oil/R-22 Mixtures Film Thickness as a Function of Refrigerant Concentration at 65 C ISO 32 Polyolester/R-134a vs. ISO 32 Polyolester/R-410A Mixtures Film Thickness as a Function of Refrigerant Concentration at 23 C ISO 32 Polyolester/R-134a vs. ISO 32 Polyolester/R-410A Mixtures Film Thickness as a Function of Refrigerant Concentration at 45 C ISO 32 Polyolester/R-134a vs. ISO 32 Polyolester/R-410A Mixtures Film Thickness as a Function of Refrigerant Concentration at 65 C ISO 68 Polyolester/R-134a vs. ISO 68 Polyolester/R-410A Mixtures Film Thickness as a Function of Refrigerant Concentration at 23 C ISO 68 Polyolester/R-134a vs. ISO 68 Polyolester/R-410A Mixtures Film Thickness as a Function of Refrigerant Concentration at 45 C ISO 68 Polyolester/R-134a vs. ISO 68 Polyolester/R-410A Mixtures Film Thickness as a Function of Refrigerant Concentration at 65 C ISO 32 Polyvinyl Ether/R-134a vs. ISO 32 Polyvinyl Ether/R-410A Mixtures Film Thickness as a Function of Refrigerant Concentration at 23 C ISO 32 Polyvinyl Ether/R-134a vs. ISO 32 Polyvinyl Ether/R-410A Mixtures Film Thickness as a Function of Refrigerant Concentration at 45 C 190 xiv
15 133 ISO 32 Polyvinyl Ether/R-134a vs. ISO 32 Polyvinyl Ether/R-410A Mixtures Film Thickness as a Function of Refrigerant Concentration at 65 C ISO 68 Polyvinyl Ether/R-134a vs. ISO 68 Polyvinyl Ether/R-410A Mixtures Film Thickness as a Function of Refrigerant Concentration at 23 C ISO 68 Polyvinyl Ether/R-134a vs. ISO 68 Polyvinyl Ether/R-410A Mixtures Film Thickness as a Function of Refrigerant Concentration at 45 C ISO 68 Polyvinyl Ether/R-134a vs. ISO 68 Polyvinyl Ether/R-410A Mixtures Film Thickness as a Function of Refrigerant Concentration at 65 C ISO 32 Polyolester/R-410A vs. ISO 32 Polyvinyl Ether/R-410A Mixtures Effect of Refrigerant Concentration on Effective Pressure- Viscosity Coefficient ISO 32 Polyolester/R-134a vs. ISO 32 Polyvinyl Ether/R-134a Mixtures Effect of Refrigerant Concentration on Effective Pressure- Viscosity Coefficient ISO 32 Polyvinyl Ether/R-134a vs. ISO 32 Naphthenic Mineral Oil/R-22 Mixtures Effect of Refrigerant Concentration on Effective Pressure- Viscosity Coefficient ISO 32 Polyolester/R-134a vs. ISO 32 Naphthenic Mineral Oil/R-22 Mixtures Effect of Refrigerant Concentration on Effective Pressure-Viscosity Coefficient ISO 32 Polyvinyl Ether/R-410A vs. ISO 32 Naphthenic Mineral Oil/R-22 Mixtures Effect of Refrigerant Concentration on Effective Pressure- Viscosity Coefficient ISO 32 Polyolester/R-410A vs. ISO 32 Naphthenic Mineral Oil Mixtures Effect of Refrigerant Concentration on Effective Pressure- Viscosity Coefficient Comparison of Film Thickness Data for R-134a and R-410A Systems Comparison of Film Thickness Data for Various Mixtures of ISO 32 Lubricants and Refrigerants Comparison of Film Thickness Data for Various Mixtures of ISO 68 Lubricants and Refrigerants 203 xv
16 1.0 EXECUTIVE SUMMARY Lubrication properties of refrigeration lubricants were investigated in high pressure nonconforming contacts under different conditions of temperature, rolling speed, and refrigerant concentration. The program was based upon the recognition that the lubrication regime in refrigeration compressors is generally elastohydrodynamic or hydrodynamic, as determined by the operating conditions of the compressor and the properties of the lubricant. Depending on the compressor design, elastohydrodynamic lubrication conditions exist in many rolling and sliding elements of refrigeration compressors such as roller element bearings, gears, and rotors. The formation of an elastohydrodynamic film separating rubbing surfaces is important in preventing the wear and failure of compressor elements. It is, therefore, important to predict the elastohydrodynamic (EHD) performance of lubricants under realistic tribocontact conditions. This is, however, difficult as the lubricant properties that control film formation are critically dependent upon pressure and shear, and cannot be evaluated using conventional laboratory instruments. In this study, the elastohydrodynamic behavior of refrigeration lubricants with and without the presence of refrigerants was investigated using the ultrathin film EHD interferometry technique. This technique enables very thin films, down to less than 5 nm, to be measured accurately within an EHD contact under realistic conditions of temperature, shear, and pressure. The technique was adapted to the study of lubricant/refrigerant mixtures. Film thickness measurements were obtained on refrigeration lubricants as a function of speed, temperature, and refrigerant concentration. The effects of lubricant viscosity, temperature, rolling speed, and refrigerant concentration on EHD film formation were investigated. From the film thickness measurements, effective pressure-viscosity coefficients were calculated. The lubricants studied in this project included two naphthenic mineral oils (NMO), four polyolesters (POE), and two polyvinyl ether (PVE) fluids. These fluids represented viscosity grades of ISO 32 and ISO 68 and are shown in the table below. Refrigerants studied included 1
17 R-22, R-134a, and R-410A. Film thickness measurements were conducted at 23 C, 45 C, and 65 C with refrigerant concentrations ranging from zero to 60% by weight. Refrigerant Lubricant Commercial Identification R-22 ISO 32 Naphthenic Mineral Oil (NMO-32) ISO 68 Naphthenic Mineral Oil (NMO-68) R-134a ISO 32 Polyolester (POE-32) ISO 32 Polyvinyl Ether (PVE-32) ISO 68 Polyolester A (POE-68A) ISO 68 Polyolester B (POE-68B) ISO 68 Polyolester C (POE-68C) ISO 68 Polyvinyl Ether (PVE-68) R-410A ISO 32 Polyolester (POE-32) ISO 32 Polyvinyl Ether (PVE-32) ISO 68 Polyolester A (POE-68A) ISO 68 Polyvinyl Ether (PVE-68) Suniso 3GS Suniso 4GS ICI Emkarate RL 32H Idemitsu Kosan FVC 32B ICI Emkarate RL 68H Mobil EAL 68 CPI Solest 68 Idemitsu Kosan FVC 68B ICI Emkarate RL 32H Idemitsu Kosan FVC 32B ICI Emkarate RL 68H Idemitsu Kosan FVC 68B All of the lubricants studied behaved as expected from the EHD theory under air. EHD film thickness increased with speed and dynamic viscosity and decreased with temperature. Effective pressure-viscosity coefficients (α) calculated from the film thickness data showed the effect of chemical structure on the pressure-viscosity characteristics of the fluids. The fluids were ranked with respect to their pressure-viscosity coefficients in the following order: naphthenic mineral oils > polyvinyl ethers > polyolesters. Differences were observed in the pressure-viscosity characteristics of the polyolesters studied. This was related to the degree of branching in the ester structure. Esters with branching have higher α-values than those with linear structure. Effective pressure-viscosity coefficients also change with temperature, decreasing as the temperature increases. Refrigerants have a significant effect on reducing the EHD film formation ability of lubricants. EHD film thickness decreases drastically in the contact as the refrigerant concentration in the lubricant increases. Even at the low refrigerant concentration of 10%, the reduction in film thickness ranges from 30 to 65% depending on the test temperature. Refrigerants reduce dynamic viscosity as well as the pressure-viscosity coefficients of lubricants. However, this effect decreases as the temperature increases. The thickness of the 2
18 EHD film formed by the lubricant/refrigerant mixtures show a similar dependence on speed as that of the lubricant itself. Under some conditions (high refrigerant concentrations, high temperatures and pressures), some deviations were observed from the EHD theoretical slope for the film thickness/speed relationship. Effective pressure-viscosity coefficients for the lubricant/refrigerant mixtures were calculated from the film thickness data using the theoretical relationship of Dowson-Hamrock and dynamic viscosity data available for the mixtures in the literature. The accuracy of the calculated pressure-viscosity coefficients depends strongly on the accuracy of the dynamic viscosity data used in the calculations. For a given refrigerant and lubricant mixture, pressure-viscosity coefficient increases linearly in proportion to the logarithm of dynamic viscosity as shown below. This finding suggests that the same fundamental molecular properties govern changes in both dynamic viscosity and pressure-viscosity properties of fluids ISO 68 PVE/ R-410A ISO 68 NMO/ R LogDynamicViscosity(cP) The ranking obtained with respect to the pressure-viscosity characteristics of the lubricants under air was also observed under refrigerant environments. However, the differences became smaller as the refrigerant concentration and the temperature increased. In general, refrigerant (R-134a or R-410A) mixtures with polyvinyl ethers have higher α-values than those with polyolesters. Mixtures of naphthenic mineral oil and R-22 have higher α-values than those of polyolesters or polyvinyl ethers and R-134a or R-410A. 3
19 The presence of R-410A in the lubricants (polyolesters or polyvinyl ethers) results in thinner EHD films, as shown below, than those produced by the same lubricants in the presence of R-134a PVE ISO 68 Lubricants, R-134a vs. R-410A POE Film Thickness (nm) PVE/ R-134a PVE/ R-410A POE A/ R-134a POE A/ R-410A PVE/ R-134a PVE/ R-410A POE A/ R-134a POE A/ R-410A PVE/ R-134a Refrigerant Concentration (Wt%) PVE/ R-410A POE A/ R-134a POEA/ R-410A PVE/ R-134a PVE/ R-410A POE A/ R-134a A graphical ranking of all the tested lubricant/refrigerant combinations is shown in the charts below. The film thickness data reported in these charts were obtained under the same conditions of temperature (22.5 C) and speed (0.8 m/s) for ISO 32 and ISO 68 lubricants and their mixtures with refrigerants. 4
20 NMO ISO 32 Lubricants PVE POE Film Thickness (nm) NMO/ R-22 PVE/ R-134a PVE/ R-410A POE/ R-134a POE/ R-410A NMO/ R-22 PVE/ R-134a POE/ PVE/ R-134a R-410A PVE/ R-410A NMO/ R-22 PVE/ R-134a PVE/ R-410A POE/ R-134a Refrigeration Concentration (Wt%) PVE ISO 68 Lubricants NMO Film Thickness (nm) POE A POE C POE B NMO / R-22 PVE/ R-134a POE A/ R-134a PVE/ R-410A POE B/ R-134a POE C/ R-134a POE A/ R-410A NMO/ R-22 PVE/ R-410A PVE/ R-134a POE B/ R-134a POE A/ R-134a POE C/ R-134a POE A/ R-410A POE C/ R-134a POE A/ R-410A NMO/ R Refrigerant Concentration (Wt%) NMO/ R-22 PVE/ POE B/ R-410A R-134a PVE / POE A/ R-134a R-134a PVE/ POE A/ R-134a R-134a PVE/ R-410A POE C/ R-134a POE B/ R-134a Based on the results of the current study, future areas of investigation were identified. These areas concentrate on 1) ways to improve the accuracy of the dynamic viscosity and 5
21 pressure-viscosity coefficient determinations on lubricant/refrigerant mixtures, and 2) evaluation of EHD friction (traction) properties of lubricant/refrigerant mixtures. This work would be useful for modeling viscosity and pressure-viscosity characteristics of lubricant/refrigerant mixtures, and for determining and optimizing lubricant behavior in EHD contacts of refrigeration compressors. 2.0 INTRODUCTION The primary role of a refrigeration lubricant is to provide satisfactory lubrication to the moving parts of the compressor by reducing friction and wear of the rubbing surfaces. In addition, the refrigeration lubricant has important secondary functions such as the removal of heat from the hot compressor parts and to act as a sealing aid for the compression space and the valves. Refrigeration lubricants represent a special case of lubricants due to their interactions with the refrigerants. These lubricants must perform their functions in the presence of refrigerants. Hence, in addition to the conventional lubricant properties such as viscosity, viscosity index, lubricity, stability, low temperature flow properties, compatibility with system materials, volatility, etc., interactions with the refrigerants should also be considered in the selection of refrigeration lubricants (1-3). There have been a number of studies reported in the literature on the interactions of refrigerants with lubricants concerning the effects on physical/chemical properties and performance (4-13). The lubricant/refrigerant interactions are determined by the stability, solubility, miscibility, and surface tension properties of the lubricant/refrigerant mixture. Special problems that can arise from such interactions include the dilution of the lubricant by the refrigerant. It has been shown that a small amount of refrigerant in the lubricant can significantly reduce viscosity, since the viscosities of the refrigerants are much lower than those of the lubricants (14). This could adversely influence the lubrication properties of refrigeration oils as well as their heat transfer and sealing properties. On the other hand, viscosity reduction may improve oil return from the evaporator to the compressor. The interactions between the lubricant and the refrigerant can also result in reaction products which could lead to the formation of sludge, deposits, and copperplating. These could increase wear and result in mechanical failures. 6
22 Refrigeration lubricants provide lubrication to the moving parts of the compressor by forming a film that separates the surfaces and limits their contact and adhesion. This film can vary in thickness from a few monolayers as found under boundary lubrication conditions to hundreds and thousands of nanometers of hydrodynamically entrained lubricant as found under elastohydrodynamic (EHD) and hydrodynamic (HD) lubrication conditions. It has been recognized that the lubrication regime in refrigeration compressors is generally elastohydrodynamic and hydrodynamic, depending on the operating conditions (pressure, speed, temperature) and lubricant properties (1-3, 15). Elastohydrodynamic lubrication conditions may exist in many rolling and sliding elements of refrigeration compressors such as roller element bearings, gears, and rotors. Boundary lubrication may also exist under insufficient lubrication and compressor overload conditions, and during start-up and shutdown procedures. It has been long recognized that the formation of EHD films separating rubbing surfaces is important in preventing wear and failure of machine elements. Therefore, it is of considerable practical importance to be able to measure film thickness in lubricated contacts in order to evaluate the effectiveness of lubricants and to test or validate the predictive theories. The objective of this study was to investigate the film formation properties of refrigeration lubricants using the ultrathin film EHD interferometry technique and to study the effects of refrigerants on film formation. Film thickness measurements were conducted as a function of lubricant viscosity, speed, temperature, and refrigerant concentration. Based on the EHD film thickness data, effective pressure-viscosity coefficients were calculated for the test fluids at different temperatures and the effects of refrigerants on pressure-viscosity properties were investigated. 7
23 3.0 BACKGROUND 3.1 Changes in Refrigerant Technology Impact on Lubrication A wide variety of lubricants have been used in the lubrication of refrigeration compressors. These include mineral oils, synthetic hydrocarbons (alkylbenzenes and polyalphaolefins), polyalkylglycols, esters, and polyvinyl ethers (2, 3, 16, 17). The choice of the lubricant depends on the type of refrigerant used and whether it is polar in nature. Until recently, the most commonly used refrigerants included ammonia, hydrochlorofluorocarbons (HCFCs), and chlorofluorocarbons (CFCs). Due to the environmental hazards imposed by the CFCs and HCFCs, these refrigerants are now being replaced by hydrofluorocarbons (HFCs). There has been a lot of work done in recent years in order to find acceptable substitutes for CFCs and HCFCs (18-25). The use of new refrigerants presents many challenges to the industry which include design changes in the refrigeration systems, materials, and lubricants. Tribological problems are expected since the candidate refrigerants do not possess the same lubrication and miscibility properties as the previous ones. For example, the refrigerant CFC-12 (R-12), which has been widely used in household refrigerators and automobile air conditioners, has good miscibility with mineral oils and alkylbenzenes. This refrigerant also makes a significant contribution to lubricity due to the presence of chlorine in its structure (26-29). Chlorinecontaining compounds are well known for their extreme-pressure (EP) properties; they can react with the metals and form protective surfaces composed of metal chlorides. On the other hand, the refrigerant R-134a, which is considered as a substitute for CFC- 12, does not have chlorine and is not miscible with mineral oils. Therefore, an EP function cannot be expected from this refrigerant. Immiscibility with mineral oils also presents oil starvation related lubrication problems in the critical compressor parts. Polyalkylglycols (PAG) and polyolesters (POE) have been considered as potential lubricants to be used with R-134a due to their good miscibility (16, 18). However, boundary lubrication studies indicate that in order to achieve the same lubricity level of R-12/mineral oil or R-12/alkylbenzene systems, EP additives must be added to PAG/R-134a and POE/R-134a systems. Another approach may be the use of self-lubricating materials on the critical compressor components (30). The viscosity of the lubricant may also need to be adjusted to maintain the hydrodynamic film thickness 8
24 similar to those obtained with the R-12/mineral oil systems. Similar issues are also valid for R- 22, a widely used refrigerant for air-conditioning units, which will also be phased-out due to environmental considerations. There have been some studies reported in the literature on the boundary lubrication properties of refrigeration lubricants and refrigerants (26-29). However, there has been very little experimental work conducted on the EHD properties of refrigeration lubricants. Significant contributions in this area were recently made by Jonsson (31) and Akei et al (32, 33). In order to ensure satisfactory operation of refrigeration compressors, the sliding and rolling components must be designed to operate under EHD or HD conditions. In the design calculations, HD and EHD theories are applied to estimate the lubrication conditions of compressors. However, the validity of these theories for non-homogeneous systems is questionable. Bearing lubrication studies by Jacobson (34) indicate that under certain conditions the behavior of the oil/refrigerant mixture deviates from the EHD theory. Therefore, it is important to be able to experimentally verify the calculated EHD film thickness. Recent studies of Wardle et al (35), Jonsson et al (31, 36), and Akei et al (32, 33) also indicate the need for further research in this area. 3.2 Elastohydrodynamic Lubrication There are many rolling or sliding contacts in engineering where high loads are spread over small contact areas, for example in gears and bearings. In such nonconforming contacts, called elastohydrodynamic (EHD) or concentrated contacts, the lubricating film is exposed to extreme conditions of pressure and shear. In refrigeration compressors, EHD contacts can be found in the rolling element bearings, gears, rotors, or wherever rigid counterformal surfaces are loaded and move relative to one another. The pressures generated in EHD contacts can be on the order of 0.5 to 2.4 GPa. The high pressures within the contact have two beneficial effects, elastically flattening the surfaces, and hence reducing contact pressure, and increasing oil viscosity in the contact. The overall effect of these two is to permit the formation of thin EHD oil films in such contacts, typically nm ( micron) thick. This is of the same order as the roughness of engineering surfaces which makes EHD oil film thickness an important practical value in predicting the performance of bearings and gears. A widely used term in this context is the specific film thickness, λ, which is defined as: 9
25 h λ = σ Equation 1 where h is the lubricant film thickness and σ is the composite surface roughness of the two rubbing surfaces. The composite roughness is defined as: σ = σ σ 2 2 Equation 2 where σ 1, σ 2 are the root mean square (RMS) roughnesses of the two rubbing surfaces. The specific film thickness describes the thickness of the lubricant film in relation to the roughness of the lubricated surfaces. As the λ value increases, there is less contact between the two surfaces. The surfaces are in contact at some point or points nearly all the time when λ < 1, and are almost never in contact when λ > 4. The specific film thickness parameter correlates with the function of a lubricant to prevent or minimize wear, scuffing, and to minimize rolling contact fatigue. Theoretical calculation of EHD lubricant film thickness requires the simultaneous solution of hydrodynamic flow equations based on Reynolds theory, surface elasticity equations based on Hertzian theory, and lubricant pressure-viscosity equations. This problem cannot be solved analytically, but successful numerical solutions were found by Archard (37), Dowson and Hamrock (38), and Foord and Cameron (39). These solutions are presented in the form of regression equations based on numerical solutions. The predicted film thickness is expressed in terms of three non-dimensional groups: speed, material, and load. These are shown below in the Dowson and Hamrock equation for central film thickness: h c = 2.69 Uµ αe 0.53 W e -0.73k R E R E R 2 Equation 3 10
26 where h c = central film thickness U = mean surface speed of the two surfaces R = reduced radius of the two surfaces E = reduced Young s modulus W = applied load k = ellipticity parameter µ 0 = dynamic viscosity of the oil at atmospheric pressure and the test temperature α = pressure-viscosity coefficient of the oil The existing EHD design equations to calculate film thickness are based on the assumptions that the lubricant is both homogeneous and exists as a continuum. These assumptions may not be valid for lubricant and refrigerant mixtures. Also, under very thin film conditions, where film thickness is comparable to surface roughness, these assumptions may break down and the existing theories may not be valid. An alternative approach is to measure EHD film thickness directly from within the contact under realistic conditions of pressure and shear. 3.3 Film Thickness Measurements A number of test methods have been developed to measure film thickness in hydrodynamic and EHD contacts (40-46). These are mostly based on electrical or electromagnetic radiation measurements and include techniques such as capacitance, resistance, fluorescence, x-ray, and inductance. Among these, the most widely used technique is the capacitance method. The advantage of this technique is that it can be applied to realistic metal-to-metal contacts. Capacitance has been used to measure film thickness in bearings and piston liner/rings (47, 48). One method that has proven particularly effective for measuring lubricant film thickness in model contacts is optical interferometry (39, 49). This technique has the advantage over the capacitance method in that it relies upon the refractive index of the separating film rather than its dielectric constant. Refractive index is much less variable with film composition than dielectric constant. 11
27 Figure 1 shows the principles of optical interferometry as applied to an EHD contact. The EHD contact can be formed by a steel ball loaded against a flat disc as a contact geometry equivalent to many nonconforming contacts of practical importance. Either the ball or the disc can be driven to give varying slide-to-roll ratios, simulating conditions found in practice. The disc is transparent to visible light, and the EHD film generated is measured by the observation of interference color within the contact. This technique has been very useful in studying EHD behavior of lubricants since the wavelength of light is of the same order as a typical EHD lubricant film. The surface of the glass disc shown in Figure 1 is coated with a thin (20 nm) semireflecting chromium layer. Light is shone into the contact through the glass disc. Some of this light is reflected from the underside of the disc and some passes through the lubricant s film and is reflected back from the steel surface. Since the two beams of light travel different distances, when they recombine they interfere either constructively or destructively, according to Equations 4 and 5 below, and produce colored interference patterns which are characteristic of the lubricant film thickness. The lubricant film thickness, which is represented by the optical path difference between the two beams, is determined by studying the intensity of the recombined beam. Destructive interference: h oil = (N + ½ - φ) λ 2n Cos θ N = 0,1,2 Equation 4 12
28 Constructive interference: h oil = (N - φ) λ 2n Cos θ N = 1,2,3 Equation 5 where h = lubricant film thickness N = fringe order φ = net phase change λ = wavelength of interfered light n = refractive index of lubricant θ = angle of incidence 13
29 14
30 The optical interferometry technique has been a useful tool for measuring lubricant film thickness in EHD contacts. This technique, however, also has some significant limitations with respect to the thickness of the films measured and the precision of the measurements. For example, for vertical illumination Equation 4 reduces down to the following equation for the first fringe: nh oil = λ 4 Equation 6 This indicates that the first fringe occurs at the wavelength of visible light divided by four, which means that the thinnest films that can be measured by conventional optical interferometry are around 80 to 100 nanometers. This limitation has been overcome by the development of the ultrathin film EHD interferometry technique which is described in Section 5.0 (50). 3.4 Pressure-Viscosity Coefficient Pressure-viscosity coefficient is an important rheological property of a lubricant that shows the dependence of viscosity on pressure and is defined as follows: α = 1 µ µ ρ T Equation 7 where α is the pressure-viscosity coefficient, µ is the dynamic viscosity, and ρ is the pressure. Pressure-viscosity coefficient is of particular importance for applications when the lubricants are subjected to high local pressures, such as those found in EHD contacts. The knowledge of the pressure-viscosity coefficient for a particular lubricant system and its variation with temperature provides valuable design data and is essential if the EHD film thickness is to be calculated from theory. It can be seen from Equation 3 above that the EHD film thickness depends on two lubricant properties, µ and α. µ 0 is the ambient pressure oil viscosity in the inlet zone, and can be measured using conventional viscometers. The measurement of α, on the other hand, is more complicated. However, it can be conveniently determined from the measured EHD film thickness by comparing the results to a reference oil with a known α value as shown below: 15
31 From the Dowson-Hamrock equation for EHD central film thickness: h c = kα 0.53 (Uµ 0 ) 0.67 Equation 8 where k = constant, depending on load, geometry, and material properties. Comparison of the film thickness for the test oil and the reference oil gives: href htest = αref 0.53 αtest Equation 9 Pressure-Viscosity coefficient for the test oil is given by: αtest = αref htest href Equation SCOPE AND TECHNICAL APPROACH The scope of this project was to investigate the film formation properties of refrigeration lubricants and is primarily concerned with measuring EHD film thickness of refrigeration lubricants and understanding the contribution of refrigerants to film formation. The lubricants studied included ISO 32 and ISO 68 viscosity grades of naphthenic mineral oils, polyolesters, and polyvinyl ethers. The refrigerants studied included R-22 (with mineral oils), R-134a (with polyolesters and polyvinyl ether lubricants), and R-410A (with polyolester and polyvinyl ether lubricants). 16
32 The technical approach taken was to investigate the EHD behavior of refrigeration lubricants, with and without the presence of refrigerants, using the ultrathin film EHD technique. This technique enables very thin films, down to less than 5 nm, to be measured accurately within an EHD contact under realistic conditions of shear and pressure. The effects of lubricant viscosity, temperature, rolling speed, and refrigerant concentration on EHD film formation were investigated. Effective pressure-viscosity coefficients were calculated for the fluids studied. The information generated as a result of this study is expected to aid in the selection of lubricants in refrigeration systems and also in the development of improved bearing designs. The project was conducted according to the Tasks outlined below for the refrigerant and lubricant combinations listed in Table 2 (page 29). Task 1: Visit Manufacturers of Air-Conditioning and Refrigeration Compressors Visit one or more manufacturers to acquire more information about the specific lubrication requirements of air-conditioning and refrigeration compressors. Also gather information regarding the handling of refrigerants to assist with charging the EHD Tester and for conducting tests with various refrigerant concentrations. Task 2: Modify the EHD Test Apparatus to Contain Refrigerant Pressure Modify the ultrathin film EHD rig to operate at pressures above the vapor pressure of the refrigerants at the test temperatures. Task 3: Conduct Baseline Tests on Lubricants in Air Determine baseline EHD film thickness and pressure-viscosity coefficient for the ISO 32 and 68 lubricants (i.e., two mineral oils, four polyolester lubricants, and two polyvinyl ether lubricants) as a function of rolling speed over the temperature range 25 to 65 C. 17
33 Task 4: Conduct Tests on R-22 Refrigerant and Mineral Oil (Baseline) Determine EHD film thickness and pressure-viscosity coefficient for R-22 with the ISO 32 and 68 mineral oils as a function of rolling speed over the temperature range 25 to 65 C and at refrigerant concentrations from 10 to 50%. Task 5: Conduct Tests on R-134a and Polyolester and Polyvinyl Ether Lubricants Determine EHD film thickness and pressure-viscosity coefficient for R-134a with the indicated ISO 32 and 68 lubricants as a function of rolling speed over the temperature range 25 to 65 C and at refrigerant concentrations from 10 to 50%. Task 6: Conduct Tests on R-410A and Polyolester and Polyvinyl Ether Lubricants Determine EHD film thickness and pressure-viscosity coefficient for R-410A with the indicated ISO 32 and 68 lubricants as a function of rolling speed over the temperature range 25 to 65 C and at refrigerant concentrations from 10 to 50%. 5.0 TEST METHOD 5.1 Ultrathin Film Interferometry Method Lubricant Film Thickness Measurements Ultrathin film interferometry method (50) was adapted to measure film thickness of lubricant and refrigerant mixtures. This method is an extension of conventional optical interferometry that permits very thin films, down to less than 5 nm, to be measured accurately within an EHD contact. This technique can be used to study lubricant behavior in EHD as well as in mixed lubrication regimes. It is particularly useful for measuring film thickness for low viscosity fluids and/or under high temperatures. It has been successfully applied to study the EHD behavior of lubricant base oils, antiwear additives, metalworking fluids and polymers used as viscosity index improvers in lubricants (51-57). Some preliminary studies were also conducted on refrigeration lubricants (58). The test set-up is shown schematically in Figure 2. A highly polished steel ball (AISI 52100, mm diameter, 11 nm RMS surface roughness) is loaded against the underside 18
34 flat surface of a rotating transparent glass disc to form a circular concentrated EHD contact. The underside of the chromium-plated glass disc is coated with a spacer layer of transparent silica of about 500 nm thickness. The composite surface roughness of the undeformed surfaces is 11 nm. The ball is contained in a lubricant bath and is driven by the disc in nominally pure rolling. The lubricant is filled halfway to the top of the ball, so that the lubricant is entrained into the contact by the rolling motion of the ball. The test lubricant is enclosed in a stainless steel chamber and a heat insulation lid sits on top of the glass disc. This helps to maintain constant test temperature and protects the lubricant from exposure to the outside environment. The test temperature is controlled using heating rods embedded in the chamber walls and is monitored near the contact inlet using a digital thermometer. The temperature can be controlled to a set value within ± 0.5 C. 19
35 width of contact TV camera white light spectrometer framegrabber & microcomputer glass disc spacer layer ball position encoder (position of disc) Figure 2. Schematic set-up for ultrathin film interferometry 20
36 Lubricant film thickness is determined by optical interferometry as shown schematically in Figure 3. White light is shone into the contact and some is reflected from the chromium layer, while some passes through the silica spacer layer and any lubricant film present to be reflected from the ball. The two beams recombine and interfere. The interfered light from the contact is passed into a spectrometer where it is dispersed and detected by a solid state, black and white TV camera as shown in Figure 2. A framegrabber is used to capture this image and a microcomputer program determines the wavelength of maximum constructive interference in the central region of the contact. In this case, the maximum constructive interference of spacer layer plus lubricant film occurs when: n oil h oil + n sp h sp = (N - φ) λ sp + oil N = 1,2,3 Equation 11 2 Cos θ Maximum constructive interference of spacer layer occurs when: n sp h sp = (N - φ) λ sp N = 1,2,3 Equation 12 2 Cos θ The lubricant film thickness is then calculated from the difference between the measured film thickness and the thickness of the silica spacer layer: h oil = (N sp + oil λ sp + oil - N sp λ sp ) N = 1,2,3 Equation 13 2n oil 21
37 22
38 The ultrathin film technique incorporates two important advances over conventional optical interferometry. The first one is the use of a transparent silica spacer layer which acts like a supplementary oil film, enabling optical interference to be observed even when the actual oil film present is very thin. This overcomes a major limitation of conventional optical interferometry, that it cannot easily measure film below approximately one quarter the wavelength of visible light. Thus, lubricant films less than 100 nm (0.1 micron) thick cannot be measured using the conventional method. The second advance is that the reflected interfered light is dispersed by a spectrometer rather than being observed by the eye, as is done in conventional optical interferometry. The dispersed spectrum is computer-analyzed to identify the wavelength of light that is most constructively interfered. This greatly increases the precision of the method compared to conventional optical interferometry. 5.2 Film Thickness Measurements for Lubricant/Refrigerant Mixtures Pressurized Test Rig The ultrathin film EHD rig was modified to operate at pressures above the vapor pressure of the refrigerants at the test temperatures. For this purpose, a new stainless steel test chamber with thicker walls (20 mm) was constructed. This chamber was fitted with a heavy section bolt-down lid with a nitrile O-ring and a small (25 mm diameter) fused silica insert to view the contact, as shown in Figure 4. The fused silica window was sealed with a nitrile O-ring and a copper washer to prevent stress cracking of the window due to misalignment. The optics were adjusted to compensate for the longer focal length as compared to the atmospheric system. The chamber was fitted with a new shaft and seal assembly. The seal assembly consisted of a high pressure bellows seal with graphite face. A solid-based chamber with no aperture for the load system was designed. A spring loading system with parallel leafs was fitted inside the chamber. When the ball and disc were placed and clamped in the chamber, the springs deflected and applied a constant load of 20N to the contact. The chamber was fitted with heating rods, cooling galleries, an inlet valve, an adjustable pressure relief valve, and an emergency burst valve. 23

39 24
40 Figure 5 is a simplified diagram showing the test set-up for refrigerant/lubricant mixtures. The refrigerant cylinder was placed on a balance with a resolution of ± 0.05 g. The cylinder was connected to the test chamber by a 4.76 mm ID flexible stainless steel tubing. A known amount of refrigerant was introduced into the test chamber by a needle valve, V2. The system was designed to operate under 25 bars of pressure. The externally adjustable pressure relief valve was set at 35 bars. The emergency burst valve was rated at 50 bars. The system was fitted with vent and vacuum lines with needle valves for degassing the lubricant and discharging the refrigerant Test Procedure and Conditions The test conditions are shown in Table 1. Film thicknesses of lubricants and refrigerant/lubricant mixtures were measured between the ball and the disc using ultrathin film interferometry as described above at a series of rolling speeds ranging from 0.01 m/s (2 rpmdisc rotational speed) to about 2 m/s (460 rpm). All of the tests were carried out at a load of 20N. For the glass-on-steel contact, this load resulted in a maximum Hertz contact pressure of 0.54 GPa. Table 1. Test Conditions and Materials Contact Materials steel ball (19 mm diameter) SiO 2 coating (~ 400 nm) on Cr coated glass disc Contact Load 20 N Maximum Contact Pressure 0.54 GPa Rolling Speed 0.01 to 2 m/s Bulk Temperature 23 C, 45 C, 65 C The film thickness was measured at three fluid temperatures: ambient, 45 C, and 65 C. The ambient temperature varied from 22 C to 25 C between tests. The variation in the ambient temperature for each test was within ± 0.5 C. The average temperature for each ambient temperature test was reported along with the data. The test temperature of 45 C 25
41 and 65 C was controlled to a set value within ± 0.5 C using a small K-type thermocouple with a resolution of 0.1 C near the contact inlet. A new steel ball of RMS surface roughness of 11 nm was used for each test. 26
42 27
43 Lubricant and refrigerant were supplied separately to the test chamber. After placing the ball and disc in place, a known volume of test lubricant was charged into the chamber. The lid was bolted down using a torque wrench. The chamber was then evacuated to 350 microns to degas the oil. During evacuation, the refrigerant cylinder valve (V1) and the vent valve (V3) (Figure 5) were closed, and the chamber valve (V2) and the vacuum line valve (V4) were opened. After evacuation of the system, valves V2 and V4 were closed. Valve V1 was then opened and refrigerant was introduced into the line connecting the cylinder to the test chamber. The cylinder pressure and weight were recorded. Valve V2 was then opened and the desired weight of the refrigerant was added into the test chamber. The amount of the refrigerant charged into the chamber varied depending on the refrigerant concentration tested. Once the refrigerant was introduced into the test chamber, the chamber pressure would increase and then gradually decrease over time due to the dissolution of the refrigerant into the lubricant. The concentration of the refrigerant in the lubricant was determined by weighing the lubricant and the refrigerant added to the test chamber, and measuring the temperature and pressure of the chamber at equilibrium conditions. Daniel charts are used to determine the solubility and viscosity characteristics of the refrigerant and lubricant mixtures. The chamber pressure was monitored using a high precision gauge with an accuracy of ± 0.25%. An electronic halogen leak detector was used to ensure that no refrigerant leaked during the test. Film thickness measurements were taken after the pressure reached steady state. The time required for the system to reach steady state took from three to twenty-four hours, depending on the concentration and type of the refrigerant and lubricant tested. As described in Section 3.3 above, the refractive index of the test fluid is necessary to calculate film thickness in optical interferometry. A method for calculating the refractive index (RI) of the lubricant/refrigerant mixtures was developed and given in Appendix A. However, the repeatability of the measurements was poor (i.e., greater than the RI differences caused by the addition of the refrigerant to the lubricant). This could be improved by changes in the optics and the software. This work is planned in future studies. Previous studies by Akei et al (32, 33) on similar lubricant/refrigerant mixtures indicate that the refractive indices of lubricants decrease slightly up to a maximum deviation of 1.7% with increasing refrigerant concentration of up to 40% by weight. Therefore, it was assumed in this study that the refractive index change due to refrigerants was negligible. For all the lubricants tested, the effect of contact pressure on refractive index was calculated and corrected using the Lorentz-Lorentz equation and Hartung s formula (39) as shown in Appendix B. 28
44 5.3 Test Fluids The lubricants and refrigerants used in this study are shown in Table 2. Three different refrigerants were used: R-22, R-134a and R-410A. The lubricants studied included naphthenic mineral oils, polyolesters, and polyvinyl ethers of two different viscosity grades: ISO 32 and ISO 68. Table 3 shows some of the physical properties of the lubricants used. Table 2. Lubricants and Refrigerants Used Refrigerant Lubricant Commercial Identification R-22 ISO 32 Naphthenic Mineral Oil (NMO-32) ISO 68 Naphthenic Mineral Oil (NMO-68) R-134a ISO 32 Polyolester (POE-32) ISO 32 Polyvinyl Ether (PVE-32) ISO 68 Polyolester A (POE-68A) ISO 68 Polyolester B (POE-68B) ISO 68 Polyolester C (POE-68C) ISO 68 Polyvinyl Ether (PVE-68) R-410A ISO 32 Polyolester (POE-32) ISO 32 Polyvinyl Ether (PVE-32) ISO 68 Polyolester A (POE-68A) ISO 68 Polyvinyl Ether (PVE-68) Suniso 3GS Suniso 4GS ICI Emkarate RL 32H Idemitsu Kosan FVC 32B ICI Emkarate RL 68H Mobil EAL 68 CPI Solest 68 Idemitsu Kosan FVC 68B ICI Emkarate RL 32H Idemitsu Kosan FVC 32B ICI Emkarate RL 68H Idemitsu Kosan FVC 68B 29
45 Table 3. Physical Properties of Lubricants Lubricant Kinematic Viscosity, cst Density, g/ml Refractive Index 40 C 100 C 25 C 45 C 65 C 25 C 45 C 65 C NMO NMO POE POE-68A POE-68B POE-68C PVE PVE RESULTS 6.1 Film Thickness Measurements on Lubricants Under Air Baseline film thickness measurements were conducted on two naphthenic mineral oils, four polyolester lubricants, and two polyvinyl ether lubricants as a function of rolling speed at ambient (22-25 C), 45 and 65 C. The results for each lubricant are reported below Naphthenic Mineral Oils Figures 6 and 7 show the results for the ISO 32 and ISO 68 naphthenic mineral oils in the form of plots of log (film thickness) vs. log (rolling speed). According to the Dowson and Hamrock film thickness equation described in Section 3.2, the relationship between lubricant film thickness and entrainment speed should obey the relationship: h α U 0.67 Equation 14 The slopes of the lines in Figures 6 and 7 conform to Equation 14, lying in the range of 0.69 to The film thickness behavior with rolling speed followed Equation 14 up to the highest speeds (2 m/s) measured. It is predicted that significant thermal effects, such as inlet shear heating, will not occur until the entrainment speed approaches 5 m/s (59). 30
46 The data also shows a rapid fall in film thickness with rising temperature, which is predicted to occur from the EHD theory due to a decrease in both the bulk-viscosity and pressure-viscosity coefficient of the lubricant with increasing temperature. Figure 8 compares the film thickness measurements obtained on the two mineral oils and shows the effects of viscosity on film thickness measurements. As expected, the ISO 32 mineral oil forms thinner films (about half the thickness) in the contact than the ISO 68 mineral oil due to its lower viscosity Polyolesters Figures 9 through 12 show the film thickness data as a function of rolling speed and temperature for the four polyolesters tested. The gradients of the plots vary from 0.67 to 0.71 and agree with the theoretical EHD slope. The data shows similar trends to those observed with the mineral oils above. Figure 13 shows the effects of lubricant viscosity on film thickness and compares the data obtained on ISO 32 and ISO 68 polyolesters. As expected, the lower viscosity ester forms thinner films in the contact than the higher viscosity fluid. Figure 14 compares the data obtained on the three ISO 68 polyolesters: A, B and C. The film thickness of the three fluids appear to be comparable to each other at the temperatures tested Polyvinyl Ethers Figures 15 and 16 show the film thickness data as a function of rolling speed and temperature for the two polyvinyl ethers tested. Similar to the results reported above on mineral oils and polyolesters, the gradients of the plots show a good agreement with the EHD theory. Figure 17 shows the effects of lubricant viscosity on film thickness and compares the data obtained on ISO 32 and ISO 68 polyvinyl ethers. Overall, the data shows similar trends to those observed with the mineral oils and polyolesters above. 31
47 32

48 33

49 34
50 35

51 36

52 37

53 38

54 39

55 40
56 41

57 42

58 43
59 6.1.4 Repeatability of Measurements The repeatability of the film thickness measurements by ultrathin film interferometry was determined to be ± 1 nm below 5 nm and ± 5% above 5 nm in previous studies (55). The repeatability of the film thickness measurements in this study was determined for two different conditions. First, the film thickness measurements obtained in the old test chamber (i.e. atmospheric) and the new test chamber (i.e. modified to operate under pressure) were compared to verify the operation of the new chamber. For this purpose, tests were conducted in air under identical test conditions. Second, the repeatability of the measurements in the new test chamber was investigated by conducting duplicate measurements on a number of test fluids. Figures 18 through 21 show the repeatability of the film thickness measurements obtained in the old and the modified chamber for two naphthenic mineral oils and two polyolesters at three different test temperatures. The results indicate good agreement between the measurements and confirm the successful operation of the new rig. Figures 22 to 25 show the repeatability of the film thickness measurements in the new rig for duplicate tests on two polyolesters and two polyvinyl ethers. The results indicate that the measurements are repeatable within 3%. This agrees with the previous studies which indicate an overall repeatability of 3-5% for the ultrathin film interferometry method (54-57). 6.2 Effective Pressure-Viscosity Coefficients The effective pressure-viscosity coefficients (α-value) of the test fluids were calculated from the measured film thickness values as described in Section 3.4 above. The reference oil used for this procedure, obtained from Imperial College, U.K., was a well characterized synthetic hydrocarbon with a viscosity of cp and a pressure-viscosity coefficient of 13.5 GPa -1 at 40 C. Since the α-values determined in this report depend upon a reference fluid, these values should be considered accurate relative to each other, but not as absolute values. The effective pressure-viscosity coefficients calculated for the lubricants from the measured film thickness data at the three test temperatures are given in Table 4. The pressure-viscosity coefficient reported in the table is an average value determined from 44
60 duplicate film thickness measurements. The repeatability in the pressure-viscosity coefficients was determined to be ± 3 GPa -1. Figures 26 and 27 show the variation of α-value with temperature for the ISO 32 and ISO 68 test fluids, respectively. These figures also show the effect of chemical structure on pressure-viscosity characteristics and rank the lubricants with respect to their α-values. The mineral oils give the highest α-values, followed by polyvinyl ethers. Among the lubricants tested, the polyolesters have the lowest α-values. Molecular characteristics and shape factors, such as flexibility and the presence of short, rigid side groups, influence pressure-viscosity properties (60). Pressure-viscosity characteristics of fluids depend on the chemical structure and the steric nature of the molecules. In general, fluids with ring structures or bulky side groups have higher α-values than those with flexible, straight chain molecules (61). In Eyring s model of viscous flow, α- value depends upon the activation flow volume which is a measure of the size of hole required to be created in a fluid against pressure for the activated jump to occur (62). The size of this hole will depend upon the size of a flow unit within a molecule and thus directly upon the rigidity and shape of the molecule (63). The data given in Table 4 and Figures 26 and 27 show that the naphthenic oils with ring structures have the highest α-values. Esters, on the other hand, have low pressure-viscosity coefficients. This finding agrees with the existing literature on similar fluids (64, 65). Differences were observed in the pressure-viscosity characteristics of the polyolesters tested. This is probably due to the differences in the degree of branching in the ester structure. Polyolester B, which has the highest percent of branched acids (~ 84%), has higher α-values than polyolesters A (~ 51% branched acids) and C (~ 67% branched acids). Esters with more linear structure (POE-32 and POE-68A) have the lowest α-values. Pressure-viscosity coefficients also change with temperature as shown in Figures 26 and 27. As the temperature increases, alpha value decreases. This is due to the reduced interaction between the molecules at the higher temperatures. 45
61 6.3 Film Thickness Measurements on Mixtures of Naphthenic Mineral Oils and R-22 Film thickness measurements were conducted on mixtures of ISO 32 and ISO 68 naphthenic mineral oils as a function of rolling speed, temperature and refrigerant concentration. The results are reported in the following sections. Table 4. Effective Pressure-Viscosity Coefficients of Lubricants Lubricant Temperature ( C) NMO POE PVE NMO POE-68A POE-68B POE-68C PVE Effective Pressure-Viscosity Coefficient (± 3 GPa -1 )
62 47

63 48
64 49
65 50
66 51

67 52
68 53
69 54
70 55
71 56
72 6.3.1 ISO 32 Naphthenic Mineral Oil/R-22 Figures 28 through 30 show the film thickness data as a function of rolling speed and refrigerant concentration for mixtures of ISO 32 naphthenic mineral oil and R-22 at 23 C, 45 C and 65 C, respectively. The gradients of the plots, in general, agree with the EHD theoretical slope. However, some deviations are observed at the higher temperatures with high refrigerant concentrations. The R-22 concentrations studied included 0, 10, 20, 40 and 60% by weight. It must be noted that the refrigerant concentrations reported on the plots throughout this report are the percent weight of the refrigerant soluble in the lubricant. At the highest R-22 concentration of 60% by weight, tests were limited up to a temperature of 45 C due to the formation of extremely thin films (<10 nm) within the speed range studied. Figure 28 compares the film thickness data of ISO 32 naphthenic mineral oil with various concentrations of R-22 at ambient temperature. Film thickness decreases significantly in the contact as the refrigerant concentration increases. The same trend is observed at the higher test temperatures of 45 and 65 C, as shown in Figures 29 and 30. Figure 31 compares the reduction in film thickness with increasing refrigerant concentration at a constant speed of 0.81 m/s at the three test temperatures. It is interesting to note that even at the low refrigerant concentration of 10%, a reduction in film thickness of 45 to 63% was measured. Table 5 compares the percent reduction in film thickness at the different concentration levels of R-22 at the three test temperatures. At each temperature, the film thickness was decreased with increasing refrigerant concentration. However, at a given refrigerant concentration, the percent reduction in film thickness becomes smaller as the temperature is increased. 57
73 Table 5. Percent Reduction in Film Thickness for Mixtures of ISO 32 Naphthenic Mineral Oil and R-22 at a constant rolling speed of 0.8 m/s Refrigerant Temperature, C Concentration, wt % % Reduction in Film Thickness ISO 68 Naphthenic Mineral Oil/R-22 Figures 32 through 34 show the film thickness data as a function of rolling speed and refrigerant concentration for mixtures of ISO 68 naphthenic mineral oil and R-22 at 23 C, 45 C and 65 C, respectively. The gradients of the plots, in general, agree with the EHD theoretical slope. However, some deviations are observed at high temperatures with high refrigerant concentrations. The R-22 concentrations studied include 0, 10, 15, 30 and 50% by weight. At the highest R-22 concentration of 50% by weight, tests were limited up to a temperature of 45 C. Figure 32 compares the film thickness data of ISO 68 naphthenic mineral oil with various concentrations of R-22 at ambient temperature. The data shows similar trends to those observed with the lower viscosity (ISO 32) mineral oil reported above, i.e. film thickness decreases as the refrigerant concentration in the oil increases. The same trend is observed at the higher test temperatures of 45 and 65 C, as shown in Figures 33 and 34. Figure 35 compares the reduction in film thickness with increasing refrigerant concentration at a constant speed of 0.81 m/s at the three test temperatures. Table 6 compares the percent reduction in film thickness at the different concentration levels of R-22 at the three test temperatures. The percent reduction in film thickness is similar to that measured with the mixtures of ISO 32 naphthenic mineral oil and R-22, as shown in Table 5. In all cases, 58
74 the higher viscosity oil (ISO 68) forms thicker films in the contact than the lower viscosity oil (ISO 32) as expected. Table 6. Percent Reduction in Film Thickness for Mixtures of ISO 68 Naphthenic Mineral Oil and R-22 at a constant rolling speed of 0.8 m/s Refrigerant Temperature, C Concentration, wt % % Reduction in Film Thickness Effect of Refrigerant Concentration (R-22) on Effective Pressure-Viscosity Coefficients of Naphthenic Mineral Oils Effective pressure-viscosity coefficients of the oil and refrigerant mixtures were calculated as described in Section 3.4. It was assumed that the mixtures obey the theoretical relationship of Hamrock and Dowson (Equations 8-10). The reference oil information was given in Section 6.2. This calculation requires the knowledge of dynamic viscosity (or kinematic viscosity and density) for oil and refrigerant mixtures. This information was obtained from various literature sources including Henderson (70), Cavestri (71) and Van Gaalen (72). Table 7 shows the dynamic viscosity data obtained from the various references mentioned above for mixtures of ISO 32 naphthenic mineral oil and R-22. As seen in the table, depending on the literature source used, the viscosity values differ significantly by about 13 to 46%. This discrepancy is critical in α-value calculations. Depending on the dynamic viscosity used in the calculations, it was found that the α-values calculated from the same film thickness data could vary as much as 60%. 59
75 Temp., C Table 7. Dynamic Viscosity Data on Mixtures of ISO 32 Naphthenic Mineral Oil and R-22 obtained from various references Dynamic Viscosity, cp R-22 Concentration, Weight Percent 0% 10% 20% 40% 60% Ref. Ref. Ref. Ref. Ref. Ref. Ref. Ref. 71** 70* 71** 70* 71** 71** 72*** 11**** * Ref. 70: Henderson, 1994; dynamic viscosity calculated from empirical equations. ** Ref. 71: Cavestri, 1995, kinematic viscosity and density read from graphical data. *** Ref. 72: Van Gaalen, 1991; dynamic viscosity calculated from empirical equations. **** Ref. 11: Van Gaalen, 1990; experimental data. Table 8 shows the effective α-values calculated using the dynamic viscosity data from different sources. The α-values at 10 and 20 weight percent refrigerant concentration were calculated using the dynamic viscosity data obtained from the regression equations given in Reference 70. Since these equations are valid only up to a refrigerant concentration of 30%, the viscosity data provided in References 71, 72 and 11 were used at the higher R-22 concentrations of 40 and 60%. The numbers in parenthesis show the α-values calculated using the kinematic viscosity and density data obtained from Reference 71. As seen in Table 8, there is a big discrepancy in the α-values calculated from the same film thickness data using different dynamic viscosities. Figure 36 shows the effect of refrigerant concentration on effective pressure-viscosity coefficients and dynamic viscosity. In general, both the α-value and dynamic viscosity decrease with increasing refrigerant concentration and temperature. To test for the effect of viscosity on pressure-viscosity coefficient, α-values were plotted against dynamic viscosity for the naphthenic mineral oil (NMO-32) alone and its blends with R- 22 at all the test temperatures. The data was plotted using a logarithmic viscosity scale as shown in Figure 37. It is known from thermodynamic models that the changes in certain properties are related exponentially to viscosity (62, 66, 67). As can be seen in Figure 37, pressure-viscosity coefficient increases linearly in proportion to dynamic viscosity both for the mineral oil alone and its blends with the refrigerant. This effect has been reported recently for 60
76 various lubricant base oils (polyalphaolefins and mineral oils) and polyalphaolefin blends (68, 69). Table 8. Effective Pressure-Viscosity Coefficients for Mixtures of ISO 32 Naphthenic Mineral Oil and R-22 Temp., C Refrigerant Concentration, wt % 0% 10%* 20%* 40%** 60%*** α-values, GPa (23.9) a 12.8 (21.4) a (24.6) a 11.1 (25.1) a (23.3) a 13.8 (35.6) a * α-values were based on dynamic viscosity data from Ref. 70. ( ) a numbers in parenthesis show α-values based on dynamic viscosity data from Ref. 71. ** α-values were based on dynamic viscosity data from Ref. 11 and 72. *** α-values were based on dynamic viscosity data from Ref. 71. Effective pressure-viscosity coefficients were also calculated for the mixtures of ISO 68 naphthenic mineral oil and R-22. Dynamic viscosity was calculated from the kinematic viscosity and density data (graphical format) provided by Reference 73 and given in Table 9. Table 10 shows the α-values calculated as a function of refrigerant concentration at the three test temperatures. These were limited to the refrigerant concentrations of up to 30% by weight, since the viscosity data at 50% concentration was not available. Similar to the trends reported above for mixtures of ISO 32 naphthenic mineral oil and R-22, α-values and dynamic viscosities decrease with increasing refrigerant concentration and temperature, Figure 38. This finding agrees with Akei s work (33). Table 11 compares the α-values obtained in this work with those reported by Akei (33) for the same lubricant and refrigerant mixture. As seen in the table, excellent agreement was observed between the two studies. Figure 39 shows the increase in pressure-viscosity coefficient as a function of log (dynamic viscosity). 61
77 Table 9. Dynamic Viscosity Data for Mixtures of ISO 68 Naphthenic Mineral Oil and R-22 Temperature, C Dynamic Viscosity, cp R-22 Concentration, wt % 0% 10% 15% 30% Table 10. Effective Pressure-Viscosity Coefficients for Mixtures of ISO 68 Naphthenic Mineral Oils and R-22 Temperature, C Refrigerant Concentration, wt % 0% 10% 15% 30% α-values, GPa Table 11. Comparison of Effective Pressure-Viscosity Coefficients for ISO 68 NMO and R-22 Mixtures Temperature, C R-22 Concentration, wt % 0% 10% α-values, GPa * 21.0* * 17.0* * 14.0* * reported by M. Akei in Reference 33 62
78 63
79 64
80 65
81 Figure 31. Film Thickness vs. R-22 Concentration for ISO 32 Naphthenic Mineral Oil ± 0.3 C at 0.81 m/sec 45 C at 0.81 m/sec 65 C at 0.81 m/sec Film Thickness (nm) Wt.% R-22 in ISO 32 Naphthenic Mineral Oil 66

82 67

83 68

84 69
85 Figure 35. Film Thickness vs. R-22 Concentration for ISO 68 Naphthenic Mineral Oil ± 0.5 C at 0.81 m/sec 45 C at 0.81 m/sec 65 C at 0.81 m/sec Film Thickness (nm) Wt.% R-22 in ISO 68 Naphthenic Mineral Oil 70
86 Figure 36. Effect of Refrigerant Concentration on Effective Pressure- Viscosity Coefficient and Dynamic Viscosity for Mixtures of ISO 32 Naphthenic Mineral Oil and R C 45 C 65 C Alpha Value (GPa- 1 ) Dynamic Viscosity (cp) Solid lines represent alpha values Dashed lines represent dynamic viscosities Wt% R-22 71
87 Figure 37. Alpha Value vs. Dynamic Viscosity for ISO 32 Naphthenic Mineral Oil in R Alpha Value (GPa- 1 ) Log Dynamic Viscosity (cp) 72
88 Figure 38. Effect of Refrigerant Concentration on Effective Pressure- Viscosity Coefficient and Dynamic Viscosity for Mixtures of ISO 68 Naphthenic Mineral Oil and R-22 Alpha Value (GPa- 1 ) C 45 C 65 C Dynamic Viscosity (cp) Solid lines represent alpha values Dashed lines represent dynamic viscosities Wt% R-22 73
89 Figure 39. Alpha Value vs. Dynamic Viscosity for ISO 68 Naphthenic Mineral Oil in R Alpha Value (GPa- 1 ) Log Dynamic Viscosity (cp) 74
90 6.4 Film Thickness Measurements on Mixtures of Polyolesters and R-134a Film thickness measurements were conducted on mixtures of R-134a and polyolesters as a function of rolling speed, temperature and refrigerant concentration. One polyolester of ISO 32 viscosity grade (POE-32) and three polyolesters of ISO 68 viscosity grade (POE-68A, POE-68B, POE-68C) were included in this study. The results are reported in the following sections ISO 32 Polyolester/R-134a Figures 40 through 42 show the film thickness data as a function of rolling speed and refrigerant concentration for mixtures of ISO 32 polyolester and R-134a at 23 C, 45 C and 65 C, respectively. Overall, the gradients of the plots agree with the EHD theoretical slope. Some deviation from the theoretical slope is observed at the highest refrigerant concentration of 50% at the higher test temperatures. This discrepancy could be related to the miscibility characteristics of the refrigerant/lubricant mixtures under these conditions (i.e., high temperatures, pressures and refrigerant concentrations). It is possible that a two-phase system may occur in the inlet zone of the contact under these test conditions. The R-134a concentrations studied included 0, 10, 20, 40 and 50% by weight. Similar to the findings reported in the previous sections for naphthenic oils and R-22, film thickness decreases significantly in the contact as the refrigerant concentration in the lubricant increases. Figure 43 compares the reduction in film thickness with increasing refrigerant concentration at a constant speed of 0.81 m/s at the three test temperatures. Percent reduction in film thickness as a function of R-134a concentration is calculated for the data shown in Figure 43 and given in Table 12. Trends observed are similar to those reported in Section 6.3 for the mineral oil and R-22 mixtures. 75
91 Table 12. Percent Reduction in Film Thickness for Mixtures of ISO 32 Polyolester and R-134a at a constant rolling speed of 0.8 m/s Refrigerant Concentration, wt % Temperature, C % Reduction in Film Thickness ISO 68 Polyolesters/R-134a Polyolester A/R-134a Figures 44 through 46 show the film thickness data as a function of rolling speed and refrigerant concentration for mixtures of ISO 68 polyolester A and R-134a at 23 C, 45 C and 65 C, respectively. The gradients of the plots vary from 0.65 to 0.78 and agree with the EHD theoretical slope. The R-134a concentrations studied include 0, 10, 15, 30 and 50% by weight. Figure 44 compares the film thickness data of ISO 68 polyolester with various concentrations of R-134a at ambient temperature. The data shows similar trends to those observed with the lower viscosity (ISO 32) polyolester reported above, i.e. film thickness decreases as the refrigerant concentration in the oil increases. The same trend is observed at the higher test temperatures of 45 and 65 C, as shown in Figures 45 and 46. Figure 47 compares the reduction in film thickness with increasing refrigerant concentration at a constant speed of 0.81 m/s at the three test temperatures. Percent reduction in film thickness as a function of R-134a concentration is calculated from Figure 47 and reported in Table 13. This information is also given in the table for the other polyolesters (POE-68B and POE-68C) tested. The results indicate a similar reduction in film thickness for the three polyolesters studied. Jonsson reported a 55% reduction in film thickness for mixtures of polyolesters and R-134a containing 9% refrigerant at 21 C (31). This compares favorably 76
92 with the 52-57% reduction measured in this study for 10% R-134a concentration at 23 C (Table 13). Polyolester B/R-134a Figures 48 through 50 show the film thickness data as a function of rolling speed and refrigerant concentration for mixtures of ISO 68 polyolester B and R-134a at 23 C, 45 C and 65 C, respectively. The gradients of the plots vary from 0.65 to 0.78 and agree with the EHD theoretical slope. Figure 51 compares the reduction in film thickness with increasing refrigerant concentration at a constant speed of 0.81 m/s at the three test temperatures. Trends observed were similar to those reported above for the polyolester A/R-134a mixtures. Table 13. Percent Reduction in Film Thickness for Mixtures of ISO 68 Polyolesters and R-134a at a constant rolling speed of 0.8 m/s Refrigerant Concentration, wt % Temperature, C * reported in Reference % Reduction in Film Thickness POE-68A POE-68B POE-68C * 21* 55%
93 Polyolester C/R-134a Similar data on ISO 68 polyolester C and R-134a mixtures are given in Figures 52 through 55. Similar trends were observed to those reported above for polyolesters A and B. Comparison of Film Thickness Data for Polyolesters A, B and C Figures 56 through 58 compare the film thickness data obtained on mixtures of R-134a and polyolesters A, B and C at the test temperatures of 23, 45 and 65 C, respectively. Overall, the esters produce films of comparable thickness. In some cases, polyolester B produced thinner films in the contact than polyolesters A and C. This could be due to the higher solubility of this ester in the refrigerant due to its more branched structure Effect of Refrigerant Concentration (R-134a) on Effective Pressure- Viscosity Coefficients of Polyolesters Effective pressure-viscosity coefficients of the ester and refrigerant mixtures were calculated as described in Section 3.4. It was assumed that the mixtures obey the theoretical relationship of Hamrock and Dowson. As explained in Section 6.3.3, the calculation of α-value requires the knowledge of dynamic viscosity (or kinematic viscosity and density) data for ester and refrigerant mixtures. Dynamic viscosity, given in Table 14 for mixtures of ISO 32 polyolester and R-134a, was calculated from the kinematic viscosity and density data provided by Reference 74. Table 15 shows the effective α-values calculated for the mixtures of ISO 32 polyolester and R-134a as a function of refrigerant concentration and temperature. There are some anomalies in the α- values at high temperatures (45 and 65 C) and high refrigerant concentrations (40-50 wt %). There may be several possible reasons for this. First of all, in α-calculations, it was assumed that the mixtures of esters and refrigerants obey the theoretical relationship of Hamrock and Dowson, i.e. the EHD film generated in the presence of refrigerants depends on the same viscosity and pressure-viscosity mechanisms as for the lubricants only. This may not be true especially at high refrigerant concentrations. Discrepancies between experiments and theory were also reported by Jonsson (31). There also exists the possibility of the lubricant/refrigerant mixture to form a two-phase system in the inlet region of the contact (31). In this case, the 78
94 refrigerant concentration in the lubricant and hence the dynamic viscosity would vary from those reported in Tables 14 and 15. Other reasons may include the use of inaccurate dynamic viscosity in the pressure-viscosity coefficient calculations or the assumption of the same refractive index for the refrigerant/lubricant mixtures as the lubricant only. As discussed in Section 6.3.3, depending on the dynamic viscosity used in the calculations, the pressureviscosity coefficients calculated from the same film thickness data could vary as much as 60%. Table 14. Dynamic Viscosity Data for Mixtures of ISO 32 Polyolester and R-134a Temperature, C Dynamic Viscosity, cp R-134a Concentration, wt % 0% 10% 20% 40% 50% The α-value and dynamic viscosity, in general, decrease with increasing refrigerant concentration and temperature as shown in Figure 59. Figure 60 shows the relationship between α-values and log (dynamic viscosity). The α-values calculated for the ISO 32 polyolester/r-134a mixtures were compared to those reported in Reference 31 for a series of ISO 32 polyolester/r-134a in Table 15. Considering the differences in the experimental techniques, reasonable agreement was observed between the two studies. 79
95 Table 15. Effective Pressure-Viscosity Coefficients for Mixtures of ISO 32 Polyolester and R-134a Temperature, C Refrigerant Concentration, wt % 0% 10% 20% 40% 50% α-values, GPa (?) 19.2(?) (?) * * * ~ 13* * reported in Reference 31 for a series of ISO 32 Polyolesters Effective pressure-viscosity coefficients were also calculated for the mixtures of ISO 68 polyolesters A, B and C, and R-134a. Dynamic viscosity data, given in Table 16, were calculated from the kinematic viscosity and density data provided by References 74, 75, and 76. Table 17 compares the α-values calculated as a function of refrigerant concentration and temperature for the polyolesters A, B and C. The α-values calculated for these mixtures were compared to those reported by Akei (33) and Jonsson (31) in Table 18. In general, there is a good agreement between the ranges of α-values reported in this study and those reported in the literature. Figures 61 through 63 show the effect of R-134a concentration on dynamic viscosity and α-values. Figure 64 shows α-values plotted against log (dynamic viscosity) for the three polyolesters. The same overall trend as reported above for mineral oil/r-22 mixtures is seen, although there is more apparent overall scatter. 80
96 Table 16. Dynamic Viscosity Data for Mixtures of ISO 68 Polyolester and R-134a Temperature, C Polyolester A B C Dynamic Viscosity, cp R-134a Concentration, wt % 0% 10% 15% 30% Table 17. Effective Pressure-Viscosity Coefficients for Mixtures of ISO 68 Polyolester and R-134a Temperature, C Polyolester A B C Refrigerant Concentration, wt % 0% 10% 15% 30% α-values, GPa
97 Table 18. Comparison of Effective Pressure-Viscosity Coefficients for ISO 68 Polyolester and R-134a Mixtures Temperature, C Lubricant R-134a Concentration, wt % 0% 10% 30% α-values, GPa A POE* A B C POE* POE** ~14-31 ~14-25 ~ A B C POE* * reported in Reference 33 for ISO 68 POE ** reported in Reference 31 for a series of ISO 32 to ISO 370 polyolesters 82

98 83

99 84
100 85
101 Figure 43. Film Thickness vs. R-134a Concentration for ISO 32 Polyolester ± 0.3 C at 0.81 m/sec 45 C at 0.81 m/sec 65 C at 0.81 m/sec Film Thickness (nm) Wt.% R-134a in ISO 32 Polyolester 86

102 87
103 88
104 89
105 Figure 47. Film Thickness vs. R-134a Concentration for ISO 68 Polyolester A C ± 0.5 C at 0.81 m/sec 45 C at 0.81 m/sec 65 C at 0.81 m/sec Film Thickness (nm) Wt.% R-134a in ISO 68 Polyolester A 90

106 91

107 92

108 93
109 Figure 51. Film Thickness vs. R-134a Concentration for ISO 68 Polyolester B ± 0.5 C at 0.81 m/sec 45 C at 0.81 m/sec 65 C at 0.81 m/sec Film Thickness (nm) Wt.% R-134a in ISO 68 Polyolester B 94

110 95

111 96

112
113 Figure 55. Film Thickness vs. R-134a Concentration for ISO 68 Polyolester C ± 0.5 C at 0.81 m/sec 45 C at 0.81 m/sec 65 C at 0.81 m/sec Film Thickness (nm) Wt.% R-134a in ISO 68 Polyolester C 98

114 99

115 100

116 101
117 Figure 59. Effect of Refrigerant Concentration on Effective Pressure- Viscosity Coefficient and Dynamic Viscosity for Mixtures of ISO 32 Polyolester and R-134a C 45 C 65 C Alpha Value (GPa- 1 ) Dynamic Viscosity (cp) Solid lines represent alpha values Dashed lines represent dynamic viscosities Wt% R-134a 102
118 Figure 60. Alpha Value vs. Dynamic Viscosity for ISO 32 Polyolester in R-134a Alpha Value (GPa- 1 ) Log Dynamic Viscosity (cp) 103
119 Figure 61. Effect of Refrigerant Concentration on Effective Pressure- Viscosity Coefficient and Dynamic Viscosity for Mixtures of ISO 68 Polyolester A and R-134a Alpha Value (GPa- 1 ) C POE-68A 45 C POE-68A 65 C POE-68A Dynamic Viscosity (cp) Solid lines represent alpha values Dashed lines represent dynamic viscosities Wt% R-134a 104
120 Figure 62. Effect of Refrigerant Concentration on Effective Pressure- Viscosity Coefficient and Dynamic Viscosity for Mixtures of ISO 68 Polyolester B and R-134a C POE-68B C POE-68B Alpha Value (GPa- 1 ) C POE-68B Dynamic Viscosity (cp) Solid lines represent alpha values Dashed lines represent dynamic viscosities Wt% R-134a 105
121 Figure 63. Effect of Refrigerant Concentration on Effective Pressure- Viscosity Coefficient and Dynamic Viscosity for Mixtures of ISO 68 Polyolester C and R-134a Alpha Value (GPa- 1 ) C POE-68C 45 C POE-68C 65 C POE-68C Dynamic Viscosity (cp) Solid lines represent alpha values Dashed lines represent dynamic viscosities Wt% R-134a 106
122 Figure 64. Alpha Value vs. Dynamic Viscosity for ISO 68 Polyolesters A, B and C in R-134a POE-68 A POE-68 B POE-68 C Alpha Value (GPa- 1 ) Log Dynamic Viscosity (cp) 107
123 6.5 Film Thickness Measurements on Mixtures of Polyvinyl Ethers and R-134a Film thickness measurements were conducted on mixtures of ISO 32 and ISO 68 polyvinyl ethers as a function of rolling speed, temperature and refrigerant concentration. The results are reported in the following sections ISO 32 Polyvinyl Ether/R-134a Figures 65 through 67 show the film thickness data as a function of rolling speed and refrigerant concentration for mixtures of ISO 32 polyvinyl ether (PVE) and R-134a at 23 C, 45 C and 65 C, respectively. The gradients of the plots, in general, agree with the EHD theoretical slope. However, deviations are observed at the higher refrigerant concentrations and temperatures. The R-134a concentrations studied included 0, 10, 20 and 40% by weight. Similar to the trends observed with the polyolesters, Section 6.4, film thickness decreases significantly in the contact as the refrigerant concentration and temperature increase. Figure 68 compares the reduction in film thickness with increasing refrigerant concentration as a function of temperature at a constant speed of 0.81 m/s. At each temperature, the film thickness decreases with increasing refrigerant concentration. Table 19 compares the percent reduction in film thickness as a function of refrigerant concentration and temperature. At a constant refrigerant concentration, the reduction in film thickness becomes smaller as the temperature increases. 108
124 Table 19. Percent Reduction in Film Thickness for Mixtures of ISO 32 Polyvinyl Ether and R-134a at a constant rolling speed of 0.8 m/s Refrigerant Temperature, C Concentration, wt % % Reduction in Film Thickness ISO 68 Polyvinyl Ether/R-134a Figures 69 through 71 show the film thickness data as a function of rolling speed and refrigerant concentration for mixtures of ISO 68 polyvinyl ether (PVE) and R-134a at 23 C, 45 C and 65 C, respectively. The gradients of the plots vary from 0.67 to 0.74 and agree with the EHD theoretical slope. The R-134a concentrations studied include 0, 10, 15, 30 and 50% by weight. The data shows similar trends to those observed with the lower viscosity (ISO 32) PVE reported above, i.e. film thickness decreases as the refrigerant concentration in the lubricant increases. Figure 72 compares the reduction in film thickness with increasing refrigerant concentration at a constant speed of 0.81 m/s at the three test temperatures. Percent reduction in film thickness is given in Table Effect of Refrigerant Concentration (R-134a) on Effective Pressure- Viscosity Coefficients of Polyvinyl Ethers Effective pressure-viscosity coefficients of the PVE and R-134a mixtures were calculated as described in Section 3.4. It was assumed that the mixtures obey the theoretical relationship of Hamrock and Dowson. Dynamic viscosity data for mixtures of ISO 32 PVE and R-134a, given in Table 21, were obtained from Reference 77. The effective α-values calculated for these mixtures are given in 109
125 Table 22 as a function of refrigerant concentration and temperature. In general, the α-value and dynamic viscosity decrease with increasing refrigerant concentration and temperature as shown in Figure 73. Figure 74 shows the increase in α-values as a function of log (dynamic viscosity). Effective pressure-viscosity coefficients were also calculated for the mixtures of ISO 68 PVE and R-134a. Dynamic viscosity data obtained from Reference 77 is given in Table 23. The α-values and dynamic viscosity as a function of refrigerant concentration and temperature are given in Table 24 and Figure 75. The α-values reported for 30% refrigerant concentration at high temperatures (45 and 65 C) show some anomalies, i.e. they increase with increasing temperature. This was also observed for mixtures of R-134a and polyolesters. Possible reasons for this finding were discussed in Section Figure 76 shows the increase in α-values as a function of log (dynamic viscosity). 110
126 Table 20. Percent Reduction in Film Thickness for Mixtures of ISO 68 Polyvinyl Ether and R-134a at a constant rolling speed of 0.8 m/s Refrigerant Concentration, Temperature, C wt % % Reduction in Film Thickness Table 21. Dynamic Viscosity Data for Mixtures of ISO 32 Polyvinyl Ether and R-134a Temperature, C Dynamic Viscosity, cp R-134a Concentration, wt % 0% 10% 20% 40% Table 22. Effective Pressure-Viscosity Coefficient for Mixtures of ISO 32 Polyvinyl Ether and R-134a Temperature, C Refrigerant Concentration, wt % 0% 10% 20% 40% α-values, GPa
127 Table 23. Dynamic Viscosity Data for Mixtures of ISO 68 Polyvinyl Ether and R-134a Temperature, C Dynamic Viscosity, cp R-134a Concentration, wt % 0% 10% 15% 30% 50% N/A N/A Table 24. Effective Pressure-Viscosity Coefficients for Mixtures of ISO 68 Polyvinyl Ether and R-134a Temp., C Refrigerant Concentration, wt % 0% 10% 15% 30% 50% α-values, GPa (?) (?) Film Thickness Measurements on Mixtures of Polyolesters and R-410A Film thickness measurements were conducted on mixtures of R-410A and polyolesters, POE-32 and POE-68A, as a function of rolling speed, temperature and refrigerant concentration. The results are reported in the following sections ISO 32 Polyolester/R-410A Figures 77 through 79 show the film thickness data as a function of rolling speed and refrigerant concentration for mixtures of ISO 32 polyolester and R-410A at 23 C, 45 C and 65 C, respectively. Overall, the gradients of the plots agree with the EHD theoretical slope. The R-410A concentrations studied were limited to 10 and 20% by weight due to the high vapor pressure of this refrigerant. The data shows similar trends to those observed with the other lubricant and refrigerant mixtures reported in the previous sections, i.e. the film thickness decreases as the refrigerant concentration in the lubricant increases. Figure
128 compares the reduction in film thickness with increasing refrigerant concentration at a constant speed of 0.81 m/s at the three test temperatures. The percent reduction in film thickness at this speed is given in Table 25. Table 25. Percent Reduction in Film Thickness for Mixtures of ISO 32 Polyolester and R-410A at a constant rolling speed of 0.8 m/s Refrigerant Concentration, Temperature, C wt % % Reduction in Film Thickness ISO 68 Polyolester A/R-410A Similar data on ISO 68 polyolester A and R-410A mixtures are given in Figures 81 through 84 and Table 26. The data shows similar trends to those reported above in Section for the ISO 32 polyolester. As expected, the film thicknesses measured for POE-68A/R- 410A were greater than those measured for POE-32/R-410A. Table 26. Percent Reduction in Film Thickness for Mixtures of ISO 68 Polyolester A and R-410A at a constant rolling speed of 0.8 m/s Refrigerant Concentration, Temperature, C wt % % Reduction in Film Thickness
129 114
130 115

131 116
132 Figure 68. Film Thickness vs. R-134a Concentration for ISO 32 Polyvinyl Ether ± 1.0 C at 0.81 m/sec 45 C at 0.81 m/sec 65 C at 0.81 m/sec Film Thickness (nm) Wt.% R-134a in ISO 32 Polyvinyl Ether 117

133 118

134 119

135 120
136 Figure 72. Film Thickness vs. R-134a Concentration for ISO 68 Polyvinyl Ether ± 0.4 C at 0.81 m/sec 45 C at 0.81 m/sec 65 C at 0.81 m/sec Film Thickness (nm) Wt.% R-134a in ISO 68 Polyvinyl Ether 121
137 Figure 73. Effect of Refrigerant Concentration on Effective Pressure- Viscosity Coefficient and Dynamic Viscosity for Mixtures of ISO 32 Polyvinyl Ether and R-134a Alpha Value (GPa- 1 ) C 45 C 65 C Dynamic Viscosity (cp) Solid lines represent alpha values Dashed lines represent dynamic viscosities Wt% R-134a 122
138 Figure 74. Alpha Value vs. Dynamic Viscosity for ISO 32 Polyvinyl Ether in R-134a Alpha Value (GPa- 1 ) Log Dynamic Viscosity (cp) Solid lines represent alpha values Dashed lines represent dynamic viscosities 123
139 Figure 75. Effect of Refrigerant Concentration on Effective Pressure- Viscosity Coefficient and Dynamic Viscosity for Mixtures of ISO 68 Polyvinyl Ether and R-134a Alpha Value (GPa- 1 ) C 45 C 65 C Dynamic Viscosity (cp) Solid lines represent alpha values Dashed lines represent dynamic viscosities Wt% R-134a 124
140 Figure 76. Alpha Value vs. Dynamic Viscosity for ISO 68 Polyvinyl Ether in R-134a Alpha Value (GPa- 1 ) Log Dynamic Viscosity (cp) 125
141 126
142 127
143 128
144 Figure 80. Film Thickness vs. R-410A Concentration for ISO 32 Polyolester ± 0.5 C at 0.81 m/sec 45 C at 0.81 m/sec 65 C at 0.81 m/sec Film Thickness (nm) Wt.% R-410A in ISO 32 Polyolester 129

145 130

146 131

147 132
148 Figure 84. Film Thickness vs. R-410A Concentration for ISO 68 Polyolester A ± 0.4 C at 0.81 m/sec 45 C at 0.81 m/sec 65 C at 0.81 m/sec Film Thickness (nm) Wt.% R-410A in ISO 68 Polyolester A 133
149 6.6.3 Effect of Refrigerant (R-410A) Concentration on Effective Pressure- Viscosity Coefficients of Polyolesters Effective pressure-viscosity coefficients of the ester and refrigerant mixtures were calculated as described in Section 3.4. It was assumed that the mixtures obey the theoretical relationship of Hamrock and Dowson. Dynamic viscosity data for mixtures of POE-32 and R-410A were calculated from the kinematic viscosity and density data provided by Reference 74 and given in Table 27. The effective α-values calculated for these mixtures are given in Table 28. Figure 85 shows the variation of α-value and dynamic viscosity as a function of refrigerant concentration and temperature. Figure 86 shows the variation of α-values with the logarithm of dynamic viscosity. Table 27. Dynamic Viscosity Data for Mixtures of ISO 32 Polyolester and R-410A Temperature, C Dynamic Viscosity, cp R-410A Concentration, wt % 0% 10% 20% Table 28. Effective Pressure-Viscosity Coefficients for Mixtures of ISO 32 Polyolester and R-410A Temperature, C R-410A Concentration, wt % 0% 10% 20% α-values, GPa (?) Effective pressure-viscosity coefficients were also calculated for the mixtures of POE- 68A and R-410A. Table 29 shows the dynamic viscosity data calculated from the kinematic viscosity and density data provided by Reference 74. The α-values calculated as a function of refrigerant concentration and temperature are given in Table 30 and Figure 87. Figure 88 shows the variation of pressure-viscosity coefficient with log (dynamic viscosity). The data reported in Tables 28 and 30 show that α-values increase with temperature at high R-410A concentrations. This was also observed for the mixtures of R-134a and 134
150 polyolesters, and R-134a and polyvinyl ethers. Possible reasons for this observation were discussed in Section Table 29. Dynamic Viscosity Data for Mixtures of ISO 68 Polyolester A and R-410A Temperature, C Dynamic Viscosity, cp R-410A Concentration, wt % 0% 10% 15% 30% N/A Table 30. Effective Pressure-Viscosity Coefficients for Mixtures of ISO 68 Polyolester A and R-410A Temperature, C R-410A Concentration, wt % 0% 10% 15% 30% α-values, GPa (?) Film Thickness Measurements on Mixtures of Polyvinyl Ethers and R-410A Film thickness measurements were conducted on mixtures of ISO 32 and ISO 68 polyvinyl ethers and R-410A as a function of rolling speed, temperature and refrigerant concentration. The results are reported in the following sections ISO 32 Polyvinyl Ether/R-410A Figures 89 through 91 show the film thickness data as a function of rolling speed and refrigerant concentration for mixtures of ISO 32 polyvinyl ether (PVE) and R-410A at 23 C, 45 C and 65 C, respectively. The gradients of the plots vary from 0.65 to 0.71 and agree with the EHD theoretical slope. The R-410A concentrations studied included 0, 20, and 40% by weight. Similar to the trends observed with the other lubricant and refrigerant system investigated in this study, film thickness decreases significantly in the contact as the refrigerant concentration and temperature increase. 135
151 Figure 92 compares the reduction in film thickness with increasing refrigerant concentration at a constant speed of 0.81 m/s as a function of temperature. At each temperature, the film thickness decreases with increasing refrigerant concentration. Table 31 compares the percent reduction in film thickness as a function of refrigerant concentration and temperature. At a constant refrigerant concentration, the reduction in film thickness becomes smaller as the temperature increases. Table 31. Percent Reduction in Film Thickness for Mixtures of ISO 32 Polyvinyl Ether and R-410A at a constant rolling speed of 0.8 m/s Refrigerant Concentration, Temperature, C wt % % Reduction in Film Thickness ISO 68 Polyvinyl Ether/R-410A Figures 93 through 95 show the film thickness data as a function of rolling speed and refrigerant concentration for mixtures of ISO 68 polyvinyl ether (PVE) and R-410A at 23 C, 45 C and 65 C, respectively. The gradients of the plots vary from 0.67 to 0.78 and agree with the EHD theoretical slope. The R-410A concentrations studied include 0, 10, 15, 20, 30 and 50% by weight. The data shows similar trends to those observed with the lower viscosity (ISO 32) PVE reported above, i.e. film thickness decreases as the refrigerant concentration in the lubricant increases. As expected, the film thicknesses measured for PVE-68A/R-410A were greater than those measured for PVE-32/R-410A. Figure 96 compares the reduction in film thickness with increasing refrigerant concentration at a constant speed of 0.81 m/s at the three test temperatures. The same data is also given in Table
152 Effective pressure-viscosity coefficients of the PVE and R-410A mixtures were calculated as described in Section 3.4. Dynamic viscosity data for mixtures of ISO 32 PVE and R-410A, given in Table 33, were obtained from Reference 77. The effective α-values calculated for these mixtures are given in Table 34 as a function of refrigerant concentration and temperature. Dynamic viscosity and α- value decrease with increasing refrigerant concentration and temperature as shown in Figure 97. Figure 98 shows the increase in α-values as a function of log (dynamic viscosity). Effective pressure-viscosity coefficients were also calculated for the mixtures of ISO 68 PVE and R-410A. Dynamic viscosity data obtained from Reference 77 is given in Table 35. The α-values calculated as a function of refrigerant concentration and temperature are given in Table 36 and Figure 99. Figure 100 shows the increase in α-values as a function of log (dynamic viscosity). 137
153 Table 32. Percent Reduction in Film Thickness for Mixtures of ISO 68 Polyvinyl Ether and R-410A at a constant rolling speed of 0.8 m/s Refrigerant Concentration, Temperature, C wt % % Reduction in Film Thickness Table 33. Dynamic Viscosity Data for Mixtures of ISO 32 Polyvinyl Ether and R-410A Temperature, C Dynamic Viscosity, cp R-410 Concentration, wt % 0% 10% 20% 40% N/A Table 34. Effective Pressure-Viscosity Coefficients for Mixtures of ISO 32 Polyvinyl Ether and R-410A Temperature, C R-410A Concentration, wt % 0% 10% 20% 40% α-values, GPa
154 Table 35. Dynamic Viscosity Data for Mixtures of ISO 68 Polyvinyl Ether and R-410A Temperature, C Dynamic Viscosity, cp R-410 Concentration, wt % 0% 15% 20% 30% Table 36. Effective Pressure-Viscosity Coefficients for Mixtures of ISO 68 Polyvinyl Ether and R-410A Temperature, C R-410A Concentration, wt % 0% 15% 20% 30% α-values, GPa
155 Figure 85. Effect of Refrigerant Concentration on Effective Pressure- Viscosity Coefficient and Dynamic Viscosity for Mixtures of ISO 32 Polyolester and R-410A C 45 C 65 C Alpha Value (GPa- 1 ) Dynamic Viscosity (cp) Solid lines represent alpha values Dashed lines represent dynamic viscosities Wt% R-410A 140
156 Figure 86. Alpha Value vs. Dynamic Viscosity for ISO 32 Polyolester in R-410A Alpha Value (GPa- 1 ) Log Dynamic Viscosity (cp) 141
157 Figure 87. Effect of Refrigerant Concentration on Effective Pressure- Viscosity Coefficient and Dynamic Viscosity for Mixtures of ISO 68 Polyolester A and R-410A Alpha Value (GPa- 1 ) C 45 C 65 C Dynamic Viscosity (cp) Solid lines represent alpha values Dashed lines represent dynamic viscosities Wt% R-410A 142
158 Figure 88. Alpha Value vs. Dynamic Viscosity for ISO 68 Polyolester A in R-410A Alpha Value (GPa- 1 ) Log Dynamic Viscosity (cp) 143
159 144
160 145
161 146
162 Figure 92. Film Thickness vs. R-410A Concentration for ISO 32 Polyvinyl Ether ± 0.6 C at 0.81 m/sec 45 C at 0.81 m/sec 65 C at 0.81 m/sec Film Thickness (nm) Wt.% R-410A in ISO 32 Polyvinyl Ether 147

163 148

164 149

165 150
166 Figure 96. Film Thickness vs. R-410A Concentration for ISO 68 Polyvinyl Ether ± 0.7 C at 0.81 m/sec 45 C at 0.81 m/sec 65 C at 0.81 m/sec Film Thickness (nm) Wt.% R-410A in ISO 68 Polyvinyl Ether 151
167 Figure 97. Effect of Refrigerant Concentration on Effective Pressure- Viscosity Coefficient and Dynamic Viscosity for Mixtures of ISO 32 Polyvinyl Ether and R-410A Alpha Value (GPa- 1 ) C 45 C 65 C Dynamic Viscosity (cp) Solid lines represent alpha values Dashed lines represent dynamic viscosities Wt% R-410A 152
168 Figure 98. Alpha Value vs. Dynamic Viscosity for ISO 32 Polyvinyl Ether in R-410A Alpha Value (GPa- 1 ) Log Dynamic Viscosity (cp) 153
169 Figure 99. Effect of Refrigerant Concentration on Effective Pressure- Viscosity Coefficient and Dynamic Viscosity for Mixtures of ISO 68 Polyvinyl Ether and R-410A Alpha Value (GPa- 1 ) C 45 C 65 C Dynamic Viscosity (cp) Solid lines represent alpha values Dashed lines represent dynamic viscosities Wt% R-410A 154
170 Figure 100. Alpha Value vs. Dynamic Viscosity for ISO 68 Polyvinyl Ether in R-410A Alpha Value (GPa- 1 ) Log Dynamic Viscosity (cp) 155
171 6.8 Comparison of Different Lubricant/Refrigerant Systems Polyolesters/R-134a vs. Mineral Oils/R-22 Figures 101 through 106 compare the film thickness measured for polyolester/r-134a mixtures with those measured with mineral oil/r-22 mixtures. Figures 101 through 103 compare the data for ISO 32 fluids, whereas Figures 104 through 106 compare the data for ISO 68 fluids at the three test temperatures. It is interesting to note that when there is no refrigerant in the lubricant, mineral oils produce thicker EHD films in the contact than the esters, particularly at low temperatures. The difference becomes smaller as the temperature increases due to the higher viscosity index of the ester fluids. In the presence of refrigerants, the mineral oil/r-22 system produces thinner films in the contact as compared to the polyolester/r-134a system. The difference is more significant as the refrigerant concentration in the lubricant increases. The differences observed can be related to the dynamic viscosity of the lubricant/refrigerant mixtures. As discussed in Section 3.2, the thickness of the lubricant film formed in EHD contacts is determined by the rheology of the lubricant in the contact inlet region and depends on two fluid properties: dynamic viscosity and pressure-viscosity coefficient. As shown in Tables 14, 16, 21 and 23, the dynamic viscosity of the naphthenic mineral oil/r-22 mixtures is lower than that of the polyolester/r-134a mixtures Polyvinyl Ethers/R134a vs. Polyolesters/R-134a and Mineral Oils/R-22 Figures 107 through 112 compare the film thickness measured for polyvinyl ether/r- 134a mixtures with those measured with polyolester/r-134a and mineral oil/r-22 mixtures. Figures 107 through 109 compare the data for ISO 32 fluids, whereas Figures 110 through 112 compare the data for ISO 68 fluids at the three test temperatures. Overall, PVE/R-134a mixtures give comparable films in thickness to POE/R-134a mixtures. At the low refrigerant concentrations (10 and 20 wt %), some differences were observed between the film formation capability of polyvinyl ethers and polyolesters in that polyvinyl ethers formed thicker films in the contact than polyolesters. 156

172 157

173 158

174 159

175 160

176 161

177 162

178 163

179 164

180 165

181 166

182 167

183 168
184 6.8.3 Polyolesters/R410A vs. Mineral Oils/R-22 Figures 113 through 118 compare the film thickness measured for polyolesters/r-410a mixtures with those measured with mineral oil/r-22 mixtures. Figures 113 through 115 compare the data for ISO 32 fluids, whereas Figures 116 through 118 compare the data for ISO 68 fluids at the three test temperatures. Overall, polyolester/r-410a mixtures give comparable films in thickness to mineral oil/r-22 mixtures Polyvinyl Ethers/R-410A vs. Polyolesters/R-410A and Mineral Oil/R-22 Figures 119 through 124 compare the film thickness measured for polyvinyl ether/r- 410A mixtures with those measured with polyolester/r-410a and mineral oil/r-22 mixtures. Figures 119 through 121 compare the data for ISO 32 fluids, whereas Figures 122 through 124 compare the data for ISO 68 fluids at the three test temperatures. Overall, PVE/R-410A mixtures give comparable films in thickness to POE/R-410A mixtures. With the lower viscosity fluids (ISO 32), polyvinyl ether/r-410a mixtures appear to form thicker films in the contact than polyolester/r-410a and mineral oil/r-22 mixtures R-410A vs. R-134a Figures 125 through 130 compare the film thickness measured for polyolester/r-134a mixtures with those measured with polyolester/r-410a mixtures. The data indicates that mixtures of polyolester/r-410a produce thinner films in the contact than those of the same lubricant and R-134a. The same result was observed for polyvinyl ethers, as shown in Figures 131 through 136, i.e. the presence of R-410A in the lubricant results in thinner films in the contact than that of R-134a Effective Pressure-Viscosity Coefficients Figures 137 through 142 compare the pressure-viscosity coefficients of the various lubricant and refrigerant mixtures tested. The comparisons were shown for ISO 32 fluids. 169
185 However, the same trends were also observed for the ISO 68 fluids. The results are summarized as follows: POE/R-410A vs. PVE/R-410A: Mixtures with PVE have higher α-values than those with polyolesters at all test temperatures. POE/R-134a vs. PVE/R-134a: Mixtures with PVE have higher α-values than those with polyolesters at all test temperatures. PVE/R-134a vs. NMO/R-22: Mixtures with NMO/R-22 have higher α-values than those with PVE/R-134a. However, the differences become smaller as the temperature and refrigerant concentration increase. POE/R-134a vs. NMO/R-22: NMO/R-22 mixtures have higher α-values than POE/R-134a. PVE/R-410A vs. NMO/R-22: Mixtures with NMO/R-22 have higher α-values than those with PVE/R-410A. However, the differences become smaller as the temperature and refrigerant concentration increase. POE/R-410A vs. NMO/R-22: NMO/R-22 mixtures have higher α-values than POE/R-410A. A graphical ranking of all the tested lubricant/refrigerant combinations is shown in Figures 143 through 145. The film thickness data reported in these figures were obtained under the same conditions of temperature (22.5 C) and speed (0.8 m/s). 170

186 171

187 172

188 173

189 174

190 175

191 176

192 177

193 178

194 179

195 180

196 181

197 182

198 183

199 184
200 185

201 186
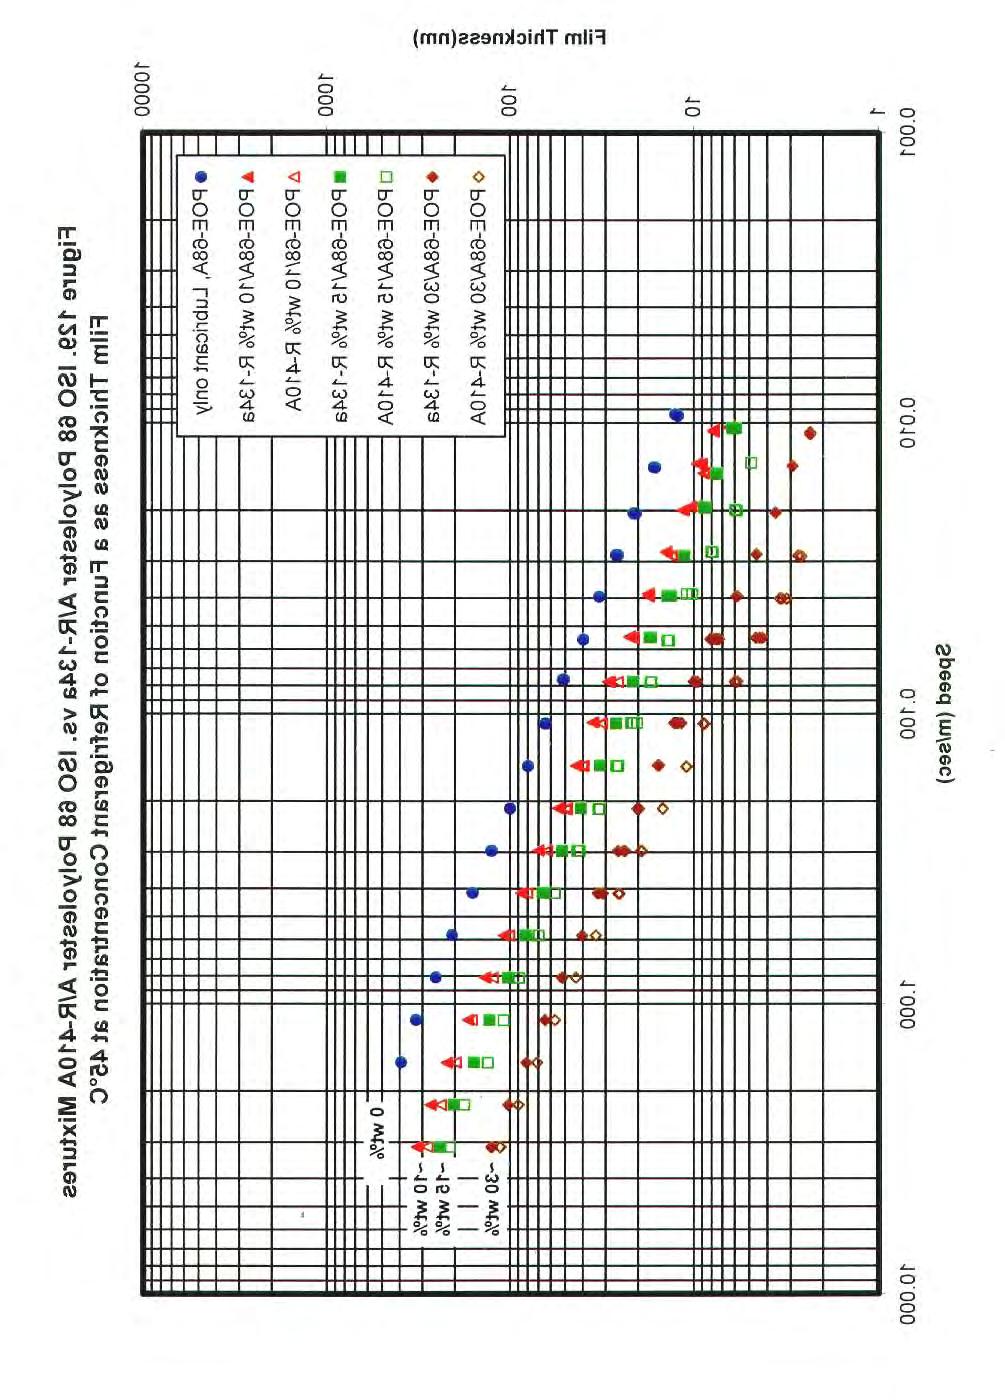
202 187

203 188

204 189

205 190
206 191

207 192

208 193

209 194
210 Figure 137. ISO 32 Polyolester/R-410A vs. ISO 32 Polyvinyl Ether/R-410A Mixtures - Effect of Refrigerant Concentration on Effective Pressure-Viscosity Coefficient Alpha Value (GPa- 1 ) C, POE C, POE C, POE C, PVE C, PVE C, PVE Wt% R-410A 195
211 Figure 138. ISO 32 Polyolester/R-134a vs. ISO 32 Polyvinyl Ether/R-134a Mixtures - Effect of Refrigerant Concentration on Effective Pressure-Viscosity Coefficient 35.0 Alpha Value (GPa- 1 ) C, POE C, POE C, POE C, PVE C, PVE C, PVE Wt% R-134a 196
212 Alpha Value (GPa- 1 ) Figure 139. ISO 32 Polyvinyl Ether/R-134a vs. ISO 32 Naphthenic Mineral Oil/R-22 Mixtures - Effect of Refrigerant Concentration on Effective Pressure-Viscosity Coefficient 23 C, PVE-32/R-134a 45 C, PVE-32/R-134a 65 C, PVE-32/R-134a 23 C, NMO-32/R C, NMO-32/R C, NMO-32/R Wt% Refrigerant 197
213 Alpha Value (GPa- 1 ) Figure 140. ISO 32 Polyolester/R-134a vs. ISO 32 Naphthenic Mineral Oil /R-22 Mixtures - Effect of Refrigerant Concentration on Effective Pressure-Viscosity Coefficient 23 C, POE-32/R-134a 45 C, POE-32/R-134a 65 C, POE-32/R-134a 23 C, NMO-32/R C, NMO-32/R C, NMO-32/R Wt% Refrigerant 198
214 Figure 141. ISO 32 Polyvinyl Ether/R-410A vs. ISO 32 Naphthenic Mineral Oil/R-22 Mixtures - Effect of Refrigerant Concentration on Effective Pressure-Viscosity Coefficient Alpha Value (GPa- 1 ) C, PVE-32/R-410A 45 C, PVE-32/R-410A 65 C, PVE-32/R-410A 23 C, NMO-32/R C, NMO-32/R C, NMO-32/R Wt% Refrigerant 199
215 Figure 142. ISO 32 Polyolester/R-410A vs. ISO 32 Naphthenic Mineral Oil Mixtures - Effect of Refrigerant Concentration on Effective Pressure-Viscosity Coefficient Alpha Value (GPa- 1 ) C, POE-32/R-410A 45 C, POE-32/R-410A 65 C, POE-32/R410A 23 C, NMO-32/R C, NMO-32/R C, NMO-32/R Wt% Refrigerant 200
216 201
217 202

218 203
Friction Coefficient Of Oil/Refrigerant Mixtures At A Pressure of 2.5 GPa
 Purdue University Purdue e-pubs International Compressor Engineering Conference School of Mechanical Engineering 2002 Friction Coefficient f il/refrigerant Mixtures At A Pressure of 2.5 GPa R. Tuomas Luleå
Experimental study on the shear thinning effects of viscosity index improver added lubricant by in-situ optical viscometer
 Korea-Australia Rheology Journal Vol. 15, No. 3, September 2003 pp. 117-124 Experimental study on the shear thinning effects of viscosity index improver added lubricant by in-situ optical viscometer Siyoul
Tribology Module4: Lubricants & Lubrication
 Tribology Module4: Lubricants & Lubrication Q.1. What is fluid film lubrication? What is the difference between hydrostatic and hydrodynamic lubrication? Ans: Fluid film lubrication is a generic term used
GREASE FILM THICKNESS AND FRICTION IN EHL CONTACTS
 GREASE FILM THICKNESS AND FRICTION IN EHL CONTACTS P. M. CANN Tribology Section, Department of Mechanical Engineering, Imperial College of Science, Technology and Medicine, London SW7 2BX, UK, e-mail:
Electrical Contact Resistance (ECR)
") Electrical Contact Resistance (ECR) The ECR (Electrical Contact Resistance) is an add-on to the standard MTM2 system. The electrical resistance is measured between the disc and the upper specimen (ball,
Electrical Contact Resistance (ECR) The ECR (Electrical Contact Resistance) is an add-on to the standard MTM2 system. The electrical resistance is measured between the disc and the upper specimen (ball,
FILM FORMING AND FRICTION PROPERTIES OF SINGLE PHASE AND TWO PHASE LUBRICANTS IN HIGH-SPEED ROLLING/SLIDING CONTACT
 FILM FORMING AND FRICTION PROPERTIES OF SINGLE PHASE AND TWO PHASE LUBRICANTS IN HIGH-SPEED ROLLING/SLIDING CONTACT by Joslyn HILI A thesis submitted to Imperial College London for the degree of Doctor
AN INTRODUCTION TO LUBRICANTS
 AN INTRODUCTION TO LUBRICANTS Basic Lubrication Principles This article serves to be a practical guide to lubricants and lubrication. The proper selection and application of lubricants will hopefully be
BREOX RFL-X for CO2 Refrigeration
 BREOX RFL-X for CO2 Refrigeration Additional Technical Data BREOX RFL-X GRADES FOR CO2 COMPRESSION High performance novel polyalkylene glycol lubricants for CO2 based air-conditioning / refrigeration systems
Performance Additives. Printing Inks
 Performance Additives Printing Inks Honeywell Gives You Every Advantage Honeywell A-C Performance Additives Honeywell s A-C Performance Additives help you improve a multitude of processes and products.
Protect your investment:
 Protect your investment: Five factors to consider before making the switch to aftermarket oil Oil formulation is more critical than ever to maintaining uptime, productivity and equipment life. Aftermarket
Printing Inks. Performance Additives
 Printing Inks Performance Additives Honeywell Gives You Every Advantage Honeywell A-C Performance Additives Honeywell s A-C Performance Additives help you improve a multitude of processes and products.
Analysing oil as a tool for improving the performance of wind turbine gearboxes. Main problems detected with the lubricant.
 Analysing oil as a tool for improving the performance of wind turbine gearboxes. Main problems detected with the lubricant. Jesús Terradillos, Jose Ignacio Ciria Within the current environment of renewable
EFFECT OF WETTING ON FRICTION M. Kalin*, M. Polajnar *Corresponding author:
 EFFECT OF WETTING ON FRICTION M. Kalin*, M. Polajnar *Corresponding author: mitjan.kalin@tint.fs.uni-lj.si Laboratory for Tribology and Interface Nanotechnology, University of Ljubljana, Ljubljana, Slovenia
Choice of Test Machines
 Choice of Test Machines 2003 George Plint Wear & Failure Mechanisms The more we can characterize the full scale problem the easier it becomes to ensure that the bench tests we run will provide useful information.
High-Pressure Viscosity Measurements of Polyalphaorefins at Elevated Temperature
 Tribology Online, 11, 2 (2016) 444-449. ISSN 1881-2198 DOI 10.2474/trol.11.444 Short Communication High-Pressure Viscosity Measurements of Polyalphaorefins at Elevated Temperature Yuichi Nakamura 1)*,
Efficacy of Lead Naphthenate for Wear Protection in Mixed Lubrication Regime
 Efficacy of Lead Naphthenate for Wear Protection in Mixed Lubrication Regime Jason T. Galary *, This research investigated the efficacy of lead naphthenate as a wear additive in multi alkylated cyclopentane
Elastohydrodynamic film thickness of soft EHL contacts using optical interferometry
 Elastohydrodynamic film thickness of soft EHL contacts using optical interferometry Nigel Marx*, Johan Guegan*, Hugh A Spikes* * Tribology Group, Department of Mechanical Engineering, Imperial College
XL0897 HIGH-FLASH POE CHAIN OIL
 XL0897 XL0897 HIGH-FLASH POE CHAIN OIL XL0897 is a polyolester-based lubricant formulated with highly stable polymers to increase its viscosity index. This helps prevent the formation of varnish and carbon
Analysis and simulation of friction and wear processes using sliding stress Universal tribometer. TÜV Thuringia examination extracts
 Analysis and simulation of friction and wear processes using sliding stress Universal tribometer TÜV Thuringia examination extracts The Universal tribometer type TRM 1000 used to study and simulate friction
Various Performance Of Polyvinylether (PVE) Lubricants With HFC Refrigerants
 Lubricants With HFC Refrigerants") Purdue University Purdue e-pubs International Refrigeration and Air Conditioning Conference School of Mechanical Engineering 22 Various Performance Of Polyvinylether () Lubricants With HFC Refrigerants
Purdue University Purdue e-pubs International Refrigeration and Air Conditioning Conference School of Mechanical Engineering 22 Various Performance Of Polyvinylether () Lubricants With HFC Refrigerants
Lubricating grease shear flow and boundary layers in a concentric. cylinder configuration
 45 3rd International Tribology Symposium of IFToMM, March in 2013, Luleå Lubricating grease shear flow and boundary layers in a concentric cylinder configuration J. X. LI 1, LARS G. WESTERBERG 2, E. HÖGLUND
TRIBOLOGICAL BEHAVIOUR OF POLYALPHAOLEFINS: WEAR AND ROLLING CONTACT FATIGUE TESTS
 TRIBOLOGICAL BEHAVIOUR OF POLYALPHAOLEFINS: WEAR AND ROLLING CONTACT FATIGUE TESTS E. Fernández Rico University of Oviedo, Spain. Carretera de Castiello s/n. 334 Gijón. Asturias. Email: efrico@correo.uniovi.es
ISO 6281 INTERNATIONAL STANDARD. Plain bearings Testing under conditions of hydrodynamic and mixed lubrication in test rigs
 Provläsningsexemplar / Preview INTERNATIONAL STANDARD ISO 6281 First edition 2007-06-15 Plain bearings Testing under conditions of hydrodynamic and mixed lubrication in test rigs Paliers lisses Essai des
Viscosity Loss in PFPE Lubricant for Space Applications under EHL Conditions
 Tribology Online, 2, 2 (27) 54-58. ISSN 88-298 DOI.2474/trol.2.54 Viscosity Loss in PFPE Lubricant for Space Applications under EHL Conditions Sobahan Mia )*, Hidekazu Komiya ), Shinichiro Hayashi ), Shigeki
4. Surface & Metrology
 4. Index Surface roughness Friction, wear Surface treatment & Coating Metrology Surface Structure ( 표면구조 ) Contaminant ( 불순물 ) Oxide ( 산화물 ) Fe 2 O 3, Al 2 O 3, Cu 2 O, CrO Surface structure( 표면구조 ): work
Fabrication of sub-100nm thick Nanoporous silica thin films
 Fabrication of sub-100nm thick Nanoporous silica thin films Abstract M. Ojha, W. Cho, J. L. Plawsky, W. N. Gill Department of chemical and biological engineering, Rensselaer Polytechnic Institute Low refractive
Volume I. Final Report. Robert Kauffman. University of Dayton Research Institute 300 College Park Dayton, Ohio
 DOE/CE/23810-41 ACCELERATED SCREENING METHODS FOR DETERMINING CHEMICAL AND THERMAL STABILITY OF REFRIGERANT-LUBRICANT MIXTURES PART II: EXPERIMENTAL COMPARISON AND VERIFICATION OF METHODS Volume I Final
DESIGN IMPROVEMENT BASED ON WEAR OF A JOURNAL BEARING USING AN ELASTOHYDRODYNAMIC LUBRICATION MODEL
 C58, Page DESIGN IMPROVEMENT BASED ON WEAR OF A JOURNAL BEARING USING AN ELASTOHYDRODYNAMIC LUBRICATION MODEL Mustafa DUYAR, Zafer DURSUNKAYA 2 Ricardo Software, Prague, Czech Republic Phone: 42 22 729
AN ASSESSMENT OF CAPPED POLYALKYLENE GLYCOL TECHNOLOGY FOR CO 2 REFRIGERATION. Elizabeth Dixon
 AN ASSESSMENT OF CAPPED POLYALKYLENE GLYCOL TECHNOLOGY FOR CO 2 REFRIGERATION. Elizabeth Dixon LAPORTE - COGNIS Introduction The refrigeration industry has recently realised a number of significant changes
Improvement of Fracturing for Gas Shales
 Improvement of Fracturing for Gas Shales RPSEA Subcontract Number: 07122-38 Topical Progress Report Students: Abhishek Gaurav & Ming Gu Principal Investigator: Dr. Kishore Mohanty Department of Petroleum
Fundamentals of Machine Component Design
 FOURTH E D I T I O N Fundamentals of Machine Component Design ROBERT C. JUVINALL Professor of Mechanical Engineering University of Michigan KURT M. MARSHEK Professor of Mechanical Engineering University
FOAMING CHARACTERISTICS OF REFRIGERANT / LUBRICANT MIXTURES
 DOE/CE/23810-88 FOAMING CHARACTERISTICS OF REFRIGERANT / LUBRICANT MIXTURES Final Technical Report D. Yogi Goswami Dinesh O. Shah Chand K. Jotshi Sunil S. Bhagwat Michael Leung Aaron S. Gregory Shaoguang
Water Droplet Impingement Erosion (WDIE) Water Droplet Impingement Erosion (WDIE) Solid Particle Erosion. Outline
 Water Droplet Impingement Erosion (WDIE) Solid Particle Erosion. Outline") Water Droplet Impingement Erosion (WDIE) Incoming air temperature Outline Mass flow rate Introduction Example Output power Energy Demand Temperature Turbine efficiency 1 F 0.3-0.5% Turbine inlet cooling
Water Droplet Impingement Erosion (WDIE) Incoming air temperature Outline Mass flow rate Introduction Example Output power Energy Demand Temperature Turbine efficiency 1 F 0.3-0.5% Turbine inlet cooling
Fundamentals p. 1 Mechanical Engineering Design in Broad Perspective p. 3 An Overview of the Subject p. 3 Safety Considerations p.
 Fundamentals p. 1 Mechanical Engineering Design in Broad Perspective p. 3 An Overview of the Subject p. 3 Safety Considerations p. 5 Ecological Considerations p. 9 Societal Considerations p. 11 Overall
Sede Legale: Via IV Novembre, n CERANO (NO) Italy Fax R439A
 Italy Fax R439A") R439A R439A is a new environment-friendly refrigerant, developed to replace R22 and R410A in household air conditioning / heat pump, industrial process refrigeration and cold-storage refrigeration etc.
R439A R439A is a new environment-friendly refrigerant, developed to replace R22 and R410A in household air conditioning / heat pump, industrial process refrigeration and cold-storage refrigeration etc.
Influence of Lubricant Factors on Coefficient of Friction and Clarification of Lubrication Mechanism in Hot Rolling
 , pp. 868 873 Influence of Lubricant Factors on Coefficient of Friction and Clarification of Lubrication Mechanism in Hot Rolling Akira AZUSHIMA, 1) WeiDong XUE 2) and Yoshiaki YOSHIDA 3) 1) Yokohama National
Numerical Simulation of Sliding Contact during Sheet Metal Stamping
 Numerical Simulation of Sliding Contact during Sheet Metal Stamping Biglari F. R. * Nikbin K. ** O Dowd N. P. ** Busso E.P. ** * Mechanical Engineering Department, Amirkabir University of Technology, Hafez
EFFECT OF FRICTION MODIFY AND EP ADDITIVE ON FRICTION CAUSED BY SOLID PARTICLES IN OIL
 EFFECT OF FRICTION MODIFY AND EP ADDITIVE ON FRICTION CAUSED BY SOLID PARTICLES IN OIL M. TOMIMOTO Nihon PALL ltd., 46 Kasuminosato, Inashiki, Ibaraki, JAPAN; e-mail: makoto_tomimoto@pall.com K. MIZUHARA
INVITATION TO SUBMIT A RESEARCH PROPOSAL ON AN ASHRAE RESEARCH PROJECT March 15, 2009
 INVITATION TO SUBMIT A RESEARCH PROPOSAL ON AN ASHRAE RESEARCH PROJECT March 15, 2009 Attached is a Request for Proposal (RFP) for a project dealing with a subject in which you, or your institution have
ARC RECIPROCATING WEAR AT HIGH TEMPERATURE
 ARC RECIPROCATING WEAR AT HIGH TEMPERATURE Prepared by Duanjie Li, PhD 6 Morgan, Ste156, Irvine CA 92618 P: 949.461.9292 F: 949.461.9232 nanovea.com Today's standard for tomorrow's materials. 2016 NANOVEA
Tribological Characterization of Ti-WS2 Coating
 Tribological Characterization of Ti-WS2 Coating Prepared by Johans Restrepo 6 Morgan, Ste156, Irvine CA 92618 P: 949.461.9292 F: 949.461.9232 nanovea.com Today's standard for tomorrow's materials. 2010
DURABILITY AND TRIBOLOGICAL PROPERTIES OF THERMALLY SPRAYED WC CERMET COATING IN FULL FILM AND PARTIAL EHL CONTACTS
 Durability and Tribological Properties of Thermally Sprayed WC Cermet Coating 38 DURABILITY AND TRIBOLOGICAL PROPERTIES OF THERMALLY SPRAYED WC CERMET COATING IN FULL FILM AND PARTIAL EHL CONTACTS D. M.
Void Fraction of CO2 and Ammonia in Multiport Aluminum Microchannel Tubes
 Purdue University Purdue e-pubs International Refrigeration and Air Conditioning Conference School of Mechanical Engineering 26 Void Fraction of CO2 and Ammonia in Multiport Aluminum Microchannel Tubes
MODULE 3 - BEARINGS LECTURE 1- SLIDING CONTACT BEARINGS INTRODUCTION
 MODULE 3 - BEARINGS CONTENTS LECTURE 1- SLIDING CONTACT BEARINGS INTRODUCTION 1. Sliding contact bearings - introduction. 2. Sliding contact bearings - advantages and disadvantages. 3. Classification of
A number of different pump types have become established on the market:
 White paper Comparison of different metering pumps on the basis of abrasiveness and wear 1. Abstract What characteristics are required of a metering pump that is to process highly viscous and abrasive
3.5.7 Flow Through Simple Dies
 152 3 Fundamentals of Polymers isothermal spinning of a Newtonian fluid and predicted the critical draw ratio of 20.210. Below the critical draw ratio, any disturbance along the filament is dampened out
Tribology of Journal Bearings Subjected to Boundary and Mixed Lubrication
 Mechanics of Contact and Lubrication ME5656 Department of Mechanical & Industrial Engineering Northeastern University Fall 2011 Tribology of Journal Bearings Subjected to Boundary and Mixed Lubrication
Connexion Developments Ltd + Solenoid Valves (UK) Ltd Unit 3, Rainbow Court, Armstrong Way, Great Western Business Park, Yate, Bristol, BS37 5NG,
 Ltd Unit 3, Rainbow Court, Armstrong Way, Great Western Business Park, Yate, Bristol, BS37 5NG,") 1 2 3 4 5 6 7 8 9 10 11 12 13 14 15 16 17 18 19 20 21 22 23 24 THERMOPLASTICS & ELASTOMERS ABS Acrylonitrile Butadiene Styrene Class 32222 conforming to ASTM D3965 is a time-proven material. The smooth
1 2 3 4 5 6 7 8 9 10 11 12 13 14 15 16 17 18 19 20 21 22 23 24 THERMOPLASTICS & ELASTOMERS ABS Acrylonitrile Butadiene Styrene Class 32222 conforming to ASTM D3965 is a time-proven material. The smooth
PROBLEM 2: PREDICTING GLASS RIBBON SHAPE IN
 PROBLEM 2: PREDICTING GLASS RIBBON SHAPE IN THE TIN BATH Industry: Glass Industry Representative: Eddie Ferreira Moderator: TBD Student Moderator: TBD PROBLEM STATEMENT During the forming process, the
ACCELERATED SCREENING METHODS FOR PREDICTING LUBRICANT PERFORMANCE IN REFRIGERANT COMPRESSORS
 DOE/CE/23810-45 ACCELERATED SCREENING METHODS FOR PREDICTING LUBRICANT PERFORMANCE IN REFRIGERANT COMPRESSORS FINAL REPORT C. Cusano, H. Yoon, C. Poppe Department of Mechanical and Industrial Engineering
Quantitative Viscosity Mapping Using Fluorescence Lifetime Measurements
 Tribol Lett (2017) 65:25 DOI 10.1007/s11249-016-0807-3 ORIGINAL PAPER Quantitative Viscosity Mapping Using Fluorescence Lifetime Measurements J. Dench 1 N. Morgan 1,2 J. S. S. Wong 1 Received: 20 October
Deployment of a New Series of Eco Turbo ETI Chillers
 56 Deployment of a New Series of Eco Turbo ETI Chillers KENJI UEDA *1 YASUSHI HASEGAWA *2 KAZUKI WAJIMA *3 MASAHARU NITTA *2 YASUHIRO KAMADA *1 AKIMASA YOKOYAMA *2 The use of inverters in heat source equipment
APPLICATION OF CERAMICS TO HIGH PRESSURE FUEL SYSTEMS. Thomas M. Yonushonis Cummins, Inc.
 APPLICATION OF CERAMICS TO HIGH PRESSURE FUEL SYSTEMS William F. Mandler, Jr. ENCERATEC, Inc. Thomas M. Yonushonis Cummins, Inc. Introduction Diesel fuel systems are facing increased demands as engines
Tribology in Hydrostatic Extrusion of Metals A review
 Tribology in Hydrostatic Extrusion of Metals A review P. Tomar*, R. K. Pandey, Y. Nath Mechanical and Automation Engineering Department G.G.S. Indraprastha University, Delhi-110403, India *Corresponding
Wear Analysis of Polytetrafluoroethylene and it s Composites under Dry Conditions using Design-Expert
 International Journal of Scientific and Research Publications, Volume 3, Issue 1, January 2013 1 Wear Analysis of Polytetrafluoroethylene and it s Composites under Dry Conditions using Design-Expert Deepak
Analytical Analysis for Enhancement of Performance and Efficiency for Different Blade of HAWT by Computer Program
 Analytical Analysis for Enhancement of Performance and Efficiency for Different Blade of HAWT by Computer Program 1 Hemant Rav Patel, 2 Dr. V.N. Bartaria, 3 Dr. A.S. Rathore 1 Department of Mechanical
Automotive & Mechanical Applications Broad Base. Best Solutions.
 Carbon and Graphite Materials for Mechanical Seals Automotive & Mechanical Applications Broad Base. Best Solutions. Tribological Behavior Friction Friction depends on surface finish of the mating surfaces
Evaluation of Mechanical Properties of Hard Coatings
 Evaluation of Mechanical Properties of Hard Coatings Comprehensive mechanical testing of two coated metal samples was performed on the UNMT- 1. The tests clearly distinguished brittle and ductile samples,
AUTOSTAT PRODUCT DATA SHEET
 AUTOSTAT PRODUCT DATA SHEET Heat stabilised polyester film has low residual shrinkage at elevated temperatures. This is essential when tight registration tolerances need to be maintained during multiple
Chapter 2: Mechanical Behavior of Materials
 Chapter : Mechanical Behavior of Materials Definition Mechanical behavior of a material relationship - its response (deformation) to an applied load or force Examples: strength, hardness, ductility, stiffness
Lecture Retaining Wall Week 12
 Lecture Retaining Wall Week 12 Retaining walls which provide lateral support to earth fill embankment or any other form of material which they retain them in vertical position. These walls are also usually
A systemic approach for enhancing applications reliability through advanced analysis and technical solutions for various bearing damage modes
 A systemic approach for enhancing applications reliability through advanced analysis and technical solutions for various bearing damage modes Relatore Badard Guillaume, Chief Engineer Europe Azienda: Timken
Dow Corning 705 Diffusion Pump
 Product Information Performance Chemicals FEATURES & BENEFITS Thermal stability Resists oxidation Chemically inert COMPOSITION Silicone (Dow Corning 702 Fluid) Single-component silicone material (Dow Corning
About us. Capabilities
 Catalog 215 Content About us... 2 Capabilities... 2 Anti-reflection coatings... 4 High reflection coatings... 5 Beamsplitter coatings... 6 Filter coatings... 7 Multiband precision filters... 8 DLC coatings...
Industrial Assembly and Maintenance High-Performance Lubricants Selection Guide
 Industrial Assembly and Maintenance High-Performance Lubricants Selection Guide Molykote brand Smart Lubrication Solutions for Machine Components Meet your lubrication challenges. Select proven, effective
SLIDING WEAR BEHAVIOR OF Zn-Al ALLOYS IN CONDITIONS OF BOUNDARY LUBRICATION
 THE ANNALS OF UNIVERSITY DUNĂREA DE JOS OF GALAŢI FASCICLE VIII,, ISSN 11-9 SLIDING WEAR BEHAVIOR OF Zn-Al ALLOYS IN CONDITIONS OF BOUNDARY LUBRICATION Miroslav BABIC 1, Rato NINKOVIC, Aleksandar RAC 3
Polypropylene A grease technology for energy efficient lubrication
 Polypropylene A grease technology for energy efficient lubrication René Westbroek and Johan Leckner Axel Christiernsson International AB, Nol, Sweden Bearing grease lubrication Adapted from: P. Lugt, Grease
MEASUREMENT OF STATIC AND DYNAMIC FRICTION ENERGY ABSORPTION IN CARBON/VINYL ESTER COMPOSITE
 MEASUREMENT OF STATIC AND DYNAMIC FRICTION ENERGY ABSORPTION IN CARBON/VINYL ESTER COMPOSITE Thomas J. Brimhall, PhD, PE Altair Engineering Abstract Experiments have suggested that sliding friction plays
FE MODELLING OF WEAR MECHANISMS OF CF/PEEK COMPOSITES
 FE MODELLING OF WEAR MECHANISMS OF CF/PEEK COMPOSITES K. Váradi 1, T. Goda 1 and K. Friedrich 2 1 Institute of Machine Design, Budapest University of Technology and Economics, Műegyetem rkp. 3., H-1111
Chapter 2 Lubrication Principles
 Chapter 2 Lubrication Principles 2-1. Friction a. Definition of friction. (1) Friction is a force that resists relative motion between two surfaces in contact. Depending on the application, friction may
COMPARATIVE ASPECTS BETWEEN EHD LUBRICATION OF GEARS, BEARINGS AND RADIAL JOURNAL BEARINGS UNDER HUGE LOADING
 5 th INTERNATIONAL MEETING OF THE CARPATHIAN REGION SPECIALISTS IN THE FIELD OF GEARS COMPARATIVE ASPECTS BETWEEN EHD LUBRICATION OF GEARS, BEARINGS AND RADIAL JOURNAL BEARINGS UNDER HUGE LOADING Assist.
Lubrication in tube hydroforming (THF) Part II. Performance evaluation of lubricants using LDH test and pear-shaped tube expansion test
 Part II. Performance evaluation of lubricants using LDH test and pear-shaped tube expansion test") Journal of Materials Processing Technology 146 (2004) 116 123 Lubrication in tube hydroforming (THF) Part II. Performance evaluation of lubricants using LDH test and pear-shaped tube expansion test Gracious
Journal of Materials Processing Technology 146 (2004) 116 123 Lubrication in tube hydroforming (THF) Part II. Performance evaluation of lubricants using LDH test and pear-shaped tube expansion test Gracious
Ferrography A procedure for measuring wear rate
 Indian Journal of Engineering & Materials Sciences Vol. 15, October 2008, pp. 377-381 Ferrography A procedure for measuring wear rate N Govindarajan a * & R Gnanamoorthy b a Flat B, Raj Enclave, Balaji
Numerical method for modelling spray quenching of cylindrical forgings
 Modellazione Numerical method for modelling spray quenching of cylindrical forgings M. Soltani, A. Pola, G. M. La Vecchia, M. Modigell Nowadays, in steel industries, spray quenching has been used as a
Visualization Study of Flow Stability in Reverse Roll Coating
 ISIJ International, Vol. 55 (015), No. 4, pp. 863 869 Visualization Study of Flow Stability in Reverse Roll Coating Masato SASAKI, 1) * Masaru MIYAKE ) and Naoki NAKATA ) 1) JFE Steel Corporation, 1-1,
Operations & Maintenance
 Operations & Maintenance Best Practices A Guide to Achieving Operational Efficiency G. P. Sullivan R. Pugh A. P. Melendez W. D. Hunt December 2002 Prepared by Pacific Northwest National Laboratory for
Chapter 3 Basic Crystallography and Electron Diffraction from Crystals. Lecture 9. Chapter 3 CHEM Fall, L. Ma
 Chapter 3 Basic Crystallography and Electron Diffraction from Crystals Lecture 9 Outline The geometry of electron diffraction Crystallography Kinetic Theory of Electron diffraction Diffraction from crystals
Study of correlation between grease film formations and mechanical losses on various surfaces
 Study of correlation between grease film formations and mechanical losses on various surfaces Kazumi Sakai Supervisor: prof. Ing. Křupka Ivan, Ph.D. Institute of Machine and Industrial Design Faculty of
Multiphase Flow and Heat Transfer
 Multiphase Flow and Heat Transfer Wettability Sudheer Siddapuredddy sudheer@iitp.ac.in Department of Mechanical Engineering Indian Institution of Technology Patna Multiphase Flow and Heat Transfer Wettability
TABLE OF CONTENTS DECLARATION DEDICATION ACKNOWLEDGEMENTS ABSTRACT ABSTRAK
 vii TABLE OF CONTENTS CHAPTER TITLE PAGE DECLARATION DEDICATION ACKNOWLEDGEMENTS ABSTRACT ABSTRAK TABLE OF CONTENTS LIST OF TABLES LIST OF FIGURES LIST OF ABBREVIATIONS LIST OF SYMBOLS LIST OF APPENDICES
MTM2 Mini-Traction Machine
 MTM2 Mini-Traction Machine A bench top, computer controlled, precision traction measurement instrument which provides fully automated traction mapping of lubricants and other fluids MTM2 Overview The MTM2
High-Quality Tool Steel Hot-Work Steels
 High-Quality Tool Steel Hot-Work Steels Hot-forming tools are needed for chipless forming of workpieces from iron and non-ferrous materials and their alloys as well as the production of articles of daily
/ 1 URIGHT-PRTTERSON SF9 ON 16 RUG 65 FTD-ID(RS)T-U562-SS UNCLASIESIFIED F/G 13/9 NL. RD-i EL STIC BE RING(U) FOREIGN TECHNOLOGY DIV ME...
T-U562-SS UNCLASIESIFIED F/G 13/9 NL. RD-i EL STIC BE RING(U) FOREIGN TECHNOLOGY DIV ME...") RD-i5 14 1 EL STIC BE RING(U) FOREIGN TECHNOLOGY DIV / 1 URIGHT-PRTTERSON SF9 ON 16 RUG 65 FTD-ID(RS)T-U562-SS UNCLASIESIFIED F/G 13/9 NL ME...E NI 11111 2~ 11111-! -25 MICROCOPY RESOLUTION TEST CHART
RD-i5 14 1 EL STIC BE RING(U) FOREIGN TECHNOLOGY DIV / 1 URIGHT-PRTTERSON SF9 ON 16 RUG 65 FTD-ID(RS)T-U562-SS UNCLASIESIFIED F/G 13/9 NL ME...E NI 11111 2~ 11111-! -25 MICROCOPY RESOLUTION TEST CHART
Effect of Bearing Design Parameters on the Minimum Oil Film Thickness of Hydrodynamic Journal Bearing
 Volume: 04 Issue: 08 Aug -2017 www.irjet.net p-issn: 2395-0072 Effect of Bearing Design Parameters on the Minimum Oil Film Thickness of Hydrodynamic Journal Bearing Mohammed Ali 1, S.K. Somani 2 1Department
Establishment of Yield Strength Using Sub-Size Samples without Gas Line Shutdown, Phase 2
 OTD-13/0005 Establishment of Yield Strength Using Sub-Size Samples without Gas Line Shutdown, Phase 2 (Mini, Full-Wall Longitudinal Specimens) Prepared by: Gas Technology Institute Des Plaines, Illinois
Effects of Temperature on Desiccant Catalysis of Refrigerant and Lubricant Decompositions
 DOE/CE/2381-95 Effects of Temperature on Catalysis of Refrigerant and Lubricant Decompositions Final Report June 1998 N.D.T (Rosine) Rohatgi Spauschus Associates, Incorporated 3 Corporate Center Court
BLOCK COPOLYMER PHOTONIC GEL FOR DETECTING INTERFACIAL SEPARATION
 BLOCK COPOLYMER PHOTONIC GEL FOR DETECTING INTERFACIAL SEPARATION Edwin P. Chan, Materials Research Engineer, National Institute of Standards and Technology, Gaithersburg, MD Introduction Mechanochromism,
Accelerated Evaluation of Capillary Clogging in HFC Air Conditioners
 Purdue University Purdue e-pubs International Refrigeration and Air Conditioning Conference School of Mechanical Engineering 1998 Accelerated Evaluation of Capillary Clogging in HFC Air Conditioners S.
GA A23971 WAVEGUIDE DIAMOND VACUUM WINDOWS WITH HELICOFLEX SEALS
 GA A23971 WAVEGUIDE DIAMOND VACUUM WINDOWS WITH HELICOFLEX SEALS by MAY 2002 DISCLAIMER This report was prepared as an account of work sponsored by an agency of the United States Government. Neither the
Extreme pressure property of Carbon Nano Tubes (CNT) based nanolubricant
 based nanolubricant") Vol. 4(8), pp. 123-127, December 2013 DOI: 10.5897/JCEMS2013.0163 ISSN 2141-6605 2013 Academic Journals http://www.academicjournals.org/jcems Journal of Chemical Engineering and Materials Science Full
Vol. 4(8), pp. 123-127, December 2013 DOI: 10.5897/JCEMS2013.0163 ISSN 2141-6605 2013 Academic Journals http://www.academicjournals.org/jcems Journal of Chemical Engineering and Materials Science Full
Simultaneous Reflection and Transmission Measurements of Scandium Oxide Thin Films in the Extreme Ultraviolet
 Simultaneous Reflection and Transmission Measurements of Scandium Oxide Thin Films in the Extreme Ultraviolet Introduction Guillermo Acosta, Dr. David Allred, Dr, Steven Turley Brigham Young University
GREASE PROPERTIES. Calcium. complex. complex. Lithium < Smooth & Gel. Smooth. Excellent
 GREASE Lubricating greases are typically applied in areas where a continuous supply of oil cannot be retained, such as open bearings or gears. Factors to be considered when selecting a suitable grease
INCOMPRESSIBLE FLOW TURBOMACHINES Design, Selection, Applications,
 INCOMPRESSIBLE FLOW TURBOMACHINES Design, Selection, Applications, George F. Round Professor Emeritus McMaster University Hamilton, Ontario Canada ELSEVIER BUTTERWORTH HEINEMANN Amsterdam Boston Heidelberg
TABLE OF CONTENTS SECTION 1 INTRODUCTION... 1
 TABLE OF CONTENTS SECTION 1 INTRODUCTION... 1 1.1 Scope of Report... 1 1.2 Intent of Seismic Isolation Provisions... 2 1.3 Analysis Procedures for Seismically Isolated Structures... 3 SECTION 2 FORCE-DISPLACEMENT
EXPERIMENTAL AND NUMERICAL INVESTIGATIONS OF CONCRETE BEHAVIOUR AT MESO-LEVEL DURING QUASI-STATIC SPLITTING TENSION
 Size effect in concrete under tensile splitting - experiments and DEM analyses for different failure modes V International Conference on Particle-based Methods Fundamentals and Applications PARTICLES 2017
THE ANALYSIS OF STRESS DISTRIBUTION BASED ON MEASUREMENTS USING TWO METHODS OF X-RAY APPLICATION
 182 THE ANALYSIS OF STRESS DISTRIBUTION BASED ON MEASUREMENTS USING TWO METHODS OF X-RAY APPLICATION ABSTRACT Barbara Kucharska Institute of Materials Engineering, Czestochowa University of Technology,
Universities of Leeds, Sheffield and York
 promoting access to White Rose research papers Universities of Leeds, Sheffield and York http://eprints.whiterose.ac.uk/ This is an author produced version of a paper published in Proceedings of the Institution
HONEYCOMB MECHANICAL BEHAVIOR USING MACROINDENTATION
 HONEYCOMB MECHANICAL BEHAVIOR USING MACROINDENTATION. Prepared by Duanjie Li, PhD 6 Morgan, Ste156, Irvine CA 92618 P: 949.461.9292 F: 949.461.9232 nanovea.com Today's standard for tomorrow's materials.
Energy and Environmental Research Emphasizing Low-Rank Coal -- Task 1.7 Hot-Water Extraction of Nonpolar Organic Pollutants from Soils
 DOERdCB97-578 (DE966 1) Energy and Environmental Research Emphasizing Low-Rank Coal -- Task 1.7 Hot-Water Extraction of Nonpolar Organic Pollutants from Soils Topical Report Steven B. Hawthorne January
MADE BY POWDER METALLURGY
 SELF-LUBRICATING SINTERED SLIDING BEARINGS MADE BY POWDER METALLURGY TM Modern bearing technology in sintered metal: We have the right solution for you SINTERED SLIDING BEARINGS FROM GKN SINTER METALS