ESA Climate Change Initiative (CCI) Version 1.0, revision February Author: Will Hewson
|
|
|
- Rodger Patrick
- 6 years ago
- Views:
Transcription
1 Page 1 ESA Climate Change Initiative (CCI) Product User Guide: University of Leicester full physics XCH 4 retrieval algorithm for CRDP3 OCFP v1.0 : Version 1.0, revision 0. Author: Will Hewson Earth Observation Science Department of Physics and Astronomy University of Leicester Leicester United Kingdom
2 Page 2 Document history: Version Revision Date Description/Comments Feb 2016 New document for voluntary full physics XCH 4 retrieval contribution. The research described in this document was carried out at the University of Leicester, United Kingdom. Copyright All rights reserved.
3 Page 3 Table of contents Table of contents... 3 List of tables... 4 List of figures Summary Introduction GOSAT FTS The University of Leicester Full Physics XCH 4 Product Validation Product Description Product Format and Content Quality Flags and Metadata Data Usage File contents References... 12
4 Page 4 List of tables Table 1. Product quality filter Table 2. Common variables for the CH4_GOS_OCFP data product Table 3. Additional variables for CH4_GOS_OCFP List of figures Figure 1. Global seasonal maps of OCFPv1.0 XCH 4 retrieved between April 2009 and December Figure 2. Comparison of retrieved XCH 4 (red) with TCCON XCH 4 (green) between April 2009 and December Only TCCON/GOSAT data pairs are plotted where co-location criteria are met. Statistics for the mean difference and standard deviation are shown in ppm along with the correlation coefficient and the total number of GOSAT soundings Figure 3. Comparison of retrieved UoL XCH 4 with the TCCON XCH 4 between April 2009 and December 2014 across all land TCCON sites, coloured by site. Statistics for mean bias and standard deviation are shown in ppm along with the correlation coefficient.... 9
5 Page 5 1. Summary This document is the Product User Guide version 1 (PUG1); a deliverable of the ESA project GHG-CCI. The GHG-CCI project started on 1st September 2010 as one of several ESA Climate Change Initiative (CCI) projects. The GHG-CCI project will deliver the Essential Climate Variable (ECV) Greenhouse Gases (GHG). State-of-the-art retrieval algorithms for remote sensing of the GHG ECV will be developed further in the frame of this project. Multi-year carbon dioxide (CO 2 ) and methane (CH 4 ) data sets will be generated and validated. Currently GHG-CCI is in Phase 2 ( ). This document describes the University of Leicester Full-Physics XCH 4 (CH4_GOS_OCFP) data product for users. The description includes quality flags and metadata, data format, product grid and geographical projection, known limitations. Two existing satellite sensors are used to produce core GHG-ECV products (XCO 2 and XCH 4 ): SCIAM- ACHY on ENVISAT and TANSO on GOSAT. Both instruments measure Near Infra-Red (NIR) and Short Wave Infra-Red (SWIR) spectra of reflected solar radiation and are sensitive to CO 2 and CH 4 concentration changes close to Earth s surface, offering information on regional surface fluxes. The accuracy requirements for such an application are demanding, especially for CO 2 but also for CH 4.
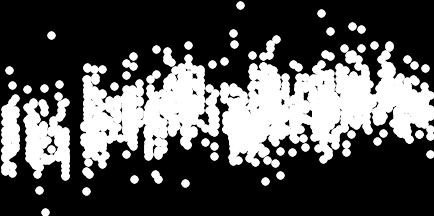
6 Page 6 2. Introduction 2.1 GOSAT FTS The Japanese Greenhouse gases Observing SATellite (GOSAT) was launched on 23rd January 2009 by the Japanese Space Agency (Yokota et al., 2009). GOSAT provides the first dedicated global measurements of total column CO 2 and CH 4 from its SWIR bands (Yoshida et al., 2011). It is equipped with two instruments; the Thermal And Near infra red Sensor for carbon Observations Fourier Transform Spectrometer (TANSO FTS), and a dedicated Cloud and Aerosol Imager (TANSO CAI). TANSO FTS measures in four spectral bands with a high spectral resolution of 0.3 cm -1, three of which operate in the SWIR at around 0.76, 1.6 and 2.0 μm providing sensitivity to the near-surface absorbers with the fourth channel operating in the thermal infrared between 5.5 and 14.3 μm providing midtropospheric sensitivity (Saitoh et al., 2009). The measurement strategy of TANSO FTS is optimised for characterisation of continental scale GHG sources and sinks, with the aim of achieving a 0.3 1% relative accuracy for 3 month averages of CO 2 at a km spatial resolution (Kuze et al., 2009). The aim for CH 4 is to achieve an accuracy of better than 2% on the same spatial and temporal scales. In order to achieve this, TANSO FTS utilises a pointing mirror to perform off-nadir measurements at the same location on each 3-day repeat cycle. The pointing mirror allows TANSO FTS to observe up to ±35 across track and ±20 along-track. These measurements nominally consist of 5 across track points spaced ~100km apart (although measurements are possible with 1, 3, 5, 7 or 9 across track points) with a ground footprint diameter of approximately 10.5 km and a 4 second exposure duration. Whilst the majority of data is limited to measurements over land where surface reflectance is high, TANSO FTS also observes in sun-glint mode over the ocean within ±20 of the sub-solar latitude. 2.2 The University of Leicester Full Physics XCH 4 Product Full physics XCH 4 retrievals build on the OCFPv6.0 FP XCO 2 retrieval (see OCFPv6.0 PUG), using the same forward and inverse model system as for XCO 2, with a-priori adjusted to per sounding retrieval outputs from OCFPv6.0. These outputs are retrieved surface pressure, temperature and H 2 O profiles (multiplied by their retrieved scaling factors), VMR profiles of CO 2, O 2 and CH 4, and optical depth profiles of type 1, 2, and cirrus aerosols. In the subsequent XCH 4 retrieval, only the CH 4 profile, dispersion and albedo are retrieved at 1.64 μm, allowing for a rapid convergence compared to XCO 2 making use of all three GOSAT SWIR bands. As the FP XCH 4 retrieval relies on FP XCO 2 outputs, only those soundings for which the XCO 2 retrieval was able to successfully converge are processed. Figure 1 shows global seasonal maps of the XCH 4 product retrieved for land and glint modes between April 2009 and December Note that in August 2010 GOSAT moved from a 5-point grid mode to a 3- point grid mode, explaining the change in spatial coverage.
, a global network of ground-based high resolution Fourier transform")
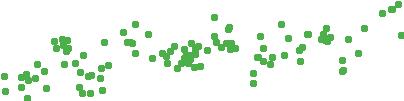
7 Page 7 ESA Climate Change Initiative (CCI) Figure 1. Global seasonal maps of OCFPv1.0 XCH4 retrieved between April 2009 and December Validation Validation of our retrieved XCH4 has been performed against the Total Carbon Column Observing Network (TCCON), a global network of ground-based high resolution Fourier transform spectrometers recording direct solar spectra in the near infrared spectral region, itself validated against aircraft measurements. Figure 2 shows retrieved GOSAT XCH4 compared to 14 TCCON sites for the period April 2009 to December 2014, using the latest available TCCON data (GGG2015), and co-located spatially and temporally by selecting GOSAT soundings within 550 km of the TCCON site, and ± 2 hours of each TCCON measurement. Whilst this rudimentary selection algorithm is sufficient for most sites, it can lead to issues where sites are situated close to different chemical regimes. A more robust coincidence criterion is therefore currently being explored. Overall a good agreement between TCCON and UoL GOSAT XCH4 is found, with the magnitude and phase of the seasonal cycle being well captured over a variety of sites. Figure 3 shows the total correlation across all sites, with a correlation coefficient of 0.85 and a standard deviation of 1.86 ppb.


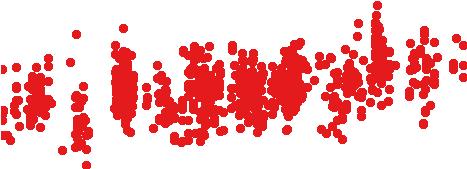


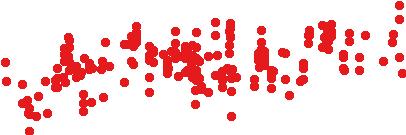


8 Page Sodankyla, Finland 1850 Bialystok, Poland Bremen, Germany Karlsruhe, Germany Orleans, France XCH 4 mean =-3.30ppb 1700 =14.54ppb r =0.56 n obs. = XCH 4 mean =2.06ppb =13.39ppb r =0.56 n obs. = 523 XCH 4 mean =1.40ppb =13.39ppb r =0.55 n obs. = 256 XCH 4 mean =-1.80ppb =15.78ppb r =0.36 n obs. = 742 XCH 4 mean =2.52ppb =14.26ppb r =0.47 n obs. = Garmisch, Germany 1850 Park Falls, Wisconsin, USA Lamont, Oklahoma, USA Tsukuba, Ibaraki, Japan Saga, Japan XCH 4 (ppb) XCH 4 mean =-5.76ppb 1700 =15.40ppb r =0.44 n obs. = Darwin, Australia XCH 4 mean =1.26ppb 1700 =10.66ppb r =0.59 n obs. = XCH 4 mean =-5.42ppb =13.17ppb r =0.61 n obs. = 868 Wollongong, Australia XCH 4 mean =4.45ppb =15.16ppb r =0.53 n obs. = XCH 4 mean =5.44ppb =15.68ppb r =0.62 n obs. = 3792 Lauder, New Zealand, 125 XCH 4 mean =-2.25ppb =11.14ppb r =0.67 n obs. = Year XCH 4 mean =0.28ppb =15.05ppb r =0.65 n obs. = 548 Lauder, New Zealand, 120 XCH 4 mean =-0.50ppb =12.52ppb r =0.64 n obs. = XCH 4 mean =4.89ppb =15.23ppb r =0.66 n obs. = OCFP XCH 4 v1.0 (ppb) TCCON XCH 4 (ppb) Figure 2. Comparison of retrieved XCH 4 (red) with TCCON XCH 4 (green) between April 2009 and December Only TCCON/GOSAT data pairs are plotted where co-location criteria are met. Statistics for the mean difference and standard deviation are shown in ppm along with the correlation coefficient and the total number of GOSAT soundings.
 1875 1850")


9 Page 9 ESA Climate Change Initiative (CCI) OCFP XCH4 (ppb) Sodankyla, Finland Bialystok, Poland Bremen, Germany Karlsruhe, Germany 1750 Orleans, France Garmisch, Germany Park Falls, Wisconsin, USA Lamont, Oklahoma, USA Tsukuba, Ibaraki, Japan Saga, Japan 1725 Darwin, Australia Wollongong, Australia Lauder, New Zealand, 125 Lauder, New Zealand, 120 Mean = 1.86 ppb, = ppb, r = 0.85, n obs. = TCCON XCH4 (ppb) Figure 3. Comparison of retrieved UoL XCH4 with the TCCON XCH4 between April 2009 and December 2014 across all land TCCON sites, coloured by site. Statistics for mean bias and standard deviation are shown in ppm along with the correlation coefficient.
10 Page Product Description 3.1 Product Format and Content XCH 4 data are stored in the netcdf format, with each file containing a single day s GOSAT soundings. Table 2 provides a description of the variables common to all ESA GHG-CCI data products, and all necessary parameters to make use of the data (e.g. a priori data, column averaging kernels, quality information, etc.). Table 3 contains additional product-specific variables, such as instrument flags and important ancillary retrieval profile information. 3.2 Quality Flags and Metadata The data product contains an "xch4_quality_flag" variable, indicating whether the data has passed our quality checks. In normal use, only data with an xch4_quality_flag equal to 0 should be used. Only GO- SAT soundings where a pre-filter of soundings with a signal to noise ratio >= 20, solar zenith angle <= 75, latitude >= -60 S, and passing the cloud screen (i.e. surface pressure difference between O 2 -A band retrieval and ECMWF surface pressure is within 30 hpa) have been successful are processed to retrieve XCO 2. Post-filtering checks for a successful retrieval outcome (a solution is converged upon in the full physics routine), and the full CH4_GOS_OCFP v1 filter, detailed in Table 1. Glint soundings are subjected to modified filters listed in parentheses. Parameter Filter Signal to noise ratio (all bands) >= 45 Band 3 albedo: band 2 albedo >= Cross track angle error (degrees) >= and <= Along track angle error (degrees) >= and <= 0.05 n retrieval iterations <= 7 n diverging retrieval steps <= 2 Retrieved type 1 (small) aerosol optical depth (AOD) <= 0.3 Retrieved type 2 (large) AOD <= 0.15 (<= 0.08) Retrieved ice type AOD <= XCO 2 retrieval error (ppm) <= 2.15 (<=1.15) σ retrieved surface pressure (hpa) <= 2000 Retrieved CO 2 profile gradient between the surface and retrieval level 15 <= type 1 AOD (relative difference between retrieved and a-priori surface pressure) >= -1.5 type 2 AOD (relative difference between retrieved and a-priori surface pressure) >= -1.2 Weak CO 2 column: strong CO 2 column >= 0.99 and <= Table 1. Product quality filter. 3.3 Data Usage The xch4_quality_flag variable must be applied to data before use; a value of 0 indicates that the data passes our quality control. All vertically resolved data is provided on levels (as opposed to layers). This is especially important when applying UoL averaging kernels to model data.
11 ESA Climate Change Initiative (CCI) Page File contents netcdf data files contain all of the common parameters for the ESA GHG-CCI data products (as outlined in the GHG-CCI Product Specification Document v3) as well as additional product specific parameters. A dimension of n refers to the number of retrievals per file, whilst a dimension of m refers to the number of levels retrieved for each sounding (typically 20). Name solar_zenith_angle Type Dimension Units degree Description Angle between line of sight to the sun and local vertical sensor_zenith_angle degree Angle between the line of sight to the sensor and the local vertical time dou- n seconds since Measurement time ble :00:00 longitude degrees east Centre longitude latitude degrees north Centre latitude pressure_levels, m hpa Vertical altitude coordinate in pressure units as used for averaging kernels pressure_weight, m Pressure weights as used for averaging kernels xch4 1e-9 Retrieved column-averaged dry-air mole fraction of atmospheric methane (XCH4) in ppb. No bias correction applied xch4_uncertainty 1e-9 Statistical uncertainty of XCH4 in ppb (1σ) xch4_averaging_kernel, m XCH4 averaging kernel (a profile = vector for each single observation). Quantifies the altitude sensitivity of the XCO2 retrieval. ch4_profile_apriori, m 1e-9 A-priori mole fraction profile of atmospheric CH4 in ppm. co2_profile_apriori, m 1e-6 A-priori mole fraction profile of atmospheric CO2 in ppm. xch4_quality_flag byte n Quality flag for XCH4 retrieval, 0=good, 1=bad Table 2. Common variables for the CH4_GOS_OCFP data product. Name exposure_id Type Dimension char n, 22 Units surface_altitude float n metres surface_altitude_stdev float n metres surface_air_pressure_apriori float surface_air_pressure_apriori_std float n n hpa hpa gain byte n air_temperature_apriori float n, m K h2o_profile_apriori float n, m 1e-6 total_aod aod_type1 aod_type2 cirrus retr_flag byte n Table 3. Additional variables for CH4_GOS_OCFP. Description Exposure identification number of the sounding Altitude is the (geometric) height above the geoid, which is the reference geopotential surface. Standard deviation of the surface elevation within the area of the GOSAT sounding, as derived from the SRTM database. A-priori surface pressure value A-priori surface pressure standard deviation GOSAT TANSO FTS instrument gain mode. 1 indicates high gain. 0 indicates medium gain. Air temperature is the bulk temperature of the air, not the surface (skin) temperature. A-priori mole fraction profile of atmospheric H2O in ppm. Retrieved total aerosol optical depth Retrieved AOD type 1 Retrieved AOD type 2 Retrieved AOD cirrus Retrieval type flag (0 = land, 1 = glint).
12 Page References Boesch, H., Baker, D., Connor, B., Crisp, D. and Miller, C.: Global Characterization of CO 2 Column Retrievals from Shortwave-Infrared Satellite Observations of the Orbiting Carbon Observatory-2 Mission, Remote Sens., 3(12), , doi: /rs , Kuze, A., Suto, H., Nakajima, M. and Hamazaki, T.: Thermal and near infrared sensor for carbon observation Fourier-transform spectrometer on the Greenhouse Gases Observing Satellite for greenhouse gases monitoring, Appl. Opt., 48(35), 6716, doi: /ao , Natraj, V., Boesch, H., Spurr, R. J. D. and Yung, Y. L.: Retrieval of X CO2 from simulated Orbiting Carbon Observatory measurements using the fast linearized R-2OS radiative transfer model, J. Geophys. Res., 113(D11), doi: /2007jd009017, O Dell, C. W.: Acceleration of multiple-scattering, hyperspectral radiative transfer calculations via lowstreams interpolation, J. Geophys. Res., 115(D10), doi: /2009jd012803, Saitoh, N., Imasu, R., Ota, Y. and Niwa, Y.: CO 2 retrieval algorithm for the thermal infrared spectra of the Greenhouse Gases Observing Satellite: Potential of retrieving CO 2 vertical profile from high-resolution FTS sensor, J. Geophys. Res., 114(D17), doi: /2008jd011500, Yokota, T., Yoshida, Y., Eguchi, N., Ota, Y., Tanaka, T., Watanabe, H. and Maksyutov, S.: Global Concentrations of CO2 and CH4 Retrieved from GOSAT: First Preliminary Results, SOLA, 5, , doi: /sola , Yoshida, Y., Ota, Y., Eguchi, N., Kikuchi, N., Nobuta, K., Tran, H., Morino, I. and Yokota, T.: Retrieval algorithm for CO 2 and CH 4 column abundances from short-wavelength infrared spectral observations by the Greenhouse gases observing satellite, Atmospheric Meas. Tech., 4(4), , doi: /amt , 2011.
Global Greenhouse Gas Observation by Satellite
 Global Greenhouse Gas Observation by Satellite Greenhouse gases Observing SATellite Figure 1. Overview of GOSAT ( JAXA) The Greenhouse Gases Observing Satellite (GOSAT) will be the world s first satellite
Earth Explorer 8 Candidate
 Earth Explorer 8 Candidate Hartmut Bösch University of Leicester CarbonSat Earth Explorer 8 Mission Advisory Group Heinrich Bovensmann, IUP, University of Bremen, Bremen, D (Chair) Hartmut Bösch, University
Greenhouse Gas Measurements from Space. Chris O Dell Colorado State University
 Greenhouse Gas Measurements from Space Chris O Dell Colorado State University 1 Climate Forcings & Feedbacks Forcings Greenhouse Gases Aerosols Volcanic Eruptions Solar Forcing Temperature Change Feedbacks
Greenhouse gases observation from space by GOSAT & Ocean and Antarctic observation researches
 COP19 Official Side Event Japan's Research and Observation for IPCC AR5 WGI Japan Pavilion, Warsaw, Poland, 1630-1800, 12 November 2013 Greenhouse gases observation from space by GOSAT & Ocean and Antarctic
GeoCarb. PI: Berrien OU (Leadership, science analysis)
") PI: Berrien Moore @ OU (Leadership, science analysis) Partner Institutions: Lockheed-Martin (instrument) CSU (Algorithms) NASA Ames (Validation) GeoCarb A NASA Earth-Ventures mission, awarded in Dec 2016,
PI: Berrien Moore @ OU (Leadership, science analysis) Partner Institutions: Lockheed-Martin (instrument) CSU (Algorithms) NASA Ames (Validation) GeoCarb A NASA Earth-Ventures mission, awarded in Dec 2016,
OCO-3 Science and Status for CEOS
 OCO-3 Science and Status for CEOS John Worden presenting for Annmarie Eldering and the OCO-3 Team, October 2016 Copyright 2016. U.S. Government sponsorship acknowledged. Comparison of OCO-2 and OCO-3 Measurements
IASI AND IASI NG, MERLIN, MICROCARB FOR CH 4 AND CO 2 OBS. IN THE TROPOSPHERE
 CEOS-ACC- Séoul, October 14th, 2016 IASI AND IASI NG, MERLIN, MICROCARB FOR CH 4 AND CO 2 OBS. IN THE TROPOSPHERE Prepared by C. DENIEL, CNES, France (carole.deniel@cnes.fr) With contributions from C.
Carbon Dioxide and Methane Emissions Derived from GOSAT Data
 LCLUC SARI International Regional Science Meeting in South/Southeast Asia Chiang Mai, Thailand, July 17-19, 2017 1 Carbon Dioxide and Methane Emissions Derived from GOSAT Data GOSAT-2 (FY2018 - ) Tsuneo
NDACC differences to TCCON German contribution to NIDFORVal & TCCON4S5P CO an CH 4 validation strategy
 German contribution to S5P validation via 12 TCCON and NDACC FTIR stations Ralf Sussmann, KIT/IMK-IFU, Garmisch Thomas Blumenstock, KIT/IMK-ASF, Karlsruhe Dietrich Feist, MPI-BGC, Jena Frank Hase, KIT/IMK-ASF,
User Requirements Document (URD)
") Page 1 ESA Climate Change Initiative (CCI) (URD) Written by: GHG-CCI project team Lead author for Version 1: M. Buchwitz, IUP, Univ. Bremen, Germany Lead author for Version 2: F. Chevallier, LSCE, France
Page 1 ESA Climate Change Initiative (CCI) (URD) Written by: GHG-CCI project team Lead author for Version 1: M. Buchwitz, IUP, Univ. Bremen, Germany Lead author for Version 2: F. Chevallier, LSCE, France
Zugspitze Solar FTIR: NDSC Primary-Status Instrument cm-1 resolution (OPD = 486 cm) Bruker IFS120HR FT-spectrometer
 Bruker IFS120HR FT-spectrometer") Zugspitze Solar FTIR: NDSC Primary-Status Instrument 0.00186 cm-1 resolution (OPD = 486 cm) Bruker IFS120HR FT-spectrometer SFIT1.09e/2.38 FASCATM 2.03 raytracing SCIAMACHY Validation by FTIR at Zugspitze:
Zugspitze Solar FTIR: NDSC Primary-Status Instrument 0.00186 cm-1 resolution (OPD = 486 cm) Bruker IFS120HR FT-spectrometer SFIT1.09e/2.38 FASCATM 2.03 raytracing SCIAMACHY Validation by FTIR at Zugspitze:
Land surface albedo and downwelling shortwave radiation from MSG: Retrieval, validation and impact assessment in NWP and LSM models
 Land surface albedo and downwelling shortwave radiation from MSG: Retrieval, validation and impact assessment in NWP and LSM models Jean-Louis ROUJEAN, Dominique CARRER, Xavier CEAMANOS, Olivier HAUTECOEUR,
MONITORING AIR POLLUTION AT GLOBAL SCALE USING IASI THERMAL INFRARED INSTRUMENT
 MONITORING AIR POLLUTION AT GLOBAL SCALE USING IASI THERMAL INFRARED INSTRUMENT S. Bauduin 1, L. Clarisse 1, C. Clerbaux 1,2, D. Hurtmans 1 and P-F. Coheur 1 1 Spectroscopie de l Atmosphère, Service de
A 3-D observational network for determining urban emissions of CO2 and CH4
 A 3-D observational network for determining urban emissions of CO2 and CH4 Jonathan E Franklin1, Taylor S Jones1, Jia Chen2, Harrison Parker3, Jacob Hedelius3, Paul Wennberg3, Manvendra K Dubey4, Ron C
Trace Gas Performance of Sentinel 4 UVN on Meteosat Third Generation
 Trace Gas Performance of Sentinel 4 UVN on Meteosat Third Generation Heinrich Bovensmann, S. Noël, K. Bramstedt, P. Liebing, A. Richter, V. Rozanov, M. Vountas, J. P. Burrows University of Bremen, Germany
Discussion of the NASA OCO-2 Satellite Measurements of CO 2 Concentrations
 Physics Journal Vol. 1, No. 3, 2015, pp. 189-193 http://www.aiscience.org/journal/pj Discussion of the NASA OCO-2 Satellite Measurements of CO 2 Concentrations A. Parker * School of Engineering and Physical
Climate: Earth s Dynamic Equilibrium
 Climate: Earth s Dynamic Equilibrium review session CCIU April 30, 2016 High-school standard HS-ESS2-4 focuses on the role energy flows play in Earth s climate HS-ESS2-4 Use a model to describe how variations
THE GREENHOUSE GAS PROJECT OF ESA S CLIMATE CHANGE INITIATIVE (GHG-CCI): PHASE 1 ACHIEVEMENTS
: PHASE 1 ACHIEVEMENTS") THE GREENHOUSE GAS PROJECT OF ESA S CLIMATE CHANGE INITIATIVE (GHG-CCI): PHASE 1 ACHIEVEMENTS M. Buchwitz 1, M. Reuter 1, O. Schneising 1, H. Boesch 2, I. Aben 3, R. Armante 5, P. Bergamaschi 10, T. Blumenstock
THE GREENHOUSE GAS PROJECT OF ESA S CLIMATE CHANGE INITIATIVE (GHG-CCI): PHASE 1 ACHIEVEMENTS M. Buchwitz 1, M. Reuter 1, O. Schneising 1, H. Boesch 2, I. Aben 3, R. Armante 5, P. Bergamaschi 10, T. Blumenstock
Introduction. Introduction. Introduction. Outline Last IPCC report : 2001 Last IPCC report :
 Introduction Greenhouse Gases & Climate Change Laurent Bopp LSCE, Paris When did the story start? ¾1827 Fourier hypothesizes greenhouse effect ¾1860 Tyndal identifies CO2 and water vapor as heat trapping
ECVS IN THE STRATOSPHERE
 METEOROLOGY ECVS IN THE STRATOSPHERE O 3, H 2 O, AEROSOL, N 2 O, CH 4, CFCS, HCFCS, HFCS, SF 6, PFCS, AND TEMPERATURE Michaela I. Hegglin, University of Reading UK GCOS COMPOSITION ECVs EXTEND INTO THE
INFLUX (The Indianapolis Flux Experiment)
") INFLUX (The Indianapolis Flux Experiment) A top-down/bottom-up greenhouse gas quantification experiment in the city of Indianapolis Paul Shepson, Purdue University Kenneth Davis, Natasha Miles and Scott
INFLUX (The Indianapolis Flux Experiment) A top-down/bottom-up greenhouse gas quantification experiment in the city of Indianapolis Paul Shepson, Purdue University Kenneth Davis, Natasha Miles and Scott
Air Transportation: Emissions and Effects
 Air Transportation: Emissions and Effects Joyce E. Penner University of Michigan Report Co-ordinator: IPCC Special Report on Aviation and the Global Atmosphere Presentation to the First Regional Symposium
Copernicus Climate Change Service (C3S)
") Copernicus Service (C3S) European Contribution to the Monitoring of Essential Variables from Space Jean-Noël Thépaut, ECMWF C o p e r n i c u s : E a r t h o b s e r v a t i o n s a n d i n f o r m a t
Copernicus Service (C3S) European Contribution to the Monitoring of Essential Variables from Space Jean-Noël Thépaut, ECMWF C o p e r n i c u s : E a r t h o b s e r v a t i o n s a n d i n f o r m a t
PERFORMANCE OF VAISALA OZONE INTERFACE BOARD OIF411
 PERFORMANCE OF VAISALA OZONE INTERFACE BOARD OIF411 White Paper B211385EN-A Performance of Vaisala Ozone Interface Board OIF411 This page intentionally left blank. 2 B211385EN-A Table of Contents CHAPTER
Composition and Energy AOSC 200 Tim Canty
 Composition and Energy AOSC 200 Tim Canty Class Web Site: http://www.atmos.umd.edu/~tcanty/aosc200 Topics for today: Atmospheric composition cont. Energy transfer Lecture 03 Sept 5 2017 1 Today s Weather
Towards an operational observing system to monitor fossil CO 2 emissions
 Towards an operational observing system to monitor fossil CO 2 emissions Y. Meijer (1), P. Ciais (2), M. Drinkwater (1), P. Ingmann (1), A. Loescher (1), B. Sierk (1), and P. Silvestrin (1) (1) ESA, Noordwijk,
Using Satellite Observations to Constrain Carbon Flux Estimates
 Using Satellite Observations to Constrain Carbon Flux Estimates Shaun Quegan (University of Sheffield) Centre for Terrestrial Carbon Dynamics & National Centre for Earth Observation Lecture content The
Estimation of Surface Carbon Fluxes with Data Assimilation
 Estimation of Surface Carbon Fluxes with Data Assimilation *Ji-Sun Kang, *Eugenia Kalnay, *Takemasa Miyoshi, *Kayo Ide, + Junjie Liu, and # Inez Fung *University of Maryland, College Park, + NASA, JPL,
Global Warming: What is the role of aerosol?
 Global Warming: What is the role of aerosol? Barbara Wyslouzil, Sept. 10 2007 Outline Aerosols 101 The greenhouse effect Global temperature records The global warming problem How do aerosols play a role
- geographic patterns of energy balance
 (1 of 10) Further Reading: Chapter 04 of the text book Outline - geographic patterns of energy balance - net radiation - meridional transport (2 of 10) Introduction Previously, we discussed the energy
15.023J / J / ESD.128J Global Climate Change: Economics, Science, and Policy Spring 2008
 MIT OpenCourseWare http://ocw.mit.edu 15.023J / 12.848J / ESD.128J Global Climate Change: Economics, Science, and Policy Spring 2008 For information about citing these materials or our Terms of Use, visit:
Lecture 2: Greenhouse Gases - Basic Background on Atmosphere - GHG Emission and Concentration Rise - California Regulation (AB32)
") Lecture 2: Greenhouse Gases - Basic Background on Atmosphere - GHG Emission and Concentration Rise - California Regulation (AB32) METR 113/ENVS 113 Spring Semester 2011 February 15, 2011 Suggested Reading
Lecture 2: Greenhouse Gases - Basic Background on Atmosphere - GHG Emission and Concentration Rise - California Regulation (AB32) METR 113/ENVS 113 Spring Semester 2011 February 15, 2011 Suggested Reading
Remote Sensing of CO from AIRS AIRS typically sees 82% of the globe each day
 Remote Sensing of CO from AIRS 14 AIRS typically sees 82% of the globe each day From McMillan, et. al., AIRS Science Team Meeting, Spring, 2004 Addressing Aerosol / CO Interactions Sub-Saharan biomass
Midtropospheric CO 2 Concentration derived from infrared and microwave sounders. Application to the TOVS, AIRS/AMSU, and IASI/AMSU instruments.
 ITSC XVI Angra dos Reis, 7-13 May 2008 Midtropospheric CO 2 Concentration derived from infrared and microwave sounders. Application to the TOVS, AIRS/AMSU, and IASI/AMSU instruments. Cyril Crevoisier,
Global Space-based Inter-Calibration System INTRODUCTION TO GSICS
 GSICS-RD001 Global Space-based Inter-Calibration System INTRODUCTION TO GSICS "Space-based" is in fact too restrictive because the GSICS calibration system is not only based in space but includes elements
Leif Backman HENVI Seminar February 19, 2009
 Methane Sources and Sinks Leif Backman HENVI Seminar February 19, 2009 Background Atmospheric methane Sources & Sinks Concentration variations & trends Objective & methods Objective & Goals Research plan
LAND AND WATER - EARTH OBSERVATION INFORMATICS FSP
 Earth Observation for Water Resources Management Arnold Dekker,Juan P Guerschman, Randall Donohue, Tom Van Niel, Luigi Renzullo,, Tim Malthus, Tim McVicar and Albert Van Dijk LAND AND WATER - EARTH OBSERVATION
Global Warming and the Hydrological Cycle
 Global Warming and the Hydrological Cycle Climate Change Projections Wet regions will become wetter Dry regions will become drier Precipitation will occur less frequently Precipitation will be more intense
Monitoring fugitive emissions from oil and gas methane and natural gas emissions
 Monitoring fugitive emissions from oil and gas methane and natural gas emissions PERF London May 2016 Rod Robinson National Physical Laboratory UK rod.robinson@npl.co.uk Welcome to the National Physical
Date: Author: Doc Title. 20/08/14 Jimmy Slaughter Copernicus Services. Copernicus Services
 Date: Author: Doc Title 20/08/14 Jimmy Slaughter Copernicus Services Copernicus Services Table of Contents Introduction... 3 What Will Copernicus Do?... 3 2.1 Land Monitoring... 3 2.2 Marine Monitoring...
Remote Estimation of Leaf and Canopy Water Content in Winter Wheat with Different Vertical Distribution of Water-Related Properties
 Remote Sens. 2015, 7, 4626-4650; doi:10.3390/rs70404626 Article OPEN ACCESS remote sensing ISSN 2072-4292 www.mdpi.com/journal/remotesensing Remote Estimation of Leaf and Canopy Water Content in Winter
Many players have contributed to this John Miller, Arlyn Andrews, Pieter Tans, Oksansa Tarasova, and a host of partners.
 Many players have contributed to this John Miller, Arlyn Andrews, Pieter Tans, Oksansa Tarasova, and a host of partners. Whatever measurements are made supporting urban systems must be compatible with
Advanced Thermal/Optical: Fire Applications. E. Chuvieco (Univ. of Alcala, Spain)
") Advanced Thermal/Optical: Fire Applications E. Chuvieco (Univ. of Alcala, Spain) RS is a basic tool to retrieve fire information Fuel moisture Soils Elevation / DTM Fuel Types Meteorology / climate Density
Advanced Thermal/Optical: Fire Applications E. Chuvieco (Univ. of Alcala, Spain) RS is a basic tool to retrieve fire information Fuel moisture Soils Elevation / DTM Fuel Types Meteorology / climate Density
Lecture 22: Atmospheric Chemistry and Climate
 Lecture 22: Atmospheric Chemistry and Climate Required Reading: FP Chapter 14 (only sections that I cover) Suggested Introductory Reading: Jacob Chapter 7 Atmospheric Chemistry CHEM-5151 / ATOC-5151 Spring
Observation System Requirements to Support Greenhouse Gas Management Strategies
 Observation System Requirements to Support Greenhouse Gas Management Strategies 7 September 2009 James Butler NOAA Earth System Research Laboratory Page 1 Outline Global Greenhouse Gas Monitoring Today
The Chemistry of Climate Change. Reading: Chapter 8 Environmental Chemistry, G. W. vanloon. S. J. Duffy
 The Chemistry of Climate Change Reading: Chapter 8 Environmental Chemistry, G. W. vanloon. S. J. Duffy The Science of Global Climate There's a lot of differing data, but as far as I can gather, over the
Monitoring water quality of the Southeastern Mediterranean sea using remote sensing
 Monitoring water quality of the Southeastern Mediterranean sea using remote sensing Tamir Caras The Remote Sensing Laboratory Jacob Blaustein Institutes for Desert Research Ben-Gurion University of the
The EUMETSAT Satellite Application Facility on Land Surface Analysis (LSA SAF) Continuous Development 2 Phase
 Continuous Development 2 Phase") The EUMETSAT Satellite Application Facility on Land Surface Analysis (LSA SAF) Continuous Development 2 Phase Jean-Louis Roujean and many co-authors METEO FRANCE / Toulouse jean-louis.roujean@meteo.fr
The EUMETSAT Satellite Application Facility on Land Surface Analysis (LSA SAF) Continuous Development 2 Phase Jean-Louis Roujean and many co-authors METEO FRANCE / Toulouse jean-louis.roujean@meteo.fr
The CO 2 budget: methods for estimating CO 2 fluxes from atmospheric observations. Jan Winderlich PhD student
 The CO 2 budget: methods for estimating CO 2 fluxes from atmospheric observations 1 Dr. Christoph Gerbig Research Scientist Jan Winderlich PhD student Dr. Rona Thompson Post-doctoral researcher 2 How do
SP-1279 (2) REPORTS FOR MISSION SELECTION THE SIX CANDIDATE EARTH EXPLORER MISSIONS. April 2004
 REPORTS FOR MISSION SELECTION THE SIX CANDIDATE EARTH EXPLORER MISSIONS. April 2004") SP-1279 (2) April 2004 EarthCARE - Earth Clouds, Aerosols and Radiation Explorer SPECTRA - Surface Processes and Ecosystem Changes Through Response Analysis WALES - Water Vapour Lidar Experiment in Space
SP-1279 (2) April 2004 EarthCARE - Earth Clouds, Aerosols and Radiation Explorer SPECTRA - Surface Processes and Ecosystem Changes Through Response Analysis WALES - Water Vapour Lidar Experiment in Space
User Awareness & Training: LAND. Tallinn, Estonia 9 th / 10 th April 2014 GAF AG
 User Awareness & Training: LAND Tallinn, Estonia 9 th / 10 th April 2014 GAF AG Day 2 - Contents LAND (1) General Introduction to EO and the COPERNICUS Sentinel Programme Overview of COPERNICUS/GMES LAND
The Earth s Global Energy Balance
 The Earth s Global Energy Balance Electromagnetic Radiation Insolation over the Globe World Latitude Zones Composition of the Atmosphere Sensible Heat and Latent Heat Transfer The Global Energy System
Suborbital Measurement Program Using the MEOS Spectrometer (MEOSuB)
") Suborbital Measurement Program Using the MEOS Spectrometer (MEOSuB) J.J. Sloan, R. V. Kruzelecky, K. Strong and J. Lin Workshop on Suborbital Platforms and Nanosatellites Canadian Space Agency, Saint-Hubert,
Suborbital Measurement Program Using the MEOS Spectrometer (MEOSuB) J.J. Sloan, R. V. Kruzelecky, K. Strong and J. Lin Workshop on Suborbital Platforms and Nanosatellites Canadian Space Agency, Saint-Hubert,
Earth energy budget and balance
 Earth energy budget and balance 31% total reflection (3% clouds. 8% surface) 69% absorption( 0% clouds, 49% surface) Reflection is frequency dependent but will be treated as average value for visible light
Understanding how carbon dioxide emissions from human activity contribute to global climate change MYLES ALLEN Environmental Change Institute, School
 Understanding how carbon dioxide emissions from human activity contribute to global climate change MYLES ALLEN Environmental Change Institute, School of Geography and the Environment & Department of Physics
HIGH RESOLUTION AIRBORNE SOIL MOISTURE MAPPING
 HIGH RESOLUTION AIRBORNE SOIL MOISTURE MAPPING Jeffrey Walker 1, Rocco Panciera 1 and Ed Kim 2 1. Department of Civil and Environmental Engineering, University of Melbourne 2. Hydrospheric and Biospheric
OMI on board of EOS-Aura OMI TES MLS HIRDLS
 OMI on board of EOS-Aura OMI TES MLS HIRDLS 21 Ozone Monitoring Instrument OMI UV and VIS backscatter instrument (270-500 nm) Wide swath telescope yields daily global maps (2600 km) Urban scale resolution
Soil moisture measurements
 Soil moisture measurements Climatological and hydrological field work - FS2017 1 Introduction Soil moisture is a key variable in the climate system. By controlling evapotranspiration, soil moisture impacts
WMO/GAW observation system and greenhouse gases
 WMO/GAW observation system and greenhouse gases Hans-Eckhart Scheel Karlsruhe Institute of Technology, IMK-IFU, Germany hans-eckhart.scheel@kit.edu Oksana Tarasova, Liisa Jalkanen and Leonard Barrie Atmospheric
Earth Science Lesson Plan Quarter 2, Week 1, Day 1
 Earth Science Lesson Plan Quarter 2, Week 1, Day 1 1 Outcomes for Today Standard Focus: Earth Sciences 4.c Students know the different atmospheric gases that absorb the Earth s thermal radiation and the
Continuous in-situ observation of methane at a paddy field in India
 Rajdhani College, University of Delhi Continuous in-situ observation of methane at a paddy field in India T. Hidemori 1, M. Izuhara 1, M. Kawasaki 1, T. Nakayama 1, Y. Matsumi 1, Y. Terao 2, T. Machida
Greenhouse Gas Measurement Technology
 Greenhouse Gas Measurement Technology Michael Corvese Thermo Fisher Scientific March 25, 2010 Agenda Introduction GHG Regulatory Current Methods Infrared Spectroscopy GC FID Emerging Methods Laser-Based
Quenching steels with gas jet arrays
 Quenching steels with gas jet arrays PAUL F STRATTON ANDREW P RICHARDSON BOC Rother Valley Way, Holbrook, Sheffield UNITED KINGDOM Paul.stratton@boc.com http://www.catweb.boc.com Abstract: - Single components
Future remote sensors for chlorophyll a. Dimitry Van der Zande, Quinten Vanhellemont & Kevin Ruddick
 Future remote sensors for chlorophyll a Dimitry Van der Zande, Quinten Vanhellemont & Kevin Ruddick Workshop Scheldt Commission: eutrophication 20 th October 2016 Ocean colour from space ESA MERIS 7 May
RICE PADDY MONITERRING USING RADARSAT DATA
 RICE PADDY MONITERRING USING RADARSAT DATA Naoki ISHITSUKA *, Genya SAITO *, Shigeo OGAWA **, Ayumi FUKUO* * National Institute for Agro-Environmental Sciences 3-1-3 Kannondai Tsukuba Ibaraki, 305-8604,
Is the greenhouse effect good or bad?
 NAME 1. The diagram below represents energy being absorbed and reradiated by the Earth. Is the greenhouse effect good or bad? 5. Equal areas of which surface would most likely absorb the most insolation?
Crop Growth Monitor System with Coupling of AVHRR and VGT Data 1
 Crop Growth Monitor System with Coupling of AVHRR and VGT Data 1 Wu Bingfng and Liu Chenglin Remote Sensing for Agriculture and Environment Institute of Remote Sensing Application P.O. Box 9718, Beijing
Climate Change: The Debate
 Climate Change: The Debate Key Concepts: Greenhouse Gas Carbon dioxide Fossil fuels Greenhouse effect Greenhouse gases Methane Nitrous oxides Radiative forcing WHAT YOU WILL LEARN 1. You will learn about
A student investigated the efficiency of a motor using the equipment in Figure 1. Figure 1
 A student investigated the efficiency of a motor using the equipment in Figure. Figure He used the motor to lift a weight of.5 N a height of.0 m. He measured the speed at which the weight was lifted and
UNFCCC and IPCC Engagement Status
 Committee on Earth Observation Satellites UNFCCC and IPCC Engagement Status Yoshiaki Kinoshita, Director of JAXA Paris Office 13 th CEOS Atmospheric Composition Virtual Constellation (AC-VC) Meeting CNES
Satellite observations of air quality, climate and volcanic eruptions
 Satellite observations of air quality, climate and volcanic eruptions Ronald van der A and Hennie Kelder Introduction Satellite observations of atmospheric constitents have many applications in the area
Global emission estimates for GHG within the EU EVERGREEN project (EnVisat for Environmental Regulation of GREENhouse gases)
") Global emission estimates for GHG within the EU EVERGREEN project (EnVisat for Environmental Regulation of GREENhouse gases) J.M. Pacyna 1,2, S. Mano 1, A. Luekewille 1, D. Panasiuk 2, S.Wilson 2, and
Global emission estimates for GHG within the EU EVERGREEN project (EnVisat for Environmental Regulation of GREENhouse gases) J.M. Pacyna 1,2, S. Mano 1, A. Luekewille 1, D. Panasiuk 2, S.Wilson 2, and
Understanding the Causes of Global Climate Change
 FACT SHEET I: Attribution Environment Understanding the Causes of Global Climate Change Average air temperatures at the Earth s surface have increased by approximately 0.6 o C (1 o F) over the 20 th century.
In-situ measurements of CO2
 In-situ measurements of CO2 Calibration, error estimates, role of in-situ chemical measurements, quantification of fossil fuel emissions Pieter Tans NOAA Earth System Research Laboratory 3 March 2010 Keck
LINKE TURBIDITY FACTOR FOR BRAŞOV URBAN AREA
 LINKE TURBIDITY FACTOR FOR BRAŞOV URBAN AREA Elena EFTIMIE Abstract: Atmospheric turbidity is an important parameter for assessing the air pollution in local areas, as well as being the main parameter
The Chemistry of Carbon and Global Warming Potentials Dr. Erik Krogh, Department of Chemistry; Local 2307
 The Chemistry of Carbon and Global Warming Potentials Dr. Erik Krogh, Department of Chemistry; erik.krogh@viu.ca; Local 2307 Biogeochemical Cycling - Where on Earth is all the carbon and what s it doing
Climate Change. Black-Body Radiation. Factors that affect how an object absorbs, emits (radiates), and reflects EM radiation incident on them:
, and reflects EM radiation incident on them:") Climate Change Black-Body Radiation Factors that affect how an object absorbs, emits (radiates), and reflects EM radiation incident on them: 1) Nature of the surface: material, shape, texture, etc. 2)
Climate Change Black-Body Radiation Factors that affect how an object absorbs, emits (radiates), and reflects EM radiation incident on them: 1) Nature of the surface: material, shape, texture, etc. 2)
Why is carbon dioxide so important? Examining the evidence
 Why is carbon dioxide so important? Examining the evidence In the light of new evidence and taking into account the remaining uncertainties, most of the observed warming over the last 50 years is likely
Urban-Dome GHG Monitoring:
 Urban-Dome GHG Monitoring: The INFLUX Project Measurement Challenges and Perspectives J. Whetstone (1), P.B. Shepson (2), K.J. Davis (3), C. Sweeney (4), K.R. Gurney (5), N.L. Miles (3), S. Richardson
SYSTEM MATURITY ASSESSMENT
 SYSTEM MATURITY ASSESSMENT Copernicus Workshop on Climate Observation Requirements, ECMWF, Reading, 29 June 2 July 2015 Jörg Schulz, EUMETSAT With contributions from: Ali Nadir Arslan, Jean-Christoph Calvet,
Climate observations and services: GCOS and GFCS
 WMO World Meteorological Organization Working together in weather, climate and water Climate observations and services: GCOS and GFCS Sophia Sandström Climate and Water Department World Meteorological
The Effect of GOSAT Observations on Estimates of Net CO 2 Flux in Semi-Arid Regions of the Southern Hemisphere
 SOLA, 2016, Vol. 12, 181 186, doi:10.2151/sola.2016-037 181 The Effect of GOSAT Observations on Estimates of Net CO 2 Flux in Semi-Arid Regions of the Southern Hemisphere Masayuki Kondo 1, Tazu Saeki 1,
In the following sections, we respond to the comments that were more specific to each referee.
 We would like to thank the reviewers for their thoughtful comments and efforts towards improving our manuscript. In the following, we highlight general concerns of reviewers that were common and our effort
Global air quality monitoring from space
 I. De Smedt, BIRA Global air quality monitoring from space Michel Van Roozendael SCIAMACHY book Royal Belgian Institute for Space Aeronomy (BIRA-IASB) Content Introduction AQ from space what can be seen?
Mapping water constituents concentrations in estuaries using MERIS full resolution satellite data
 Mapping water constituents concentrations in estuaries using MERIS full resolution satellite data David Doxaran, Marcel Babin Laboratoire d Océanographie de Villefranche UMR 7093 CNRS - FRANCE In collaboration
Carbon Dioxide and Global Warming Case Study
 Carbon Dioxide and Global Warming Case Study Key Concepts: Greenhouse Gas Carbon dioxide El Niño Global warming Greenhouse effect Greenhouse gas La Niña Land use Methane Nitrous oxide Radiative forcing
Dr David Karoly School of Meteorology
 Global warming: Is it real? Does it matter for a chemical engineer? Dr David Karoly School of Meteorology Email: dkaroly@ou.edu Recent global warming quotes Senator James Inhofe (R, Oklahoma), Chair, Senate
Smarter water management through sensor-based networks
 Smarter water management through sensor-based networks Dr Ian Oppermann Director ICT Centre With Thanks to Dr. Matt Dunbabin and the Autonomous Systems Lab Australia is a big country with a small population
On SEBI-SEBS validation in France, Italy, Spain, USA and China
 On SEBI-SEBS validation in France, Italy, Spain, USA and China Massimo Menenti Li Jia 2 and ZongBo Su 2 - Laboratoire des Sciences de l Image, de l Informatique et de la Télédétection (LSIIT), Strasbourg,
ГЕОЛОГИЯ МЕСТОРОЖДЕНИЙ ПОЛЕЗНЫХ ИСКОПАЕМЫХ
 LE HUNG TRINH (Le Quy Don Technical University) APPLICATION OF REMOTE SENSING TECHNIQUE TO DETECT AND MAP IRON OXIDE, CLAY MINERALS, AND FERROUS MINERALS IN THAI NGUYEN PROVINCE (VIETNAM) This article
How to Use Satellite GHG Concentration Data for Verification of GHG Emissions Inventories
 UNFCCC COP 22/CMP 12/CMA 1. Marrakech, Morocco, November 7-18, 2016 How to Use Satellite GHG Concentration Data for Verification of GHG Emissions Inventories GOSAT-2 (2018 - ) Dr. Tsuneo Matsunaga Satellite
Thermal Imaging for Discharge and Velocity Measurements in Open Channels. PKI 205C, Omaha, NE ;
 Thermal Imaging for Discharge and Velocity Measurements in Open Channels E. Jackson 1, D. Admiraal 2, D. Alexander 3, J. Stansbury 4, J. Guo 5, D. Rundquist 6, and M. Drain 7 1 Dept. of Electrical Engineering,
Intersection of SAR imagery with medium resolution DEM for the estimation of regional water storage changes
 Intersection of SAR imagery with medium resolution DEM for the estimation of regional water storage changes Sonya Spiridonova 1, Karin Hedman 1, Florian Seitz 2 1 Earth Oriented Space Science and Technology
Atmospheric greenhouse gases monitoring in India
 Atmospheric greenhouse gases monitoring in India Yogesh K. Tiwari Indian Institute of Tropical Meteorology (IITM), Pune CO 2 emissions from India India has one of the largest and fastest growing economies
and spatial resolution)
") Analysis of different synergy schemes to improve SMOS soil moisture retrievals (accuracy and spatial resolution) A. Chanzy 1, B. Berthelot 2, S. Cros 1, M. Weiss 2, J.-C. Calvet 3, T. Pellarin 4, J.-P
Analysis of different synergy schemes to improve SMOS soil moisture retrievals (accuracy and spatial resolution) A. Chanzy 1, B. Berthelot 2, S. Cros 1, M. Weiss 2, J.-C. Calvet 3, T. Pellarin 4, J.-P
SOLAR THERMAL ELECTRICITY GENERATION. By Franz Trieb, Carsten Hoyer, Stefan Kronshage, Richard Meyer, Marion Schroedter-Homscheidt
 SOLAR THERMAL ELECTRICITY GENERATION By Franz Trieb, Carsten Hoyer, Stefan Kronshage, Richard Meyer, Marion Schroedter-Homscheidt 28 Solar Potentials and Markets Power Solar irradiance is the fuel for
ESA Programmes Earth Observation Navigation
 05 March 2007 SSOM Engelberg Lectures R. Hartmann / Eumetsat, Meteosat-8, 28-Jun-2004, VIS+IR ESA Programmes Earth Observation Navigation Urs Frei Swiss Space Office (SSO) SSOM Engelberg Lectures, 05 March
Dawn of Satellite Lidar in Oceanography
 Dawn of Satellite Lidar in Oceanography Passive Ocean Color Measurements atmosphere dominates measured signal and correction is challenging ocean component of signal dominated by upper ½ optical depth
Chapter 11: Atmosphere
 To get you thinking This is our atmosphere. All life on Earth exists within this tiny protective blanket. Why is the atmosphere important to us? What do you think it does for us? Chapter 11: Atmosphere
WP3 OVERVIEW. Coordinating Efforts on Uncertainty trade-off for fossil fuel emissions
 WP3 OVERVIEW Coordinating Efforts on Uncertainty trade-off for fossil fuel emissions Greet Janssens-Maenhout / Marko Scholze JRC / Lund University 05/02/18 This project has received funding from the European