DRAFT. Agricultural Land Use and Management in the Willow Creek Watershed
|
|
|
- Alfred Powers
- 5 years ago
- Views:
Transcription
1 DRAFT Agricultural Land Use and Management in the Willow Creek Watershed Submitted by Agriculture and Agri-Food Canada Agri-Environment Services Branch (AESB) and Manitoba Agriculture Food and Rural Initiatives (MAFRI) May 17,
2 Table of Contents A. Executive Summary B. Acknowledgements: C. Preface D. Introduction Objective E. Agricultural Land Use and Management i. Current Agricultural Land Use of the Willow Creek IWMP Study Area a) Agricultural Profile Summary of Farm Financial Characteristics Agriculture Profile Summary b) 2006 Land Cover Summary Summary of 2006 Land Cover ii. Agricultural Land Use Trends Land Cover 1993, 2000, iii. Other Agricultural Land Use Trends/Impacts Changes in Annual Cropland Area Changes in Grassland Area Changes in Wetlands F. Agricultural Land Use and Management Considerations i. Agricultural Capability Analysis ii. Soil Texture Analysis iii. Wind Erosion Risk Analysis iv. Water Erosion Risk Analysis v. Soil Drainage Analysis G. Recent Federal and Provincial Policies and Programs Affecting Agricultural Land Use and Management ii. Management Considerations on Crown Lands a) Land Capability Classification b) Wooded Species Encroachment on Crown Lands ii. Recent Federal-Provincial Programs Environmental Farm Planning and Canada-Manitoba Farm Stewardship Program - On-Farm Beneficial Management Practices Adoption H. Agricultural Land Use and Management Recommendations* I. References: J. Appendices Appendix A: Diagram for Interpolating Census of Agriculture Data (Area Weighting Method) Appendix B: Animal Unit Calculations Appendix C: Land Cover Time Frame, Classifications, and Constraints Appendix D: Soil Information and Background Appendix E: Canada Land Inventory System Land Classes Appendix F: Water Erosion Risk Appendix G: Wind Erosion Risk Appendix H: Soil Drainage Classes
3 Appendix I: 2006 Census of Agriculture data Appendix J: Private and Crown Land Planning in the Willow Creek Watershed Appendix K: Beneficial Management Practices offered under the Canada Manitoba Farm Stewardship Program Appendix L: Environmental Farm Plan Workshops and EFP Statement of Completions in Manitoba Appendix N: Annual Precipitation for weather stations located in the Willow Creek IWMP for selected years.*
4 List of Figures: Figure 1: Willow Creek Watershed Study Area and Subwatershed Groupings for the Agriculture Profile (2006 Census of Agriculture analysis) Summary of Land Use and Land Management Figure 2: Distribution of Agricultural Land Use (2006 Census of Agriculture) Figure 3: Distribution of the main crop types grown in the Willow Creek Watershed (2006 Census of Agriculture) Figure 4: Area treated to crop inputs in the 2005 crop year (2006 Census of Agriculture) Figure 5: Tillage practices in the Willow Creek Watershed (2006 Census of Agriculture) Figure 6: Total livestock numbers in the Willow Creek Watershed (2006 Census of Agriculture) Figure 7: Average number of cattle per farm in the Willow Creek Watershed (2006 Census of Agriculture) Figure 8: Total number of farms and average farm size in the Willow Creek Watershed (2006 Census of Agriculture) Figure 9: Summary of farm financial activity for the 2005 calendar year (2006 Census of Agriculture) Figure 10: Average livestock and crop-related expenses per hectare for the 2005 calendar year (2006 Census of Agriculture) Figure 11: Distribution of Land Cover within the Willow Creek Watershed in Figure 12: 2006 Land Cover in the Willow Creek Watershed* Figure 13 Watershed Boundaries for 1971 to 2006 Census of Agriculture Data Figure 14 - Farm size in hectares, number of farms and total farm land in hectares in the Willow Creek Watershed from 1971 to Figure 15 Owned versus Rented Land trends in the Willow Creek Watershed from 1971 to Figure 16 - Cropland and Pasture area trends in the Willow Creek Watershed from 1971 to 2006* Figure 17 - Major crop types in the Willow Creek Watershed Trends from 1971 to 2006 (*) Figure 18 Alfalfa and tame hay trends in the Willow Creek Watershed from 1971 to Figure 19 - Major livestock production trends in the Willow Creek Watershed from 1971 to Figure 20 - Trend of the average number of livestock per farm reporting in the Willow Creek Watershed from 1971 to Figure 21 - Trend of fertilizer/herbicide use in the Willow Creek Watershed from 1971 to 2006 * Figure 22 - Manure application trends in terms of amount of land receiving manure in the Willow Creek Watershed from 1991 to Figure 23 - Trend of tillage practices in the Willow Creek Watershed from 1991 to Figure 24 - Total farm capital trends in the Willow Creek Watershed from 1971 to 2006 (*) Figure 25 - Farm financial characteristics in the Willow Creek Watershed from 1981 to Figure 26: Comparison of change in land cover from 1993 to Figure 27: Total change in area of annual cropland, in relation to other land cover types, in the entire Willow Creek IWMP study area (from 1993 to 2006) Figure 28: Analysis of Annual Cropland changes between the 1993 and 2006 Land Cover data* Figure 29: Total change in area of grassland, in relation to other land cover types, in the entire Willow Creek IWMP study area (from 1993 to 2006) Figure 30: Analysis of Grasslands changes between the 1993 and 2006 Land Cover data* Figure 31: Total change in area of wetland, in relation to other land cover types, in the entire Willow Creek IWMP study area (from 1993 to 2006) Figure 32: Analysis of Wetland changes between the 1993 and 2006 Land Cover data*
5 Figure 33: Areas Annually Cropped in 2006 on Soils with an Agricultural Capability of Class 4, 5, 6 or 7 in the Willow Creek Watershed IWMP study area Figure 34: Areas Annually Cropped in 2006 on Surface Texture in the Willow Creek Watershed IWMP study area Figure 35: Wind Erosion Risk on 2006 Annual Cropland in the Willow Creek Watershed Figure 36: High and Severe Risk of Water Erosion on 2006 Annual Cropland in the Willow Creek Watershed Figure 37 - Soil Drainage with Respect to 2006 Annual Cropping in the Willow Creek Watershed Study Area i. Crown Land Management in the Willow Creek Watershed Area Figure Figure 39: Agricultural Capability of Crown Lands in the Willow Creek Watershed List of Tables Table 1: Subwatershed Areas Table 2: Estimated annual animal units produced in the Willow Creek Subwatersheds (2006 Census of Agriculture) Table 3: Average dollars per hectare spent on fertilizer and pesticides in the 2005 calendar year (2006 Census of Agriculture) Table 4: 2006 Land Cover by Subwatershed (hectares) Table 5: Change in land cover from 1993 to 2000 to Table 6: Agricultural Capability in the Willow Creek Watershed Study Area Table 7: Soil Texture in the Willow Creek Watershed Study Area Table 8: Wind Erosion Risk on Annual Cropland in the Willow Creek Watershed Study Area from 2006 Land Cover Table 9: Water Erosion Risk on Annual Cropland in the Willow Creek Watershed Study Area from 2006 Land Cover Table 10: Soil Drainage Classes in the Willow Creek Watershed Table 11 Crown Lands by Rural Municipality including those in the Willow Creek Watershed Study Area Table 12- Hectares by MAFRI Crown Land Use Coding Table 13 - Agricultural Capability of Crown lands in the Willow Creek Watershed Study Area * Table 14: Change in grassland to trees on Crown Lands ( ) Table 15: BMP Adoption through the Canada-Manitoba Farm Stewardship Program
6 A. Executive Summary The Willow Creek watershed is approximately 121,100 ha in size and is located in the Interlake Region of Manitoba, north of Winnipeg. An Integrated Watershed Management Plan (IWMP) is being developed for this watershed by the East Interlake Conservation District (EICD) in collaboration with Manitoba Water Stewardship and numerous other stakeholders. Understanding changes in agricultural land use is essential for the development of the integrated watershed management plan. The overall objective of this report is to examine risks to key watershed resources by analyzing the physical characteristics of the landscape with consideration for how specific agricultural activities may be influencing them. This analysis also assists in identifying where soil and water management efforts could be directed to help address priority issues or identified risks within the watershed. An assessment at a watershed scale provides a snapshot in time of the various agricultural activities in the Willow Creek Watershed. Census of Agriculture data, temporal in nature, illustrates influences from external factors like weather, government programs and polices, market drivers, and technology to land use and land management decisions and the community response to those interactions. Such events, with an examination of a watershed s physical resource characteristics and risks, assist to develop an understanding of potential impacts on the basin s water quality, and identify opportunities for future sustainable land use strategies. This is particularly important to the Willow Creek IWMP where public consultation identified eight key categories of concern: Drinking Water Quality, Flooding/Drainage, Surface Water Quality, Soil Loss/Erosion, Fisheries, Natural Areas, Water Use/Allocation, and Wildlife. Ag-Profiling examines variables from 2006 Census of Agriculture database depicted over two subwatershed regions, including farm area, type of farm, cropping practices, tillage practices, fertilizer and pesticide use, financial activity, and livestock numbers. The same variables from the 2006 Census of Agriculture data were used to examine 35-year changes in agricultural activities to the study area. Land cover data, derived from 1993, 2000, and 2006 satellite imagery, was analyzed to document temporal changes to landcover. Using soils data and modeling, environmental indicators were developed for Agricultural Capability, Wind and Water Erosion Risks, and Soil Drainage characteristics. These were examined in combination with the annual cropland identified in the 2006 land cover. A review of recent federal and provincial policies and programs was conducted to assess their impact on agricultural land use and management. Results reveal the Willow Creek IWMP study area as a diverse agricultural landscape. Slight differences are evident from the northern part of the watershed compared to the southern areas with respect to soils types, land use, cropping practices, crop types, and livestock types and sizes of livestock operation. From 1971 to 2006, there were fewer but larger farms located in the study area, with a trend towards renting more land for agriculture production. Livestock production is important throughout the watershed, while crop production tends to be dominating in the eastern portion. The watershed has an increasing reliance on commercial fertilizers and pesticides, with a larger proportion of cropland being treated to crop inputs. Compared to five years ago, there has been an overall increase in annual cropland, forages, and treed/forested areas (suggesting encroachment) and decreases noted in wetlands, and grasslands. The majority of farms employ conventional tillage practices, however, over the last five years, there has been an increase in the amount of farms practicing no-till and conservation tillage practices. Analysis of land cover over a 13-year period corresponds well with the Census data, particularly the conversion of wetlands and the increases in annual cropland. Analysis of soils under annual - 6 -
7 cropland showed trends toward improved management, with a decreasing amount of annual cropland on soils that are class 4 or lower. Areas were identified and mapped within the watershed where the combination of annual cropping and landscape risk factors such as wind erosion, agricultural capability, and drainage, indicate special management of these lands may be warranted. An examination of land cover data changes was undertaken to identify changes in land cover with respect to grasslands, wetlands, and annual cropland, and how they relate to the issues of flooding and natural areas. This also included examination of land cover changes as they relate to crown lands in the watershed. Due to data limitations, all geographic analyses using land cover and soils data require further verification for accuracy assessment. The interest and willingness of producers within the watershed in addressing environmental issues was demonstrated by their participation under two key environmental programs in the Agricultural Policy Framework (APF); the Environmental Farm Plan (EFP) Program and the Canada-Manitoba Farm Stewardship Program (CMFSP). There were average levels of uptake in both programs, as 33 Beneficial Management Practice (BMP) projects were completed with financial and technical assistance through the CMFSP. Over 75% were non-point source livestock related BMP projects and 20% were Point Source Protection BMPs (Petroleum Fertilizer Storage). Recommendations from the analysis to address drinking water quality and source water protection include considerations for marginal land management options. These include adoption of BMPs where annual cropland is located on soils with agricultural capability of Class 4 or lower, protection and management of environmentally sensitive lands, and private source water assessments. With respect to flooding and drainage, recommendations include water supply assessment and surface water management assessment study conducted on the entire watershed to understand where gains could be made for flood protection. In addition, the promotion of point specific BMPs (riparian buffer design, riffle structures/ headwater storage options, erosion control structures) and landscape type BMPs (sustainable woodlot management options and sustainable rotational grazing) need to be considered on a targeted watershed perspective. An examination of the role of agro-forestry to reduce flood frequency could be carried out to explore options for maintaining particular lands that provide environmental benefits by reducing impacts of drainage and flooding. Recommendations for surface water quality include sustainable land management, water erosion mitigation practices such as grassed waterways, buffer establishment, and land conversion to forages, as well as promoting BMPs that will reduce nutrient transport to waterbodies. Analysis of the erosion issue revealed the focus should be on wind erosion and that recommendations included use of cover crops and residue management to annual cropland areas. Potential indicators were also identified for each recommendation presented to allow the IWMP process to evaluate progress related to addressing issues in the future
8 B. Acknowledgements: The following individuals contributed to the compilation, interpretation, and derivation of information contained in this submission. AAFC-AESB: Holweger, U., Michiels, P., Powers, J., Vanrobaeys, J., Becenko, S., Kopytko, M. MAFRI: Schindler, D
9 C. Preface In 2009, the East Interlake Conservation District (EICD) was designated as the Watershed Planning Authority to develop a comprehensive integrated watershed plan (IWMP) for the Willow Creek Study Area. A Project Management Team (PMT) was formed to guide the watershed planning process. A formal request was made on behalf of the PMT and Manitoba Water Stewardship to Agriculture and Agri-Food Canada - Agri Environment Services Branch (AESB) and Manitoba Agriculture Food and Rural Initiatives (MAFRI) to be involved in the IWMP process. Agriculture is a shared responsibility between the federal and provincial governments. As such, AESB and MAFRI are partnering to provide professional and technical guidance to the IWMP process on agricultural issues and agri environmental priorities. This report focuses on information related to agricultural activities and land resources in the watershed. It is important to note that in addition to agriculture, there are other industries, sectors, and users of the watershed s resources that also have an impact on the watershed. As there are scale and accuracy limitations associated with the data, it should be noted that the information contained within this report does not replace the need for site-specific analysis; rather, it serves as a guide for general planning purposes in the Willow Creek Study Area. More information on the data used in this document can be found within the Appendices section of the report
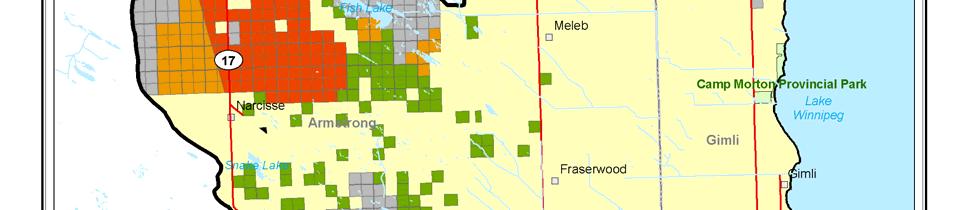
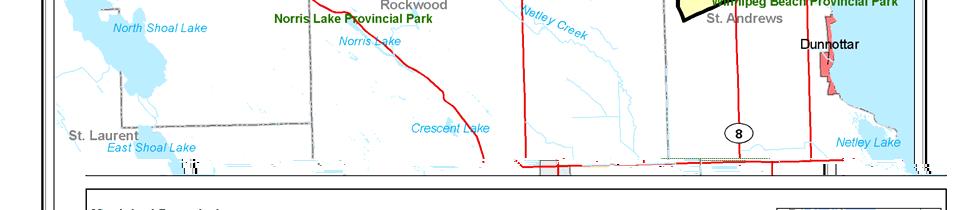
10 D. Introduction The Willow Creek Integrated Watershed Management Plan (IWMP) Area is defined as watershed 05OJ by Manitoba Water Stewardship and is situated in Manitoba s Interlake Region (Figure 1). The Willow Creek IWMP study area is approximately 121,098 ha in size and consists of the area west of Lake Winnipeg, east of the Narcisse Wildlife Management Area, and north of Winnipeg Beach Provincial Park. Some of the communities located within the study area include Gimili, Narcisse, Fraserwood, Chatfield, Komarno, Malonton, Sandy Hook, and Winnipeg Beach. Camp Morton Provincial Park is also located in the watershed. Objective Understanding the current state and trends in agricultural land use and practices along with landscape characteristics is essential for developing an integrated watershed management plan. Agricultural land use and associated land cover can influence watershed processes and impact issues like water quality and hydrological flow within the watershed. Knowledge of these factors contributes to developing sustainable land use strategies that will lead to a healthier and more ecologically functioning landscape. To better understand agricultural changes and impacts within the watershed, AESB and MAFRI partnered to analyze agricultural aspects, focusing on the major issues identified in the 2008 public consultations in support of the IWMP. Specifically, the document will examine the following in order to help guide watershed management: 1. "Near-Current" Agricultural Land Use and Management using the latest available Census of Agriculture data and satellite imagery. 2. Five-year change in agricultural land use and management using 2001 and 2006 Census of Agriculture data and a time series of satellite imagery. 3. Land cover data in combination with landscape risk factors pertaining to the soil and water resource. 4. The impact of recent federal and provincial initiatives, policies and regulations impacting agricultural land management and land use planning activities in the watershed


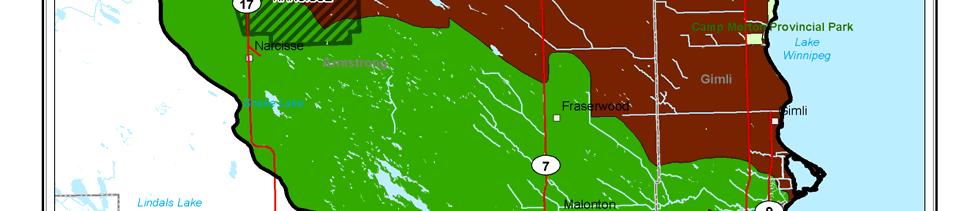
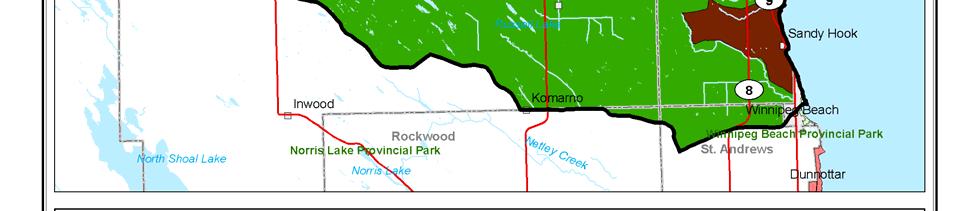
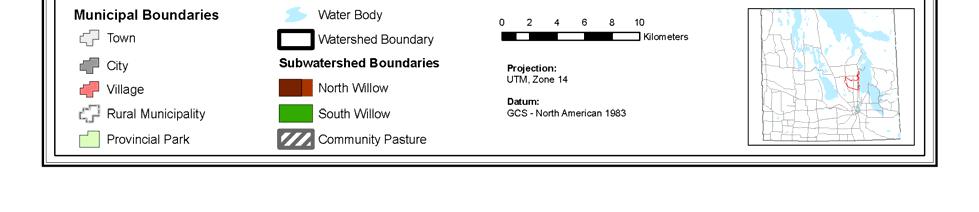
11 Figure 1: Willow Creek Watershed Study Area and Subwatershed Groupings for the Agriculture Profile (2006 Census of Agriculture analysis)
12 E. Agricultural Land Use and Management i. Current Agricultural Land Use of the Willow Creek IWMP Study Area a) Agricultural Profile Agricultural profiling refers to the characterization of agricultural production in a specified area or region. Census of Agriculture information can provide a snapshot in time of the agricultural footprint on the landscape. The information can be portrayed either on a municipal or geographical boundary and can provide value to understanding the role and trends of the industry to the area. Census of Agriculture data at a subwatershed scale has been obtained from Statistics Canada for the 2006 Census year. Further details on the method used to interpolate Statistics Canada s Census of Agriculture from a geographic boundary to a subwatershed boundary are provided in Appendix A. For reporting purposes, numbers have been rounded to the nearest 5 for farm numbers, 10 for livestock and smaller area data, and 100 for poultry, financial data and for larger areas. Due to the different boundaries between the IWMP study area and the Ag. Census subwatershed layer, only 88% of the watershed can be accurately represented in the agricultural profile. Agricultural activities were analyzed within both the North Willow Creek and the South Willow Creek subwatersheds (Figure 1). The South Willow Creek refers to the area which drains the south and western portion of the study area. The North Willow Creek can be described as the area draining the north and eastern portion of the watershed study area, as well as some areas draining into the Lake Winnipeg some of which located outside of the IWMP study area (see Figure 1). Since the Census data is summarized for the entire area of the subwatershed, the following profile for North Willow includes this area. Table 1 lists these subwatersheds with their respective sizes. Table 1: Subwatershed Areas Subwatershed name Area (hectares) Percent of Willow Creek IWMP study area North Willow 54,631 (47,612 ha within IWMP study area) 45%* South Willow 66,467 55% * Only 88% is of the North Willow subwatershed is located within IWMP boundary
13 Summary of Land Use and Land Management North Willow Subwatershed: According to the 2006 Census of Agriculture data, over 29% of the farmland in the North Willow Subwatershed was dedicated to annual crop production and over 53% to pasture, alfalfa, and hay and fodder crops. Cereals made up almost 35% of the cultivated land while almost 15% was seeded to oilseeds (mainly canola but some flax). Almost 40% of the cultivated land was in forages. There was also a small area dedicated to forage for seed reported. Land management practices included almost half of the cultivated land prepared with conservation or zero tillage, while the remaining area was prepared with conventional tillage practices. Beef production was accounted for the majority of livestock operations in the area, with almost 65 farm operations reporting beef cows, an average of almost 65 cows per farm. Approximately 5 farms reported a total of 125 dairy cows. Total cattle and calves in the area added up to over 8,458 animals. More than 5 farms reported poultry with an average flock size of 315 birds per farm, representing over 1,960 birds in the subwatershed. Less than 5 operations reported pigs. South Willow Subwatershed: In 2006, over 35% of the farmland in the South Willow Subwatershed was dedicated to annual crop production, and almost 45% to pasture, alfalfa, and hay and fodder crops. Cereals made up 25% of the cultivated area, oilseeds (mainly canola) over 10%, and forages almost 55%. Land management practices included almost 70% of the cultivated land prepared with conventional tillage practices, and the remaining area with conservation tillage or zero tillage practices. Over 5 farms had poultry with an average flock size of approximately 165 birds per farm for a total of approximately 840 birds reported. Less than 5 operations reported pigs. Beef production accounted for the majority of livestock operations in the subwatershed, almost 75 farm operations reporting beef cows, an average of over 55 cows per farm. Total cattle and calves reported in the area added up to almost 9,320 animals. Dairy cows were reported by a few farms. When comparing the two sub-watersheds, although South Willow had more total farmland, the North Willow reported slightly more cropland, while the South Willow had more pastureland (Figure 2). Summerfallow occurred throughout the area, though at a small percentage (~ 3%). Figure 2: Distribution of Agricultural Land Use (2006 Census of Agriculture) Total farmland Total cropland* Summerfallow Pasture** Other*** 50,000 40,000 hectares 30,000 20,000 10,000 0 North Willow South Willow Subwatershed * Total cropland includes all field crops, vegetables, fruit and nuts and sod ** Pasture includes tame pasture and natural areas used for pasture
14 *** Other category includes all other land uses including farmyard, woodlots, Christmas trees, wetlands, etc. With respect to crops grown in 2006, more than half of the cropland was dedicated to forage for hay production in the South Willow, whereas in the north it was slightly less than half. The North Willow reported a larger area sown to cereals and oilseeds (Figure 3). Figure 3: Distribution of the main crop types grown in the Willow Creek Watershed (2006 Census of Agriculture) 10,000 8,000 Cereals Oilseeds Pulses Forage hay hectares 6,000 4,000 2,000 0 North Willow Subwatershed South Willow As for crop inputs, cropland in South received, on average, less inputs than crops in the other subwatershed (Figure 4). Farmers in North Willow applied fertilizer and herbicides to approximately 44% and 42% of the cropland respectively. Some fungicides and insecticides were applied in North Willow. Figure 4: Area treated to crop inputs in the 2005 crop year (2006 Census of Agriculture) hectares 8,000 6,000 4,000 2,000 Use of commercial fertilizers Use of insecticides Use of herbicides Use of fungicides 0 North Willow Subwatershed South Willow With respect to seedbed preparation, tillage practices tended to be dominantly conventional with almost 55% and 70% of the cropland in North Willow and South Willow, respectively, prepared for seeding using tillage practices which incorporate most of the crop residue into the soil
15 (Figure 5). The higher application of conventional tillage in South Willow is associated with more soil capability limitations. Figure 5: Tillage practices in the Willow Creek Watershed (2006 Census of Agriculture) Conventional tillage Conservation tillage* Zero tillage* percent of area prepared for seeding North Willow South Willow Subwatershed * Information is under-reported due to suppression of data to protect confidentiality Figure 6 summarizes the livestock numbers in the Willow Creek Watershed. Livestock production is important in the watershed, with beef being the main livestock product. For both subwatersheds, beef cows made up about half of the total cattle and calves number, indicating that cow/calf operations dominated. Dairy, pigs and poultry are present, though in small numbers. Figure 6: Total livestock numbers in the Willow Creek Watershed (2006 Census of Agriculture) Total cattle and calves Beef cows Dairy cows* Total Poultry number of animals or birds reported 10,000 8,000 6,000 4,000 2,000 0 North Willow South Willow Subwatershed * Suppression of dairy cow numbers occurs in South Total Animal Units (AU) produced in the watershed (based on annual nitrogen production) has been estimated using Manitoba s AU coefficients and by making several assumptions (refer to Appendix B). As represented in Table 2, cattle and calves, consisting mainly of beef cattle,
16 contributed the majority of animal units produced in each of the subwatersheds (over 95% in both subwatersheds). Since beef production consists of mainly cow/calf operations, manure nitrogen and phosphorous will be deposited on pastureland naturally by the animals during the grazing season, and accumulate in more concentrated areas during the winter season. Table 2: Estimated annual animal units produced in the Willow Creek Subwatersheds (2006 Census of Agriculture) Livestock Type Animal Units (AU) North South Total Animal Units Total Cattle and Calves 5,438 5,925 11,363 Total Pigs Total Poultry Total Horses and Ponies Other livestock - sheep, goats, bison, elk) TOTAL AU* 5,550 6,140 11,690 * some livestock numbers have been suppressed to preserve confidentiality of the Census data and are not included in the calculations of total animal units. Intensity of the livestock industry can be determined by the average size of flocks and herds. In both subwatersheds, the average number of total cattle and calves and beef cows per farm is similar; North Willow reporting an average of 65 beef cows per farm and South Willow reporting numbers slightly less at 57 beef cows/farm (Figure 7). The average number of poultry per farm was higher in North Willow, with an average of over 160 birds per farm. Figure 7: Average number of cattle per farm in the Willow Creek Watershed (2006 Census of Agriculture) Total cattle and calves Beef cows Dairy cows* Total Poultry average animals/farm North Willow South Willow Subwatershed * Suppression of dairy cow numbers occurs in South Willow
17 Summary of Farm Financial Characteristics North Willow Subwatershed: In 2006, the North Willow subwatershed reported approximately 105 farms with 67% of the subwatershed area being used for farming. Generally, the average farm size was approximately 350 ha/farm with an average capital investment of $1,700 per hectare of farmland (or almost $599,000/farm). Livestock-related expenses per hectare of farmland were over $75/ha and crop-related expenses were almost $105/ha. Per farm, profit was estimated to be over $20,140 and the sales to expense ratio was reported to be 1.20 (farm operations received $1.20 gross revenue for every $1 of agricultural expense). South Willow Subwatershed: In the South Willow subwatershed reported approximately 125 farms with an equivalent to almost 65% of the subwatershed area. Generally, the average farm size was around 345 ha/farm and farms had an average capital investment of almost $1,450 per hectare (or over $498,700 per farm). Average livestock-related expenses per hectare of farmland were $40/ ha farmland, while crop-related expenses were almost $77/ha. Profit was estimated to be almost $7,371 per farm and the sales to expense ratio was reported to be The average farm size is similar in both watersheds (Figure 8). South Willow, which is a larger area, has almost 20 more farm operations in comparison to the North Willow. A look at the farm financial activity shows that farms in North Willow tended to have higher sales and expenses activity as well as estimated profit per farm (Figure 9). Further information regarding the 2006 Census of Agriculture data can be found in Appendix I. Figure 8: Total number of farms and average farm size in the Willow Creek Watershed (2006 Census of Agriculture) Average farm size (hectares) Number of farms 0 North Willow Subwatershed South Willow
18 Figure 9: Summary of farm financial activity for the 2005 calendar year (2006 Census of Agriculture) dollars Total sales and expenses per farm Estimated profit/farm 250,000 25, ,000 20, ,000 15, ,000 10,000 50,000 5, North Willow South Willow Subwatershed profit dollars/farm Livestock and Crop-related expenses reported for the 2005 crop year have been determined on a per hectare basis. Figure 10 shows that on average, farm operations in South Willow had the lowest livestock-related expenses per hectare of farmland. This equaled almost half of what was recorded in the farms reporting for North Willow. With respect to crop-related expenses, again, producers in South Willow reported the lowest expenses per hectare of cropped land and summerfallow. However, a closer look at the crop input costs shows that farms in North Willow spent more on fertilizer and pesticides per ha compared to the south perhaps due to higher priced chemicals (Table 3). Figure 10: Average livestock and crop-related expenses per hectare for the 2005 calendar year (2006 Census of Agriculture) dollars/hectare Livestock expenses $/ha farmland Crop expenses $/ha cropped land and summerfallow North Willow Subwatershed South Willow * Livestock-related expenses include total feed, supplements, and hay purchases, livestock and poultry purchases, veterinary services, drugs, semen, breeding feeds, etc ** Crop-related expenses include purchases of fertilizer, lime, herbicides, insecticides, fungicides, and seed and plant (excluding materials purchased for resale)
19 Table 3: Average dollars per hectare spent on fertilizer and pesticides in the 2005 calendar year (2006 Census of Agriculture) Dollars spent on fertilizer Dollars spent on pesticides Subwatershed name per hectare applied per hectare applied North Willow $127 $69 South Willow $93 $ Agriculture Profile Summary Approximately two thirds of the land in the watershed is owned by farm operations and considered farmland. Agriculture is very similar throughout the watershed with some differences seen between the two subwatersheds. Beef production is important in the watershed. In both subwatersheds, land use for beef production dominates the farmland (pastures and seeded forage for hay) but in the South Willow, it makes up a greater portion of the farmland than in the North Willow. With respect to beef herd sizes, on average farms report very similar number of animals. Farms in the North Willow spend more livestock-related expenses per hectare of farmland than farms in the south. This extra expense in the north is attributed to a dependence of for more tame forage production as compared to the south which relies more on native grazing lands. Crop production is important in both subwatersheds, but in North Willow, annual crops tend to make up a greater portion of the cropland and fertilizer and herbicides are used on around 43% of the cropped land. In South Willow, these inputs are used on a smaller percentage of the cropped land. Farmers paid more for crop inputs on a per hectare of cropland in the North Willow than in the South Willow. In North Willow, conservation and zero tillage practices are reported on over 45% of the fields prepared for seeding, with zero tillage dominating. In South Willow, these numbers are lower (30%) with more farms reporting of conventional tillage practices, perhaps due to the larger area of seeded forages occurring. Farms in South Willow tend to have lower total income and expenses, but also lower average profit per farm than farms in North Willow. b) 2006 Land Cover Summary Land cover data used in this analysis was derived from 30 metre resolution LANDSAT Thematic Mapper satellite imagery taken on August 22, The land cover data provides information on the spatial extent of general types of land cover within a given area at that point in time.. Further details on the land cover data, and the constraints associated with this data are provided in Appendix C. Summary of 2006 Land Cover Agriculture plays an important but lesser role to other land cover categories in the Willow Creek watershed. In 2006, over half (62,667 ha) of the land was classified as trees, water, or wetlands (Table 4, Figures 11 and 12). Grassland/pasture areas cover another 30% (35,767 ha) of the watershed and are mainly located in the central portions of the watershed. Annual Cropland accounts for 11% of the watershed (12,769 ha). Forage land, usually indicative of alfalfa stands, makes up 5% of the watershed and is found in the same areas as the annual cropland. Wetlands occupy a relatively small portion of the watershed (approximately 8%) with the majority
20 found in the headwater - western portion of the watershed. Approximately 3% of the watershed is classified as water. Table 4: 2006 Land Cover by Subwatershed (hectares) 1 Subwatershed Annual Cropland Trees Water Grassland/ Pasture Wetlands 2 Forage Urban Total 3 North Willow 6,669 22,246 1,027 14,100 5,345 2,861 2,383 South Willow 6,100 27,137 2,184 21,667 4,728 2,906 1,745 12,769 49,383 3,211 35,767 10,073 5,767 4, , Area totals are approximate due to the nature of the image analysis procedure 2. Due to seasonal changes in wetland size, date of imagery will affect area 3. Area calculations are for the portion of the North Willow subwatershed which is located within the IWMP study area Figure 11: Distribution of Land Cover within the Willow Creek Watershed in 2006 Willow Creek IWMP Study Area 2006 Landcover Breakdown 8% 5% 3% 11% 30% 40% Annual Cropland Trees Water Grassland/ Pasture Wetlands Forage Urban 3%


21 Figure 12: 2006 Land Cover in the Willow Creek Watershed* *Land cover was derived from satellite imagery captured September 9,
22 ii. Agricultural Land Use Trends Agricultural land use is dynamic and there are many factors influencing changes over time. The factors vary from economic drivers like commodity prices, land values, input costs, and government programs to social influences like changing demographics and increasing environmental awareness. Changes in land use can have a tremendous impact on the watershed, in terms of both its environmental and economic health. Trends can be identified and can influence the development of future strategies or approaches to encourage sustainable resource management in the watershed. Census of Agriculture 1971 to 2006 Census of Agriculture data has been obtained from Statistics Canada for the Census years from 1971 to 2006 and has been interpolated on a national scale to the Water Survey of Canada Sub- Sub Drainage Area boundaries. Further details on the method used to interpolate Statistics Canada s Census of Agriculture from a geographic boundary to a subwatershed boundary are provided in Appendix A. In the Willow Creek Watershed, one drainage area has Census of Agriculture data dating back to 1971 (Figure 13). The Drainage area is approximately 121,000 ha. and is coded as 05SB in the Water Survey of Canada data. For this section of the report, 05SB will be referred to as Willow Creek. Although the boundaries of the Census of Agriculture data in this case differ slightly from the IWMP watershed boundaries, the data is still applicable for characterizing long term trends. This analysis is based on different parameters than the previous sections due to larger area and less data suppression issues. For example, livestock numbers were higher for cattle poultry and pigs in this data set. For reporting purposes, numbers have been rounded to the nearest 5 for farm numbers, 10 for livestock and smaller area data, and 100 for poultry and for larger area and financial data


23 Figure 13 Watershed Boundaries for 1971 to 2006 Census of Agriculture Data
24 Number of Farms and Farmed Area The number of farms in the Willow Creek Watershed has declined steadily from about 500 farms in 1971 to about 210 farms in 2006, a decrease of approximately 57% (Figure 14). As the amount of land farmed in the watershed has declined from about 87,000 ha to about 67,400 ha, the average size of these farms, has increased steadily from about 180 ha to about 320 ha, an increase of about 79%. Figure 14 - Farm size in hectares, number of farms and total farm land in hectares in the Willow Creek Watershed from 1971 to Total Farms Total Farm Area (000 ha) Owned or Rented Lands In the Willow Creek watershed, there is a shift in farmland control toward more rental agreements. The amount of farmland that is owned has dropped significantly since 1971, from approximately 56,000 ha in 1971 to approximately 36,000 ha in During the same period, the amount of rented lands fluctuated, rising form 1976 to 1986 then declining from 1996 onward. The amount of rented land reported in 2006 was at a similar level to what was noted in 1971(Figure 15). Local knowledge attributes the change of private lands being idled or left vacated, due to the number of farmers who are approaching retirement age and/or interest in subdivisions. Figure 15 Owned versus Rented Land trends in the Willow Creek Watershed from 1971 to ,000 50,000 40,000 Hectares 30,000 Lands Owned Lands Rented 20,000 10,
25 Cropland and Pasture Area The area of cropland in the watershed has been increasing overall showing a peak of about 27,000 ha in Conversely, unimproved pasture lands have declined, from a peak of about 36,000 ha in 1991, to about 22,000 ha in 2006 (Figure 16). The area of improved pasture, otherwise known as tame or seeded pasture, has been decreasing over that same 20 year period, from about 6,700 ha to about 3,500 ha. Unimproved or natural pasture has declined, since its 1981 peak of about 33,000 ha, to about 22,000 ha in Summerfallow practices have decreased in the watershed from about 4,000 ha in 1971 to about 1,000 ha in 2006, a 75% decrease. Local knowledge indicates that these trends are a reflection of the conversion of marginal lands to crop production. Figure 16 - Cropland and Pasture area trends in the Willow Creek Watershed from 1971 to 2006* 40,000 35,000 30,000 Hectares 25,000 20,000 15,000 Cropland Improved Pasture Unimproved Pasture Summerfallow 10,000 5, *data was not collected for unimproved pasture in the 1976 Census of Agriculture Cropping Trends The area of land seeded to different crops from 1971 to 2006 has revealed some significant trends in the Willow Creek watershed (Figure 17). The most dramatic shift has been the area defined as other cereals (as defined at bottom of Figure 17), illustrating a consistent downward trend from approximately 6,800 ha in 1971 to below 1,000 ha in Almost all of the other crops were reported to be spring seeded annual crop varieties. Spring wheat showed a significant increase in area seeded, from 3,300 ha in 1971 to 5,500 ha in Area sown to spring wheat showed declines from 1981 to 1996, (about a 25% decrease), but rebounded slightly in 2001 and Oilseed production has increased in the watershed, from 1,700 ha in 1971 to about 3,800 ha in 2006 (a 130% increase). Canola is a key crop that leads to the increased hectares in oilseeds, where it was reported to have a 1000% increase since Together, oilseeds, spring wheat and other cereals make up the vast majority of crops grown in the watershed
26 Figure 17 - Major crop types in the Willow Creek Watershed Trends from 1971 to 2006 (*) 8,000 7,000 6,000 Hectares 5,000 4,000 3,000 Oilseed Spring Wheat Other Cereals 2,000 1, (*) Other cereals include areas of all grains, including: winter wheat, oats, barley, mixed grains, fall and spring rye, corn for grain, buckwheat and triticale. Alfalfa and Hay The importance of hay and alfalfa production is demonstrated in the high percentage of farmland in forage production. The amount of alfalfa grown has increased significantly, from about 4,300 ha in 1971 (representing 5% of the farmland) to about 8,000 ha in 2006 (this represents 12% of the farmland). The highest amount was noted in 2001 with 11,000 ha (Figure 18). The amount of tame hay also had a marginal decrease from 1971 to 2006, from about 5,300 ha to about 4,700 ha. The highest amount was noted in 1971 at 5,300 ha (representing approximately 6% of farmland). Figure 18 Alfalfa and tame hay trends in the Willow Creek Watershed from 1971 to ,000 10,000 8,000 Hectares 6,000 Alfalfa Tame Hay 4,000 2,
27 Livestock Production The amount of livestock and poultry produced in the watershed has varied during the 1971 to 2006 period (Figure 19). The largest changes occurred with poultry, where the total number of birds was 46,000 in 1971 and rose to the highest level of about 79,000 in Following 1996, poultry numbers declined dramatically to about 8,500 birds in the watershed in This change was attributed to the economic impacts felt by a bird processing plant. The amount of pigs increased steadily since 1971, from about 2,800 pigs in 1976 to about 6,500 pigs in The number of pigs peaked in 2001 when there were about 17,000 pigs in the watershed. The amount of cattle in the watershed has seen a modest decline, from about 17,000 head in 1971 to about 14,000 head in Figure 19 - Major livestock production trends in the Willow Creek Watershed from 1971 to ,000 80,000 70,000 60,000 50,000 40,000 Total Poultry Total Pigs Total Cattle 30,000 20,000 10, There is also a correlation between declining farm numbers reporting livestock to the increase in livestock numbers per farm. As one would expect, declining farm numbers and increasing amounts of livestock lead to the average amount of livestock on a farm increases substantially (Figure 20). The amount of pigs per farm has increased dramatically, from about 15 in 1971 to about 1,100 in Cattle herd size increased significantly as well, from about 46 head per farm in 1971 to almost 113 head per farm in The number of birds per farm increased as well, from about 200 birds per farm in 1971 to almost 700 birds per farm in
28 Figure 20 - Trend of the average number of livestock per farm reporting in the Willow Creek Watershed from 1971 to ,500 3,000 2,500 2,000 1,500 Av.#Poultry /Farm Reporting Av.#Pig /Farm Reporting Av.#Cattle /Farm Reporting 1, Land Management Fertilizer and Herbicide Usage The area of land in the watershed that receives commercial fertilizer each year has fluctuated from a low in 1971 of about 4,400 ha (5% of total farmland) to a peak of about 14,000 ha in 2001 (20% of total farmland) (Figure 21). During this period, fertilizer use has fluctuated. In 2006, there were about 12,000 ha of land receiving commercial fertilizer (18% of total farmland). Herbicide usage has also fluctuated, but has shown steady increases since Over the entire period from 1971 to 2006, land with herbicide being applied increased from approximately 6,200 ha in 1971 (7% of total farmland) to approximately 11,000 ha in 2006 (16% of total farmland). Figure 21 - Trend of fertilizer/herbicide use in the Willow Creek Watershed from 1971 to 2006 * 16,000 14,000 12,000 10,000 Hectares 8,000 6,000 Fertilizer Applied Herbicide Applied 4,000 2, * data for fertilizer and herbicide application was not collected in the 1976 Census of Agriculture
29 Manure Application The amount of land in the watershed with applied manure has shown a steady increase from 1991 (700 ha) to 2001 (1,700 ha) (Figure 22). This trend correlates well with the trend of increased pig numbers to the watershed. Solid manure incorporated into the soil was the dominant method prior from 1991 to In 2006, the manure application also included composted manure; applied to the same amount of hectares as solid manure incorporation on surface. Figure 22 - Manure application trends in terms of amount of land receiving manure in the Willow Creek Watershed from 1991 to ,000 1,800 1,600 1,400 Hectares 1,200 1, Tillage practices Trends related to tillage practices in the watershed can provide an indication of producer adopting of alternative land management practices (Figure 23). The amount of conventional tillage, in terms of the area of land where it was used, has been the most common choice of all other tillage practices. Conservation tillage accounted for 23% of all tillage practices for 2006 (3,300 ha). This has been increasing slightly since 1991 where it accounted for 32% of all tillage practices (3,700 ha). No-Tillage is not common in the watershed, as only a small number of landowners use this practice (10 farms reporting this practice in 2006). It is worthy to note, however, that no-till increased from about 1% (approximately 160 ha) in 1991 to about 13% (approximately 1,900 ha) of all tillage operations in
30 Figure 23 - Trend of tillage practices in the Willow Creek Watershed from 1991 to ,000 10,000 8,000 6,000 Conservation Conventional No Till 4,000 2, Financial Characteristics The financial picture for the agriculture sector is an indicator of producer s comfort level toward investment to support the agricultural resource. The amount of farm capital in the watershed has shown relatively steady growth from almost $16,400,000 in 1971 to approximately $111,500,000 in 2006 (Figure 24). It should be noted that the level of capital was relatively constant during the 15 year period from 1981 to 1996, and higher investment levels noted before and after that period. Figure 24 - Total farm capital trends in the Willow Creek Watershed from 1971 to 2006 (*) 120,000, ,000,000 80,000,000 Dollars 60,000,000 40,000,000 20,000, * Inflation has not been accounted for in total farm capital
31 Average Farm Sales and Expenses Farm sales and expenses from 1981 to 2006 indicate that while sales have seen modest increases, expenses have had greater increases, leading to lower net cash income in the sector (Figure 25). While average salaries increased significantly, average expenses and net cash income per farm reporting also increased at a similar rate. Overall, average net cash income per farm experienced a subtle increase in the 25 year period of 1981 to In 2006, average net cash income per farm was approximately $10,700, suggesting a 47% increase from 1981 (approximately $2,500). Figure 25 - Farm financial characteristics in the Willow Creek Watershed from 1981 to ,000 90,000 80,000 70,000 Dollars/Year 60,000 50,000 40,000 30,000 20,000 10,000 Aver. Sales/Farm Reporting Aver. Exp/Farm Reporting Aver. Net Cash Income/Farm Reporting Land Cover 1993, 2000, 2006 Land cover maps used in this analysis were developed from 30 metre resolution LANDSAT Thematic Mapper satellite imagery. These data sets are point in time and allow users to see the spatial extent of general types of land cover within a given area over time. Further details on the information used for the land cover analysis and the constraints associated with this data are provided in Appendix C. The 1993 land cover was derived from satellite imagery captured on May 14, 1993, and the 2000 land cover is from imagery taken on September 14, 2000, while the 2006 land cover was captured on August 22, Change in Land Cover An analysis of land cover data from 1993, 2000 and 2006 satellite imagery supports the trends seen in the census data, with modest declines in cropland since the 1990s, and increases in grassland and forages over the same period (Figure 26). Although there are some inherent limitations in analyzing land cover data to determine changes in land use, some changes can be noted: Trees are the predominant land cover type in the watershed with an overall decrease of over 6,000 ha (or 40%) between 1993 and 2006 (Table 5). The increase in annual cropland correlates with increases noted with oil seed production and possible forage rejuvenation (refer to Table 5). There is also an increase in forages from 1993 to 2006, in part to landowners seeding areas otherwise normally part of
32 annual cropland to forage. This is due to wetness from precipitation or indiscriminate drainage as identified through local knowledge. Increases noted in water may be attributed to flooding due to above normal rainfall being recorded in 1993 and 2005 in portions of the watershed (see Appendix M). These flooding events, the result of two significant spring rainfall events, would have created ponding and unseedable arable acres having the appearance of water in the following year. While these areas may be noted as higher than normal in 2001, the 1999 land cover data still supports changes that were already occurring; movement away from annual cropland on marginal lands to seeded forages and/or grasslands. Urban areas have shown a steady increase in the watershed from each of the years recorded, noting a 5% increase within the land cover class. There is more area associated with urban land cover than the amount of hectares associated with forages or open water in the watershed. Most of the urban areas are located on the eastern, downstream portion of the watershed. This suggests that while urban areas are of significance, increased pressure for urban development within the watershed may be impacting prime and viable agricultural land, possibly taking them out of production
33 Table 5: Change in land cover from 1993 to 2000 to Land Cover 1993 Area (ha) 2000 Area (ha) 2006 Area (ha) Change from 1993 to 2000 (ha) Change from 2000 to 2006 (ha) Annual Cropland 11,905 15,716 12,769 3,811-2,947 Trees 41,601 45,165 49,382 3,564 4,217 Water 2,599 2,586 3, Grassland 47,472 39,170 35,767-8,302-3,403 Wetlands 12,566 11,636 10, ,562 Forage 1,044 2,865 5,767 +1,821 +2,902 Urban 3,912 3,959 4, Totals 121, , , Area totals are approximate due to the nature of the image analysis procedure Figure 26: Comparison of change in land cover from 1993 to ,000 50,000 40,000 Hectares 30,000 20,000 10,000 0 Annual Cropland Trees Water Grassland/ Pasture Wetlands** Forage Urban * Area totals are approximate due to the nature of the image analysis procedure ** Due to seasonal changes in wetland size, date of imagery will affect area iii. Other Agricultural Land Use Trends/Impacts Agricultural land use is constantly changing due to factors such as climate, markets, crop rotation or changes in agricultural production systems (livestock versus crop production). The previous section summarized the overall change in land cover from 1993 to A more detailed examination of the land cover classes from 1993 and correlating them to data collected from the 2006 imagery can not only tell us how much one classification has changed over a time period, it can also identify where changes in land use are occurring, thereby giving some indication of influences of land management or land use change. It should be noted that data classification limitations and the acquisition dates of satellite imagery can introduce
34 discrepancies into these values. Further field investigations would be required to verify these findings. Changes in Annual Cropland Area Changes in land use can reflect changes in land management practices, and possible impacts felt in environmentally sensitive areas. Areas of annual cropland will be constantly changing due, in part to crop rotations, market and economic drivers, as well as environmental factors. Analyzing changes in annual cropland can be useful to help explain changes in environmental factors like water quality, both surface and ground, and flooding. In the Willow Creek IWMP, there was a modest increase in annual cropland in 2006, from 1993 (Table 10). Figure 27 summarizes parcels which experienced changes to and from annual cropland from 1993 to Annual cropland was most often changed from grassland land cover - over 4,400 hectares of grassland in 1993 converted to cropland in 2006 (Figure 27). Approximately 1,200 hectares, however, had reciprocal conversion of cropland in 1993 to grassland in 2006, resulting in a small net increase of annual cropland in the extreme north-west portions of the watershed near communities of Narcisse and Chatfield (Figure 28). Most of the remaining land that was changed to annual cropland in 2006 came largely from forages and treed areas that were present in 1993 (Table 5). With seeded forages, there was more cropland being converted to forage than the reverse, resulting in a net conversion of almost 3,000 ha of cropland to forage by Figure 27: Total change in area of annual cropland, in relation to other land cover types, in the entire Willow Creek IWMP study area (from 1993 to 2006) Hectares Total Area which changed to annual cropland in 2006 (from 1993) Total Area which changed from annual cropland in 1994 to different land cover in ,000 4,500 4,000 3,500 3,000 2,500 2,000 1,500 1, Trees Water Grassland Wetland Forages Urban/transp


35 Figure 28: Analysis of Annual Cropland changes between the 1993 and 2006 Land Cover data* * Land cover is derived from satellite imagery taken May 14, 1993 and September 9,
36 Changes in Grassland Area Analyzing changes in grassland land cover can be useful to understand risks associated to water quality and can be beneficial for reducing runoff and flood mitigation. In the Willow Creek IWMP, there was an overall decrease of almost 12,000 ha of grassland in 2006, from 1993 (Table 5). Figure 29 summarizes parcels which experienced changes to and from grassland from 1993 to Most of the changes from 1993 grasslands are located in the western portion of the watershed. Some of these changes may be due to forage and pasture rejuvenation, or desire to move to annual crop production as shown by the numbers in the Census of Agriculture data (Figure 18 & 19, pages 23-24). It might also suggest a producer response to move away from a limited livestock industry hit by BSE. The main conversion of grassland cover from 1993 to 2006 was to trees, suggesting tree encroachment into natural grasslands and pastures is occurring (Figure 29 and Figure 30). The1993 grassland hectares to trees were almost double the conversion of trees annual cropland, and forages combined to grasslands in While conversion to grasslands may sometimes be the result of market trends and present economic opportunities and benefits, there may be a risk to the environment. For example, the increased conversion of grasslands to annual cropland on soils prone to erosion could impact water quality as well as increased flooding downstream due to higher runoff levels. In turn, it could also lead to increased concentrations of contaminants in water if appropriate management practices are not utilized. Figure 29: Total change in area of grassland, in relation to other land cover types, in the entire Willow Creek IWMP study area (from 1993 to 2006) Total Area which changed to grassland in 2006 (from 1993) Total Area which changed from grassland in 1993 to a different land cover in Hectares Annual cropland Trees Water Wetland Forages Urban/transp


37 Figure 30: Analysis of Grasslands changes between the 1993 and 2006 Land Cover data* * Land cover is derived from satellite imagery taken May 14, 1993 and September 9,
38 Changes in Wetlands Assessing the wetland classification change can provide some information about impacts of flooding, water supply and quality, as well as natural areas. In the Willow Creek watershed, there was an overall decrease of almost 2,400 ha of wetland in 2006 when compared to 1993 (Table 5). Figure 31 summarizes parcels which experienced changes to and from wetland from 1993 to In the eastern part of the watershed, wetlands which were present in 1993 are not present in the 2006 imagery, suggesting that land drainage may have contributed. Most new wetlands identified in 2006 are situated in the south and central portions of the watershed and are associated with the expansion of a nearby existing wetland. This association suggests that the majority of the changes may be in relation to natural wetness or through beaver dam activity, but should be verified with field verifications. Further analysis indicates that most changes from wetlands were to land cover classifications of grasslands, trees and water (Table 5). The greatest change in wetlands from 1993 to 2006 was the change of approximately 3,200 hectares to grasslands (Figure 31). This conversion was partly offset by the conversion of grasslands in 1993 to wetland in The largest gains in wetlands for 2006 came from the conversion of 1993 grassland, resulting in a net decrease in wetlands (Figure 31 and 32). One possible explanation for some of the changes noted could be the result of annual precipitation levels in the area, which showed above normal rainfall for the 2005 year (see Appendix M). Figure 31: Total change in area of wetland, in relation to other land cover types, in the entire Willow Creek IWMP study area (from 1993 to 2006) 3,500 Total Area which changed to wetland in 2006 (from 1993) Total Area which changed from wetland in 1993 to different landcover in ,000 2,500 Hectares 2,000 1,500 1, Annual cropland Trees Water Grassland Forages Urban/transp


39 Figure 32: Analysis of Wetland changes between the 1993 and 2006 Land Cover data* * Land cover is derived from satellite imagery taken May 14, 1993 and September 9,
40 F. Agricultural Land Use and Management Considerations This section involves the analysis of a combination of factors, land use and the characteristics of the local landscape, in order to determine where consideration should be given to how the land is used or managed, including the potential for adoption of Beneficial Management Practices (BMPs). Land cover data represents an indicator of how the land is being used, while relevant landscape characteristics and risk factors are contained within the soils dataset. Further information about land cover data can be found in Appendix C, while more information about the soils data can be found in Appendix D. i. Agricultural Capability Analysis The Canada Land Inventory System (CLI) was used to classify land based on agricultural capability. The CLI is a comprehensive survey of land capability and land use aimed at providing a basis for making land-use planning decisions. Under the CLI, lands are classified according to physical capability for agricultural use (PFRA, 2005). Agriculture capability can best be described as the ability of the land to support the appropriate type of crops and agriculture management techniques. Not all land can be managed in the same manner with soil types, topography, stoniness, soil moisture deficiency and low fertility and other potential limitations influencing land use and practices. Classes ranging from 1 to 7 have been established, with 1 being the highest rated land class with no limitations to annual crop production and 7 being the lowest rated land for agriculture (not suitable for agriculture). Further information about CLI and specific characteristics and limitations associated with individual land classes is provided in Appendix E. Analytical Methods Analysis of the land classes with respect to land cover helps to understand the extent of agricultural activity over marginal lands. An examination of annual cropland from the 2006 land cover will provide estimation to the extent of how much annual cropping is occurring on those marginal lands. Such analysis can also provide an indication of where producers are demonstrating good land management practices by utilizing these marginal lands for purposes other than annual crop production. As well, comparisons examining land cover analysis from the 1993 data sets provide opportunity to examine how much change has occurred in agricultural activity with respect to time. A relatively small portion of the watershed is considered highly productive Class 2 and 3 lands (17% or approximately 20,000 hectares). These are associated with an elongated beach ridge running parallel to the lakeshore. Of these soils, only 56% of them are used for annual cropland (Table 11), as determined from examining the 2006 land cover data Cropland on Class 4 and poorer soils Within the Willow Creek Watershed study area, the majority of the land is considered marginal agricultural land, classified as Class 4 and poorer. Approximately 82% (99,500 ha) of the study area (see Table 6) is considered marginal land. An examination of the 2006 land cover data indicates that approximately 44% (or 3,700 ha) of the annual cropland was located on land rated as Class 4 or poorer (see Figure 33). The amount of marginal land being annually cropped has shown a slight decrease since
41 From the 1993 to 2006 land cover change analysis, it was noted that annual cropland had increased slightly, in part due to increased interest in the oil seeds and the impacts felt with the cattle industry from the BSE issue as noted earlier in this document. Changes were noted within the agricultural capabilities classes as well. There was less annual cropland found from in the class 2 and 3 lands (1,100 ha), but almost 1,700 more hectares on class 4 soils (see Table 6). Table 6: Agricultural Capability in the Willow Creek Watershed Study Area to 2006 Total Area 2006 Annual Distribution Class 1 Annual Change in Annual in IWMP Cropland of Annual (ha) (ha) 2 Cropland Cropland Cropland (%) (ha) 3 Area (ha) 4 Class % 1 18 Class 2 13,086 4,873 38% 5, Class 3 7,544 2,249 18% 2, Class 4 59,854 3,502 27% 1,823 1,679 Class 5 7,465 1,144 9% 1, Class 6 20, % Class % 0 0 Organic 11, % Unclassified % 0 0 Water % 0 0 TOTAL 120,995 12, % 11, Agricultural Capability is based on the CLI Rating of the dominant soil series for each soil polygon 2. Annual Cropland taken from the 2006 Land Cover (from Landsat Imagery captured on September 9, 2006) 3. Annual Cropland taken from the 1993 Land Cover (from Landsat Imagery captured on May 14, 1993) 4. Figures are derived from the total area of annual cropland in 2006 minus total annual cropland in 1993 in each Class

42 Figure 33: Areas Annually Cropped in 2006 on Soils with an Agricultural Capability of Class 4, 5, 6 or 7 in the Willow Creek Watershed IWMP study area 1 1. Agricultural capability is based on the CLI Rating of the dominant soil series for each soil polygon
43 ii. Soil Texture Analysis Soil surface texture strongly influences the soil s ability to retain moisture, its general level of fertility, and the ease or difficulty of cultivation. For example, water moves easily through coarsetextured (sandy) soils, with little moisture being retained resulting in these soils drying out more quickly than fine-textured (clayey) soils. Sandy soils are often characterized as having a loose or single-grained structure which is very susceptible to wind erosion whereas clay soils have a high proportion of very small pore spaces that are capable of retaining moisture. Clay soils are usually fertile because they have a greater capacity to retain nutrients than sandy soils. However, they transmit water very slowly and are therefore susceptible to excess moisture conditions (PFRA, 2005) Soil texture in the Willow Creek watershed can have a bearing on groundwater management and potential contamination. Proper land management with respect to fertilizer and pesticide applications are important as soil textures can contribute to greater subsurface movement to the groundwater source, particularly where there are thin soil overburden to the aquifer. Furthermore, surface water movement into the bedrock material can increase contamination risks by the chemical makeup of the surface water and by the physical properties of freezing and thawing. The majority of the soils in the Willow Creek watershed are loamy soils making up 57% and located throughout the watershed (refer to Table 7). Organic soils are the second largest soil texture group in the watershed, making up 27%, followed by clayey type of soils at 11%. With respect to annual cropland, 10% was located on sandy type soils in 2006, primarily associated with moraine deposition distributed in the north and south eastern portions of the watershed (Figure 34). About 8% of annual cropland is located on organic soils. Table 7: Soil Texture in the Willow Creek Watershed Study Area Surface Texture Class 1 Area (ha) 2006 Annual Cropland area (ha) Distribution of 2006 Annual Cropland 2 Organic 32, % Coarse Sands Sands 5,180 1,282 10% Coarse Loamy 1, % Loamy 67,959 6,153 48% Clayey 13,142 3,739 29% Rock Unclassified 176 Water TOTAL 120,042 12, % 1. Soils Surface Texture is based on the textural rating of the dominant soil series for each soil polygon 2. Annual Cropland taken from the 2005 Land Cover (from Landsat Imagery)

44 Figure 34: Areas Annually Cropped in 2006 on Surface Texture in the Willow Creek Watershed IWMP study area 1 1. Soils Surface Texture is based on the textural rating of the dominant soil series for each soil polygon
45 iii. Wind Erosion Risk Analysis Wind erosion risk information in Manitoba has been developed from the provincial soil survey data and the Soil Landscapes of Canada (SLC Ver see Appendix G). The Wind Erosion Risk model used for the Agriculture Canada Wind Erosion Risk Maps (1989) incorporates soil moisture, surface roughness and aggregate size, and drag velocity by wind. Erosion risk classes were assigned based on the weighted average soil loss for each map polygon. The five classes of soil erosion risk (ranging from negligible to severe) are based on a bare, unprotected soil condition and do not consider land use and crop management factors. Cropping and residue management practices can significantly reduce erosion risk depending on crop rotation, soil type, and landscape features. Basing soil erosion risk on a bare soil scenario helps to identify areas dominated by sensitive, erosive soils which may otherwise be masked if a land use or surface vegetation cover factor was considered (Eilers et. al. 1989). Approximately 10% of the Willow Creek Watershed study area is considered to have a high to severe wind erosion risk on 2006 annual cropland (Table 8). This is situated in the eastern portion of the watershed (Figure 35). Affected areas generally correspond to the portions with coarse textured soils. The majority of the watershed, or about 53%, is considered to have a negligible to low risk of wind erosion. Based on the 2006 land cover data, approximately 45% of the annual cropland was located on soils with moderate, high, to severe risk for wind erosion (Table 8). When compared to 1993 land cover, there was a decline in the amount of annual cropland located on soils with a moderate to severe risk of wind erosion. Increases were noted from 1993 to 2006 in the area of cropland in negligible or low wind erosion risk categories, suggesting that annual crop production in the watershed is becoming more responsive to such environmental risks. However, information from Census survey indicates that 70% to 85% of seeded fields were prepared using conventional tillage in Table 8: Wind Erosion Risk on Annual Cropland in the Willow Creek Watershed Study Area from 2006 Land Cover 1 Class 2 Total Area in IWMP (ha) 2006 Annual Cropland (ha) 2 Distribution of Annual Cropland (%) 1993 Annual Cropland (ha) to 2006 Change in Annual Cropland Area (ha) 4 Negligible 25,931 1,182 9% Low 61,019 5,641 44% 4,397 1,244 Moderate 15,246 4,422 35% 5, High 4, % Severe % Organic Soil 12, % Water % 0 0 Unclassified % 0 1 TOTAL 121,001 12, % 11, Wind Erosion Risk is based on the weighted wind erosion rating for each soil polygon and assumes bare soil. 2. Annual Cropland taken from the 2006 Land Cover (from Landsat Imagery captured on September 9, 2006) 3. Annual Cropland taken from the 1993 Land Cover (from Landsat Imagery captured on May 14, 1993) 4. Figures are derived from the total area of annual cropland in 2006 minus total annual cropland in 1993 in each Risk Class


46 Figure 35: Wind Erosion Risk on 2006 Annual Cropland in the Willow Creek Watershed 1 1. Wind Erosion Risk is based on bare soil and does not take into account vegetative cover or management practices
47 iv. Water Erosion Risk Analysis The overland flow of water can, under certain circumstances, carry particles of soil with it. Rain splash erosion, sheet erosion, rill erosion and gully erosion are all caused by water. Where this occurs, there is the potential to carry large quantities of sediment and contaminants to nearby waterways and waterbodies throughout the watershed. This section examines where in the watershed that there may be a greater potential for this to happen. The analytical component of this section focuses on annual cropland from land cover data (see Appendix C) in conjunction with water erosion risk (see Appendix F) and the proximity of these areas to water courses. Water Erosion Risk The risk of water erosion was estimated using the Universal Soil Loss Equation (USLE) developed by Wischmeier and Smith (1965). The USLE predicted soil loss (tonnes/hectare/year) was calculated for each soil component in the soil map polygon. Water erosion risk factors used in the calculation include mean annual rainfall, slope length, slope gradient, vegetation cover, management practices, and soil erodibility (Eilers et. al. 2002). Erosion risk classes were assigned based on the weighted average soil loss for each map polygon. The five classes of soil erosion risk (ranging from negligible to severe) are based on bare and unprotected soil conditions. Cropping and residue management practices can significantly reduce this risk depending on crop rotation, soil type, and landscape features. Basing the soil erosion risk on a bare soil scenario helps to identify areas dominated by sensitive, erosive soils which may otherwise be masked if a land use or surface vegetation cover factor was considered (Eilers et. al. 2002). An examination of the watershed shows that almost 5,000 hectares (4% of the study area) have a moderate, high, to severe risk of water erosion. Analysis of land cover shows that over 2,900 hectares were annual cropland in 2006, which is a slight decrease from 1993 (Table 9, Figure 36). Table 9: Water Erosion Risk on Annual Cropland in the Willow Creek Watershed Study Area from 2006 Land Cover 2006 Distribution 1993 to 2006 Total Area 1993 Annual Class 1 Annual of Annual Change in Annual in IWMP Cropland Cropland Cropland (ha) (ha) 2 (ha) 3 Cropland (%) Area (ha) 4 Negligible 105,291 7,352 58% 5, Low ,476 19% 2, Moderate ,894 23% 3, High % Severe 0 0 0% 0 0 Organic Soil 0 0 0% 0 0 Water % 1-1 Unclassified % 1-1 TOTAL 120,995 12, % 11, Water Erosion Risk is based on the weighted average USLE predicted soil loss within each soil polygon, assuming bare unprotected soil. 2. Annual Cropland taken from the 2006 Land Cover (from Landsat Imagery captured on September 9, 2006) 3. Annual Cropland taken from the 1993 Land Cover (from Landsat Imagery captured on May 14, 1993) 4. Figures are derived from the total area of annual cropland in 2006 minus total annual cropland in 1993 in each Risk Class

48 Figure 36: High and Severe Risk of Water Erosion on 2006 Annual Cropland in the Willow Creek Watershed 1 1. Water Erosion Risk is based on bare soil and does not take into account vegetative cover or management practices
49 v. Soil Drainage Analysis Soil drainage reflects the actual moisture content in excess of field capacity and the length of the saturation period within the plant root zone. Excess water content in the soil limits the free movement of oxygen and decreases the efficacy of nutrient uptake. Delays in spring tillage and planting are more likely to occur in depressional or imperfectly to poorly drained areas of individual fields. Surface drainage improvements and tile drainage are management practices that can potentially be used to manage excess moisture conditions in soils but should only be used if deemed appropriate for a site specific situation and only where regulations requirements can be met. Agriculture and Agri-Food Canada (AAFC) has classified soils for their drainage capacity using a five class system (see Appendix H). Analysis of the soil drainage shows that the vast majority, or approximately 88% (106,000 ha) of the study area, can be considered very poorly to imperfectly drained. These types of lands make up 66% (11,000 ha) of the 2006 annual cropland (Table 10). Most of the imperfectly drained soils that were annually cropped in 2006 are associated with the eastern portion of the watershed (refer to Figure 37). Improved drainage indicates areas where networks of surface drains can accelerate surface runoff that reduce the duration of surface ponding and provide greater flexibility to crop management. While these drains effectively move water off fields and decrease the amount of standing water in agricultural fields, other adverse effects need to be considered. The drains facilitate water moving off fields more quickly than under natural run off conditions resulting in river channels being filled to high water levels during heavy precipitation events. High water levels could lead to a flood or near-flood stage, thereby increasing the risk for water erosion or property damage. Also, man-made drainage systems tend not to have riparian buffers associated with them, unlike natural and undisturbed watercourses. With decreased or nonexisting riparian buffers, there is an increased risk of nutrient and sediment loading into watercourses, a critical water quality issue associated with Lake Winnipeg. Riparian areas and perennial vegetation on adjacent lands are able to trap and store sediment and nutrients from field runoff during the growing season, reducing the risk of contaminating surface water. Table 10: Soil Drainage Classes in the Willow Creek Watershed Drainage Class 1 Area (ha) 2006 Annual Cropland area (ha) 1. Soil Drainage is based on the dominant soil series for each soil polygon 2. Annual Cropland taken from the 2006 Land Cover (from Landsat Imagery) Distribution of 2006 Annual Cropland Annual Cropland (ha) to 2006 Change in Annual Cropland Area (ha) 4 Rapid 2, % Well 12,485 1,568 12% 1, Imperfect 65,792 7,953 62% 6,727 1,226 Poor (Improved) 5, % 1, Poor 2, % Very Poor 32, % Unclassified Water TOTAL 120,042 12, % 11,

50 Figure 37 - Soil Drainage with Respect to 2006 Annual Cropping in the Willow Creek Watershed Study Area 1 1. Soil drainage class is based on the dominant soil series for each soil polygon
51 G. Recent Federal and Provincial Policies and Programs Influencing Agricultural Land Use and Management i. Crown Land Management in the Willow Creek Watershed Area The majority of crown lands in the Willow Creek Watershed are located in the Rural Municipality of Armstrong (see Table 11). Crown Land statistics are currently captured on a municipal boundary basis. As such, the statistics shown below are based on the total amount of crown land within the municipalities including areas beyond the watershed. Although the information is not available on a watershed basis, it does provide a general indication of the use and management of crown lands within the Willow Creek portion of the watershed. The information presented in Table 11 and Table 12 is derived from two different datasets which results in minor discrepancies for the total amount of hectares of crown land within these two municipalities. Table 11 Crown Lands by Rural Municipality including those in the Willow Creek Watershed Study Area Rural Municipality Ha Percentage of crown land based on total amount of crown land in watershed Armstrong 28, Gimli TOTAL 29, A total of 29,131 ha is Crown Land in the Willow Creek Watershed and represents 25% of the total land base within the watershed (see Table 12). Of this 29,131 ha, approximately 15,165 ha are available for agricultural use through the Agricultural Crown Land leasing and permitting program (See Appendix J). Another 5,242 ha of land is managed by AESB s Community Pasture Program (see Figure 38). Table 12- Hectares as per MAFRI s Crown Land Use Coding MAFRI Crown Land Use Code Total Area (ha) Agricultural Use (Lease) 9,823 Agricultural Use (Yearly Permits) 5,342 Community Pastures (Managed by AESB) 5,242 No Agriculture Use (Wildife, Recreational) 8,528 Uncoded (No Agricultural Use) 208 Total 29,143 Crown land is subject to specific land use and management based on government acts, regulations and policies. More information regarding Crown Land Policy, Management, and regulation can be found in Appendix J. MAFRI administers agricultural use in accordance with provincial policy on approximately 1.6 million acres of leased Crown Land in Manitoba. This land
52 base, which is primarily utilized for forage production and rangeland, provides the annual feed requirements for approximately 20-25% of the provincial beef herd. Given that crown land accounts for approximately 25% of the land base in the watershed, one could assume that continued agricultural use on these crown lands is extremely important in sustaining annual feed requirements for the cow calf herd in the Willow Creek Watershed. Of the 98% of the crown land located in the Rural Municipality of Armstrong, approximately 485 parcels of land or 29,187 ha were utilized in 2009 for some form of agricultural production (such as long term forage lease or short term hay permit). (MAFRI, Land Use Planning Knowledge Centre)


53 Figure 38 - Crown Land Characterization Coding in the Willow Creek Watershed Area
54 ii. Management Considerations on Crown Lands a) Land Capability Classification Table 13 illustrates the agricultural land use capability of crown land in the Willow Creek Watershed. Approximately 61.5% of the total crown lands within the watershed are either Class 4 or Class 5 (see Figure 39, Table 13). These viable lower class lands are suitable for supporting the existing cow calf enterprises within the watershed and should be maintained in agricultural production through the crown land leasing system. There are opportunities to increase productivity of crown lands through the Crown Land Improvement Program (see Appendix J). Table 13 - Agricultural Capability of Crown lands in the Willow Creek Watershed Study Area * Agricultural Capability Total Area (ha.) Percentage of Crown Land Area Class Class 4-5 Class , Organic 5, Unclassified 4, Water 93 - TOTAL 27, * Table does not include other categories and reflects a smaller area of Crown lands in the watershed


55 Figure 39: Agricultural Capability of Crown Lands in the Willow Creek Watershed
56 b) Wooded Species Encroachment on Crown Lands As noted in Section E iii, there was an overall decrease of almost 12,000 ha of grassland between 1993 and This trend also occurs on crown lands with the watershed (see Table 14). Between 1993 and 2006, the largest increase took place on lands not available for agriculture use, while the lowest increase has taken place on lands identified for wildlife or recreational use. It would seem to indicate that lands with wildlife or recreational use have reached equilibrium in terms of wooded species encroachment, while lands available for long term agricultural use have the second lowest rate of increase. This would seem to indicate that a woody species regeneration has been slowed on these lands somewhat maintaining productivity. Wooded species encroachment is a function of management (e.g. grazing), weather (rainfall), drainage, by reduced cattle numbers, and by financial pressures in the industry. In general terms, the primary woody species encroaching on grassland tend to be poplar and willow. A number of key factors have played a role in the reduction of productivity on both crown and private lands within the Willow Creek Watershed including reduced grazing pressure and lower cattle numbers, as well as excessive moisture and poor drainage. Table 14: Change in grassland to trees on Crown Lands ( ) Generalized Operation Land Use Code Total Area (ha) Total Area which changed from grassland in 1993 to trees in 2006 % Change % Change/Yr Agricultural Use (Lease) 9,823 1, Agricultural Use (Yearly Permits) 5,342 1, Community Pastures (Managed by AESB) 5, No Agriculture Use (Wildife, Recreational) 8, Uncoded (No Agricultural Use) Total 29,143 4, It should be noted that the factors identified above have played a key role in reducing the overall productivity on crown lands within the watershed. Extension activities focusing on range management and your farmer entrance into the cow calf sector would help to address this loss of productivity
57 ii. Recent Federal-Provincial Programs Environmental Farm Planning and Canada-Manitoba Farm Stewardship Program - On- Farm Beneficial Management Practices Adoption In 2003, the Agricultural Policy Framework (APF) was launched as a new national approach to support agricultural activities associated with Business Risk Management, food safety and quality, science and innovation, environment, and skill development. In support of priorities related to soil, air, water and biodiversity, various environmental initiatives were introduced across Canada including Environmental Farm Planning and the National Farm Stewardship Program. Environmental Farm Planning (EFP) is awareness and planning tool used to enhance producers understanding of potential on-farm environmental risks and to develop action plans for how these risks can be addressed. Many producers in Manitoba, including those in the watershed, have participated in the EFP process to gain an improved understanding of the potential environmental risks associated with agriculture, as well as, those on their own farms. The EFP process also allowed producers to develop an action plan that outlines how potential risks on their farms can be addressed through the adoption of beneficial management practices (BMPs). Financial and technical support has been offered to producers wishing to adopt BMPs through the Canada Manitoba Farm Stewardship Program (CMFSP) between 2003 and This program offered 30 different BMPs to producers that had completed an EFP. (For a list and description of the BMPs see Appendix K). Participation in the Environmental Farm Plan Program is aggregated by municipalities in the study area (Appendix L). The information portrays the number of participants in the Environmental Farm Planning process based on where EFP workshops were held. Therefore it should be noted that participants may reside in the surrounding area and not necessarily in location of the workshop. Environmental Farm Planning Workshops were well attended, with a high degree of producers completing the process to receive a Statement of Completion for eligibility to BMP funding through the CMFSP. These numbers within the study area were at the Manitoba average as well, indicating that producers in the Willow watershed are proactive in nature and environmental issues are high on their priorities. In the Willow Creek Watershed study area there were a total of 30 BMP projects that were completed by producers (Table 11). All of these BMPs contribute to reducing risks to water quality. Of the 30 completed, 18 of the projects were categorized as Non Point Source Livestock Related BMPs. The top two BMPs adopted by producers in the study area through the CMFSP were Winter Site Management and Product and Waste Management. The adoption of BMPs by producers is not limited to those funded through the CMFSP. Other agencies like Conservation Districts, Ducks Unlimited Canada, and Manitoba Habitat Heritage Corporation also support the adoption of various BMPs. In addition, as indicated in the public consultation process for the IWMP, there have been many producers who have adopted BMPs on their own initiative, so it is difficult to determine precise adoption levels. However, considering the number of farms in the watershed, the CMFSP program data does suggest that producers in the watershed are progressive in terms of BMP adoption and that future conservation programs that may stem from IWMP implementation are likely to have considerable levels of participation in this region
58 Table 15: BMP Adoption through the Canada-Manitoba Farm Stewardship Program Willow Creek BMP Categories IWMP Point Source - Livestock Manure Related 1 0 Point Source - Other (Petroleum, Nutrients from Feed, Pesticides, etc.) 2 6 Non Point Source - Livestock Related 3 18 Non Point Source - Crop Related 4 <5 Non Point Source - Crop Related (Pesticides) 5 <5 Soil Erosion - Soils at Risk 6 <5 Biodiversity 7 <5 Total These include BMPs 1, 2, 4, 5, 6 2. These include BMPs 8, 9, These include BMPs 3, 7, 10, 26, These include BMPs 14, 18, 24, These include BMPs 16, 20, These include BMPs 11, 12, 13, 15, 19, These include BMPs 21, 22, 23, Refer to Appendix M for BMP descriptions
59 H. Agricultural Land Use and Management Recommendations* Watershed Issue Analysis Recommended Actions* Target Areas* Potential Indicators* Drinking Water)- Source Protection Public Agricultural impacts on groundwater quality. Agricultural activities and landscape characteristics that affect the risk of groundwater contamination (i.e. the potential for contaminants to leach into groundwater), either negatively or positively, in the watershed include: Soil Texture -10% of annual croplands are located on sandy soil, 8% on organic (Table 7, Page 43) Tillage Practices (a) conventional tillage continues to be the main tillage practice applied within the watershed. (Figure 23, Page 30) (b) Land management practices in the northern part of the watershed included almost 50% of the cultivated land prepared using conservation or zero tillage, while land management practices in the southern portion of the watershed included approximately 70% of the cultivated land prepared using conventional tillage practices (Figure 5, Page 15) Annual Cropping on Marginal Land - 44% of the annual cropland in the watershed is found on marginal lands, (class 4 and poorer) (Table 6, Page 41) Livestock Numbers - There are approximately 17,000 head of cattle reported in the watershed, or approximately 60 beef cows/farm reporting. This is considered small numbers for the watershed (Figure 7, Page 16) Perennial Cover Approximately 95,200 (78%) of land in the watershed was classified as trees, grassland/pasture or wetland in 2006 (Figure 12, Page 20). Approximately 1,400 hectares were subscribed to the Permanent Cover Program (between 1989 and 1992) and 200 hectares to the Green Cover Program (between 2003 and 2008). The amount of alfalfa grown in the watershed has increased significantly since 1971; from 4,300 hectares to 8,000 hectares in 2001 (an increase from 5% to 12% of the available farmland)(figure 18, Page 26). Approximately 4,900 ha has changed from wetlands, grassland/pasture, and trees in 1993 to annual cropland in 2006 (Figure 28, page 35). Groundwater Source Risk Assessment - Assessment of where vulnerabilities are with respect to public groundwater sources (i.e. groundwater risk areas like recharge areas, high water table areas and contamination sources in or near these areas). Groundwater Contamination Mitigation BMPs Provide professional assistance to producers for: Non-point Source BMPs such as: Improved nutrient and pesticide management Land conversion to perennial cover and wetland restoration Point Source BMPs such as: Fertilizer, manure, silage, pesticide, petroleum and waste storage improvements Improved management of livestock confinement areas (e.g. runoff control, wintering sites, facility relocation). High Risk Areas identified through groundwater source assessments (e.g. recharge areas, high water table areas, and identified potential contamination source areas). Source water quality results Areas in drinking source watersheds, specifically those: that are class 4 or lower under annual crop production where BMPs have been implemented on cropland of class 4 or lower Forested and wetland areas Contain grazing BMPs implemented in riparian areas Private Private water wells are the primary drinking source for the majority of farms in the watershed. Private Water Source Assessments Continue to promote private source assessments and action plans like those included in the environmental farm plan program. Entire watershed Number of well assessed and plans implemented on individual farms Point Source BMP Implementation - Continue to provide professional assistance to producers to upgrade or protect their well. * Specific approaches and opportunities related to recommended actions, including potential target areas and indicators; need to be explored further by the Project Management Team. Potential collaboration with partners and stakeholders should be considered Specific recommendations from the IWMP process must be forwarded to local councils for consideration within the Development Plan. These recommendations should take agricultural land management into consideration, for preservation of existing farm land and operations.
60 Watershed Issue Analysis Recommended Actions* Target Areas* Potential Indicators* Flooding/Drainage Influences on Water Management Parts of the watershed are vulnerable to flooding due to excess moisture and/or increased drainage. The following trends can have an influence on this issue: Farm Size- The average size of farms, in terms of area per farm, has increased steadily from about 180 ha to about 323 ha, an increase of approximately 79%. The amount of land farmed in the watershed has declined slightly from approximately 87,000 ha to 67,400 ha. (Figure 14, Page 23) Annual Cropping (a) Annual cropland has increased by approximately 1000 ha between 1993 and 2006 (Table 5, Page 33) (b) - Approximately 5,000 ha. has changed from annual cropland in the 2006 Landcover that were previously identified as wetlands, grassland/pasture, and trees in 1993 (Figure 28, page 35) Soil Drainage-Approximately 88% of the study area can be considered poor to imperfectly drained. These types of lands make up 64% of the 2006 annual cropland. Most of the imperfectly drained soils are found in the eastern portion of the watershed (Figure 37, Page50). Class 4 and Lower Agricultural Lands - Within the Willow Creek Watershed, approximately 82% of the land is classified as Class 4 and lower. The 2006 land cover data indicates that over 44% of annual cropland is located on land rated as Class 4 or lower. There has also been a steady increase in perennial cover in the watershed (e.g. improved pasture and alfalfa) since 1986 (Figure 33, Page 42) Tree Land Cover - Changes in land cover between 1993 and 2006 show an increase of 8,500 ha in forested areas, primarily in the headwater portion of the watershed (Table 5, Page33) Grassland - Approximately 5,000 ha. was changed from grassland in 1994 to annual cropland in 2006 (Figure 30, Page 37) Forages - Forage land cover had increase by approximately 4,700 ha. from 1993 to 2006 (Table 5, Page 33) Wetlands (a) Wetlands are common in the watershed (about 8%), especially in the western portion of the watershed ( Figure 32, Page 39) (b) The area covered by wetlands decreased by approximately 2400 hectares from wetland changes in the western portion of the watershed suggest that land changes were associated with marginal areas (trees, grassland, and water), most likely due to excess moisture (Table 5, Page 33) (c) Most of the changes from wetlands in 1993 to another land cover in 2006 were identified in the eastern half of the watershed. In this portion of the watershed, few wetlands were identified in the 2006 imagery, suggesting that land drainage may have contributed to this change (Figure 32, Page 39) Precipitation Levels- Four of the six weather stations recording total annual precipitation in the watershed that correspond to years of land cover imagery were noted to be above the 30 year averages (see Appendix P, Page 106) Timing of Land cover Imagery -Timing of Imagery and classification definitions may affect the number (i.e. a decrease or increase) of wetlands identified and should be verified with site specific analysis (ground truthing) Crown Lands Management- Approximately 45% of the agricultural crown lands have shown a change from grasslands to Forestry, possibly leading to greater likelihood of snowpack conditions, and possible overland flooding (Table 14, Page 56) Examine the needs for a water assessment and surface water management assessment study for the entire watershed. Point Specific BMP Implementation for Water Management - Promote and provide technical assistance for water management BMPs (e.g. riparian buffers, riffle structures, headwater storage options, and erosion control in key priority areas of the watershed. Watershed Approach to Water Management BMP Implementation - Promote and provide technical assistance for water management BMPs using whole watershed approach with consideration of upstream opportunities and downstream effects (e.g. perennial forage establishment, sustainable woodlot management, sustainable rotational grazing, riparian area management). Examine other Land Management Opportunities that provide value to landowners and contribute environmental benefits (e.g. wetlands or riparian buffers). Maintaining and improving of Crown Lands through control of woody species by mechanical and/or chemical means to stabilize and enhance local forage production for cow/calf producers in the Willow Creek Watershed. Areas in the watershed that are: Imperfectly drained soils and annual cropland headwater wetland areas to maintain a sustainable percentage of ephemeral type of wetlands on class 4 or higher lands that assist with wetland retention purposes Crown Lands under lease in watershed Proportion of watershed where: wetlands have changed (e.g. increase in sizes and/or numbers), the change of annual cropland hectares on imperfectly drained soils Is wetland, tree, grassland/pasture and forage land cover classes, BMPs have been implemented to manage flooding and/or restore wetlands Changes in surface water flows as identified through stream flow measurements. Ecosystem health of Crown Lands. Surface Water Quality Nutrient transport from agricultural land due to fertilizers and manure application. The following trends (or influences) affect this issue: Oilseeds, Spring Wheat - An increase in oilseed and spring wheat production may be leading to increased levels of nutrient application on cropland (Figure 17, Page 26) Manure Application Field area with applied manure has been steadily increasing (Figure 22, Page 29) Agricultural influence on source water areas in watershed- Activities on land may lead to the possibility of increased movement into the subsurface and impacting the groundwater supply. Specific influences may include: Annual Cropping (a) Annual cropland has increased by approximately 1000 ha between 1993 and 2006 (Table 5, Page 33) (b) - Approximately 5,000 ha. has changed from annual cropland in the 2006 Landcover that were previously identified as wetlands, grassland/pasture, and trees in 1993 (Figure 28, page 35) Soil Texture -10% of annual croplands are located on Sandy soil, 8% on organic (Table 7, Page 43) Tillage Practices (a) Conventional tillage continues to be the main tillage practice applied within the watershed. (Figure 23, Page 30) (b) Land management practices in the northern part of the watershed included almost 50% of the cultivated land prepared using conservation or zero tillage, while land management practices in the southern portion of the watershed included approximately 70% of the cultivated land prepared using conventional tillage practices (Figure 5, Page 15) Annual Cropland on marginal land - 44% of the annual cropland in the watershed is found on marginal lands (i.e. class 4 and poorer) in 2006 (Table 6, Page 40) Perennial Cover -There has also been a steady increase in the amount of perennial cover in the watershed (e.g. improved pasture and alfalfa) since 1986 (Figure 18, Page 26) Grasslands - There was an overall decrease of almost 12,000 ha of grassland in 2006, from 1993 (Table 5, Page 36). Livestock Numbers - There are approximately 17,000 head of cattle reported in the watershed, or approximately 60 beef cows per farm reporting (Figure 7, Page 16) Beef production -In both subwatersheds, land use for beef production dominates the farmland (pastures and seeded forage for hay) but in the South, it makes up a greater portion of the farmland than in the North (Figure 2, Page 13) Nutrient Losses from Agricultural Lands - Promote BMPs related to reducing nutrient transport to waterbodies (e.g. nutrient management plans, soil testing, manure testing, riparian area management and buffer strips) specify within point and non point. Areas near source water or waterways and are: In annual crop production and receive fertilizer or manure application Change in area of watershed that : have implemented BMPs to reduce nutrient losses from cropland (e.g. nutrient management plans, buffer strips, soil and manure testing) are forested or wetland areas have grazing BMPs implemented for the riparian areas Changes have been noted as reflected by positive source water quality testing results * Specific approaches and opportunities related to recommended actions, including potential target areas and indicators; need to be explored further by the Project Management Team. Potential collaboration with partners and stakeholders should be considered Specific recommendations from the IWMP process must be forwarded to local councils for consideration within the Development Plan. These recommendations should take agricultural land management into consideration, for preservation of existing farm land and operations
61 Watershed Issue Analysis Recommended Actions* Target Areas* Potential Indicators* Surface Water Quality (con t) Changing use and management of environmentally sensitive lands, such as natural forests and wetlands that provide valuable ecological services like clean water. The following influences or trends can affect this issue: Environmentally Sensitive Lands -Approximately 95,000 ha (78%) of land in the watershed that was classified as trees, grassland/pasture or wetland in 2006 could be considered vulnerable or environmentally sensitive (Figure 17, Page 31) Annual Cropping (a) Annual cropland has increased by approximately 1000 ha between 1993 and 2006 (Table 5, Page 33) (b) - Approximately 5,000 ha. has changed from annual cropland in the 2006 Landcover that were previously identified as wetlands, grassland/pasture, and trees in 1993 (Figure 28, page 35) Perennial Cover -There has been a steady increase in the amount of perennial cover in the watershed (e.g. improved pasture and alfalfa) since 1972 (Figure 18, page 26) Changes in Land Use- Local knowledge indicates that some of the privately owned agricultural land is no longer being cropped due to the number of farmers who have or are approaching retirement and/or due to landowners pursuing subdivision development (Figure 15, Page 24) Crown Lands - In the Willow Creek Watershed study area, there are approximately 29,100 hectares of Crown Lands, representing 25% of the total watershed (Figure 40, Page 60) Rented vs. Owned - The amount of farmland that is owned has decreased significantly since 1971, from approximately 56,000 hectares in 1971 to approximately 36,000 hectares in Rented lands, making up 45% of the total farm area in 2006, had modest growth to 1991 where it was almost equal to farm area owned. The 2006 area reported was almost the same level as was reported in 1991 (Figure 15, Page 24) Commercial Fertilizer- application of fertilizer has fluctuated each year with low application rates in 1971 with approximately 4,400 ha having commercial fertilizers applied to a high of approximately 14,000 ha in 1986 (Figure 23). With the exception of an increase from 2001 to 2006, there has been a steady decline since this peak, with about 12,000 ha of land receiving commercial fertilizer in 2006 (Figure 21, Page 28) Herbicide Use- Land with herbicide applied increased dramatically from 1971 (approx. 6,200 ha) to its peak in 1986 (approx. 11,200 ha), then declined to 2006 levels with approx. 11,000 ha receiving herbicides that year. (Figure 21, Page 28) Grasslands There was an overall decrease of almost 12,000 ha of grassland in 2006, from 1993 (Table 5, Page 36) Management of Environmentally Sensitive Lands - Explore options to utilize Narcisse Community Pasture for demonstration projects or extension activities for BMPS related to priority IWMP issues (surface water management, water quality, and/or wildlife habitat). These options would further the goals of the IWMP without contradicting the mandate of the Community Pasture Program. Non- Point Source BMP Implementation Water Management Landscape Approach i) Marginal Land Management - Promote the adoption of sustainable beneficial management practices where annual cropland is located on soils with agricultural capabilities of Class 4 and poorer, as well as, organic soils. Grazing management and agro- forestry BMPs should be implemented or promoted in environmentally sensitive areas (including riparian areas) that are not in annual cropland. Further ground truthing, prioritization and analysis should be undertaken to increase accuracy in identifying vulnerable or sensitive lands. Areas in the watershed that are: Narcisse Community Pasture and other wetlands or perennial cover (forest, grassland or pasture) near class 4 or higher land Successful two way extension activities between the watershed stakeholders and Community Pasture Erosion The following influences or trends may affect this issue: Water Erosion Risk-Soils and land cover data suggest there are no areas with a high water erosion risk and only some with moderate water erosion risk. (Figure 36, Page 48) Wind Erosion Risk-Approximately 10% of the Willow Creek Watershed is considered to have a high to severe wind erosion risk, primarily in the eastern portion of the watershed. Affected areas generally correspond to the portions of the study area with light textured soils. (Figure 35, Page 46) Soil Texture-10 % of annual croplands are located on sandy soil, 8% on organic (Table 7, Page 43) Alfalfa Production -The amount of alfalfa grown in the watershed has increased significantly since 1971; from 4,300 hectares to 8,000 hectares in 2001 ( an increase from 5% to 12% of the available farmland)(figure 18, Page 26). Perennial Cover -There has been a steady increase in the amount of perennial cover in the watershed (e.g. improved pasture and alfalfa) since 1972 (Figure 20, page 25) Oilseeds, Spring Wheat - The watershed saw an increase in oilseed and spring wheat production (Figure 17, Page 26) Annual Cropping (a) Annual cropland has increased by approximately 1000 ha between 1993 and 2006 (Table 5, Page 33) (b) - Approximately 5,000 ha. has changed from annual cropland in the 2006 Landcover that were previously identified as wetlands, grassland/pasture, and trees in 1993 (Figure 28, page 35) Annual Croplands on Marginal Lands-Marginal lands, class 4 and poorer have 44% of the annual cropland in the watershed (Table 6, page 40) Tree Land cover- Trees dominate the watershed 2006 Land Cover (40%) (Figure 32, page 39) Water Erosion Mitigation - Promote BMPs in prioritized water erosion risk areas (e.g. riparian buffer, and perennial cover establishment for the lower class of lands in severe or highly erosive areas). Wind Erosion Mitigation -. Promote BMPs, such as the use of cover crops and residue management techniques, and shelterbelt establishment where wind erosion is an issue. Areas in the watershed that are: in close proximity to waterways and in annual crop production and high risk of water erosion Annual cropped lands of class 4 and lower or coarse textured soils Proportion of the watershed that: Annual cropland hectares within 50 m of a water course have water erosion mitigation BMPs (e.g. cover crops, buffer strips, etc.) implemented BMP adoption within those critical areas or targeted areas; water quality results or report card larger waterways * Specific approaches and opportunities related to recommended actions, including potential target areas and indicators; need to be explored further by the Project Management Team. Potential collaboration with partners and stakeholders should be considered Specific recommendations from the IWMP process must be forwarded to local councils for consideration within the Development Plan. These recommendations should take agricultural land management into consideration, for preservation of existing farm land and operations
62 I. References: Agriculture and Agri-Food Canada BMP Fact Sheets, Canada-Manitoba Farm Stewardship Program Agriculture and Agri-Food Canada - Prairie Farm Rehabilitation Administration, Historical Perspective of Precipitation on the Prairies. Agriculture and Agri-Food Canada Prairie Farm Rehabilitation Administration, Regina, Saskatchewan. Agriculture and Agri-Food Canada - Prairie Farm Rehabilitation Administration, Prairies East Region Summary of Resources and Land Use Issues Related to Riparian Areas in the Willow Creek Watershed Study Area. Agriculture and Agri-Food Canada - Prairie Farm Rehabilitation Administration, Winnipeg. Coote, Eilers & Langman Agriculture Canada Wind Erosion Risk Maps Eilers, R.G., G.W. Lelyk, P. Cyer, and W.R. Fraser. Status of Agricultural Soil Resources of Manitoba; Summary of Applications and Interpretations of RMSID, (Rural Municipality Soil Information Data Base). Environment Canada, Canadian Climate Normals or Averages , Manitoba Agriculture Food and Rural Initiatives Seeded Acres Report for Watershed Region Manitoba Agriculture Yearbook Manitoba Conservation. 2001, Land Use/Land Cover Descriptions. Geomatics and Remote Sensing Branch
 -")
63 J. Appendices Appendix A: Diagram for Interpolating Census of Agriculture Data (Area Weighting Method)
64 Appendix B: Animal Unit Calculations Summary of Animal Unit coefficients used in Manitoba as compared to those used for calculations in this report 1. Assumptions are given in the following Table: Livestock Animal Units produced by one animal (MAFRI) Animal Unit coefficient used in report Dairy Milking Cows (including associated livestock) Beef Beef Cows, incl. associated livestock Backgrounder \ Summer pasture } Feedlot / Hogs Sows, farrow-to-finish Sows, farrow-to-weanling Sows, farrow-to-nursery Weanlings Grower/finishers Boars (artificial insemination operations) Chickens Broilers Roasters Layers Pullets Turkeys Broilers \ Heavy Toms } Heavy Hens / Horses (PMU) Mares, including associated livestock Sheep Ewes, including associated livestock Feeder Lambs Goats Bison Cow 1.00 \ Bull 1.00 } Calf 0.25 / Elk Cow 0.53 \ Bull 0.77 } Calf 0.05 / 1. An Animal Unit is defined as the number of livestock required to excrete 73 kg (160 lbs) of nitrogen in a 12-month period (as defined in the Farm Practices Guidelines for Poultry Producers in Manitoba)
65 Summary of assumptions made in calculating Animal Units1 from 2001 Agricultural Census Data Livestock Manitoba Animal Unit Category Census Category Assumptions Used for Animal Unit Calculations with census data Dairy Milking cows (including associated livestock) Dairy cows Assumed categories are equal. Beef cows Beef cows Assumed number of beef cows reported in 2001 Census equal cow/calf pairs Heifers and steers for Backgrounder Assumed steers and heifers reported in these census categories are split into Beef slaughter or feeding 1 yr Summer pasture the three categories (communication with MAFRI). Animal unit coefficient and older (combined Feedlot cattle determined using this ratio. categories) Sows, farrow to-weanling Sows Assumed there are no farrow-to-finish operations and no weanling operations Grower/finishers Grower and finisher pigs in Manitoba only farrow-to-weanling and grower/finisher operations. Pigs Chickens Turkeys Sheep Boars (artificial insemination operations) Broilers Boars Broilers and roasters Assumed all boars reported in the 2001Census are from artificial inseminations. Assumed all birds reported in the census category are broilers (communication with MAFRI). Layers Laying hens (19 weeks and older) Assumed categories are equal. Pullets Pullets (under 19 weeks) Assumed categories are equal. Broiler breeding hens Laying hens in hatcheries Assumed all laying hens in hatchery supply flocks reported in Manitoba are broiler breeder hens. Assumed turkeys represents 20% boilers, 40% heavy toms, 40% heavy hens Broiler, Heavy Toms, Heavy Turkeys (communication with MAFRI). Animal unit coefficient is determined using this Hens ratio. Ewes, including associated livestock Feeder lambs Ewes Lambs Horses Horses Total horses and ponies Bison Bison Bison Elk Elk Elk Goats Goats Goats Assumed ewe/lamb pairs (communication with MAFRI). Assumed no feeder lambs in province since numbers are very small and cannot be determined from census data (communication with MAFRI). Assumed each animal produces 1 Animal Unit PMU farms not identified in Census (communication with MAFRI). Assumed adults represent 85% and calves represent 15% of bison population in Manitoba (communication with MAFRI). Animal unit coefficient is determined using this ratio. Number of calves and sex of animals not identified in Census assumed 45% cows, 35% bulls and 20% calves (communication with MAFRI). Animal unit coefficient is determined using this ratio. Number of kids and sex of animals not identified in Census assumed 7 goats make up one Animal Unit, irregardless of age and sex. 1. One Animal Unit is defined as the number of livestock required to excrete 73 kg (160 lbs) of nitrogen in a 12-month period (as defined in the Farm Practices Guidelines for Poultry Producers in Manitoba)
66 Appendix C: Land Cover Time Frame, Classifications, and Constraints For the IWMP study area, imagery was available for the years of 1993, 2000, and most recently, Imagery was classified by the Manitoba Conservation - Manitoba Remote Sensing Centre into 16 unique land cover classes. To simplify the analysis, the 16 classes were aggregated into 7 basic land cover classes: annual cropland, forages, grasslands/pasture, trees, wetlands, water, and urban/transportation. The 1993 land cover used satellite imagery that was captured on May 14, Imagery for the 2000 land cover data was taken September 14, The 2006 land cover data utilized satellite imagery that was captured on September 9 th, Data Constraints It should be noted that the use of land cover data has limitations from a couple of perspectives. Weather patterns in years leading up to the imagery will impact the cover analysis and may be short term as opposed to a long term trend. Further, past image classifications were undertaken for specific purposes with standardization occurring between and as detailed below: Classification effort - the 1993 image classification concentrated specifically on annual cropland to aid in delivery of the Western Grains Transportation Payment Program. Greater attention was paid to all classification categories on the 2000 image classification. The classification of forages and forages/grasslands - As the land cover classifications could be difficult to interpret given the age of the forage stand and the reflectance of the satellite imagery for classification. With respect to the increased level of forages, some of the forage conversion trends may be explained through the adoption of Permanent Cover Program offered by Agriculture Canada in the early 1990s. A program summary for the Willow Creek Watershed study area could provide more insight toward understanding the forage trends and if they were indeed related to the Permanent Cover Program, however, the data could not be made available in time for this report. There is some indication from local contacts that the program uptake by producers was low for this watershed, however, without an actual program summary, it cannot be quantified. This information will be available for future reports or for this watershed at a later date. Classification Scheme: Land Cover Mapping of Manitoba 1. Annual crop land: Land that is normally cultivated on an annual basis. 2. Forage: Perennial forages, generally alfalfa or clover with blends of tame grasses. 3. Grassland: Areas of native or tame grasses, may contain scattered stands of trees 4. Trees: Lands that are primarily in tree cover 5. Wetlands: Areas that are wet, often with sedges, cattails, and rushes 6. Water Open water lakes, rivers, streams, ponds, and lagoons 7. Urban and Transportation: Towns, roads, railways, quarries


.")


67 Appendix D: Soil Information and Background Soils data within the watershed can be used to provide information on various soil characteristics as well as interpretative ratings such as agriculture capability, water and wind erosion risk. Used in conjunction with the land cover data from , observations about temporal land use trends can be made and used to explain any changes in land management practices. Soils data within Manitoba have been mapped at different scales of accuracy. In the Willow Creek study area, soils on the eastern shoreline of Lake Winnipeg in the Rural Municipalities of Gimili and St. Andrews and around the communities of Fraserwood and Komarno 1:20,000. (yellow area). The remaining area of the watershed was surveyed at more reconnaissance scale of 1:100,000 (orange area) (see figure below). Reconnaissance soils data is more suitable for broader landscape based analysis and regional planning purposes. This information is not suitable for the development of municipal development plans/zoning by-laws, agronomic assessment for irrigation and other site specific land use activities. Analysis of this nature requires more detailed soils information for assessments and management considerations. Soil information provided in this report is based on the characteristics of the dominant soil series within the various soils polygons
68 Appendix E: Canada Land Inventory System Land Classes Agricultural Capability for Manitoba Agriculture capability is a 7 class rating of mineral soils based on the severity of limitations for dryland farming. This system does not rate the productivity of the soil, but rather its capability to sustain agricultural crops based on limitations due to soil properties and landscape features and climate. This system is usually applied on a soil polygon basis and the individual soil series are assessed and maps portray the condition represented by the dominant soil in the polygon. Class 1 soils have no limitations, whereas Class 7 soils have such severe limitations that they are not suitable for agricultural purposes. In general, it takes about 2 acres (0.8 hectares) of Class 4 land to equal production from 1 acre (0.4 hectares) of prime (Class 1) land. (From Land: The Threatened Resource). Class 1: Soils in this class have no important limitations for crop use. The soils have level to nearly level topography; they are deep, well to imperfectly drained and have moderate water holding capacity. The soils are naturally well supplied with plant nutrients, easily maintained in good tilth and fertility; soils are moderately high to high in productivity for a wide range of cereal and special crops (field crops). Class 2: Soils in this class have moderate limitations that reduce the choice of crops or require moderate conservation practices. The soils have good water holding capacity and are either naturally well supplied with plant nutrients or are highly responsive to inputs of fertilizer. They are moderate to high in productivity for a fairly wide range of field crops. The limitations are not severe and good soil management and cropping practices can be applied without serious difficulty. Class 3: Soils in this class have moderate limitations that restrict the range of crops or require moderate conservation practices. The limitations in Class 3 are more severe than those in Class 2 and conservation practices are more difficult to apply and maintain. The limitations affect the timing and ease of tillage, planting and harvesting, the choice of crops and maintenance of conservation practices. Under good management, these soils are fair to moderate in productivity for a fairly wide range of field crops. Class 4: Soils in this class have significant limitations that restrict the choice of crops or require special conservation practices or both. These soils have such limitations that they are only suited for a few field crops, the yield for a range of crops may be low or the risk of crop failure is high. These soils are low to moderate in productivity for a narrow range of field crops but may have higher productivity for a specially adapted crop or perennial forage. Class 5: Soils in this class have severe limitations that restrict their capability to producing perennial forage crops and improvement practices are feasible. These soils have such serious
69 soil, climatic or other limitations that they are not capable of use for sustained production of annual field crops. However, they may be improved by the use of farm machinery for the production of native or tame species of perennial forage plants. Class 6: Soils in this class are capable only of producing perennial forage crops and improvement practices are not feasible. Class 6 soils have some natural sustained grazing capacity for farm animals, but have such serious soil, climatic or other limitations as to make impractical the application of improvement practices that can be carried out on Class 5 soils. Soils may be placed in this class because their physical nature prevents the use of farm machinery or because the soils are not responsive to improvement practices. Class 7: Soils in this class have no capability for arable culture or permanent pasture because of extremely severe limitations. Bodies of water too small to delineate on the map are included in this class. These soils may or may not have a high capability for forestry, wildlife and recreation. Agriculture capability subclasses identify the soil properties or landscape conditions that may limit use. A capital letter immediately following the class number identifies the limitation (eg. 2W, 3N, etc.). Subclasses: C - adverse climate (outside the boundaries of agro-manitoba) D - undesirable soil structure and/or low permeability E - erosion damage I - inundation (flooding) by streams and lakes M - moisture (droughtiness) or low water holding capacity N - salinity P - stoniness R - consolidated bedrock T - topography (slopes) W - excess water other than flooding (inadequate soil drainage or high water table) X - two or more minor limitations
70 Appendix F: Water Erosion Risk Water erosion information is available as part of the provincial soil survey data that has been compiled from reconnaissance (1:126,720 scale) and detailed (1:40,000 & 1:20,000 scale) soil survey reports. The Universal Soil Loss Equation (USLE) that was developed by Wischmeier and Smith (1965) was used to provide information on water erosion as part of the provincial soils data. The USLE provides a quantitative estimate on the amount of soil that is displaced due to water erosion (either tonne/ha or ton/ac) on an annual basis due to soil, climatic, landscape and management factors that influence the rate of erosion. The USLE can be written as: A = RKLSCP soil) Where: A = Predicted water erosion rate R = Erosivity of rainfall and snowmelt factor K = Soil erodibility factor L = Slope length factor S = Slope steepness factor C = Crop cover and management factor (set at assuming bare, unprotected P = Conservation practice factor (set at assuming no conservation practices) Due to limitations that are inherent in the model, the lack of the inclusion of conservation management practices and crop cover factors, the numbers that are generated from the USLE should not be used as a value for actual soil loss due to water erosion. However, the USLE is useful in comparing water erosion risk between soils based on their soil/landscape properties and climatic conditions. To accomplish this, the computed USLE values have been compiled into the following 5 group risk classes: N = Negligible L = Low M = Moderate H = High S = Severe < 2.7 ton/ac/yr (< 6 tonne/ha) ton/ac/yr (6 11 tonne/ha) ton/ac/yr (11 22 tonne/ha) ton/ac/yr (22 33 tonne/ha) > 14.7 ton/ac/yr (> 33 tonne/ha) By using the risk class groupings, soils can be compared on the basis of their soil physical properties, landscape and climate for resource analysis and targeting of soil conservation programming
71 Appendix G: Wind Erosion Risk Wind erosion information in Manitoba has been developed from the provincial soil survey data and the Soil Landscapes of Canada (SLC Ver 1.0). A geographic information system (GIS) was used to combine both spatial datasets, creating a derived product upon which wind erosion was calculated. The wind erosion model that is used for the Agriculture Canada Wind Erosion Risk Maps (1989) was applied to the derived dataset. The model was developed from the works of Chepil (1945, 1956) and Chepil and Woodruff (1963) and derives an index value E for wind erosion risk (Coote, Eilers & Langman, 1989). The model is stated as: E = kc(v * 2 γw 2 ) 1.5 Where: E = maximum instantaneous soil movement by wind (dimensionless) k = surface roughness and aggregation factor (dimensionless) C = factor representing soil; resistance to movement by wind (dimensionless) V * = drag velocity of wind at soil surface (cm s -1 ) γ = soil moisture shear resistance (dimensionless), a value of 5000 was used W = available moisture of the surface soil (m 3 water m -3 soil) For the analysis, the V * and W values were used from the Soil Landscapes of Canada series. These values are listed for each polygon in the Wind Erosion Risk publication. A listing of k and C values are also listed in the report and are based on soil surface texture. The values were entered into the database based on soil surface texture types taken from the provincial soil survey data. Following entering of values for K, C, W and calculating values for V *, the dimensionless wind erosion index values (E) were calculated for each polygon. These values were rated as per the rating system in the Wind Erosion Risk publication. Class E Value Negligible < 100 Low Moderate High Severe > 700 The ratings are for bare soil and do not consider land use and crop management factors. E values were calculated only for those soils within the seamless soil layer that had a mineral soil surface texture rating. Polygons that were rated as being organic soils, bare rock and water in either the seamless soil data or the SLC data did not have E values calculated. For those polygons that have secondary and/or tertiary soils listed within the map unit, a weighted calculation was done based on the percent of occurrence. If organic soils existed in any combination (primary, secondary, tertiary) with mineral soils, weightings were based on mineral soils only
72 Appendix H: Soil Drainage Classes Soil Drainage Class Very Poor Poor Imperfect Well Description Water is removed from the soil so slowly that the water table remains at or on the soil surface for the greater part of the time the soil is not frozen. Excess water is present in the soil throughout most of the year Water is removed so slowly in relation to supply that the soil remains wet for a large part of the time the soil is not frozen. Excess water is available within the soil for a large part of the time. Water is removed from the soil sufficiently slowly in relation to supply to keep the soil wet for a significant part of the growing season. Excess water moves slowly down the profile if precipitation is the major source Water is removed from the soil readily but not rapidly. Excess water flows downward readily into underlying materials or laterally as subsurface flow Rapid Water is removed from the soil rapidly in relation to supply. Excess water flows downward if underlying material is pervious. Subsurface flow may occur on steep slopes during heavy rainfall. Source: System of Soil Classification of Canada Canada-Manitoba Soil Survey Reports Drainage classification is based on the dominant soil series within each individual soil polygon
73 Appendix I: 2006 Census of Agriculture data Table 1: Agricultural Land Use types reported in the 2006 Census of Agriculture (hectares) Total Total Subwatershed Summerfallow Pasture*** Other* Farmland Cropland** North 36,815 16, ,738 6,702 South 42,923 14, ,667 8,759 *Other category includes all other land uses including farmyard, woodlots, Christmas trees, wetlands, etc. ** Total cropland includes all field crops, vegetables, fruit and nuts and sod *** Pasture includes tame pasture and natural areas used for pasture. Table 2: Distribution of crop types as reported in the 2006 Census of Agriculture (hectares) Subwatershed Forage Total Forage Cereals Oilseeds Pulse for Cropland* for hay seed Other** North 16,725 5,896 2, ,751 1, South 14,995 3,952 1, , x data has been suppressed by Statistics Canada to preserve confidentiality of the data * Total Cropland includes all field crops, vegetables, fruits and nuts, and sod ** Other category includes other special field crops, fruits and nuts, sod, vegetables, and all suppressed hectares in the listed categories Table 3: Total area treated with crop inputs for the 2005 cropping year, as reported in the 2006 Census of Agriculture (hectares) Subwatershed Use of Use of Use of Use of commercial Herbicides Insecticides Fungicides Fertilizers North 7,430 7, South 6,354 5, Table 4: Total dollars spent on crop inputs for the 2005 cropping year, as reported in the 2006 Census of Agriculture Total Total crop Total fertilizer herbicides, Subwatershed expenses and lime insecticides & Total seed fungicides North $1,818,968 $942,154 $603,762 $273,051 South $1,189,779 $589,797 $332,289 $267,693 Table 5: Tillage practices on areas prepared for seeding as reporting as a percentage of total cultivated land Subwatershed Tillage incorporating Tillage retaining No-till or zero-till most crop residue into most crop residue seeding the soil on the surface North 53% 16% 25% South 69% 12% 4%
74 Table 6: Total number of livestock and poultry on Census Day in 2006, as reported in the 2006 Census of Agriculture Dairy Total Total Subwatershed Total cattle Beef cows Sows cows Pigs Poultry North 8,458 3, ,964 South 9,319 4, x data has been suppressed by Statistics Canada to preserve confidentiality Table 7: Total number farms reporting livestock and poultry on Census Day in 2006, as reported in the 2006 Census of Agriculture Dairy Total Total Subwatershed Total cattle Beef cows Sows cows Pigs Poultry North South Table 8: Average number of livestock animals or poultry birds per farm on Census Day in 2006, as reported in the 2006 Census of Agriculture Dairy Total Total Subwatershed Total cattle Beef cows Sows cows Pigs Poultry North South x data has been suppressed by Statistics Canada to preserve confidentiality Table 9: Summary of Farm financial characteristics Subwatershed Number of Farms Average farm size (ha) Average Capital investment ($/farm) Average livestockrelated expenses ($/ha farmland)* Average crop-related expenses ($/ha farmland)* Estimated profit ($/farm)* North , ,007 South , ,245 * Calculations are based on the expenses for the 2005 calendar year, as reported in the 2006 Census of Agriculture
75 Appendix J: Private and Crown Land Planning in the Willow Creek Watershed Overview The Provincial Land Use Policies (PLUPs) outline Agriculture s interests of both private and crown land that is used for agriculture by maintaining this land as viable agricultural land, minimizing subdivision, and protecting farms from encroachment or other uses which may be incompatible with normal farming operations. Policy #1 of the Provincial Land Use Policies Regulation deals with General Development while Policy #2 deals with Agriculture. The objectives of policy #2 are to maintain a viable base of agricultural lands for present and future food production and agricultural diversification, and to protect economically viable agricultural operations. Provincial Land Use Policies These policies guide local and provincial authorities in preparing Development Plans and in making land use decisions. The PLUPS cover nine broad policy areas, of which Agriculture is one component. The other areas, besides agriculture, are General Development, Renewable Resources, Water and Shoreline, Recreational Resources, Natural Features and Heritage Resources, Flooding and Erosion, Provincial Highways, and Mineral Resources. The various government departments own their policies and are involved in establishing them. Development Plans The Development Plan is the agreement between the local and provincial governments on matters concerning land use. Once in place, all proposed development and land use changes must be evaluated under the policies of the development plan. This is where the policies governing the protection of prime agricultural land and agricultural operations are set out. The Provincial Land Use Policies are applied at the local level through the Development Plans, initiated by a municipality or planning district (group of municipalities). The purpose is to set out land use objectives and patterns or characteristics of development for an area. Through the Development Plan, lands are designated for certain uses such as agriculture, agriculture restricted, residential, industrial or commercial. Zoning By-Laws Regulating the Use of the Land: Following the approval of a development plan, a municipality must enact a zoning by-law that is consistent with their development plan. A municipal zoning by-law contains the rules and regulations that control development as it occurs. A zoning by-law further divides a municipality into various zones such as rural residential, highway-commercial and general agricultural. For example, an area that is designated as Agricultural in a development plan may be further zoned as Agricultural General and Agricultural Restricted, with both zones having separate criteria for agricultural development. The zoning by-law sets out requirements and criteria under which development may occur, including property site size, dimensions, separation distances and other siting criteria. It also specifies permitted and conditional uses within each zone. Planning -General Integrated watershed planning is a community based focused planning process around issues which effective water management. This planning needs to support the existing community framework for economic development and land use planning. In most cases, this means, integration of the IWMP into the existing Development Plan. The Development Plan is the local legal framework under the Provincial Land Use Policies
76 All of the municipalities included in the Willow Creek IWMP area have Development Plans which govern land use decisions including the protection and use of agricultural lands. Development of rural lands for non-agricultural use can impact watershed health, and may result in enhanced drainage above agricultural requirements. Because of this, the ability of the landscape to provide ecological goods and services such as the retention and filtering of water is impacted with development. Within a Development Plan, protecting agricultural land from non agricultural use may also mean protecting wetlands and tree cover, especially if the farmland is maintained for grazing purposes. For these reasons, having agricultural lands protected in a Development Plan will have benefits for the five issues (surface water quality, ground water quality, source water protection, soils and land use and habitat & wildlife) identified in the public consultations. There are 2 planning districts within the Willow Creek IWMP area: East Interlake Planning District (R.M. s of Gimli and Bifrost) Fisher Armstrong Planning District (R.M. s of Armstrong and Fisher) The following sections describe the framework for land use planning from a legal perspective, set out by the Provincial Government. Crown Land Management and Planning in the Willow Creek Watershed. Overview In 1930, responsibility for Crown Lands was transferred to the provincial government of Manitoba. Virtually all of Northern Manitoba, beyond the Department of Aboriginal and Northern Affairs boundary, is what they called unorganized territory'' and is also Crown land. Today, Manitoba s Crown Lands are used for varying purposes, including agriculture, mining, and cottages. Other areas are set aside for research, environmental protection, public recreation, and resource management. Approximately 95% of the province's forests sit within provincial Crown land. Operations The planning and classification of Crown land in agro-manitoba is the ultimate responsibility of the Crown Lands Assistant Deputy Minister s Committee (CLADMC), previously known as the Crown Land Classification Committee (CLCC). The CLCC was created in 1975 by the Premier of Manitoba for the specific purpose of Crown land use planning and resolution of land and resource use conflicts between departments of government. It is an interdepartmental committee with representation from Manitoba Agriculture, Food and Rural Initiatives (MAFRI), Conservation, Water Stewardship, Aboriginal and Northern Affairs, Science Technology Energy & Mines (STEM) and Intergovernmental Affairs (IAF). The committee reports to cabinet. The CLCC determined that to achieve its objectives, there was a need for on-the-ground planning and resource management expertise. This was obtained by creating local Block Planning Committees (BPC s), comprised of regional specialists from those departments on CLADMC. Eight BPCs were created in The BPC s meet every two months or as needed to discuss issues related to crown lands in their respective regions. Minutes are then forwarded to CLADMC for final approval. Multi-Use Concept The Provincial Crown Land Planning Process is strongly guided by the concept of multiple resource use whereby Crown Lands may be used by both competing and complementary users
77 Complementary use of Crown land requires special consideration be given to management in order to ensure that one resource use does not compromise the other. One such example is timber harvesting/livestock grazing, where a project initiated by MAFRI (Garland Project) is showing that proper management (of livestock grazing and forestry practices) can result in long term benefits to both resource users. The science and research from this project will be very beneficial in resolving a longstanding land use issue, and ultimately make more land available for complementary use. The information from this project will also assist private landowners in terms of managing their resources (e.g.; in instances where the land management objective is to enhance both forestry potential and livestock grazing). Management and Administration Management and administration of Crown land is shared by Manitoba Conservation, Manitoba Agriculture, Food and Rural Initiatives (MAFRI), Aboriginal and Northern Affairs and Manitoba Infrastructure and Transportation (MIT). The Crown Lands and Property Agency of MIT is responsible for the administration of Crown land, issues leases and permits upon the direction of MAFRI with regard to Crown lands classified for agricultural uses and issues leases and permits for all other Crown lands as directed by Manitoba Conservation. Manitoba Aboriginal and Northern Affairs maintains authority equivalent to that of local government for Crown land dispositions in the Northern Affairs area. Manitoba Agricultural Crown Lands Agricultural Crown Lands in Manitoba are managed and regulated by the Agriculture Crown Lands section of the Land Use Branch of Manitoba Agriculture, Food and Rural Initiatives. MAFRI issues agricultural leases and permits on those lands which are designated as primarily agricultural as well as multi-use lands which may be used for agricultural purposes on a secondary or interim use-basis, subject to specific conditions and covenants required by other resource users. The section also advertises available agricultural Crown lands for lease and ensures equitable allocation. The Crown Lands Improvement Program (CLIP) In the 70 s and early 80 s, the Province of Manitoba introduced the Crown Lands Improvement Program (CLIP) in an effort to provide farmers and ranchers with a better forage base. Under this program, the province provided financial report for clearing, breaking and seeding tame forage to Crown lands, relieving many clients from relying solely on lakeshores and meadows for hay and contributing to better animal health. The forage production capacity of the field is then reassessed on the lease according to soil type and it was the obligation of the lessee to maintain the developed field to produce tame forage at the rate specified until it was transferred or surrendered. When these lands are not maintained, productivity is reduced due to changes in species composition and poplar encroachment. When a lessee surrenders their lease on a CLIP field and has not maintained the CLIP development, they will be charged back the depreciated % loss and have to reimburse the province
78 Appendix K: Beneficial Management Practices offered under the Canada Manitoba Farm Stewardship Program NFSP System Development BMP Category Code/Practice Code Assignment NOTE 1: The units of measurement are: distance = kilometers (km), area = acres, volume = cubic meters (m3) NOTE 2: Funding is expressed as thousands of $ = K (eg. $4K = $4,000) BMP Category Code BMP Category Description BMP Practice Code 0101 BMP Practice Description increased storage to meet winter spreading restrictions (including satellite storage) BMP Practice Unit Type volume (m 3 ) Cost Share Caps 01 Improved Manure Storage and Handling 0102 improved features to prevent risks of water contamination (leaks, spills) N/A 0103 slurry storage covers to reduce odours and GHG emissions N/A 0104 containment systems for solid manure (includes covers) N/A 30% $30K 0105 assessment and monitoring of existing manure storage infrastructure N/A 0106 engineering design work (this practice code will stand alone if project does not proceed for economic, technical or environmental reasons (CEAA) N/A 0201 dewatering systems, nutrient recovery systems 02 Manure Treatment 0202 composting of manure 0203 anaerobic biodigestors N/A 30% $30K 0204 engineering design work (this practice code will stand alone if project does not proceed for economic, technical or environmental reasons (CEAA) 03 Manure Land Application 0301 specialized/modification to equipment for improved manure application N/A 30% $10K 04 In Barn Improvements 0401 more efficient livestock watering devices and cleanout systems to reduce water use and decrease manure volumes 0402 engineering design work (this practice code will stand alone if project does not proceed for economic, technical or environmental reasons (CEAA) N/A 30% $20K 05 Farmyard Runoff Control 0501 upstream diversion around farmyards ;downstream protection (eg. catch basins, retention ponds, constructed wetlands) N/A 50%
79 BMP Category Code BMP Category Description BMP Practice Code BMP Practice Description BMP Practice Unit Type Cost Share Caps 0502 construction of impermeable base and roof for minimizing runoff from livestock pen areas and confinement areas (feed bunks, water infrastructure, walls and electrical costs are not eligible) 0503 engineering design work (this practice code will stand alone if project does not proceed for economic, technical or environmental reasons (CEAA) 06 Relocation of Livestock Confinement and Horticultural Facilities relocation of livestock facilities such as corrals, paddocks and wintering sites away from riparian areas relocation of horticultural facilities such as greenhouses and container nurseries from riparian areas engineering design work (this practice code will stand alone if project does not proceed for economic, technical or environmental reasons (CEAA) N/A 50% $30K 0701 shelterbelt establishment # kms 0702 portable shelters and windbreaks # kms 07 Wintering Site Management 0703 alternative watering systems (ie: solar, wind or grid power) N/A 50% $15K 0704 field access improvements: alleyway/access lane upgrades # kms 0705 fence modifications # kms 0801 improved on-farm storage and handling of agricultural products (eg. fertilizer, silage, petroleum products, and pesticides) 08 Product and Waste Management improved on-farm storage, handling, and disposal of agricultural waste (eg. livestock mortalities, fruit and vegetable cull piles, wood waste) composting of agricultural waste (eg. Livestock mortalities fruit, vegetable, wood, straw residue) N/A 30% $15K 0804 engineering design work (this practice code will stand alone if project does not proceed for economic, technical or environmental reasons (CEAA) sealing & capping old water wells Water Well Management 0902 protecting existing water wells from surface contamination N/A 50% $6K
80 BMP Category Code BMP Category Description BMP Practice Code BMP Practice Description BMP Practice Unit Type Cost Share Caps 1001 alternative watering systems (ie: solar, wind or grid power)to manage livestock: N/A Riparian Area Management (GREENCOVER) Riparian Area Management (GREENCOVER) 1002 buffer establishment and planting of forages (planting and establishment costs for trees and shrubs for the year of planting and one year after the planting year, or the termination of the NFSP funding, whichever comes first) # acres 1003 fencing to manage grazing and improve riparian condition/function # kms 1004 native rangeland restoration or establishment: native species of forages, shrubs, and trees # acres 50% $20K 1005 grazing management in surrounding uplands: alternative watering systems (ie: solar, wind or grid power) and cross fencing # kms offence 1006 improved stream crossings N/A 11 Erosion Control Structures(Riparian) (GREENCOVER) constructed works in riparian areas: contour terraces, gully stabilization, bank stabilization, erosion control matting, silt fencing, drop inlet and enhanced infiltration systems, in-channel control, retention ponds and erosion control dams engineering design work (this practice code will stand alone if project does not proceed for economic, technical or environmental reasons (CEAA) N/A 50% $20K 12 Erosion Control Structures(Non Riparian) constructed works in non riparian areas: contour terraces, gully stabilization, bank stabilization, erosion control matting, silt fencing, drop inlet systems and enhanced infiltration systems, in-channel control, retention ponds and erosion control dams, mechanical wind screens engineering design work (this practice code will stand alone if project does not proceed for economic, technical or environmental reasons (CEAA) N/A 50% $20K 1301 forage or annual barrier establishment for soils at risk (eg. stripcropping, grassed waterways, perennial forages on severely erodible or saline soils) # acres 13 Land Management for Soils at Risk 1302 straw mulching # acres 1303 grazing management in critical erosion areas not associated with riparian zones: alternative watering systems (ie: solar, wind or grid power), crossfencing # kms offence 50% $5K
81 BMP Category Code BMP Category Description BMP Practice Code BMP Practice Description BMP Practice Unit Type Cost Share Caps 1401 equipment modification on pre-seeding implements for restricted zone tillage for row crops, seeding and post seeding implements for low disturbance placement of seed and fertilizer 14 Improved Cropping Systems 1402 chaff collectors and chaff spreaders installed on combines N/A 30% $15K 1403 precision farming applications: GPS information collection, GPS guidance (ie: autosteer, lightbars, software), manual and variable rate controllers for variable fertilizer application 15 Cover Crops 1501 establishment of non-economic cover crop # acres 1502 equipment modification for inter row seeding of cover crops (eg. relay crops) N/A 30% $5K 1601 equipment modification for improved application 1602 information collection and monitoring 16 Improved Pest Management 1603 biological control agents N/A 30% $5K 1604 cultural control practices 1605 mobile water tanks 17 Nutrient Recovery from Waste Water recycling of waste water streams from milkhouses, fruit and vegetable washing facilities, and greenhouses in order to recover nutrients engineering design work (this practice code will stand alone if project does not proceed for economic, technical or environmental reasons (CEAA) N/A 30% $20K 18 Irrigation Management 1801 irrigation equipment modification/improvement to increase water or nutrient use efficiency 1802 equipment to prevent backflow of altered irrigation water into water sources N/A 30% $10K 1803 improved infiltration galleries and irrigation intake systems
82 BMP Category Code 19 BMP Category Description Shelterbelt Establishment (GREENCOVER) BMP Practice Code 1901 BMP Practice Description establishment of shelterbelts for farmyard, live stock facilities, dugout snowtrap, wildlife habitat enhancement, field (planting and establishment costs for trees and shrubs for the year of planting and one year after the planting year, or the termination of the NFSP funding, whichever comes first) BMP Practice Unit Type # kms Cost Share Caps 50% $10K 1902 tree materials required for shelterbelt establishment N/A 20 Invasive Alien Plant Species Control 2001 integrated approaches (cultural, mechanical, and biological) for control of invasive plant species (eg. leafy spurge, purple loosestrife, scentless chamomile) N/A 50% $5K 2101 buffer strips: native vegetation # acres Enhancing Wildlife Habitat and Biodiversity 2102 alternative watering systems (ie: solar, wind or grid power) N/A 2103 improved grazing systems: crossfencing # kms wildlife shelterbelt establishment # kms 50% $10K 21 Enhancing Wildlife Habitat and Biodiversity 2105 improved stream crossings N/A 2106 hayland management to enhance wildlife survival N/A 2107 wetland restoration acres 2201 alternative watering systems (ie: solar, wind or grid power) N/A 22 Species at Risk 2202 improved grazing systems: crossfencing # kms 2203 plant species establishment # acres 50% $10K 2204 infrastructure development and relocation N/A 23 Preventing Wildlife Damage 2301 forage buffer strips # acres 2302 fencing or netting to protect stored feed, concentrated livestock, high value crops, drip irrigation systems, and other ag. activities # km offence 2303 scaring and repellant systems and devices N/A 30% $10K
83 BMP Category Code BMP Category Description 24 Nutrient Management Planning BMP Practice Code BMP Practice Description 2401 consultative services to develop nutrient management plans, planning and decision support tools BMP Practice Unit Type Cost Share Caps # acres 50% $4K 25 Integrated Pest Management Planning 2501 consultative services to develop integrated pest management plans, planning and decision support tools # acres 50% $2K 26 Grazing Management Planning (GREENCOVER) 2601 consultative services to develop range and grazing management plans, planning and decision support tools # acres 50% $2K 27 Soil Erosion and Salinity Control Planning 2701 consultative services to develop soil erosion and salinity control plans, planning and decision support tools # acres 50% $2K 28 Biodiversity Enhancement Planning 2801 consultative services to plan habitat enhancement, wetland restoration, stewardship for species at risk and/or wildlife damage prevention within agricultural land base; planning and decision support tools # acres 50% $2K 29 Irrigation Management Planning 2901 consultative services for planning improved water use efficiency and reduced environmental risk of existing irrigation systems, planning and decision support tools # acres 50% $2K 30 Riparian Health Assessment (GREENCOVER) 3001 consultative services for assessing riparian health, planning and decision support tools # acres 50% $2K

84 Appendix L: Environmental Farm Plan Workshops and EFP Statement of Completions in Manitoba
Agricultural Land Use and Management in the West Souris River Watershed
 Agricultural Land Use and Management in the West Souris River Watershed Submitted by Agriculture and Agri-Food Canada Agri-Environment Services Branch (AESB) and Manitoba Agriculture Food and Rural Initiatives
Agricultural Land Use and Management in the Central Assiniboine and Lower Souris River Watershed
 Agricultural Land Use and Management in the Central Assiniboine and Lower Souris River Watershed Submitted by Agriculture and Agri-Food Canada Agri-Environment Services Branch (AESB) and Manitoba Agriculture
An Overview of Agriculture in the Rural Municipalities of the Lower Souris River Watershed. Dana Harper Jim Unterschultz Scott Jeffrey
 RURAL ECONOMY An Overview of Agriculture in the Rural Municipalities of the Lower Souris River Watershed Dana Harper Jim Unterschultz Scott Jeffrey Project Report #8-3 Project Report Department of Rural
AGRICULTURE Statistics
 Agriculture Statistics Index: http://www.gov.mb.ca/agriculture/market-pricesand-statistics/index.html AGRICULTURE Statistics MANITOBA CROP HIGHLIGHTS 2016 CENSUS OF AGRICULTURE Farm Area: Total farm area
STATISTICAL PROFILE OF HALIFAX AND HANTS COUNTIES. Prepared By: Nova Scotia Federation of Agriculture
 STATISTICAL PROFILE OF HALIFAX AND HANTS COUNTIES Prepared By: Nova Scotia Federation of Agriculture 1.0 Introduction Agriculture in the Local Economy Agriculture in Halifax and Counties are characterized
Saskatchewan remains the breadbasket of Canada
 Catalogue no. 95-640-X Saskatchewan remains the breadbasket of Canada Release date: May 10, 2017 How to obtain more information For information about this product or the wide range of services and data
Canadian Forage and Grassland Association s Strategy for the Future
 Canadian Forage and Grassland Association s Strategy for the Future The Canadian Forage and Grassland Association is a national, non-profit association supported by stakeholders in the forage and grassland
STATISTICAL PROFILE OF COLCHESTER COUNTY. Prepared By: Nova Scotia Federation of Agriculture
 STATISTICAL PROFILE OF COLCHESTER COUNTY Prepared By: Nova Scotia Federation of Agriculture 1.0 Introduction Agriculture in the Local Economy Agriculture in County is characterized by a diversity of farm
New Brunswick Census of Agriculture Graphs October 2017
 New Brunswick Census of Agriculture Graphs 216 October 217 New Brunswick Census of Agriculture Report 216 Province of New Brunswick P.O. Box 6, Fredericton NB E3B 5H1 CANADA www.gnb.ca Printed English
15. Soil Salinity SUMMARY THE ISSUE
 15. Soil Salinity AUTHORS: B.H. Wiebe, R.G. Eilers, W.D. Eilers and J.A. Brierley INDICATOR NAME: Risk of Soil Salinization STATUS: Provincial coverage (AB, SK, MB), 1981 to 2001 SUMMARY At very low levels,
Agriculture in the Great Lakes Basin Stewardship and Innovation
 Agriculture in the Great Lakes Basin Stewardship and Innovation November 2008 AGRICULTURE IS IMPORTANT IN THE GREAT LAKES BASIN The Great Lakes Basin provides 20 per cent of the world s fresh surface water,
Overview of livestock farm operating expenses
 Catalogue no. 96 32 X No. 008 ISSN 0-662-369-4 Canadian Agriculture at a Glance Overview of livestock farm operating expenses by Jean-Mathieu Lachapelle Release date: October 28, 2014 How to obtain more
AGRICULTURAL OVERVIEW
 Regional District of Central Okanagan CONTENTS Corporate Name Date of Incorporation August 24, 1967 Postal Address 1450 KLO Road, Kelowna, BC, V1W 3Z4 Phone (250) 763-4918 Fax (250) 763-0606 E-mail Internet
Growing Crops for Biofuels Has Spillover Effects
 Growing Crops for Biofuels Has Spillover Effects VOLUME 7 ISSUE 1 Scott Malcolm smalcolm@ers.usda.gov 10 Marcel Aillery maillery@ers.usda.gov Federal mandates for biofuel production promote expanded crop
Resource Conserving Crop Rotation & Alternative Livestock Watering System
 Ken Teske Pottawatomie County Resource Conserving Crop Rotation & Alternative Livestock Watering System Cooperator: Ken Teske 19900 Golden Belt Road Onaga, Ks. 66521 Water Quality Concerns: Run-off of
GLASI GLASI. Priority Subwatershed Project. Great Lakes Agricultural Stewardship Initiative
 GLASI GLASI Great Lakes Agricultural Stewardship Initiative Priority Subwatershed Project Wigle Creek Priority Subwatershed Project Essex Region Conservation Authority Up to $75,000 per eligible farm business
Integrating Agricultural Land Management into a Watershed Response Model
 Integrating Agricultural Land Management into a Watershed Response Model Adam Freihoefer, Tom Beneke, & Aaron Ruesch Wisconsin Department of Natural Resources NCASI Northern Region Meeting May 6, 2014
International Research and Development. Designing a Crop Rotation Plan with Farmers
 International Research and Development Designing a Crop Rotation Plan with Farmers University of Agriculture, Faisalabad, June, 2011 Definition A system of farming in which a regular succession of different
A Decade of Change in Texas Agriculture Highlights and Trends from the Census of Agriculture
 E-590 10/09 A Decade of Change in Texas Agriculture Highlights and Trends from the Census of Agriculture A Decade of Change in Texas Agriculture Highlights and Trends from the Census of Agriculture Authors
24. Wildlife Habitat on Farmland
 24. Wildlife Habitat on Farmland AUTHORS: S.K. Javorek, R. Antonowitsch, C. Callaghan, M. Grant and T. Weins INDICATOR NAME: Wildlife Habitat on Farmland Indicator STATUS: National coverage, 1981 to 2001
Watercourses and Wetlands and Agricultural Activities
 Watercourses and Wetlands and Agricultural Activities Watercourses and regulated wetlands can be found throughout New Brunswick, including on agricultural lands. The Clean Water Act defines a watercourse
Commentary on Results
 Commentary on Results Number of farms In 2010, there were 139,860 farms in Ireland. This compares to a total of 141,527 farms in 2000. Therefore, the total number of farms decreased by less than 2,000
USC BMP Definitions - Agricultural Best Management Practices (including NEIEN Code Id)
") USC BMP Definitions - Agricultural Best Management Practices (including NEIEN Code Id) Animal Waste Management Systems or Waste Storage Facility (840, 23) Practices designed for proper handling, storage,
USC BMP Definitions - Agricultural Best Management Practices (including NEIEN Code Id) Animal Waste Management Systems or Waste Storage Facility (840, 23) Practices designed for proper handling, storage,
Report by Greg Dejong, Organic Alberta, September 2018
 ORGANIC AGRICULTURE IN ALBERTA 2017 Statistics Report by Greg Dejong, Organic Alberta, September 2018 TABLE OF CONTENTS EXECUTIVE SUMMARY 02 Methodology 03 Regions 04 ORGANIC OPERATIONS IN ALBERTA 05 Cereal
The environmental impact of agricultural trade liberalization in Canada
 The environmental impact of agricultural trade liberalization in Canada Valeria C. Castellanos-Hurtado Faculty of Land and Food Systems The University of British Columbia 1. Motivation 2. Risk of nitrogen
SECTION 5. ENVIRONMENTAL TRENDS and ISSUES
 SECTION 5 ENVIRONMENTAL TRENDS and ISSUES Project Coordinated By: This Section Prepared by: - With input from Planscape 5.1 Introduction As an inherent component of the rural landscape in the Golden Horseshoe
Lowland cattle and sheep farms, under 100 hectares
 GROSS OUTPUT, VARIABLE COSTS AND FARM GROSS MARGIN, 2003/2004 Output Milk 0 0 Milk quota leasing, milk levy and compensation 0 0 Cattle 280 415 Herd depreciation -1 8 Cattle subsidies 135 211 Sheep 127
Intensive Livestock Farming: Does Farm Size Matter?
 Statistics Canada Agriculture Division Agriculture and Rural Working Paper Series Working Paper No. 48 Intensive Livestock Farming: Does Farm Size Matter? Prepared by Martin S. Beaulieu, MSc, Analyst Analysis
SDA cattle and sheep farms, 120 hectares and over
 GROSS OUTPUT, VARIABLE COSTS AND FARM GROSS MARGIN, 2003/2004 Output Milk 0 0 Milk quota leasing, milk levy and compensation 0 0 Cattle 138 160 Herd depreciation -12-16 Cattle subsidies 92 101 Sheep 131
Economic Analysis of Vegetative Buffer Zone Beneficial Management Practices (BMPs) for a Mixed Farm Operation in the Lower Little Bow Watershed
 for a Mixed Farm Operation in the Lower Little Bow Watershed") RESOURCE ECONOMICS AND ENVIRONMENTAL SOCIOLOGY Economic Analysis of Vegetative Buffer Zone Beneficial Management Practices (BMPs) for a Mixed Farm Operation in the Lower Little Bow Watershed Jun Yang,
RESOURCE ECONOMICS AND ENVIRONMENTAL SOCIOLOGY Economic Analysis of Vegetative Buffer Zone Beneficial Management Practices (BMPs) for a Mixed Farm Operation in the Lower Little Bow Watershed Jun Yang,
Agricultural. Credit Conditions. Farmland Markets Show Signs of Cooling. SURVEY of TENTH DISTRICT
 SURVEY of TENTH DISTRICT Agricultural Credit Conditions S4 et hp tqeuma rb te err 22 00 1 30 FF ee dd ee rraall RReesseerrvvee BBa annk k o of f KKa an ns sa as s C Ci ti ty y Farmland Markets Show Signs
WILLOW CREEK INTEGRATEDWATERSHEDMANAGEMENTPLAN DRAFT
 WILLOW CREEK INTEGRATEDWATERSHEDMANAGEMENTPLAN DRAFT table of contents Executive Summary page 01 Introduction page 02 Key Players page 02 willow creek Watershed page 03 Watershed PRIORITIES page 05 PRIORITY
2010 Washington County Appraisal District. 1-D-1 Agricultural Use Guidelines
 2010 Washington County Appraisal District 1-D-1 Agricultural Use Guidelines A SUPPLEMENT TO THE STATE OF TEXAS PROPERTY TAX MANUAL FOR THE APPRAISAL OF AGRICULTURAL LAND These guidelines are general in
Fayette County Appraisal District
 Fayette County Appraisal District Agricultural Guidelines 2017 A SUPPLEMENT TO THE STATE OF TEXAS PROPERTY TAX MANUAL FOR THE APPRAISAL OF AGRICULTUAL LAND AND WILDLIFE MANAGEMENT ACTIVITIES AND PRACTICES
Fayette County Appraisal District
 Fayette County Appraisal District Agricultural Guidelines 2016 A SUPPLEMENT TO THE STATE OF TEXAS PROPERTY TAX MANUAL FOR THE APPRAISAL OF AGRICULTUAL LAND AND WILDLIFE MANAGEMENT ACTIVITIES AND PRACTICES
Manure Management Facts Managing Manure within Tillage Systems and Crop Rotations
 Manure Management Facts Managing Manure within Tillage Systems and Crop Rotations January 2009 Introduction Manure is a valuable source of nutrients for crop production. Most crop rotations can be designed
ON-FARM CONSERVATION: Resource Inventory Checklist
 ON-FARM CONSERVATION: Resource Inventory Checklist The Resource Inventory Checklist focuses on current agricultural land use, farm infrastructure and natural resources. This worksheet will help you assess
Australian Beef Financial performance of beef farms, to
 Australian Beef Financial performance of beef farms, 2014 15 to 2016 17 Jeremy van Dijk, James Frilay and Dale Ashton Research by the Australian Bureau of Agricultural and Resource Economics and Sciences
Introduction Assignment
 Sustainable Resources 12: Agriculture Introduction Assignment Student Name Student No. Address Date Postal Code Based on the instructions provided by your school, complete the following Sustainable Resources
Agri-Environment Services Branch (AESB)
") Agri-Environment Services Branch (AESB) competitive agriculture & agri-food sector healthy environment Agriculture Economy Environment agriculture and agri-food sector is a key contributor to Canada s
Agri-Environment Services Branch (AESB) competitive agriculture & agri-food sector healthy environment Agriculture Economy Environment agriculture and agri-food sector is a key contributor to Canada s
Enterprise Budgeting... 1 Crop Inputs Introduction... 46
 Contents Enterprise Budgeting... 1 Crop Inputs... 3 Introduction... 4 Fertiliser... 4 Lime... 4 Slurry and Manure... 4 Nutrient Planning... 6 Residual Values of Fertilisers, Manures and Lime... 8 Pesticide
ON-FARM CONSERVATION: Resource Inventory Checklist
 ON-FARM CONSERVATION: Resource Inventory Checklist The Resource Inventory Checklist focuses on current agricultural land use, farm infrastructure and natural resources. This worksheet will help you assess
ON-FARM CONSERVATION: RESOURCE INVENTORY CHECKLIST
 ON-FARM CONSERVATION: RESOURCE INVENTORY CHECKLIST American Farmland Trust s Farmland Information Center holds a collection of resources specifically created to help landowners navigate common issues including
GRowing Outcomes in Watersheds (GROW) A home-grown ecological goods and services program for Manitoba
 A home-grown ecological goods and services program for Manitoba") GRowing Outcomes in Watersheds (GROW) A home-grown ecological goods and services program for Manitoba PUBLIC CONSULTATION DOCUMENT AUGUST 2017 MINISTERS MESSAGE Dear Manitobans, Manitoba s agriculture
GRowing Outcomes in Watersheds (GROW) A home-grown ecological goods and services program for Manitoba PUBLIC CONSULTATION DOCUMENT AUGUST 2017 MINISTERS MESSAGE Dear Manitobans, Manitoba s agriculture
ON-FARM CONSERVATION: Resource Inventory Checklist
 ON-FARM CONSERVATION: Resource Inventory Checklist The Resource Inventory Checklist focuses on current agricultural land use, farm infrastructure and natural resources. This worksheet will help you assess
Candia Agricultural Survey Proposed Approach
 Candia Agricultural Survey Proposed Approach 1. Set up a survey with questions (below). Have a paper version and SurveyMonkey or other on-line tool for the survey. 2. Start the list with current members
Contents of the 2018 (48 th ) Edition
 Edition") Contents of the 2018 (48 th ) Edition Published September 2017 CONTENTS I. GENERAL 1 PAGE 1. The Use of Gross Margins 1 2. Complete Enterprise Costings 2 3. Farm Business Survey Data 3 4. Main Assumptions
Contents of the 2018 (48 th ) Edition Published September 2017 CONTENTS I. GENERAL 1 PAGE 1. The Use of Gross Margins 1 2. Complete Enterprise Costings 2 3. Farm Business Survey Data 3 4. Main Assumptions
1. GENERAL DESCRIPTION OF LAND USE / COVER TYPES (SEE GENERAL DESCRIPTIONS ON PAGE 7) A 2. ADJACENT LANDS & EASEMENTS 3. FAMILY AGRICULTURAL LEGACY
 A 2. ADJACENT LANDS & EASEMENTS 3. FAMILY AGRICULTURAL LEGACY") CONSERVATION EASEMENT PROJECT: COUNTY: NAME OF LANDOWNER: CELL/OFFICE PHONE: NAME OF FARM / SITE MANAGER: CELL/OFFICE PHONE: GENERAL DESCRIPTION OF LAND USE / COVER TYPES (SEE GENERAL DESCRIPTIONS ON PAGE
CONSERVATION EASEMENT PROJECT: COUNTY: NAME OF LANDOWNER: CELL/OFFICE PHONE: NAME OF FARM / SITE MANAGER: CELL/OFFICE PHONE: GENERAL DESCRIPTION OF LAND USE / COVER TYPES (SEE GENERAL DESCRIPTIONS ON PAGE
December 2012 SASKATCHEWAN MINISTRY OF AGRICULTURE LAND LEASE SURVEY
 December 2012 SASKATCHEWAN MINISTRY OF AGRICULTURE LAND LEASE SURVEY Report compiled by Insightrix Research Inc. 1 3223 Millar Ave. Saskatoon, Saskatchewan T: 1-866-888-5640 F: 1-306-384-5655 Executive
Developing Ontario s Agricultural Soil Health and Conservation Strategy
 Developing Ontario s Agricultural Soil Health and Conservation Strategy Ontario Ministry of Agriculture, Food and Rural Affairs January 2017 Outline Provide background on development of a soil strategy
AGRICULTURAL ELEMENT. September Chisago County Comprehensive Plan
 AGRICULTURAL ELEMENT September 2017 Chisago County Comprehensive Plan 2017 Agriculture Chisago County has been an agricultural area since its permanent settlement by immigrants in the mid and late 1800
Role of Soils in Water Quality. Mike Marshall Extension Associate Texas A&M-Institute of Renewable Natural Resources
 Role of Soils in Water Quality Mike Marshall Extension Associate Texas A&M-Institute of Renewable Natural Resources Water Quality in Texas Water is a finite resource that can be impaired by pollution from
AGRICULTURAL & APPLIED ECONOMICS
 University of Wisconsin-Madison February 2001 Staff Paper No. 439 A Study of Costs of Compliance Related to Non-Point Pollution: Rules for Wisconsin Crop Producers By T. Randall Fortenbery AGRICULTURAL
WATERSHED. Maitland Valley. Report Card 201
 Maitland Valley WATERSHED Report Card 201 The Maitland Valley Conservation Authority has prepared this report card as a summary on the state of our forests, wetlands, surface water, and ground water resources.
Forage, feed and supplements, Forages Hay and Processed Forage
 Alberta Forages High quality forages and feed are essential for Alberta's livestock industries. Their use results in the production of high quality meat, fish and dairy products. Forage, feed and supplements,
National Forage and Grassland Assessment
 National Forage and Grassland Assessment Report Prepared by: Douglas Yungblut, Ph.D., P.Ag. Yungblut & Associates Inc. Final Report June, 2012 Table of Contents 1. EXECUTIVE SUMMARY... 2 2. INTRODUCTION...
Forage implications on Cow/calf Cost of Production
 Forage implications on Cow/calf Cost of Production Canadian Forage & Grassland Association November 2016 The Beef Cattle industry is a major user of Canadian forages 80% of a beef animals diet over its
How Will Farmers Respond to High Fuel and Fertilizer Prices?
 How Will Farmers Respond to High Fuel and Fertilizer Prices? Damona Doye Regents Professor and Extension Economist Oklahoma State University Value of production by commodity Cattle and calves Poultry &
Teagasc National Farm Survey 2016 Results
 Teagasc National Farm Survey 2016 Results Emma Dillon, Brian Moran and Trevor Donnellan Agricultural Economics and Farm Surveys Department, Rural Economy Development Programme, Teagasc, Athenry, Co Galway,
Industry and Market Highlights
 Ag Statistics 101 Series Industry and Market Highlights............................... Webinar March 22, 2018, 9:00AM-10:30AM Agenda Industry Highlights Eric Liu, Manitoba Agriculture Eric is Manger of
Proposed Interim Application Reduction Efficiency
 Proposed Interim Application Reduction Efficiency 1 Terminology Historically, CBP has referred to application reduction as nutrient management Comprehensive nutrient management involves having the correct
Appendix 2 Description of EU Farm Typology Classification System
 Appendices Appendix 2 Description of EU Farm Typology Classification System Introduction The EU Farm Typology Classification System was developed in order to identify and classify relatively homogeneous
MURPHY DRAIN CATCHMENT
 The RVCA produces individual reports for 16 catchments in the Lower Rideau subwatershed. Using data collected and analysed by the RVCA through its watershed monitoring and land cover classification programs,
NUTRIENT BUDGETING AND MANAGEMENT ON ORGANIC FARMS
 NUTRIENT BUDGETING AND MANAGEMENT ON ORGANIC FARMS James McDonnell, Organic Specialist, Teagasc, Oak Park, Carlow. Mark Plunkett, Soil & Plant Nutrient Specialist, Teagasc, Johnstown Castle, Wexford. Introduction
2 Okanogan County Regional Setting
 1 1 1 1 1 1 1 1 0 1 0 1 Okanogan County Regional Setting.1 Okanogan County Profile Okanogan County is in North Central Washington State. The county borders Canada in the North and the southern and eastern
Manitoba Pig and Pork Industry
 Manitoba Pig and Pork Industry History: Manitoba farmers have been raising pigs since the province was settled by Europeans in the 18s. Pig production has fluctuated over the decades depending on market
ACQUISITION OF HYDROPONIC GREEN FODDER CULTIVATION EQUIPMENT (AG)
") ACQUISITION OF HYDROPONIC GREEN FODDER CULTIVATION EQUIPMENT (AG) The purpose of this project is provision of technical and economical arguments for hydroponic green fodder (HGF) cultivation and their
ACQUISITION OF HYDROPONIC GREEN FODDER CULTIVATION EQUIPMENT (AG) The purpose of this project is provision of technical and economical arguments for hydroponic green fodder (HGF) cultivation and their
The Value of Growing Quality Forage Fraser Stewart, Manitoba Forage Council Presented at the Manitoba Forage Symposium April 2004
 The Value of Growing Quality Forage Fraser Stewart, Manitoba Forage Council Presented at the Manitoba Forage Symposium April 2004 Importance of forage in Manitoba Of the total farmland in Manitoba, 39%
District of Maple Ridge Agricultural Land Use Inventory 2004
 Agricultural Land Use Inventory 2004 Prepared by the Ministry of Agriculture, Food and Fisheries October 2004 Table of Contents INTRODUCTION... 2 THE DISTRICT OF MAPLE RIDGE... 2 SURVEY METHOD... 2 LAND
7.0 CHAPTER. Wildlife Habitat
 BENEFICIAL MANAGEMENT PRACTICES 123 CHAPTER 7.0 Wildlife Habitat Natural ecosystems are a vital component in sustaining ecological functions. This chapter describes beneficial management practices for
United States Department of Agriculture (USDA) Highlights of various programs. Wetlands Reserve program (WRP)
 Highlights of various programs. Wetlands Reserve program (WRP)") Funding Sources: (USDA) United States Department of Agriculture The following is a listing of the various funding sources offered to farmers by the USDA. Each source shows the eligibility, what it will
Funding Sources: (USDA) United States Department of Agriculture The following is a listing of the various funding sources offered to farmers by the USDA. Each source shows the eligibility, what it will
Sand (%) Silt (%) Clay (%)
 Silt (%) Clay (%)") Farmer name Farm Code Farm herd number Data year Annual rainfall (mm) N deposition (kg/ha) Longitude: Latitude: Dairy system characterization Calving pattern Milk produced All year round Manufacturing
Farmer name Farm Code Farm herd number Data year Annual rainfall (mm) N deposition (kg/ha) Longitude: Latitude: Dairy system characterization Calving pattern Milk produced All year round Manufacturing
EU Milk Margin Estimate up to 2013
 Farm Economics Brief No 5 April 2014 EU Milk Margin Estimate up to 2013 An overview of estimates of of production and gross margins of milk production in the EU Contents Need for monitoring milk margin
Outline Delta/DF&WT Overview Should I Cover Crop? Winter Cover Crop Varieties Challenges and Opportunities
 Delta Farmland & Wildlife Trust Coastal Winter Cover Crops Christine Terpsma, Program Coordinator Outline Delta/DF&WT Overview Should I Cover Crop? Winter Cover Crop Varieties Challenges and Opportunities
Re: Recommendations for Regulating Phosphorus from Livestock Operations in Manitoba
 Manitoba Conservation Operations Division Headquarters Environmental Programs Box 46, 200 Saulteaux Crescent Winnipeg MB R3J 3W3 Telephone: (204) 945-8553 http://www.gov.mb.ca/conservation May 6, 2005
STATEMENT OF FARMING INCOME AND EXPENSES
 STATEMENT OF FARMING INCOME AND EXPENSES - 2012 NAME: Business #: AgriStability #: Commodity Sales and Program Payments Code Amount Other Farming Income Line Amount GRAINS & FORAGES: Program payouts -
eprofit Monitor Analysis Tillage Farms 2016 Crops Environment & Land Use Programme
 eprofit Monitor Analysis Tillage Farms 2016 Crops Environment & Land Use Programme Printed by Naas Printing Ltd. Contents Foreword 2 Overall performance 3 Rented land 6 Comparison of eprofit Monitor to
Research and Conservation Opportunities Arising from a High Resolution LiDAR Mission for the Long Point Biosphere Reserve and Surrounding Region
 Research and Conservation Opportunities Arising from a High Resolution LiDAR Mission for the Long Point Biosphere Reserve and Surrounding Region Dr. Stewart J. Sweeney, Environmental Management Branch,
Appendix X: Non-Point Source Pollution
 Appendix X: Non-Point Source Pollution Sources Nonpoint source of pollution, unlike pollution from industrial and sewage treatment plants, comes from many different sources. Nonpoint source pollution is
THE INTRODUCTION THE GREENHOUSE EFFECT
 THE INTRODUCTION The earth is surrounded by atmosphere composed of many gases. The sun s rays penetrate through the atmosphere to the earth s surface. Gases in the atmosphere trap heat that would otherwise
STATEMENT OF FARMING INCOME AND EXPENSES
 STATEMENT OF FARMING INCOME AND EXPENSES - 2015 NAME: Business #: AgriStability #: Commodity Sales and Program Payments Code Amount Other Farming Income Line Amount GRAINS & FORAGES: Program payouts -
Fiona Thorne Outlook for Inputs. Ag Econ and Farm Surveys Dept.
 Fiona Thorne Outlook for Inputs Ag Econ and Farm Surveys Dept. Recovery in commodity prices in 2017 as year progressed Low commodity prices coming into 2017 Energy, metals and ag commodities (with exceptions)
Characteristics and Production Costs of U.S. Cow-Calf Operations
 United States Department of Agriculture Electronic Report from the Economic Research Service www.ers.usda.gov Statistical Bulletin Number 974-3 November 2001 Characteristics and Production Costs of U.S.
Clinton County Agricultural Development Board. Comprehensive Plan
 Clinton County Agricultural Development Board Comprehensive Plan 2008 Clinton County Agricultural Development Board I. Overview of County Clinton County has 639 farms which average 122 acres. 268 or 42%
AAFC and H 2 O. Ian D Campbell. Director, Integrated Natural Resources Agri-Environment Services Branch Agriculture and Agri-Food Canada
 AAFC and H 2 O Ian D Campbell Director, Integrated Natural Resources Agri-Environment Services Branch Agriculture and Agri-Food Canada AAFC and Water: Outline Role of AAFC in water Irrigation and drainage
FARMLAND AGREEMENTS. A guide to sustainable land rental in Ontario.
 FARMLAND AGREEMENTS A guide to sustainable land rental in Ontario www.farmlandagreements.ca Larry Davis, Brant County One farmer s experience. Larry Davis farms in Brant County, where he grows corn, soybeans
Lesser Slave Watershed Council. Executive Summary Community Engagement for the Integrated Watershed Management Plan, October December 2016
 Lesser Slave Watershed Council Executive Summary Community Engagement for the Integrated Watershed Management Plan, October December 2016 Alan Dolan Alan Dolan & Associates January 11, 2017 Executive Summary
Nutrient BMP Evaluation Project: Preliminary Conclusions
 Nutrient BMP Evaluation Project: Preliminary Conclusions Manure Management Update 2013 Conference Lethbridge, AB January 14, 2013 Beneficial Management Practices How effective are they, what are the costs,
1. Under 60k SO Farm Business Income ( per farm)
") 1. Under 60k SO Farm Business Income ( per farm) Number of farms in sample 21 21 Average business size (SO) 32,754 33,481 OUTPUTS 2016/17 2015/16 Other cattle 15,275 16,588 Sheep 10,263 10,669 Main crops
1. Under 60k SO Farm Business Income ( per farm) Number of farms in sample 21 21 Average business size (SO) 32,754 33,481 OUTPUTS 2016/17 2015/16 Other cattle 15,275 16,588 Sheep 10,263 10,669 Main crops
Degradation of the resource Fertility loss Organic matter Tilth degradation. Water quality Sediment Nutrients
 Near Blue River ca. 1980 Degradation of the resource Fertility loss Organic matter Tilth degradation Water quality Sediment Nutrients Program cost Cheaper to prevent Still expensive Long-term productivity
3.3 Denmark (Mette Vaarst, Anne Braad Kudahl)
") 3.3 Denmark (Mette Vaarst, Anne Braad Kudahl) The majority of the milk in Denmark is produced in Jutland, the western part of the country. The holdings are basically family farms with one or two employees.
3.3 Denmark (Mette Vaarst, Anne Braad Kudahl) The majority of the milk in Denmark is produced in Jutland, the western part of the country. The holdings are basically family farms with one or two employees.
The Eastern Ontario Farm Model
 The Eastern Ontario Farm Model Modelling The Effect of Changing Weather Patterns on Farming Operations Dan MacDonald, Ruth Waldick, Sampsa Hamalainen AAFC, Ottawa, Scott Mitchell, Anna Zaytseva Carleton
Kansas Farm Economy Update Land and Leasing
 Kansas Farm Economy Update Land and Leasing Mykel Taylor Kansas State University January 10, 2017 Net Farm and Ranch Income Returns over Total Costs ($/ac) $230,000 $180,000 $130,000 $80,000 $30,000 $(20,000)
Alameda County Eligibility Requirements for Williamson Act Contracts for Agricultural Uses GUIDELINES FOR COMMERCIAL AGRICULTURE
 Alameda County Eligibility Requirements for Williamson Act Contracts for Agricultural Uses GUIDELINES FOR COMMERCIAL AGRICULTURE Introduction These Guidelines are intended to summarize the requirements
DEVELOPING AGRI-ENVIRONMENTAL INDICATORS FOR CANADA GENERAL PROPOSAL
 DEVELOPING AGRI-ENVIRONMENTAL INDICATORS FOR CANADA GENERAL PROPOSAL MARCH 1994 (description of proposed water quality indicator modified in June 1994) ENVIRONMENTAL INDICATOR WORKING GROUP AGRICULTURE
Refer to Appendix B, Livestock Manure and Mortalities Management Regulation.
 Imperial Units Table : Required Manure Storage Setbacks Storage Type All manure storage structures Field storage Composting Distance (ft) to Surface watercourse, Property Boundary sinkhole, spring, or
Soil Organic Matter. Soil degradation has become a major concern in. What is organic matter? Organic matter in virgin and cultivated soils
 Agdex 6- Soil degradation has become a major concern in Canada. Erosion, salinization, acidification and loss of organic matter are the main forms of soil deterioration. This factsheet deals with the role
List of contributors
 List of contributors p. x Foreword p. xii Preface to the third edition p. xiii Introduction p. 1 Objectives p. 1 The development and distribution of grasslands p. 1 Classification of grasslands - ecological
USDA Farm Data for the HICAHS Region
 USDA Farm Data for the HICAHS Region The six-state HICAHS region includes Colorado, Montana, North Dakota, South Dakota, Utah, and Wyoming. Through an agreement with the Southwest Center for Agricultural
Managing nutrient needs in organic farming. Judith Nyiraneza
 Managing nutrient needs in organic farming Judith Nyiraneza Managing nutrient supply One of the main challenge facing the organic farmer: In short-term: supply sufficient nutrient to the crop to achieve