Sheep and Cattle Breeding Farm
|
|
|
- Randolph Sutton
- 5 years ago
- Views:
Transcription
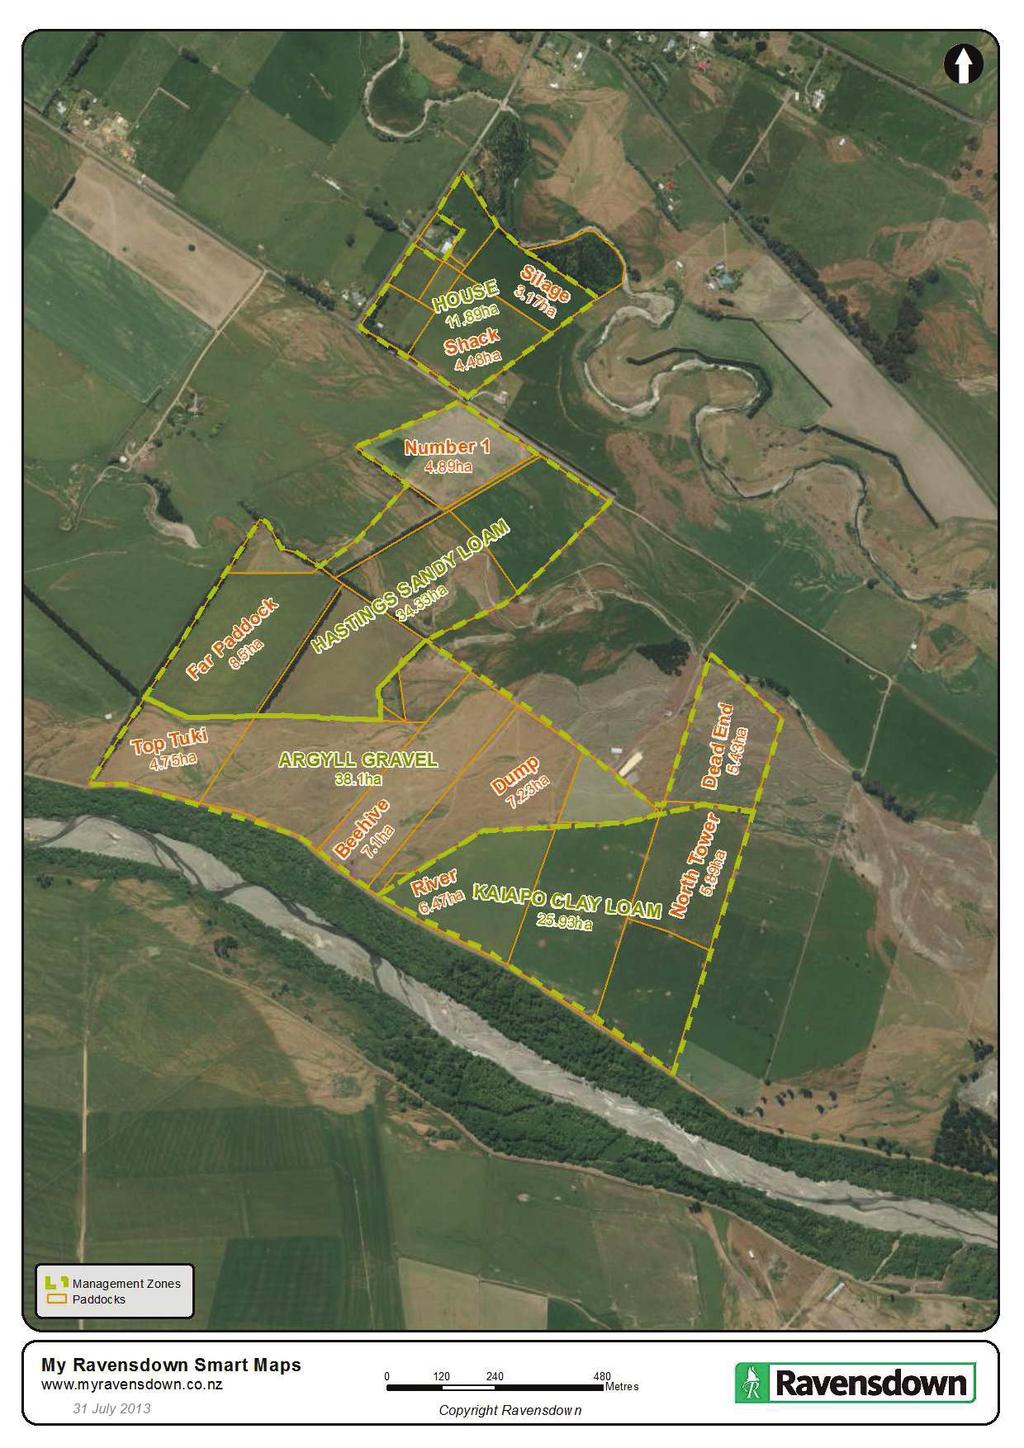
1 Sheep and Cattle Breeding Farm Purpose The purpose of this case study is to establish the benefit of incorporating irrigated Ruataniwha Plains land into a sheep and beef breeding farm. More particularly the cost benefit of completing the irrigation development utilising water purchased from the Ruataniwha Water Storage Scheme (RWSS). Executive Summary To carry out this case study the Bradley Family who own three properties in Central Hawke s Bay have made their farm business available to complete a review. The Bradley Family farm three separate properties, two hill country breeding properties comprising 478 ha plus 112 ha flat land with irrigation potential. In total 590 ha of which 550 ha is deemed to be effective with 5,000 stock units wintered. The properties are farmed together as a sheep and cattle breeding and finishing operation with 78:22 sheep to cattle ratio. The current farming system aims to finish all lambs to 17 kg s with the exception of 400 ewe lambs sold store. Store numbers increase to 1,000 in a 1 in 5 year drought. The focus of this case study is to understand the financial impact of irrigating the 112 ha finishing property farmed in a system to finish hill country lambs and the overall increase in profitability incorporating the irrigation into the whole farm system, more specifically the marginal return on capital of the investment. The results confirmed improved overall profitability and a marginal return on capital significantly above the anticipated cost of capital. To establish a framework to determine the value of the irrigation to the whole farm system we first reviewed the current production of the 112 ha and then measured the increase in cash surplus by irrigating 63 ha and then increasing this to 88 ha if permitted. Increasing the irrigated area allowed us to assess the benefits of irrigating the property to its full potential. We then incorporated both irrigation options into the whole farm system to measure the benefits in cash, value and marginal return on capital. We have involved agronomists (Agricom), independent pastural consultants (Challenge Consultancy), fertiliser consultants (Ravensdown) and irrigation specialists (Bay Irrigation) to assist assess the productive potential under irrigation. Nutrient leaching was also a consideration and Ravensdown have assessed both the fertiliser requirements on the irrigation area and modelled nutrient losses using Overseer to ensure the farming system does not create nutrient issues outside the likely thresholds permitted under Plan Change 6. Site Inspection and Observations The farm was visited on 8 July 2013 with a focus on the irrigation potential of 112 ha Taylor Road property. It was noted that the soil on the subject property was a mix of Hastings Sandy Loam, Kaiapo Clay Loam and Argyll Gravel. Refer property and soil map appendices. Pasture specialists Agricom were consulted and recommended Lucerne and Plantain to maximise production and efficiency under take or pay irrigation. They estimated that 300 mm per ha per annum of irrigation would be required to produce 14 tonne dry matter per annum. We were able to gain some confidence in the level of water required to achieve this production having visited another property in the South Island High Country irrigating river shingle. In this case the soil is Tasman sand and stones with very little soil, sown in Tall Fescue and Ryegrass. It was producing 17 tonne under an irrigation rate of 420 mm per annum. Unlike the South Island property the subject property will only have between 36 and 50% of the lighter soil under irrigation, depending on the extent of the irrigation development. The Taylor road property will also develop a Plantain dominant sward. By utilising pasture species that are considered more productive than grass on lighter soils, 14 tonne under 300 mm irrigation is considered realistic. There is no specific research data for Plantain under irrigation on the Ruataniwha Plains but irrigated plantain is producing 18 tonne dry matter under irrigation in the Manawatu.
 for budget purposes.")
2 Additional capital is being invested to prevent water wastage and therefore the amount of water required. All things considered we feel that between 250 and 350 mm irrigation will be required to produce the 14 tonne budgeted and on this basis we have adopted 300 mm (3,000 cube/ha) for budget purposes. A sensitivity analysis has been included in this paper considering the implications of both water price and water volume. Irrigation Infrastructure To determine the irrigation infrastructure required we consulted with Bay Irrigation. Because of the irregular shape of the property it was decided that 63 ha running parallel to the Tuki Tuki River boundary could be irrigated with a Linear Irrigation System. The irrigation of an addition 25 ha s using the same irrigator by utilising a pivot system is hypothetical, because to implement this augmentation of the linear irrigation system, a boundary adjustment and land swap with the neighbour would be required. This would involve squaring off the said 25 ha s by including 7.20 ha s of the neighbours and in return giving the neighbour 6.91 ha s land. This in turn would provide the neighbour a regular shaped irrigable property. The land swap concept is seen as mutually beneficial and in these situations would normally proceed should both parties wish to irrigate or take the opportunity to square off an irregular shaped boundary. Budget scenarios have been completed for both 63 and 88 ha (+25ha). Irrigation of the balance of the property is not considered worthwhile as the property is dissected by Taylor Road and the additional capital cost of another irrigation system for just a small area was assumed to be marginal at this stage. The capital and development cost is extrapolated in appendices with cost estimates supplied by Bay Irrigation. The cost of the development is expected to be $200,000 for the Linear Pivot irrigator (plus $6,000 to include pivot), 45,000 for a variable rate irrigation system (VRI) and $65,000 for installing the mainline and purchasing supply hose and hydrants. There is also $32,000 budgeted for contingencies such as a small amount of fencing and shelter belt removal. The total development cost for the two systems is $342,541 (63 ha, $5,437 per ha,) and $348,541 (88ha, $3,961 per ha). The main irrigation site has a seam of light soil through it so a VRI system should be fitted to the irrigator which will allow the different soil types to be irrigated at different rates for more efficient use of water. The VRI system will enable the lighter soils with a lower water holding capacity to be managed more efficiently, keeping the soil moisture in the desired range.
3 A B C MODEL 0 ha 63 ha 88 ha Total $ Dryland Irrigated Irrigated Gross Income 521, , ,121 Farm Operating Expenses Economic Farm surplus (EFS) 326, , , , , ,871 Interest 6,143 31,331 34,093 Depreciation - Irrigator 189, , ,778-12,000 12,000 Taxable Profit 189, , ,778 Total Capital Employed 5,355,000 5,697,541 5,703,541 Total Liabilities - 342, ,541 Equity 5,355,000 5,355,000 5,355,000 Marginal Return Irrigation % % Return on Capital 3.66% 4.83 % 4.80 % NPV $ 953,004 $ 896,771 Per Effective Hectare Gross Income 949 1,212 1,266 Farm Operating Expenses EFS % Of Gross Income Farm Operating Expenses 62.48% % % Fertiliser 15.13% % % Production Total Farm Area (Ha) Effective Farm Area Irrigated Area Percentage Irrigated - 12 % 16 % Water cost - 41,958 58,608 % Increase EFS % % Lambing % 110% 120 % 120 % Lamb CWT Irrigation Financial Analysis Budgets have been completed on Taylor Road as the property is now, and post irrigation development. Production estimates have been made using our knowledge and then cross checking this with work done independently on Farmax. Farmax is a grazing management tool that models pasture supply and feed demand throughout the year and we engaged John Cannon of Challenge Consultancy to undertake this work as they have a strong reputation in this area. The cost benefit analysis of the irrigation has been reviewed on the Taylor Road property as a stand-alone unit and then looking at the wider economic benefit of the whole farm business when incorporating the sheep and cattle breeding unit. The capital and operational cost of the irrigation has been set-off against the production increase in order to measure the economic benefit of the irrigation. The following table focuses on the benefit to the whole farm system. Three scenarios are illustrated in the table to measure the benefit of irrigation and help determine the irrigation area required to achieve economic efficiency. a. Whole farm profitability utilising the dry land Taylor runoff and the sheep and cattle breeding property to understand current profitability and the irrigation potential. To provide a clear base case for comparison we have assumed no term debt but included seasonal finance interest. b. Whole farm profitability utilising 63 ha irrigation at Taylor Road to finish all lambs owned at higher weights plus 633 external trade lambs all on the irrigation. The irrigation will also prevent the sale of 400 store lambs each year and a further 600 lambs in a one in five year drought. Ewe fertility also increases with lambing percentage up by 10%. c. As in B above but utilising 88 ha irrigation at Taylor Road to finish all lambs owned at higher weights plus 2,526 external trade lambs all on the irrigation. The economics for this system would likely improve if cash cropping was introduced as an option, the scope was limited to filling the additional feed with more lambs only.

4 Key Points Irrigation Comparison Table The return on Capital increases from 3.66% to 4.83 and 4.80% respectively. The interest rate used for irrigation development expenditure is 7%. It is assumed there is no existing debt except for seasonal finance. On the basis the investment is 100% equity funded the marginal return on capital for the 63 ha development is 23% excluding cost of capital. This reduces to 16% when including the interest cost for the development. For the 88 ha development these same returns are 22% and 14% respectively. The water is priced at 17 cents/cubic meter for the first four years incorporating the 6 cent discount on offer then increasing to base price of 23 cents. The average price is 22.2 cents over 30 years (excluding inflationary impacts on water price which is consistent with impacts on other expenditure and commodity prices) which we believe is the useful life of the irrigator. We have added 3 cents per cubic meter for power giving an all up status quo budget price for water of 25.2 cents. An increase in lambing percentage of 10% (from 110% to 120%)is budgeted by being able to shift all lambs off the breeding properties. Lambs transferred to Taylor Road will increase from approximately 1000 to Shifting the lambs off will free up grazing for the ewes and hoggets improving condition and fertility. It will also reduce the impact the 1 in 5 year drought has on ewe fertility and lamb survivability. Lamb finishing weights are increased from 17 to 19.8 kg The whole farm system incorporating 63 ha property is the most profitable. This would indicate there is increasing economies of scale incorporating irrigation into a breeding farm to a level that permits all own bred lambs to be finished. After this point a change in farming system is required and this could include additional grazing, cropping, expanding the breeding operation or to provide an additional buffer in a drought year. A Lamb production lift to 136% would provide maximum efficiency of the 63 ha irrigation.the whole farm system would then be self-contained from own bred lambs, reducing trading risk and capturing the profit from the additional lambs produced.

5 Sensitivity of water price and volume The table below illustrates the change in EFS with changes in water price and volume. This is a consideration if you were to over or under subscribe to water and if the price of the water were to vary above or below the 22.7 cents we have budgeted on. Worst case under this sensitivity scenario a 10% increase in water usage and cost results in a marginal reduction of profit of $8,580. This demonstrates that water price risk and sensitivity isn t as high as you might expect. Purchasing additional water over and above budget does not threaten the benefit from the irrigation. The additional EFS from irrigation is $79,227 which is enough to irrigate up to 800 mm before the financial benefit is lost. Note: 5% change in water price is equivalent to 1.14 cents/cubic meter of water 5% change in water volume is equivalent to 150 cubic meters budget water price is the average over the 30 year investment period i.e. 23 cents less the 6 cent discount for the first four years Water Usage Water Price -10.0% -5.0% 0.0% 5.0% 10.0% $38,613 $40,758 $42,903 $45,048 $47, % $38,613 $283,567 $281,422 $279,277 $277,132 $274, % $40,758 $281,422 $279,277 $277,132 $274,986 $272, % $42,903 $279,277 $277,132 $274,986 $272,841 $270, % $45,048 $277,132 $274,986 $272,841 $270,696 $268, % $47,193 $274,986 $272,841 $270,696 $268,551 $266,406

6 Investment Case (NPV) NPV calculation Period (Years) 30 Option ha 88 ha Discount rate (per annum) 4% 4% $ 953,004 $ 896,771 The additional value the irrigation brings to the business based on incremental future cash flow is significant, as illustrated by the table above. The work done with this example is purely hypothetical as the farm is not a contiguous block of land but three separate blocks. It is likely that the value of Taylor Road property would increase by the capital cost of the irrigation if farmed stand alone. A premium over cost would come from sheep and beef farmers keen to exploit the benefits of the irrigation on the wider business and the above analysis would indicate they may pay up to $190/su premium on this basis ($953,004/5000su) for an irrigated sheep and cattle farm of this size. worth more to the business. Because NPV s are cash based depreciation has not been included but instead the cost of the irrigator has been included as repairs and maintenance over the expected life of the machine which is expected to be between 30 and 40 years. The NPV period has been set at 30 years, being the lower end of the irrigator expected useful life. The irrigation charges included for the first four years are included at a cost of 17 cents per cubic meter with the 6 cent discount and 23 cents thereafter. We have included a contingency of 3 cents for power. Key Points The NPV is of the differential in profit margin between irrigated and non - irrigated as explained in Models A to C. A discount rate of 4% is used noting the project is low risk. It could be argued that we should adopt a lower discount rate because the investment reduces business risk significantly and it is difficult to quantify what the risks are, if at all. A lower discount rate would indicate the development is
7 Lambs Price $ Production % -10.0% -5.0% 0.0% 5.0% 10.0% Lambs $98 $104 $109 $114 $ % 3508 $194,649 $213,768 $232,888 $252,008 $271, % 3703 $213,768 $233,950 $254,132 $274,314 $294, % 3898 $232,888 $254,132 $274,986 $296,620 $317, % 4093 $252,008 $274,314 $296,620 $318,927 $341, % 4288 $271,127 $294,496 $317,864 $341,233 $364,601 Sensitivity of lamb production Lamb price does not materially impact the marginal benefit as the price per kg used is constant pre and post development. No premium has been included for heavier or a more reliable supply of lambs with the irrigation although this is a possibility and irrigation could be used to generate feed to target winter lamb finishing premiums. The variable that is influenced most by the irrigation is lamb production. A 10% increase in the number of lambs available for sale increases the marginal return on capital from 23 to 35%. Conversely if lamb production was unchanged the marginal return would reduce from 23 to 11%. Summary & Conclusion The case study has identified the potential for a significant improvement in profitability of a sheep and cattle breeding operation in Hawkes Bay with the introduction of RWSS irrigation. A minimum of 10% of the total effective farming area is required to enable all lambs to be finished on the irrigation area. The key benefits of the irrigation are identified as : 1. All lambs can be consistently finished on the irrigation at heavier weights. 2. Ewe and hogget condition and therefore fecundity can be improved utilising the feed made available by moving lambs onto the irrigation freeing up pasture to flush ewes and hoggets 3. The impact of the 1 in 5 year drought is dramatically reduced by not having to sell lambs store on weak markets and maintaining ewes and replacement hoggets in better condition. 4. A reduction in farm management and financial stress by reducing drought risk 5. Increased resilience, confidence and consistency in the farming business While only 55 ha is required to achieve the objective of finishing all lambs to heavy weights. In this case study a 63 ha area provides the best return on investment. The reason for irrigating the additional land is because the capital cost isn t any greater and the return on capital is high. The whole farm system incorporating 63 ha property is the most profitable. This would indicate there is increasing economies of scale incorporating irrigation into a breeding farm to a level that permits all own bred lambs to be finished. After this point a change in farming system can be adopted to increase returns further and this could include different grazing options, cropping, expanding the breeding operation or to provide an additional buffer in a drought year. The marginal return on capital irrigating the full 88 ha is also high at 22%, trading additional lambs on the 25 ha. We have not modelled the significant benefits in a drought year, which would likely increase returns further by having this land under irrigation. For further information please contact GoodmanRural p: (06) or e: info@goodmanrural.co.nz

8 Hawke s Bay Regional Investment Company Limited Appendices Price Notes Linear Irrigator (installed) $ 199, meter 2-Wheel Cart Pivital Lateral installed Pivot application $ 6,000 To allow linear to pivot and irrigate a further 25 hectares Variable Rate Irrigation System $ 45,477 Price is based on fitting at irrigator installation saving Mainline 1,560M 225mm PN6 $ 58,604 Mainline including 7 hydrands all installed Supply Hose 140M $ 6,929 Supply hose between hydrants Contingencies $ 31,686 Fencing, trees/shelter removal and micellanious Total $ 348,541 Development Items
9
10 Bradley Farm - Dryland $'s CASH FORECAST FOR YEAR ENDED: Jun-2015 STOCK UNITS S.U. RATIO AREA(HA) 608 Milksolid Price $3.90 SHEEP % EFFECTIVE 550 Prodn lstyr 0 CATTLE % Waste 58 Prodn this yr 0 DEER 0 0 0% TOTAL (HA) 608 Prodn/HA 0 CROP 0% Cows Milked 0 Prodn/cow 0 TOTAL S.U Cows/Ha 0.00 Average Payout $0.00 $/ha STOCK SALES Price WAGES $145 $16.06 $80, Sheep $91 $374,570 ANIMAL HEALTH $42.58 $4.70 $23, Cattle $1,035 $283,654 ELECTRICITY $4.18 $0.46 $2,301 Deer $0 WATER - Irrigation $0.00 $0.00 $0 ELECTRICITY - Irrigation $0.00 $0.00 $0 FEED / GRAZING $15 $1.70 $8,458 TOTAL $658,224 FREIGHT $14.55 $1.61 $8,000 STOCK PURCHASES Price FERTILISER $ $14.81 $73, Sheep $ $7,152 WEEDS/SEEDS/PESTS $5.59 $0.62 $3, Cattle $873 $184,129 SHED EXPENSES $48.78 $5.38 $26,828 Deer $0 PASTURE RENEWAL $47 $5.22 $26,000 R&M $27.27 $3.01 $15,000 TOTAL $191,281 VEHICLE EXPENSES $32.77 $3.62 $18,025 NET STOCK SALES $466,943 ADMINISTRATION $6.43 $0.71 $3,536 ACCOUNTANCY $9.35 $1.03 $5,142 WOOL INCOME INSURANCE $7.74 $0.85 $4, Total # KG's $3.00 $54,840 RATES $39.83 $4.40 $21,907 ACC $11.39 $1.26 $6,265 VELVET INCOME Farm Working Expenses(FWE) $ % $326,024 0 Total # KG's $0 $0 TERM LOANS $195,758 TERM LOANS % CROP INCOME IRRIGATION 7.00 $0 $0 PRINCIPAL $0 $0 $0 FAMILY $ $0 $0 OTHER $ $0 $0 TOTAL $0 LEASE COWS $0 RENT $0 HP $0 $0 SEASONAL 22 (% Utilisation) BANK $400, $6, (% Utilisation) OTHER $0 $6,143 TOTAL DEBT SERVICING (TDS) 1% $6,143 $189,616 WAGE OF MANAGEMENT $0 LIFE INSURANCE $0 TAXATION $56,885 TOTAL PERSONAL EXPENDITURE $56,885 DAIRY INCOME CAPITAL EXPENDITURE 0 Kg's this year $3.30 $0 $0 0 Kg's Last year $0.60 $0 $0 OTHER INCOME $0 $0 $0 TOTAL CAPITAL EXPENDITURE $0 GROSS FARM INCOME (GFI) $521,783 NON FARM INCOME $0 $0 TOTAL EXPENDITURE $389,052 TOTAL INCOME $521,783 SURPLUS / (DEFICIT) 25% $132,731 (12/5/14) $189,616 DISCLAIMER: This farm budget and cashflow forecast has been prepared by GoodmanRural from records, information and instructions furnished to us by the customer. Neither GoodmanRural nor any of it's employees accept any responsibility for the accuracy of the material from which this has been prepared.
11 Breeding 63 ha Irrigation $'s CASH FORECAST FOR YEAR ENDED: Jun-2015 STOCK UNITS S.U. RATIO AREA(HA) 608 Milksolid Price $3.90 SHEEP % EFFECTIVE 550 Prodn lstyr 0 CATTLE % Waste 58 Prodn this yr 0 DEER 0 0 0% TOTAL (HA) 608 Prodn/HA 0 CROP 0% Cows Milked 0 Prodn/cow 0 TOTAL S.U Cows/Ha 0.00 Average Payout $0.00 $/ha STOCK SALES Price WAGES $145 $16.06 $80, Sheep $105 $543,992 ANIMAL HEALTH $44.83 $4.95 $24, Cattle $1,149 $355,112 ELECTRICITY $4.18 $0.46 $2,301 Deer $0 WATER - Irrigation $76.29 $8.42 $41,958 ELECTRICITY - Irrigation $10.31 $1.14 $5,670 FEED / GRAZING $15 $1.70 $8,458 TOTAL $899,104 FREIGHT $28.73 $3.17 $15,800 STOCK PURCHASES Price FERTILISER $ $15.58 $77, Sheep $93.23 $60,134 WEEDS/SEEDS/PESTS $5.59 $0.62 $3, Cattle $924 $227,304 SHED EXPENSES $48.78 $5.38 $26,828 Deer $0 PASTURE RENEWAL $47 $5.22 $26,000 R&M $36.36 $4.01 $20,000 TOTAL $287,438 VEHICLE EXPENSES $32.77 $3.62 $18,025 NET STOCK SALES $611,666 ADMINISTRATION $6.43 $0.71 $3,536 ACCOUNTANCY $9.35 $1.03 $5,142 WOOL INCOME INSURANCE $7.74 $0.85 $4, Total # KG's $3.00 $54,840 RATES $39.83 $4.40 $21,907 ACC $11.39 $1.26 $6,265 VELVET INCOME Farm Working Expenses(FWE) $ % $391,520 0 Total # KG's $0 $0 EFS $274,986 TERM LOANS % CROP INCOME IRRIGATION 7.00 $23,978 $0 PRINCIPAL $0 $0 $0 FAMILY $ $0 $0 OTHER $ $0 $23,978 TOTAL $0 LEASE COWS $0 RENT $0 HP $0 $0 SEASONAL 26 (% Utilisation) BANK $400, $7, (% Utilisation) OTHER $0 $7,353 TOTAL DEBT SERVICING (TDS) 5% $31,331 $243,655 DRAWINGS $0 LIFE INSURANCE $0 TAXATION $69,497 TOTAL PERSONAL EXPENDITURE $69,497 DAIRY INCOME 0 Kg's this year $3.30 $0 $12,000 0 Kg's Last year $0.60 $0 $0 OTHER INCOME $0 $0 $0 TOTAL CAPITAL EXPENDITURE $12,000 GROSS FARM INCOME (GFI) $666,506 NON FARM INCOME $0 $0 TOTAL EXPENDITURE $504,348 TOTAL INCOME $666,506 SURPLUS / (DEFICIT) 24% $162,158 (12/5/14) $231,655 DISCLAIMER: This farm budget and cashflow forecast has been prepared by GoodmanRural from records, information and instructions furnished to us by the customer. Neither GoodmanRural nor any of it's employees accept any responsibility for the accuracy of the material from which this has been prepared.
12 88 ha Irrigation $'s CASH FORECAST FOR YEAR ENDED: Jun-2015 STOCK UNITS S.U. RATIO AREA(HA) 608 Milksolid Price $3.90 SHEEP % EFFECTIVE 550 Prodn lstyr 0 CATTLE % Waste 58 Prodn this yr 0 DEER 0 0 0% TOTAL (HA) 608 Prodn/HA 0 CROP 0% Cows Milked 0 Prodn/cow 0 TOTAL S.U Cows/Ha 0.00 Average Payout $0.00 $/ha STOCK SALES Price WAGES $153 $16.86 $84, Sheep $106 $750,980 ANIMAL HEALTH $46.26 $5.11 $25, Cattle $1,101 $319,324 ELECTRICITY $4.18 $0.46 $2,301 Deer $0 WATER - Irrigation $ $11.76 $58,608 ELECTRICITY - Irrigatiom $14.40 $1.59 $7,920 FEED / GRAZING $15 $1.70 $8,458 TOTAL $1,070,304 FREIGHT $32.73 $3.61 $18,000 STOCK PURCHASES Price FERTILISER $ $16.15 $80, Sheep $86.12 $218,578 WEEDS/SEEDS/PESTS $5.59 $0.62 $3, Cattle $929 $210,976 SHED EXPENSES $48.78 $5.38 $26,828 Deer $0 PASTURE RENEWAL $51 $5.62 $28,000 R&M $36.36 $4.01 $20,000 TOTAL $429,554 VEHICLE EXPENSES $32.77 $3.62 $18,025 NET STOCK SALES $640,750 ADMINISTRATION $6.43 $0.71 $3,536 ACCOUNTANCY $9.35 $1.03 $5,142 WOOL INCOME INSURANCE $7.74 $0.85 $4, Total # KG's $3.00 $55,371 RATES $39.83 $4.40 $21,907 ACC $11.39 $1.26 $6,265 VELVET INCOME Farm Working Expenses(FWE) $ % $422,250 0 Total # KG's $0 $0 EFS $273,871 TERM LOANS % CROP INCOME IRRIGATION 7.00 $24,398 $0 PRINCIPAL $0 $0 $0 FAMILY $ $0 $0 OTHER $ $0 $24,398 TOTAL $0 LEASE COWS $0 RENT $0 HP $0 $0 SEASONAL 35 (% Utilisation) BANK $400, $9, (% Utilisation) OTHER $0 $9,695 TOTAL DEBT SERVICING (TDS) 5% $34,093 $239,778 WAGE OF MANAGEMENT $0 LIFE INSURANCE $0 TAXATION $68,333 TOTAL PERSONAL EXPENDITURE $68,333 DAIRY INCOME Irrigator Depreciation $12,000 0 Kg's this year $3.30 $0 $0 0 Kg's Last year $0.60 $0 $0 OTHER INCOME $0 $0 $0 TOTAL CAPITAL EXPENDITURE $12,000 GROSS FARM INCOME (GFI) $696,121 NON FARM INCOME $0 $0 TOTAL EXPENDITURE $536,676 TOTAL INCOME $696,121 SURPLUS / (DEFICIT) 23% $159,445 (12/5/14) $227,778 DISCLAIMER: This farm budget and cashflow forecast has been prepared by GoodmanRural from records, information and instructions furnished to us by the customer. Neither GoodmanRural nor any of it's employees accept any responsibility for the accuracy of the material from which this has been prepared.
Table 1: Key parameters, financial results and budget for the Waikato/Bay of Plenty intensive sheep and beef farm model
 FARM MONITORING 2012 WAIKATO/BAY OF PLENTY INTENSIVE SHEEP AND BEEF Key results from the Ministry for Primary Industries 2012 sheep and beef monitoring programme KEY POINTS Farmer confidence levels are
Financial Survey 2015 Southland Dairy
 Financial Survey 2015 Southland Dairy This report summarises the results of a financial survey of dairy farms across Southland, carried out by AgFirst through June 2015. A description of the model farm
Lowland cattle and sheep farms, under 100 hectares
 GROSS OUTPUT, VARIABLE COSTS AND FARM GROSS MARGIN, 2003/2004 Output Milk 0 0 Milk quota leasing, milk levy and compensation 0 0 Cattle 280 415 Herd depreciation -1 8 Cattle subsidies 135 211 Sheep 127
AgFirst 2nd Interim Report Hawkes Bay Regional Council Part 2 of the TANK catchment Economic, Social and Ecological Impact Assessment: Pre
 P a g e 0 AgFirst 2 nd Interim Report For the Hawkes Bay Regional Council on Part 2 of the TANK catchment Economic, Social and Ecological Impact Assessment: Water Management & Land Management Policy Options
SDA cattle and sheep farms, 120 hectares and over
 GROSS OUTPUT, VARIABLE COSTS AND FARM GROSS MARGIN, 2003/2004 Output Milk 0 0 Milk quota leasing, milk levy and compensation 0 0 Cattle 138 160 Herd depreciation -12-16 Cattle subsidies 92 101 Sheep 131
Appendix 5: Farm modelling methodology
 Appendix 5: Farm modelling methodology Perrin Ag Consultants Limited Box 596 Rotorua 1330 Eruera Street Rotorua, New Zealand Ph 07 3491212, Fax 07 349 1112 consult@perrinag.net.nz www.perrinag.net.nz MEMORANDUM
1. Under 60k SO Farm Business Income ( per farm)
") 1. Under 60k SO Farm Business Income ( per farm) Number of farms in sample 21 21 Average business size (SO) 32,754 33,481 OUTPUTS 2016/17 2015/16 Other cattle 15,275 16,588 Sheep 10,263 10,669 Main crops
1. Under 60k SO Farm Business Income ( per farm) Number of farms in sample 21 21 Average business size (SO) 32,754 33,481 OUTPUTS 2016/17 2015/16 Other cattle 15,275 16,588 Sheep 10,263 10,669 Main crops
Hurunui-Waiau Nutrient Budgeting Case Studies
 Hurunui-Waiau Nutrient Budgeting Case Studies Report Prepared by Rebecca Hyde & James Hoban This report outlines some considerations for the nutrient working group, relating to the Overseer nutrient budgeting
Financial Survey 2017 Waikato/Bay of Plenty Dairy
 Financial Survey 2017 Waikato/Bay of Plenty Dairy This report summarises the results of a financial survey of dairy farms across the Waikato and Bay of Plenty regions, carried out by AgFirst through June
Analysis of supplemental feed use in the new zealand sheep industry
 Analysis of supplemental feed use in the new zealand sheep industry MPI Technical Paper 2017/57 Prepared for the Ministry for Primary Industries ISBN No: 978-1-77665-677-6 (online) ISSN No: 2253-3923 (online)
There is potential in Tasmania to create new dairy farms by converting current grazing or cropping farms into dairy units.
 Dairy Conversions Introduction There is potential in Tasmania to create new dairy farms by converting current grazing or cropping farms into dairy units. Ideally a potential dairy conversion property will
Proposed Southland Water and Land Plan Hearing Statement
 Proposed Southland Water and Land Plan Hearing Statement Andrew Burtt, Chief Economist, B+LNZ 1. Good afternoon. 2. My name is Andrew Burtt. 3. I am chief economist at B+LNZ, with responsibility for managing
Evidence of Benjamin Timothy Ensor on Behalf of JG & LM Murchison (Submitter No 67179) and JWK Hoban & Ors (Submitter No 67198)
 and JWK Hoban & Ors (Submitter No 67198)") BEFORE THE CANTERBURY REGIONAL COUNCIL UNDER The Environment Canterbury (Temporary Commissioners and Improved Water Management) Act 2010 AND IN THE MATTER Submissions and Further Submissions on Proposed
BEFORE THE CANTERBURY REGIONAL COUNCIL UNDER The Environment Canterbury (Temporary Commissioners and Improved Water Management) Act 2010 AND IN THE MATTER Submissions and Further Submissions on Proposed
RUATANIWHA WATER STORAGE SCHEME
 RUATANIWHA WATER STORAGE SCHEME REVIEW OF FARM PROFITABILITY Hugh Eaton, Mark Everest, Andrew Macfarlane & Anton Nicholls Macfarlane Rural Business Ltd, Ashburton. Richmond Beetham & Stefan Bryant Baker
Stock Number Survey as at 30 June 2017
 Contents Stock as at 30 June 017 Executive Summary Breeding ewes -1.9% Hoggets +1.7% sheep -0.9% Ewe condition Scanning Lamb crop +1.1% Beef cattle +.8% Introduction Livestock numbers as at 30 June 017
27 July 2018 Dryland farming in New Zealand. Derek Daniell Masterton
 27 July 2018 Dryland farming in New Zealand Derek Daniell Masterton Handling droughts in the North Island hills Hill country, no feed crops, no supplementary feed Wairere high stocking rates (25DSE/ha)
Nutrient Budgeting. An Overview of What, How and Why. June 2014
 Nutrient Budgeting An Overview of What, How and Why 2014 Topics to Cover 1. Why the need for nutrient budgets 2. What is OVERSEER? 3. Principles Behind OVERSEER 4. User Inputs 5. Importance of accurate
Optimising farm resource allocation to maximise profit using a new generation integrated whole farm planning model
 85 Optimising farm resource allocation to maximise profit using a new generation integrated whole farm planning model J. M. RENDEL 1, A.D. MACKAY 2, A. MANDERSON 2 and K. O NEILL 1 1 AgResearch, Private
3. IMPROVING PASTURE MANAGEMENT
 3. IMPROVING PASTURE MANAGEMENT Allocating limited cash reserves post-drought to increase the productivity of pastures is a difficult exercise. This chapter will address those steps that can be taken without
Integrated grower supply chain for production of merino lamb
 Ogle Consulting RD1 Cambridge f 07 857 0823 c 0275 570 823 e graeme.ogle@rezare.co.nz Integrated grower supply chain for production of merino lamb Prepared for Merino NZ Inc by Graeme Ogle Principal Ogle
Overseer nutrient budget year 2001/02
 Overseer nutrient budget year 2001/02 Sheep, beef, deer, goats and non-milking dairy Farm information Name: Address: Property name: Property address: Contact details: Email address: Phone Home: Cell phone:
Supplier # NITROGEN RECORDING PAGES
 Supplier # NITROGEN RECORDING PAGES NITROGEN RECORDING PAGES The information you provide in this form will be entered into Overseer and used to generate a report. This report will provide you with ongoing
ECONOMIC ANALYSIS OF THE VALUE OF PASTURE TO THE NEW ZEALAND ECONOMY
 Report to: ECONOMIC ANALYSIS OF THE VALUE OF PASTURE TO THE NEW ZEALAND ECONOMY Prepared by Kel Sanderson Michael Webster Copyright BERL Economic Analysis of the Value of Pasture to the New Zealand Economy
Job Information Pack
 Job Information Pack Position Summary Property Name: Property Summary: Stockerau Station Pastoral Limited Partnership Stockerau Station Pastoral Limited Partnership will own and operate the land, buildings,
Job Information Pack
 Job Information Pack Position Summary Property Name: Property Summary: Awapai Station Awapai Station is a stunning property located in a secluded valley with wonderful views of the ranges. It is a family
The changing face of southern New Zealand farming: opportunities of land use change
 1 The changing face of southern New Zealand farming: opportunities of land use change R.J. COPLAND 1, D.R. STEVENS 2 1 Rabobank, P.O. Box 150, Gore. 2 AgResearch Invermay Research Centre, Puddle Alley
More than just a number Your guide to improving nitrogen-use efficiency on your farm
 More than just a number Your guide to improving nitrogen-use efficiency on your farm Protecting our present and our future New Zealand farmers have a reputation for producing safe, healthy food, and for
Effective Integration of Livestock & Cropping. Simon Vogt Rural Directions Pty Ltd
 Effective Integration of Livestock & Cropping Simon Vogt Rural Directions Pty Ltd Background MLA Profitable Integration of Cropping and Livestock project Currently collecting and analysing 100 x multi-year
On Farm Meeting Anawai
 On Farm Meeting Anawai 18 th September 2018 Goals, Objectives, Issues & Priorities Farming Goals Specific Deer Objectives 1. Achieve sustainable profit year on year 2. To grow a sustainable agribusiness
Australian Beef Financial performance of beef farms, to
 Australian Beef Financial performance of beef farms, 2014 15 to 2016 17 Jeremy van Dijk, James Frilay and Dale Ashton Research by the Australian Bureau of Agricultural and Resource Economics and Sciences
Bay of Plenty Regional Council
 Bay of Plenty Regional Council Methodology for creation of NDA reference files and stocking rate table Version 2 February 2016 Page 1 REPORT PREPARED BY PREPARED BY REGISTERED FARM MANAGEMENT CONSULTANTS
Farming Under Nitrate Leaching Limits
 Farming Under Nitrate Leaching Limits A case study of the effects of meeting potential nitrate leaching limits in a Canterbury dairy farming situation William Grayling Kellogg Rural Leadership Programme,
THE USE OF VARIABLE RATE FERTILISER APPLICATIONS IN NZ HILL COUNTRY
 White, M.D., Metherell, A.K. and Roberts A.H.C., 2017. The use of variable rate fertiliser applications in NZ hill country.. In: Science and policy: nutrient management challenges for the next generation.
Definition of Terms and Explanatory Notes
 CONTENTS Foreword Overview Introduction Definition of Terms and Explanatory Notes Whole Farm Data Hill cattle and sheep Hill sheep Upland cattle and sheep Lowland cattle and sheep Hill and upland dairy
Eskdalemuir A comparison of forestry and hill farming; productivity and economic impact
 Eskdalemuir A comparison of forestry and hill farming; productivity and economic impact Contents Executive Summary 3 1.0 Introduction and Objectives 4 2.0 Forestry survey and model 6 3.0 Agricultural output
Dryland Pastures. 24 June 2015 Professor Derrick Moot. Website: Blog: https://blogs.lincoln.ac.
 Dryland Pastures 24 June 2015 Professor Derrick Moot Website: http://www.lincoln.ac.nz/dryland Blog: https://blogs.lincoln.ac.nz/dryland/ Rain fed 300-800 mm East coast - summer dry By 2030 - Drier: Drought
2006 Iowa Farm Costs. and Returns File C1-10. Ag Decision Maker. Definition of Terms Used
 2006 Iowa Farm Costs Ag Decision Maker and Returns File C1-10 The farm record data utilized in this report were obtained from the Iowa Farm Business Associations. The average of all farms in each table
National Workshop 2018 Case Study B: Breeding and Finishing Easy to Medium Hill
 feed req kgdm/day* National Workshop 2018 Case Study B: Breeding and Finishing Easy to Medium Hill You will be provided with direction on how to work through the case material at the workshop. Overview
Measuring the cost of environmental compliance for Waikato dairy farmers a survey approach
 159 Measuring the cost of environmental compliance for Waikato dairy farmers a survey approach T.O.R. MACDONALD 1, J.S. ROWARTH 2 and F.G. SCRIMGEOUR 2 1 Landcorp Farming Limited, Taupo 2 University of
Enterprise Budgeting... 1 Crop Inputs Introduction... 46
 Contents Enterprise Budgeting... 1 Crop Inputs... 3 Introduction... 4 Fertiliser... 4 Lime... 4 Slurry and Manure... 4 Nutrient Planning... 6 Residual Values of Fertilisers, Manures and Lime... 8 Pesticide
TALL FESCUE MANAGEMENT GUIDE
 TALL FESCUE MANAGEMENT GUIDE Introduction Where is Tall Fescue Suited? Tall fescue is an exciting grass species that has proven itself to be an answer to pasture persistence and performance in hot summer
BEFORE THE HEARING COMMISSIONERS AT CHRISTCHURCH
 BEFORE THE HEARING COMMISSIONERS AT CHRISTCHURCH In the Matter of: Between: And: A hearing of submissions relating to Proposed Variation 1 to the proposed Canterbury Land and Water Regional Plan New Zealand
A CORE SET OF KPI MEASURES FOR RED MEAT FARMING BUSINESSES
 A CORE SET OF KPI MEASURES FOR RED MEAT FARMING BUSINESSES July 08 KPI Booklet Red Meat Profit Partnership PAGE KPI MEASURING FARM PERFORMANCE Why and what to measure 4 LAMBING PERCENTAGE 5 EWE FLOCK EFFICIENCY
Dairy Businesses for Future Climates
 Dairy Businesses for Future Climates 2016 TASMANIA - Research Findings The profitability of dairy farm businesses in this research was negatively affected by the 2040 climate change scenarios modelled.
Gearing up for increased Profitability in Drystock. A Profit Monitor the first step
 Gearing up for increased Profitability in Drystock A Profit Monitor the first step Featuring Teagasc e-profit Monitor Analysis Drystock Farms 2011 1 Working towards a Profitable Future in Drystock A Profit
Balancing dairy production and profits in northern Australia
 Balancing dairy production and profits in northern Australia Queensland Dairy Accounting Scheme - 2014 Balancing dairy production and profits in northern Australia QDAS Financial and production trends
2007 Michigan Dairy Grazing Farm Business Analysis Summary. Eric Wittenberg And Christopher Wolf. Staff Paper December, 2008
 2007 Michigan Dairy Grazing Farm Business Analysis Summary Eric Wittenberg And Christopher Wolf Staff Paper 2008-5 December, 2008 Department of Agricultural, Food, and Resource Economics MICHIGAN STATE
Prime lamb case study
 Prime lamb case study MLA Cost of Production The following case study outlines how a prime lamb producer would calculate their lamb cost of production using the MLA Cost of Production calculator. The prime
Incentives for intensification A report based on farmer case studies
 Incentives for intensification A report based on farmer case studies Prepared for the Parliamentary Commissioner for the Environment Te Kaitiaki Taiao a Te Whare Päremata PO Box 10-241 Wellington, New
Making cents for Northland farms with the ETS John-Paul Praat 1 and Bob Thomson 2
 Making cents for Northland farms with the ETS John-Paul Praat 1 and Bob Thomson 2 1 P.A. Handford and Associates, PO Box 52, Paekakariki 2 AgFirst Northland, PO Box 1345, Whangarei Corresponding author
Farm-scale Modelling Report
 Farm-scale Modelling Report Ruamahanga Whaitua Collaborative Modelling Project MPI Information Report No: 2016/22 Prepared for the Ruamahanga Whaitua Committee and Greater Wellington Regional Council by
Economics 230 Lab 4 Section 1 2 Due September 24 Fall 2010 WHOLE FARM BUDGET
 Economics 230 Name Lab 4 Section 1 2 Due September 24 Fall 2010 WHOLE FARM BUDGET The purpose of this lab is to (a) learn how to prepare a whole farm budget for a hypothetical farming situation, and use
MILK PRODUCTION COSTS in 1998 on Selected WISCONSIN DAIRY FARMS
 MILK PRODUCTION COSTS in 1998 on Selected WISCONSIN DAIRY FARMS by Gary Frank and Jenny Vanderlin 1 July 23, 1999 Introduction Total cost of production per hundredweight equivalent of milk ($14.90) was
Base information required for sheep and beef OverseerFM nutrient budget
 Base information required for sheep and beef OverseerFM nutrient budget Year: (Note: nutrient budget year is from July to June) OverseerFM is a software application that supports farmers and growers to
Potential for future growth in lamb supply from sheep and beef farming systems in Hawke s Bay, New Zealand
 20th International Congress on Modelling and Simulation, Adelaide, Australia, 1 6 December 2013 www.mssanz.org.au/modsim2013 Potential for future growth in lamb supply from sheep and beef farming systems
Economic, Productive & Financial Performance Of Alberta Cow/Calf Operations
 Benchmarks for Cattlemen Economics & Competitiveness Economic, Productive & Financial Performance Of Cow/Calf Operations Southern Fescue land, Mixed land & Moist Mixed land Production Year - 2002 Jan.
IN THE MATTER of the Resource Management Act 1991 STATEMENT OF EVIDENCE OF ANDREW MACFARLANE ON BEHALF OF RDRML LIMITED (HEARING 2)
") IN THE MATTER of the Resource Management Act 1991 AND IN THE MATTER of the submissions and further submissions by Rangitata Diversion Race Management Limited to the Proposed Canterbury Land & Water Regional
IN THE MATTER of the Resource Management Act 1991 AND IN THE MATTER of the submissions and further submissions by Rangitata Diversion Race Management Limited to the Proposed Canterbury Land & Water Regional
Resilient milk production systems for an expanding Irish dairy industry post 2015
 Resilient milk production systems for an expanding Irish dairy industry post 2015 Dr. Brendan Horan Animal and Grassland Research and Innovation Centre, Teagasc Moorepark Presentation Outline Expansion
Australian beef. Financial performance of beef cattle producing farms, to Therese Thompson and Peter Martin. Research report 14.
 Australian beef Financial performance of beef cattle producing farms, 2011 12 to 2013 14 Therese Thompson and Peter Martin Research by the Australian Bureau of Agricultural and Resource Economics and Sciences
research report The Impact of a Carbon Price on Australian Farm Businesses: Grain Production Australia s Independent Farm Policy Research Institute
 research report June 2011 The Impact of a Carbon Price on Australian Farm Businesses: Grain Production A report prepared by the Australian Farm Institute with funding from GrainCorp Operations Limited
Questions relating to changes in NDA allowances
 PO Box 9078, Hamilton Ph 07 839 2683 Fax 07 839 2686 www.agfirst.co.nz 14 February 2017 Gemma Moleta Policy Analyst Bay of Plenty Regional Council Dear Gemma Questions relating to changes in NDA allowances
2008 Michigan Cash Grain Farm Business Analysis Summary. Eric Wittenberg And Stephen Harsh. Staff Paper November, 2009
 2008 Michigan Cash Grain Farm Business Analysis Summary Eric Wittenberg And Stephen Harsh Staff Paper 2009-11 November, 2009 Department of Agricultural, Food, and Resource Economics MICHIGAN STATE UNIVERSITY
Suckler beef systems assessing steps to improve profitability
 [Beef 2016 Profitable Technologies, Teagasc, Grange, Dunsany, Ireland, Open Day July 2016] Suckler beef systems assessing steps to improve profitability Paul Crosson, Adam Woods and James Keane Teagasc
 Woodford, K., Roberts, A. and Manning., M., 2018. Dairy composting barns can improve productivity, enhance cow welfare and reduce environmental footprint: A synthesis of current knowledge and research
Kansas Farm Economy Update Land and Leasing
 Kansas Farm Economy Update Land and Leasing Mykel Taylor Kansas State University January 10, 2017 Net Farm and Ranch Income Returns over Total Costs ($/ac) $230,000 $180,000 $130,000 $80,000 $30,000 $(20,000)
Financial Data Standard
 NZ Farm Data Standards Financial Data Standard Version 1.1 Jenna Thornborough, Andrew Cooke, Don Wilson, Vicki Fabling 15 December 2015 Contents Rezare Systems 1 Document Management... 4 1.1 Referenced
2014 Michigan Cash Grain Farm Business Analysis Summary. Eric Wittenberg And Christopher A. Wolf. Staff Paper December, 2015
 2014 Michigan Cash Grain Farm Business Analysis Summary Eric Wittenberg And Christopher A. Wolf Staff Paper 2015-07 December, 2015 Department of Agricultural, Food, and Resource Economics MICHIGAN STATE
2006 Michigan Dairy Grazing Farm Business Analysis Summary. Eric Wittenberg And Christopher Wolf. Staff Paper November, 2007
 2006 Michigan Dairy Grazing Farm Business Analysis Summary Eric Wittenberg And Christopher Wolf Staff Paper 2007-09 November, 2007 Department of Agricultural Economics MICHIGAN STATE UNIVERSITY East Lansing,
STOCKTAKE REPORT 2015
 STOCKTAKE REPORT 2015 This document includes costings for English cattle and sheep enterprises in the year ending 31 March 2015 CONTENTS Welcome... 1 Glossary of abbreviations... 1 Cost and price changes
The New Zealand Agricultural Story. Successes, Challenges and Opportunities from a hungry world
 The New Zealand Agricultural Story. Successes, Challenges and Opportunities from a hungry world Mike Petersen, New Zealand s Special Agricultural Trade Envoy First, a little about New Zealand Population
NEW ZEALAND. Submission to the Subsidiary Body for Scientific and Technological Advice (SBSTA) Views on issues related to agriculture.
 Views on issues related to agriculture.") NEW ZEALAND Submission to the Subsidiary Body for Scientific and Technological Advice (SBSTA) Views on issues related to agriculture September 2013 Context The thirty-eighth session of the Subsidiary Body
NEW ZEALAND Submission to the Subsidiary Body for Scientific and Technological Advice (SBSTA) Views on issues related to agriculture September 2013 Context The thirty-eighth session of the Subsidiary Body
Farm Environment Plan for Willowburn Station
 Farm Environment Plan for Willowburn Station Property name Willowburn Station/W H McAughtrie Farm Ltd Owner name Dannie McAughtrie Phone no Postal address C/- PO Box 200, Omarama Post code Email mcaughtrie@farmside.co.nz
Northern beef case study
 MLA Cost of Production This case study outlines how a northern beef producer would calculate their cost of production for beef, using the MLA Cost of Production calculator. The northern beef herd used
The impact of a carbon price on Australian farm businesses: Grain production
 The impact of a carbon price on Australian farm businesses: Grain production Australian Farm Institute, May 2011. Summary Farm level modelling was carried out of the impact of an economy-wide carbon price
Accounting for Agriculture
 International Journal of Recent Research and Review, Vol. II, June 2012 Accounting for Agriculture R. S. Sharma Department of ABST, Assistant Professor, University of Rajasthan, Jaipur, India Email: sharmarss1959@gmail.com
2009 Michigan Dairy Farm Business Analysis Summary. Eric Wittenberg And Christopher Wolf. Staff Paper December, 2010
 2009 Michigan Dairy Farm Business Analysis Summary Eric Wittenberg And Christopher Wolf Staff Paper 2010-04 December, 2010 Department of Agricultural, Food, and Resource Economics MICHIGAN STATE UNIVERSITY
This qualification has been reviewed. The last date to meet the requirements is 31 December 2018
 NZQF NQ Ref 1188 Version 3 Page 1 of 11 National Certificate in Agriculture (Production Management) with strands in Arable Farming, Cattle Farming, Dairy Farming, Deer Farming, and Sheep Farming Level
An Economic Comparison of Organic and Conventional Dairy Production, and Estimations on the Cost of Transitioning to Organic Production
 An Economic Comparison of Organic and Conventional Dairy Production, and Estimations on the Cost of Transitioning to Organic Production Produced by: the Northeast Organic Farming Association of Vermont
Agriculture & Business Management Notes...
 Agriculture & Business Management Notes... SPA Standardized Performance Analysis For Cow/Calf Producers -- A Worksheet Approach -- Cow/calf producers have been challenged to be lower cost producers, to
2004 Michigan Dairy Farm Business Analysis Summary. Eric Wittenberg Christopher Wolf. Staff Paper September 2005
 Staff Paper 2004 Michigan Dairy Farm Business Analysis Summary Eric Wittenberg Christopher Wolf Staff Paper 2005-10 September 2005 Department of Agricultural Economics MICHIGAN STATE UNIVERSITY East Lansing,
7.0 - nutrient uptake, removal and budgeting
 7.0 - nutrient uptake, removal and budgeting - nutrient uptake - nutrient removal - nutrient budgeting 7.0 nutrient uptake, removal and budgeting NUTRIENT UPTAKE The generalised relationship between plant
2014 Michigan Dairy Farm Business Analysis Summary. Eric Wittenberg And Christopher Wolf. Staff Paper December, 2015
 2014 Michigan Dairy Farm Business Analysis Summary Eric Wittenberg And Christopher Wolf Staff Paper 2015-08 December, 2015 Department of Agricultural, Food, and Resource Economics MICHIGAN STATE UNIVERSITY
2015 Michigan Cash Grain Farm Business Analysis Summary. Eric Wittenberg And Christopher A. Wolf. Staff Paper November, 2016
 2015 Michigan Cash Grain Farm Business Analysis Summary Eric Wittenberg And Christopher A. Wolf Staff Paper 2016-02 November, 2016 Department of Agricultural, Food, and Resource Economics MICHIGAN STATE
LEGUMES AT MEADOWBANK
 LEGUMES AT MEADOWBANK We re in clover Will Grigg BACKGROUND INFO 2800 ha, 2400 ha effective Topography 140 ha Flat (excluding vineyard) 250 ha Cultivable hill developed 40 ha Cultivable hill yet to be
Farm Performance in Scotland
 Farm Performance in Scotland 2015 crop year 1 Enterprise Gross Margins Farm Accounts Survey SAC Consulting Auchincruive Ayr KA6 5HW April 2017 1 Based on a survey of Scottish farms with year ends ranging
John Deere s Outlook on Cattle Economics
 John Deere s Outlook on Cattle Economics U.S. Drought having serious impact on livestock Drought impacting large cattle/dairy states Pushing feed prices higher Forced to feed hay earlier, haul water to
MEMORANDUM. Properties where the grazing of dry dairy cattle forms the predominant livestock enterprise (cattle ratio >66%);
;") Perrin Ag Consultants Limited Box 596 Rotorua 106 Lake Road Rotorua, New Zealand Ph 07 3491212, Fax 07 349 1112 consult@perrinag.net.nz www.perrinag.net.nz MEMORANDUM TO: Stakeholder Advisory Group FROM:
Perrin Ag Consultants Limited Box 596 Rotorua 106 Lake Road Rotorua, New Zealand Ph 07 3491212, Fax 07 349 1112 consult@perrinag.net.nz www.perrinag.net.nz MEMORANDUM TO: Stakeholder Advisory Group FROM:
2015 Michigan Dairy Farm Business Analysis Summary. Eric Wittenberg And Christopher Wolf. Staff Paper November, 2016
 2015 Michigan Dairy Farm Business Analysis Summary Eric Wittenberg And Christopher Wolf Staff Paper 2016-01 November, 2016 Department of Agricultural, Food, and Resource Economics MICHIGAN STATE UNIVERSITY
Purpose of Report. Instructions and Purpose of Report. Instructions: Purpose of Report: Reporting Process:
 Report Prepared at the Request of Wairarapa Regional Irrigation Trust(WRIT) and Meridian Energy Limited Draft Report to WRIT Part Two 31 st March 2009 31 MARCH 2009 Purpose of Report Instructions and Purpose
What is pasture? Pasture as a feed for stock
 PASTURE What is pasture? Pasture is made up of different varieties (cultivars) of grasses, clovers and weed species, as well as bare ground and dung areas. The most productive grasses are perennials and
Economic Analysis on the Valuue of Winter Housing for Dairy Farming in Tararua District Phil Journeaux Paper presented at the 2013 NZARES Conference
 Economic Analysis on the Value of Winte er Housing for Dairy Farming in Tararua District Phil Journeaux AgFirst Waikato phil.journeaux@agfirst.co.nz Paper presented at the 2013 NZARES Conference Lincoln
2011 STATE FFA FARM BUSINESS MANAGEMENT TEST PART 2. Financial Statements (FINPACK Balance Sheets found in the resource information)
") 2011 STATE FFA FARM BUSINESS MANAGEMENT TEST PART 2 Financial Statements (FINPACK Balance Sheets found in the resource information) Please use the Market Value when making the calculations for the Zimmerman
2011 STATE FFA FARM BUSINESS MANAGEMENT TEST PART 2 Financial Statements (FINPACK Balance Sheets found in the resource information) Please use the Market Value when making the calculations for the Zimmerman
Institute of Organic Training & Advice
 Institute of Organic Training & Advice Results of Organic Research: Technical Leaflet 2 Financial Performance, Benchmarking and Management of livestock and mixed organic farming Introduction T he successful
FARM BUSINESS MANAGEMENT
 FARM BUSINESS MANAGEMENT 2009 Annual Report Central and West Central Minnesota April, 2010 A Management Education Program Minnesota State Colleges and Universities Ridgewater College VISIT OUR WEBSITE
Defining nutrient (nitrogen) loss limits within a water management zone on the basis of the natural capital of soil
 loss limits within a water management zone on the basis of the natural capital of soil") Appendix 6 Defining nutrient (nitrogen) loss limits within a water management zone on the basis of the natural capital of soil An appendix to the Farm Strategies for Contaminant Management report by SLURI,
Appendix 6 Defining nutrient (nitrogen) loss limits within a water management zone on the basis of the natural capital of soil An appendix to the Farm Strategies for Contaminant Management report by SLURI,
Eskdalemuir A comparison of forestry and hill farming; productivity and economic impact
 Eskdalemuir A comparison of forestry and hill farming; productivity and economic impact Contents Executive Summary 3 1.0 Introduction and Objectives 4 2.0 Forestry survey and model 6 3.0 Agricultural output
THE FARM BUSINESS SURVEY IN WALES
 Institute of Biological, Environmental and Rural Sciences THE FARM BUSINESS SURVEY IN WALES Wales Farm Income Booklet 2013/14 Results Sponsored by CONTENTS Foreword Overview Introduction Definition of
Overview. Background. Beef and Sheep Outlook Situation and Outlook for Cattle. Cattle Sheep. Inputs Outputs Margins Take Home Messages
 Beef and Sheep Outlook 212 James Breen 1, Kevin Hanrahan 2 & Anne Kinsella 2 1 School of Agriculture and Food Science, UCD 2 Agricultural Economics & Farm Surveys Dept. Teagasc Outlook 212 19 th January
Expansion Through Vertical Integration. InnoVeg. Horticulture Australia Limited BUSINESS CASE
 InnoVeg Horticulture Australia Limited BUSINESS CASE Expansion Through Vertical Integration The Vegetable Industry Development Program is funded by HAL using the vegetable levy and matched funds from the