Statistical Methods for Network Analysis of Biological Data
|
|
|
- Vincent Brooks
- 5 years ago
- Views:
Transcription
1 The Protein Interaction Workshop, 8 12 June 2015, IMS Statistical Methods for Network Analysis of Biological Data Minghua Deng, dengmh@pku.edu.cn School of Mathematical Sciences Center for Quantitative Biology Peking University, Beijing June 2015, NUS
2 Outline Part I: Correlation inference for genomic survey data Part II: Network based eqtl analysis
3 Part I: Correlation Inference for Genomic Survey Data Joint work with Huaying Fang, Chengcheng Huang, Hongyu Zhao Fang et al. Bioinformatics. June 4, 2015
4 Metagenomics Microbes play important role in environment and human life. Metagenomics is the direct sequencing of microbe community. HMP (Human Microbiome Project) aims to investigate the fundamental roles of the microbes in human health and disease. But only relative abundances of different microbes make sense for metagenomics data.
5 Genomic Survey Data Such a data is called as genomic survey data It s called as compositional data in statistics. Suppose the data is for p species, where Y=(y 1,,y p ) is the latent absolute abundance.
6 Correlation for Compositional Data It has been known since Karl Pearson that direct correlation for compositional data can produce unreliable results. Aitchison (1982) proposed a family of log ratio transformation Aitchison, J. (1982). The statistical analysis of compositional data. J. Roy. Stat. Soc. B Met., 44(2),
7 Correlation for Compositional Data A natural way is to study the correlation among the latent variable ys For technical reason, we can focus on the correlation among log transform of ys. The objective is to estimate this from observed data.
8 Correlation for Compositional Data Covariance estimation is very challenging because of small sample size (n<p). But now the problem is more challenging because estimate from is underdetermined. Number of parameters
9 SparCC Frideman and Alm (2012) proposed a algorithm SparCC based on the following addition assumption to solve estimation equation, An iterative algorithm was proposed. Note that the iterative procedure can result in correlations whose magnitude is greater than 1. Friedman, J. and Alm, E. J. (2012). Inferring correlation networks from genomic survey data. PLoS Comput. Biol., 8(9), e
10 Our Method Let F be a p x p matrix with where 1p is a p dimensional vector with all entries 1. We have where is the sample variance of lnx.
11 Our Method We propose a novel method CCLasso based on least square with lasso type penalty, with the sparsity assumption CCLasso minimize following objective function where Tuning parameter can be selected through cross validation.
12 Algorithm The above minimization can be solved by Alternating Direction Augmented Lagrangian Method (ADAM) In most cases, the algorithm can convergent to a positive definite matrix.
13 Random model Simulation
14 Simulation Neighbor model Random select p points, and select its 10 neighbors with strength 0.5.
15 Simulation Hub model Random select 3 points as hubs and other p 3 points as common points. Hubs are connecting to common with probability 0.7, common points are connecting with probability 0.2. Strength is set to 0.2. The diagonal is selected so that the matrix is positive definite, and then normalized to 1.
16 AR(4) model Simulation
17 Simulation Block Model First divide nodes into 5 blocks equally. Then is equal to 0.2 with probability 0.2 if node iand j are in different block; 0.4 with probability 0.6 if nodes iand j are in the same block. The diagonal is selected so that the matrix is positive definite, and then normalized to 1.
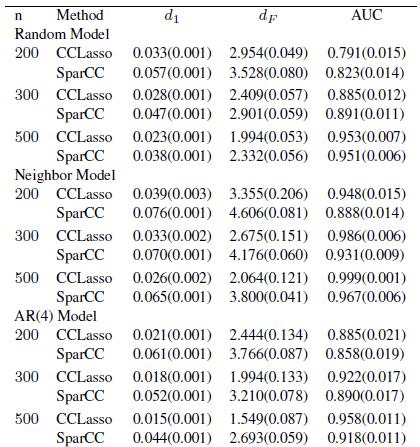
18 Measure the Performance Distance between the real matrix and estimated one AUC of ROC curve
19
20

21
22 Notes Expected number of edges in neighbor and AR(4) model is proportional to p, while p 2 for others. Random model roughly satisfies the assumption of SparCC, so SparCC is better than our method Our method outperforms SparCC in all other models.
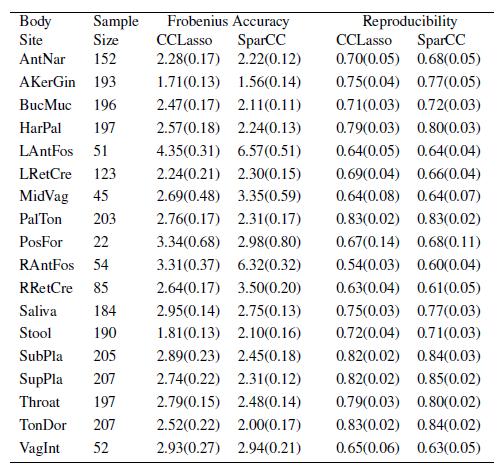
23 Real Data Real data are download from HMP, including microbes in 18 body sites. Species are characterized by OUT As no benchmark is available, the following two measurements are used Consistent Accuracy: Frobenius norm of the difference between two estimated covariance matrix from part and all samples. Consistent reproducibility: Fraction of same edges between two estimated covariance matrix from part and all samples.
24

25 Result on Permutated Data Binning sets: [0,0.001], [0.001, 0.1], [0.1, 03]
26 Future Work Theoretical works Identifiability Edge select consistency How to deal 0s in compositional data? How to explore non-linear relation among the latent variables?
27 Part II: Network based eqtl Analysis Joint work with Lin Wang, Wei Zheng, Hongyu Zhao Lin Wang et al. Plos Genetics, 9(3): e , 2013
28 eqtl DNA mrna Genotype Data (SNP polymorphism) Gene Expression Data Expression QTL (eqtl): Treat gene expression intensity as a continuous trait. Goal: Identify genetic loci where DNA significantly affects gene expression.
29 Cis eqtl and Trans eqtl Copied from Harm Jan Westra s PPT

30 eqtl Mapping 1D 2D
31 2D trait Conditional Bivariate Model (Ho, et al, 2011; Chen, et al. 2011; Daye, et al. 2012)
32 Methods Finding interacting loci (epistasis) associated with 2D traits Lin Wang et al. Plos Genetics, 9(3): e , 2013
33 Filtering Process Computational burden ~800*400*4000*2000=2.56*10 12 Potential of Association Where n ij is the number of individuals having the genotype iand j. In yeast data, it can achieve about 16 fold reduction of computation time.
34 Application Yeast dataset (Kruglyak group, 2008, Plos Bio) The experiments were performed under two conditions: glucose and ethanol. 4,482 genes measured in 109 segregants derived from a cross between BY and RM. Genotypes at 2,956 loci. (We combined neighboring loci having fewer than 5 discordant calls among the 109 samples, leading to 820 merged markers.)
35 Result Cutoff for p value from LR test is (FDR<0.2) FDR is estimated from permutation test 225 and 224 Epistasis 2D modules (2 genes+2 Markers) were detected in glucose and ethanol condition
36 GO Enrichment There is an enrichment of pairs having the same functional annotations according to GO slim. (31 out of 225 with a p value of 0.05 and 58 out of 224 with a p value of ) Most pairs have different functional annotations suggesting either unknown functions for these genes or interactions between different biology processes.

37 An Example The two genes (GOT1 and ERV14) are functional in ER to Golgi vesicle mediated transport. The two loci are located at two genes Yip1 and Mst28 which also functions in ER to Golgi vesiclemediated transport. Literature suggests the regulatory relationships between the two loci and the two genes.

38 Clustering in the Epistasis Map We applied the hierarchical clustering to this interaction map and found densely interacting locus clusters which contains a group of loci mapping to oxidative phosphorylation pathway. Their 2D traits also contain lots of genes in this pathway. p

39 Environment Modulates Regulatory Modules
40 Environment Modulates Regulatory Modules Glucose response pathway modulates ribosome related modules We observed that ribosome biogenesis related regulation was only identified under the glucose condition Previous study found that ribosome biogenesis genes induced in response to high, but not low glucose signals

41 Environment Modulates Regulatory Modules Glucose modulates ribosome related modules through glucose response pathway
42 Extensions Finding the locus associated with the network among a group of genes A simple way is to test each pairs individually. Or we can test
43 Summary We developed penalized likelihood model to infer the correlation for genomic survey data. We developed an conditional bivariate model to find higher level association in eqtl analysis.
44 Thanks for your attention! Questions?
Package trigger. R topics documented: August 16, Type Package
 Type Package Package trigger August 16, 2018 Title Transcriptional Regulatory Inference from Genetics of Gene ExpRession Version 1.26.0 Author Lin S. Chen , Dipen P. Sangurdekar
CS 5984: Application of Basic Clustering Algorithms to Find Expression Modules in Cancer
 CS 5984: Application of Basic Clustering Algorithms to Find Expression Modules in Cancer T. M. Murali January 31, 2006 Innovative Application of Hierarchical Clustering A module map showing conditional
Workshop on Data Science in Biomedicine
 Workshop on Data Science in Biomedicine July 6 Room 1217, Department of Mathematics, Hong Kong Baptist University 09:30-09:40 Welcoming Remarks 9:40-10:20 Pak Chung Sham, Centre for Genomic Sciences, The
Scoring pathway activity from gene expression data
 Scoring pathway activity from gene expression data Jörg Rahnenführer Computational Biology and Applied Algorithmics Max Planck Institute for Informatics D-66123 Saarbrücken Germany NGFN - Courses in Practical
Introduction to Quantitative Genomics / Genetics
 Introduction to Quantitative Genomics / Genetics BTRY 7210: Topics in Quantitative Genomics and Genetics September 10, 2008 Jason G. Mezey Outline History and Intuition. Statistical Framework. Current
Advanced Introduction to Machine Learning
 Advanced Introduction to Machine Learning 10715, Fall 2014 Structured Sparsity, with application in Computational Genomics Eric Xing Lecture 3, September 15, 2014 Reading: Eric Xing @ CMU, 2014 1 Structured
Course Announcements
 Statistical Methods for Quantitative Trait Loci (QTL) Mapping II Lectures 5 Oct 2, 2 SE 527 omputational Biology, Fall 2 Instructor Su-In Lee T hristopher Miles Monday & Wednesday 2-2 Johnson Hall (JHN)
SNPs - GWAS - eqtls. Sebastian Schmeier
 SNPs - GWAS - eqtls s.schmeier@gmail.com http://sschmeier.github.io/bioinf-workshop/ 17.08.2015 Overview Single nucleotide polymorphism (refresh) SNPs effect on genes (refresh) Genome-wide association
Statistical Methods for Quantitative Trait Loci (QTL) Mapping
 Mapping") Statistical Methods for Quantitative Trait Loci (QTL) Mapping Lectures 4 Oct 10, 011 CSE 57 Computational Biology, Fall 011 Instructor: Su-In Lee TA: Christopher Miles Monday & Wednesday 1:00-1:0 Johnson
Statistical Methods for Quantitative Trait Loci (QTL) Mapping Lectures 4 Oct 10, 011 CSE 57 Computational Biology, Fall 011 Instructor: Su-In Lee TA: Christopher Miles Monday & Wednesday 1:00-1:0 Johnson
Illuminating Genetic Networks with Random Forest
 ? Illuminating Genetic Networks with Random Forest ANDREAS BEYER University of Cologne Outline Random Forest Applications QTL mapping Epistasis (analyzing model structure) 2 Random Forest HOW DOES IT WORK?
Computational Genomics
 Computational Genomics 10-810/02 810/02-710, Spring 2009 Quantitative Trait Locus (QTL) Mapping Eric Xing Lecture 23, April 13, 2009 Reading: DTW book, Chap 13 Eric Xing @ CMU, 2005-2009 1 Phenotypical
Genomic Selection with Linear Models and Rank Aggregation
 Genomic Selection with Linear Models and Rank Aggregation m.scutari@ucl.ac.uk Genetics Institute March 5th, 2012 Genomic Selection Genomic Selection Genomic Selection: an Overview Genomic selection (GS)
By the end of this lecture you should be able to explain: Some of the principles underlying the statistical analysis of QTLs
 (3) QTL and GWAS methods By the end of this lecture you should be able to explain: Some of the principles underlying the statistical analysis of QTLs Under what conditions particular methods are suitable
Lecture: Genetic Basis of Complex Phenotypes Advanced Topics in Computa8onal Genomics
 Lecture: Genetic Basis of Complex Phenotypes 02-715 Advanced Topics in Computa8onal Genomics Genome Polymorphisms A Human Genealogy TCGAGGTATTAAC The ancestral chromosome From SNPS TCGAGGTATTAAC TCTAGGTATTAAC
 http://genemapping.org/ Epistasis in Association Studies David Evans Law of Independent Assortment Biological Epistasis Bateson (99) a masking effect whereby a variant or allele at one locus prevents
QTL mapping in mice. Karl W Broman. Department of Biostatistics Johns Hopkins University Baltimore, Maryland, USA.
 QTL mapping in mice Karl W Broman Department of Biostatistics Johns Hopkins University Baltimore, Maryland, USA www.biostat.jhsph.edu/ kbroman Outline Experiments, data, and goals Models ANOVA at marker
Survival Outcome Prediction for Cancer Patients based on Gene Interaction Network Analysis and Expression Profile Classification
 Survival Outcome Prediction for Cancer Patients based on Gene Interaction Network Analysis and Expression Profile Classification Final Project Report Alexander Herrmann Advised by Dr. Andrew Gentles December
QTL Mapping, MAS, and Genomic Selection
 QTL Mapping, MAS, and Genomic Selection Dr. Ben Hayes Department of Primary Industries Victoria, Australia A short-course organized by Animal Breeding & Genetics Department of Animal Science Iowa State
Multi-SNP Models for Fine-Mapping Studies: Application to an. Kallikrein Region and Prostate Cancer
 Multi-SNP Models for Fine-Mapping Studies: Application to an association study of the Kallikrein Region and Prostate Cancer November 11, 2014 Contents Background 1 Background 2 3 4 5 6 Study Motivation
BTRY 7210: Topics in Quantitative Genomics and Genetics
 BTRY 7210: Topics in Quantitative Genomics and Genetics Jason Mezey Biological Statistics and Computational Biology (BSCB) Department of Genetic Medicine jgm45@cornell.edu January 29, 2015 Why you re here
Authors: Yumin Xiao. Supervisor: Xia Shen
 Incorporating gene annotation information into fine-mapping quantitative trait loci in genome-wide association studies: a hierarchical generalized linear model approach Authors: Yumin Xiao Supervisor:
Database Searching and BLAST Dannie Durand
 Computational Genomics and Molecular Biology, Fall 2013 1 Database Searching and BLAST Dannie Durand Tuesday, October 8th Review: Karlin-Altschul Statistics Recall that a Maximal Segment Pair (MSP) is
Quantitative Genetics
 Quantitative Genetics Polygenic traits Quantitative Genetics 1. Controlled by several to many genes 2. Continuous variation more variation not as easily characterized into classes; individuals fall into
BIOINF/BENG/BIMM/CHEM/CSE 184: Computational Molecular Biology. Lecture 2: Microarray analysis
 BIOINF/BENG/BIMM/CHEM/CSE 184: Computational Molecular Biology Lecture 2: Microarray analysis Genome wide measurement of gene transcription using DNA microarray Bruce Alberts, et al., Molecular Biology
QTL mapping in mice. Karl W Broman. Department of Biostatistics Johns Hopkins University Baltimore, Maryland, USA.
 QTL mapping in mice Karl W Broman Department of Biostatistics Johns Hopkins University Baltimore, Maryland, USA www.biostat.jhsph.edu/ kbroman Outline Experiments, data, and goals Models ANOVA at marker
Deep learning sequence-based ab initio prediction of variant effects on expression and disease risk
 Summer Review 7 Deep learning sequence-based ab initio prediction of variant effects on expression and disease risk Jian Zhou 1,2,3, Chandra L. Theesfeld 1, Kevin Yao 3, Kathleen M. Chen 3, Aaron K. Wong
Permutation Clustering of the DNA Sequence Facilitates Understanding of the Nonlinearly Organized Genome
 RESEARCH PROPOSAL Permutation Clustering of the DNA Sequence Facilitates Understanding of the Nonlinearly Organized Genome Qiao JIN School of Medicine, Tsinghua University Advisor: Prof. Xuegong ZHANG
Effectively identifying regulatory hotspots while capturing expression heterogeneity in gene expression studies
 Effectively identifying regulatory hotspots while capturing expression heterogeneity in gene expression studies The Harvard community has made this article openly available. Please share how this access
Probabilistic Graphical Models
 School of Computer Science Probabilistic Graphical Models Graph-induced structured input/output models - Case Study: Disease Association Analysis Eric Xing Lecture 25, April 16, 2014 Reading: See class
Title: Genome-Wide Predictions of Transcription Factor Binding Events using Multi- Dimensional Genomic and Epigenomic Features Background
 Title: Genome-Wide Predictions of Transcription Factor Binding Events using Multi- Dimensional Genomic and Epigenomic Features Team members: David Moskowitz and Emily Tsang Background Transcription factors
BTRY 7210: Topics in Quantitative Genomics and Genetics
 BTRY 7210: Topics in Quantitative Genomics and Genetics Jason Mezey Biological Statistics and Computational Biology (BSCB) Department of Genetic Medicine jgm45@cornell.edu Spring 2015, Thurs.,12:20-1:10
Bioinformatics opportunities in Genomics and Genetics
 Bioinformatics opportunities in Genomics and Genetics Case Study: Prediction of novel gene functions of NSF1/YPL230W in Saccharomyces Cerevisiae via search for maximally interconnected sub-graph Kyrylo
Probabilistic Graphical Models
 School of Computer Science Probabilistic Graphical Models Graph-induced structured input/output models - Case Study: Disease Association Analysis Eric Xing Lecture 23, April 6, 2016 Reading: See class
Inferring Gene-Gene Interactions and Functional Modules Beyond Standard Models
 Inferring Gene-Gene Interactions and Functional Modules Beyond Standard Models Haiyan Huang Department of Statistics, UC Berkeley Feb 7, 2018 Background Background High dimensionality (p >> n) often results
Scoring Alignments. Genome 373 Genomic Informatics Elhanan Borenstein
 Scoring Alignments Genome 373 Genomic Informatics Elhanan Borenstein A quick review Course logistics Genomes (so many genomes) The computational bottleneck Python: Programs, input and output Number and
Robust Prediction of Expression Differences among Human Individuals Using Only Genotype Information
 Robust Prediction of Expression Differences among Human Individuals Using Only Genotype Information Ohad Manor 1,2, Eran Segal 1,2 * 1 Department of Computer Science and Applied Mathematics, Weizmann Institute
Marker types. Potato Association of America Frederiction August 9, Allen Van Deynze
 Marker types Potato Association of America Frederiction August 9, 2009 Allen Van Deynze Use of DNA Markers in Breeding Germplasm Analysis Fingerprinting of germplasm Arrangement of diversity (clustering,
Summary for BIOSTAT/STAT551 Statistical Genetics II: Quantitative Traits
 Summary for BIOSTAT/STAT551 Statistical Genetics II: Quantitative Traits Gained an understanding of the relationship between a TRAIT, GENETICS (single locus and multilocus) and ENVIRONMENT Theoretical
Detecting gene-gene interactions in high-throughput genotype data through a Bayesian clustering procedure
 Detecting gene-gene interactions in high-throughput genotype data through a Bayesian clustering procedure Sui-Pi Chen and Guan-Hua Huang Institute of Statistics National Chiao Tung University Hsinchu,
Bayesian Networks as framework for data integration
 Bayesian Networks as framework for data integration Jun Zhu, Ph. D. Department of Genomics and Genetic Sciences Icahn Institute of Genomics and Multiscale Biology Icahn Medical School at Mount Sinai New
Bayesian Variable Selection and Data Integration for Biological Regulatory Networks
 Bayesian Variable Selection and Data Integration for Biological Regulatory Networks Shane T. Jensen Department of Statistics The Wharton School, University of Pennsylvania stjensen@wharton.upenn.edu Gary
Tree Depth in a Forest
 Tree Depth in a Forest Mark Segal Center for Bioinformatics & Molecular Biostatistics Division of Bioinformatics Department of Epidemiology and Biostatistics UCSF NUS / IMS Workshop on Classification and
Haplotype Association Mapping by Density-Based Clustering in Case-Control Studies (Work-in-Progress)
") Haplotype Association Mapping by Density-Based Clustering in Case-Control Studies (Work-in-Progress) Jing Li 1 and Tao Jiang 1,2 1 Department of Computer Science and Engineering, University of California
Haplotype Association Mapping by Density-Based Clustering in Case-Control Studies (Work-in-Progress) Jing Li 1 and Tao Jiang 1,2 1 Department of Computer Science and Engineering, University of California
From Genotype to Phenotype
 From Genotype to Phenotype Johanna Vilkki Green technology, Natural Resources Institute Finland Systems biology Genome Transcriptome genes mrna Genotyping methodology SNP TOOLS, WG SEQUENCING Functional
Finding Compensatory Pathways in Yeast Genome
 Finding Compensatory Pathways in Yeast Genome Olga Ohrimenko Abstract Pathways of genes found in protein interaction networks are used to establish a functional linkage between genes. A challenging problem
Introduction to RNA-Seq. David Wood Winter School in Mathematics and Computational Biology July 1, 2013
 Introduction to RNA-Seq David Wood Winter School in Mathematics and Computational Biology July 1, 2013 Abundance RNA is... Diverse Dynamic Central DNA rrna Epigenetics trna RNA mrna Time Protein Abundance
Machine learning applications in genomics: practical issues & challenges. Yuzhen Ye School of Informatics and Computing, Indiana University
 Machine learning applications in genomics: practical issues & challenges Yuzhen Ye School of Informatics and Computing, Indiana University Reference Machine learning applications in genetics and genomics
1 why study multiple traits together?
 Multiple Traits & Microarrays why map multiple traits together? central dogma via microarrays diabetes case study why are traits correlated? close linkage or pleiotropy? how to handle high throughput?
Functional genomics + Data mining
 Functional genomics + Data mining BIO337 Systems Biology / Bioinformatics Spring 2014 Edward Marcotte, Univ of Texas at Austin Edward Marcotte/Univ of Texas/BIO337/Spring 2014 Functional genomics + Data
Cross Haplotype Sharing Statistic: Haplotype length based method for whole genome association testing
 Cross Haplotype Sharing Statistic: Haplotype length based method for whole genome association testing André R. de Vries a, Ilja M. Nolte b, Geert T. Spijker c, Dumitru Brinza d, Alexander Zelikovsky d,
and Promoter Sequence Data
 : Combining Gene Expression and Promoter Sequence Data Outline 1. Motivation Functionally related genes cluster together genes sharing cis-elements cluster together transcriptional regulation is modular
2. Materials and Methods
 Identification of cancer-relevant Variations in a Novel Human Genome Sequence Robert Bruggner, Amir Ghazvinian 1, & Lekan Wang 1 CS229 Final Report, Fall 2009 1. Introduction Cancer affects people of all
Comparative eqtl analyses within and between seven tissue types suggest mechanisms underlying cell type specificity of eqtls
 Comparative eqtl analyses within and between seven tissue types suggest mechanisms underlying cell type specificity of eqtls, Duke University Christopher D Brown, University of Pennsylvania November 9th,
High-density SNP Genotyping Analysis of Broiler Breeding Lines
 Animal Industry Report AS 653 ASL R2219 2007 High-density SNP Genotyping Analysis of Broiler Breeding Lines Abebe T. Hassen Jack C.M. Dekkers Susan J. Lamont Rohan L. Fernando Santiago Avendano Aviagen
Monday, November 8 Shantz 242 E (the usual place) 5:00-7:00 PM
 5:00-7:00 PM") Review Session Monday, November 8 Shantz 242 E (the usual place) 5:00-7:00 PM I ll answer questions on my material, then Chad will answer questions on his material. Test Information Today s notes, the
Review Session Monday, November 8 Shantz 242 E (the usual place) 5:00-7:00 PM I ll answer questions on my material, then Chad will answer questions on his material. Test Information Today s notes, the
A Protein Secondary Structure Prediction Method Based on BP Neural Network Ru-xi YIN, Li-zhen LIU*, Wei SONG, Xin-lei ZHAO and Chao DU
 2017 2nd International Conference on Artificial Intelligence: Techniques and Applications (AITA 2017 ISBN: 978-1-60595-491-2 A Protein Secondary Structure Prediction Method Based on BP Neural Network Ru-xi
Nature Genetics: doi: /ng Supplementary Figure 1. H3K27ac HiChIP enriches enhancer promoter-associated chromatin contacts.
 Supplementary Figure 1 H3K27ac HiChIP enriches enhancer promoter-associated chromatin contacts. (a) Schematic of chromatin contacts captured in H3K27ac HiChIP. (b) Loop call overlap for cohesin HiChIP
Haplotype Based Association Tests. Biostatistics 666 Lecture 10
 Haplotype Based Association Tests Biostatistics 666 Lecture 10 Last Lecture Statistical Haplotyping Methods Clark s greedy algorithm The E-M algorithm Stephens et al. coalescent-based algorithm Hypothesis
Using RNAseq data to improve genomic selection in dairy cattle
 Using RNAseq data to improve genomic selection in dairy cattle T. Lopdell 1,2 K. Tiplady 1 & M. Littlejohn 1 1 R&D, Livestock Improvement Corporation, Ruakura Rd, Newstead, Hamilton, New Zealand 2 School
Syllabus for BIOS 101, SPRING 2013
 Page 1 Syllabus for BIOS 101, SPRING 2013 Name: BIOSTATISTICS 101 for Cancer Researchers Time: March 20 -- May 29 4-5pm in Wednesdays, [except 4/15 (Mon) and 5/7 (Tue)] Location: SRB Auditorium Background
Conifer Translational Genomics Network Coordinated Agricultural Project
 Conifer Translational Genomics Network Coordinated Agricultural Project Genomics in Tree Breeding and Forest Ecosystem Management ----- Module 4 Quantitative Genetics Nicholas Wheeler & David Harry Oregon
Supplementary Figure 1 Genotyping by Sequencing (GBS) pipeline used in this study to genotype maize inbred lines. The 14,129 maize inbred lines were
 pipeline used in this study to genotype maize inbred lines. The 14,129 maize inbred lines were") Supplementary Figure 1 Genotyping by Sequencing (GBS) pipeline used in this study to genotype maize inbred lines. The 14,129 maize inbred lines were processed following GBS experimental design 1 and bioinformatics
Supplementary Figure 1 Genotyping by Sequencing (GBS) pipeline used in this study to genotype maize inbred lines. The 14,129 maize inbred lines were processed following GBS experimental design 1 and bioinformatics
Bioinformatics : Gene Expression Data Analysis
 05.12.03 Bioinformatics : Gene Expression Data Analysis Aidong Zhang Professor Computer Science and Engineering What is Bioinformatics Broad Definition The study of how information technologies are used
Supplementary Information
 Supplementary Information Supplement to Genome-wide allele- and strand-specific expression profiling, Julien Gagneur, Himanshu Sinha, Fabiana Perocchi, Richard Bourgon, Wolfgang Huber and Lars M. Steinmetz
SAS Microarray Solution for the Analysis of Microarray Data. Susanne Schwenke, Schering AG Dr. Richardus Vonk, Schering AG
 for the Analysis of Microarray Data Susanne Schwenke, Schering AG Dr. Richardus Vonk, Schering AG Overview Challenges in Microarray Data Analysis Software for Microarray Data Analysis SAS Scientific Discovery
Inferring Gene Networks from Microarray Data using a Hybrid GA p.1
 Inferring Gene Networks from Microarray Data using a Hybrid GA Mark Cumiskey, John Levine and Douglas Armstrong johnl@inf.ed.ac.uk http://www.aiai.ed.ac.uk/ johnl Institute for Adaptive and Neural Computation
arxiv: v1 [stat.ap] 31 Jul 2014
![arxiv: v1 [stat.ap] 31 Jul 2014](/thumbs/83/88363606.jpg "arxiv: v1 [stat.ap] 31 Jul 2014") Fast Genome-Wide QTL Analysis Using MENDEL arxiv:1407.8259v1 [stat.ap] 31 Jul 2014 Hua Zhou Department of Statistics North Carolina State University Raleigh, NC 27695-8203 Email: hua_zhou@ncsu.edu Tao
Fast Genome-Wide QTL Analysis Using MENDEL arxiv:1407.8259v1 [stat.ap] 31 Jul 2014 Hua Zhou Department of Statistics North Carolina State University Raleigh, NC 27695-8203 Email: hua_zhou@ncsu.edu Tao
Random matrix analysis for gene co-expression experiments in cancer cells
 Random matrix analysis for gene co-expression experiments in cancer cells OIST-iTHES-CTSR 2016 July 9 th, 2016 Ayumi KIKKAWA (MTPU, OIST) Introduction : What is co-expression of genes? There are 20~30k
Lecture 8: Predicting and analyzing metagenomic composition from 16S survey data
 Lecture 8: Predicting and analyzing metagenomic composition from 16S survey data What can we tell about the taxonomic and functional stability of microbiota? Why? Nature. 2012; 486(7402): 207 214. doi:10.1038/nature11234
POPULATION GENETICS Winter 2005 Lecture 18 Quantitative genetics and QTL mapping
 POPULATION GENETICS Winter 2005 Lecture 18 Quantitative genetics and QTL mapping - from Darwin's time onward, it has been widely recognized that natural populations harbor a considerably degree of genetic
Microbiomes and metabolomes
 Microbiomes and metabolomes Michael Inouye Baker Heart and Diabetes Institute Univ of Melbourne / Monash Univ Summer Institute in Statistical Genetics 2017 Integrative Genomics Module Seattle @minouye271
Traditional Genetic Improvement. Genetic variation is due to differences in DNA sequence. Adding DNA sequence data to traditional breeding.
 1 Introduction What is Genomic selection and how does it work? How can we best use DNA data in the selection of cattle? Mike Goddard 5/1/9 University of Melbourne and Victorian DPI of genomic selection
An Analytical Upper Bound on the Minimum Number of. Recombinations in the History of SNP Sequences in Populations
 An Analytical Upper Bound on the Minimum Number of Recombinations in the History of SNP Sequences in Populations Yufeng Wu Department of Computer Science and Engineering University of Connecticut Storrs,
Single-cell sequencing
 Single-cell sequencing Harri Lähdesmäki Department of Computer Science Aalto University December 5, 2017 Contents Background & Motivation Single cell sequencing technologies Single cell sequencing data
SolCAP. Executive Commitee : David Douches Walter De Jong Robin Buell David Francis Alexandra Stone Lukas Mueller AllenVan Deynze
 SolCAP Solanaceae Coordinated Agricultural Project Supported by the National Research Initiative Plant Genome Program of USDA CSREES for the Improvement of Potato and Tomato Executive Commitee : David
Introduction to QTL mapping
 Introduction to QL mapping in experimental crosses Karl W Broman Department of Biostatistics he Johns Hopkins niversity http://biosun.biostat.jhsph.edu/ kbroman Outline Experiments and data Models ANOVA
The application of hidden markov model in building genetic regulatory network
 J. Biomedical Science and Engineering, 2010, 3, 633-637 doi:10.4236/bise.2010.36086 Published Online June 2010 (http://www.scirp.org/ournal/bise/). The application of hidden markov model in building genetic
Mapping and Mapping Populations
 Mapping and Mapping Populations Types of mapping populations F 2 o Two F 1 individuals are intermated Backcross o Cross of a recurrent parent to a F 1 Recombinant Inbred Lines (RILs; F 2 -derived lines)
Introduction. CS482/682 Computational Techniques in Biological Sequence Analysis
 Introduction CS482/682 Computational Techniques in Biological Sequence Analysis Outline Course logistics A few example problems Course staff Instructor: Bin Ma (DC 3345, http://www.cs.uwaterloo.ca/~binma)
Midterm 1 Results. Midterm 1 Akey/ Fields Median Number of Students. Exam Score
 Midterm 1 Results 10 Midterm 1 Akey/ Fields Median - 69 8 Number of Students 6 4 2 0 21 26 31 36 41 46 51 56 61 66 71 76 81 86 91 96 101 Exam Score Quick review of where we left off Parental type: the
Grand Challenges in Computational Biology
 Grand Challenges in Computational Biology Kimmen Sjölander UC Berkeley Reconstructing the Tree of Life CITRIS-INRIA workshop 24 May, 2011 Prediction of biological pathways and networks Human microbiome
advanced analysis of gene expression microarray data aidong zhang World Scientific State University of New York at Buffalo, USA
 advanced analysis of gene expression microarray data aidong zhang State University of New York at Buffalo, USA World Scientific NEW JERSEY LONDON SINGAPORE BEIJING SHANGHAI HONG KONG TAIPEI CHENNAI Contents
Supplementary Text. eqtl mapping in the Bay x Sha recombinant population.
 Supplementary Text eqtl mapping in the Bay x Sha recombinant population. Expression levels for 24,576 traits (Gene-specific Sequence Tags: GSTs, CATMA array version 2) was measured in RNA extracted from
Drift versus Draft - Classifying the Dynamics of Neutral Evolution
 Drift versus Draft - Classifying the Dynamics of Neutral Evolution Alison Feder December 3, 203 Introduction Early stages of this project were discussed with Dr. Philipp Messer Evolutionary biologists
Identification of biological themes in microarray data from a mouse heart development time series using GeneSifter
 Identification of biological themes in microarray data from a mouse heart development time series using GeneSifter VizX Labs, LLC Seattle, WA 98119 Abstract Oligonucleotide microarrays were used to study
Genomic resources. for non-model systems
 Genomic resources for non-model systems 1 Genomic resources Whole genome sequencing reference genome sequence comparisons across species identify signatures of natural selection population-level resequencing
Bioinformatics. Microarrays: designing chips, clustering methods. Fran Lewitter, Ph.D. Head, Biocomputing Whitehead Institute
 Bioinformatics Microarrays: designing chips, clustering methods Fran Lewitter, Ph.D. Head, Biocomputing Whitehead Institute Course Syllabus Jan 7 Jan 14 Jan 21 Jan 28 Feb 4 Feb 11 Feb 18 Feb 25 Sequence
Experimental Design and Sample Size Requirement for QTL Mapping
 Experimental Design and Sample Size Requirement for QTL Mapping Zhao-Bang Zeng Bioinformatics Research Center Departments of Statistics and Genetics North Carolina State University zeng@stat.ncsu.edu 1
Data Mining and Applications in Genomics
 Data Mining and Applications in Genomics Lecture Notes in Electrical Engineering Volume 25 For other titles published in this series, go to www.springer.com/series/7818 Sio-Iong Ao Data Mining and Applications
Whole Transcriptome Analysis of Illumina RNA- Seq Data. Ryan Peters Field Application Specialist
 Whole Transcriptome Analysis of Illumina RNA- Seq Data Ryan Peters Field Application Specialist Partek GS in your NGS Pipeline Your Start-to-Finish Solution for Analysis of Next Generation Sequencing Data
Nature Genetics: doi: /ng.3254
 Supplementary Figure 1 Comparing the inferred histories of the stairway plot and the PSMC method using simulated samples based on five models. (a) PSMC sim-1 model. (b) PSMC sim-2 model. (c) PSMC sim-3
Prediction and Meta-Analysis
 Prediction and Meta-Analysis May 13, 2015 Greta Linse Peterson Director of Product Management & Quality Questions during the presentation Use the Questions pane in your GoToWebinar window Golden About
A Propagation-based Algorithm for Inferring Gene-Disease Associations
 A Propagation-based Algorithm for Inferring Gene-Disease Associations Oron Vanunu Roded Sharan Abstract: A fundamental challenge in human health is the identification of diseasecausing genes. Recently,
Protein-Protein-Interaction Networks. Ulf Leser, Samira Jaeger
 Protein-Protein-Interaction Networks Ulf Leser, Samira Jaeger This Lecture Protein-protein interactions Characteristics Experimental detection methods Databases Protein-protein interaction networks Ulf
dmgwas: dense module searching for genome wide association studies in protein protein interaction network
 dmgwas: dense module searching for genome wide association studies in protein protein interaction network Peilin Jia 1,2, Siyuan Zheng 1 and Zhongming Zhao 1,2,3 1 Department of Biomedical Informatics,
RNA-SEQUENCING ANALYSIS
 RNA-SEQUENCING ANALYSIS Joseph Powell SISG- 2018 CONTENTS Introduction to RNA sequencing Data structure Analyses Transcript counting Alternative splicing Allele specific expression Discovery APPLICATIONS
Huijuan Feng, Shining Ma,Chao Ye & Zhixing Feng
 Huijuan Feng, Shining Ma,Chao Ye & Zhixing Feng Background-Author introduction Research interest: Methods for gene mapping of complex traits Inference of population structure from genetic data Genome variation
The effect of host genetics factors on
 The effect of host genetics factors on shaping Die Universität pig gut Hohenheim microbiota M. Maushammer 1, A. Camarinha-Silva 1, M. Vital 2, R. Wellmann 1, S. Preuss 1, J. Bennewitz 1 1 University of
ENGR 213 Bioengineering Fundamentals April 25, A very coarse introduction to bioinformatics
 A very coarse introduction to bioinformatics In this exercise, you will get a quick primer on how DNA is used to manufacture proteins. You will learn a little bit about how the building blocks of these