Measure of how much stuff (aka suspended solids) is mixed into the water (i.e., cloudy vs clear) Suspended solids = clay, silt, plankton, industrial
|
|
|
- Rosa Craig
- 5 years ago
- Views:
Transcription

1


2

3

4


5 Measure of how much stuff (aka suspended solids) is mixed into the water (i.e., cloudy vs clear) Suspended solids = clay, silt, plankton, industrial wastes, sewage Should not be confused with color, since darkly colored water can still be clear This measurement should be low Problems Caused by Suspended Solids: Covers food sources, nests and eggs Blocks sunlight from plants Most common water pollutant Makes it hard for organisms to breathe

")
 that stir up")
6 Possible Causes of Turbidity Erosion from agricultural fields construction sites driveways, roads, and lawns natural and accelerated erosion of stream bank Wastewater treatment plants Runoff from urban areas Dredging (deepening, widening) waterways Waste discharge (garbage, sewage) Excessive population of bottom-feeding fish (such as carp) that stir up bottom sediments Boat traffic


7 Measured with a secchi disk Unit = JTU (Jackson Turbidity Units) We use an alternate method as the stream is too shallow. We use a turbidity tube/jar and a reader card to measure turbidity with a mini secchi disk at the bottom of the tube/jar. The reader card is based on the depth of our container. The secchi disk is lowered into the water. When parts of the disk disappear, you get a JTU measurement based on depth. In the top picture, the black part has disappeared


8 Water color and odor can indicate water pollution.


9 Measures the acidic or basic (alkalinity) quality of water ph scale ranges from 0 (very acidic) to 14 (very basic); 7 is neutral 0-6 = acid 7 = neutral 8-14 = base ** see next slide for ph scale diagram ph of natural water ranges between 6.5 and 8.2 Most aquatic organisms are adapted to a specific ph and may die if the ph of the water changes even slightly. ph can be affected by Industrial waste Agricultural runoff Drainage from mining operations Acid precipitation Air pollution from cars, trucks & busses (oxides of nitrogen and sulfur, aka NOx and SOx)

10 ph is a logarithmic scale, meaning each number is 10x greater/less than the next. A ph of 9 is 10x more basic than a ph of 8, and 100x more basic than ph 7 A ph of 5 is 10x more acidic than a ph of 6, and 100x more acidic than a ph of 7


11 In nature, the ph of water is influenced by the type of rocks and soil that the water flows over, around, and through. Rapidly growing algae and vegetation remove carbon dioxide (CO 2 ) from the water during photosynthesis which causes ph levels of the water to rise. For the folks who like math: ph is the negative log of the hydrogen ion concentration ph = -log[h + ] The picture shows the ph test kits we use in Stream Study


12 Phosphate (PO 4 ) is a nutrient needed for plant and animal growth and other cell processes. High levels of phosphate cause algae and water weeds to grow wildly which clogs the waterway. As the plant and algae populations explode, they use up large amounts of oxygen. This can cause fish and other aquatic organisms to die. This process is called eutrophication. An algae bloom has caused this water to become scum-covered; a sign of eutrophication


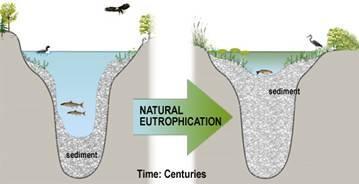
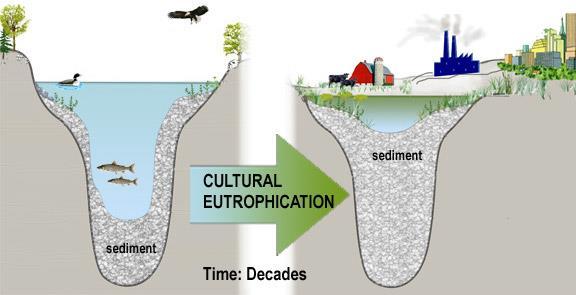
13 Eutrophication that is a natural part of aquatic succession is not considered harmful. Eutrophication caused by people is called cultural eutrophication and is a sign of poor water quality Read the Nitrogen slides about Eutrophication too!


14 Sources of phosphate Fertilizer runoff from farms, lawns, golf courses, playing fields Human waste / sewage Pet, geese waste Leaves Industrial waste Detergents Forest fires


15 Cultural Eutrophication Anoxic = lack of oxygen

16

17 Look at the slide before this one too! Nitrate (NO 3 )is a form of nitrogen Nitrate is a nutrient used by all plants and animals to build protein. We fertilize land to help crops and lawns grow better. If the fertilizer runs off into a body of water, the nitrate helps aquatic plants to grow better as well! The increase in plant growth and decay increases bacterial growth, and they end up decreasing the amount of oxygen available in the water. This decrease in oxygen can cause fish and other aquatic organisms to die. This process of over-fertilization is called cultural eutrophication See the Phosphate slides about Eutrophication, both natural and cultural

18 Sources of nitrate Sewage treatment facilities Pet wastes Leaking or failing septic systems Fertilizer and agricultural runoff Farm animals, ducks, and geese that eliminate waste directly into waterways Grass clippings Sewage treatment facility

19 See the Phosphate slides about Eutrophication, both natural and cultural How does eutrophication actually lower oxygen levels when it is common knowledge algae produce oxygen? It is true algae produce oxygen, but only when there is enough light. Eutrophication reduces the clarity of water and underwater light. In eutrophic lakes, algae are starved for light. When algae don t have enough light they stop producing oxygen and in turn begin consuming oxygen. Moreover, when the large blooms of algae begin to die, bacterial decomposers further deplete the levels of oxygen. As a result, eutrophication can quickly remove much of the oxygen from a lake, leading to an anoxic* and lethal underwater environment. Source: * Anoxic lacking oxygen

20 Dissolved oxygen (DO, pronounced dee-oh ) is the oxygen in the water that aquatic organisms use to breathe DO is NOT the O of H 2 O! DO levels are decreased by: Fertilizer runoff Sewage Decaying plants Temperature increases DO levels are increased by: Water tumbling through riffles Water mixed by wind & waves Temperature decreases Aquatic plants and algae photosynthesizing Molecules of dissolved oxygen fit in between the molecules of water


21 Oxygen is dissolved into water when air mixes with water as it tumbles over rocks, rushes over riffles and through rapids or over waterfalls. The white in white water is air, or, dissolved oxygen! Oxygen also dissolves into water when waves, created by wind, toss the water around and up into the air.

22 A high DO is a sign of a healthy ecosystem. Low levels are a sign of pollution and aquatic life can die DO levels below 3 ppm are stressful to most aquatic life Levels of 5 to 7 ppm are usually needed for healthy aquatic life


23 Cold water can hold more DO than warm water. Fish that need a lot of oxygen will be found in colder water It is important when collecting water samples for DO tests not to add any air into the collection bottle! There should be no air bubbles in a water sample collected for DO testing! The bottle should overflow when the cap is tightened.
24 % Saturation When water holds all the DO it can hold at a given temperature, it is said to be 100% saturated with oxygen. If water holds half as much oxygen as it can hold at a given temperature, it is 50% saturated. High levels of bacteria from sewage pollution or large amounts of rotting plants can cause the %-saturation to decrease, which can affect the ability of aquatic organisms to thrive. From the chart, water at 6.5⁰C with 8 mgl DO = 68% sat


25 Temperature affects the amount of dissolved oxygen in water the rate of photosynthesis by aquatic plants how toxic wastes, parasites, and diseases affect aquatic organisms Trout prefer cooler water temps; catfish like warmer water Most aquatic animals cannot tolerate temp extremes Optimum or Preferred Temperature, C. Rainbow trout 13 Chum salmon 13.5 Sockeye salmon 15 Lake trout Coho salmon 20 Greenthroat darter Largemouth bass Roach Guppy Carp 32 catfish Fish Temps Source:

26 How Water Temperature Can Be Changed Thermal pollution is caused by human activities that add warm water to a river Industries and power plants use water to cool machinery and then return the warm water back to the river. Buildings and parking lots in built-up areas trap heat and warm up rainwater that runs off them into streams Weather rain, snow, sun, etc. Loss /removal of trees that provide shade alongside a waterway Reservoirs behind dams release cold water downstream Soil erosion will cloud water (see turbidity); cloudy water absorbs the sun s heat, increasing temperature.
27

28 Pathogenic (disease-causing) bacteria in water are a concern because of the health problems they can cause. Sources of pathogens in water are pet wastes, farm animal wastes and untreated human sewage Pathogens are hard to detect in water, and we could get sick in the process of conducting the test Instead water is tested for harmless coliform bacteria that also live in human and animal digestive tracts. A positive coliform test usually means wastes are in the water that may also contain pathogenic bacteria

29


30 Most swimmers eye, ear, nose or throat infections do not result from coliform bacteria Swimming in waste-contaminated sea water has little health risk because the salt in the ocean kills many pathogenic bacteria; also oceans are big, so the wastes are quickly diluted.

31 Salinity is the amount of dissolved salts in water. Sources of salt rocks and soil the fresh water flows through or over pollution from industrial waste runoff from road salt

32 Freshwater life is adapted to water with a very low salt content. The parts of the river closest to the ocean will have a higher salinity level than the headwaters. The area where fresh and salt water mix is an estuary An estuary is an area of transition from the river s fresh water to the ocean s salt water Estuaries have tides; the tide brings the salt water from the ocean up the estuary to mix with fresh water from the river. Because of this mixing, salt levels in the estuary are lower than the ocean, but higher than the river How the water mixes in an estuary


")
33 The Chesapeake Bay is one of the largest estuaries in the world Philadelphia is up here We live near the Delaware Bay estuary, part of the Delaware River watershed (basin) Delaware Bay Chesapeake Bay

34 The St. Lawrence River is the world s largest estuary. Other US estuaries: Puget Sound, WA San Francisco Bay, CA Hudson River, NYC/NY Barnegat Bay, NJ Casco Bay, ME Galveston Bay, TX Of the world s 32 largest cities, 22 are on estuaries.
Introduction to Water Quality Parameters
 Introduction to Water Quality Parameters Directions: Your group will be assigned one or two Water Quality (WQ) parameters to read about and present to the class. 1. Read the explanations for your assigned
Activity 1: Using the Level of Oxygen- Saturation Chart graph Dissolved Oxygen vs. Temperature at 100% saturation. Start by making a 2 column table.
 Activity 1: Using the Level of Oxygen- Saturation Chart graph Dissolved Oxygen vs. Temperature at 100% saturation. Start by making a 2 column table. Number the first column with temperatures from 0 to
Water Quality: The Basics
 Water Quality: The Basics Environmental Science Why is Water Quality Important? Effects all humans Safe drinking water Allows for food productions and SAFE food products Effects Wildlife Health domestic
He eia Fishpond Water Monitoring Project Due:
 He eia Fishpond Water Monitoring Project Due: While on your field trip to He eia Fishpond, you will be using a water monitoring kit. This kit was designed to provide a simple, affordable, non-hazardous
Anthropogenic Impacts on Bays and Watersheds. HI-MOES Presentation 2009 The Kohala Center Kohala Watershed Partnership
 Anthropogenic Impacts on Bays and Watersheds HI-MOES Presentation 2009 The Kohala Center Kohala Watershed Partnership Some Common Terms Watershed = An area of land that drains into a common destination
Water Quality Testing
 Field Experience Water Quality Testing How s the Water? Overview Students will use chemical tests to determine the water quality of a local pond. Teacher Background: Water Quality In 1972 the Clean Water
Detective on the case of the...
 Detective on the case of the... River Kid Mystery Allie, the equipment manager, packed the ph kit, thermometer, and bug pan for the hike to the creek. She placed the objects in three of the backpacks.
Water Monitoring in Spa Creek: A Summary
 Water Monitoring in Spa Creek: A Summary Written by: Alexis Jones & Blake Harden Edited by: Hannah Krauss Water monitoring is very important in order to determine the health of the Chesapeake Bay and its
Santa Rosa Creek Water Quality Results 2004
 Santa Rosa Creek Water Quality Results 24 Community Clean Water Institute Site Description: SRC4: Off 3rd Street in downtown Santa Rosa. Behind the Vineyard Hotel just West of Highway 11 along the Prince
Aquatic Science Unit 2. Water Quality and Water Pollution
 Aquatic Science Unit 2 Water Quality and Water Pollution What is a healthy water body? In your own words, take a moment to describe what you believe are some of the characteristics of a healthy stream
Science Enhanced Scope and Sequence Grade 6. Water Quality
 Water Quality Strand Topic Living Systems Investigating water quality Primary SOL 6.7 The student will investigate and understand the natural processes and human interactions that affect watershed systems.
Lake Washington. Water Quality Assessment Report. Copyright 2012 PLM Lake & Land Management Corp.
 Lake Washington 2012 Water Quality Assessment Report Copyright 2012 PLM Lake & Land Management Corp. Water Quality Report On May 22nd, June 18th, July 30th, August 29th, and September 27 th, 2012, PLM
National Science Content Standards: A: Science as Inquiry E: Science and Technology
 National Science Content Standards: A: Science as Inquiry E: Science and Technology To develop an understanding of water quality monitoring and an appreciation of the methods used to keep water safe and
Water Pollution Overview. Sewage dumping
 Water Pollution Water Pollution Overview Sewage dumping Ocean Pollution Water Pollution Overview Urban Water Pollution Water Pollution Overview Water Pollution Overview Urban Runoff Water Pollution Overview
Water Quality indicators and How Human Activities Affect Water Quality
 Water Quality indicators and How Human Activities Affect Water Quality Name: Online Assignment: Period: Date: Purpose: to learn how to evaluate water quality and how pollution can make water unavailable
CBF Water Quality Interactive Map
 CBF Water Quality Interactive Map Student and adult groups that take part Often, they measure the water chemistry to evaluate the be doing it when you come out with us! By compiling these points on a map
Pennsylvania Senior Environment Corps. Table of Contents Part 2 Getting Started:. 21 Chemical Analysis... 22
 Table of Contents Part 2 Getting Started:. 21 Chemical Analysis.... 22 3 Chapter 2: Getting Started 21 Chemical Analysis of the Water Dependent on your area, you may measure for several parameters. In
2009 Columbia River Water Quality Monitoring Data Report
 2009 Columbia River Water Quality Monitoring Data Report Table of Contents Page Introduction......3 Map of Columbia Basin....4 Maps of Portland and Wenatchee Area Sites..5 Maps or Columbia Gorge East and
Freshwater Ecosystems
 Freshwater Ecosystems The types of organisms in an aquatic ecosystem are mainly determined by the water s salinity. As a result, aquatic ecosystems are divided into freshwater and marine ecosystems. Freshwater
BACKGROUND: The following is adapted from the Watershed Cruzin Guide:
 GOALS: To introduce students to the Watsonville Wetlands water system To help students identify sources of water pollution and learn how they can avoid polluting the environment To discuss the importance
Earth Systems and Interactions
 CHAPTER The Earth System Earth Systems and Interactions What do you think? Read the three statements below and decide whether you agree or disagree with them. Place an A in the Before column if you agree
Acidity and Alkalinity:
 Evaluation of Pollution Sources to Lake Glenville Quarterly Report December 2018 Kimberlee K Hall, PhD Environmental Health Program, Western Carolina University Summary Chemical and microbial analysis
8/11/2015 BY KOREE POMPEY
 8/11/2015 BY KOREE POMPEY Water Basics AVAILABLE WATER ON EARTH Salt water Fresh water Ground water Surface water Saltwater Saltwater, is a geological term that refers to naturally occurring solutions
Little Bay Water Quality Report Card Spring 2014
 Little Bay Water Quality Report Card Spring 2014 Little Bay is a small, semi-enclosed estuary located in the heart of Rockport, Texas. Estuaries, where freshwater from rivers and streams mixes with salt
Water Pollution. And Humans are 70% Water! A. Facts 1. 71% of the Earth s surface is water I. Water and the Planet Earth
 Water Pollution Water Pollution I. Water and the Planet Earth A. Facts 1. 71% of the Earth s surface is water. 3 0.5.003 2. Of the 100% of water on the planet, % is fresh water, % is available fresh water
Part I: Salish Sea Introduction. Review:
 Part I: Salish Sea Introduction Review: The Salish Sea The Salish Sea was formed about 20,000 years ago during the last ice age by the carving action of glaciers. There are 3 major parts of the Salish
Freshwater ecosystems
 Aquatic Ecosystems Aquatic Ecosystems The types of organisms in an aquatic ecosystem are determined by the water s salinity. Salinity - Amount of salt in the water. Freshwater ecosystems do not have any
Applicable TEKS. Procedure. Duration. Objectives. Prerequisites. Materials. Temperature Station. ph Station
 L E S S O N LESSON 7 Survey: Physical Properties Applicable TEKS Grade 4 4.1 A 4.2 A, B, D, E, F 4.3 A 4.4 A, B Grade 4 4.1 A, C 4.8 C Duration Two 40-minute lessons Grade 5 5.1 A 5.2 A, C, D, E, F 5.3
Resource. ph must be measured in the field. The ph will change if the water is collected and stored, and will not reflect the true value at the site.
 Resource ph What is ph? ph is a measurement of how acidic or alkaline (basic) the water is. ph is measured on a scale of 0 to 14, with 0 being the most acidic, and 14 being the most basic. Distilled water,
Student Data Sheet 1
 Student Data Sheet 1 Name Date Latitude (e.g. 75 o N) Longitude (e.g.18 o W) Recent weather conditions: Current weather (circle one) Clear Partly Cloudy Fog Overcast Rain Snow Air Temperature C or F Wind
WATER QUALITY; WHY IS IT SO IMPORTANT?
 WATER QUALITY; WHY IS IT SO IMPORTANT? by Debra Veeder 62 OBJECTIVES: Students will be able to describe the relationship between chemical changes in a stream and the reasons these changes take place. METHOD:
Water Chemistry Monitoring
 Chicago River Fieldtrip Activity Summary Students use basic to advanced water quality monitoring kits and probes to assess the water quality of the Chicago River. Water chemistry kits available for loan
Hydrology and Water Quality. Water. Water 9/13/2016. Molecular Water a great solvent. Molecular Water
 Hydrology and Water Quality Water Molecular Water Exists as an equilibrium But equilibrium altered by what is dissolved in it Water Molecular Water a great solvent In reality, water in the environment
HYDROSPHERE EOG REVIEW
 HYDROSPHERE EOG REVIEW 1 Why is fresh water in short supply on Earth? A. Most of it is frozen B. Most of it is polluted C. Most of it is in the atmosphere D. Most of it is trapped underground A. About
EUTROPHICATION. Student Lab Workbook
 EUTROPHICATION Student Lab Workbook THE SCIENTIFIC METHOD 1. Research Background literature research about a topic of interest 2. Identification of a problem Determine a problem (with regards to the topic)
The Snapshot CONODOGUINET CREEK WATERSHED SNAPSHOT
 CONODOGUINET CREEK WATERSHED SNAPSHOT ABOVE: CONODOGUINET CREEK AT RT 74 BRIDGE FACING DOWNSTREAM The Snapshot The Conodoguinet Watershed Snapshot was a collaborative effort to engage local citizens in
Hydrology and Water Quality. Water. Water 9/11/2018. Molecular Water a great solvent. Molecular Water
 Hydrology and Water Quality Water Molecular Water Exists as an equilibrium But equilibrium altered by what is dissolved in it Water Molecular Water a great solvent In reality, water in the environment
WATER QUALITY TESTING STATION
 WATER QUALITY TESTING STATION Today, the students at your station are citizen scientists! Objectives Students will understand the importance and techniques of water quality sampling by: 1) Performing stream
PART 3 ANALYSIS FRESHWATER. Chemical Analysis Tests
 PART 3 ANALYSIS FRESHWATER Along with biological analysis, water chemistry analysis plays an important role in determining water quality. Lack of key nutrients or excess of others can result in the degradation
Properties of Water. Their shapes change when they are in different containers. Their volumes stay the same in any container.
 Name: Date: 1. Which statement correctly describes both gases and liquids? Their shapes stay the same in any container. Their shapes change when they are in different containers. Their volumes stay the
ECOSYSTEMS, WATERSHEDS AND POLLUTION CONTROL REVIEW
 ECOSYSTEMS, WATERSHEDS AND POLLUTION CONTROL REVIEW ECOSYSTEMS: (6 th grade content) How biotic and abiotic factors make an ecosystem: https://www.youtube.com/watch?v=mdlwptkg-vi 1. A/An ecosystem is a
Know What You re Monitoring! Since not all of us are water chemists, here is a brief understanding of what your different tools measure
 1 Know What You re Monitoring! Since not all of us are water chemists, here is a brief understanding of what your different tools measure Extech EC400 meters Salinity (SAL) Total Dissolved Solids (TDS)
WASA Quiz Review. Chapter 2
 WASA Quiz Review Chapter 2 Question#1 What is surface runoff? part of the water cycle that flows over land as surface water instead of being absorbed into groundwater or evaporating Question #2 What are
WHY DO WE NEED NITROGEN?? Nitrogen is needed to make up DNA and protein!
 Nitrogen Cycle 2.2 WHY DO WE NEED NITROGEN?? Nitrogen is needed to make up DNA and protein! In animals, proteins are vital for muscle function. In plants, nitrogen is important for growth. NITROGEN Nitrogen
Mr. Leach Science Burrillville High School
 Mr. Leach Science Burrillville High School The Clear River subwatershed, is located in northwestern Rhode Island. This subwatershed is a component of the Lower Blackstone River Watershed, the Blackstone
How Ecosystems Work Section 2
 Objectives List the three stages of the carbon cycle. Describe where fossil fuels are located. Identify one way that humans are affecting the carbon cycle. List the tree stages of the nitrogen cycle. Describe
TEKS Lesson 7.8C: Effects of Human Activity on Surface Water and Groundwater
 Class ----- Date -------- TEKS Lesson 7.SC TEKS 7.8e Model the effects of human activity on groundwater surface water in a watershed. and TEKS Lesson 7.8C: Effects of Human Activity on Surface Water and
A Claytor Nature Center Stream Monitoring Experience
 A Claytor Nature Center Stream Monitoring Experience Conduct field investigations in which distinctions are made among observations, hypotheses, results and conclusions Perform a visual habitat assessment
The rest of this article describes four biogeochemical cycles: the water cycle, carbon cycle, nitrogen cycle, and phosphorous cycle.
 BIOGEOCHEMICAL CYCLES The chemical elements and water that are needed by living things keep recycling over and over on Earth. These cycles are called biogeochemical cycles. They pass back and forth through
Redwood Shores Lagoon November 2016 Monthly Water Quality Monitoring Report
 Redwood Shores Lagoon November 2016 Monthly Water Quality Monitoring Report Prepared for Redwood City Public Works Services Department 1400 Broadway Redwood City, CA 94063-2594 Prepared by Clean Lakes,
Redwood Shores Lagoon February 2019 Monthly Water Quality Monitoring Report
 Redwood Shores Lagoon February 2019 Monthly Water Quality Monitoring Report Prepared for Redwood City Public Works Services Department 1400 Broadway Redwood City, CA 94063-2594 Prepared by Clean Lakes,
Student Readers. What is the Water Like in Our. River? Student Materials
 What is the Water Like in Our Student Readers River? Student Materials Content Student Readers LEARNING SET ONE A Closer Look at Our River LEARNING SET TWO Where is My River Located/ Landcover Uses: How
Lakes and Ponds. Questions to consider. Ponds breathe. Sinkhole pond. Oxbow lake. Farm pond. Reservoir
 8 Lakes and Ponds dane johnson / visuals unlimited Oxbow lake Farm pond Sinkhole pond Reservoir albert copley / visuals unlimited Questions to consider 1 2 3 4 5 6 7 How do oxygen levels in ponds change
Environmental Science 101 Water. Fall Learning Objectives: Reading Assignment:
 Environmental Science 101 Water Fall 2012 1 Lecture Outline: 16. SURFACE WATER OLLUTION A. Two Kinds of Aquatic lants B. Upsetting the Balance by Nutrient Enrichment C. Idaho Examples D. Sources of Nutrients
ENVIRONMENTAL IMPACT OF CHEMICALS IPC NOTES
 ENVIRONMENTAL IMPACT OF CHEMICALS IPC NOTES POLLUTION POLLUTION - WHEN HARMFUL SUBSTANCES CONTAMINATE THE ENVIRONMENT POLLUTION REFERS TO THE VERY BAD CONDITION OF ENVIRONMENT IN TERMS OF BOTH QUANTITY
Redwood Shores Lagoon May 2017 Monthly Water Quality Monitoring Report
 Redwood Shores Lagoon May 2017 Monthly Water Quality Monitoring Report Prepared for Redwood City Public Works Services Department 1400 Broadway Redwood City, CA 94063-2594 Prepared by Clean Lakes, Inc.
In 1854, hundreds of people living in London died during a cholera epidemic. The disease spread from India to London.
 The Epidemic (Intro for Poison Pump) In 1854, hundreds of people living in London died during a cholera epidemic. The disease spread from India to London. Cholera is characterized by rapid dehydration
Summary. River. 5 th 8 th. about the. Chemical. anteceden. Grade Level: 5 th. 12 th. Objectives: instructions to. determine the. Chicago River Field
 Water Chemistry Monitoring Chicago River Field Trip Activity Summary Students use basic to advanced water quality monitoring kits and probes to assess the water quality of the Chicago River. Water chemistry
Section 2: The Cycling of Materials
 Section 2: The Cycling of Materials Preview Bellringer Objectives The Carbon Cycle How Humans Affect the Carbon Cycle The Nitrogen Cycle Decomposers and the Nitrogen Cycle The Phosphorus Cycle Section
Bell Ringer AP Practice
 Bell Ringer AP Practice 1) Reasons that the population size of an exotic species often grows rapidly when the species is introduced in a new environment include which of the following? i. The exotic species
UNIT 1 SUSTAINING ECOSYSTEMS
 UNIT 1 SUSTAINING ECOSYSTEMS Chapter 2 Biogeochemical Cycles Science 10 Change & Recovery in Ecosystems (you do not need to copy) What happens to the materials that make up a truck when it begins to rust?
Factsheet: Town of Deep River Water Quality and Stormwater Summary
 79 Elm Street Hartford, CT 06106-5127 www.ct.gov/deep Affirmative Action/Equal Opportunity Employer Factsheet: Town of Deep River Water Quality and Stormwater Summary This document was created for each
What s in the Water?
 Purpose: Summary: Background: To observe and list abiotic factors in specific ecosystems. In this exercise, students will observe and list abiotic factors in an aquatic system and measure four of them
Environmental Science 101. Chapter 11 Water Pollution
 Environmental Science 101 Chapter 11 Water Pollution Water Pollution Any change in water quality that causes harm to humans and other living organisms. Review Renewable vs nonrenewable Hydrological cycle
Water Quality in the Cypress Creek
 Water Quality in the Cypress Creek A summary of findings from CRP monitoring in the Wimberley Valley Adrian L. Vogl March 2012 Contents Introduction Water Quality Summary Bacteria Dissolved Oxygen Learn
Water Pollution. Chapter 20
 Water Pollution Chapter 20 Water Pollution Comes from Point and Nonpoint Sources Water pollution Any chemical, biological, or physical change in water quality that harms living organisms or makes water
Dissolved oxygen. How Does Dissolved Oxygen Affect Freshwater Ecosystems? Ecology Dissolved Oxygen.notebook. September 30, 2014
 Dissolved oxygen Information from "Water's The Matter" module How Does Dissolved Oxygen Affect Freshwater Ecosystems? 1 Dissolved oxygen MS LS2 I can construct an argument with empirical evidence to show
Human Impact on Water
 Human Impact on Water Date: Water, Water Everywhere Why is water important? shapes Earth s surface and affects Earth s weather and climates. Most processes use water. For and other organisms, access to
Factsheet: City of West Haven Water Quality and Stormwater Summary
 79 Elm Street Hartford, CT 06106-5127 www.ct.gov/deep Affirmative Action/Equal Opportunity Employer Factsheet: City of West Haven Water Quality and Stormwater Summary This document was created for each
Reporting Period: 01/01/2008 to 12/31/2008. Understanding the Level 2 Stream Monitoring Data Report
 St Croix River at Old HWY 53 At Gordon, 163118 Saint Croix River Latitude: 46.252617, Longitude: -91.79963 Susan Peterson, Friends of the Saint Croix Headwaters James Heim, Friends of the Saint Croix Headwaters
SAMPLING YOUR ESTUARY Level IIB WHAT S IN THE WATER?
 SAMPLING YOUR ESTUARY Level IIB WHAT S IN THE WATER? GOAL Students will understand that an estuary is made up of different microenvironments whose plants and animals are dependent on its water quality.
Kill the Weeds, Not the Fish!
 Kill the Weeds, Not the Fish! Dr. Chuck Cichra University of Florida / IFAS School of Forest Resources & Conservation Program in Fisheries & Aquatic Sciences My goal is for you to have a better understanding
Biogeochemical cycles
 Biogeochemical cycles MATTER CYCLING IN ECOSYSTEMS Nutrient Cycles: Global Recycling Global Cycles recycle nutrients through the earth s air, land, water, and living organisms. Nutrients are the elements
How Ecosystems Work Section 2. Chapter 5 How Ecosystems Work Section 2: Cycling of Materials DAY 1
 Chapter 5 How Ecosystems Work Section 2: Cycling of Materials DAY 1 The Carbon Cycle The carbon cycle is the movement of carbon from the nonliving environment into living things and back Carbon is the
What Are the Causes and Effects of Water Pollution?
 Water PolChapter 20 Ch20 Water Pollution SPARK Notes lution What Are the Causes and Effects of Water Pollution? Water pollution causes illness and death in humans and other species, and disrupts ecosystems.
Factsheet: Town of East Lyme Water Quality and Stormwater Summary
 79 Elm Street Hartford, CT 06106-5127 www.ct.gov/deep Affirmative Action/Equal Opportunity Employer Factsheet: Town of East Lyme Water Quality and Stormwater Summary This document was created for each
Water Pollution. Water Pollution: Two Main Causes: Two Types of Sources. Iron Mine Pollution. Oil leak into bay
 Water Pollution: Water Pollution any chemical, physical or biological agent added to water that decreases water quality and affects organisms Two Main Causes: Industrialization: Developed countries Dumping
4. What is Item A called? a. Eckman dredge b. Secchi disk c. Van Dorn sampler d. Ponar sampler
 Envirothon Questions for AQUATICS station April 24, 2013 1. Eutrophication often results in large fish kills. What is the major cause of these fish kills? a. Oxygen has been depleted due to the decay of
Lesson Overview. Cycles of Matter. Lesson Overview. 3.4 Cycles of Matter
 Lesson Overview 3.4 THINK ABOUT IT A handful of elements combine to form the building blocks of all known organisms. Organisms cannot manufacture these elements and do not use them up, so where do essential
Fact Sheet. Chesapeake Bay Water Quality
 Fact Sheet Chesapeake Bay Water Quality Water quality is a critical measure of the Chesapeake Bay s health. For the Bay to be healthy and productive, the water must be safe for people and must support
Cycles of Ma,er. Lesson Overview. Lesson Overview. 3.4 Cycles of Matter
 Lesson Overview Cycles of Ma,er Lesson Overview 3.4 Cycles of Matter THINK ABOUT IT A handful of elements combine to form the building blocks of all known organisms. Organisms cannot manufacture these
Factsheet: Town of Hamden Water Quality and Stormwater Summary
 79 Elm Street Hartford, CT 06106-5127 www.ct.gov/deep Affirmative Action/Equal Opportunity Employer Factsheet: Town of Hamden Water Quality and Stormwater Summary This document was created for each town
Redwood Shores Lagoon August Monthly Water Quality Monitoring Report
 Redwood Shores Lagoon August Monthly Water Quality Monitoring Report Prepared for Redwood City Public Works Services Department 1400 Broadway Redwood City, CA 94063-2594 Prepared by Clean Lakes, Inc. P.
Reporting Period: 01/01/2010 to 12/31/2010. Understanding the Level 2 Stream Monitoring Data Report
 Squaw Creek, 10030147 Squaw Creek Latitude: 45.32639, Longitude: -88.945564 Jim Waters, Wolf River Trout Unlimited Andy Killoren, Wolf River Trout Unlimited Reporting Period: 01/01/2010 to 12/31/2010 Understanding
Water Pollution. Dr. Sireen Alkhaldi/ Community Medicine
 Water Pollution Dr. Sireen Alkhaldi/ Community Medicine Water Situation 85% of the world population lives in the driest half of the planet (United Nations, 2013) 1 billion people do not have access to
Reporting Period: 01/01/2008 to 12/31/2008. Understanding the Level 2 Stream Monitoring Data Report
 Panther Creek, 10010222 Panther Creek Latitude: 44.6216, Longitude: -90.568054 Carol Vedra, Beaver Creek Science Center Steven Hemersbach, Beaver Creek Citizen Science Center Reporting Period: 01/01/2008
Basics of Water Quality Sheila Murphy
 Basics of Water Quality Sheila Murphy Water quality: The chemical, physical, and biological characteristics of water, usually in respect to its suitability for a particular purpose Water quality can include:
Starting Your Own Water Monitoring Program
 Starting Your Own Water Monitoring Program By initiating your own citizen-based watershed group, you can serve your community by leading and taking part in activities to protect and restore your local
When Things Heat Up. To relate the physical and chemical properties of water to a water pollution issue.
 Purpose: Summary: To relate the physical and chemical properties of water to a water pollution issue. In this exercise, students will measure the temperature and dissolved oxygen of a stream (or use their
Dissolved oxygen. Pre Assess. Post Assess. Big Ideas. Learning Target 1
 Dissolved oxygen MS LS2 I can construct an argument with empirical evidence to show that changes to physical or biological components of an ecosystem can affect populations. Learning Target 1 Pre Assess
BIOMES. Living World
 BIOMES Living World Biomes Biomes are large regions of the world with distinctive climate, wildlife and vegetation. They are divided by terrestrial (land) or aquatic biomes. Terrestrial Biomes Terrestrial
CHEMICAL MONITORING & MANAGEMENT LESSON 6: WATER QUALITY 1 SAMPLE RESOURCES
 YEAR 2 CHEM ISTRY CHEMICAL MONITORING & MANAGEMENT SAMPLE RESOURCES 300 008 008 www.matrix.edu.auu YEAR 2 CHEMISTRY. Water Quality Students perform first hand investigations to use qualitative and quantitative
Ocean Pollution. Ocean Pollution
 Ocean Pollution Ocean Pollution Some scientists believe that it is safer to dump sewage sludge into the deep ocean because it has the ability to dilute, disperse, and degrade large amounts of pollutants
Los Angeles Fresh Water Testing LAB
 Los Angeles Fresh Water Testing LAB Background: Freshwater is placed in Los Angeles from precipitation. The water either goes into the ground (which percolates into groundwater reservoirs) or runs off
CHAPTER 15 WATER POLLUTION. INTO THE GULF Researchers try to pin down what s choking the Gulf of Mexico
 CHAPTER 15 WATER POLLUTION INTO THE GULF Researchers try to pin down what s choking the Gulf of Mexico SAVING THE BAY Teams of researchers try to pin down what s choking the Chesapeake Water pollution
City of Texarkana, Arkansas. Storm Water Pollution
 City of Texarkana, Arkansas Storm Water Pollution STORM WATER GUIDE What is Storm Water Pollution? Stormwater can provide a toxic discharge which can enter into a lake, river or coastal water system. As
Biogeochemical Cycles
 Biogeochemical Cycles Biogeochemical Cycles refers to the cycling of materials between living things and the environment. Text Pages 50 51, 62 69 1 The Oxygen Cycle the movement of oxygen between the atmosphere
Reporting Period: 01/01/2010 to 12/31/2010. Understanding the Level 2 Stream Monitoring Data Report
 Eau Claire River at Outlet Bay Rd, 10029003 Upper Eau Claire Lake Latitude: 46.302803, Longitude: -91.50336 Susan Peterson, Friends of the Saint Croix Headwaters John Kudlas, Friends of the St.Croix Headwaters
Youth make a solution of food coloring with a concentration of one part per million and discuss clean water standards.
 One in a Million Overview: Youth make a solution of food coloring with a concentration of one part per million and discuss clean water standards. Substances dissolved in water can be present in very tiny
Environmental Science Diagnostic Practice Exam
 Name: Period: Environmental Science Diagnostic Practice Exam * This test will be used to determine your current levels of understanding on Environmental Science topics. You will be graded based on effort