NH3 Emissions for Regional Air Quality Modeling
|
|
|
- Alisha Hunt
- 6 years ago
- Views:
Transcription

1 NH3 Emissions for Regional Air Quality Modeling
2 Motivation and Questions Motivation NH3 plays a key role in secondary aerosol formation impact on health & regional haze NH3 deposits readily and contributes to N deposition in pristine ecosystems Questions What are the major sources of NH3 within the region? For the major sources, what are the uncertainties in the emission factors? For the major sources, how well do we know the activity levels? For the major sources, how do environmental or operating practices affect emission rates? NH3 emissions are uncertain, but how sensitive are model results to these uncertainties? Is near-source NH3 deposition an issue within a grid modeling framework?

3 Atmosphere/biosphere Nitrogen Cycle Anthropogenic Tg NH 3 / year Domesticated animals Fertilizer 6-9 Biomass burning 2 6 Fossil fuel Miscellaneous 0-7 Total Anthropogenic Natural Total 45-75
4 NEI NH3 Emissions for Washington Source Type NH3 (tons/yr) Ag Fertilizer Application 12,659 Cattle & calves operations 12,462 Dairy operations 5,718 Other animals 4,957 Biogenic sources 4,082 Waste treatment 2,602 Industrial Processes 1,392 Stationary Fuel Combustion 306 Waste burning 111 Solvent Use 0 WA Total 44,289

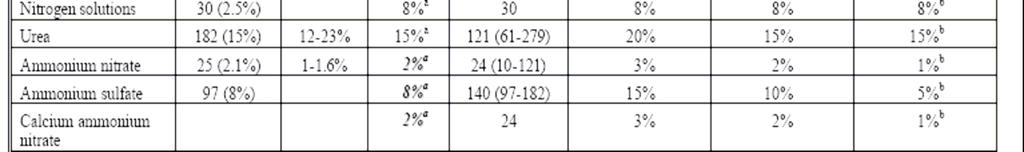
5 Fertilizer NH3 emissions factors (Chinkin et al. 2003) A. NH3---Battye-12(1%)--CMU-1%--Corsi-49(12-121)-EEA-4%
6 Beef and dairy cattle NH3 emission factors (lb/head/year; Chinkin et al. 2003) Dairy 48 to 74 lb/head/yr Beef 29 to 88 lb/head/yr
7 Recent Feedlot Emission Results (Flesch et al., 2007) Spring and summer 0.15 kg/head/day Extrapolated annual emission factor: 55 kg/head/yr or 120 lb/head/yr
8 Recent EI adjustments: Columbia River Gorge Visibility Modeling Analysis (Environ, 2007) Comparison of 2002 NEI and Environ NH3 GIS EI (1) Ammonia emissions from confined area feeding operations (CAFO), such as dairies, were understated by factors of 1.5 to approximately 3, depending on the type of manure handling conducted at each (i.e., flush, scrape, drylot/pasture, or deep-pit); (2) Ammonia emissions from fertilizer application were understated by upwards of a factor of three for anhydrous and aqueous ammonia application sources, and by a factor of 2.5 for nitrogen solution fertilizer application sources.

9 Tomorrow s Air Quality: AIRPACT-3 Daily Forecast System Airpact Terrain ht. MM5 numerical mesoscale meteorological model (UW) SMOKE: Sparse Matrix Operating Kernal for Emissions processing. CMAQ: Community Multi-scale Air Quality model: O 3 & toxics chemistry with 72 species and 214 reactions Aerosol dynamics & chemistry in Aitken, accumulation, & coarse modes Deposition of N, S, O3, & Hg species 12 km x 12 km grid cells, 21 layers Forecast to 64 hours daily Runs in ~1 hour on 4 nodes of a linux cluster PM species Nitrates Sulfates Organic aerosols Wind-Blown Dust (soon) PM2.5 total mass
10 AIRPACT-3 Dynamic Emissions & IC/BC 2005 anthropogenic emissions (SMOKE) MM5/MCIP Meteorology from UW Weather Forecast System Updated Biogenic Emission Model (BEIS3) WSU Dairy NH3 Emissions Module Wild and Prescribed Fire Emissions Gridded Emissions Dynamic Boundary Conditions: spatial & temporal details CMAQ Daisy-chain Initial Conditions
 based upon DOAS NH3 & tracer")


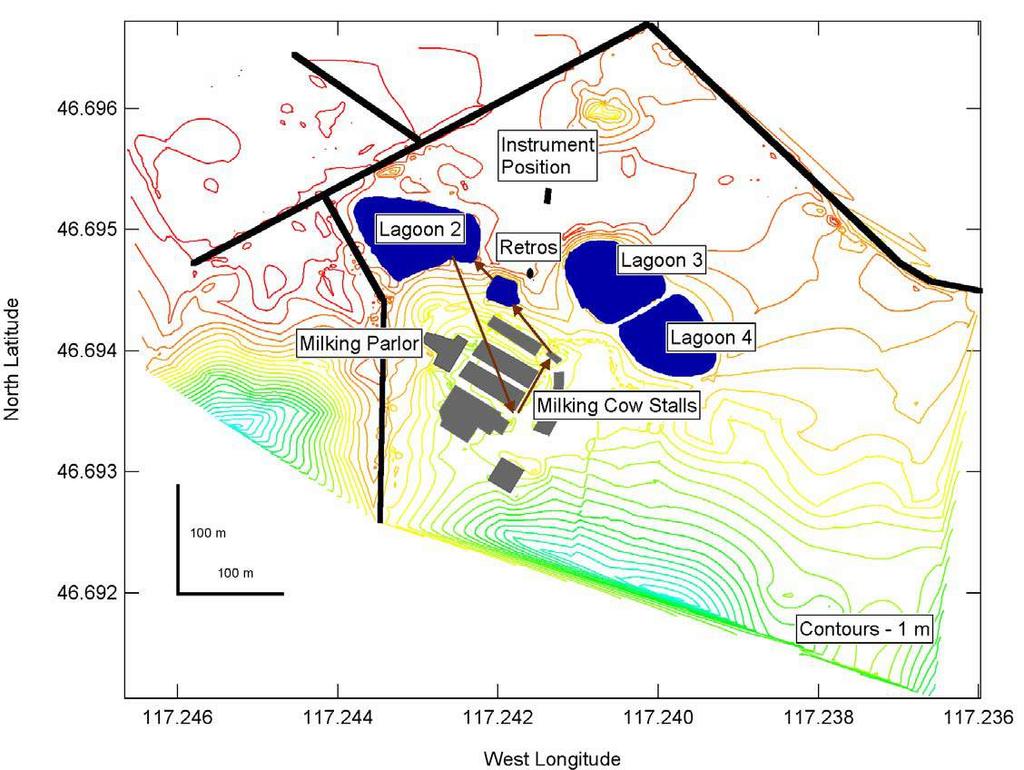
11 NH3 Emissions Dairy Module (Rumburg et al., 2006) based upon DOAS NH3 & tracer ratio measurements at the WSU dairy Housing, lagoon, and slurry application emissions Incorporates N balance approach and accounts for wind speed & temperature effects
12
13 Stalls Model Sensitivity Model Parameter Avg. Flux Avg. Daily Peak Daily Annual (mg cow -1 s -1 ) (kg day -1 ) (kg day -1 ) (kg year -1 ) Base Case ,000 ph = ,000 ph = ,700 Temperature + 2 C ,500 Temperature - 2 C ,400 Milk Prod. = 50 kg day Milk Prod. = 35 kg day , ,000 Protein = 21% ,300 Protein = 17% ,500
14 Dairy Module Input Data Requirements Column Description Type A FIPS 5-digit Integer B Site-ID 5-digit Integer C Latitude Real D Longitude Real E Number of Milking cow Integer F Number of Dry cow Integer G Number of Heifer Integer H Number of Calves Integer I Lagoon area (m^2) Real J Pit area (m^2) Real K Tank area (m^2) Real L Housing type (Scrape Barn = 1) Integer M Application type (Big Gun = 1) Integer N Application area Real O Site name Text in quotes
 Housing 9,469 Storage 5,079 Application 3,420 Total 17,967")
15 Dairy NH3 Emission Module WA Dairy NH3 (ton/yr) Housing 8,634 Storage 5,441 Application 4,364 Total 18,439 OR Dairy NH3 (ton/yr) Housing 9,469 Storage 5,079 Application 3,420 Total 17,967
16 Source Type NH3 (tons/yr) Ag Fertilizer Application 12,659 Cattle & calves operations 12,462 Dairy operations 5,718 Other animals 4,957 Airpact NH3 Emissions for Washington Biogenic sources 4,082 Waste treatment 2,602 Industrial Processes 1,392 Stationary Fuel Combustion 306 Waste burning 111 Solvent Use 0 WA Total 44,289 or with WSU dairy module Dairy operations 18,439 WA Total 57,010 % increase 29%
17 50 POC PEC Airpact-3 Evaluation, Aug-Nov 2004 (Chen, 2007) Modeled (µg/m 3 ) EPA_AQS IMPROVE SWCAA Modeled (µg/m 3 ) EPA_AQS IMPROVE SWCAA 8 Measured (µg/m 3 ) Measured (µg/m 3 ) Modeled (µg/m 3 ) EPA_AQS SWCAA PSO4 Modeled (µg/m 3 ) EPA_AQS SWCAA PNH4 Modeled (µg/m 3 ) EPA_AQS SWCAA PNO Measured (µg/m 3 ) Measured (µg/m 3 ) Measured (µg/m 3 )
18 Columbia Gorge Visibility Modeling Analyses (Environ, 2007) Source attribution results for PNH4 Nov. 2004
19 Questions remain What are the major sources of NH3 within the region? Fertilizer vs livestock which is larger? Biogenic natural soil emissions very few measurements. For the major sources, what are the uncertainties in the emission factors? Factor of two or more in available factors For the major sources, how well do we know the activity levels? For the major sources, how do environmental or operating practices affect emission rates? Seasonal changes, diurnal changes NH3 emissions are uncertain, but how sensitive are model results to these uncertainties--how accurate does an emission inventory need to be? Is near-source NH3 deposition an issue within a grid modeling framework? What is required to improve our ability to construct more accurate emission inventories for NH3?
20
21 Animal Ammonia Emissions Pathways for NH 3 emissions from animal waste Hydrolysis of urea in urine with urease Anaerobic biological breakdown organic nitrogen amino acids NH 3 Dairy cows have the largest per animal emissions (Bouwmann et al., 1997) Developed countries ~ 20 kg NH 3 cow -1 yr -1 Developing countries ~ 8 kg NH 3 cow -1 yr -1 European measurements and farming practices Filters, flasks, and passive samplers
22
23 Housing Emissions Model Calculates liquid NH3 concentration based upon cow factors Uses milk production, dietary Na, K, and N intake, body weight, and week of lactation -> urinary urea Assumes excess of urease from manure Converts urea to ammonia-n Partitions ammonia-n between NH 3 and NH 4 + based upon ph, (ph = lagoon ph) Calculates volatilization based upon temperature
24 Lagoon Emissions Model Calculates lagoon ammonia-n concentration based upon temperature Partitions ammonia-n between NH 3 and NH 4+ based upon ph, ph = 7.8 Calculates volatilization based upon temperature Uses Gaussian plume model to calculate downwind concentrations
25 Lagoon Modeling Normalized mean error = 21% NH 3 Modeled Concentration (ppbv) NH 3 Measured Concentration (ppbv)
26 Stalls Modeled versus Measured Concentrations 2500 Normalized Mean Error = 30% 2000 NH 3 Modeled Concentration (ppbv) NH 3 Measured Concentration (ppbv)
27 Slurry Application Modeling Theoretical Model Error = 59% Empirical Model Error = 22% NH 3 Concentration [ppbv] Measured Concentration Theoretical Model Empirical Model Decay Time (Hours)
28 Lagoon Emissions Model Stalls Convective Mass Transfer Coefficient hm Free Air Stream NH3(g) NH3 NH3 + NH4 + NH 4 + ph NH 3 Temperature Bacteria Bacteria Organic N Organic N
29 Waste Application Model Theoretical Model Slurry volatilization from upper layer of soil Slurry infiltration - HYDRUS 1D Slurry adsorption to soil Slurry temperature - radiation & canopy light model Empirical Model Exponential fit to the data Useful for air quality models
30 Slurry Application Convective Mass Transfer Coefficient hm Free Air Stream Adsorption NH3(g) NH3 Soil (-) particles NH 4 + ph NH 3 Temperature Infiltration
31 Tomorrow s Air Quality: AIRPACT-3 Daily Forecast System Airpact Terrain ht. MM5 numerical mesoscale meteorological model (UW) SMOKE: Sparse Matrix Operating Kernal for Emissions processing. CMAQ: Community Multi-scale Air Quality model: O 3 & toxics chemistry with 72 species and 214 reactions Aerosol dynamics & chemistry in Aitken, accumulation, & coarse modes Deposition of N, S, O3, & Hg species 12 km x 12 km grid cells, 21 layers Forecast to 64 hours daily Runs in ~1 hour on 4 nodes of a linux cluster PM species Nitrates Sulfates Organic aerosols Wind-Blown Dust (soon) PM2.5 total mass

32 Airpact-3 Aerosol Results /
 emissions Portland 5.")
33 Modeling sensitivity to NH3 emissions: Columbia Gorge Modeling Analysis (Environ, 2007) Sensitivity Runs 1. Zero PGE Boardman from BART-level emissions 2. Zero ammonia emissions East of Gorge 3. Zero on-road mobile emissions in Portland 4. Zero major industrial (point) emissions Portland 5. Zero major point emissions in the Gorge
Quantifying Emissions of Ammonia For Air Quality Analysis
 Quantifying Emissions of Ammonia For Air Quality Analysis Viney P. Aneja Department of Marine, Earth, and Atmospheric Sciences North Carolina State University Raleigh, NC 27695-8208, U.S.A. 2009 Science
Northwest-AIRQUEST & AIRPACT-3 Regional Modeling Studies
 Northwest-AIRQUEST & AIRPACT-3 Regional Modeling Studies Joseph Vaughan, Farren Thorpe, Ying Xie, Serena Chung, Brian Lamb and George Mount Laboratory for Atmospheric Research Washington State University,
Ammonia emissions from agriculture
 Ammonia emissions from agriculture Brian Pain and Steve Jarvis Sources of ammonia 48 Factors affecting ammonia emission 48 Abatement options 5 Modelling emissions 51 Brian Pain and Steve Jarvis Ammonia
DIFFERENTIAL OPTICAL ABSORPTION SPECTROSCOPY (DOAS) MEASUREMENTS OF ATMOSPHERIC AMMONIA IN THE MID-ULTRAVIOLET FROM A DAIRY:
 MEASUREMENTS OF ATMOSPHERIC AMMONIA IN THE MID-ULTRAVIOLET FROM A DAIRY:") DIFFERENTIAL OPTICAL ABSORPTION SPECTROSCOPY (DOAS) MEASUREMENTS OF ATMOSPHERIC AMMONIA IN THE MID-ULTRAVIOLET FROM A DAIRY: CONCENTRATIONS, EMISSIONS, AND MODELING By BRIAN PAUL RUMBURG A dissertation
DIFFERENTIAL OPTICAL ABSORPTION SPECTROSCOPY (DOAS) MEASUREMENTS OF ATMOSPHERIC AMMONIA IN THE MID-ULTRAVIOLET FROM A DAIRY: CONCENTRATIONS, EMISSIONS, AND MODELING By BRIAN PAUL RUMBURG A dissertation
Livestock and Air Quality CAFO Air Emissions Project CSU-ARDEC Feb. 9, 2006
 Livestock and Air Quality CAFO Air Emissions Project CSU-ARDEC Feb. 9, 2006 Animal Science (Johnson, Stanton, Marcillac) NREL (Hannan) ARS (Mosier/Follet Atmospheric Sci. (Collet, Lee) National Academy
NATURAL AND TRANSBOUNDARY INFLUENCES ON PARTICULATE MATTER IN THE UNITED STATES: IMPLICATIONS FOR THE EPA REGIONAL HAZE RULE. Rokjin J.
 NATURAL AND TRANSBOUNDARY INFLUENCES ON PARTICULATE MATTER IN THE UNITED STATES: IMPLICATIONS FOR THE EPA REGIONAL HAZE RULE Rokjin J. Park ACCESS VII, September 5, 2003 EPA REGIONAL HAZE RULE Federal
Manure-DNDC: Building a Process-Based Biogeochemical Tool for Estimating Ammonia and GHG Emissions from California Dairies
 Manure-DNDC: Building a Process-Based Biogeochemical Tool for Estimating Ammonia and GHG Emissions from California Dairies William Salas*, Applied Geosolutions, LLC Changsheng Li, University of New Hampshire,
Approaches to Reducing Ammonia Emissions in Canada
 Special session on Agriculture and Air Pollution organized for WGSR by the Task Force on Reactive Nitrogen and the Secretariat Approaches to Reducing Ammonia Emissions in Canada Shabtai Bittman Agriculture
Regional Photochemical Modeling - Obstacles and Challenges. Extended Abstract No Prepared By:
 Regional Photochemical Modeling - Obstacles and Challenges Extended Abstract No. 33594 Prepared By: Christine L Haman, PhD Consultant Abhishek S Bhat, PhD Senior Consultant Tiffany L Gardner BREEZE Product
Final Report. Modeling Air Quality Impact Potential of a Nearby Concentrated Animal Feeding Operation for Minidoka National Historic Site
 Final Report Modeling Air Quality Impact Potential of a Nearby Concentrated Animal Feeding Operation for Minidoka National Historic Site performed under Pacific Northwest Cooperative Ecosystem Studies
The Effects of Hog Waste on the Environment
 The Effects of Hog Waste on the Environment Viney P. Aneja and William Battye Air Quality Research Group Department of Marine, Earth, and Atmospheric Sciences North Carolina State University Raleigh, NC
U.S. EPA Models-3/CMAQ Status and Applications
 U.S. EPA Models-3/CMAQ Status and Applications Ken Schere 1 Atmospheric Modeling Division U.S. Environmental Protection Agency Research Triangle Park, NC Extended Abstract: An advanced third-generation
Measurement of Ammonia Fluxes at a Cattle Feedlot Using Relaxed Eddy Accumulation
 Measurement of Ammonia Fluxes at a Cattle Feedlot Using Relaxed Eddy Accumulation Patrick O Keeffe Shelley Pressley Eugene Allwine Brian Lamb Kris Johnson Jennifer Michal Sarah Spogen NH 3 impacts: Motivation
The Columbia River Gorge Air Quality and Visibility Study
 feature em The Columbia River Gorge Air Quality and Visibility Study by Mark Green, Marc Pitchford, and Chris Emery The Columbia River Gorge ( the Gorge ) is a narrow gap in the Cascade Mountains of Washington
Current and estimated future atmospheric nitrogen loads to the Chesapeake Bay Watershed
 Current and estimated future atmospheric nitrogen loads to the Chesapeake Bay Watershed Jesse O. Bash, Kyle Hinson, Patrick Campbell, Norm Possiel, Tanya Spero, Chris Nolte 1 Outline Background of historic
IMPROVE s Evolution. Data Tools Publications Special Studies Education Activities.
 IMPROVE s Evolution Data Tools Publications Special Studies Education Activities http://vista.cira.colostate.edu/improve VIEWS VIEWS To be Archived Datasets to be included IMPROVE aerosol data Forest
SOUTH AFRICA S PERSPECTIVE
 CURRENT KNOWLEDGE FOR ESTIMATION OF EMISSIONS AND PRIORITIES FOR MITIGATION AND ADAPTATION: SOUTH AFRICA S PERSPECTIVE Luanne Stevens 1, L. Du Toit 2 and M. Scholtz 3 1 North-West 2 Tshwane 3 ARC-Animal
Modeling Atmospheric Nitrogen Deposition: The Current State of the Science and Future Directions
 Modeling Atmospheric Nitrogen Deposition: The Current State of the Science and Future Directions Jesse O. Bash 1, Patrick Campbell 1, Norm Possiel 2, Donna Schwede 1, Ellen Cooter 1, Tanya Spero 1, Chris
Nitrogen and Sulfur Deposition Modeling for ROMANS with CAMx
 Nitrogen and Sulfur Deposition Modeling for ROMANS with CAMx Mike Barna 1, Marco Rodriguez 2, Kristi Gebhart 1, John Vimont 1, Bret Schichtel 1 and Bill Malm 1 1 National Park Service - Air Resources Division
EQUATION 11 = ( x DE%) EQUATION 12 = ( x DE%)
 EQUATION 12 = ( x DE%)") 4 AGRICULTURE Based on a review of other energy systems (e.g., ARC, 1980), a linear relationship between digestible energy and net energy was derived for digestibilities below 65 per cent as follows (see
4 AGRICULTURE Based on a review of other energy systems (e.g., ARC, 1980), a linear relationship between digestible energy and net energy was derived for digestibilities below 65 per cent as follows (see
WRAP Regional Haze Analysis & Technical Support System
 WRAP Regional Haze Analysis & Technical Support System IMPROVE Steering Committee Meeting September 27, 2006 Technical Analysis Status Report WRAP 2003-08 Strategic Plan identifies Fall 2006 to complete
Using satellites to improve our understanding on air pollution
 Using satellites to improve our understanding on air pollution CESAM & Dep. Environment and Planning 28-11-2011, Workshop on Space Technologies & Synergies with Technological Poles, IT, Aveiro, Portugal
BIOMASS BURNING CONTRIBUTION TO CARBONACEOUS AEROSOLS IN THE WESTERN U.S. MOUNTAIN RANGES
 BIOMASS BURNING CONTRIBUTION TO CARBONACEOUS AEROSOLS IN THE WESTERN U.S. MOUNTAIN RANGES Yuhao Mao, Qinbin Li, Li Zhang, Dan Chen, Kuo-Nan Liou Dept. of Atmospheric & Oceanic Sciences, UCLA UCLA-JPL Joint
Ammonia Emissions from Confined Feeding Operations (CFOs): Control and Mitigation
: Control and Mitigation") March 2008 Agdex 729-4 Ammonia Emissions from Confined Feeding Operations (CFOs): Control and Mitigation This factsheet is intended to provide producers and farm managers with information on how to reduce
March 2008 Agdex 729-4 Ammonia Emissions from Confined Feeding Operations (CFOs): Control and Mitigation This factsheet is intended to provide producers and farm managers with information on how to reduce
Development of a 2007-Based Air Quality Modeling Platform
 Development of a 2007-Based Air Quality Modeling Platform US EPA Office of Air Quality Planning and Standards Heather Simon, Sharon Phillips, Norm Possiel 1 NEI Other EI Data Regulatory Modeling Platform
EPA Regional Modeling for National Rules (and Beyond) CAIR/ CAMR / BART
 CAIR/ CAMR / BART") EPA Regional Modeling for National Rules (and Beyond) CAIR/ CAMR / BART 1 Emissions & Modeling Contacts Pat Dolwick Meteorology and Episodic Ozone Modeling Brian Timin Speciated Modeled Attainment Test
EPA Regional Modeling for National Rules (and Beyond) CAIR/ CAMR / BART 1 Emissions & Modeling Contacts Pat Dolwick Meteorology and Episodic Ozone Modeling Brian Timin Speciated Modeled Attainment Test
INFLUX (The Indianapolis Flux Experiment)
") INFLUX (The Indianapolis Flux Experiment) A top-down/bottom-up greenhouse gas quantification experiment in the city of Indianapolis Paul Shepson, Purdue University Kenneth Davis, Natasha Miles and Scott
INFLUX (The Indianapolis Flux Experiment) A top-down/bottom-up greenhouse gas quantification experiment in the city of Indianapolis Paul Shepson, Purdue University Kenneth Davis, Natasha Miles and Scott
WESTAR-WRAP Regional Haze Webinar Series #5 November 16, 2017
 WESTAR-WRAP Regional Haze Webinar Series #5 November 16, 2017 Proposed Guidance Focuses on Large Emitters Rank Top 80% of non-mobile Anthropogenic State Inventory List Potential Control Technologies for
WESTAR-WRAP Regional Haze Webinar Series #5 November 16, 2017
 WESTAR-WRAP Regional Haze Webinar Series #5 November 16, 2017 Proposed Guidance Focuses on Large Emitters Rank Top 80% of non-mobile Anthropogenic State Inventory List Potential Control Technologies for
6.0 STATE AND CLASS I AREA SUMMARIES
 6.0 STATE AND CLASS I AREA SUMMARIES As described in Section 2.0, each state is required to submit progress reports at interim points between submittals of Regional Haze Rule (RHR) State Implementation
Draft manuscript. Real-Time Numerical Forecasting of Wildfire Emissions and Perturbations to Regional Air Quality
 Draft manuscript Real-Time Numerical Forecasting of Wildfire Emissions and Perturbations to Regional Air Quality Brian Lamb *1, Jack Chen 1, Susan O Neill 2, Jeremy Avise 1, Joseph Vaughan 1, Sim Larkin
EMISSION OF GREEN HOUSE GASES FROM MANURE MANAGEMENT OF CATTLE AND BUFFALOES IN ROMANIA
 EMISSION OF GREEN HOUSE GASES FROM MANURE MANAGEMENT OF CATTLE AND BUFFALOES IN ROMANIA Dana Popa 1*, Livia Vidu 1, R. Popa 1, Gh. Mărginean 1, Nicoleta Defta 1, V. Băcilă 1, A. Bota 2 1 University of
A Multi-model Operational Air Pollution Forecast System for China Guy P. Brasseur
 A Multi-model Operational Air Pollution Forecast System for China Guy P. Brasseur Max Planck Institute for Meteorology Hamburg, Germany and National Center for Atmospheric Research, Boulder, CO Ying Xie
NAEMS. What do the data mean?
 Erin Cortus Ag & Biosystems Engineering South Dakota State University Al Heber Ag & Biological Engineering Purdue University NAEMS What do the data mean? How do we interpret the numbers? Ammonia, Hydrogen
Comparisons of CMAQ and AURAMS modeling runs over coastal British Columbia
 Comparisons of CMAQ and AURAMS modeling runs over coastal British Columbia Robert Nissen Environment Canada Contact: robert.nissen@ec.gc.ca Collaborators: NW-AIRQUEST Meeting, Seattle, February 2, 2012
An Improved Ammonia Inventory for the WRAP Domain
 An Improved Ammonia Inventory for the WRAP Domain ENVIRON International Corporation and University of California, Riverside WRAP Emission Forum Meeting July 15, 2004 Introduction Objectives Methods and
The Modern Dairy Cow
 The Modern Dairy Cow A marvel of a biological system to convert a wide range of feeds into high quality protein products for consumption by humans. What are the limits in terms of milk production? Recent
Sand (%) Silt (%) Clay (%)
 Silt (%) Clay (%)") Farmer name Farm Code Farm herd number Data year Annual rainfall (mm) N deposition (kg/ha) Longitude: Latitude: Dairy system characterization Calving pattern Milk produced All year round Manufacturing
Farmer name Farm Code Farm herd number Data year Annual rainfall (mm) N deposition (kg/ha) Longitude: Latitude: Dairy system characterization Calving pattern Milk produced All year round Manufacturing
Technical Annex: The Smart Agriculture Inventory
 Technical Annex: The Smart Agriculture Inventory Acknowledgements The Committee would like to thank: The team that prepared this Annex: Ewa Kmietowicz and Indra Thillainathan. A number of stakeholders
MODELING PHOSPHORUS LOADING TO THE CANNONSVILLE RESERVOIR USING SWAT
 MODELING PHOSPHORUS LOADING TO THE CANNONSVILLE RESERVOIR USING SWAT Bryan Tolson 1 & Christine Shoemaker 2 1. PhD Student, 2. Professor School of Civil & Environmental Engineering Cornell University PWT
Revision of the National Emissions Inventory of Ammonia From Animal Husbandry
 Revision of the National Emissions Inventory of Ammonia From Animal Husbandry Marc Houyoux, US EPA (houyoux.marc@epa.gov) Presentation to the RPO National Workgroup November 4-6, 2004 St. Louis, Missouri
Overview of NH 3 Emission from Poultry Facilities and the BMPs and BATs
 Overview of NH 3 Emission from Poultry Facilities and the BMPs and BATs Lingying Zhao Associate Professor and Extension Specialist Dept. of Food, Agri. And Biological Engineering The Ohio State University
Reporter:Qian Wang
 A discussion on the paper Formation mechanism and source apportionment of water-soluble organic carbon in PM 1, PM 2.5 and PM 10 in Beijing during haze episodes Reporter:Qian Wang 2 0 1 8. 9. 28 C O N
Columbia River Gorge Visibility Project 2006 Interim Progress Report
 Columbia River Gorge Visibility Project 2006 Interim Progress Report Oregon Department of Environmental Quality Southwest Clean Air Agency March 14, 2006 1 Interim Report Presentation Overview: Project
A comparative study on multi-model numerical simulation of black carbon in East Asia
 A comparative study on multi-model numerical simulation of black carbon in East Asia Zifa Wang, Hajime Akimoto and Greg Carmichael, Xiaole Pan, Xueshun Chen, Jianqi Hao(IAP/CAS), Wei Wang (CMEMC), and
SOURCE ALLOCATION AND VISIBILITY IMPAIRMENT IN TWO CLASS I AREAS WITH POSITIVE MATRIX FACTORIZATION
 SOURCE ALLOCATION AND VISIBILITY IMPAIRMENT IN TWO CLASS I AREAS WITH POSITIVE MATRIX FACTORIZATION Keith A. Rose Senior Environmental Scientist U.S. Environmental Protection Agency, Region 1 Rose.Keith@epa.gov
Manure Management Techniques
 Workshop: 'Best practices addressing environmental needs' Fachbereich Veterinärmedizin Institut für Tier- und Umwelthygiene Manure Management Techniques Barbara Amon & Nicholas Hutchings 23 rd 24 th March
David Lavoué, Ph.D. Air Quality Research Branch Meteorological Service of Canada Toronto, Ontario
 David Lavoué, Ph.D. Air Quality Research Branch Meteorological Service of Canada Toronto, Ontario National Fire Emissions Technical Workshop New Orleans, LA May 4-6, 2004 Fire regions Canadian Wildfires
Impact of Agricultural Production on Climate Change
 Impact of Agricultural Production on Climate Change Aaron J. Glenn Research Scientist - Micrometeorology Brandon Research & Development Centre March 22, 2017 What is micrometeorology? A part of meteorology
6.0 STATE AND CLASS I AREA SUMMARIES
 6.0 STATE AND CLASS I AREA SUMMARIES As described in Section 2.0, each state is required to submit progress reports at interim points between submittals of Regional Haze Rule (RHR) State Implementation
MODELLING OF AMMONIA CONCENTRATIONS AND DEPOSITION OF REDUCED NITROGEN IN THE UNITED KINGDOM
 MODELLING OF AMMONIA CONCENTRATIONS AND DEPOSITION OF REDUCED NITROGEN IN THE UNITED KINGDOM Anthony Dore 1, Mark Theobald 1, Massimo Vieno 2 Sim Tang 1 and Mark Sutton 1 1 Centre for Ecology and Hydrology,
BACKGROUND AEROSOL IN THE UNITED STATES: NATURAL SOURCES AND TRANSBOUNDARY POLLUTION. Daniel J. Jacob and Rokjin J. Park
 BACKGROUND AEROSOL IN THE UNITED STATES: NATURAL SOURCES AND TRANSBOUNDARY POLLUTION Daniel J. Jacob and Rokjin J. Park with support from EPRI, EPA/OAQPS How good are the default estimated natural PM concentrations
Climate Change. Air Quality. Stratospheric. Ozone. NAS study on International Transport of Air Pollution NOAA Perspective
 Climate Change Air Quality Stratospheric Ozone NAS study on International Transport of Air Pollution NOAA Perspective A.R. Ravishankara NOAA Climate Research and Modeling Program David Parrish NOAA/ESRL/Chemical
6. Agriculture. Figure 6-1: 2002 Agriculture Chapter Greenhouse Gas Sources
 6. Agriculture Agricultural activities contribute directly to emissions of greenhouse gases through a variety of processes. This chapter provides an assessment of non-carbon dioxide emissions from the
Impact of changes in nitrogen and energy inputs at farm level. Léon Šebek. Efficiency and Environmental impact
 Impact of changes in nitrogen and energy inputs at farm level Efficiency and Environmental impact Léon Šebek Wageningen UR Livestock Research The Netherlands Innovative and practical management approaches
What is the Greenhouse Gas Contribution from Agriculture in Alberta?
 What is the Greenhouse Gas Contribution from Agriculture in Alberta? The most recent GHG inventory estimated that in 2002 nationwide, agricultural related GHG emissions contributed about 59,000 kt (kilotonnnes)
There is growing interest in odor and gaseous
 EM 8982-E August 2009 Ammonia Control Best Management Practices Troy Downing, Oregon State University Dairy Extension, Tillamook, Oregon Mike Gamroth, Oregon State University Dairy Specialist, Corvallis,
deal with the climate issue? Focus on nutrients Anna Hagerberg of Agriculture
 How does the advisory service deal with the climate issue? Focus on nutrients Anna Hagerberg Swedish Board of Agriculture Co-operation ope o project between: ee Swedish Board of Agriculture Federation
Preparation of Fine Particulate Emissions Inventories. Lesson 1 Introduction to Fine Particles (PM 2.5 )
") Preparation of Fine Particulate Emissions Inventories Lesson 1 Introduction to Fine Particles (PM 2.5 ) What will We Discuss in Lesson 1? After this lesson, participants will be able to describe: the general
Preparation of Fine Particulate Emissions Inventories Lesson 1 Introduction to Fine Particles (PM 2.5 ) What will We Discuss in Lesson 1? After this lesson, participants will be able to describe: the general
Greenhouse Gas Emissions from U.S. Livestock Production Systems. D. Johnson, H. Phetteplace, A. Seidl Colorado State University
 Greenhouse Gas Emissions from U.S. Livestock Production Systems D. Johnson, H. Phetteplace, A. Seidl Colorado State University Outline, AN448,Sept. 22, 2004 I. Global greenhouse gas accum II. Agriculture
Model Evaluation and SIP Modeling
 Model Evaluation and SIP Modeling Joseph Cassmassi South Coast Air Quality Management District Satellite and Above-Boundary Layer Observations for Air Quality Management Workshop Boulder, CO May 9, 2011
ESTIMATING FEEDLOT NUTRIENT BUDGETS AND MANAGING MANURE OUTPUT
 1997 Minnesota Cattle Feeder Report B-450 ESTIMATING FEEDLOT NUTRIENT BUDGETS AND MANAGING MANURE OUTPUT C. M. Zehnder and A. DiCostanzo Department of Animal Science University of Minnesota, St. Paul INTRODUCTION
Attribution of Haze. What Are the Pieces and How Do They Fit? s e. a e
 Attribution of Haze What Are the Pieces and How Do They Fit? a n o R s a e E l b Pr r g o s s e One Possible Recipe Describe the area Identify glidepath Break down problem by pollutant Where is the pollutant
Nutrient input from nitrogen deposition in the North China Plain
 Presentation in 16 th IPNC 29 Nutrient input from nitrogen deposition in the North China Plain Liu XJ 1, He CE 1, Kopsch J 2, Fangmeier A 2, Zhang FS 1 1 College of Resources & Environmental Sciences,
Working Group Agriculture and Environment March 2011 Agri-environmental data needs
 Working Group Agriculture and Environment Agri-environmental data needs 29-30 March 2011 Content Data types Building blocks Present data sources Data collection scenarios Data types Statistics Collected
Ammonia Emissions from Agriculture in the Mid-Atlantic
 Ammonia Emissions from Agriculture in the Mid-Atlantic John (Jack) Meisinger Soil Scientist, USDA-ARS Beltsville, MD Adj. Assoc. Prof, UMCP College Pk, MD Jerry Hatfield Plant Physiologist, USDA-ARS Ames,
Nitrogen Deposition at Rocky Mountain National Park: the RoMANS Study
 Nitrogen Deposition at Rocky Mountain National Park: the RoMANS Study Mike Barna Bill Malm Bret Schichtel Kristi Gebhart Air Resources Division National Park Service National Park Service U.S. Department
UNCERTAINTY FACTORS IN MODELLING DISPERSION OF SMOKE FROM WILD FIRES IN A MEDITERRANEAN AREA
 UNCERTAINTY FACTORS IN MODELLING DISPERSION OF SMOKE FROM WILD FIRES IN A MEDITERRANEAN AREA R. Cesari 1, C. Pizzigalli 2, F. Monti 3, M D Isidoro 4, A. Maurizi 3, M. Mircea 4, F.Tampieri 3 (1) ISAC-CNR
CMAQ Simulations of Long-range Transport of Air Pollutants in Northeast Asia
 CMAQ Simulations of Long-range Transport of Air Pollutants in Northeast Asia Fan Meng Youjiang He Chinese Research Academy of Environmental Sciences A&WMA International Specialty Conference: Leapfrogging
Nitrogen losses in agriculture: coupling the updated FAN ammonia model with CLM. Julius Vira, Jeff Melkonian, Will Wieder, Peter Hess
 Nitrogen losses in agriculture: coupling the updated FAN ammonia model with CLM Julius Vira, Jeff Melkonian, Will Wieder, Peter Hess FAN: Flow of Agricultural Nitrogen Reduced nitrogen (NH4+NH3) is subject
Kewaunee County Clean Groundwater
 Kewaunee County Clean Groundwater A PROPOSAL FOR SUSTAINABLE TREATMENT OF MANURE JANUARY 20, 2015 Market Perspective 2 These are Family Owned Businesses 3 4 We are part of an important industry w/ global
6.0 STATE AND CLASS I AREA SUMMARIES
 6.0 STATE AND CLASS I AREA SUMMARIES As described in Section 2.0, each state is required to submit progress reports at interim points between submittals of Regional Haze Rule (RHR) State Implementation
Southern New Mexico Ozone Modeling Study Summary of Results: Tasks 4-6
 Summary of Results: Tasks 4-6 Ramboll-Environ (RE) University of North Carolina (UNC-IE) February 22, 2016 SNMOS Background and Objectives The southern Doña Ana County region has the highest ozone levels
Regional Smoke Haze in Southeast Asia: Causes, Impacts and Possible Solutions
 Regional Smoke Haze in Southeast Asia: Causes, Impacts and Possible Solutions Rajasekhar Bala Division of Environmental Science and Engineering National University of Singapore National Environment Conference
Agricultural activities contribute directly to emissions of greenhouse gases through a variety of processes.
 6. Agriculture Agricultural activities contribute directly to emissions of greenhouse gases through a variety of processes. This chapter provides an assessment of non-carbon-dioxide emissions from the
The modification of global atmospheric Nitrogen cycling by human activities. David Fowler Centre for Ecology and Hydrology Edinburgh UK
 The modification of global atmospheric Nitrogen cycling by human activities David Fowler Centre for Ecology and Hydrology Edinburgh UK Background The N cycle Global N emissions Oxidised Nitrogen Reduced
ANAEROBIC DIGESTION OF FLUSHED DAIRY MANURE
 ANAEROBIC DIGESTION OF FLUSHED DAIRY MANURE Ann C. Wilkie Soil and Water Science Department P.O. Box 110960 University of Florida Gainesville, FL 32611-0960 Tel: (352)392-8699 Fax: (352)392-7008 E-mail:
DEVELOPMENT OF STANDARD METHODS TO ESTIMATE MANURE PRODUCTION AND NUTRIENT CHARACTERISTICS FROM DAIRY CATTLE
 This is not a peer-reviewed article. Pp. 263-268 in the Ninth International Animal, Agricultural and Food Processing Wastes Proceedings of the 12-15 October 2003 Symposium (Research Triangle Park, North
Chapter 3 - ATMOSPHERIC TRANSPORT AND MERCURY DEPOSITION
 Chapter 3 - ATMOSPHERIC TRANSPORT AND MERCURY DEPOSITION A. Introduction Mercury is an especially dynamic pollutant because of its unique physical, chemical, and bioaccumulative properties. The volatility
6. Agriculture. Figure 6-1: 2009 Agriculture Chapter Greenhouse Gas Emission Sources
 6. Agriculture Agricultural activities contribute directly to emissions of greenhouse gases through a variety of processes. This chapter provides an assessment of non-carbon-dioxide emissions from the
Impacts of aerosols on climate in the Arctic
 Impacts of aerosols on climate in the Arctic Yutaka Kondo and Makoto Koike Department of Earth and Planetary Science, Graduate School of Science, University of Tokyo, Tokyo, Japan Polar Climate, Ecosystem
Analyses for geochemical investigations traditionally report concentrations as weight per volume of the measured ions (mg/l of NO 3 , NO 2
 Nitrate-Nitrogen 55 Nutrients The nutrients nitrogen and phosphorus occur naturally and also may be introduced to groundwater systems from urban and agricultural fertilizer applications, livestock or human
strategies: win-win solutions Vera Eory
 Cost benefit analysis of mitigation strategies: win-win solutions Vera Eory 31/10/2014 Outline Problem setting: emissions and reduction targets Assessing mitigation practices: cost-effectiveness and marginal
MOZART Development, Evaluation, and Applications at GFDL
 MOZART Development, Evaluation, and Applications at GFDL MOZART Users Meeting August 17, 25 Boulder, CO Arlene M. Fiore Larry W. Horowitz Arlene.Fiore@noaa.gov Larry.Horowitz@noaa.gov Outline: MOZART Development,
Air Managers Committee
 Air Managers Committee Mission: To Bring Air Managers perspective to WRAP processes To provide a place for managers to discuss and resolve air program management issues related to regional haze To provide
ANTHROPOGENIC EMISSIONS AND AIR QUALITY: ASSESSING THE EFFECT OF THE STANDARD NOMENCLATURE FOR AIR POLLUTION (SNAP) CATEGORIES OVER EUROPE
 CATEGORIES OVER EUROPE") ANTHROPOGENIC EMISSIONS AND AIR QUALITY: ASSESSING THE EFFECT OF THE STANDARD NOMENCLATURE FOR AIR POLLUTION (SNAP) CATEGORIES OVER EUROPE E. Tagaris Environmental Research Laboratory, NCSR Demokritos,
ANTHROPOGENIC EMISSIONS AND AIR QUALITY: ASSESSING THE EFFECT OF THE STANDARD NOMENCLATURE FOR AIR POLLUTION (SNAP) CATEGORIES OVER EUROPE E. Tagaris Environmental Research Laboratory, NCSR Demokritos,
Deliverable D2.4.2, type: Report
 TRANSPHORM Transport related Air Pollution and Health impacts Integrated Methodologies for Assessing Particulate Matter Collaborative project, Large-scale Integrating Project SEVENTH FRAMEWORK PROGRAMME
Particulate Matter Science for Policy Makers: A. Ambient PM 2.5 EXECUTIVE SUMMARY MASS AND COMPOSITION RESPONSES TO CHANGING EMISSIONS
 Particulate Matter Science for Policy Makers: A NARSTO Assessment was commissioned by NARSTO, a cooperative public-private sector organization of Canada, Mexico and the United States. It is a concise and
Methane and Ammonia Air Pollution
 Methane and Ammonia Air Pollution Policy Brief prepared by the UNECE Task Force on Reactive Nitrogen 1. May 2015. There are significant interactions between ammonia and methane emissions from agriculture.
Feed Nutrient Management Planning Economics (FNMP$) Connecting Feed Decisions with Crop Nutrient Management Plans
 Connecting Feed Decisions with Crop Nutrient Management Plans") Feed Nutrient Management Planning Economics (FNMP$) Connecting Feed Decisions with Crop Nutrient Management Plans Software Instructions This tool estimates: 1) manure volume and nutrient content 2) land
Feed Nutrient Management Planning Economics (FNMP$) Connecting Feed Decisions with Crop Nutrient Management Plans Software Instructions This tool estimates: 1) manure volume and nutrient content 2) land
Predicting Fate and Transport of Toxic Air Pollutants using CMAQ
 Predicting Fate and Transport of Toxic Air Pollutants using CMAQ Deborah Luecken Atmospheric Modeling Division National Exposure Research Laboratory, U.S. EPA Research Triangle Park, NC CMAQ Model Peer
IS IT OR IS IT SMOKE? Beyond visual observation we cannot differentiate between smoke and any other organic aerosol.
 IS IT ------------ OR IS IT SMOKE? Beyond visual observation we cannot differentiate between smoke and any other organic aerosol. WHY DO WE NEED TO APPORTION ORGANIC AERSOLS PM2.5 STANDARD REGIONAL HAZE
Joseph K. Vaughan*, Serena H. Chung, Farren Herron-Thorpe, Brian K. Lamb, Rui Zhang, George H. Mount
 TOWARD A CHEMICAL CLIMATOLOGY OF OZONE CONTRIBUTIONS FROM LONG RANGE TRANSPORT IN THE PACIFIC NORTHWEST -- INCORPORATION OF OZONE TRACERS IN THE AIRPACT-4 AIR QUALITY FORECAST SYSTEM Joseph K. Vaughan*,
Alexis Zubrow, Alison Eyth, Rich Mason. AQAST Conference, June 2014
 Alexis Zubrow, Alison Eyth, Rich Mason AQAST Conference, June 2014 1 The full NEI is on a 3 year cycle States, locals, and tribes (S/L/Ts) are required to submit criteria pollutants Air Emissions Reporting
Air pollution health impact assessment: PM 2.5 exposures, sources and components
 Assessing the Climate and Health Co-Benefits of Clean Cooking Global Alliance for Clean Cookstoves / Environmental Defense Fund July 16th 17th 2015 Washington D.C. Air pollution health impact assessment:
SECTION II THEORETICAL CAPACITY OF KINGS COUNTY TO HOST DAIRIES
 Public Hearing - Dairy Element SECTION II THEORETICAL CAPACITY OF KINGS COUNTY TO HOST DAIRIES A. Theoretical Capacity in Kings County for Dairies Dairies generate liquid and solid (dry) manure. This liquid
Assimilating Smoke Data for Air Quality Analysis
 Assimilating Smoke Data for Air Quality Analysis Matt Mavko TEMPO Early Adopters Meeting April 11, 2018 Western Regional Air Partnership Why Include Fire in Air Quality Models? EPA s Fire NEI estimated
The Global Nitrogen Cycle, and Linkages Between C, N, and P Cycles
 OCN 401 The Global Nitrogen Cycle, and Linkages Between C, N, and P Cycles (12.1.11) The Contemporary N Cycle - Basic Facts - Reservoirs and Fluxes Global N and P Budgets - balance between N-fixation and
Sensitivity of air quality simulations in the Lower Fraser Valley of British Columbia to model parameterizations and emission sources
 Sensitivity of air quality simulations in the Lower Fraser Valley of British Columbia to model parameterizations and emission sources Robert Nissen, Paul Makar, Andrew Teakles, Junhua Zhang, Qiong Zheng,