Nitrogen Deposition at Rocky Mountain National Park: the RoMANS Study
|
|
|
- Ruby Owen
- 6 years ago
- Views:
Transcription

1 Nitrogen Deposition at Rocky Mountain National Park: the RoMANS Study Mike Barna Bill Malm Bret Schichtel Kristi Gebhart Air Resources Division National Park Service National Park Service U.S. Department of the Interior Ozone and NOx in the West Meeting November 11, 2009 Santa Fe, NM
2 RoMANS Nitrogen deposition at Rocky Mountain NP has exceeded a critical load of 1.5 kg/ha/yr RoMANS: Rocky Mountain Atmospheric Nitrogen and Sulfur Study Field measurement campaigns conducted in spring and summer of 2006 Which source regions / source types are contributing to N deposition at RMNP?
3 RoMANS participants FEDERAL GOVERNMENT AGENCIES NPS NOAA USGS USFS EPA STATE OF COLORADO Colorado State University Colorado Department of Public Health and Environment CONTRACTORS Air Resource Specialists University of California Desert Research Institute Research Triangle Institute
4 RoMANS objectives Characterize the atmospheric concentrations of sulfur and nitrogen species in gaseous, particulate and aqueous phases (precipitation and clouds) along the east and west sides of the Continental Divide (Organic Nitrogen?) GAS: NH 3, R-NH 2, NO X (NO+NO 2 ), NO Y (HNO 3, PAN, etc) PARTICLE: NH 4, NO 3, ORGANICS (reduced and oxidized)? WET (rain, snow, and clouds): NH 4, NO 3, ORGANICS (reduced and oxidized)? Identify the relative contributions to atmospheric sulfur and nitrogen species in RMNP from within and outside of the state of Colorado. Identify the relative contributions to atmospheric sulfur and nitrogen species in RMNP from emission sources along the Colorado Front Range versus other areas within Colorado. Identify the relative contributions to atmospheric sulfur and nitrogen species from mobile sources, agricultural activities, large and small point sources within the state of Colorado.

5 Concerns about N deposition Low capacity to sequester atmospheric N deposition N enrichment and shifts in diatom communities in alpine lakes N enrichment in organic soil layer and Engelmann spruce needles on eastern slope See Fenn et al. (2003) for review of N deposition ecological effects


6 Increasing wet N deposition Wet nitrate concentration deposition trends Wet ammonium concentration deposition trends

 Fertilizer,")


7 Sources of reduced/oxidized N Naturally Occurring Compound Anthropogenic NO 2 NO 3 Fossil-Fuel Combustion (power plants- mobile sources-oil and gas) Fertilizer, Prescribed fire Soil Release Lightning Wild fire NH 3 NH 4 Feedlots Fertilizer Mobile & Area Sources Wild animals Ecosystem respiration Organic N Feedlots-Fossil Fuel Combustion Vegetation


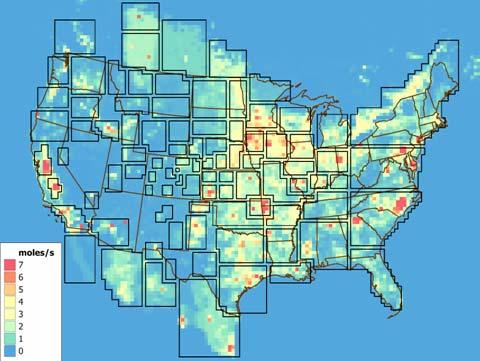
8 NH3 and NOx emissions What happens to emitted NOx & NH3? NH 3 : rapid deposition, NH 3 NH 4 +, no gasphase oxidation NO x : complicated photochemistry, HNO 3 NO 3 -, some species rapidly deposit (HNO 3, NO. ) NH3 NOx
9 2006 v NOx emissions in UBAQS

10 RoMANS field sites Grant, NE Dinosaur Timber Creek Loch Vale Beaver Meadows Brush Gore Pass Core Site Lyons Springfield

11 Core site at RMNP

 ROMANS (2006) Concentration (mg/l) Concentration (mg/l 1.4 1.2 1 0.8 0.")
12 RoMANS period typical? Concentration (mg/l Concentration (mg/ Spring (Mar 25 - Apr 30) Loch Vale N_NH4 N_NO3 Total N S_SO4 Climatology ( ) ROMANS (2006) Spring (Mar 25 - Apr 30) Beaver Meadows N_ NH4 N_ NO3 Total N S_ SO4 Climatology ( ) ROMANS (2006) Concentration (mg/l) Concentration (mg/l Summer (Jul 6 - Aug 11) N_NH4 N_NO3 Total N S_SO4 Climatology ( ) ROMANS (2006) Summer (Jul 6 - Aug 11) N_ NH4 N_NO3 Total N S_ SO4 Climatology ( ) ROMANS (2006)


13 RoMANS trajectories Rocky Mountain National Park Concentration Weighte Deposition Weighted Residence Time Heights = m, input = Hy47 EDASGDAS, Traj Len = 5 days, 1 Percent of Endpoints All days from January 1, 2000 December 31, 2007 < to to to to to to to to > All days from During RoMANS study period Mar 27, Aug 11, 2006 Weighted by N.TotDep.BM.kghay Includes Months: 3,4,7,8
14 Wind direction and concentration N neq/m precipitation W S E Wind Direction (degrees) 0 0 4/20 4/21 4/22 4/23 4/24 4/25 4/26 4/27 Date N SO 4 2- NO 3 - NH 4 + Wind Direction
15 Apportionment strategy Concentration gradients Which way is the wind coming from? Simple back trajectories Residence time analysis Trajectory receptor models Receptor models Chemical transport models Hybrid Models

16 NH 3 NO x
17 Wet Deposition (Spring) g/m 2 ) Wet Deposition N or S ( SO 4 NO 3 NH 4 DON mmprecip /26 3/29 4/15 4/17 4/18 4/23 4/24 4/ Precipitation (mm) Spring Average Wet NO3 Fractional Deposition Spring Average Wet NH4 Fractional Contribution Other 17% Denver 12% Other 39% East WY 7% Denver 52% Calif 1% Estes 1% East WY 6% NW CO 2% Northeastern CO 1% Northeastern CO 62%
18 Wet Deposition (Summer) Wet Deposition N or S ( g/m 2 ) SO 4 NO 3 NH 4 DON mmprecip /06 7/07 7/08 7/09 7/11 7/15 7/17 7/19 7/20 7/23 7/24 7/25 7/26 7/30 7/31 8/03 8/05 8/07 8/10 8/ Precipitation (mm) Summer Average NO3 Wet Dep Summer Average NH4 Wet Dep East WY 3% SW WY 2% Four Corners 8% NGS 2% Other 21% S Nevada 15% Denver 10% Calif 17% Western CO 3% Northeastern CO 3% Local 8% NW CO 5% Estes 3% East WY 2% SW WY 1% Calif 7% Other 24% Denver 2% Local 32% Western CO 24% Northeastern CO 7% Estes 1%


19 Wet + Dry Deposition for Spring and Summer (in state vs out of state)


20 Missing nitrogen measured species: missing N species: 20
21 N dry deposition of Rocky Mountain NP N dry deposition at RMNP based on CASTNet Only three N species are typically measured for dry deposition: NH 4 +, NO 3 - and HNO 3 What happens when we consider the dry deposition of total N at RMNP? Oxidized N (the NO y budget): NO x, HNO 3, NO 3 -, PAN + other organic nitrates, HONO, nitrate radical + N 2 O 5 Reduced N: NH 3, NH 4 + Simulate this missing N with CAMx
22 Modeled dry deposition at RMNP N-PAN 3% N-NxOy 10% N-Org N 2% N-NOx 4% N-PNH4 0% N-PNO3 0% N-HNO3 53% N-NH3 28% N-HONO 0%
23 Yearly CAMx and CASTNet estimates of dry deposited N at RMNP for 2002 N Dry Deposition [kg/ha/yr] N-PNO3 N-PNH4 N-NOx N-PAN N-NxOy N-Org N N-NH3 N-HONO 0.0 [HNO3,NO3,NH4] [HNO3,NO3,NH4] [Total N] CASTNet CAMX CAMX N-HNO3
24 New NHx measurements A new module to the IMPROVE sampler Measures both NH3 and NH4+ Proposed sites (likely to change): Chiricahua AZ Bandelier NM Mesa Verde CO Rocky Mtn CO Brooklyn Lake WY Yellostone WY Glacier MT Teddy Rosevelt ND Wind Cave SD Craters of the Moon ID
25 What we found A substantial portion of deposited Nitrogen originates from within the state of Colorado (about a 55:45 split) Of the reduced nitrogen about 70% comes from Colorado sources Of the Oxidized nitrogen the split is closer to 40% from Colorado sources During the Spring upslope conditions cause most of the N deposition. Associated with large single deposition episodes Reduced nitrogen is primarily from northeastern Colorado Oxidized nitrogen is primarily form Denver and its associated sources
26 What we found (cont d) During the summer deposition episodes are smaller but more frequent so that total deposition is greater than during the Spring. Sources of reduced nitrogen are about equally split between northeastern and western Colorado. Local emissions may also contribute significantly. Sources of oxidized nitrogen come from oil and gas and power plants in the 4-corners region and general transport form the southwest In general about ½ of total nitrogen deposition comes from the east and about ½ from the west More diverse sources contribute during the summer than spring.
27 The end
28 Process analysis in CAMx Order Process Information Units 1 Initial concentration µmole/m3 2 Gas phase chemistry µmole/m3 3 Area emissions µmole/m3 4 Point source emission µmole/m3 5 Plume-in-rid change µmole/m3 6 West boundary advection µmole/m3 7 East boundary advection µmole/m3 8 South boundary advection µmole/m3 9 North boundary advection µmole/m3 10 Bottom boundary advection µmole/m3 11 Top boundary advection µmole/m3 12 Dilution in the vertical µmole/m3 13 West boundary diffusion µmole/m3 14 East boundary diffusion µmole/m3 15 South boundary diffusion µmole/m3 16 North boundary diffusion µmole/m3 17 Bottom boundary diffusion µmole/m3 18 Top boundary diffusion µmole/m3 19 Dry deposition µmole/m3 20 Wet deposition µmole/m3 21 Heterogeneous chemistry µmole/m3 22 Final concentration µmole/m3 23 Units conversion ppm/(µmole/m3) 24 Average cell volume m 3
29 Process analysis: ammonia

30 Local dry deposition of ammonia
Origin of Reactive N in Rocky Mountain NP
 Origin of Reactive N in Rocky Mountain NP Bret A. Schichtel 1, William C. Malm 3, Mike Barna 1, Krisiti Gebhart 1, Katie Benedict 2, Anthony Prenni 2, Jr. 2, Christian M. Carrico 2, Ezra Levin 2, Derek
Consequences of Nitrogen Deposition to Rocky Mountain National Park
 Consequences of Nitrogen Deposition to Rocky Mountain National Park Jill S. Baron, US Geological Survey M.Hartman, D.S.Ojima, K. Nydick, H.M. Rueth B.Moraska Lafrancois, A.P. Wolfe, J. Botte, W.D. Bowman
The modification of global atmospheric Nitrogen cycling by human activities. David Fowler Centre for Ecology and Hydrology Edinburgh UK
 The modification of global atmospheric Nitrogen cycling by human activities David Fowler Centre for Ecology and Hydrology Edinburgh UK Background The N cycle Global N emissions Oxidised Nitrogen Reduced
NATURAL AND TRANSBOUNDARY INFLUENCES ON PARTICULATE MATTER IN THE UNITED STATES: IMPLICATIONS FOR THE EPA REGIONAL HAZE RULE. Rokjin J.
 NATURAL AND TRANSBOUNDARY INFLUENCES ON PARTICULATE MATTER IN THE UNITED STATES: IMPLICATIONS FOR THE EPA REGIONAL HAZE RULE Rokjin J. Park ACCESS VII, September 5, 2003 EPA REGIONAL HAZE RULE Federal
USE OF RPO MODELING TO MEET REGIONAL HAZE AND NAAQS REQUIREMENTS
 USE OF RPO MODELING TO MEET REGIONAL HAZE AND NAAQS REQUIREMENTS James W. Boylan* Georgia Department of Natural Resources, Air Protection Branch, Atlanta, GA, USA 1. INTRODUCTION In order to help meet
Chapter 3 - ATMOSPHERIC TRANSPORT AND MERCURY DEPOSITION
 Chapter 3 - ATMOSPHERIC TRANSPORT AND MERCURY DEPOSITION A. Introduction Mercury is an especially dynamic pollutant because of its unique physical, chemical, and bioaccumulative properties. The volatility
Air Pollution. GEOL 1350: Introduction To Meteorology
 Air Pollution GEOL 1350: Introduction To Meteorology 1 Overview Types and Sources of Air Pollutants Factors That Affect Air Pollution Air Pollution and the Urban Environment 2 Air pollutants are airborne
SOURCE APPORTIONMENT MODELING FOR AIR QUALITY FOR OIL AND GAS DEVELOPMENTS UNDER NEPA
 SOURCE APPORTIONMENT MODELING FOR AIR QUALITY FOR OIL AND GAS DEVELOPMENTS UNDER NEPA Krish Vijayaraghavan, John Grant, Tejas Shah, Zhen Liu, Ralph Morris Ramboll Environ, Novato, CA PERF Meeting November
Acid Deposition. Brief History Acids and Bases Chemical Processes and Sources Deposition Processes Acid Deposition Distribution Environmental Effects
 Acid Deposition 1 Acid Deposition Brief History Acids and Bases Chemical Processes and Sources Deposition Processes Acid Deposition Distribution Environmental Effects Health Effects Lakes and Forests Abatement
Just what is Acid Rain?
 Acid Rain Just what is Acid Rain? Acid Rain is the term used to describe the ways in which acid precipitates out of the atmosphere. Acid Rain is more accurately termed acid deposition. There are two types
Carl N. Skinner Research Geographer USDA Forest Service Pacific Southwest Research Station Redding, CA
 Fire & Healthy Forests Carl N. Skinner Research Geographer USDA Forest Service Pacific Southwest Research Station Redding, CA Our general view of forest fires. Fountain Fire 1992 60,000 acres 300 homes
Ozone and Modeled Stomatal Conductance at a High Elevation Subalpine Site in Southeastern Wyoming 1
 Ozone and Modeled Stomatal Conductance at a High Elevation Subalpine Site in Southeastern Wyoming 1 Robert C. Musselman, Karl F. Zeller, and Nedialko T. Nikolov 2 Abstract Ozone concentrations have been
Ch. 5 - Nutrient Cycles and Soils
 Ch. 5 - Nutrient Cycles and Soils What are Nutrient (biogeochemical) Cycles? a process by which nutrients are recycled between living organisms and nonliving environment. The three general types of nutrient
History of significant air pollution events
 Ch17 Air Pollution A thick layer of smoke and haze covers Santiago, Chile. History of significant air pollution events Many of the worst air pollution episodes occurred in the last two centuries in London
Multi-Scale Applications of U.S. EPA s Third-Generation Air Quality Modeling System (Models-3/CMAQ)
") Multi-Scale Applications of U.S. EPA s Third-Generation Air Quality Modeling System (Models-3/CMAQ) Carey Jang, Pat Dolwick, Norm Possiel, Brian Timin, Joe Tikvart U.S. EPA Office of Air Quality Planning
Multi-Scale Applications of U.S. EPA s Third-Generation Air Quality Modeling System (Models-3/CMAQ) Carey Jang, Pat Dolwick, Norm Possiel, Brian Timin, Joe Tikvart U.S. EPA Office of Air Quality Planning
IDENTIFYING SOURCE CONTRIBUTIONS TO VISIBILITY IMPAIRMENT USING REGIONAL MODELING TOOLS
 Point Reyes NP IDENTIFYING SOURCE CONTRIBUTIONS TO VISIBILITY IMPAIRMENT USING REGIONAL MODELING TOOLS Ralph Morris and Ou Nopmongcol Ramboll Environ November 16, 2017 1 IMPORTANCE OF SOURCE CONTRIBUTIONS
Can your unit pass a Particulate Emission Compliance Test?
 Source Emissions Testing and Emissions Specialists Can your unit pass a Particulate Emission Compliance Test? Kevin Crosby The Avogadro Group, LLC California - Oregon - Arizona McIlvaine Hot Topic Hour,
Nested Global/Regional Modeling of Background Ozone Over the US
 Nested Global/Regional Modeling of Background Ozone Over the US Chris Emery ENVIRON International Corporation, Novato, CA WESTAR Western Ozone Transport Conference October 10-12, 2012 Template Introduction
Meiyun Lin. (Princeton University/GFDL) Establishing process-oriented constraints on global models for ozone source attribution: Lessons from GFDL-AM3
 Establishing process-oriented constraints on global models for ozone source attribution: Lessons from GFDL-AM3") HTAP/WRAP Workshop, 11-May-2015 Establishing process-oriented constraints on global models for ozone source attribution: Lessons from GFDL-AM3 Meiyun Lin (Princeton University/GFDL) GFDL AM3 Global Simulations
HTAP/WRAP Workshop, 11-May-2015 Establishing process-oriented constraints on global models for ozone source attribution: Lessons from GFDL-AM3 Meiyun Lin (Princeton University/GFDL) GFDL AM3 Global Simulations
NH3 Emissions for Regional Air Quality Modeling
 NH3 Emissions for Regional Air Quality Modeling Motivation and Questions Motivation NH3 plays a key role in secondary aerosol formation impact on health & regional haze NH3 deposits readily and contributes
CHAPTER 6: GEOCHEMICAL CYCLES Daniel J. Jacob, Atmospheric Chemistry, Harvard University, Spring 2017
 CHAPTER 6: GEOCHEMICAL CYCLES Daniel J. Jacob, Atmospheric Chemistry, Harvard University, Spring 2017 THE EARTH: ASSEMBLAGE OF ATOMS OF THE 92 NATURAL ELEMENTS Most abundant elements: oxygen (in solid
Nitrogen Pollution: from the Sources to the Sea
 Nitrogen Pollution: from the Sources to the Sea C. Driscoll, D. Whitall, J. Aber,, E. Boyer, M. Castro, C. Cronan,, C. Goodale, P. Groffman, C. Hopkinson,, K. Lambert, G. Lawrence, S. Ollinger 2. Power
Cycling and Biogeochemical Transformations of N, P and S
 Cycling and Biogeochemical Transformations of N, P and S OCN 401 - Biogeochemical Systems Reading: Schlesinger, Chapter 6 1. Nitrogen cycle Soil nitrogen cycle Nitrification Emissions of N gases from soils
MOZART Development, Evaluation, and Applications at GFDL
 MOZART Development, Evaluation, and Applications at GFDL MOZART Users Meeting August 17, 25 Boulder, CO Arlene M. Fiore Larry W. Horowitz Arlene.Fiore@noaa.gov Larry.Horowitz@noaa.gov Outline: MOZART Development,
Workshop on Atmospheric Deposition of Nitrogen Chesapeake Bay Program Science and Technical Advisory Committee
 Workshop on Atmospheric Deposition of Nitrogen Chesapeake Bay Program Science and Technical Advisory Committee Held May 30, 2007 at the State University of New York, Binghamton, NY Co-Chairs: Ron Entringer
Water cycles through ecosystems.
 Water cycles through ecosystems. Water is stored on Earth s surface in lakes, rivers, and oceans. Water is found underground, filling the spaces between soil particles and cracks in rocks. Large amounts
Using Weather Forecasting For Decision Tools For Animal Agriculture
 Using Weather Forecasting For Decision Tools For Animal Agriculture Steve Buan National Weather Service Minnkota Agri-Builders and Equipment Suppliers Association 11 March 2016 Cattle Heat Stress Forecast
Interesting points from presentations
 Interesting points from presentations The topics can be broken down, roughly, into the following categories Emissions of NOx, CO, VOCs, and other gases that influence ozone (and, thus, OH) Electric Vehicles
Western U.S. Air Quality Issues
 Western U.S. Air Quality Issues Tom Moore Western Regional Air Partnership May 9, 2011 Monitoring Emissions Fire Oil & Gas Example Air Quality Assessments & Modeling Gridded Emissions (maybe) Monitoring
Air and Air Pollution Control Last changed: 4/04/11
 http://www.umweltbundesamt.de/luft-e/eintraege-wirkungen/versauerung.htm Air and Air Pollution Control Last changed: 4/04/11 Air pollutant inputs Deposition Air pollutants not only have direct effects
OPERATIONAL EVALUATION AND MODEL RESPONSE COMPARISON OF CAMX AND CMAQ FOR OZONE AND PM2.5
 OPERATIONAL EVALUATION AND MODEL RESPONSE COMPARISON OF CAMX AND CMAQ FOR OZONE AND PM2.5 Kirk Baker*, Sharon Phillips, Brian Timin U.S. Environmental Protection Agency, Research Triangle Park, NC 1. INTRODUCTION
Lightning and Atmospheric Chemistry
 Lightning and Atmospheric Chemistry 1785 Cavendish performed the first experiments with a spark discharge in glass tube. Discovered that oxidized nitrogen (NO x =NO + NO 2 ) compounds resulted from the
Acid deposition accumulation of potential acid-forming particles on a surface acids can result from natural causes
 1 Air Quality Issues: Part 2 - Acid Deposition, Greenhouse Gases EVPP 111 Lecture Dr. Largen 2 Air Quality Issues Air Pollution Indoor Air Pollution Acid Deposition Greenhouse Gases & Global Warming 3
Screening Methodology for Calculating ANC Change to High Elevation Lakes USDA Forest Service Rocky Mountain Region January, 2000
 Screening Methodology for Calculating ANC Change to High Elevation Lakes USDA Forest Service Rocky Mountain Region January, 2000 Introduction The purpose of this screening methodology is provide a simplistic
Chapter 3 Ecosystem Ecology. Tuesday, September 19, 17
 Chapter 3 Ecosystem Ecology Reversing Deforestation in Haiti Answers the following: Why is deforestation in Haiti so common? What the negative impacts of deforestation? Name three actions intended counteract
TROPOSPHERIC AEROSOL PROGRAM - TAP
 THE DEPARTMENT OF ENERGY'S TROPOSPHERIC AEROSOL PROGRAM - TAP AN EXAMINATION OF AEROSOL PROCESSES AND PROPERTIES RG99060050.3 American Geophysical Union, Fall Meeting, San Francisco, December 12-17, 1999
Chapter 2 Progress in Monitoring and Modelling Estimates of Nitrogen Deposition at Local, Regional and Global Scales
 Chapter 2 Progress in Monitoring and Modelling Estimates of Nitrogen Deposition at Local, Regional and Global Scales Frank Dentener, Robert Vet, Robin L. Dennis, Enzai Du, Umesh C. Kulshrestha and Corinne
CMAQ Simulations of Long-range Transport of Air Pollutants in Northeast Asia
 CMAQ Simulations of Long-range Transport of Air Pollutants in Northeast Asia Fan Meng Youjiang He Chinese Research Academy of Environmental Sciences A&WMA International Specialty Conference: Leapfrogging
Selected Presentation from the INSTAAR Monday Noon Seminar Series.
 Selected Presentation from the INSTAAR Monday Noon Seminar Series. Institute of Arctic and Alpine Research, University of Colorado at Boulder. http://instaar.colorado.edu http://instaar.colorado.edu/other/seminar_mon_presentations
WHY DO WE NEED NITROGEN?? Nitrogen is needed to make up DNA and protein!
 Nitrogen Cycle 2.2 WHY DO WE NEED NITROGEN?? Nitrogen is needed to make up DNA and protein! In animals, proteins are vital for muscle function. In plants, nitrogen is important for growth. NITROGEN Nitrogen
Modelling Dissolved Organic Carbon and Nitrogen in Streams and Rivers Across Atlantic Canada
 Modelling Dissolved Organic Carbon and Nitrogen in Streams and Rivers Across Atlantic Canada Marie France Jutras, Mina Nasr, Thomas Clair, Paul Arp Presented by: Marie France Jutras Introduction OBJECTIVES:
Kitimat Airshed Emissions Effects Assessment and CALPUFF Modelling
 Kitimat Airshed Emissions Effects Assessment and CALPUFF Modelling EMA of BC - May 2016 Session - Regional Air Topics Anna Henolson Topics to Cover What is Air Dispersion Modelling? Types of Models CALPUFF
WRAP Activities and Regional Transport/Source Apportionment Issues
 WRAP Activities and Regional Transport/Source Apportionment Issues Tom Moore, Air Quality Program Manager WRAP/Western Governors Association Pima Association of Governments Air Quality Forum Tucson, AZ
Ozone and trace gases in India: Effects of transport and emissions. Shyam Lal Physical Research Laboratory, Ahmedabad
 Ozone and trace gases in India: Effects of transport and emissions Shyam Lal Physical Research Laboratory, Ahmedabad Second Workshop on Atmospheric Composition and the Asian Monsoon (ACAM), 8-10 June,
Comparison of Source Apportionment and Sensitivity Analysis in a Particulate Matter Air Quality Model
 Environ. Sci. Technol. 2009, 43, 6669 6675 Comparison of Source Apportionment and Sensitivity Analysis in a Particulate Matter Air Quality Model BONYOUNG KOO,*, GARY M. WILSON, RALPH E. MORRIS, ALAN M.
Ecosystems: Nutrient Cycles
 Ecosystems: Nutrient Cycles Greeks, Native Peoples, Buddhism, Hinduism use(d) Earth, Air, Fire, and Water as the main elements of their faith/culture Cycling in Ecosystems the Hydrologic Cycle What are
Continuous Monitoring of Pollution in the Nation s Precipitation
 Continuous Monitoring of Pollution in the Nation s Precipitation Martin Risch and David A. Gay U.S. Geological Survey, Indiana Water Science Center, Indianapolis, IN, mrrisch@usgs.gov NADP Program Office,
A Summary by the Acid Rain Peer Review Panel for the Office of Science and Technology Policy Executive Office of the President June 27, 1983
 GENERAL COMMENTS ON ACID RAIN A Summary by the Acid Rain Peer Review Panel for the Office of Science and Technology Policy Executive Office of the President June 27, 1983 The United States and Canada together
Protecting Your Water and Air Resources
 Protecting Your Water and Air Resources Montana Agri-Business Association Convention (Feb 1, 2013) by Clain Jones, Extension Soil Fertility Specialist and Adam Sigler, Extension Associate Water Quality
Meteorological and Air Dispersion Modeling Methodology and Discussion for INPRO Project
 Meteorological and Air Dispersion Modeling Methodology and Discussion for INPRO Project Introduction The transport and dilution of radioactive materials in the form of aerosols, vapors, or gases released
ATMOSPHERIC DEPOSITION OF NUTRIENTS AND CONTAMINANTS
 ATMOSPHERIC DEPOSITION OF NUTRIENTS AND CONTAMINANTS Curtis D. Pollman 2008 Greater Everglades Ecosystem Restoration Conference, July 28 August 1 Naples, FL Objectives Provide an overview of the importance
Lecture 4 Air Pollution: Particulates METR113/ENVS113 SPRING 2011 MARCH 15, 2011
 Lecture 4 Air Pollution: Particulates METR113/ENVS113 SPRING 2011 MARCH 15, 2011 Reading (Books on Course Reserve) Jacobson, Chapter 5, Chapter 8.1.9 Turco, Chapter 6.5, Chapter 9.4 Web links in following
Chapter 5 FUTURE OZONE AIR QUALITY
 Chapter 5 FUTURE OZONE AIR QUALITY 5 FUTURE OZONE AIR QUALITY 5.1 INTRODUCTION AND SUMMARY Air quality models are used to predict ozone concentrations in future years. These models simulate the formation,
Co-Benefits of Renewable Energy and Energy Efficiency in Utah
 Co-Benefits of Renewable Energy and Energy Efficiency in Utah Air Quality, Health and Water Benefits A Report to the State of Utah March 15, 2010 Jeremy Fisher, PhD; Jon Levy, ScD; Yurika Nishioka, ScD;
Chapter 3 Ecosystem Ecology. Reading Questions
 APES Name 22 Module 7 Chapter 3 Ecosystem Ecology Monday Tuesday Wednesday Thursday Friday 17 Module 6 The Movement of Energy 18 Ecosystem Field Walk 19 Module 7 The 23 Module 8 Responses to Disturbances
An Assessment of the Effects of Human-Caused Air Pollution on Resources Within the Interior Columbia River Basin
 United States Department of Agriculture Forest Service Pacific Northwest Research Station United States Department of the Interior Bureau of Land Management General Technical Report PNW-GTR-447 July 1999
Ocean Production and CO 2 uptake
 Ocean Production and CO 2 uptake Fig. 6.6 Recall: Current ocean is gaining Carbon.. OCEAN Reservoir size: 38000 Flux in: 90 Flux out: 88+0.2=88.2 90-88.2 = 1.8 Pg/yr OCEAN is gaining 1.8 Pg/yr Sum of the
Clean Air Status and Trends Network (CASTNET)
") Clean Air Status and Trends Network (CASTNET) 2005 Annual Report Air Quality Measurements Long-Term Trends Environmental Results 7 6 5 4 3 2 1 0 1990 1991 1992 1993 kg/ha 1994 1995 1996 1997 1998 1999
Clean Air Status and Trends Network (CASTNET) 2005 Annual Report Air Quality Measurements Long-Term Trends Environmental Results 7 6 5 4 3 2 1 0 1990 1991 1992 1993 kg/ha 1994 1995 1996 1997 1998 1999
Griffin s Pen Condition Discussion Thoughts & Notes: Using stocking density to help control dust and mud.
 Griffin s Pen Condition Discussion Thoughts & Notes: Using stocking density to help control dust and mud. In a nut shell: Dust is relatively easy (tighten up the cattle)... mud is tough (lots of months
Cycles in Nature Standard 1 Objective 2:
 Cycles in Nature Standard 1 Objective 2: Explain relationships between matter cycles and Energy a) use diagrams to trace the movement of matter through a cycle b) Explain how water is a limiting factor
Invasive Species and Restoration of California Grasslands and Shrublands
 Invasive Species and Restoration of California Grasslands and Shrublands Edith B. Allen Department of Botany and Plant Sciences Center for Conservation Biology Exotic grass invasions are causing vegetation-type
USE OF RPO MODELING TO MEET REGIONAL HAZE AND NAAQS REQUIREMENTS
 USE OF RPO MODELING TO MEET REGIONAL HAZE AND NAAQS REQUIREMENTS James W. Boylan Georgia Department of Natural Resources (Chair for Inter-RPO Modeling Workgroup) 2005 CMAS Models-3 Conference Chapel Hill,
UNIVERSITY OF HOUSTON Campus Facilities Planning Committee Request for Project Approval Form
 UNIVERSITY OF HOUSTON Campus Facilities Planning Committee Request for Project Approval Form I. Project Number: 2. Project Name: Temporary Air Quality Trailer and Scaffold Tower (03/20/2009 6/08/2009)
clearing the air NO x HNO 3 materials yield losses human health energyeutrophication VOCs yield losses PM 2.5 human health POPs SO 2 nitrogen dioxide
 clearing the air POPs SO 2 VOCs NO x HNO 3 HNO 3 ammonia sulphur dioxide PM 2.5 30 th Anniversary of the Convention on nitrogen dioxide ammonia VOCs Long-range Transboundary Air Pollution materials materials
The climatic water balance in an ecological context
 Western Mountain Initiative The climatic water balance in an ecological context Nathan L. Stephenson U.S. Department of the Interior U.S. Geological Survey Thesis: Consideration of the climatic water balance
Oregon Smoke Management Annual Report
 Oregon Smoke Management Annual Report OREGON DEPARTMENT OF FORESTRY PROTECTION FROM FIRE PROGRAM METEOROLOGICAL SERVICES SECTION General File 1-2-5-910 OREGON SMOKE MANAGEMENT ANNUAL REPORT Prepared By:
Aspen Ecology. Read Hessl, Why have a whole lecture for a single species?
 Aspen Ecology Read Hessl, 2002 11/16/09 1 Why have a whole lecture for a single species? Populus tremuloides is the most widespread tree in N. America and 2 nd most widely distributed tree species in the
ESTIMATION OF THE MAXIMUM OZONE IMPACTS OF OXIDES OF NITROGEN
 ESTIMATION OF THE MAXIMUM OZONE IMPACTS OF OXIDES OF NITROGEN William P. L. Carter College of Engineering Center for Environmental Research and Technology University of California Riverside, California,
Cycling and Biogeochemical Transformations of N, P, S, and K
 Cycling and Biogeochemical Transformations of N, P, S, and K OCN 401 - Biogeochemical Systems 20 September 2016 Reading: Schlesinger & Bernhardt, Chapter 6 2016 Frank Sansone 1. Nitrogen cycle Soil nitrogen
Earth as a System. Chapter 2. Table of Contents. Section 1 Earth: A Unique Planet. Section 2 Energy in the Earth System.
 Earth as a System Table of Contents Section 1 Earth: A Unique Planet Section 2 Energy in the Earth System Section 3 Ecology Section 1 Earth: A Unique Planet Objectives Describe the size and shape of Earth.
NADP Site Information Worksheet, Revised Version 1.6. NADP Site Information Worksheet
 NADP Site Information Worksheet Document Change History Version Description Effective Date 1.6 Clarify major sources to document Clarified Instrument 1 and Instrument 2 tables on pg 10 04/2016 1.5 Addition
Chemical mechanisms and kinetics in atmospheric chemistry Lecture 8: Global budgets and emissions inventories
 Chemical mechanisms and kinetics in atmospheric chemistry Lecture 8: Global budgets and emissions inventories Mike Pilling University of Leeds UK Synopsis Global budgets for CH 4, CO, NO x, VOCs (tomorrow
Intermountain West Data Warehouse Western Air Quality Study (IWDW-WAQS) Applicability of the IWDW-WAQS beyond the West
 Applicability of the IWDW-WAQS beyond the West") Intermountain West Data Warehouse Western Air Quality Study (IWDW-WAQS) Applicability of the IWDW-WAQS beyond the West 2 NPS Air Quality Conditions & Trends Tools (nps.gov) Partners: NPS/ARD Databases
Intermountain West Data Warehouse Western Air Quality Study (IWDW-WAQS) Applicability of the IWDW-WAQS beyond the West 2 NPS Air Quality Conditions & Trends Tools (nps.gov) Partners: NPS/ARD Databases
Will the Air Be Clean Enough To Breathe? What are the interactions of factors that affect a region's air quality?
 lesson Will the Air Be Clean Enough To Breathe? What are the interactions of factors that affect a region's air quality? Content Created by Activity 1: Measuring Air Quality 45 mins Directions 1. Activate
The Impact of the Chesapeake Bay Climate and Boundary Layer Dynamics on Air Pollutant Concentrations during Smog Episodes
 The Impact of the Chesapeake Bay Climate and Boundary Layer Dynamics on Air Pollutant Concentrations during Smog Episodes Presentation by: Dan Goldberg, PhD Candidate Co-authors: Chris Loughner, Maria
Chapter 1. Preliminaries
 Environmental Transport and Fate Chapter 1 Preliminaries Benoit Cushman-Roisin Thayer School of Engineering Dartmouth College Context possible effluent treatment How much? How clean? resources Industrial
Estimation of atmospheric nitrogen deposition to the Baltic Sea in the periods and
 Estimation of atmospheric nitrogen deposition to the Baltic Sea in the periods 1997-23 and 2-26 Summary Report for HELCOM Jerzy Bartnicki and Semeena Valiyaveetil Meteorological Synthesizing Centre-West
Energy, Greenhouse Gases and the Carbon Cycle
 Energy, Greenhouse Gases and the Carbon Cycle David Allen Gertz Regents Professor in Chemical Engineering, and Director, Center for Energy and Environmental Resources Concepts for today Greenhouse Effect
Evaluation of Options for Addressing Secondary PM 2.5 and Ozone Formation. Bruce Macdonald, PhD Jason Reed, CCM
 Evaluation of Options for Addressing Secondary PM 2.5 and Ozone Formation Bruce Macdonald, PhD Jason Reed, CCM 1 Overview Timeline and reasoning Regulatory drivers in the U.S. Emerging approaches Qualitative
Causes of Gulf of Mexico Hypoxia
 Causes of Gulf of Mexico Hypoxia Nancy N. Rabalais 1 R. Eugene Turner 2 1 Louisiana Universities Marine Consortium 2 Louisiana State University Center for Sponsored Coastal Ocean Research, Coastal Ocean
How is the atmosphere different from outer space? a mixture of gases that surrounds the Earth
 Chapter 15 Atmosphere Section 1 Objectives Describe the composition of Earth's atmosphere. Explain why air pressure changes with altitude. Explain how air temperature changes with atmospheric composition.
Sampling Method for Wet Deposition Monitoring
 Sampling Method for Wet Deposition Monitoring by Hathairatana Garivait Prepared for the Third Country Training Program on Acid Deposition Monitoring and Assessment February 18, 2004 Environmental Research
Carbon Dioxide and Global Warming Case Study
 Carbon Dioxide and Global Warming Case Study Key Concepts: Greenhouse Gas Carbon dioxide El Niño Global warming Greenhouse effect Greenhouse gas La Niña Land use Methane Nitrous oxide Radiative forcing
Estimation of Nitrate Load from Septic Systems to Surface Water Bodies Using ArcNLET: an ArcGIS-Based Nitrate Load Estimation Toolkit
 Picture from USGS Scientific Investigations Report 2008 5220 Estimation of Nitrate Load from Septic Systems to Surface Water Bodies Using ArcNLET: an ArcGIS-Based Nitrate Load Estimation Toolkit Richard
CHAPTER 2 - Air Quality Trends and Comparisons
 CHAPTER 2 - Air Quality Trends and Comparisons Particulate Sampling Total Suspended Particulate Matter With the monitoring for PM 2.5 particulate matter being labor intensive, DEP reduced the number of
Mitigation and Calculation of Short-term Hydrogen Sulfide and Nitrogen Dioxide Impacts to Ambient Air Adjacent to Geothermal Well Pads
 Presented at Geothermal Resources Council 1999 Annual Meeting; October 17-20, 1999; Reno, Nevada Mitigation and Calculation of Short-term Hydrogen Sulfide and Nitrogen Dioxide Impacts to Ambient Air Adjacent
Northern Arizona Hydrogeology
 Northern Arizona Hydrogeology Some basics Coconino Plateau Hydrogeology Flagstaff and Coconino Plateau Water Resources Well development, City of Flagstaff Effluent discharge to the Rio de Flag from Wildcat
Reduced N in precipitation as N source for boreal bryophytes
 Reduced N in precipitation as N source for boreal bryophytes Annika Nordin and Åsa Forsum Umeå Plant Science Centre Swedish University of Agricultural Sciences Reduced N in precipitation as N source for
Directions 1. Activate students' prior knowledge about secondary pollutants. 1 of 10. Activitydevelop
 Activitydevelop Pollutants Making More Pollutants How do pollutants interact with the environment to create more pollution, and what effects do secondary pollutants have on the environment and human health?
Nutrients elements required for the development, maintenance, and reproduction of organisms.
 Nutrient Cycles Energy flows through ecosystems (one way trip). Unlike energy, however, nutrients (P, N, C, K, S ) cycle within ecosystems. Nutrients are important in controlling NPP in ecosystems. Bottom-up
Unit III Nutrients & Biomes
 Unit III Nutrients & Biomes Nutrient Cycles Carbon Cycle Based on CO 2 cycling from animals to plants during respiration and photosynthesis. Heavy deposits are stored in wetland soils, oceans, sedimentary
Ecosystems under impact of global changes and disturbances studied by LTER Slovakia
 Ecosystems under impact of global changes and disturbances studied by Slovakia Ľuboš Halada 1, Peter Fleischer 2 1 ) Institute of Landscape Ecology SAS, Slovakia 2 ) Research station of the State Forests
GLOBAL CLIMATE AND MICROCLIMATE. Dr. Muhammad Asif Hanif, Department of Chemistry, University of Agriculture, Faisalabad, Pakistan
 GLOBAL CLIMATE AND MICROCLIMATE Perhaps the single most important influence on Earth s environment is climate, consisting of long-term weather patterns over large geographical areas. One important example
Water Quality in a Changing Environment
 Water Quality in a Changing Environment Coalbed Methane (CBM) Produced Water K.J. Reddy Department of Renewable Resources School of Energy Resources University of Wyoming Arsenic Poisoning in Bangladesh
CHEMICAL: NITROGEN AND PHOSPHORUS (read pp in Dodson)
") BIOE 155, Fall 010 BACKGROUND CHEMICAL: NITROGEN AND PHOSPHORUS (read pp39-50 in Dodson) Lakes are often classified according to trophic status, specifically how much energy or food is available for the
BIOE 155, Fall 010 BACKGROUND CHEMICAL: NITROGEN AND PHOSPHORUS (read pp39-50 in Dodson) Lakes are often classified according to trophic status, specifically how much energy or food is available for the
Visible and Invisible Pollutants How do different types of pollutants affect human and environmental health?
 Activitydevelop Visible and Invisible Pollutants How do different types of pollutants affect human and environmental health? Overview Students explore data about the sources and consequences of different
Historical trends in data and studies for the Upper Green River Basin (UGRB)
") Historical trends in data and studies for the Upper Green River Basin (UGRB) 2015 Western Air Quality Modeling Workshop May 14, 2015 Darla J. Potter WDEQ Air Quality Division 1 Overview UGRB Overview Trends
Historical trends in data and studies for the Upper Green River Basin (UGRB) 2015 Western Air Quality Modeling Workshop May 14, 2015 Darla J. Potter WDEQ Air Quality Division 1 Overview UGRB Overview Trends
Air Pollutants in Germany: Long Term Trends in Deposition and Air Concentration
 Air Pollutants in Germany: Long Term Trends in Deposition and Air Concentration Th. Gauger & F. Anshelm Institute of Navigation, Stuttgart University, Geschwister-Scholl-Str. 24 D, D-70174 Stuttgart, Germany
A COMPARATIVE STUDY ON CONCENTRATION OF AIR POLLUTANTS AND RAINFALL OVER A COASTAL INDUSTRIAL AREA-A CASE STUDY
 A COMPARATIVE STUDY ON CONCENTRATION OF AIR POLLUTANTS AND RAINFALL OVER A COASTAL INDUSTRIAL AREA-A CASE STUDY 1 V. Lakshmana Rao, 2 P.Satish, 3 A.Sravani 1 Assistant Professor(c), Department of Meteorology