Mentor: William F. Hunt, Jr. Adjunct Professor. In this project our group set out to determine what effect, if any, an air monitor s distance
|
|
|
- Osborn Higgins
- 6 years ago
- Views:
Transcription
1 Assessment of Air Quality Trends Near Roadways By Taylor York, Carey Jackson, and Aaron Lamb Undergraduate Statistics Program North Carolina State University Mentor: William F. Hunt, Jr. Adjunct Professor Executive Summary: In this project our group set out to determine what effect, if any, an air monitor s distance from the roadway had on the measured air pollution levels of carbon monoxide, nitrogen dioxide, and fine particulate matter (PM2.5). The group was also searching to see if we could identify pollution emitters using wind data. "Fine particles," such as those found in smoke and haze, are 2.5 micrometers in diameter and smaller. We obtained yearly, hourly, and daily data for each pollutant from from the U. S. Environmental Protection Agency (USEPA). For both carbon monoxide and nitrogen dioxide the air monitors that are less than 30 meters from the road had higher concentrations than the other monitors located further from the road. For fine particulate matter, the monitors located 30 to 100 meters from the road were significantly different from monitors located closer to the road (less than 30 meters) or monitors located further than 100 meters from the road. Regression models were developed which examined the air pollution concentration as a function of elevation, the annual average daily traffic count, the distance the monitor is located from the roadway, the interaction of traffic count and distance from the roadway and the effect of year, which reflects air pollution controls implemented over time. The explanatory variables: elevation, the interaction of traffic count and distance from the roadway and the effect of year are significant for all three pollutants (p<.001). The annual average daily traffic count and distance from the roadway were also highly significant for NO2 (p<0.0001). Finally, the distance from the roadway was also highly significant for PM fine (p<0.0001).
2 Carbon monoxide and nitrogen dioxide have higher levels in the winter months. A majority of CO monitors reported their smallest concentration at 0.3 parts per million. Only NO2 was found to have a day of the week effect with weekend days having lower concentrations than weekdays at all three set back distances from the roadway. When examining the wind data our group was able to use hourly wind speed multiplied by the hourly concentration of each sites individual pollutants to create a wind graph showing pollutant readings at degree intervals of 10. Using Google Images of the individual sites our team was able to see that our wind graphs correctly identified primary and secondary pollutant sources for all 8 case study sites. Each graph showed that the main sources of pollution were roadways within ~300 meters of the road, showing that the pollution readings measured by the air monitors were coming from roadways and automobile traffic, which is the main goal of these roadside monitoring devices. Our final analysis examines each pollutant at multiple sites with different setback distances in 3 Cities. Are the air monitoring sites decreasing at the same rate at each monitor with a different setback distance? Upon scaling each data point by it s original starting value we were able to graph and do calculations on points of varying distances and values. After doing a comparison test of each pollutant by distance, we found that their was no significant difference in the overall means of each pollutant between the 3 different distance groups of <30 meters, between 30 and 100 meters and >100 meters. In short, there is no difference in the decreasing rate of pollutants at a significance level of.05. Introduction and Background: In this project our group set out to answer several questions posed to us by our client, Mr. David Mintz of the U. S. Environmental Protection Agency (USEPA). He asked us to investigate the
3 possible impact of the distance a monitoring site is from nearest major road on changing pollution levels over time. Are pollution levels improving at faster rate near major roadways than air monitoring sites located further from the roadway? We will try to answer the following questions regarding air pollution near roadways: What is impact of setback distance and traffic volume on air pollution monitors? Is the difference (or change) in concentration greater on certain days of the week? Is there a weekend/weekday effect due to changes in traffic patterns? Is the diurnal (hourly) pattern different due to rush hour traffic? Are we able to pinpoint pollution sources using pollution levels and wind data? Is it possible to determine if each pollutant is decreasing or increasing at the same rate for differing distances and within different cities? The most important part of this project was to first become thoroughly informed of the pollutants we would be examining. The three pollutants we examined for each monitoring site were nitrogen dioxide, carbon monoxide, and PM2.5. All three of these pollutants are important to monitor as they have been linked to an increase in respiratory symptoms, hospitalization for heart or lung diseases, and even premature death. Also, all of these pollutants have at least some connection to the automobile industry and carbon monoxide and nitrogen dioxide and are directly emitted from cars and trucks via exhaust. Fine particulate matter can be directly emitted from sources such as forest fires, or they can form when gases emitted from power plants, industries and automobiles react in the air. All three pollutants are related directly or indirectly to emissions from cars and trucks.
4 The next step our team took was to examine how and where the USEPA air monitoring sites are placed. The highest numbers of air monitoring sites are placed in highly populated areas that have heavy traffic patterns. These are the larger, more heavily populated cities around the United States. The air monitoring sites are placed according to Federal monitoring regulations and are operated for long periods of time making it possible to evaluate trends over a decade or longer. The air monitoring data from these sites are compared with the annual average traffic data, wind speed and wind direction, and several other factors to develop appropriate regression models. One final bit of information that is important to the initial research of the project is the understanding that there are 10 different regions as defined by the USEPA. These 10 regions encompass all 50 states, the US Virgin Islands, and Puerto Rico. Each of these regions is broken up geographically and contains several states. Some regions contain US territories as well. Our group decided to choose case study sites from as many of the 10 different EPA regions to see how pollutants behaved in different parts of the country. Objectives: The principal objective is to determine what effect, if any, an air monitor s distance from the roadway had on the measured air pollution levels of carbon monoxide, nitrogen dioxide, and fine particulate matter. Are concentrations at near-road cites changing at a different rate than other monitors? Are day of the week, time of day, season of the year, and year to year changes, different based upon distance from the roadway? Is there a time of day effect on air pollution levels, such as the morning rush hour? What s the effect of increasing emissions from power plants on nitrogen dioxide and PM2.5 levels, while gearing up for the start of the work week on Monday when work resumes in downtown office buildings? The hourly data will allow us to
5 examine diurnal patterns and see if there are similar patterns for carbon monoxide, nitrogen dioxide and fine particulate matter. Do they all increase during rush hour? We were interested in the effect of distance from the road on the air monitor. We set out to see how much the air pollutant levels are influenced by distance and how different distances affect their rates of change in air pollution levels. Further, how is it affected by the average annual daily traffic count (AADT), which gives you the average number of cars that pass by a roadway every day? Since all three of the pollutants should be influenced by how much traffic is in their vicinity, we are trying to determine if roads with very high traffic counts have significantly higher pollutant levels. We are interested in the impact of meteorological factors such as wind speed and direction, and other factors, such as the elevation of the site from sea level. Finally we are interested in seeing if each pollutant is decreasing at the same rate within different cities. Since each and every site will have different AADT, and different distances from the road, scaling the data in each city should allow us to see if each site in a city is decreasing at different rates. Methods and Analysis: To complete our project it was suggested by Mr. Mintz, USEPA, that we choose 5-10 different cities around the United States to use as case studies for our project. To select these cities we had several criteria. The first of which was that we had a triple site which we considered a site that recorded all three pollutants. We also wanted to be able to find the distance from the nearest road for each site selected, have the AADT count for each of those roads as well as the elevation. Finally each site must have measured air quality data from 1999 to The sites we selected were located in: Elizabeth, NJ Baltimore, MD
6 Philadelphia, PA Denver, CO Sacramento, CA Houston, TX Tucson, AZ Charlotte, NC To factor in distance, we used the distance between each air-monitoring station and the closest road to the monitor. We also used government records to determine elevation. As for wind data, we collected data from an online archive, called This site provides us with wind speed and direction (in 10 degree increments ranging from 0-360) for every hour. This data is drawn from the local airport in each city so this wind speed data will have a slight variation from the true wind data at each of the 8 sites mentioned above. To analyze the data, we performed the following functions: - Stepwise Regression Analysis - Routine Regression Analysis - Correlation Analysis - T Tests - F-Tests - Distance Comparison Tests To test the yearly data we grouped the 8 case study sites into 3 different groups based on distance between the monitor and the nearest road. Those groups were near-road sites that were 0-30 meters from the road, middle sites that were between meters from the road, and finally, far sites that were greater than 101 meters from the road. We ended up having 4 near-road sites, 2 middle sites, and 2 far sites. Once this was done we collected the yearly data for each site. To measure CO we took the
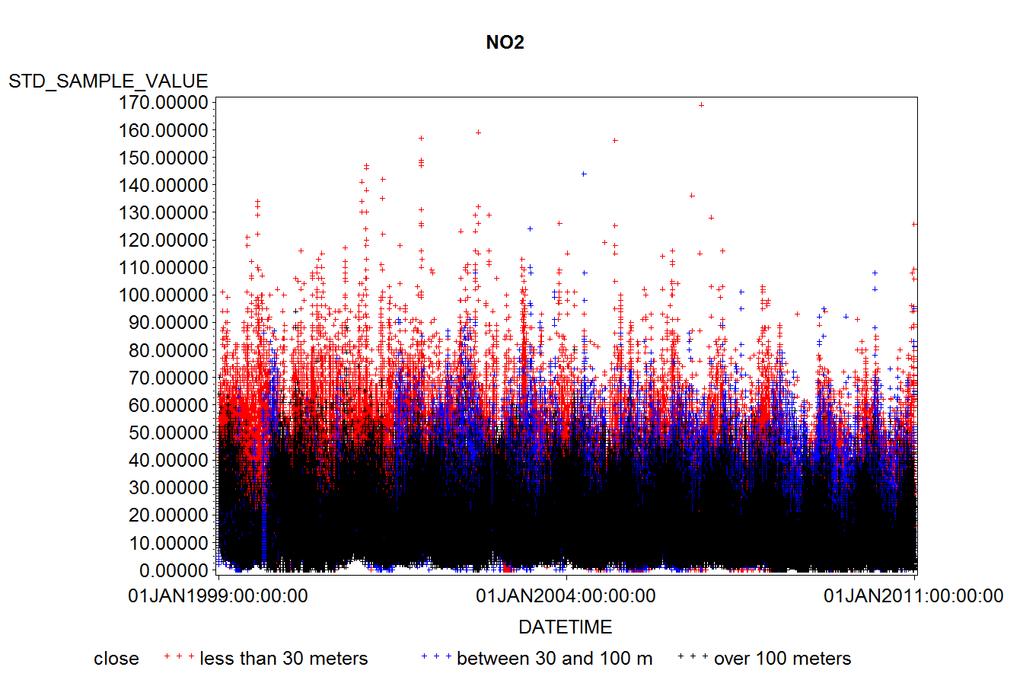
7 annual second maximum 8-hour average, for NO 2 we took the 98 th percentile of the yearly 1-hour averages, and for PM 2.5 we took the annual arithmetic mean of the 24-hour averages. This information resulted in the following graphs, which in order are CO, NO 2, and PM 2.5 : ; Using stepwise regression analysis, it was determined that a number of factors were important in determining the pollution levels of an area. Currently, these factors are: - Distance from the road - Elevation of the city - Traffic of the road - The interaction/combination of proximity to the road and the road s traffic
8 Currently, the strongest predictors for each pollutant seem to be: The elevation term when examining CO (SAS output on the far left below) Elevation, AADT, and the AADT*Distance terms for NO 2 (SAS output on the far right below) Elevation, AADT*Distance, and Distance terms for PM 2.5 (SAS output on the next page) These significance levels were <0.0001, which is much smaller than an α level of 0.05, widely considered an indicator of significance. This suggests that elevation is a very important factor in all three pollutants, and that air quality improves as the distance from the road increases, but only to a certain point if the road is too busy. Currently, it can be assumed that pollution levels will be diluted or lowered at a distance, and if possible that monitoring stations should be as close as possible to them. We should also be wary of placing houses too close to the roadways.
9 Daily data were then examined. The graphs below show the daily maximum hourly value reported each day for the year of The graphs show all eight sites and display the monitoring sites which are less than 30 meters away with a red dot, a blue dot if the monitor is between meters and with a black dot if the monitor is over 100 meters away from the nearest road. Carbon monoxide is shown having higher levels in the winter months. It also showed a majority of CO monitors reporting their smallest concentration at 0.3 parts per million. We also contrasted the three groups based on the distance from the road and each of the three groups was considered different with p-value less than.05. For both carbon monoxide and nitrogen dioxide the air monitors that are less than 30 meters from the road had higher concentrations than the other monitors located at further distances from the road. For fine particulate matter the graph shows that there are no clear differences over the year.


10 Data were also examined to determine if there were significant differences among the days of the week. Lower levels were expected on the weekend due to less traffic. The box plots below are shown for the four sites that are less than 30 meters from the road. Upon examining graphs and performing statistical tests, both carbon monoxide and fine particulate matter showed no significant differences among the days of the week. For nitrogen dioxide, however, both Saturday and Sunday were found to have lower levels than the weekdays. It is expected that the amount of traffic may be the cause, but it could also be due in part to power plants, which have lower
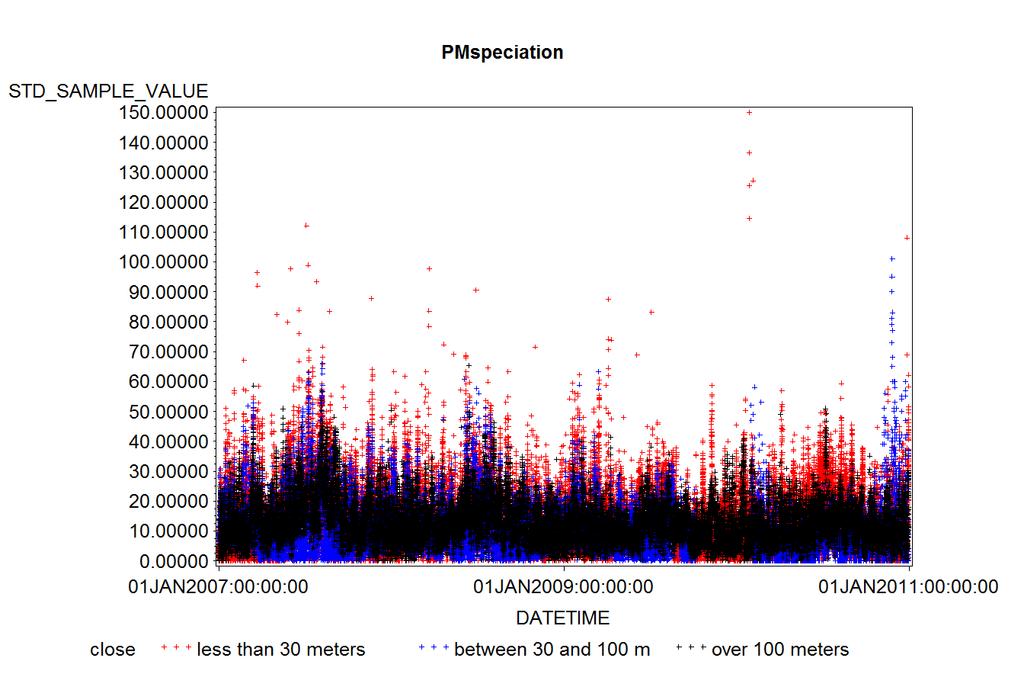
11 emissions on weekends. This process was conducted again utilizing data collected from monitors located between 30 and 100 meters from the nearest road and for monitors located over 100 meters from the nearest road. Data showed the same trends as the first analysis, where the carbon monoxide and fine particulate matter showed no differences among the days of the week, while nitrogen dioxide levels had much lower levels on the weekends. Hourly data were then examined. The graphs below show the value reported each hour from 1999 to 2011 for NO2 and CO. The fine particulate matter hourly data varied from city to city
12 so the graphs are only consistent from 2007 to There are 2 different types of graphs with the plain blue ones showing a single city s data for the time period and the multicolored one showing all cities for the time period. The graphs that show all eight sites display the monitoring sites which are less than 30 meters away with a red dot, a blue dot if the monitor is between meters and with a black dot if the monitor is over 100 meters away from the nearest road. Carbon monoxide is shown having higher levels in the winter months. This graph shows a majority of CO monitors reporting their smallest concentration at 0.25 parts per million. This value is considered to be half of the monitor s minimum detectable of.5 parts per million. The horizontal white lines occurring in the NO2 and CO graphs were due to the monitors only reading to the 2 nd decimal place and thus rounding the concentration readings. By observing the graphs, it is easy to see the decreasing trend in pollution levels throughout the years. Also by looking at the cumulative graphs the difference in pollution levels are visible with the monitors closest to the road having consistently higher readings.
13

14 We also contrasted the three groups based on the distance from the road and each of the three groups was considered different with p-value less than.05. For both carbon monoxide and nitrogen dioxide the air monitors that are less than 30 meters from the road had higher concentrations than the other monitors located at further distances from the road. For fine particulate matter the graph shows that there are no clear patterns occurring. The results of the significance test at a.05 level are shown below: One of the questions we need to ask is: Are we measuring the air impacted by over the road, or just the air of the general area? Obviously, all air monitors do both, but if it does not measure more the air coming from the road and less of the air of the general area, we cannot guarantee that we ve got the real measurements of the road. As mentioned earlier, we obtained wind speed data from and we have managed to implement wind data into the analysis. The two meteorological variables that affect the pollution dispersed from roadways to the air monitors are wind speed and wind direction.
15 To utilize the data, we created a variable called wsxpol, an abbreviation of wind speed times pollution. Multiplying the number of the pollution measurement by the wind speed creates Wsxpol. For example, if we had CO measurement of 5 parts per million going at 5 miles per hour, the wsxpol value would be 25. To determine the direction of the major sources of pollution, we created graphs featuring wsxpol as the vertical axis and wind direction in degrees as the horizontal axis. To elaborate on the degrees for the horizontal axis, we used a scale from 0 to 360. If the degree was 0 or 360 it was coming from the North. If the degrees were 90, it was considered coming from the East. Due South was 180, and due West was 270. When we plot our pollution data on our earlier graph, we will find plumes of pollution, where the higher numbers congregate in one or more general directions. We can assume that these plumes are in fact due to a source that is emitting most of the measured pollution. With the direction of our pollution source marked, we then go to Googlemaps, and take a look at the aerial view of the site. For example, if the wsxpol data suggest that we have a major pollution emitter to the South. Below are the wind plumes from Philadelphia along with the map image showing the site as a yellow dot in the upper left hand quadrant of the image.
16

17 Our final analysis focused on decreasing yearly rates. For this final analysis the team was seeking to determine if each pollutant, CO, NO2, and PM2.5, were decreasing in similar rates across the country. For this experiment we focused on 3 different case study cities: Phoenix, Arizona Philadelphia, Pennsylvania Sacramento, California These three sites were chosen because each of them contained one site from each of our 3 previously determined distance categories, which also monitored all three pollutants of interest. By comparing the findings from these 9 sites other external factors such as distance from the road, AADT, and wind speed are negated. Upon gathering the 9 sites yearly pollutant averages from , we scaled each data point in an effort to normalize the data. To do this the team divided each yearly pollution value by the starting years value. This made each pollutant begin at
18 1.0 and go up or down compared on the variance from year to year. Our group called this scaling data by COper, NO2per, and PM2.5per. The resulting graphs for Philadelphia are below: Carbon Monoxide Nitrogen Dioxide PM2.5 Fine Particulate

19 After scaling this data down, the team used SAS analysis software to test if there were any differences between the distances of each pollutant at a significance level of.05. The findings show that only one of the comparison tests between the closest nitrogen dioxide readings and those greater than 100 meters had a significantly different mean at a significant level of.05. The other 8 comparison tests show that there is no noticeable difference in the means at varying distances. The values of the t-test findings are shown below: Conclusions: We have shown that the distance from the road does indeed have an impact on air pollution levels, but it is not the sole factor. The average annual daily traffic count and elevation in combination with distance from the road are the factors that influence the pollution levels. When examining the hourly pollution data the team found an overall decreasing trend through the years for each of the three pollutants. This was significant at a.05 significance level. The windspeed * pollution level graphs allowed the team to identify primary and secondary pollution sources for
20 each of the cities that we investigated. After examining 3 different cities, with each having three monitoring sites, the team found that only the NO2 readings between close monitors compared to far away monitors were significant at an alpha level of The air pollution monitoring devices the EPA uses to track pollution near roadways are doing their job, getting readings from primary roadways. The one overlaying positive that our group has found is that the regulations the EPA has put in place to limit pollution from automobile traffic are working, shown by the decreasing trends seen at the hourly, daily, and yearly levels.
Air quality in the vicinity of a governmental school in Kuwait
 Air Pollution XVI 237 Air quality in the vicinity of a governmental school in Kuwait E. Al-Bassam 1, V. Popov 2 & A. Khan 1 1 Environment and Urban Development Division, Kuwait Institute for Scientific
Impact of traffic composition and street canyon on the street level air quality and pedestrian exposure in Central, Hong Kong
 Impact of traffic composition and street canyon on the street level air quality and pedestrian exposure in Central, Hong Kong Agata Rakowska, Ka Chun Wong, Thomas Townsend, Chan Ka Lok, Dane Westerdahl,
Winter Air Quality in Yellowstone National Park
 National Park Service U.S. Department of the Interior Natural Resource Program Center Winter Air Quality in Yellowstone National Park 2008-2009 Natural Resource Technical Report NPS/NRPC/ARD/NRTR 2010/285
Noise & air quality research in Amsterdam
 Noise & air quality research in Amsterdam Partner: Marineterrein and Topsector Logistiek Data Analysis & Reporting: Antoine Zenié antoine.zenie@ultra-iot.com 0044 (0) 740 385 8280 Contact Point: Joris
WASHINGTON COUNTY. Air Quality PM2.5
 WASHINGTON COUNTY Air Quality PM2.5 Introduction Background This presentation explains an air quality issue in Washington County (WC) as it relates to fine particulate pollution (PM2.5). Immediate plan
GAO AIR POLLUTION. Air Quality and Respiratory Problems in and Near the Great Smoky Mountains. Testimony
 GAO United States General Accounting Office Testimony Before the Subcommittee on Legislative, Committee on Appropriations, House of Representatives For Release on Delivery Expected at 2:00 p.m., Friday,
10.0 AIR QUALITY AND CLIMATIC FACTORS
 .0 AIR QUALITY AND CLIMATIC FACTORS.1 ASSESSMENT METHODOLOGY.1.1 General Section 39 (2) (b) (ii) of the Transport (Railway Infrastructure) Act 2001, requires that proposed developments are examined in
APPENDIX H AIR DISPERSION MODELLING REPORT BY PROJECT MANAGEMENT LTD. (REF. CHAPTER 11 AIR QUALITY AND CLIMATIC FACTORS)
") 101050.22.RP.0001 A Environmental Impact Statement 15 th April 2005 APPENDIX H AIR DISPERSION MODELLING REPORT BY PROJECT MANAGEMENT LTD. (REF. CHAPTER 11 AIR QUALITY AND CLIMATIC FACTORS) S:\Projects\190900\101050
101050.22.RP.0001 A Environmental Impact Statement 15 th April 2005 APPENDIX H AIR DISPERSION MODELLING REPORT BY PROJECT MANAGEMENT LTD. (REF. CHAPTER 11 AIR QUALITY AND CLIMATIC FACTORS) S:\Projects\190900\101050
Evaluation of the Port of New York & New Jersey Clean Trucks Program Rollback
 Evaluation of the Port of New York & New Jersey Clean Trucks Program Rollback June 217 Prepared by: Sustainable Systems Research, LLC Prepared for: Coalition for Healthy Ports (CHP) www.coalitonforhealthyports.org
PRESENTING DATA ATM 16% Automated or live telephone 2% Drive-through service at branch 17% In person at branch 41% Internet 24% Banking Preference
 Presenting data 1 2 PRESENTING DATA The information that is collected must be presented effectively for statistical inference. Categorical and numerical data can be presented efficiently using charts and
ASSESSMENT OF AMBIENT AIR QUALITY INDEX (AQI) IN BHUBANESWAR, THE CAPITAL CITY OF ODISHA
 IN BHUBANESWAR, THE CAPITAL CITY OF ODISHA") ASSESSMENT OF AMBIENT AIR QUALITY INDEX (AQI) IN BHUBANESWAR, THE CAPITAL CITY OF ODISHA K. Mohapatra 1, S. K. Biswal 2 1 Asst. Professor, Department of Chemistry, GITA, Bhubaneswar (India) 2 Professor,
ASSESSMENT OF AMBIENT AIR QUALITY INDEX (AQI) IN BHUBANESWAR, THE CAPITAL CITY OF ODISHA K. Mohapatra 1, S. K. Biswal 2 1 Asst. Professor, Department of Chemistry, GITA, Bhubaneswar (India) 2 Professor,
SO 2 Air Dispersion Modeling Report for White Bluff Steam Electric Station. ERM Project No The world s leading sustainability consultancy
 SO 2 Air Dispersion Modeling Report for White Bluff Steam Electric Station August 2015 ERM Project No. 0268066 www.erm.com The world s leading sustainability consultancy SO 2 Air Dispersion Modeling Report
2006 Sulfur Dioxide Summary
 2006 Sulfur Dioxide Summary New Jersey Department of Environmental Protection NATURE AND SOURCES Sulfur dioxide (SO 2 ) is a heavy, colorless gas with a suffocating odor that easily dissolves in water
Title: Peak Event Analysis: A Novel Empirical Method for the Evaluation of Elevated Particulate Events
 Author's response to reviews Title: Peak Event Analysis: A Novel Empirical Method for the Evaluation of Elevated Particulate Events Authors: Aaron M Orkin (aaron.orkin@mail.utoronto.ca) Pamela Leece (pamela.leece@mail.utoronto.ca)
AIR DISPERSION MODELLING IN COASTAL AREAS WITH ROUGH TERRAIN, USING CALPUFF PRIME
 AIR DISPERSION MODELLING IN COASTAL AREAS WITH ROUGH TERRAIN, USING CALPUFF PRIME Marcia C. Parsons, Fracflow Consultants Inc., 154 Major s Path, St. John s, NL, Canada, A1A 5A1, Faisal Khan, Memorial
Health Effects Associated with Stack Chemical Emissions from NYS Natural Gas Compressor Stations:
 Health Effects Associated with Stack Chemical Emissions from NYS Natural Gas Compressor Stations: 2008-2014 A Technical Report Prepared for the Southwest Pennsylvania Environmental Health Project D.O.
Design of Ventilation for a Highway Tunnel in a Very Crowded Urban Area
 Design of Ventilation for a Highway Tunnel in a Very Crowded Urban Area Morteza Gharouni-Nik Ph.D., Iran University of Science & Technology (IUST), Tehran, Iran ABSTRACT Resalat Tunnel is one of the widest
Air Quality Statistics
 Manual on the Basic Set of Environment Statistics of the FDES 2013 Air Quality Statistics Topic 1.3.1 of the Basic Set of Environment Statistics of the FDES 2013 Álvaro Shee Smith (ashee@mma.gob.cl) Ministry
2010 AIR POLLUTION CONTROL
 1 AIR POLLUTION CONTROL Monitoring Report for Lake and Geauga Counties Lake County General Health District 33 Mill Street Painesville, Ohio 4477 Table of Contents INTRODUCTION... 1 STATE AND FEDERAL AIR
Summary. Air Quality in Latin America: An Overview Edition. 1. Introduction. Produced by the Clean Air Institute
 Summary 1. Introduction 2012 Edition Air Quality in Latin America: An Overview Produced by the Clean Air Institute Poor air quality is having serious impacts on health, social welfare and economic development
ENCLOSURE 3 Pennsylvania s April 8, 2013 Letter Regarding 1-hour SO 2 Designations ALLEGHENY COUNTY
 ENCLOSURE 3 Pennsylvania s April 8, 2013 Letter Regarding 1-hour SO 2 Designations ALLEGHENY COUNTY On February 7, 2013, the EPA released its proposal for 1-hour SO 2 designation areas across the Commonwealth
History of significant air pollution events
 Ch17 Air Pollution A thick layer of smoke and haze covers Santiago, Chile. History of significant air pollution events Many of the worst air pollution episodes occurred in the last two centuries in London
Nova Scotia Air Zone Report. Nova Scotia Air Quality Unit, 2015
 Nova Scotia Air Zone Report Nova Scotia Air Quality Unit, 2015 Acronyms AQHI Air Quality Health Index AQMS Air Quality Management System AQU Nova Scotia Environment s Air Quality Unit CAAQS Canadian Ambient
Health impacts of air pollution in London: from understanding to forecasting
 Health impacts of air pollution in London: from understanding to forecasting John Gulliver University of the West of Scotland Marta Blangiardo, David Briggs, Anna Hansell Imperial College London Study
Effect of PM2.5 on AQI in Taiwan
 Environmental Modelling & Software 17 (2002) 29 37 www.elsevier.com/locate/envsoft Effect of PM2.5 on AQI in Taiwan Chung-Ming Liu * Department of Atmospheric Sciences, National Taiwan University, Taipei,
AIRBORNE PARTICULATE MATTER WITHIN 100 RANDOMLY SELECTED OFFICE BUILDINGS IN THE UNITED STATES (BASE)
") Proceedings of Healthy Buildings, Vol. 1 157 AIRBORNE PARTICULATE MATTER WITHIN 1 RANDOMLY SELECTED OFFICE BUILDINGS IN THE UNITED STATES (BASE) L.E. Burton, J.G. Girman, S.E. Womble Indoor Environments
Proceedings of Healthy Buildings, Vol. 1 157 AIRBORNE PARTICULATE MATTER WITHIN 1 RANDOMLY SELECTED OFFICE BUILDINGS IN THE UNITED STATES (BASE) L.E. Burton, J.G. Girman, S.E. Womble Indoor Environments
Statistical analysis of ambient air PM10 contamination during winter periods for Ruse region, Bulgaria
 Statistical analysis of ambient air PM10 contamination during winter periods for Ruse region, Bulgaria Irina Tsvetanova 1, Ivanka Zheleva 1,, Margarita Filipova 1, and Antoaneta Stefanova 1 1 Department
Application of the AERMOD modeling system for air pollution dispersion in the South Pars oilfield
 First International Symposium on Urban Development: Koya as a Case Study 339 Application of the AERMOD modeling system for air pollution dispersion in the South Pars oilfield 1,2 1,2 3 M. Rouhi, H. Moradi
The role of light duty vehicles in future air pollution: a case study of Sacramento
 Transportation Planning and Technology Vol. 33, No. 6, August 2010, 541549 The role of light duty vehicles in future air pollution: a case study of Sacramento Guihua Wang* Institute of Transportation Studies,
COMMONWEALTH OF VIRGINIA STATE AIR POLLUTION CONTROL BOARD REGULATIONS FOR THE CONTROL AND ABATEMENT OF AIR POLLUTION
 COMMONWEALTH OF VIRGINIA STATE AIR POLLUTION CONTROL BOARD REGULATIONS FOR THE CONTROL AND ABATEMENT OF AIR POLLUTION 9VAC5 CHAPTER 30. AMBIENT AIR QUALITY STANDARDS. 9VAC5-30-10. General. 9VAC5-30-15.
Indicator Fact Sheet Signals 2001 Air Pollution
 Indicator Fact Sheet Signals 1 Air Pollution AP12b Exceedance days of air quality threshold value of Particulate Matter AP12 PM: in urban areas (black smoke 24h >12, TSP 24 h > 1, PM 24h > ug/m3) 4 4 3
Air Pollution. GEOL 1350: Introduction To Meteorology
 Air Pollution GEOL 1350: Introduction To Meteorology 1 Overview Types and Sources of Air Pollutants Factors That Affect Air Pollution Air Pollution and the Urban Environment 2 Air pollutants are airborne
This summary and the Report subsequently inform the recommended mitigation contained in Section 28 and will inform the Project conditions.
 18. Air The Project Air quality team prepared an Air Quality Assessment Report for the Project, which is included in Volume 3 (Part 1). The Report provides an assessment of air quality effects associated
CHAPTER 2 - Air Quality Trends and Comparisons
 CHAPTER 2 - Air Quality Trends and Comparisons Particulate Sampling Total Suspended Particulate Matter With the monitoring for PM 2.5 particulate matter being labor intensive, DEP reduced the number of
IB internal assessment: Measuring air pollution
 IB internal assessment: Measuring air pollution Introduction Air pollution is a serious issue in the environment. Pollution from cars or other vehicles contains toxic chemicals such as oxides of nitrogen
Living things in their environments
 Introduction: This lesson will provide children the opportunity to develop a greater understanding of living things, personal health and the health of the environment. The children will be encouraged to
Air Quality Monitoring at Dublin Airport: Annual Report for HSSE Department
 Air Quality Monitoring at Dublin Airport: Annual Report for 2013 Air Quality Monitoring at Dublin Airport: 2013 Table of Contents Glossary... 3 Executive Summary... 4 1. Introduction... 5 1.1. Background...
MODULE I. Learning Objectives
 MODULE I Learning Objectives To make the students aware of history of air pollution; definition of air pollution and various types of sources and classification of air pollutants. Lecture 1 Lecture 2 Lecture
Dublin Airport Air Quality Monitoring Q1, Q2 2017
 Dublin Airport Air Quality Monitoring Q1, Q2 2017 Environment August 2017 Dublin Airport Air Quality Monitoring Report Quarter 1&2 2017 Air Quality Monitoring Dublin Airport: Q1, Q2 2017 Contents 1.0 Introduction...
GUIDELINE FOR SELECTING AND MODIFYING THE OZONE MONITORING SEASON BASED ON AN 8-HOUR OZONE STANDARD
 United States Office of Air Quality EPA-454/R-98-00 Environmental Protection Planning and Standards June 998 Agency Research Triangle Park, NC 277 Air GUIDELINE FOR SELECTING AND MODIFYING THE OZONE MONITORING
MARINA APARTMENT PROJECT PETALUMA, CA AIR QUALITY AND GREENHOUSE GAS EMISSIONS ASSESSMENT
 MARINA APARTMENT PROJECT PETALUMA, CA AIR QUALITY AND GREENHOUSE GAS EMISSIONS ASSESSMENT April 13, 2015 Prepared for - Paul Andronico Basin Street Properties 119 C St Petaluma, CA 94952 Via e-mail:
Recommended Protocol for Evaluating the Location of Sensitive Land Uses Adjacent to Major Roadways
 Recommended Protocol for Evaluating the Location of Sensitive Land Uses Adjacent to Major Roadways Technical Appendix January 2009 Version 2.1 Table of Contents Document Revisions... 4 Health Risk Assessment
Case Study: Pollution in Los Angeles L.A. COURIER
 3.2 Read Case Study: Pollution in Los Angeles L.A. COURIER Los Angeles, California May 1, 2008 The Most Polluted City in America Los Angeles under a heavy layer of smog. Once again, Los Angeles has topped
4.2 Air Quality Introduction Environmental and Regulatory Setting Environmental Setting. Existing Air Quality Conditions
 4.2 4.2.1 Introduction This section describes the affected environment and environmental consequences related to air quality from operations of the NEPA Alternatives. Information in this section is based
MEAN ANNUAL EXPOSURE OF CHILDREN AGED 0-4 YEARS TO ATMOSPHERIC PARTICULATE POLLUTION
 MEAN ANNUAL EXPOSURE OF CHILDREN AGED 0-4 YEARS TO ATMOSPHERIC PARTICULATE POLLUTION GENERAL CONSIDERATIONS Issues Type of indicator Rationale Issues in indicator design Respiratory disease Exposure (proximal)
3.6 GROUND TRANSPORTATION
 3.6.1 Environmental Setting 3.6.1.1 Area of Influence The area of influence for ground transportation consists of the streets and intersections that could be affected by automobile or truck traffic to
Appendix B2. Air Dispersion Modeling
 Appendix B2 Air Dispersion Modeling Contents 1.0 Introduction... 1 2.0 Estimation of Emissions Used in the Air Dispersion Modeling... 2 2.1 Emission Source Identification... 2 2.2 Derivation of Peak 1-Hour,
Case study on pollution prediction through atmospheric dispersion modelling
 Case study on pollution prediction through atmospheric dispersion modelling MIHAIELLA CRETU, VICTORIA TELEABA, SILVIU IONESCU, ADINA IONESCU Acoustics and Air Quality Laboratory COMOTI Romanian Research
Criteria Pollutant Concentration
 Undergraduate Journal of Mathematical Modeling: One + Two Volume 1 2008 Fall Issue 1 Article 2 Criteria Pollutant Concentration Victor Neese University of South Florida Advisors: Leslaw Skrzypek, Mathematics
Characteristics of the particulate matter in Riyadh city, Saudi Arabia
 Environmental Health Risk VII 131 Characteristics of the particulate matter in Riyadh city, Saudi Arabia A. S. Modaihsh and M. O. Mahjoub Soil Science Department, College of Food Sciences and Agriculture,
Activity 9 Finding Sources of Air Pollution
 Activity 9 Finding Sources of Air Pollution This activity calls for students to locate on a map the potential areas of air pollution in their community. It is related to the Prediction and Where s That
THE COMBUSTION OF HYDROCARBONS. I love the smell of napalm in the morning smells like victory!
 THE COMBUSTION OF HYDROCARBONS I love the smell of napalm in the morning smells like victory! Carbon monoxide is a toxic gas that can be produced during the combustion of a carbon-based fuel such as propane.
6.1 INTRODUCTION 6.2 REGULATORY FRAMEWORK NATIONAL AMBIENT AIR QUALITY STANDARDS COMPLIANCE STATUS TRANSPORTATION CONFORMITY
 Chapter 6 Air Quality 6.1 INTRODUCTION This chapter presents a project-level analysis of the potential for air quality impacts that could result from mobile and stationary sources of air emissions generated
Nova Scotia Air Zone Report
 Nova Scotia Air Zone Report 2016 Contents Introduction to Nova Scotia Environment s Ambient Air Programs... 1 Airsheds and Air Zones... 3 Airsheds... 3 Air Zones... 4 Canadian Ambient Air Quality Standards
How safe is Beijing s Air Quality for Human Health? Naresh Kumar Θ
 How safe is Beijing s Air Quality for Human Health? Naresh Kumar Θ Abstract: The success of the 2008 Olympics will be largely impacted by the level of air pollution in Beijing. The World Health Organization
Does Ozone Carryover Affect Day-of-the-Week Phenomena?
 Does Ozone Carryover Affect Day-of-the-Week Phenomena? For this to be true, carryover of ozone, apparent in changes of ozone concentrations aloft from one day to the next, should experience day-of-the-week
Renewables Portfolio Standards in the United States: A Status Update
 Renewables Portfolio Standards in the United States: A Status Update Galen Barbose Lawrence Berkeley National Laboratory Renewable Energy Markets 214 December 4, 214 This analysis was funded by the National
Regional Ecosystem Analysis Puget Sound Metropolitan Area
 Final Report: 7/25/98 Regional Ecosystem Analysis Puget Sound Metropolitan Area Calculating the Value of Nature Report Contents 2 Project Overview and Major Findings 3 Regional Level Analysis 4 Neighborhood
NO2, SO2, PM2.5, Oh my!?! Information Session EPA R/S/L Modelers Workshop May 10, 2010
 NO2, SO2, PM2.5, Oh my!?! Information Session EPA R/S/L Modelers Workshop May 10, 2010 Purpose & Outline Provide background and updates on permit modeling processes and technical aspects related to new
Quantifying the performance of a traffic data collection system: Scout Connect match rate evaluation
 Technology Showcase Miovision Scout Quantifying the performance of a traffic data collection system: Scout Connect match rate evaluation Contents Executive summary 2 Elements of the study 2 Objectives
Mitigation and Calculation of Short-term Hydrogen Sulfide and Nitrogen Dioxide Impacts to Ambient Air Adjacent to Geothermal Well Pads
 Presented at Geothermal Resources Council 1999 Annual Meeting; October 17-20, 1999; Reno, Nevada Mitigation and Calculation of Short-term Hydrogen Sulfide and Nitrogen Dioxide Impacts to Ambient Air Adjacent
Implementation Issues for the PM 2.5 National Ambient Air Quality Standards PM 2.5 NAAQS
 Implementation Issues for the PM 2.5 National Ambient Air Quality Standards Update for MARAMA CEMS Webinar October 6, 2011 Rich Damberg US EPA Office of Air Quality Planning and Standards 1 PM 2.5 NAAQS
I-70 East ROD 1: Phase 1 (Central 70 Project) Air Quality Conformity Technical Report
 Air Quality Conformity Technical Report") I-70 East ROD 1: Air Quality Conformity Technical Report January 2017 I-70 East ROD 1: Air Quality Conformity Technical Report TABLE OF CONTENTS Chapter Page 1 PURPOSE OF THIS REPORT... 1 2 PROJECT DESCRIPTION...
I-70 East ROD 1: Air Quality Conformity Technical Report January 2017 I-70 East ROD 1: Air Quality Conformity Technical Report TABLE OF CONTENTS Chapter Page 1 PURPOSE OF THIS REPORT... 1 2 PROJECT DESCRIPTION...
MEMORANDUM. September 9, 2005
 MEMORANDUM September 9, 2005 TO: FROM: MEMBERS, PORT COMMISSION Hon. Wilfred Hsu, President Hon. Michael Hardeman, Vice President Hon. Sue Bierman, Commissioner Hon. Kimberly Brandon, Commissioner Hon.
2013 National Ambient Air Quality Standard (NAAQS) for Fine Particulate Matter (PM2.5): Designating Nonattainment Areas
 for Fine Particulate Matter (PM2.5): Designating Nonattainment Areas") 2013 National Ambient Air Quality Standard (NAAQS) for Fine Particulate Matter (PM2.5): Designating Nonattainment Areas Robert Esworthy Specialist in Environmental Policy December 23, 2015 Congressional
2013 National Ambient Air Quality Standard (NAAQS) for Fine Particulate Matter (PM2.5): Designating Nonattainment Areas Robert Esworthy Specialist in Environmental Policy December 23, 2015 Congressional
TROPOSPHERIC AEROSOL PROGRAM - TAP
 THE DEPARTMENT OF ENERGY'S TROPOSPHERIC AEROSOL PROGRAM - TAP AN EXAMINATION OF AEROSOL PROCESSES AND PROPERTIES RG99060050.3 American Geophysical Union, Fall Meeting, San Francisco, December 12-17, 1999
ENVIRONMENTAL EFFECTS OF THE OPEN CAST MINING OPERATIONS AT SAMMAD URBAN AREAS NEAR TO LIMESTONE QUARRIES AMMAN 2010
 ENVIRONMENTAL EFFECTS OF THE OPEN CAST MINING OPERATIONS AT SAMMAD URBAN AREAS NEAR TO LIMESTONE QUARRIES DR. AWWAD HUSNI TITI NATURAL RESOURCES AUTHORITY AMMAN JORDAN PHONE:+962 6 58576; FAX: +962 6 5811866
Corvallis Ozone and Aerosol Experiment (COAX)
") Corvallis Ozone and Aerosol Experiment (COAX) 2008 Shayna Rogers Department of Environmental Science, Oregon State University Honors College, Corvallis, Oregon, USA Ivar Vong Departments of Chemistry and
Corvallis Ozone and Aerosol Experiment (COAX) 2008 Shayna Rogers Department of Environmental Science, Oregon State University Honors College, Corvallis, Oregon, USA Ivar Vong Departments of Chemistry and
Transit Service Guidelines
 G R E AT E R VA N CO U V E R T R A N S P O RTAT I O N A U T H O R I T Y Transit Service Guidelines PUBLIC SUMMARY REPORT JUNE 2004 Greater Vancouver Transportation Authority TRANSIT SERVICE GUIDELINES
Maryland Clean Air Progress Report
 Maryland Clean Air 217 Progress Report In 216, it was hot. Really hot. Maryland experienced the sixth-warmest summer ever recorded. Despite that type of weather -- which usually ushers in high levels of
Tunnel Ventilation System Design and Air Quality. Peter Gehrke and Andrew Purchase
 Tunnel Ventilation System Design and Air Quality Peter Gehrke and Andrew Purchase Summary of Our Input Primarily - how does the choice of in-tunnel criteria and operational strategies affect the system
The Global Reaction to Water and Air Pollution
 The Global Reaction to Water and Air Pollution By History.com, adapted by Newsela staff on 05.30.17 Word Count 900 Level 1160L White plume smoke containing many pollutants is emitted from a quenching tower
Near-Road Air Quality Monitoring and Modeling: Towards a Mechanistic Understanding
 Near-Road Air Quality Monitoring and Modeling: Towards a Mechanistic Understanding K. Max Zhang Energy and the Environment Research Laboratory Sibley School of Mechanical and Aerospace Engineering Outline
APPENDIX E EMISSIONS ESTIMATE FOR GENERAL CONFORMITY
 APPENDIX E EMISSIONS ESTIMATE FOR GENERAL CONFORMITY Environmental and Planning Consultants 440 Park Avenue South, 7th Floor New York, New York 10016 tel: 212-696-0670 fax: 212-213-3191 www.akrf.com Memorandum
Networks: Spring 2010 Homework 3 David Easley and Jon Kleinberg Due February 26, 2010
 Networks: Spring 2010 Homework 3 David Easley and Jon Kleinberg Due February 26, 2010 As noted on the course home page, homework solutions must be submitted by upload to the CMS site, at https://cms.csuglab.cornell.edu/.
Clean Air for New South Wales Submission from Asthma Foundation Queensland and New South Wales
 Clean Air for New South Wales Submission from Asthma Foundation Queensland and New South Wales Ms Tanya Raineri Senior Manager Advocacy, Policy and Research Asthma Foundation Queensland and New South Wales
A comparison of CALPUFF air quality simulation results with monitoring data for Krakow Poland
 A comparison of CALPUFF air quality simulation results with monitoring data for Krakow Poland John S. Irwin 1, Joanna Niedzialek 2, Jerzy Burzynski 3 1 Atmospheric Sciences Modeling Division (Mail Drop
Trip Generation Characteristics of Free- Standing Discount Stores: A Case Study
 Trip Generation Characteristics of Free- Standing Discount Stores: A Case Study THE RETAIL CHAIN THE INSTITUTE OF TRANSPORTAtion Engineers (ITE) recently published CHOSEN FOR THIS STUDY the sixth edition
Overview of Chapter 19
 19 Air Pollution Overview of Chapter 19 Atmosphere as a Resource Types and Sources of Air Pollution Effects of Air Pollution Controlling Air Pollution in the US Ozone Depletion in the Stratosphere Acid
12. EMISSIONS OF SULPHUR DIOXIDE
 Air Air quality is to a great extent influenced by combustion of fossil fuels, evaporation of volatile organic compounds and their photochemical reaction with other pollutants in the atmosphere. Pollutants
Multi-site Time Series Analysis. Motivation and Methodology
 Multi-site Time Series Analysis Motivation and Methodology SAMSI Spatial Epidemiology Fall 2009 Howard Chang hhchang@jhsph.edu 1 Epidemiology The study of factors affecting the health of human populations
Metropolitan Transit. Prepared for. Original Submittal: May 28, Resubmitted: November 10, 2010 January 21, aq5-28
 Criteria Pollutant Air Dispersion Modeling Analysis for Metro Transit s Existing Hiawatha Light Rail Vehicle Operation & Maintenance Facility, Proposed Paint Booth, and Proposed Light Rail Support Facility
TOGETHER North Jersey Air Quality TABLE OF CONTENTS
 TABLE OF CONTENTS 1 Introduction... 4 1.1 Organization of the Report...4 1.2 Key Findings...5 2 Introduction to Existing Regulatory Structure... 7 2.1 Criteria Pollutants...7 2.1.1 State Implementation
Can your unit pass a Particulate Emission Compliance Test?
 Source Emissions Testing and Emissions Specialists Can your unit pass a Particulate Emission Compliance Test? Kevin Crosby The Avogadro Group, LLC California - Oregon - Arizona McIlvaine Hot Topic Hour,
Outdoor Air Pollution. Primary vs. Secondary Air Pollutants
 Air Pollution Outdoor Air Pollution Primary vs. Secondary Air Pollutants Primary Pollutant a pollutant that is put directly into the air by human activity. Examples: CO, NOx, PM, SOx, VOCs Sources: Electricity
CLIMATE CHANGE AND ACID RAIN. Mr. Banks 7 th Grade Science
 CLIMATE CHANGE AND ACID RAIN Mr. Banks 7 th Grade Science COMPOSITION OF AIR? COMPOSITION OF AIR? 78% Nitrogen 21% Oxygen 0.93% Argon and other noble gases 0.04% carbon dioxide Variable amounts of water
Traffic-related environmental impact mapping in downtown Amsterdam H. Heida, A.L. de Jong, R.C. Muchall
 Traffic-related environmental impact mapping in downtown Amsterdam H. Heida, A.L. de Jong, R.C. Muchall O ME GAM-Environmental Research Institute, H.J.E. Wenckebachweg 120, 1096 AR Amsterdam, The Netherlands
The Implications of Importation of Used Vehicles on the Environment
 Global Journal of researches in engineering Automotive engineering Volume 12 Issue 1 Version 1.0 February 2012 Type: Double Blind Peer Reviewed International Research Journal Publisher: Global Journals
UC Berkeley ACCESS Magazine
 UC Berkeley ACCESS Magazine Title Carmageddon or Carmaheaven? Air Quality Results of a Freeway Closure Permalink https://escholarship.org/uc/item/81f063z9 Journal ACCESS Magazine, 1(44) Authors Winer,
Truck GPS Data for Freight Planning
 Truck GPS Data for Freight Planning presented to Florida Model Task Force, Orlando presented by Frank Tabatabaee Abdul Pinjari Jeff Short (ATRI) Florida DOT University of South Florida (USF) American Transportation
Environmental issues caused by the increasing number of vehicles in Iraq
 Energy and Sustainability V 341 Environmental issues caused by the increasing number of vehicles in Iraq H. M. Jassim 1, F. H. Ibraheem 2 & B. F. A. Zangana 3 1 Geotechnical Engineering Department, Faculty
Proceedings of the Eastern Asia Society for Transportation Studies, Vol.8, 2011
 Modeling of Traffic-Induced NO 2 Concentration to Predict the Indoor Air Quality in Houses near Major Road Adyati Pradini YUDISON Research Assistant Air and Waste Management Research Group Faculty of Civil
Sand Mining and Transport: Potential Health Effects. Thomas M. Peters, PhD, CIH Associate Professor University of Iowa Iowa City, IA
 Sand Mining and Transport: Potential Health Effects Thomas M. Peters, PhD, CIH Associate Professor University of Iowa Iowa City, IA Midwest Environmental Health Policy Summit Feb 2014 Hydraulic Fracturing
Lecture 29 Air Pollution. Air Pollution. Clean Boundary Layer. Clean Boundary Layer
 Lecture 29 Air Pollution Air Pollution Conditions that promote air pollution episodes Ozone Hole Air Pollution Elevated levels of aerosols and harmful gases Most pollution enters atmosphere near the surface.
Appendix C2 Dispersion Modeling of Criteria Pollutants for the Southern California International Gateway Project (Tables and figures in Appendix C2
 Appendix C2 Dispersion Modeling of Criteria Pollutants for the Southern California International Gateway Project (Tables and figures in Appendix C2 (Dispersion Modeling of Criteria Pollutants) have all
Section 4 The Air We Breathe
 Section 4 The Air We Breathe Key Concept Air is an important natural resource that is affected by human activities. What You Will Learn Air pollution is caused by human activities, such as burning fossil
FOR Forest Measurement and Inventory Site Index Measurement David Larsen
 Site Index FOR 2542 - Forest Measurement and Inventory Site Index Measurement David Larsen Site index is a tool to determine the relative productivity of a particular site or location. Site index is the
Fuzzy Logic for Design of Air Quality Analyser
 uzzy Logic for Design of Air Quality Analyser uzzy Logic for Design of Air Quality Analyser Manjeet Chemistry Department, BRCM CET, Bahal, M.D University, Rohtak, Haryana, India, E-mail: manjeetvijay@rediffmail.com.