PRESSURIZED IRRIGATION SYSTEM MASTER PLAN. (HAL Project No.: )
|
|
|
- Bernard Lloyd
- 6 years ago
- Views:
Transcription


1 PRESSURIZED IRRIGATION SYSTEM MASTER PLAN (HAL Project No.: ) May 2012
2
3 TABLE OF CONTENTS TABLE OF CONTENTS... i LIST OF TABLES... ii LIST OF FIGURES... ii ACKNOWLEDGEMENTS... iii GLOSSARY OF TECHNICAL TERMS... iv ABBREVIATIONS... v CHAPTER I - INTRODUCTION... I-1 PURPOSE... I-1 SCOPE... I-1 BACKGROUND... I-1 PRESSURIZED IRRIGATION SYSTEM MASTER PLANNING APPROACH... I-1 KEY SYSTEM DESIGN CRITERIA AND PERFORMANCE FINDINGS... I-2 CHAPTER II - CONNECTIONS AND IRRIGATED ACRES... II-1 EXISTING SYSTEM... II-1 SYSTEM PROJECTED AT BUILD-OUT... II-1 CHAPTER III - SOURCEs... III-1 EXISTING SOURCES... III-1 EXISTING SOURCE REQUIREMENTS... III-3 Existing Peak Day Demand... III-3 Existing Average Yearly Demand... III-4 BUILD-OUT SOURCE REQUIREMENTS... III-5 Build-Out Peak Day Demand... III-5 Build-Out Average Yearly Demand... III-5 SOURCE RECOMMENDATIONS... III-6 CHAPTER IV - STORAGE... IV-1 EXISTING STORAGE... IV-1 EXISTING STORAGE REQUIREMENTS... IV-1 Equalization Storage... IV-1 Emergency Storage... IV-1 Operational Storage... IV-1 BUILD-OUT STORAGE REQUIREMENTS... IV-2 STORAGE RECOMMENDATIONS... IV-2 CHAPTER V - DISTRIBUTION SYSTEM... V-1 EXISTING DISTRIBUTION SYSTEM... V-1 EXISTING DISTRIBUTION SYSTEM REQUIREMENTS... V-1 Existing Peak Instantaneous Demand... V-1 BUILD-OUT DISTRIBUTION SYSTEM REQUIREMENTS... V-1 Build-Out Peak Instantaneous Demand... V-1 COMPUTER MODEL... V-1 MODEL COMPONENTS... V-2 Pipe Network... V-2 Demands... V-2 Sources and Storage Tanks... V-3 MODEL CALIBRATION... V-3 ANALYSIS METHODOLOGY... V-3 Spanish Fork City i Pressurized Irrigation System Master Plan
4 High Pressure Conditions... V-3 Peak Instantaneous Demand Conditions... V-4 CONTINUED USE OF THE COMPUTER PROGRAM... V-4 RESULTS... V-4 DISTRIBUTION SYSTEM RECOMMENDATIONS... V-4 CHAPTER VI CAPITAL IMPROVEMENTS PLAN... VI-1 PRECISION OF COST ESTIMATES... VI-1 SYSTEM IMPROVEMENT PROJECTS... VI-2 FUNDING OPTIONS... VI-4 General Obligation Bonds... VI-4 Revenue Bonds... VI-5 State/Federal Grants and Loans... VI-5 Impact Fees... VI-5 SUMMARY OF RECOMMENDATIONS... VI-8 REFERENCES APPENDICES APPENDIX A - Calculations and Assumptions APPENDIX B - Calibration Data APPENDIX C - Computer Model Output APPENDIX D - Cost Estimates LIST OF TABLES NO. TITLE PAGE I-1 Key System Design Criteria... I-2 I-2 Design Flow Summary... I-3 II-1 Existing ERCs and Irrigated Acres...II-1 II-2 Build-out ERCs and Irrigated Acres...II-2 III-1 Summary of Existing Sources...III-1 III-2 Summary of PI Water Rights and Shares...III-2 III-3 Existing Peak Day Source Requirements...III-4 III-4 Build-Out Peak Day Source Requirements...III-6 IV-1 Existing Storage Requirements... IV-2 IV-2 Build-Out Storage Requirements... IV-2 V-1 Proposed Future Growth Projects... V-5 VI-1 Capital improvement Projects... VI-2 VI-2 Percentage of Pipeline Cost Related to Growth... VI-6 VI-3 Impact Fee Related Projects... VI-7 LIST OF FIGURES NO. TITLE PAGE I-1 Existing PI System... After I-1 I-2 PI Pressure Zones... After I-1 III-1 Peak Day Diurnal Curve...III-3 III-2 Wind Zones... After III-4 III-3 Annual Pressurized Irrigation Water Use...III-5 V-1 Proposed Projects... After V-7 Spanish Fork City ii Pressurized Irrigation System Master Plan
5 ACKNOWLEDGMENTS Successful completion of this study was made possible by the cooperation and assistance of many individuals, including the Mayor of Spanish Fork, City Council Members, and City Staff personnel as shown below. We sincerely appreciate the cooperation and assistance provided by these individuals. Spanish Fork City Mayor G. Wayne Andersen City Council Rod Dart Richard Davis Steve Leifson Jens Nielson Keir Scoubes City Staff Chris Thompson, Public Works Director/City Engineer Trapper Burddick, Assistant City Engineer John Waters, Water Division Manager Bryan Grace, Utility Assistant Foreman Spanish Fork City iii Pressurized Irrigation System Master Plan
6 GLOSSARY OF TECHNICAL TERMS Average Daily Flow: The average yearly demand volume expressed in a flow rate. Average Yearly Demand: The volume of water used during an entire year. Build-out: The development density when it reaches a maximum allowed by planned development. Demand: Required water flow rate or volume. Distribution System: The network of pipes, valves, and appurtenances contained within a water system. Drinking Water: Water of sufficient quality for human consumption. Also referred to as Culinary or Potable water. Dynamic Pressure: The pressure exerted by water within the pipelines and other water system appurtenances when water is flowing through the system. Equivalent Residential Connection: A measure used in comparing water demand from nonresidential connections to residential connections. Head: A measure of the pressure in a distribution system that is exerted by the water. Head represents the height of the free water surface (or pressure reduction valve setting) above any point in the hydraulic system. Headloss: The amount of pressure lost in a distribution system under dynamic conditions due to the wall roughness and other physical characteristics of pipes in the system. Irrigated Acreage (Acres): The area of land, in acres, that is irrigated. Irrigation Water: Water used solely for outdoor watering. Not for human consumption. Peak Day: The day(s) of the year in which a maximum amount of water is used in a 24-hour period. Peak Day Demand: The average daily flow required to meet the needs imposed on a water system during the peak day(s) of the year. Peak Instantaneous Demand: The flow required to meet the needs imposed on a water system during maximum flow on a peak day. Pressure Reducing Valve (PRV): distribution system. A valve used to reduce excessive pressure in a water Pressure Zone: The area within a distribution system in which water pressure is maintained within specified limits. Service Area: Typically, this is the area within the boundaries of the entity or entities, which participate in the ownership, planning, design, construction, operation and maintenance of a water system. Spanish Fork City iv Pressurized Irrigation System Master Plan
7 Static Pressure: The pressure exerted by water within the pipelines and other water system appurtenances when water is not flowing through the system, i.e., during periods of little or no water use. Storage Reservoir: A facility used to store, contain and protect water until it is needed by the customers of a water system. This is also referred to as a Storage Tank. Transmission Pipeline: A pipeline that transfers water from a source to a reservoir or from a reservoir to a distribution system. Water Conservation: Planned management of water to prevent waste. ABBREVIATIONS ac-ft cfs DDW E ERC GIS gpd gpd/conn gpm HAL N MG PI PRV psi S SCADA W acre-feet cubic feet per second (ft 3 /s) The State of Utah Division of Drinking Water East Equivalent Residential Connection Geographic Information System Gallons per Day Gallons per Day per Connection Gallons per Minute Hansen, Allen & Luce, Inc. North Million Gallons Pressurized Irrigation Pressure Reducing Valve Pounds per Square Inch South Supervisory Control And Data Acquisition West Spanish Fork City v Pressurized Irrigation System Master Plan
8 CHAPTER I INTRODUCTION PURPOSE The purpose of this master plan is to provide specific direction to Spanish Fork City for decisions that will be made over the next 5 to 10 years to help the City provide adequate irrigation water to customers at the most reasonable cost. The recommendations herein are based on conclusions that were reached by analyzing existing demand data, growth projections for the City, and a computer model of the City s pressurized irrigation distribution network. SCOPE This master plan includes a study of the City s pressurized irrigation system and customer water usage with the following sections: connections and irrigated acres, source requirements, storage requirements, and distribution system requirements. Based on study findings, an implementation plan with recommended improvements has been prepared. The implementation plan includes conceptual-level cost estimates for the recommended improvements. The conclusions and recommendations included in this report are limited by the accuracy of development projections and other assumptions. It is expected that the City will review and update this master plan as needed. BACKGROUND Spanish Fork City is located in central Utah in the south central portion of Utah County. The City is bordered by Utah Lake to the northwest and the Wasatch Mountains to the southeast. The City varies in elevation above mean sea level from about 4500 feet in the northwest to 5200 feet in the southeast foothills and covers an area of about 15.4 square miles. Spanish Fork City is growing rapidly with a population of 34,691 as of the 2010 Census. Between 2000 and 2010 the population of Spanish Fork increased just over 71%. During that period, Spanish Fork City was tied with South Jordan City as the second fastest growing cities in Utah. Spanish Fork City provides irrigation water to residents of the City via a pressurized irrigation distribution network as shown in Figure I-1. The pressurized irrigation (PI) service reduces demand on the public drinking water system, and greatly reduces the peak summer demands when irrigation usage is highest. The PI system is comprised of two pressure zones as seen in Figure I-2. The upper zone is supplied by nine sources, four of which provide water solely to the upper zone while the remaining five supply both upper and lower zones. In addition to the five shared sources, the lower zone also has two wells as exclusive sources. The elevation head of the upper zone ranges between 4,770 and 4,640 feet above mean sea level, and the lower zone ranges between 4,640 and 4,500 feet above mean sea level. The total length of pipes within the Spanish Fork PI system sums to approximately 120 miles with pipe sizes ranging from 2 to 36 inches in diameter. PRESSURIZED IRRIGATION SYSTEM MASTER PLANNING APPROACH Distribution networks are made up of a variety of components including pumps, storage facilities, valves, and pipes. The Spanish Fork PI system must be capable of responding to daily and seasonal variations in demand while suppressing wide variations in pressure. In order Spanish Fork City I-1 Pressurized Irrigation System Master Plan
 W Cemetery Well 2 ST Cemetery Well 1 US W Ensign Bickford Well X PRVs < 4 inches W Well or Springs 4 inch Booster Station 6 inch a Reservoir W 8000 S Golf Course Booster Station")

9 ST ST AT E SPANISH FORK CITY PI MASTER PLAN FIGURE I-1 Ed Clark Well MAIN ST E PR X E HWY N W 100 S 51 Y EXISTING PI SYSTEM X X East Booster Station YON RD RO AR W TR Canyon Road Well (2550 East) W Cemetery Well 2 ST Cemetery Well 1 US W Ensign Bickford Well X PRVs < 4 inches W Well or Springs 4 inch Booster Station 6 inch a Reservoir W 8000 S Golf Course Booster Station a Miles Pipe Sizes 6 Canyon Elementary Well (1700 East) 1 Legend 9 CAN Shop Well AD HE 0.5 W W X L AI US W ³ 6400 S X X 1550 W I S 900 S LN X CENTER ST Memorial Well AY W S S HW W City Boundary 8 inch 10 inch 12 inch W PI Booster Station & PRV 14 inch Darger Spring 16 inch Golf Course Reservoir inch HW Y 30 inch 36 inch PI Reservoir POWERHOUSE RD a Malcomb Springs W

10 SPANISH FORK CITY PI MASTER PLAN FIGURE I-2 LOWER ZONE PI PRESSURE ZONES ³ Miles Legend Spanish Fork City Boundary Spanish Fork Policy Declaration Boundary UPPER ZONE
11 to meet these goals, each of the distribution system components must be designed and operated properly. Furthermore, careful planning is required in order to ensure that the distribution system is capable of meeting the City's needs over the next several decades. Both present and future needs were evaluated in this master plan. System demands were evaluated by considering historical PI system demands for Future water needs were estimated by identifying locations where development is expected and adding the incremental increase in water demand associated with the development to the current demand. The build-out water demand was estimated by applying this process throughout City. In order to facilitate the analysis of Spanish Fork s PI system, a computer model of the system was prepared and analyzed in two parts. First, the performance of existing facilities with present demands was analyzed. Next, projected future demands were added and the analysis was repeated. Recommendations for system improvement were prepared based on the results of these analyses. KEY SYSTEM DESIGN CRITERIA AND PERFORMANCE FINDINGS Summaries of the key PI system design criteria and performance findings for the Spanish Fork City PI system are included in Table I-1. The design criteria were used in evaluating system performance and in recommending future PI system improvements. Table I-2 presents the design flows analyzed in the pressurized irrigation water model. TABLE I-1 KEY SYSTEM DESIGN CRITERIA CONNECTIONS ERCs IRRIGATED ACREAGE Per ERC Total SOURCE Peak Day Demand Average Yearly Demand STORAGE Equalization Emergency Operational Total DISTRIBUTION Peak Instantaneous Max Operating Pressure Min. Operating Pressure CRITERIA Billing Records Calculated Aerial Imagery & Meter Data Based on measured flow Based on measured flow 1/4 Peak Day Volume 1/3 Peak Day Volume Based on measured flow City Preference City Preference 2010 EXISTING CRITERIA 8,141 9, ac 1,477 ac 8,861 gpm 5,907 ac-ft 10 ac-ft 13 ac-ft 20 ac-ft 43 ac-ft 14,768 gpm 125 psi 50 psi ESTIMATED BUILD-OUT CRITERIA 18,013 21, ac 3,261 ac 19,605 gpm 13,070 ac-ft 22 ac-ft 29 ac-ft 40 ac-ft 91 ac-ft 32,675 gpm 125 psi 50 psi Spanish Fork City I-2 Pressurized Irrigation System Master Plan
12 TABLE I-2 DESIGN FLOW SUMMARY DEMAND DEMAND PER ERC DEMAND PER IRR. ACRE TOTAL EXISTING DEMAND TOTAL BUILD- OUT DEMAND FLOW RATIO Average Day gpm 5.0 gpm 7,384 gpm 16,338 gpm 1.00 Peak Day 0.90 gpm 6.0 gpm 8,861 gpm 19,605 gpm 1.20 Peak Instantaneous 1.50 gpm 10.0 gpm 14,768 gpm 32,675 gpm Based on annual demand assuming a 6 month growing season Spanish Fork City I-3 Pressurized Irrigation System Master Plan
13 CHAPTER II CONNECTIONS AND IRRIGATED ACRES EXISTING SYSTEM According to billing records obtained for 2008 through 2010, the Spanish Fork PI system includes a total of 8,141 connections. An Equivalent Residential Connection (ERC) is a measure used in comparing demand from residential connections to demand from nonresidential connections. By definition, each residential connection represents 1 ERC. The number of ERCs associated with non-residential connections is determined by reviewing the non-residential demand and determining the corresponding number of residential connections that would be required to produce an equivalent demand. A review of billing data for residential lots indicated that the average residential demand within the pressurized irrigation system was 0.75 gpm per connection. Therefore, 1 ERC contributes 0.75 gpm of demand. By dividing the average 2010 demand of 7,384 gpm by the average per ERC demand, the total number of ERCs was determined to be 9,845. Aerial imagery of Spanish Fork was then reviewed in order to determine the irrigated acreage contributed by the average residential lot. Based on this review, a value of 0.15 acres per residential lot was determined to represent the average irrigated acreage. The total irrigated acreage for the city was then found by multiplying 0.15 by the total number of ERCs. Table II-1 provides a per zone summary of the existing ERCs and irrigated acres in Spanish Fork. TABLE II-1 EXISTING ERCS AND IRRIGATED ACRES PRESSURE ZONE SYSTEM PROJECTED AT BUILD-OUT ERCs Irrigated Acres Upper Zone 5, Lower Zone 3, TOTAL 9,845 1,477 In order to plan for the future irrigation needs of Spanish Fork City, build-out ERCs and irrigated acres were also determined. The primary assumption employed in determining the build-out ERCs and irrigated acres was that the existing ratio of irrigated acreage to developed acreage would remain constant while development proceeds in Spanish Fork. This ratio was applied over the Policy Declaration Boundary of Spanish Fork City. In addition, it was also assumed that the ratio of irrigated acreage to ERCs would also remain constant at 0.15 irrigated acres per ERC. Table II-2 provides a per zone summary build-out ERCs and irrigated acres. Spanish Fork City II-1 Pressurized Irrigation System Master Plan
14 TABLE II-2 BUILD-OUT ERCS AND IRRIGATED ACRES PRESSURE ZONE ERC Irrigated Acres Upper Zone 14,110 2,117 Lower Zone 7,673 1,151 TOTAL 21,783 3,268 Spanish Fork City II-2 Pressurized Irrigation System Master Plan
15 CHAPTER III SOURCES EXISTING SOURCES Spanish Fork utilizes multiple water sources to supply water to its PI system. Table III-1 is a summary of the sources used within Spanish Forks PI system. TABLE III-1 SUMMARY OF EXISTING SOURCES SOURCE TYPE 1 CAPACITY PHYSICAL (gpm) ZONE 2550 East Well Dual 1,000 Upper 1700 East Well Dual 1,700 Upper Cold Springs Dual 4,000 Upper Cemetery Well #2 PI 1,000 Upper Darger Springs PI 1,000 Upper Ed Clark Well PI 225 Lower Memorial Well PI 1,000 Lower Shop (Fairgrounds) Well PI 1,300 Lower Ensign-Bickford Wells PI 500 Upper 2550 East Booster PI 250 Upper Golf Course Pond Booster PI 4,000 Upper Total 15, PI indicates the source is used solely in the PI system, dual indicates a source that has been approved as a drinking water source but may be also be used in the PI system. A summary of water rights and shares associated with PI sources is shown in Table III-2. The City s water rights and water shares far exceed the City s current ability to receive the water through existing sources. It is recommended that the City continue to monitor and perfect water rights and shares. It is recommended that the City also continue to develop sources as more sources are needed. Spanish Fork City III-1 Pressurized Irrigation System Master Plan
16 TABLE III-2 SUMMARY OF PI WATER RIGHTS AND SHARES SOURCE VOLUME (ac-ft) STATUS Wells Water Right a , Water Right Proof Due 2014 Water Right Water Right Water Right Water Right ,421 East Bench Canal Company West Field Canal Company 1, Strawberry 1 2,420 Water Right Proof Due 2014 Certificated Water Right Certificated Water Right Certificated Water Right City Owned Company Shares City Owned Company Shares City Owned Company Shares POINTS OF DIVERSION Cemetery Well #1, Cemetery Well #2, 2550 East Well, 1700 East Well, Memorial Well, Canyon View Park Well, Shop Well Cold Springs, Darger Springs Cemetery Well #2 Cold Springs Cold Springs East Bench Canal and Cold Springs West Field and Cold Springs Spanish Fork River, Canals, and Cold Springs SUVMWA (CUP) 2 7,820 Contracted Currently not available SUVMWA (Jordan Canal) 113 Contracted Currently not available 1. Includes Strawberry Project water through East Bench, Westfield and South WDA. 2. South Utah Valley Municipal Water Association (SUVMWA) 1998 and 2003 contract for Central Utah Project (CUP) water allotment. The 2003 contract has been reduced by 1,000 ac-ft in exchange for a grant to help pay for the pressurized irrigation system. 3. Dual sources that may be used in the PI system as well as the drinking water system. Currently, the Central Utah Project (CUP) water is anticipated to be more expensive than the other potential sources. It is therefore recommended that the other sources of water be developed first. As part of the CUP, a pipeline is planned to convey water south from the existing 96-inch CUP pipeline in Spanish Fork Canyon. The City has conveyance agreements through the South Utah Valley Municipal Water Association (SUVMWA) to convey irrigation shares or Strawberry Project water through this pipeline at a very reasonable cost. This pipeline will cross the City s existing 36-inch main PI transmission line at a pressure higher than the Spanish Oaks Reservoir. It is therefore recommended that the City politically promote the CUP Project so the City can benefit from the pipeline. It is recommended that the City continue to exact water rights and shares as land in Spanish Fork City is developed. However, the City should avoid accepting water rights that are not for current use in the Policy Declaration Boundary or in current sources. Irrigation companies that have service areas within the Policy Declaration Boundary include the Highline Division, Spanish Fork East Bench Irrigation, Spanish Fork South Irrigation Co., Spanish Fork Southeast Irrigation Co., Spanish Fork West Field Irrigation Co., and Springville Irrigation District. The irrigation companies and their service areas can be seen in Appendix A on the map Ditches & Irrigation Companies. Spanish Fork City III-2 Pressurized Irrigation System Master Plan
17 EXISTING SOURCE REQUIREMENTS The PI network water sources must be able to meet the expected water demand for two conditions: peak day demand and average yearly demand. Each of these criteria will be addressed in the following paragraphs. Existing Peak Day Demand Peak day demand is the water demand on the day of the year with the highest water use and is used to determine the required daily source capacity under existing and build-out conditions. The two primary descriptors in characterizing peak day demand are the diurnal demand curve and average peak day demand. A diurnal demand curve was calculated using SCADA data. The peak day diurnal curve, in non-dimensional form, is shown in Figure III-1 and was obtained by dividing the instantaneous flow values by the daily average flow Peak Factor :00 AM 8:00 AM 12:00 PM 4:00 PM 8:00 PM 12:00 AM FIGURE III-1: PEAK DAY DIURNAL CURVE With this demand curve, the primary peak takes place in the evening at about 10:00 PM with trailing subsequent peaks throughout the rest of the night. Minimum demand occurs during the day between 8:00 AM and 7:00 PM. In general, water use is higher throughout the night than at mid-day. This demand pattern results from the use of automatic sprinklers to irrigate at night. Spanish Fork City III-3 Pressurized Irrigation System Master Plan
18 Much of the City irrigates during the night because the State has educated the public to irrigate at night to reduce evaporation. However, it is recommended that certain parts of the City in the wind zone irrigate between 9:30 AM and 9:30 PM due to diurnal winds contributing significantly to evaporation. Sunlight and temperatures during the day do not contribute as much to evaporation as nightly winds in these areas. The wind zone can be seen on Figure III-2. Billing records and State Standards were considered in order to evaluate the City s existing peak day demand. Billing records provide a monthly record of demands. Between 2008 and 2010 the average demand during the month of July was about 7,384 gpm. Based on prior observations of demand patterns for various Utah cities, it is estimated that the peak day demand for Spanish Fork is about 20% higher than the City s peak monthly average demand. This assumption provides a peak day demand of about 8,861 gpm. The peak day demand per irrigated acre is determined by dividing the per ERC demand (0.9 gpm/erc) by the irrigated acreage per ERC (0.15 acres/erc) giving a value of 6 gpm per irrigated acre. In comparison, state standards stipulate an outdoor water demand of 3.96 gpm per irrigated acre. Although higher than state standards, the calculated demands are well supported by the available data. Moreover, unlike most PI systems, Spanish Fork meters the usage at each connection. In the experience of HAL, the per acre irrigation demand for the Spanish Fork PI system is lower than several other cities located along the Wasatch Front that have unmetered PI systems. It is believed that metering plays a central role in the relatively lower demands. Existing source requirements and capacities for each pressure zone are summarized in Table III-3. The ERCs and Zone Demand (gpm) columns are, respectively, the number of ERCs and the source demand in each pressure zone, both as outlined previously. Of the total pressurized irrigation demand, 5,370 gpm, and 3,491 gpm are required individually for the Upper and Lower pressure zones, respectively. TABLE III-3 EXISTING PEAK DAY SOURCE REQUIREMENTS ZONE ERC 1 DEMAND PEAK DAY (gpm) AVERAGE YEARLY DEMAND 2 (ac-ft/year) UPPER 5,967 5,370 3,580 LOWER 3, ,327 TOTAL 9,845 8,861 5, ERCs were calculated as noted previously. 2. The demands are based on billing data for 2008 through Existing Average Yearly Demand Water utilities must be able to supply the average yearly demand. Average yearly demand is the average volume of water used over the course of one year. For Spanish Fork, the irrigation season is assumed to extend from April 15 to October 15. However, the actual beginning and ending of the season varies based on year-to-year temperature and precipitation variations. Spanish Fork City s existing yearly demand was evaluated by reviewing historic water use. Figure III-3 illustrates the City s annual water use between 2008 and Spanish Fork City III-4 Pressurized Irrigation System Master Plan
19 Legend Wind Zone Spanish Fork Policy Declaration Boundary Wind Direction and Velocity SPANISH FORK CITY PI MASTER PLAN FIGURE III-2 WIND ZONES ³ Miles
20 Annual Volume (ac-ft) Year FIGURE III-3: ANNUAL PRESSURIZED IRRIGATION WATER USE Water use for that period ranged from 3,693 ac-ft to just over 4,122 ac-ft. In comparison, the average day demand per irrigated acre has been previously defined as 5 gpm per irrigated acre (see Table I-2). This average day value is based on July demands obtained from billing data. Assuming this demand will be exercised continuously over a 6 month period gives a volume of 4 ac-ft per irrigated acre, which corresponds to a total volume of 5,907 ac-ft. While higher than the historical observed irrigation demands, this is the annual demand that could be exerted in the case of an early dry spring followed by little rain during the summer months. Furthermore, the duty assigned by the State Engineer to irrigated land in Spanish Fork is 4 ac-ft per acre. Based on these considerations it is recommended that Spanish Fork should secure adequate rights to provide an annual volume of 5,907 ac-ft. Average yearly demand recommendations are provided in Table III-3 BUILD-OUT SOURCE REQUIREMENTS As with existing water source requirements, future water source needs were evaluated on the basis of peak day demand and average yearly demand. Build-out demand requirements were calculated in similar manner to the existing demands, but used the build-out ERC projections. Build-Out Peak Day Demand Based on the projected build-out ERCs, the projected peak day demand at build-out was calculated to be 19,605 gpm with the per zone demand as detailed in Table III-4. Build-Out Average Yearly Demand Based on the projected build-out ERCs, the projected annual demand at build-out was calculated to be 13,070 ac-ft with the per zone demand as detailed in Table III-4. Spanish Fork City III-5 Pressurized Irrigation System Master Plan
21 TABLE III-4 BUILD-OUT PEAK DAY SOURCE REQUIREMENTS ZONE ERC 1 DEMAND PEAK DAY (gpm) AVERAGE YEARLY DEMAND (ac-ft/year) UPPER 14,110 12,699 8,466 LOWER 7,673 6,906 4,604 TOTAL 21,783 19,605 13, ERCs were calculated as noted previously. There are three potential source options that are recommended the City pursue as more source is needed. The first, which has already been mentioned, is to add a connection from a new proposed CUP pipeline that will cross the City s existing 36-inch transmission line. The second recommended potential source is a 4,000 gpm booster station at 2550 East tank and well site. A booster station with Variable Speed Drive (VFD) could deliver irrigation share water and Cold Springs water out of the storage tank. The third recommended potential addition source of water for the future PI system is a VFD pump station that boosts water out of the Golf Course Pond. This would allow the Golf Course Pond to be used as equalization storage and add capacity to pump irrigation share water into the PI system as more becomes available. The City has access to water rights and shares for sole use in the PI system that total 12,550 ac-ft/year. This nearly meets the build-out average yearly demand of 13,070 ac-ft/year. With the dual source s water rights and shares included, the rights and shares exceed the build-out average yearly demand. However, nearly meeting the future demand with the PI water rights and shares does not provide any redundancy in case of source failures, requirements in the drinking water system, and fluctuation of source flows. Most of the water rights and shares are controlled by the River Commissioner based on flows in the Spanish Fork River. The water rights and shares are the highest amount of water possible in a good water year. In a poor water year the amount of available water can be much less, with no water available for some water rights. Therefore, continued management and exaction of water rights and shares is recommended as future demands and redundancy require. SOURCE RECOMMENDATIONS The following is a list of recommendation presented in this chapter. It is recommended that redundancy be incorporated into the pressurized irrigation system so that the pressurized irrigation system is able to meet all of the demand objectives with a major source unavailable. It is recommended that the City continue to exact water rights and shares as land in Spanish Fork City is developed. However, the City should avoid accepting water rights that are not for current use in the Policy Declaration Boundary or in current sources. Irrigation companies that have service areas within the Policy Declaration Boundary include the Highline Division, Spanish Fork East Bench Irrigation, Spanish Fork South Irrigation Co., Spanish Fork Southeast Irrigation Co., Spanish Fork West Field Irrigation Spanish Fork City III-6 Pressurized Irrigation System Master Plan
22 Co., and Springville Irrigation District. The irrigation companies and their service areas can be seen in Appendix A on the map Ditches & Irrigation Companies. It is recommended that the City exact that amount of water the new development will use to irrigate. This master plan assumes that 4.0 acre-feet is needed per irrigated acre. It was determined that the average irrigated acreage per ERC is 0.15 acres which produces a yearly demand requirement of 0.6 acre-feet per ERC. It is recommended that for nonresidential development the City calculate the amount of water required by multiplying the irrigated acreage by 4.0 acre-feet. The City s water rights and water shares far exceed the City s current ability to receive the water through existing sources. It is recommended that the City continue to monitor and perfect water rights and shares. It is recommended that the City also continue to develop sources as more sources are needed. Currently, the Central Utah Project (CUP) water is anticipated to be at a much higher cost than the other potential sources. It is therefore recommended that the other sources of water be developed first. It is recommended that the City promote the need for a CUP pipeline that is planned to convey water south from the existing 96-inch CUP pipeline so that the City can convey irrigation shares and Strawberry Project water at a high pressure directly to the Spanish Oaks reservoir. It is recommended that the City add a 4,000 gpm pump station with Variable Speed Drive (VFD) at the 2550 East Tank and well site to deliver irrigation share water and Cold Springs water out of the storage tank. It is recommended that the City add a 4,000 to 6,000 gpm pump station with Variable Speed Drive (VFD) at the Golf Course Pond to deliver additional irrigation share water out of the pond. Spanish Fork City III-7 Pressurized Irrigation System Master Plan
23 CHAPTER IV STORAGE EXISTING STORAGE The City s existing pressurized irrigation system includes two open air storage facilities, both located to the south of the City. The larger of the two, Spanish Oaks Reservoir, is at an elevation of 5180 feet and has a capacity of approximately 77 ac-ft while the smaller, Golf Course Pond, is at an elevation of 4670 feet and has a capacity of approximately 24 ac-ft. The locations of the storage facilities are shown on Figure I-1. Spanish Oaks Reservoir is located sufficiently high to allow gravity flow to either of the two PI pressure zones. The Golf Couse Pond is used to receive canal water which is then pumped to the Spanish Oaks Reservoir. EXISTING STORAGE REQUIREMENTS Storage tanks within the PI system are used to provide: 1) equalization storage volume to make up the difference between the peak day flow rate and the peak instantaneous demand; 2) emergency storage; and 3) operational storage to receive irrigation water when available and facilitate efficient pump operation. Existing storage requirements for the Spanish Fork PI system are addressed within the following sections. Equalization Storage The need for equalization storage is highest during the irrigation season on days of peak water use. Accordingly, the required equalization storage was evaluated by analyzing the volume of water used under peak day conditions based on the diurnal curve and peak instantaneous demand for Spanish Fork City. Based on the available data, a storage requirement of 25% of the peak day demand volume is recommended. This corresponds to a total volume of 9.8 ac-ft (3.2 MG). As the Golf Course Pond must be pumped to provide water, Spanish Oaks Reservoir currently supplies all of the equalization storage for the PI system. Emergency Storage Emergency storage is intended to provide a safety factor that can be used in the case of unexpectedly high demands, pipeline failures, equipment failures, electrical power outages, water supply contamination, or natural disasters. While the reliability of a PI system is often deemed to be less critical as compared to a drinking water system, the City has ample storage within their PI system. Therefore, it is suggested that Spanish Fork reserve an emergency storage volume equal to 1/3 of the equalization storage volume. As before, the Golf Course Pond cannot be considered to supply emergency storage because of the pumping requirement. Operational Storage Spanish Fork City owns irrigation shares that vary in availability according to delivery schedules. Operational storage allows Spanish Fork to receive irrigation water when available, and store the water for later use. The primary function of Golf Course Pond is to receive and temporarily store surface water prior to pumping the water up to Spanish Oaks Reservoir. The buffering capacity provided by Golf Course Pond also allows efficient operation of the Golf Course Pond pumps. In addition to Golf Course Pond, the water in Spanish Oaks Reservoir beyond that necessary for providing equalization and emergency storage also contributes to the City s Spanish Fork City IV-1 Pressurized Irrigation System Master Plan
24 operational storage. A summary of existing storage requirements by reservoir is included in Table IV-1. ZONE TABLE IV-1 EXISTING STORAGE REQUIREMENTS EQUALIZATION (ac-ft) 1 EMERGENCY (ac-ft) 2 OPERATIONAL (ac-ft) TOTAL (ac-ft) EXISTING (ac-ft) Spanish Oaks Reservoir Golf Course Pond TOTAL % of the peak day volume. 2. 1/3 of the peak day volume. BUILD-OUT STORAGE REQUIREMENTS The storage volumes required at build-out are based on the same equalization, emergency, and operational requirements as calculated for the existing conditions but have been updated to reflect build-out demands. The City s build-out storage requirements are presented in Table IV- 2. ZONE TABLE IV-2 BUILD-OUT STORAGE REQUIREMENTS EQUALIZATION (ac-ft) 1 EMERGENCY (ac-ft) 2 OPERATIONAL (ac-ft) TOTAL (ac-ft) EXISTING (ac-ft) Spanish Oaks Reservoir Golf Course Pond TOTAL % of the peak day volume. 2. 1/3 of the peak day volume. STORAGE RECOMMENDATIONS Currently Spanish Fork City has approximately 100 ac-ft of storage which should be enough storage for build-out. It is recommended that the storage situation be reviewed regularly to anticipate any storage issues arise as the City develops. It is recommended that the City add a 2,000 to 6,000 gpm pump station with VFD at the Golf Course Pond to not only deliver additional irrigation share water out of the pond but to also allow the use of the Golf Course Pond as equalization storage. Spanish Fork City IV-2 Pressurized Irrigation System Master Plan
25 EXISTING DISTRIBUTION SYSTEM CHAPTER V DISTRIBUTION SYSTEM The distribution system consists of all pipelines, valves, fittings, and other appurtenances used to convey water from the water sources and storage tanks to the water users. The existing PI system contains over 120 miles of distribution pipe ranging in size from 2 to 36 inches in diameter. Two pressure zones exist in the system. The existing distribution system is shown in Figure I-1. EXISTING DISTRIBUTION SYSTEM REQUIREMENTS The City prefers that the PI distribution system maintain pressures between 50 and 125 psi at all points in the system under normal operating conditions, including Peak Instantaneous, Peak Day, and Average Day. Existing Peak Instantaneous Demand Peak instantaneous demand is the highest demand on the peak day. The pipes in the distribution system must be large enough to convey the peak instantaneous demand while maintaining a pressure at connections between 50 and 125 psi. The peaking factor from the peak day flow to peak instantaneous flow was selected to be 1.7. Data from the SCADA system showed values that were less than 1.5, but 1.7 was selected to add a safety factor. Applying this peaking factor of 1.7 to the peak day demand gives a total existing peak instantaneous demand of 14,768 gpm. BUILD-OUT DISTRIBUTION SYSTEM REQUIREMENTS The existing system requirements apply to the projected build-out system. Build-Out Peak Instantaneous Demand Assuming the same peaking factor of 1.7 applies to the build-out peak day demand gives a build-out peak instantaneous demand of 32,675 gpm. COMPUTER MODEL A computer model of the City s PI system was developed to analyze the performance of the existing and future distribution system. The software used for the model was EPANET 2.0. EPANET 2.0 is a computer program that models the hydraulic behavior of piping networks. The pipe, tank, well and valve data used to develop the model were obtained from GIS data of the City s PI system and other updated information supplied by the City. Computer models were developed for three phases of water system development. The first phase was the development of a model of the existing system (existing model). This model was used to calibrate the model and identify deficiencies in the existing system. A second model was developed which was used to identify those corrections necessary to improve existing system deficiencies (corrected existing model). The third phase was the development of a future model to indicate those improvements that will be necessary for the projected build-out condition (future model). Spanish Fork City V-1 Pressurized Irrigation System Master Plan
26 MODEL COMPONENTS The two basic elements of the computer model are pipes and nodes. A pipe is described by its inside diameter, overall length, minor friction loss factors, and a roughness value associated with friction head losses. A pipe can include elbows, bends, valves, pumps, and other operational elements. Nodes are the end points of a pipe and they can be categorized as junction nodes or boundary nodes. A junction node is a point where two or more pipes meet, where a change in pipe diameter occurs, or where flow is put in or taken out of the system. A boundary node is a point where the hydraulic grade is known (a reservoir or PRV). The computer model of the PI distribution system is not an exact replica of the actual PI system. Pipeline locations used in the model are approximate and every pipeline may not be included in the model, although efforts were made to make the model as complete and accurate as possible. It is not necessary to include all of the distribution system pipes in the model to accurately simulate its performance. Pipe Network As indicated previously, the pipe network layout was based upon the City s GIS inventory. The computer model of the PI distribution system is not an exact replica of the actual water system, although efforts were made to make the model as complete and accurate as possible. Pipeline locations used in the model are from the City s GIS inventory. Service laterals were not included in the model and the locations of general valves are not represented in the model. Every other pipeline that was included in the GIS inventory was included. Demands Water demands were input into the PI system model by flow in gallons per minute. Water demands were located in the model based on billing data and billing address. The average yearly demand was determined for each billing address, and then the billing addresses were geocoded in order to link the demands to a physical location. Using GIS, the geocoded demands in gallons per minute were then assigned to the closest model demand node. Future demand was assigned to nodes in the future model which best represented the location of the anticipated demand by ERC. The billed average day demands assigned to the demand nodes were then multiplied by a peaking factor that increased the total demand to the average peak day demand calculated (8,861 gpm). The pattern of how the demand changes over a 24 hour period is referred to as a diurnal or daily demand curve. The diurnal curve for peak day was developed using the SCADA system and modified to represent a more aggressive peak day with a peak instantaneous 1.7 times the peak day average. The peak day diurnal curve is presented in Figure III-1. The diurnal curves are used by the model to change the demand at each demand node for each time period to simulate how demand changes in the water system throughout the day. In summary, the billing data was used for accurate demand distribution, production data was used for demand volume, and data from the SCADA system was used to define how the demand varies throughout the day. Spanish Fork City V-2 Pressurized Irrigation System Master Plan
27 Sources and Storage Tanks The sources of water in the model are the wells and springs. Wells are represented with a reservoir to represent the ground water, a pump with a pump curve, and a pipe representing the pump column to the surface. Reservoir location and volume are represented in the model. The extended period model predicts the levels in the reservoirs as they fill from sources and as they empty to meet demand in the system. MODEL CALIBRATION A water system computer model should be calibrated before it may be relied on to accurately simulate the performance of the distribution system. Calibration is a comparison of the computer results, field tests, and actual system performance. Field tests are accomplished by performing flow tests and pressure tests on the system. When the computer model does not match the field tests within an acceptable level of accuracy, the computer model is adjusted to match field conditions. The extended period model was run for several days with the demand curve repeating every 24 hours in order for the model to be compared to how the actual system performs. Key indicators of the model performing correctly are the reservoirs filling and emptying in consistent and similar patterns without running empty, and pumps turning on and off at similar times. The model was calibrated successfully with the use of pressure tests and system performance information from the SCADA system. Calibration data is found in Appendix B. It is recommended that City staff continue to conduct tests on an ongoing basis and review SCADA information to refine the model calibration as system conditions change. ANALYSIS METHODOLOGY The extended period EPANET 2.0 model was used to analyze the performance of the water system with current and projected future demands. An extended period model is actually a static model run many times, once for each time step. Like a movie is made up of individual pictures put together in a time series, the results of the extended period model can be viewed over time to watch how the system responds to changes in demand. The extended period model was used to analyze the worst case conditions in the system, analyze system controls and operation, analyze performance of the system over time, analyze system recommendations, analyze the water system for system optimization recommendations, and analyze the system for water quality. System recommendations for existing conditions and future conditions at build-out were checked with the extended period model to confirm adequacy. Two extreme operating conditions were analyzed with the model, high pressure conditions, and peak instantaneous conditions. Each of these conditions is a worst-case situation so the performance of the distribution system may be analyzed for compliance with Spanish Fork City s requirements. Each operating condition is discussed in more detail below. High Pressure Conditions Low flow or static conditions are usually the worst case for high pressures in a PI distribution system. A condition similar to static condition that can also cause high pressures in the City s PI system occurs when demand is low and pumps are on to fill storage tanks. During times of low demand, the pumps increase the pressure in the system high enough to reverse the flow Spanish Fork City V-3 Pressurized Irrigation System Master Plan
28 coming from the tanks. The highest pressures are reached when pumps are on, tanks are almost full, and demand is low. Both of these high pressure conditions were simulated with the model. The City would prefer that maximum pressures be kept below 125 psi. Peak Instantaneous Demand Conditions Peak Instantaneous demand conditions can sometimes be the worst-case scenario for low pressures throughout a PI distribution system. The PI system reaches peak instantaneous demand conditions during the hottest days of the summer when both indoor and outdoor water use is the highest. The high demand creates high velocities in the distributions pipes which reduces pressure. Usually, minimum pressures of 30 psi at peak instantaneous demand are too low for customer satisfaction; hence, the City prefers a minimum pressure of 50 psi under this condition. CONTINUED USE OF THE COMPUTER PROGRAM It is recommended that the City continue updating the model as the PI system changes. Below is a list of ways in which the model could help the City with PI system management. The computer model can assist City staff in determining: Effect of new development on the system Efficient system operation Effect on the system if individual system facilities are added or taken out of service Selection of pipe diameters and location of proposed PI mains The computer model should be maintained for future use. Necessary data required for continued use of the program are: RESULTS The location, length, diameter, pipe material, and ground elevation at each end of each new pipeline constructed Changes in PI supply location and characteristics Location and demand for new connections Generally speaking, the computer model showed that the distribution system performs quite well in both existing and future scenarios. The model output primarily consists of the computed pressures at nodes and flow rates through pipes. The model also provides additional data related to pipeline flow velocity and head loss to help evaluate the performance of the various components of the distribution system. Results from the model are available on a CD in Appendix C. Due to the large number of pipes and nodes in the model, it is impractical to prepare a figure which illustrates pipe numbers and node numbers. The reader should refer to the CD to review model output. Recommendations for future pipelines, PRVs are given below under Distribution System Recommendations. DISTRIBUTION SYSTEM RECOMMENDATIONS All of the distribution system recommendations are pipeline projects to provide capacity for projected future growth. No existing issues were identified in the existing model. Projects to Spanish Fork City V-4 Pressurized Irrigation System Master Plan
29 support City expansion are listed in Table V-1 in no particular order. Conceptual level costs for the proposed projects are presented in Chapter VI. The proposed projects can be seen on Figure V-1. TABLE V-1 PROPOSED FUTURE GROWTH PROJECTS MAP ID LOCATION From 2770 E and River Bottoms Road to Volunteer Drive and Main Street From 2300 S and 1100 E to 1400 E and 1870 S Arrowhead Trail Street between 1900 S and 1030 S on Main Street W between 900 N and 1900 N N between Main Street and 600 W 1600 N from Main Street to 200 E and 200 E from 1600 N to 2100 N 1800 N between 200 E and Chappel Drive Chappel Drive from 1800 N to 1200 N and to 1000 N and 500 E Kirby Lane from Chappel Drive to 450 E and then to 1800 N 600 W between 3100 N and State Road 77 Highway 77 between 550 W and 2050 W W between 3800 N and 2400 N N between 300 W and 1120 W 14 Canyon Crest Road between 2300 E and 2600 E S between 1050 W and 1850 W S between Mill Road and 1200 W DESCRIPTION Install 8,670 feet of 12-in pipe, 1,960 feet of 16-in pipe, and 6,580 feet of 24-in pipe from 2770 E and River Bottoms Road to Volunteer Drive and Main Street Install 2,980 feet of 12-in pipe from 2300 S and 1100 E to 1400 E and 1870 S Install 6,100 feet of 12-in pipe in Arrowhead Trail Street between 1900 S and 1030 S on Main Street Install 4,700 feet of 12-in pipe in 300 W between 900 N and 1900 N Install 3,040 feet of 12-in pipe in 3000 N between Main Street and 600 W Install 1,170 feet of 12-in pipe in 1600 N from Main Street to 200 E and install 2,220 feet of 12-in pipe in 200 E from 1600 N to 2100 N Install 2,770 feet of 12-in pipe in 1800 N between 200 E and Chappel Drive Install 4,890 feet of 12-in pipe in Chappel Drive from 1800 N to 1200 N and to 1000 N and 500 E Install 4,190 feet of 12-in pipe in Kirby Lane from Chappel Drive to 450 E and then to 1800 N Install 4,000 feet of 12-in pipe in 600 W between 3000 N and State Road 77 Install 6,990 feet of 12-in pipe in Highway 77 between 550 W and 2050 W Install 6,620 feet of 12-in pipe in 1150 W between 3050 N and 2400 Install 3,670 feet of 12-in pipe in 1000 N between 300 W and 1120 W Install 1,310 feet of 12-in pipe in Canyon Crest Road between 2300 E and 2600 E Install 4,350 feet of 12-in pipe in 100 S between 1060 W and 1850 W Install 3,300 feet of 12-in pipe in 1300 S between Mill Road and 1200 W Spanish Fork City V-5 Pressurized Irrigation System Master Plan
30 TABLE V-1 PROPOSED FUTURE GROWTH PROJECTS (CONTINUED) MAP ID LOCATION DESCRIPTION E from 1500 S to 750 S Install 3,750 feet of 12-in pipe in 3400 E between 1500 S to 750 S 18 Mill Road between 1300 S and State Road 164, Woodland Hills Drive between State Road 164 and State Road 198, and South Field Road between State Road 198 and 3000 S Install 2,480 feet of 12-in pipe in Mill Road between 1300 S and State Road 164 and install 4,030 feet of 12-in pipe in Woodland Hills Drive between State Road 194 and State Road 198 and install 5,820 feet of 12-in pipe in South Field Road between State Roads 198 and 3000 S From 2750 S and 820 E to Arrowhead Trail Street and Del Monte Road 2400 N between 2050 W and 1100 W, 1100 W and 900 W between 2400 N and 1000 N 1700 W between State Road 164 and 1400 S 1100 E from 1200 N to 950 E and 2500 N 2100 N from 1100 E to Chappel Drive and Chappel Drive from 2100 N to 1800 N 1300 N between Chappel Drive to 1100 E 1200 N from Chappel Drive to 1100 E and 1300 N Future Road connecting 1950 N on Williams Lane to 950 E and 2500 N 1420 E Extension to Expressway Lane Expressway Lane between State Road 51 and 2250 E 2250 E between Legacy Farms Parkway and Expressway Lane Legacy Farms Parkway from 400 N to State Road 51 and in 2550 E from 400 N to 100 S 400 N between Stahell Lane and Legacy Farms Parkway S between 2550 E and Railroad E along Railroad between 750 S and 150 S S between 3400 E and 2560 E Install 8,310 feet of 12-in pipe from 2750 S and 820 E to Arrowhead Trail Street and Del Monte Road Install 4,330 feet of 12-in pipe in 2400 N between 2050 W and 1100 W, install 7,890 feet of 12-in pipe in 1100 W and 900 W between 1600 N and 1000 N Install 2,360 feet of 12-in pipe in 1700 W between State Road 164 and 1400 S Install 6,190 feet of 12-in pipe in 1100 E from 1200 N to 950 E and 2500 N Install 1,450 feet of 12-in pipe in 2100 N between 1100 E and Chappel Drive and 1,310 feet of 12-in pipe in Chappel Drive from 2100 N to 1800 N Install 2,880 feet of 12-in pipe in 1300 N between Chappel Drive to 1100 E Install 1,790 feet of 12-in pipe in 1200 N from Chappel Drive to 1100 E and 1300 N Install 3,750 feet of 12-in pipe in future road connecting 1950 N on Williams Lane to 950 E and 2500 N Install 1,480 feet of 12-in pipe in future extension of 1420 E to Expressway Lane Install 3,060 feet of 12-in pipe in Expressway Lane between State Road 51 and 2250 E Install 390 feet of 12-in pipe in 2250 E from Legacy Farms Parkway to Expressway Lane Install 2,610 feet of 12-in pipe and 6,440 feet of 16-in pipe in Legacy Farms Parkway between 400 N and State Road 51 and install 2,780 feet of 12-in pipe in 2550 E from 400 N to 100 S Install 3,190 feet of 12-in pipe in 400 N between Stahell Lane and Legacy Farms Parkway Install 2,880 feet of 12-in pipe in 150 S between 2550 E and Railroad Install 2,910 feet of 12-in pipe in 3400 E and along the Railroad between 750 S and 150 S Install 3,940 feet of 12-in pipe in 750 S between 3400 E and 2560 E Spanish Fork City V-6 Pressurized Irrigation System Master Plan
31 TABLE V-1 PROPOSED FUTURE GROWTH PROJECTS (CONTINUED) MAP ID LOCATION 2300 S (relatively) between 2300 E and 1700 E From 1550 E and 2050 S to 1830 E and 2080 S 1100 E and 1200 E between 3000 S and 2080 S From 620 E and South Field Road to 2300 S and 1100 E Rivers Bottom Road Between Canyon Glen Loop and 2770 E S between 2400 E and 620 E W along I-15 between 3000 S and 900 S 1300 S between 1200 W and 1800 W 3000 S between 1000 W and 2200 W DESCRIPTION Install 3,270 feet of 12-in pipe in 2300 S between 2300 E and 1700 E Install 1,300 feet of 12-in pipe from 1550 E and 2050 S to 1830 E and 2080 S Install 1,380 feet of 12-in pipe and 3,430 feet of 16-in pipe in 1100 E and 1200 E between 3000 S and 2080 E Install 1,020 feet of 12-in pipe and 2,480 feet of 16-in pipe from 620 E and South Field Road to 2300 S and 1100 E Install 1,570 feet of 12-in pipe in Rivers Bottom Road between Canyon Glen Loop and 2770 E Install 8,760 feet of 12-in pipe in 3000 S between 2400 E and 620 E Install 5,620 feet of 12-in pipe in 1800 W and along I-15 between 3000 S and 900 S Install 2,770 feet of 12-in pipe in 1300 S between 1200 W and 1800 W Install 10,420 feet of 12-in pipe in 3000 S between 1000 W and 2200 W 44 From 2200 W and 3000 S to 1950 W and 900 S Install 5,520 feet of 12-in pipe in From 2200 W and 3000 S to 1950 W and 900 S S between 2000 W and 1150 W Install 16,420 feet of 12-in pipe in 900 S between 2000 W and 1150 W From 900 S and 2500 W to 100 S and 2000 W From 100 S and 1850 W to 1000 N and 700 W Install 4,510 feet of 12-in pipe in From 900 S and 2500 W to 100 S and 2000 W Install 8,080 feet of 12-in pipe from 100 S and 1850 W to 1000 N and 700 W N between 1230 W and 650 W 49 Woodland Hills Road and South Field Road Install 2,520 feet of 12-in pipe in 400 N between 1230 W and 650 W Install 10" PRV at Woodland Hills Road and South Field Road (See project 18) S and 750 E Install 10 PRV at 750 E and 2650 S (See project 19) E and 2250 S Install 10" PRV at 1050 E and 2250 S (See project 1) 52 Expressway Lane and 1600 E Install 10" PRV at Expressway Lane and 1600 E (See project 28) 53 Legacy Farms Parkway and State Road 51 Install 10 PRV at Legacy Farms Parkway and State Road 51 (See project 30) 54 Canyon Road Transmission Pipeline Transfer the existing drinking water system transmission pipeline to the pressurized irrigation system Spanish Fork City V-7 Pressurized Irrigation System Master Plan


32 HWY US HWY S I W HWY S 13 X MAIN ST 400 N CENTER ST 100 S 300 S ARROWHEAD TRAIL ST EXPRESSWAY LN HWY X CANYON RD 53 STATE ST US S SPANISH FORK CITY PI MASTER PLAN FIGURE V-1 PROPOSED PROJECTS ³ Miles X!( 1 Legend Future PRVs 12-inch Future Proposed Pipelines 16-inch Future Proposed Pipelines 24-inch Future Proposed Pipelines Existing PI Waterlines Project ID S HWY X 49 1 X 50 X POWERHOUSE RD
33 CHAPTER VI CAPITAL IMPROVEMENTS PLAN Throughout the master planning process, the three main components of the City s pressurized irrigation system (source, storage, and distribution) were analyzed to determine the system s ability to meet existing demands and also the anticipated future demands at build-out. Each of the system deficiencies identified in the master planning process and described previously in this report were presented in an alternatives workshop with City staff. Possible solutions were discussed for each of the identified system deficiencies as well as possible solutions for maintenance and other system needs not identified in the system analysis. After the workshop, HAL studied the feasibility of the solution alternatives and developed conceptual costs. One important method of paying for system improvements is through impact fees. Impact fees are collected from new development and should only be used to pay for system improvements related to new development. For this reason it is important to identify which projects are related to resolving existing deficiencies, and which projects are related to providing anticipated future capacity for new development. PRECISION OF COST ESTIMATES When considering cost estimates, there are several levels or degrees of precision, depending on the purpose of the estimate and the percentage of detailed design that has been completed. The following levels of precision are typical: Type of Estimate Precision Master Planning ±50% Preliminary Design ±30% Final Design or Bid ±10% For example, at the master planning level (or conceptual or feasibility design level), if a project is estimated to cost $1,000,000, then the precision or reliability of the cost estimate would typically be expected to range between approximately $500,000 and $1,500,000. While this may seem very imprecise, the purpose of master planning is to develop general sizing, location, cost, and scheduling information on a number of individual projects that may be designed and constructed over a period of many years. Master planning also typically includes the selection of common design criteria to help ensure uniformity and compatibility among future individual projects. Details such as the exact capacity of individual projects, the level of redundancy, the location of facilities, the alignment and depth of pipelines, the extent of utility conflicts, the cost of land and easements, the construction methodology, the types of equipment and material to be used, the time of construction, interest and inflation rates, permitting requirements, etc., are typically developed during the more detailed levels of design. At the preliminary or 10% design level, some of the aforementioned information will have been developed. Major design decisions such as the size of facilities, selection of facility sites, pipeline alignments and depths, and the selection of the types of equipment and material to be used during construction will typically have been made. At this level of design the precision of the cost estimate for a $1,000,000 project would typically be expected to range between approximately $700,000 and $1,300,000. After the project has been completely designed, and is ready to bid, all design plans and technical specifications will have been completed and nearly all of the significant details about Spanish Fork City VI-1 Pressurized Irrigation System Master Plan
34 the project should be known. At this level of design, the precision of the cost estimate for the same $1,000,000 project would typically be expected to range between approximately $900,000 and $1,100,000. SYSTEM IMPROVEMENT PROJECTS Project costs for PI system improvements are presented in Table VI-1 in no particular order with the location of each project shown in Figure V-1. Each recommendation includes a conceptual cost estimate for construction. Unit costs for the construction cost estimates are based on conceptual level engineering. Sources used to estimate construction costs include: 1. Means Heavy Construction Cost Data, 2011" 2. Price quotes from equipment suppliers 3. Recent construction bids for similar work All costs are presented in 2011 dollars. Recent price and economic trends indicate that future costs are difficult to predict with certainty. Engineering cost estimates provided in this study should be regarded as conceptual level for use as a planning guide. Only during final design can a definitive and more accurate estimate be provided for each project. A cost estimate calculation for each project is provided in Appendix D. All existing system improvement projects are recommended to be completed in 0 to 5 years. TABLE VI-1 CAPITAL IMPROVEMENT PROJECTS ID DESCRIPTION COST 1 Install 8,670 feet of 12-in pipe, 1,960 feet of 16-in pipe, and 6,580 feet of 24-in pipe from 2770 E and River Bottoms Road to Volunteer Drive and Main Street $3,067,000 2 Install 2,980 feet of 12-in pipe from 2300 S and 1100 E to 1400 E and 1870 S $414,000 3 Install 6,100 feet of 12-in pipe in Arrowhead Trail Street between 1900 S and 1030 S on Main Street $848,000 4 Install 4,700 feet of 12-in pipe in 300 W between 900 N and 1900 N $654,000 5 Install 3,040 feet of 12-in pipe in 3000 N between Main Street and 600 W $423,000 6 Install 1,170 feet of 12-in pipe in 1600 N from Main Street to 200 E and install 2,220 feet of 12-in pipe in 200 E from 1600 N to 2100 N $471,000 7 Install 2,770 feet of 12-in pipe in 1800 N between 200 E and Chappel Drive $385, Install 4,890 feet of 12-in pipe in Chappel Drive from 1800 N to 1200 N and to 1000 N and 500 E Install 4,190 feet of 12-in pipe in Kirby Lane from Chappel Drive to 450 E and then to 1800 N $680,000 $583, Install 4,000 feet of 12-in pipe in 600 W between 3000 N and State Road 77 $556, Install 6,990 feet of 12-in pipe in Highway 77 between 550 W and 2050 W $972, Install 6,620 feet of 12-in pipe in 1150 W between 3050 N and 2400 $921, Install 3,670 feet of 12-in pipe in 1000 N between 300 W and 1120 W $510, Install 1,310 feet of 12-in pipe in Canyon Crest Road between 2300 E and 2600 E $182,000 Spanish Fork City VI-2 Pressurized Irrigation System Master Plan
35 TABLE VI-1 CAPITAL IMPROVEMENT PROJECTS (CONTINUED) ID DESCRIPTION COST 15 Install 4,350 feet of 12-in pipe in 100 S between 1060 W and 1850 W $605, Install 3,300 feet of 12-in pipe in 1300 S between Mill Road and 1200 W $459, Install 3,750 feet of 12-in pipe in 3400 E between 1500 S to 750 S $521, Install 2,480 feet of 12-in pipe in Mill Road between 1300 S and State Road 164 and install 4,030 feet of 12-in pipe in Woodland Hills Drive between State Road 194 and State Road 198 and install 5,820 feet of 12-in pipe in South Field Road between State Roads 198 and 3000 S Install 8,310 feet of 12-in pipe from 2750 S and 820 E to Arrowhead Trail Street and Del Monte Road Install 4,330 feet of 12-in pipe in 2400 N between 2050 W and 1100 W, install 7,890 feet of 12-in pipe in 1100 W and 900 W between 1600 N and 1000 N $1,715,000 $1,156,000 $1,699, Install 2,360 feet of 12-in pipe in 1700 W between State Road 164 and 1400 S $328, Install 6,190 feet of 12-in pipe in 1100 E from 1200 N to 950 E and 2500 N $861, Install 1,450 feet of 12-in pipe in 2100 N between 1100 E and Chappel Drive and 1,310 feet of 12-in pipe in Chappel Drive from 2100 N to 1800 N $384, Install 2,880 feet of 12-in pipe in 1300 N between Chappel Drive to 1100 E $400, Install 1,790 feet of 12-in pipe in 1200 N from Chappel Drive to 1100 E and 1300 N Install 3,750 feet of 12-in pipe in future road connecting 1950 N on Williams Lane to 950 E and 2500 N $249,000 $521, Install 1,480 feet of 12-in pipe in future extension of 1420 E to Expressway Lane $206, Install 3,060 feet of 12-in pipe in Expressway Lane between State Road 51 and 2250 E Install 390 feet of 12-in pipe in 2250 E from Legacy Farms Parkway to Expressway Lane Install 2,610 feet of 12-in pipe and 3,660 feet of 16-in pipe in Legacy Farms Parkway between 400 N and State Road 51 and install 2,780 feet of 16-in pipe in 2550 E from 400 N to 100 S Install 3,190 feet of 12-in pipe in 400 N between Stahell Lane and Legacy Farms Parkway $425,000 $54,000 $1,398,000 $444, Install 2,880 feet of 12-in pipe in 150 S between 2550 E and Railroad $400, Install 2,910 feet of 12-in pipe in 3400 E and along the Railroad between 750 S and 150 S $405, Install 3,940 feet of 12-in pipe in 750 S between 3400 E and 2560 E $548, Install 3,270 feet of 12-in pipe in 2300 S between 2300 E and 1700 E $455, Install 1,300 feet of 12-in pipe from 1550 E and 2050 S to 1830 E and 2080 S $181, Install 1,380 feet of 12-in pipe and 3,430 feet of 16-in pipe in 1100 E and 1200 E between 3000 S and 2080 E Install 1,020 feet of 12-in pipe and 2,480 feet of 16-in pipe from 620 E and South Field Road to 2300 S and 1100 E Install 1,570 feet of 12-in pipe in Rivers Bottom Road between Canyon Glen Loop and 2770 E $743,000 $540,000 $218, Install 8,760 feet of 12-in pipe in 3000 S between 2400 E and 620 E $1,218,000 Spanish Fork City VI-3 Pressurized Irrigation System Master Plan
36 TABLE VI-1 CAPITAL IMPROVEMENT PROJECTS (CONTINUED) ID DESCRIPTION COST 41 Install 5,620 feet of 12-in pipe in 1800 W and along I-15 between 3000 S and 900 S $781, Install 2,770 feet of 12-in pipe in 1300 S between 1200 W and 1800 W $385, Install 10,420 feet of 12-in pipe in 3000 S between 1000 W and 2200 W $1,449, Install 5,520 feet of 12-in pipe in From 2200 W and 3000 S to 1950 W and 900 S $768, Install 16,420 feet of 12-in pipe in 900 S between 2000 W and 1150 W $2,283, Install 4,510 feet of 12-in pipe in From 900 S and 2500 W to 100 S and 2000 W $627, Install 8,080 feet of 12-in pipe from 100 S and 1850 W to 1000 N and 700 W $1,124, Install 2,520 feet of 12-in pipe in 400 N between 1230 W and 650 W $350, Install 10" PRV at Woodland Hills Road and South Field Road (See project 18) $31, Install 10 PRV at 750 E and 2650 S (See project 19) $31, Install 10" PRV at 1050 E and 2250 S (See project 1) $31, Install 10" PRV at Expressway Lane and 1600 E (See project 28) $31, Install 10 PRV at Legacy Farms Parkway and State Road 51 (See project 30) $31, Canyon Road Transmission Pipeline $993, Install 4,000 gpm VFD pump at 2550 E and Canyon Road $1,200, Install 6,000 gpm VFD pump at 2850 E and River Bottoms Road $1,500, Update the Model and Master Plan as needed, and update the Impact Fees Annually Install connection to the 36-inch reservoir transmission line from the eventual Central Utah Project pipeline FUNDING OPTIONS $304,183 $150,000 TOTAL $38,868,183 Funding options for the recommended projects, in addition to water use fees, could include the following options: general obligation bonds, revenue bonds, State/Federal grants and loans, and impact fees. In reality, the City may need to consider a combination of these funding options. The following discussion describes each of these options. Currently the City is making payments on a revenue bond through fiscal year Details of the debt service schedule are found in Appendix D. It is recommended that the City start to fund a pipeline and facility replacement program. The City could start with a small amount of $50,000 to $100,000 a year until the bond is paid off. It would then be recommended to fund the pipeline replacement program with $250,000 to $500,000 a year--the lower end representing one percent of the estimated replacement cost based on actual cost and the higher end representing the estimated replacement cost over 50 years using master plan cost estimates. General Obligation Bonds This form of debt enables the City to issue general obligation bonds for capital improvements and replacement. General Obligation (G.O.) Bonds would be used for items not typically financed through the Water Revenue Bonds (for example, the purchase of water source to ensure a sufficient water supply for the City in the future). G.O. bonds are debt instruments backed by the full faith and credit of the City which would be secured by an unconditional pledge Spanish Fork City VI-4 Pressurized Irrigation System Master Plan
37 of the City to levy assessments, charges or ad valorem taxes necessary to retire the bonds. G.O. bonds are the lowest-cost form of debt financing available to local governments and can be combined with other revenue sources such as specific fees, or special assessment charges to form a dual security through the City s revenue generating authority. These bonds are supported by the City as a whole, so the amount of debt issued for the PI system is limited to a fixed percentage of the real market value for taxable property within the City. Revenue Bonds This form of debt financing is also available to the City for utility related capital improvements. Unlike G.O. bonds, revenue bonds are not backed by the City as a whole, but constitute a lien against the water service charge revenues of a Water Utility. Revenue bonds present a greater risk to the investor than do G.O. bonds, since repayment of debt depends on an adequate revenue stream, legally defensible rate structure /and sound fiscal management by the issuing jurisdiction. Due to this increased risk, revenue bonds generally require a higher interest rate than G.O. bonds, although currently interest rates are at historic lows. This type of debt also has very specific coverage requirements in the form of a reserve fund specifying an amount, usually expressed in terms of average or maximum debt service due in any future year. This debt service is required to be held as a cash reserve for annual debt service payment to the benefit of bondholders. Typically, voter approval is not required when issuing revenue bonds. State/Federal Grants and Loans Historically, both local and county governments have experienced significant infrastructure funding support from state and federal government agencies in the form of block grants, direct grants in aid, interagency loans, and general revenue sharing. Federal expenditure pressures and virtual elimination of federal revenue sharing dollars are clear indicators that local government may be left to its own devices regarding infrastructure finance in general. However, state/federal grants and loans should be further investigated as a possible funding source for needed PI system improvements. It is also important to assess likely trends regarding federal/state assistance in infrastructure financing. Future trends indicate that grants will be replaced by loans through a public works revolving fund. Local governments can expect to access these revolving funds or public works trust funds by demonstrating both the need for and the ability to repay the borrowed monies, with interest. As with the revenue bonds discussed earlier, the ability of infrastructure programs to wisely manage their own finances will be a key element in evaluating whether many secondary funding sources, such as federal/state loans, will be available to the City. Impact Fees Impact fees can be applied to water related facilities under the Utah Impact Fees Act. The Utah Impacts Fees Act is designed to provide a logical and clear framework for establishing new development assessments. It is also designed to establish the basis for the fee calculation which the City must follow in order to comply with the statute. However, the fundamental objective for the fee structure is the imposition on new development of only those costs associated with providing or expanding water infrastructure to meet the capacity needs created by that specific new development. The following information on reimbursement for pipelines over 6-inch and existing remaining capacity is provided to the City to aid in the calculation of impact fees. It is recommended that the impact fee calculation be updated annually. Spanish Fork City VI-5 Pressurized Irrigation System Master Plan
38 Reimbursement for Pipelines Over 6-inch The City requires that a developer install the minimum size of pipe in a new development. If the pipe size is recommended by the model and Master Plan to be a larger diameter to accommodate future growth than it is recommended that the City require the developer to install the larger pipeline. It is recommended that the developer be reimbursed the difference between the larger pipe cost and the cost of minimum sized pipe (6 inch) as shown in Table VI-2. Reimbursement for growth related capacity above 6-inch is listed in Table VI-3 with an ID of A and a total cost representing an estimated reimbursement cost over the next 10 years. The 2550 E Project listed in Table VI-3 with an ID of B is already constructed and TABLE VI-2 PERCENTAGE OF PIPELINE COST RELATED TO GROWTH PIPE SIZE COST PER LINEAL FOOT % GROWTH RELATED 6 inch $73/ft 0% 8 inch $81/ft 10% 10 inch $91/ft 20% 12 inch $103/ft 29% 16 inch $119/ft 39% 18 inch $136/ft 46% 20 inch $145/ft 50% 24 inch $174/ft 58% 30 inch $236/ft 69% 36 inch $316/ft 77% Existing Remaining Capacity The Utah Impact Fees Act allows for the calculation of Impact Fees based on an estimated cost of existing system capacity that will be recouped by future development. The following is an estimate of remaining capacity in the existing pressurized irrigation source, storage, and distribution. Source. The remaining capacity of source for the Spanish Fork Irrigation System was calculated based on the level of service Design Criteria presented in Table I-1 and I-2. The level of service for source is 0.90 gpm per ERC with a total existing system source requirement of 8,861 gpm. Table III-1 shows the total of existing sources as 15,975 gpm. Because Cold Springs is not available yet for use as a source in the pressurized irrigation system, this reduces the existing capacity to 11,975 gpm. Subtracting the existing source requirement of 8,861 gpm from the existing capacity leaves a 3,114 gpm capacity or 3,460 ERCs. At the time the Golf Course PI Pond Pump Station facility was constructed, 100% of the capacity was for future growth. The Golf Course PI Pond Pump Station is listed in Table VI-3 as project C. Storage. The remaining capacity of storage for the Spanish Fork Irrigation System was calculated based on the level of service Design Criteria presented in Table I-1 and IV-1. Spanish Fork City VI-6 Pressurized Irrigation System Master Plan
39 Currently the City has 77 ac-feet of storage and an existing requirement of 28 ac-ft in the Spanish Oaks reservoir. This leaves a remaining capacity available for future growth of 63%. The Golf Course Pond has a capacity of 24 ac-ft. At the time the Golf Course PI Pond was constructed, 100% of the capacity was for future growth. The Spanish Oaks reservoir is listed in Table VI-3 with the pressurized irrigation distribution system with an ID of D. The Spanish Oaks reservoir and the citywide pressurized irrigation distribution system have a combined remaining capacity of 55%. The Golf Course Pond is listed in Table VI-3 with an ID of D. Distribution System. The capacity for the distribution system was calculated based on the level of service Design Criteria presented in Table I-1. Using the existing extended period hydraulic model for the Pressurized Irrigation System, the demand was increased until the existing system reached unacceptable performance during peak instantaneous demand. Unacceptable performance was defined as a minimum normal operating pressure of 50 psi. The highest elevations in each zone reaching 50 psi corresponded to a maximum system-wide pressure reduction during peak instantaneous demand of 20 psi caused by high velocities. The maximum capacity of the existing pressurized irrigation distribution system was determined to be 16,686 ERCs. In 2003, when the system was completed, there were 8,067 existing ERCs. The additional capacity of the distribution system for future growth was 8,619 ERCs, or 52%. The pressurized irrigation distribution system is listed in Table VI-3 with the Spanish Oaks reservoir with an ID of D. The Spanish Oaks reservoir and the citywide pressurized irrigation distribution system have a combined remaining capacity of 55%. Summary of Impact Fee Related Projects Table VI-3 shows impact fee eligible projects that Spanish Fork City has completed or anticipates completing in the next ten years. The percent impact fee eligible column is the current remaining capacity available to new development for the existing projects and the anticipated percentage of the proposed projects attributed to new development. Projects already constructed have letter IDs. Master Plan recommended projects have Map ID numbers from Table VI-1. ID TABLE VI-3 IMPACT FEE RELATED PROJECTS DESCRIPTION % IMPACT FEE ELIGIBLE TOTAL COST B 2550 E Trunkline (Nebo School District) 41% $110,554 C Golf Course PI Pond Pump Station 100% $314,882 D Citywide Pressurized Irrigation System 55% $17,315,139 E Golf Course PI Pond 100% $638, N 200 E Railroad Casing 29% $13, Canyon Road Transmission Line/Crab Creek 100% $993, Model, Master Plan & Impact Fee Updates 100% $304, CUP Connection 100% $150,000 Spanish Fork City VI-7 Pressurized Irrigation System Master Plan
40 SUMMARY OF RECOMMENDATIONS Several recommendations were made throughout the master plan report. The following is a summary of the recommendations. 1. It is recommended that the City continue to update the model as the PI system changes and use the model as a tool for determining: the effect of changes to the system, verification of pipe diameters, and location of proposed PI water mains. It is recommended that the City update the Master Plan as needed. 2. It is recommended that redundancy be incorporated into the pressurized irrigation system so that the pressurized irrigation system is able to meet all of the demand objectives with a major source unavailable. 3. It is recommended that the City continue to exact water rights and shares as land in Spanish Fork City is developed. However, the City should avoid accepting water rights that are not for current use in the Policy Declaration Boundary or in current sources. Irrigation companies that have service areas within the Policy Declaration Boundary include the Highline Division, Spanish Fork East Bench Irrigation, Spanish Fork South Irrigation Co., Spanish Fork Southeast Irrigation Co., Spanish Fork West Field Irrigation Co., and Springville Irrigation District. The irrigation companies and their service areas can be seen in Appendix A on the map Ditches & Irrigation Companies. It is recommended that the City exact that amount of water the new development will use to irrigate. This master plan assumes that 4.0 acre-feet is needed per irrigated acre. It was determined that the average irrigated acreage per ERC is 0.15 acres which produces a yearly demand requirement of 0.6 acre-feet per ERC. It is recommended that for nonresidential development the City calculate the amount of water required by multiplying the irrigated acreage by 4.0 acre-feet. 4. The City s water rights and water shares far exceed the City s current ability to receive the water through existing sources. It is recommended that the City continue to monitor and perfect water rights and shares. It is recommended that the City also continue to develop sources as more sources are needed. 5. Currently, the Central Utah Project (CUP) water is anticipated to be at a much higher cost than the other potential sources. It is therefore recommended that the other sources of water be developed first. 6. It is recommended that the City promote the need for a CUP pipeline that is planned to convey water south from the existing 96-inch CUP pipeline so that the City can convey irrigation shares and Strawberry Project water at a high pressure directly to the Spanish Oaks reservoir. 7. It is recommended that the City add a 4,000 gpm pump station with VFD at the 2550 East Tank and well site to deliver irrigation share water and Cold Springs water out of the storage tank. 8. It is recommended that the City add a 2,000 to 6,000 gpm pump station with VFD at the Golf Course Pond to deliver additional irrigation share water out of the pond and to allow the Golf Course Pond as equalization storage. Spanish Fork City VI-8 Pressurized Irrigation System Master Plan
41 9. It is recommended that the City start to fund a pipeline and facility replacement program. The City could start with a small amount of $50,000 to $100,000 a year until the bond is paid off. It would then be recommended to fund the pipeline replacement program with $250,000 to $500,000 a year--the lower end representing one percent of the estimated replacement cost based on actual cost and the higher end representing the estimated replacement cost over 50 years using master plan cost estimates. 10. It is recommended that the impact fee calculation be updated annually. 11. The City requires that a developer install the minimum size of pipe in a new development. If the pipe size is recommended by the model and Master Plan to be a larger diameter to accommodate future growth than it is recommended that the City require the developer to install the larger pipeline. It is recommended that the developer be reimbursed the difference between the larger pipe cost and the cost of minimum sized pipe. Spanish Fork City VI-9 Pressurized Irrigation System Master Plan
42 REFERENCES Horrocks Engineers. (2011). Spanish Fork City Transportation Master Plan. Pleasant Grove, UT: Horrocks Engineers. RSMeans. (2011). RSMeans Heavy Construction Cost Data. Norwell, MA: Construction Publishers & Consultants. Utah Division of Administrative Rules Utah Administrative Code, R The Department of Administrative Services. U.S. Census Bureau Profile of General Population and Housing Characteristics: 2010, Spanish Fork City, Utah.
43 APPENDIX A Calculations and Assumptions
 400 E 2300 E 2400 E 650 W 630 W 690 E 2800 E 820 E 1560 E 1100 W 2410 E 1800 W 1400 W 1200 W 2230 E 1800 E 2550 E 1100 E 1100 E 800 E 2550 E 2700 E 2100 W 1600 W 1140 W 1000 W 800 W 520 W GOMEX")


44 2000 W 1800 W 460 W MAIN ST 800 W 1400 E 1700 E 1750 W 1700 W (SP. FORK) 400 E 2300 E 2400 E 650 W 630 W 690 E 2800 E 820 E 1560 E 1100 W 2410 E 1800 W 1400 W 1200 W 2230 E 1800 E 2550 E 1100 E 1100 E 800 E 2550 E 2700 E 2100 W 1600 W 1140 W 1000 W 800 W 520 W GOMEX 1470 E Private 1650 E Private Spanish Fork River 400 E 740 E 1400 N 300 N Spanish Fork River 850 S MAPLE CANYON 900 N 540 N 1200 E 4600 S 4780 S 1850 W 1600 W 1450 W 5000 S 6800 S 1400 W 8000 S 4000 S 6000 S 1050 W 920 W MILL RD 300 W CENTER ST 700 N 500 N 100 W 1200 W 400 S 200 E 1000 N 100 N 370 E 200 N 600 E RIVER BOTTOMS RD 1600 S 3900 S 700 E 1150 E 800 E 1000 E 1250 E 400 N ASPEN 1575 E Ditches & Irrigation Companies É 1 Inch equals 4,755 Feet Legend Roads Not Paved Paved Rivers Ditches Spanish Fork Boundary Canal Co Boundaries Highline Division Lake Shore Irrig. Co Mapleton Irrig. District Salem Irrig. and Canal Co Spanish Fork East Bench Irrig. Spanish Fork South Irrig. Co Spanish Fork Southeast Irrig. Co Spanish Fork West Field Irrig. Co Springville Irrig. District 1/4/ S RIVER PALMYRA 5950 S RIVER DR 6200 S 1150 W 1900 S DEL MONTE RD 3000 N 1900 N West Park Dr 1600 N CALPAC AVE 3450 N 2050 N 1900 N 2700 N 350 E 300 E CHAPPEL DR 900 E RIVER Spanish Fork River PALMYRA 6930 S 900 S 180 S 350 S 520 S 650 W 500 W 470 N MITCHELL DR 300 N 750 W 5950 S 300 S 3200 N 500 S 900 N 300 N 300 S 100 S 400 S 800 N 600 N 300 E SCENIC DR KIRBY LN 400 E 100 E 200 E 500 E 700 E 400 S 920 E 60 S 200 S 1050 S 1240 S 1420 S 1010 N 660 N NEBO ST 1120 E 100 S 500 S 1240 E 1630 S 1750 S Rees Ave 1430 E 410 S 600 S 1790 S 750 S 970 S 1130 S 1640 S 1400 S 1850 S 5400 S 300 S 700 S 50 W 2600 E 100 E MAPLETON SLANT 1035 S 1330 S 1650 S 175 E 7200 S 2900 E 1010 S 1875 S 6800 S 500 E 400 E 550 E 1355 S 1500 S 1650 S 1530 S CHASE 400 S 400 S 900 E 800 N 300 S 400 N 400 W 700 S 650 S 1000 S 3400 E B 1380 W WEIGHT 950 E 2400 S 2600 S 1060 E 300 E 400 E 1900 S 800 S 2000 N 1200 N 975 W 2620 S 900 S 800 S 7600 S 700 W 800 N 2925 S 1450 E HOUTZ 975 S 300 W 200 W 1700 E 250 S 400 S Hobble Creek 1400 N MAIN MAIN Private BING 1950 E 1700 N 600 N 210 E 400 E 900 S 1100 S 850 S 540 E Spanish Fork City GIS 40 South Main Street Spanish Fork, UT (801) Disclaimer: Spanish Fork City makes no warranty with respect to the accuracy, completeness, or usefulness of these maps. Spanish Fork City assumes no liability for direct, indirect, special, or consequential damages resulting from the use or misuse of these maps or any of the information contained herein. Portions may be copied for incidental uses, but may not be resold. ARROWHEAD TRAIL Beer Creek Beer Creek 400 N MAIN 400 N 360 E 400 W SOUTH FIELD RD 8600 S 9400 S WOODLAND HILLS 50 E 9200 S 8800 S 780 E 1100 E 8680 S POWERHOUSE RD
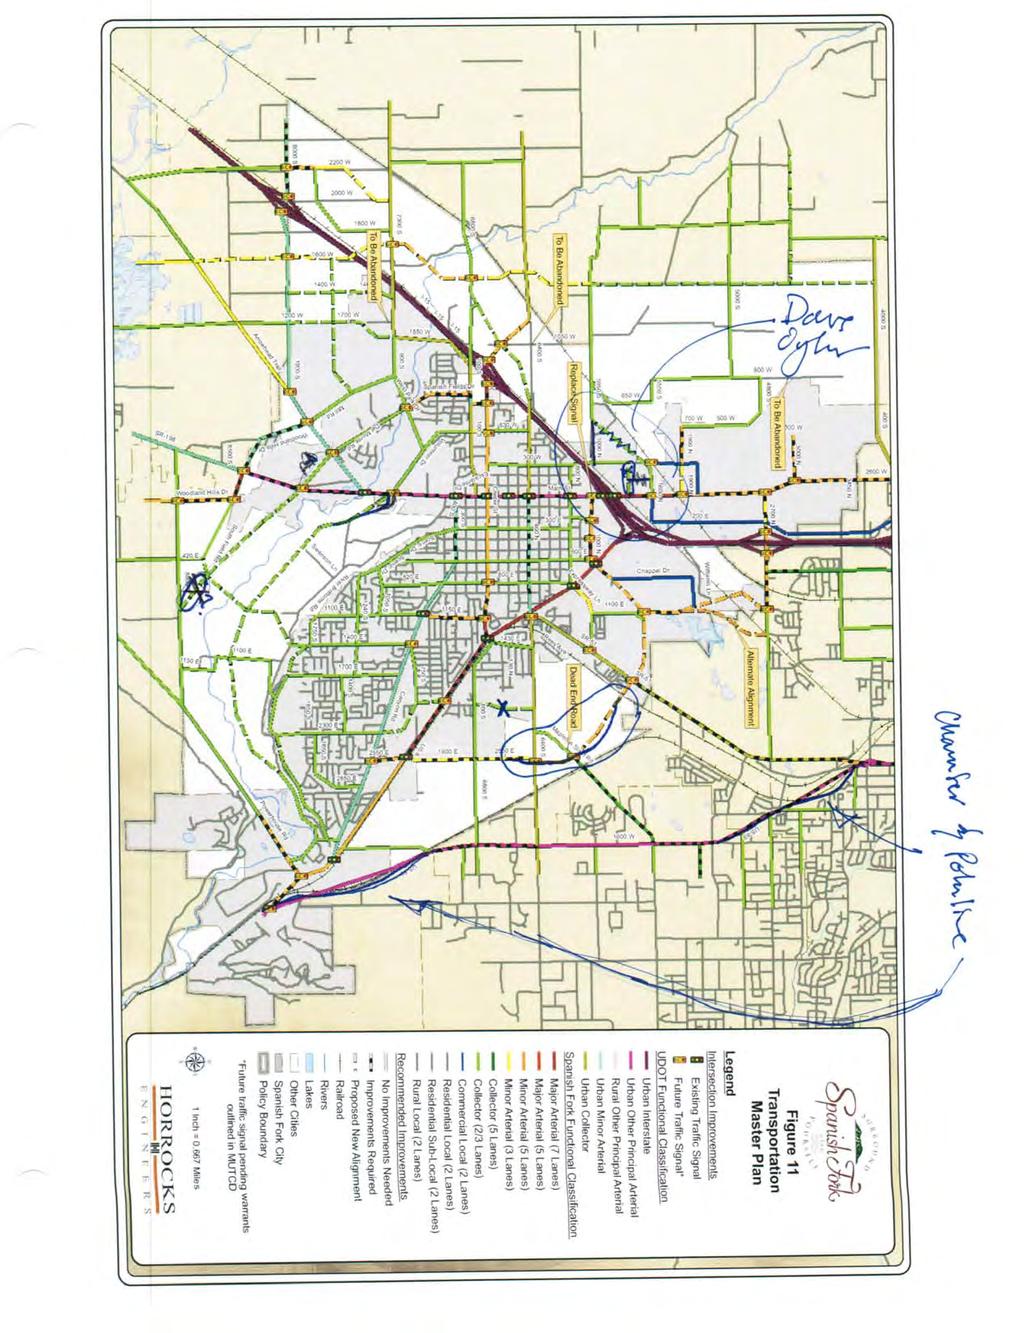
45
46 APPENDIX B Calibration Data
47 PI Reservoir PRV Diurnal Curve From SCADA 4:00 AM 8:00 AM 12:00 PM 4:00 PM 8:00 PM 12:00 AM 0 Flow (gpm)
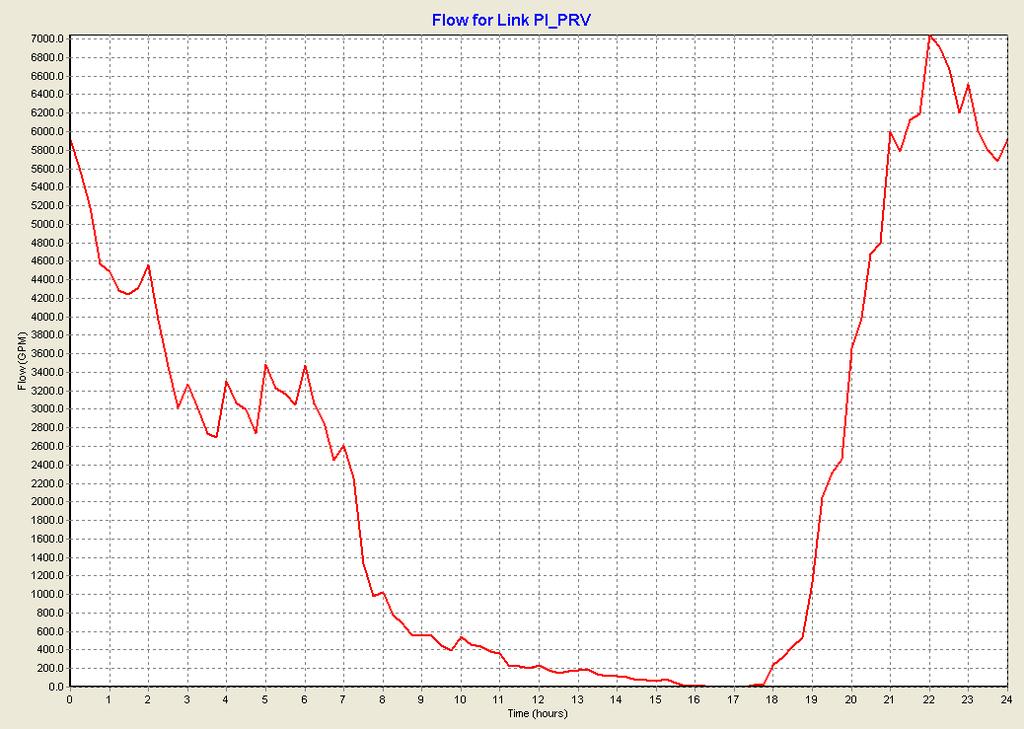
48
49 Memorial Well Diurnal Curve From SCADA 4:00 AM 8:00 AM 12:00 PM 4:00 PM 8:00 PM 12:00 AM Flow (gpm)
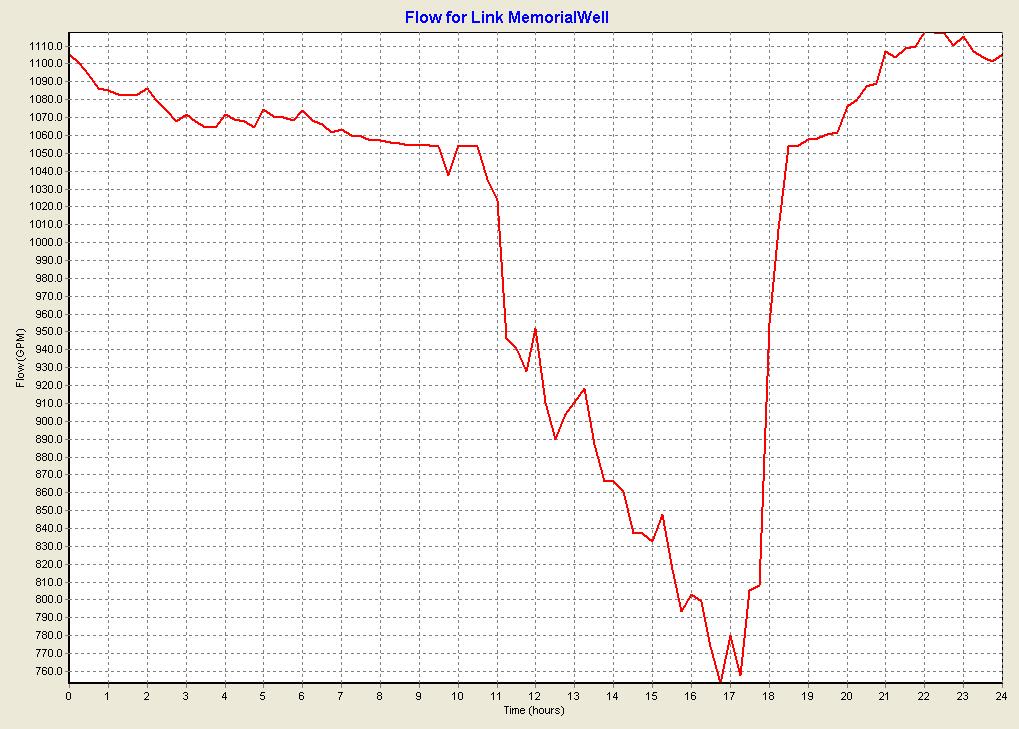
50
51 Canyon Elementary Well Diurnal Curve From SCADA 4:00 AM 8:00 AM 12:00 PM 4:00 PM 8:00 PM 12:00 AM Flow (gpm)
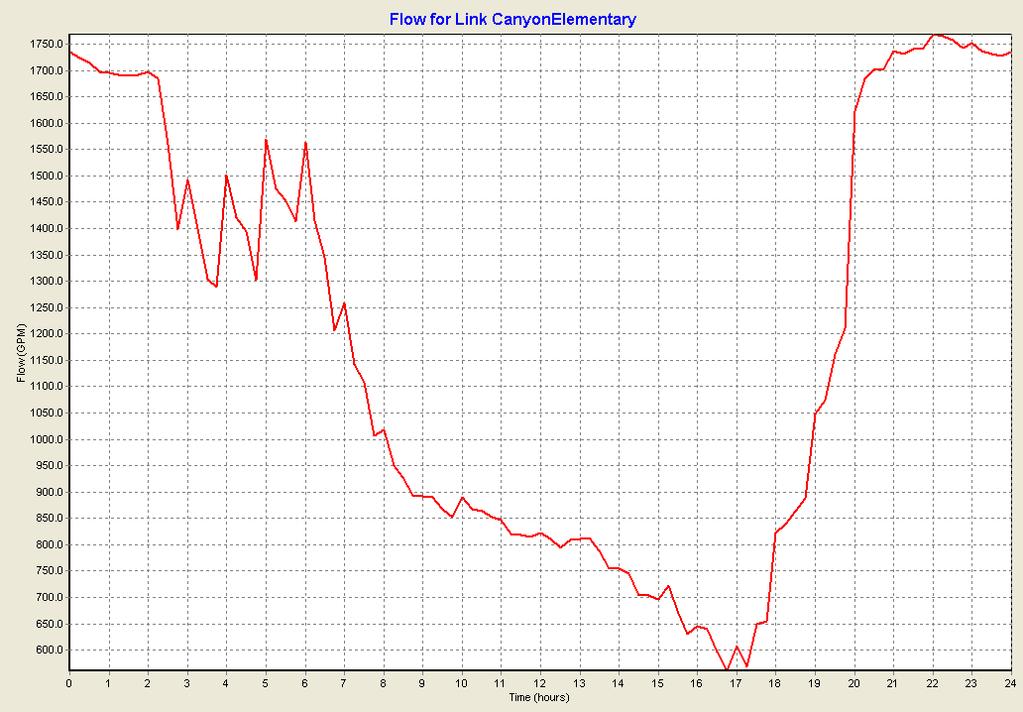
52
PRESSURIZED IRRIGATION SYSTEM MASTER PLAN
 PRESSURIZED IRRIGATION SYSTEM MASTER PLAN (HAL Project No.: 314.04.100) FINAL REPORT January 2009 ACKNOWLEDGMENTS Successful completion of this study was made possible by the cooperation and assistance
 DRINKING WATER IMPACT FEE FACILITY PLAN AND IMPACT FEE ANALYSIS (HAL Project No.: 360.07.300) OCTOBER 2017 CITY OF SARATOGA SPRINGS DRINKING WATER IMPACT FEE FACILITY PLAN AND IMPACT FEE ANALYSIS (HAL
Section 7 Hydraulic Model Development and Evaluation Criteria
 Section 7 Hydraulic Model Development and Evaluation Criteria The hydraulic evaluation conducted to develop this master plan was performed using a computer model of the reclaimed water distribution system.
Start-up of a Secondary Water Supply Company. and First Phase Design of a Regional System
 Start-up of a Secondary Water Supply Company and First Phase Design of a Regional System by Stephen W. Smith and Amy L. Johnson Abstract. Highland Ditch Company formed the Highland Secondary Water Company
Section 5 - Planning Criteria. Section 5
 Section 5 - Planning Criteria Section 5 SECTION 5 PLANNING CRITERIA This section presents the design criteria and methodologies for analysis used to evaluate the existing distribution system and its facilities
CHAPTER 4 HYDRAULIC ANALYSIS
 CHAPTER 4 HYDRAULIC ANALYSIS This chapter presents information on the computer hydraulic model of the City s water system and the results of hydraulic analyses. The purpose of the hydraulic analysis is
North and South Plan ALBERT JUNE 2. G:\2013\ \Reports\N and S Water AFC\Cover Page North and South AFC Water Master Plan.docx.
 North and South Plan AFC Water Master Prepared for: WESTERN MUNICIPAL WATER DISTRICT 14205 Meridian Parkway. Riverside, CA 92518 (951) 571-7100 Prepared by: ALBERT A. WEBBB ASSOCIATES 3788 MCCRAY STREET
Utilities are constantly striving to
 Comprehensive Approach to Increase Effectiveness & Efficiency of Flushing Programs Using Latest Hydraulic & Water Quality Monitoring Tools Kelcia D. Mazana, Edward H. Talton Jr., and C. Robert Reiss Utilities
Ivins City Standard Specifications for Design and Construction Part 2 Engineering and Design Standards
 2.9. WATER SYSTEM DESIGN Ivins City Standard Specifications for Design and Construction All culinary water mains and appurtenances shall be designed to provide for adequate future service for all contiguous
Dual Water Systems in Northern Colorado. Wayne E. Eckas, P.E. Aqua Engineering, Inc., Fort Collins, Colorado
 Dual Water Systems in Northern Colorado By Wayne E. Eckas, P.E. Aqua Engineering, Inc., Fort Collins, Colorado In northern Colorado, the cost of water rights acquisition has risen dramatically over the
UNIFORM DESIGN AND CONSTRUCTION STANDARDS FOR EXTENDING WATER DISTRIBUTION SYSTEMS SECTION 2 DESIGN STANDARDS
 UNIFORM DESIGN AND CONSTRUCTION STANDARDS FOR EXTENDING WATER DISTRIBUTION SYSTEMS SECTION 2 DESIGN STANDARDS DESIGN STANDARDS SECTION 2 INDEX ITEM DESCRIPTION 2.00 GENERAL STATEMENT 2.01 WATER DISTRIBUTION
EAST VALLEY WATER DISTRICT Wastewater Collection System Master Plan. Table 4-1 Capacity Evaluation d/d Criteria
 EAST VALLEY WATER DISTRICT Wastewater Collection System Master Plan 4 Capacity Analysis The capacity analysis used the calibrated dry weather and wet weather wastewater collection system model to evaluate
Virgin Valley Water District Water System Deficiencies VVWD BOARD MEETING DECEMBER 6, 2016
 Virgin Valley Water District Water System Deficiencies VVWD BOARD MEETING DECEMBER 6, 2016 Recap of Growth Projections 2.75% growth rate Average daily demand per Equivalent Dwelling Unit (EDU) of 410 gallons
Basic Irrigation Design
 Basic Irrigation Design Basic Irrigation Design Table of Contents Introduction............................ii Terminology...........................iii System Diagram.........................1 Hydraulics..............................2
Springfield Utility Board, Oregon Rainbow Water District, Oregon
 WATER MANAGEMENT AND CONSERVATION PLAN Springfield Utility Board, Oregon Rainbow Water District, Oregon August 2012 WATER MANAGEMENT AND CONSERVATION PLAN FOR SPRINGFIELD UTILITY BOARD AND RAINBOW WATER
Raw water sources, facilities, and infrastructure
 WATER AND WASTEWATER SERVICES IN STEAMBOAT SPRINGS Prepared by Jay Gallagher, General Manager Mt. Werner Water and Sanitation District (February, 2015) Raw water sources, facilities, and infrastructure
CHAPTER 6 COLLECTION SYSTEM HYDRAULIC MODEL
 CHAPTER 6 COLLECTION SYSTEM HYDRAULIC MODEL INTRODUCTION The District developed a hydraulic model of the sanitary sewer system as part the 2000 Wastewater Comprehensive Plan. The output from this model
VILLAGE OF BEAR LAKE. Water Reliability Study & General Plan Update
 VILLAGE OF BEAR LAKE MANISTEE COUNTY, MICHIGAN Water Reliability Study & General Plan Update November 2013 Project No. 811320 TABLE OF CONTENTS PAGES I. EXECUTIVE SUMMARY..........................................
Section 3 - Land Use, Population, and Water Demands. Section 3
 Section 3 - Land Use, Population, and Water Demands Section 3 SECTION 3 DEMANDS LAND USE, POPULATION, AND WATER This section describes the existing water demands, the population projections, and the projected
WATER SYSTEM MASTER PLAN 10. DISTRIBUTION SYSTEM EVALUATION
 WATER SYSTEM MASTER PLAN 10. DISTRIBUTION SYSTEM EVALUATION This section provides an analysis of the current water distribution system s performance. Evaluation criteria, supply scenarios, and evaluations
City of El Centro WATER SYSTEM MASTER PLAN. FINAL February 2008
 WATER SYSTEM MASTER PLAN FINAL February 2008 1 9 9 S O U T H L O S R O B L E S A V E N U E S U I T E 5 3 0 P A S A D E N A, C A L I F O R N I A 9 1 1 0 1 ( 6 2 6 ) 5 3 5-0 1 8 0 F A X ( 6 2 6 ) 5 3 5-0
SECTION 3.0 SPECIFICATIONS FOR DRINKING WATER DISTRIBUTION SYSTEMS DESIGN
 3.1 GENERAL SECTION 3.0 SPECIFICATIONS FOR DRINKING WATER DISTRIBUTION SYSTEMS DESIGN 3.1.1 The following specifications cover the general design, review of plans and specifications, and acceptance of
WATER AND SEWER CAPACITY FEE STUDY
 DRAFT WATER AND SEWER CAPACITY FEE STUDY MCKINLEYVILLE COMMUNITY SERVICES DISTRICT MAY 5, 2011 OVERVIEW McKinleyville Community Services District (the District) retained Willdan to prepare a capacity fee
Presentation Summary. What, Why, and How. Building the Model. Facility Data Acquisition. Model Calibration. Real World Applications/Case Studies
 Uday Khambhammettu Randolph Rostas VA AWWA Presentation Summary What, Why, and How Building the Model Facility Data Acquisition Model Calibration Real World Applications/Case Studies Model Maintenance
SECTION 4 - DESIGN STANDARDS FOR WATER DISTRIBUTION FACILITIES
 SECTION 4 - DESIGN STANDARDS FOR WATER DISTRIBUTION FACILITIES 4.1 GENERAL REQUIREMENTS 4.1.1 Water and fire protection distribution facilities are to be provided solely for the purpose of supplying potable
4.2 Step 2 Profile of Water Demands and Historical Demand Management
 4.2 Step 2 Profile of Water Demands and Historical Demand Management Step 2 involves an overview of the historical water demand trends as well as the influence of historical water demand management on
INFLOW DESIGN FLOOD CONTROL SYSTEM PLAN. Bremo Power Station CCR Surface Impoundment: North Ash Pond INFLOW DESIGN FLOOD
 INFLOW DESIGN FLOOD CONTROL SYSTEM PLAN INFLOW DESIGN FLOOD CONTROL SYSTEM PLAN Bremo Power Station CCR Surface Impoundment: North Ash Pond Submitted To: Bremo Power Station 1038 Bremo Bluff Road Bremo
City Council Public Input Session Water / Sewer Rate Study. March 19, 2014
 City Council Public Input Session Water / Sewer Rate Study March 19, 2014 Overview of Meeting Introduction of the Study Overview of Water and Sewer Systems FY14 Rate Study Work Accomplished and Presentations
Analysis of the Municipal Water Supply Network in the Lower Rio Grande Valley
 Analysis of the Municipal Water Supply Network in the Lower Rio Grande Valley Presentation Prepared for the Region M Water Planning Group November 19, 2003 McAllen, Texas Municipal Water Supply Network
Embedded Energy in Water Studies Study 1: Statewide and Regional Water-Energy Relationship
 Embedded Energy in Water Studies Study 1: Statewide and Regional Water-Energy Relationship Prepared by GEI Consultants/Navigant Consulting, Inc. Prepared for the California Public Utilities Commission
CONSERVATION PLAN April 2009
 CONSERVATION PLAN April 2009 1. INTRODUCTION AND OBJECTIVES Water supply has always been a key issue in the development of Texas. In recent years, the growing population and economic development of North
Water, Wastewater and Irrigation Impact Fee Study
 Water, Wastewater and Irrigation Impact Fee Study City of Cape Coral, Florida Prepared by duncan associates October 2006 Table of Contents EXECUTIVE SUMMARY... 1 INTRODUCTION... 4 Background... 4 Legal
June Lake Public Utility District
 June Lake Public Utility District 2007 Master Water Plan Update June Lake Public Utility District Board Members and General Manager: Chris Jackson President Jerry Allendorf Cheri Bromberger Katherine Kriese
GETTING A GRIP ON PRESSURE. Background
 GETTING A GRIP ON PRESSURE James W. Dettmer, P.E., Malcolm Pirnie, Inc., Tucson, Arizona Karen K. Dotson, AICP, Tucson Water, Tucson, Arizona Todd J. Schram, P.E., Malcolm Pirnie, Inc., Tucson, Arizona
Water Utility Science Water Math and Hydraulics 050. Name: Date:
 Water Utility Science Water Math and Hydraulics 050 Name: Date: Note: Please show all of your calculations for each problem no matter how simple the problem may seem. Please use the accompanying pieces
City of Grenora, ND Municipal Infrastructure Needs Assessment August 2012
 City of Grenora, ND Municipal Infrastructure Needs Assessment August 2012 Project made possible by US Dept. of HUD Regional Substantiality Planning Grant and ND Energy Development Infrastructure and Impact
Hydraulic Analysis Comparing Efficiency of One and Two Zone Pressure Water Systems
 Hydraulic Analysis Comparing Efficiency of One and Two Zone Pressure Water Systems 1 Agenda: - Background - Objectives - Water Distribution System Overview - GIS and Hydraulic Modeling Relationship - Hydraulic
SECTION 5 Design Criteria & Preliminary Analysis
 SECTION 5 Design Criteria & Preliminary Analysis This section of the report describes the hydraulic design criteria used during the system hydraulic modeling evaluation described in Section 6. This section
West Hernando County Sewer Master Plan SECTION 7.0 RECLAIMED WATER
 SECTION 7.0 RECLAIMED WATER 7.1 Introduction The use of highly treated wastewater effluent, or reclaimed water, has expanded greatly in Florida over the past several decades. In particular, the use of
CHAPTER 4 MINIMUM DESIGN CRITERIA
 4.1 INTRODUCTION CHAPTER 4 MINIMUM DESIGN CRITERIA Establishing realistic design criteria is paramount to evaluation of the existing water system s adequacy and planning for future water system improvements.
WATER SYSTEM MASTER PLAN 11. STORAGE CAPACITY EVALUATION
 WATER SYSTEM MASTER PLAN 11. STORAGE CAPACITY EVALUATION The District uses water supplied from both storage and wells to help meet peak demands. In this section District operational, emergency, and fire
STUDY OF WATER DISTRIBUTION NETWORK USING EPANET
 STUDY OF WATER DISTRIBUTION NETWORK USING EPANET Darshan Mehta 1, Krunal Lakhani 2, Divy Patel 3, Govind Patel 4 Assistant Professor, Civil Engg. Dept., S.S.A.S.I.T, Surat, Gujarat, India 1 UG Student,
WATER SUPPLY APPLICATION ENGINEER S REPORT
 February 2010 WATER SUPPLY APPLICATION ENGINEER S REPORT Burnt Hills Ballston Lake Water District No. 2 Connection to Saratoga County Water Authority East Line Road Metering/Chlorination/ Pump Station
Types of Water Resource Systems. Types of Water Resource Systems. Design of Water Resource Systems. Design for Public Water-Supply
 Types of Water Resource Systems Water Use Provide specified level of service to meet societal need Capacity dictated by population of service area, commercial and industrial requirements, economic design
WATER SUPPLY AND DISTRIBUTION PLAN. City of Medina. Adopted November 17, Project Number:
 WATER SUPPLY AND DISTRIBUTION PLAN City of Medina Adopted November 17, 2009 Project Number: 000190-07011-0 CITY OF MEDINA WATER SUPPLY AND DISTRIBUTION PLAN Table of Contents Executive Summary...1 Introduction...
TOWN OF MOUNT PLEASANT WESTCHESTER COUNTY, NEW YORK
 TOWN OF MOUNT PLEASANT WESTCHESTER COUNTY, NEW YORK COST EVALUATION FOR ROLLING HILLS AREA WATER MAIN EXTENSION PROFESSIONAL CONSULTING, LLC. Octagon 10, Office Center 1719 Route 10, Suite 225 Parsippany,
FINAL ENGINEERING REPORT
 FINAL ENGINEERING REPORT FORT PECK ASSINIBOINE AND SIOUX WATER SUPPLY SYSTEM DRY PRAIRIE RURAL WATER SYSTEM JANUARY 2002 VOLUME I FINAL ENGINEERING REPORT FORT PECK ASSINIBOINE AND SIOUX WATER SUPPLY SYSTEM
MEMORANDUM. The general findings of the assessment are as follows:
 November 28, 2006 MEMORANDUM Project No.: 030009-002-01 To: From: Re: WRIA 31 Planning Unit Steve Germiat, LHG, CGWP, and Timothy J. Flynn, LHG, CWGP Evaluation of Winterizing Existing River Pump/Conveyance
Northfield Township WWTP Capacity Evaluation Report
 Northfield Township WWTP Capacity Evaluation Report March 18, 2015 PRESENTED TO PRESENTED BY Northfield Township 8350 Main Street Suite A Whitmore Lake, Michigan 48189 Tetra Tech 710 Avis Drive Suite 100
TAUSSIG. & Associates, Inc. DAVID. Public Finance Facilities Planning Urban Economics CAPACITY FEE STUDY FOR SAN GORGONIO PASS WATER AGENCY
 DAVID TAUSSIG & Associates, Inc. CAPACITY FEE STUDY FOR SAN GORGONIO PASS WATER AGENCY JULY 21, 2015 Public Finance Facilities Planning Urban Economics Newport Beach Riverside San Francisco Chicago CAPACITY
TECHNICAL MEMORANDUM Summerhill Rd Texarkana, Texas fax
 TECHNICAL MEMORANDUM 5930 Summerhill Rd Texarkana, Texas 75503 903 838 8533 fax 903 832 4700 TO: Becky Griffith, Jon Jarvis FROM Spandana Tummuri SUBJECT: Technical Memorandum on IP Analysis PROJECT: Sulphur
Special Publication SJ2004-SP27. Affordability Analysis of Alternative Water Supply
 Special Publication SJ2004-SP27 of Alternative Water Supply of Alternative Water Supply Technical Memorandum February 9, 2004 TABLE OF CONTENTS Section Page EXECUTIVE SUMMARY i A. Background and Scope
ckly STAFF REPORT Trish Rhay, Assistant Director of Public Works Caitlin Sims, Senior Management Analyst
 Subject: Distribution of Water Rates Public Notice Phase 1: Five-Year Rate Review and Adjustment to Address Revenue Phase 2: WEP Unit Capital Charge and Cost of Service Study. With that direction, staff
2015 Water Resources Status Report
 CITY OF SAN LUIS OBISPO 2015 Water Resources Status Report This Report Covers the Time Period of October 1, 2014 through September 30, 2015 Salinas Reservoir Dam, February 2015. Photo credit: County of
Irrigation District Efficiencies and Potential Water Savings in the Lower Rio Grande Valley of Texas
 Irrigation District Efficiencies and Potential Water Savings in the Lower Rio Grande Valley of Texas Guy Fipps and Craig Pope1 Abstract Agriculture holds about 90 percent of all the water rights in the
Over 150 Years of Irrigation Implications for Montana s Water Resources
 Over 150 Years of Irrigation Implications for Montana s Water Resources Alters hydrographs Water storage; recharge Changes timing of flow Ginette Abdo Montana Bureau of Mines and Geology March 10, 2016
MASTER WATER SYSTEM DESIGN REPORT DESERT TRAILS
 MASTER WATER SYSTEM DESIGN REPORT FOR DESERT TRAILS SURPRISE, ARIZONA Prepared for: HE Capital Fox Trails, LLC 2850 E. Camelback Road Suite 110 Phoenix, Arizona 85016 1 st Submittal February, 2009 2 ND
Lake County Success. support through synergistic local partnerships that not only mitigate, but also produce
 Lake County Success Generating Environmental Gains With Geothermal Power By Mark Dellinger, Administrator, Lake County (CA) Sanitation District, and Eliot Allen, Principal, Criterion/Planners Engineers
Feasibility Study for Groundwater Availability for Spring Creek Creation at Squalicum Creek Park
 Feasibility Study for Groundwater Availability for Spring Creek Creation at Squalicum Creek Park Prepared for: City of Bellingham Public Works Department Environmental Resource Division 210 Lottie St.
WATER SYSTEM STORAGE TANK EVALUATION. Southborough, Massachusetts PREPARED FOR:
 R EPORT Pare Project No. 0876.8 WATER SYSTEM STORAGE TANK EVALUATION Southborough, Massachusetts PREPARED FOR: Town of Southborough Department of Public Works 8 Cordaville Road Southborough, MA PREPARED
Importance of Rural Water to Southern Iowa s Livestock Industry. Forty-Second Annual Cornbelt Cow-Calf Conference
 Importance of Rural Water to Southern Iowa s Livestock Industry Forty-Second Annual Cornbelt Cow-Calf Conference Rural Water in Iowa Rathbun Regional Water Association The largest rural water system in
WESTERN ENGINEERING CONSULTANTS, Inc LLC
 WESTERN ENGINEERING CONSULTANTS, Inc LLC 127 S. Denver Avenue, Ft. Lupton CO 80621 2501 Mill St. Brush, CO 80723 Ph. 303-913-7341, Fax 720-294-1330 Email: firstname.lastname@westerneci.com August 24, 2017
Utah State Group: Lake Powell Pipeline. Meaghan Stertzer Jon Flechsenhaar Christian Nelson Brandon Shepherd
 Utah State Group: Lake Powell Pipeline Meaghan Stertzer Jon Flechsenhaar Christian Nelson Brandon Shepherd Utah 1922 Colorado River Compact 23% water right equalling to 1.71 million acre feet/year 2nd
FREELAND WATER AND SEWER DISTRICT HARBOR HILL COMMUNITY ASSOCIATION WATER SYSTEM CONSOLIDATION STUDY REPORT
 FREELAND WATER AND SEWER DISTRICT ISLAND COUNTY WASHINGTON HARBOR HILL COMMUNITY ASSOCIATION WATER SYSTEM CONSOLIDATION STUDY REPORT G&O #16524 APRIL 2017 TABLE OF CONTENTS INTRODUCTION...1 EXISTING SYSTEMS
Glossary Irrigation Terminology
 Glossary Irrigation Terminology ANGLE VALVE A valve configured so its outlet is oriented 90 from its inlet. In irrigation, these valves are generally installed with the inlet at the bottom of the valve.
Frequently Asked Questions - Fire Suppression Water Systems
 Frequently Asked Questions - Fire Suppression Water Systems 1) What is the Auxiliary Water Supply System, and what is its primary function? The Auxiliary Water Supply System (AWSS) is a non-potable fire-suppression
NZQA registered unit standard version 4 Page 1 of 5
 Page 1 of 5 Title Describe drinking-water supply reticulation systems Level 5 Credits 8 Purpose People credited with this unit standard are able to describe: the reticulated services found on public and
Central Oregon Irrigation District
 Central Oregon Irrigation District On-Farm Water Conservation Report Prepared by: Black Rock Consulting 320 SW Upper Terrace Drive, Suite #102, Bend, Oregon 97702 (541) 480-6257 & Farmers Conservation
Cypress Waters: TIF Plan and MOU Amendments, Related Service Plan/Development Agreements and Boundary Adjustments
 Cypress Waters: TIF Plan and MOU Amendments, Related Service Plan/Development Agreements and Boundary Adjustments Economic Development Committee June 1, 2015 Purpose Update status of Cypress Waters project
CITY OF LYNWOOD. Specification for Correlator-Based Leak Detection Study
 CITY OF LYNWOOD Request for Proposals (RFP) for Specification for Correlator-Based Leak Detection Study Date: November 16, 2011 Department: Project Name: Public Works Specification for Correlator-Based
Purpose of the Comprehensive Water System Plan
 2006 TACOMA WATER COMPREHENSIVE WATER SYSTEM PLAN UPDATE EXECUTIVE SUMMARY Purpose of the Comprehensive Water System Plan Tacoma Water s planning activities center on the need to meet increasing demands
The following words and terms shall have the following meanings unless the context indicates otherwise:
 SUBCHAPTER 6. WATER SUPPLY MANAGEMENT ACT RULES 7:19-6.1 Scope and Authority (a) The Statewide Water Supply Master Plan represents the planning mechanism by which the State approaches its water needs.
Ag Water Energy Center at Fresno State
 Water Use Efficiency for Grapes and Almonds Presented by the (CIT) California State University, Fresno Ag Water Energy Center at Fresno State The Designers and Managers of the Program: Water and Energy
2016 ANNUAL ICR AND TRR WELL FIELD REPORT ICR WATER USERS ASSOCIATION
 2016 ANNUAL ICR AND TRR WELL FIELD REPORT Prepared for ICR WATER USERS ASSOCIATION Prepared By William Meyer 1 2016 ANNUAL ICR AND TRR WELL FIELD REPORT PURPOSE OF THE REPORT This report is one of an annual
Master Plan of Storm Drainage for East Garden Grove Wintersburg Channel Tributary Area
 CITY OF ANAHEIM Master Plan of Storm Drainage for East Garden Grove Wintersburg Channel Tributary Area JANUARY 2006 VOLUME 1 Table of Contents VOLUME 1 1. Executive Summary... 1 1.1 General... 1 1.2
INFLOW DESIGN FLOOD CONTROL SYSTEM PLAN PLANT GREENE COUNTY ASH POND ALABMA POWER COMPANY
 INFLOW DESIGN FLOOD CONTROL SYSTEM PLAN PLANT GREENE COUNTY ASH POND ALABMA POWER COMPANY Section 257.82 of EPA s regulations requires the owner or operator of an existing or new CCR surface impoundment
CHAPTER 2 TECHNICAL APPROACH 2 TECHNICAL APPROACH
 CHAPTER 2 TECHNICAL APPROACH 2 TECHNICAL APPROACH The approach used in the update of the County of Hawaii WUDP was documented in the Project Description, as required by the Framework. The Project Description
SECTION 7: DEMAND MANAGEMENT MEASURES
 SECTION 7: DEMAND MANAGEMENT MEASURES 7.1 DOCUMENT REQUIREMENTS 7.1.1 UWMP Requirements This section will include the following: Describe how each water demand management measures are being implemented
Inflow Design Flood Control System Plan for Louisa Generating Station CCR Impoundment. MidAmerican Energy Company
 Control System Plan for Louisa Generating Station CCR Impoundment MidAmerican Energy Company October 10, 2016 Control System Plan for Louisa Generating Station CCR Impoundment Prepared for MidAmerican
CHAPTER 1 DESCRIPTION OF WATER SYSTEM
 CHAPTER 1 DESCRIPTION OF WATER SYSTEM This Chapter presents information on ownership and management of the water system, system history and background information, inventory of existing facilities, related
Variable Frequency Drive (VFD) Controlled Irrigation Pumps Analysis of Potential Rebate
 Controlled Irrigation Pumps Analysis of Potential Rebate") Variable Frequency Drive (VFD) Controlled Irrigation Pumps Analysis of Potential Rebate Well pumps, booster pumps, and a combination of the two are used throughout the agricultural sector to provide water
Variable Frequency Drive (VFD) Controlled Irrigation Pumps Analysis of Potential Rebate Well pumps, booster pumps, and a combination of the two are used throughout the agricultural sector to provide water
Water Distribution System Calibration Report
 Project Title: Studying Distribution System Hydraulics and Flow Dynamics to Improve Water Utility Operational Water Distribution System: Paris, Kentucky Project No.: 02-10-UK Grant No.: HSHQDC-07-3-00005
Section V WATER DISTRIBUTION SYSTEM DESIGN GUIDELINES
 Section V WATER DISTRIBUTION SYSTEM DESIGN GUIDELINES A. GENERAL 1. The following water system design guidelines are based on Federal, State and local health requirements and the Hilton Head No. 1 Public
III. INVENTORY OF EXISTING FACILITIES
 III. INVENTORY OF EXISTING FACILITIES Within the Growth Management Boundary, the existing storm drainage facilities are largely associated with development that has historically occurred in the ten drainage
PREPARE60 OVERVIEW 1
 PREPARE60 OVERVIEW 1 UTAH S WATER BUDGET Category Total precipitation 61,500,000 Used by vegetation & natural systems 53,789,000 Basin Yield 7,711,000 Compact decreases 535,000 Ground water mining increases
Forecasting Exempt Well Demand in Spokane County Presented by: Mike Hermanson Water Resources Specialist Spokane County Utilities
 Forecasting Exempt Well Demand in Spokane County Presented by: Mike Hermanson Water Resources Specialist Spokane County Utilities Exempt Well Conference May 17, 2011 Background Spokane County Water Demand
ARIZONA CONSERVATION REQUIREMENTS. Management Plans MUNICIPAL CONSERVATION REQUIREMENTS
 ARIZONA CONSERVATION REQUIREMENTS Management Plans The Arizona Groundwater Management Code establishes the legal framework for conserving water in Arizona's most populous areas. To help achieve its goals,
City and County of Broomfield, Colorado CITY COUNCIL AGENDA MEMORANDUM. 11f - Page 1
 To: From: Prepared by: Agenda Title: CITY COUNCIL AGENDA MEMORANDUM Mayor and City Council Charles Ozaki, City and County Manager Jim Becklenberg, Assistant City and County Manager David Allen, Director
City of Surrey, ND Municipal Infrastructure Needs Assessment September 2012
 City of Surrey, ND Municipal Infrastructure Needs Assessment September 2012 Project made possible by US Dept. of HUD Regional Substantiality Planning Grant and ND Energy Development Infrastructure and
Hydraulic Modeling Predicting and Resolving Water Quality Issues
 Alliance of Indiana Rural Water September 21, 2016 Hydraulic Modeling Predicting and Resolving Water Quality Issues Jim McNulty, P.G. Strand Associates, Inc. The content of this presentation is not to
HOW TO SAVE COSTS AND IMPROVE SUSTAINABILITY WHILE REDUCING EFFLUENT NITROGEN
 HOW TO SAVE COSTS AND IMPROVE SUSTAINABILITY WHILE REDUCING EFFLUENT NITROGEN Introduction Donna Kaluzniak, CEP, Utility Director, City of Atlantic Beach, Florida John E. Collins, Jr., P.E., J. Collins
Farm Turnout Flow Recommendations. for New Outlets in. Cameron County Irrigation District No. 2 1
 Farm Turnout Flow Recommendations for New Outlets in Cameron County Irrigation District No. 2 1 A Report prepared for the Bureau of Reclamation Cameron County Irrigation District No. 2 December 10, 2002
MEMO I N T E O F F I C E
 I N T E R O F F I C E MEMO To: Diana Mikula, Interim-Village Manager From: Scott Shirley, Director of Public Works Thomas F. Kuehne, Finance Director/Treasurer Date: August 15, 2014 Subject: PROPOSED FIVE-YEAR
GUIDELINE FOR PROVIDING WATER AND SEWER SERVICE TO DEVELOPER PROJECTS AND PUBLIC OR PRIVATE PROPERTIES
 Public Works Department Water & Wastewater Services WATER & WASTEWATER ENGINEERING DIVISION 2555 West Copans Road Pompano Beach, Florida 33369 954-831-0745 FAX 954-831-0798/0925 GUIDELINE FOR PROVIDING
HALL COUNTY DEPT OF PUBLIC WORKS & UTILITIES Page 1 of 8 Reuse Water End User Application
 Page 1 of 8 Reuse Water End User Application Hall County s Reclaimed Water System is currently available in select areas of the County. This packet details the various benefits of reclaimed water and the
AALSO Summary of Formulas needed for Levels I, II and III.
 AALSO Summary of Formulas needed for Levels I, II and III. The information provided below is used in the math portion of the proficiency exams. Please take time to review and learn how to use these formulas
Secondary Water Systems for Landscape Irrigation: Issues and Opportunities
 Secondary Water Systems for Landscape Irrigation: Issues and Opportunities Stephen W. Smith 1 ABSTRACT Secondary or dual water systems are described as those providing pressurized raw water for landscape
Water System Modeling A Unique Way to Use Meter Technology. John Brady, PE x 1121
 Water System Modeling A Unique Way to Use Meter Technology John Brady, PE 610-373-6667 x 1121 jbrady@entecheng.com Steve Riley, PE NE MD Client Manager John Brady, PE Hydraulic Modeler Engineering Consultant