|
|
|
- Kellie Carson
- 6 years ago
- Views:
Transcription
1
2

3
4
5
6
7
8
9
10
11

12 DRINKING WATER IMPACT FEE FACILITY PLAN AND IMPACT FEE ANALYSIS (HAL Project No.: ) OCTOBER 2017

 Steven C. Jones, P.E.")
13 CITY OF SARATOGA SPRINGS DRINKING WATER IMPACT FEE FACILITY PLAN AND IMPACT FEE ANALYSIS (HAL Project No.: ) Steven C. Jones, P.E. Project Engineer OCTOBER 2017
14 IMPACT FEE CERTIFICATION The Utah Impact Fee Act requires certifications for the Impact Fee Facilities Plan (IFFP) and the Impact Fee Analysis (IFA). Hansen, Allen & Luce provides these certifications with the understanding that the recommendations in the IFFP and IFA are followed by City Staff and elected officials. If all or a portion of the IFFP or IFA are modified or amended, or if assumptions presented in this analysis change substantially, this certification is no longer valid. All information provided to Hansen, Allen & Luce, Inc. is assumed to be correct, complete, and accurate. IFFP Certification Hansen, Allen & Luce, Inc. certifies that the Impact Fee Facilities Plan (IFFP) prepared for the drinking water system: 1. includes only the costs of public facilities that are: a. allowed under the Impact Fees Act; and b. actually incurred; or c. projected to be incurred or encumbered within six years after the day on which each impact fee is paid; 2. does not include: a. costs of operation and maintenance of public facilities; b. costs for qualifying public facilities that will raise the level of service for the facilities, through impact fees, above the level of service that is supported by existing residents; c. an expense for overhead, unless the expense is calculated pursuant to a methodology that is consistent with generally accepted cost accounting practices and the methodological standards set forth by the federal Office of Management and Budget for federal grant reimbursement; and 3. complies in each and every relevant respect with the Impact Fees Act. HANSEN, ALLEN & LUCE, INC. IFA Certification Hansen, Allen & Luce, Inc. certifies that the Impact Fee Analysis (IFA) prepared for the drinking water system: 1. includes only the costs of public facilities that are: a. allowed under the Impact Fees Act; and b. actually incurred; or c. projected to be incurred or encumbered within six years after the day on which each impact fee is paid; 2. does not include: a. costs of operation and maintenance of public facilities; b. costs for qualifying public facilities that will raise the level of service for the facilities, through impact fees, above the level of service that is supported by existing residents; c. an expense for overhead, unless the expense is calculated pursuant to a methodology that is consistent with generally accepted cost accounting practices and the methodological standards set forth by the federal Office of Management and Budget for federal grant reimbursement; d. offsets costs with grants or other alternate sources of payment; and 3. complies in each and every relevant respect with the Impact Fees Act. HANSEN, ALLEN & LUCE, INC.
15 TABLE OF CONTENTS Page No IMPACT FEE SUMMARY iii SECTION 1 INTRODUCTION 1.1 Background Purpose Impact Fee Collection Master Planning CHAPTER 2 EXISTING DRINKING WATER SYSTEM 2.1 General Pressure Zones Existing City Secondary Water System Existing Equivalent Residential Connections Methodology Used to Determine Existing System Capacity Water Source & Remaining Capacity Storage Facilities & Remaining Capacity Water Rights & Remaining Capacity Distribution System Capital Facilities to Meet System Deficiencies CHAPTER 3 IMPACT FEE CALCULATION 3.1 General Growth Projections Cost of Existing and Future Facilities Revenue Options Impact Fee Unit Calculation Total Impact Fee Calculation for a Typical Single Family Residence i
16 LIST OF FIGURES Page No Figure 2-1: Existing System... After 2-8 Figure 3-1: Impact Fee Improvements... After 3-7 LIST OF TABLES Table 2-1: Existing Water Sources Table 2-2: Existing Pump Station Summary by wsfu Table 2-3: Existing Pump Station Summary by GPM Table 2-4: Existing Fire Suppression Storage by Zone Table 2-5: Existing Storage Tank Summary Table 3-1: Residential Building Permit History Table 3-2: Growth Projections Table 3-3: Cost of Existing Facilities Table 3-4: Cost of Future Facilities Table 3-5: Facility Cost by Time Period Table 3-6: Indoor Water Capacity Cost Table 3-7: Indoor Water Capacity Cost per wsfu Table 3-8: Fire Flow Capacity Impact Fee Cost Distribution Unit Table 3-9: Water Rights Needed by Table 3-10: Water Rights Excess Capacity Table 3-11: Additional Water Rights Needed by Table 3-12: Total Proposed Impact Fee per Typical Single Family Residence With Well Water Rights Table 3-13: Total Proposed Impact Fee per Typical Single Family Residence With CUWCD Water APPENDICES Appendix A Existing Facilities Costs Appendix B Cost Estimates Appendix C CUWCD Water Costs ii
17 IMPACT FEE SUMMARY The purpose of the Impact Fee Facilities Plan (IFFP) and the Impact Fee Analysis (IFA) is to comply with the requirements of the Utah Impact Fees Act by identifying demands placed on the existing Drinking Water System by new development and by identifying the means by which the City will meet these new demands. This analysis is an update to the Culinary Water System IFFP and IFA prepared in 2014 to address changes in conditions and assumptions that result in a reduction in the proposed drinking water impact fee. The Drinking Water System Master Plan and Capital Facility Plan have also been updated to support this analysis. The significant change in this update is no remaining capacity of groundwater source is available for future growth. It is assumed all future source will be provided by Central Utah Water Conservancy District (CUWCD). As a result, it is recommended that the water right component of the impact fee be removed and the cost for source be reduced for those using CUWCD water because the City s wholesale connection capacity is less expensive than well capacity. The wholesale water has a much higher upfront cost and long term cost. However, the City has not paid and do not plan to pay the upfront costs of the wholesale water and the long term costs are not impact fee eligible. The impact fee service area is the drinking water system service area, which includes the current city boundary and future areas anticipated to be annexed into the city. There are two components to the drinking water impact fee. The first component is indoor water which includes: well source capacity, CUWCD source capacity, storage conveyance, associated pipelines and planning. The second component is fire flow. The impact fee unit for indoor water use is based on the International Plumbing Code (IPC), issued by the International Code Council as a method to size the water meter and piping by the number of water fixtures and the type of water fixtures a building has. Each fixture type is assigned a load value in water supply fixture units (wsfu). The impact fee unit for fire flow is based on fire suppression requirements specified by the International Fire Code (IFC), issued by the International Code Council. A fire flow impact fee distribution unit was calculated to represent the equitable distribution of the fire flow capacity cost for each fire flow requirement. The level of service for indoor drinking water supply is 10 gallons per day (gpd) per wsfu or 400 gpd per typical single family residential connection and maintaining a pressure of 40 pounds per square inch (psi). The level of service for fire flow is 1,500 gpm for 2 hours for a typical single family residential connection while maintaining a pressure of 20 psi. The existing system served about 6,494 connections at the beginning of Projected growth adds 7,403 equivalent connections (296,120 wfsu) in the next 10 years for a total of 13,897 connections or equivalent. The existing drinking water system has no existing deficiencies. The costs calculated for the capacity required for growth in the next 10 years comes from the proportional historical buy-in costs of excess capacity and new projects required entirely to provide capacity for the new development. The following table is a summary of the costs associated with providing capacity for growth in the next 10 years. iii
18 INDOOR WATER IMPACT FEE COSTS COMPONENT COST WELLS $1,459,048 CUWCD $59,958 SOURCE CONVEYANCE $9,740,497 STORAGE $4,093,020 WATER RIGHTS $0 PLANNING $140,000 TOTAL COST $15,492,523 The indoor water impact fee is calculated based on whether the new development has well water rights or if source water capacity will be purchased from CUWCD. This will allow for development to pay their fair share of the facilities used for the source water available to the development. The projected growth in the next 10 years is 296,120 wfsu or 7,403 equivalent residential connections. The wells have 162,880 wsfu of remaining capacity. Therefore the 133,240 wsfu of remaining source capacity needed is assumed to come from CUWCD over the next ten year window. The fee is $2,246 per typical single family connection or $56.14 per wsfu for those with well water rights. The fee is $1,905 per typical single family connection or $47.63 per wsfu for those acquiring source water from CUWCD. Fire flow impact fee costs attributed to growth in the next 10 years is $3,056,881. A fire flow impact fee distribution unit was calculated to represent the equitable distribution of the fire flow capacity cost for each fire flow requirement. The following table is the per connection fire flow impact fee for each fire flow requirement. FIRE FLOW IMPACT FEE Fire Flow Requirement (gpm) Fire Flow Duration Requirement (hours) Fee per Connection 1,500 2 $285 1,750 2 $599 2,000 2 $1,044 2,250 2 $1,704 2,500 2 $2,768 2,750 2 $4,674 3,000 3 $26,777 3,250 3 $33,994 3,500 3 $43,467 3,750 3 $57,245 4,000 4 $249,224 iv
19 The impact fee for a typical single family residential connection requiring 40 wsfu, using well water rights, and requiring a 1,500 gpm fire flow would have an impact fee of $2,531 (see the following table). TOTAL PROPOSED IMPACT FEE PER TYPICAL SINGLE FAMILY CONNECTION WITH WELL WATER RIGHTS Component Per WSFU Per Typical Residential Connection Indoor Water $56 $2,246 Fire Flow $7 $285 Total (source capacity from well water rights) $63 $2,531 Note: 40 wsfu = 1 Typical residential connection The typical single family residential connection requiring 40 wsfu, purchasing source water capacity from CUWCD, and requiring a 1,500 gpm fire flow would have an impact fee of $2,190 (see the following table). This includes $1,905 for indoor water capacity and $285 for fire flow capacity. TOTAL PROPOSED IMPACT FEE PER TYPICAL SINGLE FAMILY CONNECTION WITH CUWCD WATER Component Per WSFU Per Typical Residential Connection Indoor Water $48 $1,905 Fire Flow $7 $285 Total (source capacity from CUWCD) $55 $2,190 Note: 40 wsfu = 1 Typical residential connection v
20 SECTION 1 INTRODUCTION 1.1 Background The City of Saratoga Springs has experienced tremendous growth since the early 2000 s that has transformed the once largely agricultural community into an urbanized region of northern Utah County. Residential and commercial developments are being established at a rapid pace with additional open space available for future growth. As this growth continues additional drinking water facilities will be required to provide an adequate water system that meets the City s current level of service for indoor water use. The City has recognized the importance to plan for increased demands on its drinking water system from new development as a result of the rapid growth. A Drinking Water Impact Fee Facilities Plan (IFFP) and Impact Fee Analysis (IFA) update was required to address changes in conditions and assumptions that result in a reduction in the proposed drinking water impact fee. The Drinking Water System Master Plan and Capital Facility Plan have also been updated to support this analysis. 1.2 Purpose The purpose of the IFFP and IFA is to comply with the requirements of the Utah Impact Fees Act by identifying demands placed on the existing Drinking Water System by new development and by identifying the means by which the City will meet these new demands. This analysis is an update to the Culinary Water System IFFP and IFA prepared in 2014 to address changes in conditions and assumptions that result in a reduction in the proposed drinking water impact fee. The Drinking Water System Master Plan and Capital Facility Plan have also been updated to support this analysis. The significant change in these updates is no remaining capacity of groundwater source is available for future growth. This report identifies those items that the Utah Impact Fees Act specifically requires including demands placed upon existing facilities by new development activity and the proposed means by which the municipality will meet those demands. In preparing this report a systematic approach was utilized to evaluate the existing and planned drinking water facilities identified in the City s master planning efforts. Each facility s capacity was evaluated in accordance with the selected level of service to determine the appropriate share between existing demand and future demands. This approach was taken in order to determine the proportional share of improvement costs between existing users and future development users. The basis for this report was to provide proposed project costs and the fractional cost associated with future development. The following analyses were performed to meet the study s objectives: 1) Identify the existing and proposed City drinking water facilities; 2) Identify the existing level of service for the system; 3) Identify a proposed level of service for the system; 1-1
21 4) Identify if any deficiencies are present in the existing system utilizing the proposed level of service; 5) Identify any excess capacity in the existing system facilities using the proposed level of service; 6) Identify the phasing of new development and the appropriate facilities needed to support the development; 7) Project growth in water demands attributable to new development within the existing system; 8) Determine projects required by the new water demands to provide the proposed level of service to future development without compromising the level of service provided to existing residents; 9) Establish construction phasing of proposed capital facilities; 10) Prepare detailed cost estimates for each proposed project; 11) Determine if proposed projects will provide capacity for growth beyond the IFFP planning period 12) Separate and identify infrastructure costs to maintain the proposed level of service for existing residents versus infrastructure costs to provide capacity at the proposed level of service for future development, and then identify and subtract the proportionate cost of any excess capacity for growth that is projected to occur beyond the 10 year planning window for the IFFP; 1.3 Impact Fee Collection Impact fees enable local governments to finance public facility improvements necessary to service new developments without burdening existing development with capital facilities construction costs that are exclusively attributable to growth. An impact fee is a one-time charge on new development to pay for that portion of a public facility that is required to support that new development. In order to determine the appropriate impact fee, the cost of the facilities associated with future development must be proportionately distributed. As a guideline in determining the proportionate share, the fee must be found to be roughly proportionate and reasonably related to the impact caused by the new development. 1.4 Master Planning The Drinking Water System Master Plan and Capital Facility Plan have also been updated to support this analysis. The master plan for the City s drinking water system is more comprehensive than the IFFP and IFA. It provides the basis for the IFFP and IFA as well as identifies all Capital Facilities required of the Drinking Water System for the 20-year planning range including maintenance, repair, replacement, as well as growth related project recommendations. The recommendations made within the master plan are in compliance with current City policies and standard engineering practices. 1-2
22 A hydraulic model of the Drinking Water System was prepared to aid in the analyses performed to complete the Drinking Water System Master Plan. The model was used to assess existing performance, level of service, to establish a proposed level of service and to confirm the effectiveness of the proposed capital facility projects to maintain the proposed level of service over the next 10 years. 1-3
23 SECTION 2 EXISTING DRINKING WATER SYSTEM 2.1 General The purpose of this section is to provide information regarding the existing Drinking Water System, identify the current level of service, and analyze the remaining capacity of the existing system s facilities. Saratoga Springs existing drinking water system is comprised of a pipe network, water storage facilities, and water sources. These facilities are found within three separate pressure zones. Figure 2-1 illustrates the existing water system that services the entire City. 2.2 Pressure Zones Currently, the drinking water distribution system serving Saratoga Springs has three pressure zones. Zone 2 and 3 are split north and south as they are not interconnected. The pressure zones were designed to provide pressures between psi. 2.3 Existing City Secondary Water System To preserve drinking water sources, the City has a Secondary Water System that provides outdoor irrigation. The secondary system is master planned to be an independent system, but currently the Secondary Water System can be supplemented by excess capacity in the Drinking Water System. Separate drinking water and secondary water pipelines exist in all developments. However, a few isolated developments currently rely on the Drinking Water System to provide storage and source water to the secondary water pipelines. As the excess capacity in the Drinking Water System is needed for future growth, Secondary Water System facilities will be constructed to increase the capacity of the Secondary Water System. A Secondary Water System Master Plan was prepared in conjunction with the Drinking Water System Master Plan. For both the Drinking Water System Master Plan and the Secondary Water System Master Plan each system was analyzed with no sharing of capacity for future projections. It was assumed for all calculations that no Secondary Water System facilities are being supplemented by Drinking Water System capacity. Additional information regarding the Secondary Water System may be found in Secondary Water System Master Plan, IFFP, and IFA. 2.4 Existing Equivalent Residential Connections Water demands from non-residential water users, such as commercial, industrial, or civic water users have been converted to an Equivalent Residential Unit (ERC) for analytical purposes. The use of ERCs is a common engineering practice to describe the entire system s usage based upon a common unit of measurement. An ERC is equal to the average demand of one 2-1
24 residential connection. The method of using ERCs for analysis is a way for allocating existing and future demands over non-residential land uses. An ERC quantifies the ratio of nonresidential water demands relative to an equivalent residential level of service demand. For this analysis all residential connections, including townhouses and apartments were equated to one ERC for indoor water demands. The City assigns non-residential development an ERC value based on a fixture count that is performed at the issuance of the Building Permit. The fixture count is based on the International Plumbing Code (IPC), issued by the International Code Council. The IPC fixture count method was developed to predict water use for various fixture types. Each fixture type is assigned a load value in water supply fixture units (wsfu). For example, a kitchen sink has a load factor of 1.4 wsfu based on how much water is used at a kitchen sink. A typical residential toilet has a load factor of 2.2 wsfu because a toilet uses more water than a kitchen sink. Once all the fixtures are identified, all the fixture units are added together for a total fixture unit count. One ERC is equivalent to 40 wsfu. At the end of 2016, the City s database had a total of 6,494 ERCs. For a validation of the City s ERC calculation, past water meter information was used to calculate an ERC for each nonresidential connection based on actual drinking water use. For example, a non-residential connection with an average usage 20 times more than the average day residential usage was assigned an ERC of 20. Even though ERC s were used to quantify existing demand and to predict future demand for the Master Plan, it is recommended that the City continue to use the IPC fixture count method to calculate predicted demand of new development. The level of service provided by the Drinking Water System has been established by the City to provide a reasonable supply of indoor water, fire suppression capacity, and water rights to assure that the system does not run out of water. This level of service establishes the sizing criteria for the City s distribution (pipelines), source, storage facilities, and water rights for the Drinking Water System. The level of service standards are provided below: Indoor Water Supply Well Source Capacity: 10 gpd per wsfu plus 10 gpd per wsfu for redundancy Pump Station Source Capacity: 10 gpd per wsfu plus 10 gpd per wsfu for redundancy Wholesale Indoor Water Source Capacity: 10 gpd per wsfu Indoor Water Storage Capacity: 10 gpd per wsfu Pipe Capacity: 40 psi minimum during peak day demand conditions and 30 psi minimum during peak instantaneous conditions Well and pump station sources require more capacity than source supplied by a wholesale connection because it cannot be assumed that pumps run 100% of the time. Also, redundant 2-2
25 pumps are required to provide source when primary pumps fail. Wholesale connections rely on the redundancy provided by the wholesaler and do not rely on mechanical facilities maintained by the City. Fire Suppression Minimum Fire Flow: 1,500 gpm for 2 hours (180,000 gallons) as directed by the Fire Marshall from the International Fire Code (IFC), issued by the International Code Council. Maximum Fire Flow: 4,000 gpm for 4 hours (960,000 gallons) as directed by the Fire Marshall from the IFC. Fire Suppression Storage Capacity: as required by the Fire Marshall (see Table 2-4 for a summary of fire suppression storage by pressure zone) Minimum Pressure: 20 psi residual during peak day + fire flow event Water Rights Yearly Volume: 10 gpd per wsfu (0.011 ac-ft per wsfu) 2.5 Methodology Used to Determine Existing System Capacity The method for determining the remaining capacity in the system for indoor water supply was based on the defined level of service in terms of wsfu. Each component of the Drinking Water System was assessed a capacity in terms of wsfu. The components include: Source (wells, wholesale connections, and pump stations), Storage (tanks and associated transmission lines), Fire Suppression (storage and main transmission line capacity associated with providing fire suppression capacity), and water rights. Each component was also assigned a number of existing wsfu currently using each component. The difference between the wsfu capacity and wsfu existing demand for each component is the remaining capacity. For example, to calculate the remaining capacity for source in wsfu, the required source for existing users in wsfu is subtracted from the capacity of the wells in wsfu. For storage, the required storage for existing users in wsfu is subtracted from the capacity of the tanks in wsfu to calculate the remaining capacity for storage in wsfu. A hydraulic model was developed for the purpose of assessing system operation and capacity. For pipelines, the model was used to calculate a capacity in terms of wsfu for each pipeline and to assign capacity for indoor water use and fire suppression. The capacity for each pipeline in wsfu is estimated by the flow capacity of the pipe at a velocity of 5 feet per second subtracted by the minimum fire flow requirement of 1,500 gpm and dividing the remainder by 10 gpd per wsfu. The transmission pipelines out of Tanks 4, 5, 6 and 7 down to the first intersection include a fire flow capacity of 2,000 gpm and larger based on the fire flow assumed from these tanks. Capacity, demand and remaining capacity is presented in the following paragraphs for each component of the Drinking Water System. 2-3
26 2.6 Water Source & Remaining Capacity Drinking water source primarily comes from groundwater wells. However, the City has also begun using Central Utah Water Conservancy District (CUWCD) to provide drinking water source. There is additional physical groundwater and water right capacity remaining, but this is mostly in the form of water right credit owned by developers. An assessment of available water rights and physical groundwater capacity of drinking water quality is limited. Once the capacity is gone, all future drinking water source and water rights will be from CUWCD. All current wells, located on the eastern border of the City, are actively used throughout the year on a rotating basis. The active wells are equipped with either submersible or vertical turbine pumps. These wells provide the well source capacity level of service of 10 gpd/wsfu for indoor water use and 10 gpd/wsfu for redundancy. For the summer of 2016 and 2017, several of the drinking water wells are producing half capacity due to groundwater and well conditions. Because of the lack of excess redundancy capacity available to supplement the secondary water system, CUWCD water needed to be purchased earlier than planned. Table 2-1 summarizes the information of each well and all sources total. A wsfu count was not allocated to specific wells as all sources are in the same zone. Currently the City has chlorination stations at Wells 2 and 6. Table 2-1 Existing Water Sources Name Capacity (gpm) Capacity (wsfu) Existing Demand (gpm) Existing Demand (wsfu) Remaining Capacity (gpm) Remaining Capacity (wsfu) Well No. 1 1,000 72, Well No. 2 1,020 73, Well No. 3 1, , Well No. 4 1,000 72, Well No. 6 1,100 79, TOTAL 5, ,640 3, ,760 2, ,880 The City operates pump stations to move water from a lower zone to a higher zone. These pump stations provide the water source to the upper zones and therefore must meet the pump station source capacity level of service of 10 gpd/ wsfu for indoor use and 10 gpd/ wsfu for redundancy. Table 2-2 is a summary of the pump station information for drinking water demands in units of wsfu. Table 2-3 is a summary of the pump station information for drinking water demands in GPM. 2-4
27 Table 2-2 Existing Pump Station Summary by wsfu Zone Name Capacity (wsfu) Existing Demand (wsfu) Remaining Capacity (wsfu) 2 South PS 1 (Grandview) 180,000 82,160 97,840 2 North PS 2 (Harvest Hills) 72,000 54,576 17,424 2 North Crossroads Blvd 144,000 24, ,952 3 North PS 3 (Harvest Moon) 36,000 9,504 26,496 3 South PS 4 (Fox Hollow) 313,200 2, ,248 Table 2-3 Existing Pump Station Summary by GPM Zone Name Capacity (gpm) Existing Demand (gpm) Remaining Capacity (gpm) 2 South PS 1 (Grandview) 2,500 1,141 1,359 2 North PS 2 (Harvest Hills) 1, North Crossroads Blvd 2, ,666 3 North PS 3 (Harvest Moon) South PS 4 (Fox Hollow) 4, , Storage Facilities & Remaining Capacity Saratoga Springs currently operates seven buried concrete water storage tanks serving the City. Each pressure zone has at least one tank to provide storage. Storage requirements are determined on a per zone basis. Some fire flow is shared between zones through PRV s in the system to transfer water from a higher zone to a lower zone during fire events or high peak demands. The total storage capacity is million gallons. All tanks were constructed in the last 15 years and are in good condition. The storage level of service is 10 gallons of storage per wsfu plus fire flow storage. The fire flow storage requirements were provided by the Fire Marshall as per IFC. The amount of fire suppression storage was assigned to each tank based on available capacity for fire storage in the tank, the amount of fire flow in the pressure zone or zones the tank can serve, and the 2-5
28 capacity of the transmission lines from the tank to where the largest fire flows are required. The required fire storage capacity and existing capacity for each pressure zone is found in Table 2-4. The capacity of each tank was analyzed in respect to the zone it serves. It was assumed that storage in upper pressure zones could assist in providing a portion of the required fire flow demand to a lower zone. Table 2-5 is a summary of the storage facility information. Capacity calculations are shown in Table 2-5 for each tank and account for fire suppression storage volumes. Table 2-4 Existing Fire Suppression Storage by Zone Zone Fire Flow (GPM) Fire Duration (HOURS) Fire Storage (MG) Existing Fire Storage in Zone (MG) Existing Fire Storage From Upper Zones (MG) 1 4, North 3, South 4, North 2, South 2, Total The following are assumptions for fire flow storage at each tank: Tank 1-The recommended fire flow for Zone 1 is 4,000 gpm for 4 hours, or 0.96 MG. Tank 1 supplies about 1,000 gpm, or 0.24 MG. The remainder was assigned to Tanks 5 and 3. Tank 5-The recommended fire flow for Zone 1 is 4,000 gpm for 4 hours, or 0.96 MG. Tank 5 supplies about 2,000 gpm, or 0.48 MG. The remainder was assigned to Tanks 1 and 3. Tank 3-The recommended fire flow for Zone 2 North is 3,000 gpm for 3 hours, or 0.54 MG. Tank 3 supplies 0.30 MG. The remainder was assigned to Tank 4. Tank 3 may also supply fire flow to Zone 1. Tank 2-The recommended fire flow for Zone 2 South is 4,000 gpm for 4 hours, or 0.96 MG. Tank 2 supplies about 850 gpm, or 0.20 MG. The remainder was assigned to Tanks 6, 4, and
29 Tank 6-The recommended fire flow for Zone 2 South is 4,000 gpm for 4 hours, or 0.96 MG. Tank 6 supplies about 2,000 gpm, or 0.48 MG. The remainder was assigned to Tanks 2, 4, and 7. Tank 4-The recommended fire flow for Zone 3 North is 2,000 gpm for 2 hours, or 0.48 MG. Half of the requirement (1,000 gpm or 0.24 MG) was assigned to Tank 4. Tank 4 may also supply fire flow to Zone 2 North or Zone 2 South. Tank 7- The recommended fire flow for Zone 3 North is 2,000 gpm for 2 hours, or 0.48 MG. Half of the requirement (1,000 gpm or 0.24 MG) was assigned to Tank 7. Tank 7 may also supply fire flow to Zone 2 North. Table 2-5 Existing Storage Tank Summary Tank Zone Total Capacity (MG) Fire Storage (MG) Demand Storage (MG) Emergency Storage (MG) Remain. Capacity (MG) Total Capacity (wsfu) Remain. Capacity (wsfu) , , , N ,000 76, S ,000 38, S , , N ,000 71, S , ,000 Total , , Water Rights & Remaining Capacity The City owns a total of 10,391 acre-feet of water rights that can be used between their drinking and secondary water systems. The existing drinking water right demand at the proposed level of service of 10 gpd per wsfu is 2,922 acre-feet. The existing supply of water rights attributed to the drinking water system are 4,758 acre-feet. The existing remaining capacity in the drinking water system is 1,836 acre-feet. This excess capacity is water right credits owned by various developers within the City that previously deeded the water rights to the City in exchange for the credits. It is recommended that the City not collect impact fees for water rights in the drinking water system for the next ten years. Rather than paying impact fees to the City for new drinking water rights, new developments can utilize the credit they own, or if they do not have a credit, they can purchase a water right credit held by others or work with the City to contract CUWCD water. All water right volumes are annual diversions in acre-feet. 2-7
30 2.9 Distribution System Pipe diameters range from 6 inches to 20 inches, with the majority being 8 inches within subdivisions. The larger pipes in the system were provided as transmission lines to deliver water from sources and storage tanks and fire flow scenarios. All pipes are in good condition as they have been constructed within the last 15 years. The City s current standard allows for Ductile Iron Pipe (DIP) for pipe diameters of 24 inches and larger and Polyvinyl Chloride (PVC) pipe is allowed for pipes up to 24 inches. Figure 2-1 illustrates the existing distribution pipelines. The capacity of the distribution system is assumed to be accounted for in the source, storage and fire flow capacities since the pipeline sizes include a component of each Capital Facilities to Meet System Deficiencies The existing drinking water system meets the current level of service. 2-8
31 Tank 5 (Zone 1) UT Tank 4 (Zone 3) UT Tank 3 (Zone 2) UT ") B ") T North Turnout ") B ") B Well 4 ") W Well 6 ") W Well 3 ") W ") W Well 2 Well 1 ") WB ") B Tank 1 (Zone 1) UT Legend Tank 6 (Zone 2) UT UT Existing Tanks Date: 9/6/2017 Document Path: H:\Projects\360 - Saratoga Springs City\ Drinking Water Plans Update\GIS\Working\DW Existing.mxd ") W Existing Wells ") T Existing Turnout ") B Existing Pump Stations Existing Pipes DIAMETER Pressure Zones Zone 1 Zone 2 Zone 3 Zone 4 Zone Miles SARATOGA SPRINGS DRINKING WATER SYSTEM ") B Tank 2 (Zone 2) Tank 7 (Zone 3) UT UT Source: Esri, DigitalGlobe, GeoEye, Earthstar Geographics, CNES/Airbus DS, USDA, USGS, AEX, Getmapping, Aerogrid, IGN, IGP, swisstopo, and the GIS User Community EXISTING SYSTEM FIGURE 2-1
32 SECTION 3 IMPACT FEE CALCULATION 3.1 General This section relies on the data presented in the previous sections to calculate a proposed impact fee based on the appropriate proportion of cost of projects planned in the next 10 years to increase capacity for new growth and an appropriate buy-in cost of available existing excess capacity previously purchased by the City. The Drinking Water System facility projects planned in the next 10 years to increase capacity for new growth included within the impact fee are presented. Also included in this section are the possible revenue sources that the City may consider to fund the recommended projects. The three components of the impact fee are presented with the proposed fee. The Drinking Water System impact fee units include the indoor water capacity unit, fire flow capacity unit and the water right unit. 3.2 Growth Projections The development of impact fees requires growth projections over the next ten years. Growth projections for Saratoga Springs were made by evaluating the history of building permit issuance over the last decade as summarized in Table 2-4. Saratoga Springs experienced rapid growth at the beginning of 2000 followed by a cooling period from 2007 to 2010 with growth rebounding to a more moderately strong growth. The City has conservatively projected growth for the near future with stronger growth occurring in the near future due to projected development of large property owners. Total growth projections for the City through 2026 are summarized in Table 2-5. Growth projections were not changed from the 2014 impact fee analysis because growth projects over the last few years have been accurate. The existing system served about 6,494 connections at the beginning of Projected growth adds 7,403 ERCs (296,120 wfsu) in the next 10 years for a total of 13,897 ERCs (555,890 wfsu). 3-1
33 TABLE 3-1 RESIDENTIAL BUILDING PERMIT HISTORY Year Annual Residential Permits Annual Growth % % % % % % % % % % % % % % % % % 3-2
34 TABLE 3-2 GROWTH PROJECTIONS Year Total Projected ERCs Total Projected wsfu Annual Growth , , % , , % , , % , , % , , % , , % , , % , , % , , % , , % , , % , , % , , % , , % , , % , , % , , % , , % , , % , , % , , % 3-3
35 3.3 Cost of Existing and Future Facilities The facilities and costs presented in Table 3-3 are existing facilities with remaining buy-in capacity. The historical costs for the existing facilities come from City records. Costs and figures depicting these projects are included in Appendix A. The facilities and costs presented in Table 3-4 are proposed projects essential to maintain the current level of service while accommodating future growth within the next 10 years. The facility sizing for the future proposed projects was based on using the proposed level of service with growth projections provided by the City and hydraulic modeling. All future projects have a design life greater than 10 years, as required by the Impact Fee Act, and all of the projects are 100% growth-related. Each project has a detailed cost for each component of the drinking water impact fee: Wells, CUWCD (wholesale connections), Source Conveyance (transmission lines associated with source conveyance and pump stations), Storage (tanks and associated transmission lines), Fire (storage and main transmission lines associated with providing fire suppression capacity), Planning (costs related to preparing master plans, CFPs, IFFPs, IFFAs), and Water Rights. See Appendix B for cost estimate details of future projects. 3-4
36 TABLE 3-3 COST OF EXISTING FACILITIES PROJECT MAP ID* WELLS CUWCD SOURCE CONVEYANCE STORAGE FIRE WATER RIGHTS TOTAL Lake Mountain Mutual Purchase N/A $2,700,000 $0 $10,216,000 $4,710,000 $2,240,000 $1,134,000 $21,000,000 Lake Mountain Development Purchase (2005 Bond) N/A $417,014 $0 $1,262,621 $639,500 $755,047 $0 $3,074,183 Tank 5 (2006 Bond) N/A $0 $0 $0 $2,645,796 $2,236,090 $0 $4,881,886 Zone 2 South SID (2009 Bond) SAR. 156 $0 $0 $0 $1,579,763 $547,938 $0 $2,127,701 Water Right Purchases N/A $0 $0 $0 $0 $0 $2,088,825 $2,088, North Pipeline (SAR.159) SAR. 159 $0 $0 $186,278 $0 $310,809 $0 $497,087 Saratoga Rd Pipeline (SAR.163) SAR.163 $0 $0 $575,780 $0 $0 $0 $575,780 Booster Pump Station (SAR.140) SAR.140 $0 $0 $99,995 $0 $0 $0 $99, North Pipeline (SAR.115) SAR. 115 $0 $0 $0 $26,659 $65,022 $0 $91,681 Project - Fox Hollow Zone 3 1 $0 $0 $1,189,127 $1,405,223 $191,621 $0 $2,785,971 Talus Ridge Pipeline Upsizes 2 $0 $0 $65,294 $422,634 $106,690 $0 $594,618 Legacy Farms Pipeline Upsizes 3 $0 $0 $234,669 $0 $352,004 $0 $586,673 Harvest Point Com. Pipeline Upsize 4 $0 $0 $0 $0 $16,023 $0 $16,023 Fox Hollow N6 Pipeline Looping 5 $0 $0 $44,720 $0 $44,721 $0 $89,441 Zone 2 North Source 6 $0 $0 $729,324 $0 $339,980 $0 $1,069,304 Redwood Road Transmission 7 $0 $0 $402,640 $0 $409,603 $0 $812,243 Project CWP Turnouts Transmission 8 $0 $275,869 $0 $0 $0 $0 $275,869 Land Acquisition Cost for Well 4 N/A $124,968 $0 $0 $0 $0 $0 $124,968 TOTAL $3,241,982 $275,869 $15,006,448 $11,429,575 $7,615,548 $3,222,825 $40,792,247 * See Figures in Appendix A 3-5
37 TABLE 3-4 COST OF FUTURE FACILITIES PROJECT MAP ID* WELLS CUWCD SOURCE CONVEYANCE STORAGE FIRE PLANNING WATER RIGHTS TOTAL 2017 IFFP Project- Mt. Saratoga Zone3 Source/Storage 2017 IFFP Project- Mt. Saratoga Zone2 Storage 2025 IFFP Project- Pony Express CWP Turnout & Pump Station 2025 IFFP Project West CWP Turnout 1 $0 $0 $1,111,680 $1,970,200 $581,120 $0 $0 $3,663,000 2 $0 $0 $147,000 $2,700,000 $98,000 $0 $0 $2,945,000 3 $0 $350,000 $685,000 $0 $170,000 $0 $0 $1,205,000 4 $0 $346,000 $0 $0 $0 $0 $0 $346,000 Planning N/A $0 $0 $0 $0 $0 $140,000 $0 $140,000 TOTAL $0 $696,000 $1,943,680 $4,670,200 $849,120 $140,000 $0 $8,299,000 * See Figure 3-1 (Additional details on cost estimates are in Appendix B) 3-6
38 Legend UT UT ") B UT ") T ") T Future Turnout ")B UT Future Pumps Existing Tanks ") W Existing Wells ") T Existing Turnout ") B Existing Pump Stations Existing Pipes UT Proposed Tank ") B ") W Pressure Zones «2 Zone 2N 2 MG Tank 1,500 ft of 16-in Pipe Zone 1 Zone 2 Zone 3 UT UT ")B « West Turnout 2,000 ft of 16-in Pipe ") W ") T Zone 4 Zone 5 «1 Zone 3N 1.4 MG Tank 3,000 gpm Pump Station 1,700 ft of 16-in Pipe 5,600 ft of 12-in Pipe ") T ")B ") W ") W ") WB «3 Pony Express Turnout 2,250 gpm Pump Station 3,400 ft of 16-in Pipe UT UT Date: 7/19/2017 Document Path: H:\Projects\360 - Saratoga Springs City\ Drinking Water Plans Update\GIS\Working\DW Impact Fee Improvements.mxd Miles SARATOGA SPRINGS DRINKING WATER SYSTEM UT ") B UT Source: Esri, DigitalGlobe, GeoEye, Earthstar Geographics, CNES/Airbus DS, USDA, USGS, AeroGRID, IGN, and the GIS User Community IMPACT FEE IMPROVEMENTS FIGURE 3-1
39 Only those costs attributed to the new growth in the next 10 years can be included in the impact fee. Table 3-5 is a summary of the existing and future facility costs by Drinking Water System component and by time period. Existing costs are those costs attributed to capacity currently being used by existing connections. Costs attributed to the next 10 years are costs for the existing capacity or new capacity for the assumed growth in the next 10 years. Costs attributed to beyond 10 years are costs for the existing capacity or new capacity for the assumed growth beyond 10 years. TABLE 3-5 FACILITY COST BY TIME PERIOD EXISTING NEXT 10 YEARS BEYOND 10 YEARS TOTAL WELLS $1,782,934 $1,459,048 $0 $3,241,982 CUWCD $0 $59,958 $911,911 $971,869 SOURCE CONVEYANCE $5,520,489 $9,740,497 $1,689,142 $16,950,128 STORAGE $3,769,440 $4,093,020 $8,237,316 $16,099,776 FIRE $2,018,236 $3,056,881 $3,389,551 $8,464,668 WATER RIGHTS $3,222,825 $0 $0 $3,222,825 PLANNING $0 $140,000 $0 $140,000 TOTAL COST $16,313,924 $18,549,404 $14,227,920 $49,091, Revenue Options Revenue options for the recommended projects include: general obligation bonds, revenue bonds, State/Federal grants and loans, user fees, and impact fees. Although this analysis focuses on impact fees, the City may need to consider a combination of these funding options. The following discussion describes each of these options. 3-7
40 General Obligation Bonds through Property Taxes This form of debt enables the City to issue general obligation bonds for capital improvements and replacement. General Obligation (G.O.) Bonds would be used for items not typically financed through the Water Revenue Bonds (for example, the purchase of water source to ensure a sufficient water supply for the City in the future). G.O. bonds are debt instruments backed by the full faith and credit of the City which would be secured by an unconditional pledge of the City to levy assessments, charges or ad valorem taxes necessary to retire the bonds. G.O. bonds are the lowest-cost form of debt financing available to local governments and can be combined with other revenue sources such as specific fees, or special assessment charges to form a dual security through the City s revenue generating authority. These bonds are supported by the City as a whole, so the amount of debt issued for the water system is limited to a fixed percentage of the real market value for taxable property within the City. For growth related projects this type of revenue places an unfair burden on existing residents as they had previously paid for their level of service. Revenue Bonds This form of debt financing is also available to the City for utility related capital improvements. Unlike G.O. bonds, revenue bonds are not backed by the City as a whole, but constitute a lien against the water service charge revenues of a Water Utility. Revenue bonds present a greater risk to the investor than do G.O. bonds, since repayment of debt depends on an adequate revenue stream, legally defensible rate structure /and sound fiscal management by the issuing jurisdiction. Due to this increased risk, revenue bonds generally require a higher interest rate than G.O. bonds, although currently interest rates are at historic lows. This type of debt also has very specific coverage requirements in the form of a reserve fund specifying an amount, usually expressed in terms of average or maximum debt service due in any future year. This debt service is required to be held as a cash reserve for annual debt service payment to the benefit of bondholders. Typically, voter approval is not required when issuing revenue bonds. For growth related projects this type of revenue places an unfair burden on existing residents as they had previously paid for their level of service. State/Federal Grants and Loans Historically, both local and county governments have experienced significant infrastructure funding support from state and federal government agencies in the form of block grants, direct grants in aid, interagency loans, and general revenue sharing. Federal expenditure pressures and virtual elimination of federal revenue sharing dollars are clear indicators that local government may be left to its own devices regarding infrastructure finance in general. However, state/federal grants and loans should be further investigated as a possible funding source for needed water system improvements. It is also important to assess likely trends regarding federal / state assistance in infrastructure financing. Future trends indicate that grants will be replaced by loans through a public works revolving fund. Local governments can expect to access these revolving funds or public works trust funds by demonstrating both the need for and the ability to repay the borrowed monies, 3-8
41 with interest. As with the revenue bonds discussed earlier, the ability of infrastructure programs to wisely manage their own finances will be a key element in evaluating whether many secondary funding sources, such as federal/state loans, will be available to the City. User Fees Similar to property taxes on existing residents, user fees to pay for improvements related to new growth related projects places an unfair burden on existing residents as they had previously paid for their level of service. Impact Fees As discussed in Section 1, an impact fee is a one-time charge to a new development for the purpose of raising funds for the construction of improvements required by the new growth and to maintain the current level of service. Impact fees in Utah are regulated by the Impact Fee Statute and substantial case law. Impact fees are a form of a development exaction that requires a fee to offset the burdens created by the development on existing municipal services. Funding the future improvements required by growth through impact fees does not place the burden on existing residents to provide funding of these new improvements. 3.5 Impact Fee Unit Calculation Currently, the City assigns non-residential development an ERC value based on a fixture count that is performed at the issuance of the Building Permit. The fixture count is based on the International Plumbing Code (IPC), issued by the International Code Council as a method to size the water meter and piping by the number of water fixtures and the type of water fixtures a building has. Each fixture type is assigned a load value in water supply fixture units (wsfu). For example, a kitchen sink has a load factor of 1.4 wsfu based on how much water is used at a kitchen sink. A typical residential toilet has a load factor of 2.2 wsfu because a toilet uses more water than a kitchen sink. Once the total fixtures are identified, all the fixture units are added together for a total fixture unit count. The City also uses the IPC as the plumbing standards for plan reviews and building inspections. It is recommended that the City have three components to the impact fee for drinking water system facilities-- indoor water use, fire flow capacity, and water rights. Each component is discussed separately in the following paragraphs. Indoor Water Use Impact Fee Unit It is recommended that the City continue to use the IPC fixture unit (wsfu) count method to calculate an Indoor Water Impact Fee Unit. It is recommended that one impact fee unit be equal to a fixture count of 40, which is the recommended maximum fixture count for a ¾ inch meter. A fixture count of 40 and a ¾ inch meter size matches the existing and proposed level of service. It is recommended that the City continue the requirement of a ¾ inch meter being the minimum meter size allowed and a fixture count of 40 being the minimum indoor water impact 3-9
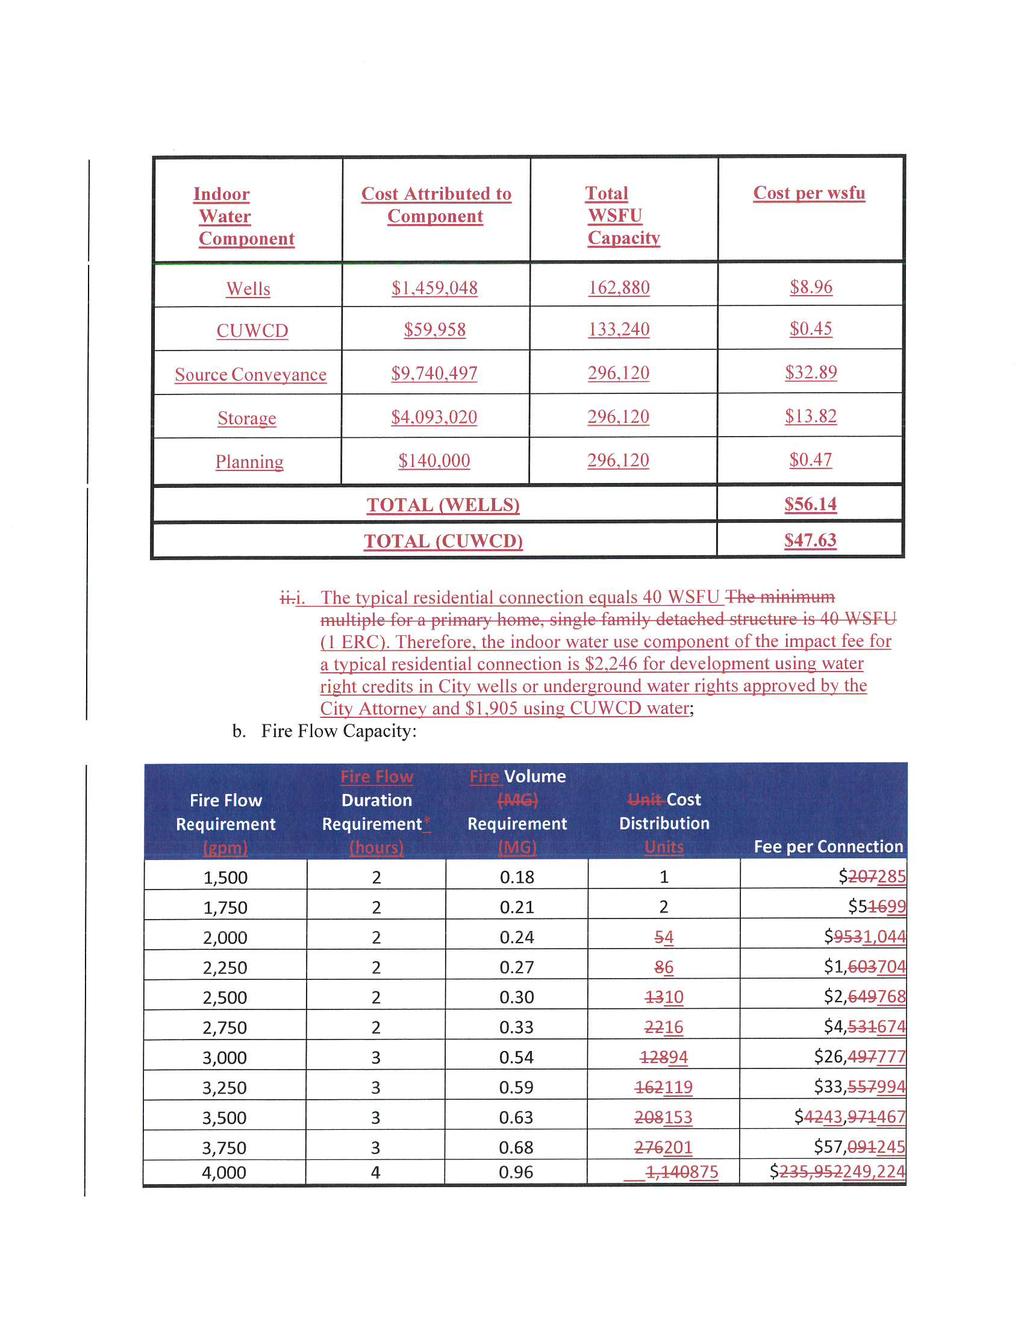
42 fee unit for a connection. A fixture count greater than 40 would require a larger meter and an impact fee unit larger than 1. For example, a building with a fixture unit count of 87 would have an impact fee unit of 2.2 because 87 divided by 40 is 2.2. The Indoor Water Impact Fee per unit is based on the documented cost of the excess capacity in the indoor water components of the drinking water system and the cost of future projects for the predicted development in the next 10 years. Table 3-6 is a summary of the capacity cost included in the impact fee calculation by indoor water component. TABLE 3-6 INDOOR WATER CAPACITY COST Indoor Water Component EXISTING NEXT 10 YEARS BEYOND 10 YEARS TOTAL wsfu* Cost wsfu Cost wsfu Cost wsfu* Cost WELLS 217,600 $1,782, ,880 $1,459,048 0 $0 380,480 $3,241,982 CUWCD 0 $0 133,240 $59,958 2,020,120 $911,911 2,153,360 $971,869 SOURCE CONVEYANCE 217,600 $5,520, ,120 $9,740,497 74,517 $1,689, ,237 $16,950,128 STORAGE 217,600 $3,769, ,120 $4,093, ,120 $8,237,316 1,215,840 $16,099,776 PLANNING 0 $0 296,120 $140,000 0 $0 296,120 $140,000 TOTAL COST $11,072,863 $15,492,523 $10,838,369 $37,403,755 *Existing wsfu does not include 42,160 units attributed to existing units at the time of the Lake Mountain Mutual Water Company purchase. Currently the drinking water system has excess capacity for both source and storage. The costs in the existing column were not included in the calculation of the new unit cost because it represents the money that has already been collected as existing customers connected to the system. Table 3-7 is a summary of the indoor water capacity cost per wsfu using the totals of the column in Next 10 Years from Table 3-6. The unit costs calculated in Table 3-7 only include cost and capacity attributed to future connections anticipated in the next 10 years. The 3-10
43 indoor water impact fee is calculated based on whether the new development has well water rights or if water will be purchased from CUWCD. This will allow for development to pay their fair share of the facilities used for the source water available to the development. The Cost per wsfu for development with well water right credit is $56.14 per wsfu. The cost for development that purchase CUWCD capacity, the cost will be $ Note that the cost of purchasing source water capacity from CUWCD is not included in this impact fee. See Appendix C for details on CUWCD water cost. TABLE 3-7 INDOOR WATER CAPACITY COST PER WSFU Indoor Water Component Cost Attributed to Component Total wsfu* Capacity Cost per wsfu Wells $1,459, ,880 $8.96 CUWCD $59, ,240 $0.45 Source Conveyance $9,740, ,120 $32.89 Storage $4,093, ,120 $13.82 Planning $140, ,120 $0.47 TOTAL (WELLS) $56.14 TOTAL (CUWCD) $47.63 Fire Flow Impact Fee Unit Capacity attributed to fire flow is based on the fire suppression requirement specified by the International Fire Code (IFC), issued by the International Code Council. The level of service is equal to 0.18 Million Gallons (1,500 gpm for 2 hours) which is the IFC fire suppression requirement for most single family homes and non-residential buildings with fire suppression systems. It is recommended that a building requiring greater than 0.18 Million Gallons (MG) of fire suppression be assigned an equitable cost of providing the additional capacity. Assigning an impact fee cost unit by wsfu does not work in the case of fire flow capacity because everyday water use is not related to fire flow requirement. Assigning an impact fee cost unit based on the storage volume required for a typical single family residence does not work because every home and building needs the minimum 0.18 MG for fire suppression. There is a greater distribution of the cost for the minimum storage. When a higher fire flow capacity is required, there are fewer buildings needing that higher volume to distribute the cost of supplying the greater capacity. A fire flow impact fee unit was therefore calculated to represent the equitable 3-11
44 distribution of the fire flow capacity cost. The fee unit is based on an analysis of the existing capacity in the storage facilities versus the existing number of buildings within each fire flow requirement. It was assumed that the excess fire flow storage capacity will be distributed by the same ratio of buildings within each fire flow category. This cost distribution fee unit for each IFC fire flow requirement is shown in Table 3-8. TABLE 3-8 FIRE FLOW CAPACITY IMPACT FEE COST DISTRIBUTION UNIT Fire Flow Requirement (gpm) Fire Flow Duration Requirement (hours) Fire Volume Requirement (MG) Cost Distribution Units Fee per Connection 1, $285 1, $599 2, $1,044 2, $1,704 2, $2,768 2, $4,674 3, $26,777 3, $33,994 3, $43,467 3, $57,245 4, $249,224 Also shown in Table 3-8 is a Fire Flow Impact Fee per Connection based on the cost distribution units and a total cost of $8,484,668 attributed to fire flow capacity (see Table 3-5). An estimated increase of 5,750 Fire Flow Units are projected to be added to the system at a cost of approximately $1.6 million since the previous Impact Fee study through the next ten years. The Fire Flow Impact Fee per unit is based on the actual municipal incurred cost of the available capacity in the fire flow components of the Drinking Water System and the cost of necessary future projects for the predicted growth in the next 10 years. 3-12
45 Water Right Impact Fee Unit The proposed level of service for water rights is 10 gpd per wsfu. An assessment of available water rights and physical groundwater capacity of drinking water quality is limited. There are not enough water rights or ground water available to meet future demands. Existing well capacity is about equal to the existing demand and drinking water right credit. Additional source and water right capacity will need to come from CUWCD. There are already 2 existing connections to CUWCD with 2 more planned to meet future demands. The CUWCD water has a much higher upfront cost and long term cost. However, the City has not paid and do not plan to pay the upfront costs of the wholesale water and the long term costs are not impact fee eligible. There may be a small amount of additional groundwater rights available from private owners that may be used in lieu of paying for CUWCD water, but this is anticipated to be very limited. It is recommended that the City not collect impact fees for water rights moving forward and require future connections to use credit, buy existing credit, or buy on the market and transfer to the City (including CUWCD water). See Appendix C for details on CUWCD water cost. The additional CUWCD water, in addition to existing excess capacity in the City water system (including credits held by developers) is sufficient to meet demands for the next ten years (see Tables 3-9, 3-10 and 3-11). All water right volumes are annual diversions in acre-feet. TABLE 3-9 WATER RIGHTS NEEDED BY 2026 Acre-Feet Predicted Demand in 2026 at the Proposed Level of Service Existing Demand at the Proposed Level of Service 6,254 2,922 Additional Demand Expected by ,332 TABLE 3-10 WATER RIGHTS EXCESS CAPACITY Acre-Feet Water Rights Owned 4,758 Existing Demand at the Proposed Level of Service 2,922 Excess Capacity 1,
46 TABLE 3-11 ADDITIONAL WATER RIGHTS NEEDED BY 2026 Acre-Feet Additional Demand Expected by ,332 Excess Capacity 1,836 Additional Capacity Needed by ,496 The additional demand will be met by water from CUWCD. By the year 2026 the City is projected to have at least 3,140 acre-feet of water available from CUWCD, which is sufficient to cover the projected growth at that point in time. It is recommended that the City accept water rights to maintain its level of service in one of three ways: Use of developer credit, Deed the City an underground water right approved by the City Attorney, or provide CUWCD capacity sufficient to meet the level of service for the proposed development. 3.6 Total Impact Fee Calculation for a Typical Single Family Residence Adding the proposed Drinking Water System impact fee units together, the total proposed impact fee for a typical single family residential connection requiring 40 wsfu, using well water rights, and requiring a 1,500 gpm fire flow would have an impact fee of $2,531 (see Table 3-12). This includes $2,246 for indoor water capacity and $285 for fire flow capacity. TABLE 3-12 TOTAL PROPOSED IMPACT FEE PER TYPICAL SINGLE FAMILY CONNECTION WITH WELL WATER RIGHTS Component Per Typical Residential Connection Indoor Water $2,246 Fire Flow $285 Total (source capacity from well water rights) $2,531 Note: 40 wsfu = 1 Typical residential connection The typical single family residential connection requiring 40 wsfu, purchasing source water capacity from CUWCD, and requiring a 1,500 gpm fire flow would have an impact fee of $2,190 (see the Table 3-13). This includes $1,905 for indoor water capacity and $285 for fire flow capacity. 3-14
47 Component TABLE 3-13 TOTAL PROPOSED IMPACT FEE PER TYPICAL SINGLE FAMILY CONNECTION WITH CUWCD WATER Per WSFU Per Typical Residential Connection Indoor Water $47 $1,905 Fire Flow $7 $285 Total (source capacity from CUWCD) $54 $2,190 Note: 40 wsfu = 1 Typical residential connection 3-15
48 Appendix A Existing Facilities Costs
49 DRINKING WATER SYSTEM COST 1 Lake Mountain Mutual Purchase Wells Wells 1,2,4,6 (7,8) $2,700,000 Wells $450,000 Source 2 Boosters, and pipelines $10,216,000 Transmission for wells and boosters $1,050,000 Storage Tank 1,3,4 and pipelines $4,710,000 Booster station $500,000 Fire Tank 1,3,4 and pipelines $2,240,000 Storage per gallon $1 Water Rights 378 acre-feet $1,134,000 Water rights per ac-ft $3,000 TOTAL $21,000,000 Total $21,000,000 2 Lake Mountain Development Purchase (2005 Bond) Wells Well 3, Booster and pipelines $417,014 Well 3 $417,014 Source Booster and pipelines $1,262,621 Tank 2 $519,828 Storage Tank 2 and Pipelines $639,500 Booster 1 $180,966 Fire Tank 2 and Pipelines $755,047 Pipeline B & D $132,294 TOTAL $3,074,183 Pipeline C $907, Bond Interest $916,106 Total $3,074,183 3 Tank 5 and Waterline Bond Storage Tank 5 and pipeline $2,645,796 Tank 5 and Pipeline $3,500,000 Fire Tank 5 and pipeline $2,236, Bond Interest $1,381,886 TOTAL $4,881,886 Total $4,881,886 4 Zone 2 South SID (2009 Bond) Storage Tank 6 and pipeline $1,579,763 Tank 6 $1,588,650 Fire Tank 6 and pipeline $547,938 Pipeline $539,051 TOTAL $2,127,701 Total $2,127,701 5 Water Right Purchases Water Right 150 acre-feet from L&V Properties $450,000 Water Right 75 acre-feet from L&V Properties $225,000 Water Right 225 acre-feet from L&V Properties $675,000 Water Right 225 acre-feet from Jeff Neilson $350,000 Water Right 225 acre-feet from Jeff Neilson $275,000 Water Right 225 acre-feet from Jeff Neilson $113,825 TOTAL $2,088, North Pipeline Source Pipeline $186, North 14" Pipeline $497,087 Fire Pipeline $310,809 Total $497,087 TOTAL $497,087 7 Saratoga Road Pipeline Source Pipeline $575,780 Saratoga Road Pipeline $575,780 TOTAL $575,780 8 Booster Pump Station 1 Upgrade Source Booster Upgrade $99,995 Booster Pump Station 1 Upgrade $99,995 TOTAL $99, North Pipeline Storage Pipeline $26, North 12" Pipeline $91,681 Fire Pipeline $65,022 Total $91,681 TOTAL $91, Fox Hollow Zone 3 Source Booster $1,189,127 Tank 7 $1,596,844 Storage Tank 7 and pipelines $1,405,223 Fox Hollow Booster $1,189,127 Fire Tank 7 and pipelines $191,621 Total $2,785,971 TOTAL $2,785, Talus Ridge Pipeline Upsizes
50 Source Pipeline Upsizes $65,294 Plat A $259,214 Storage Pipeline Upsizes $422,634 Plat B $125,777 Fire Pipeline Upsizes $106,690 Plat D $55,310 TOTAL $594,618 Plat F $45,578 Plat G $108,739 Total $594, Legacy Farms Source Pipeline Upsizes $234,669 Legacy Farms Pipe Upsize $389,673 Fire Pipeline Upsizes $352,004 Legacy Farms Pipe Upsize VP2 $197,000 TOTAL $586,673 Total $586, Harvest Point Commercial Pipeline Upsize for Fireflow Fire Pipeline Upsize $16,023 Pipeline Upsize $16,023 TOTAL $16,023 Total $16, Fox Hollow N6 Pipeline Looping Fire Pipeline Looping $44,721 Pipeline Looping $89,441 Source Pipeline Looping $44,720 Total $89,441 TOTAL $89, Master Planning, CFP, IFFP, IFFA Planning 2 Updates $140,000 Master Planning, CFP, IFFP, IFFA $70,000 TOTAL $140, Zone 2 North Source Source Booster Station and Pipeline $729,324 Booster Station $383,465 Fireflow 18" U-73 Pipeline $339,980 18" U-73 Pipeline $685,839 TOTAL $1,069,304 Total $1,069, Redwood Rd Transmission Line Source Redwood Rd Transmission Line $402,640 Redwood Rd Transmission Line $627,743 Fireflow Redwood Rd Transmission Line $409, Bond Interest $184,500 TOTAL $812,243 Total $812, Transmission Lines to Connect CWP Turnouts CUWCD Transmission Lines $275,869 Transmission Lines $275,869 TOTAL $275,869 Total $275, Additional Land Acquisition Cost for Well 4 Wells Transmission Lines $120,000 Land Acquisition $120,000 TOTAL $120,000 Total $120,000
51
52
53
54
 B \") B «7 Redwood Road Transmission \") W \") T Existing Turnout \") B Existing Pump Stations Existing Pipes Pressure Zones Zone 1 Zone 2 «8 CWP Turnout Transmission Zone 3 Zone 4 Zone 5 «2 Talus")
55 Legend UT UT ") B UT ") T «8 CWP Turnout Transmission «4 Harvest Point Commercial Pipeline Upsizes ") B Pump Station ") T Turnout UT Tank UT Existing Tanks ") W Existing Wells «6 Zone 2 North Source ") B ") B «7 Redwood Road Transmission ") W ") T Existing Turnout ") B Existing Pump Stations Existing Pipes Pressure Zones Zone 1 Zone 2 «8 CWP Turnout Transmission Zone 3 Zone 4 Zone 5 «2 Talus Ridge Pipeline Upsizes ") T ") W ") W ") W ") WB «3 Legacy Farms Pipeline Upsizes ") B UT Date: 9/28/2017 Document Path: H:\Projects\360 - Saratoga Springs City\ Drinking Water Plans Update\GIS\Working\DW Existing Projects with Buy-in Capacity.mxd Miles SARATOGA SPRINGS DRINKING WATER SYSTEM UT «1 Fox Hollow Zone 3 UT ") B UT «5 Fox Hollow N6 Looping Source: Esri, DigitalGlobe, GeoEye, Earthstar Geographics, CNES/Airbus DS, USDA, USGS, AEX, Getmapping, Aerogrid, IGN, IGP, swisstopo, and the GIS User Community EXISTING IMPACT FEE FACILITIES FIGURE A-1
56 Lake Mountain Mutual Culinary Asset Phurchase Tank 4! T Tank 3 12"! T Bo o st e r 3 " B 18" 10 PROVIDENCE DR 12'' 12" 12'' Harvest Hills 12'' HARVEST MOON DR HARVEST HILLS BLVD REDWOOD RD 2 Bo o st e r 2 " B µ 0 1,000 2,000 6 Feet '' ASPEN HILLS BLVD J o r d a n Ri v e r Wel l 8 " W SR " 15 SR CROSSROADS BLVD 12" Wel l 4 10" " W 13 3-T5-R1 4-T5-R NORTH Sunrise Meadows FOOTHILL BLVD REDWOOD RD PIONEER XING Wel l 7 " W NORTH 12" 23 18" 24 Wel l 6 " W '' Wel l 2 " W PONY EXPRESS PKWY SARATOGA RD 14" Wel l 1 " W 30 4-T5-R1 9-T99-R99 9-T99-R99 3-T5-R SOUTH Utah Lake REDWOOD RD SARATOGA DR 36 14'' Lake Lake Mtn. Mutual Mtn. Mutual purchased installed capacity the 14", Lake from Mtn. Lake Development Mountain Development. purchased capacity. S:\GIS\Utilities\Maps\LakeMtnMutualPurchaseCulinary.mxd February 2014 The Benches 3-T5-R1 3-T6-R1 14" Saratoga Hills GRANDVIEW BLVD Tank 1! T 35 14'' Saratoga Springs Development 14" Bo o st e r 1 " B 2 PARKWAY BLVD REDWOOD REDWOOD RD RD 36 Saratoga Springs Development 1 Tank 5 Land " W Well " B Booster! T Tank Water Line City Boundary Subdivision Township/Range Section
57 800 WEST 2005 Bond Series - Lake Mtn. Development, Water System Purchase Well 3 PONY EXPRESS PKWY J o r d a n Ri v e SARATOGA RD r SARAT OGADR Saratoga Springs Development U t a h L a k e GRANDVIEW BLVD Booster 1 PAR KWAY BLV D REDWOOD RD City Boundary Subdivision Secondary Facilities Pond Well Waterline Culinary Facilities Booster Tank Well Waterline CENTENN IA L BLVD 0 1,000 2,000 Saratoga Springs Development Feet Jacobs Ranch STILLWATER DR Well 1 S:\GIS\Utilities\Maps\Bonded_2005_LakeMtnDevPurchase.mxd 27 August 2012 Pond 2 Tank 2 VILLAGE PKWY The Villages at Saratoga WILDLIFE BLVD Lake Mountain Estates
58 P STAR DR REDWOOD RD 2006 Bond Series - Zone 1: Tank 5 and Waterline Connections Tank 5 SAR.156 A SAR.169 B Tank and Line JONATHAN PL APRICOT PL NECTAR WAY PL PE AR SAR.156 B A P L T C E APPLE AVE CIDER PL EACH PL ORCHARD WAY CHERRY CIR PLUM PL HARVEST MOON DR WINTER WHEAT WAY SPRING HILLS DR RYE DR SPRING HILL WAY SPRINGVIEW DR SPRINGTIME DR STAGECOACH DR CAMBRIA DR S:\GIS\Utilities\Secondary\Bonded_2006_Tank5.mxd MILLET PL S WEET CORN WAY S TRAWBERRY PL HARVEST HILLS 27 August 2012 City Boundary Culinary Projects RASPBERRY DR Tank - SAR.156 A SAR.156 A & B Feet BLVD BLACKBERRY DR BOY SENBERRY DR SUNLIGHT WAY BERRY PATCH WAY MORNING SUNCREST LN DAYBREAK LN AUR O RA WAY HILLCREST R HARVEST HILLS BLVD

59 CANYON VIEW DR 2009 Bond Series - South Zone 2 SID Projects VALLEY VIEW DR MOUNTAINVIEW DR MEADOW RUN REGAL VIEW DR ALLISON WAY SAGE BLOOM WAY ALPINE DR ROLLING SAGE WAY PONDSIDE DR MISTY SAGE WAY GRANDVIEW CT HILLSIDE DR GRANDVIEW BLVD LUCAS LN SAR.169 B LEA CT Filter Station 2 Pond 1 LAND ROCK DR LAN D VIEW BLVD SKY CT STAR CIR PARKSIDE CIR SAR.167 Pond Expansion SAR.138 R Filter Station S T ADAM S LAKE PARKSIDE DR WIL D HORSE RD HORSESHOE PARKWAY BLVD R D S ETTLER VIEW TERRACE R D R D BATTALION FRONTIER CT SAR.152 C CIR A Y B PIONEER CIR SUMMER PL COTTONWOOD LN TRAPPER RD ANASAZI CT REDWOOD RD PARKWAY CT OCOTTON W O D LOOP NINE IRON CT RA NGE RD U t a h L a k e GREEN CT GALLANT VIEW RD P PAR ST R AIRIE POND RD AMANDA LN CENTENNIAL BLVD SAR.169 A Tank Tank 6 SAR.152 A Pond Pond 7 MUSTANG DR SAR.152 B S TETSON AVE RUGAR DR APPALOOSA DR CIR BRID LE LARIAT CIR SAR.189 Filter Station REMINGTON AVE CAHILL AVE LARIAT BLVD Filter Station 3 RUGER SAR.134 B Well DR CHISUM AVE Well 5 HUNTER DR SAR.134 C BROWNING DR COLT DR WESSON DR PALOMINO CIR WINCHESTER DR MORGAN RD FAIRWAY BLVD CAMERON DR CIMARRON AVE WRANGLER AVE HONEYSUCKLE DR S:\GIS\Utilities\Maps\Bonded_2009_SID.mxd City Boundary Secondary Projects SAR.134 C SAR.152 B SAR.152 C Pond - Varies Well - SAR.134 B Filter Station - SAR.189 Culinary Projects Tank - SAR.169 B SAR.169 B ,000 Feet 27 August 2012 SAR.160 Pond Expansion LILY LN SUNRISE PEAK CIR DELPHINIUM WAY SPRING MEADOW DR KIT FOX DR Pond 2 PALOMINO DR LUPINE LN COLUMBINE CIR SHADOW RIDGE DR LORI LN LILAC STILLWATER DR BIRCH DR LAKE MOUNTAIN RD MAVERICK RD DAY LILLY DR HOLLY RD SUMMERHILL DR LOST C REEK CIR FOX HOLLOW DR FOX LN POINT DR VILLAGE PKWY REDWOOD RD IVY LN WILLOW CREEK DR RE D PI NE DR
Contents 8/31/2017 DRAFT REGIONAL IMPACT FEE FACILITIES PLAN & ANALYSIS
 Contents Executive Summary... 2 Introduction... 2 Impact Fee Facilities Plan and Impact Fee Analysis... 2 Level of Service... 2 Excess Capacity Used by New Development... 3 Building Facilities for New
POWDER MOUNTAIN WATER AND SEWER IMPROVEMENT DISTRICT WATER IMPACT FEE FACILITIES PLAN
 May 31, 2018 POWDER MOUNTAIN WATER AND SEWER IMPROVEMENT DISTRICT WATER IMPACT FEE FACILITIES PLAN 4246 S. Riverboat Rd. Ste 200 Salt Lake City, Utah 84213 T 801.359.5565 F 801.359.4272 TABLE OF CONTENTS
West Bountiful City. Water System Capital Facilities Plan
 Water System Capital Facilities Plan August 2008 TABLE OF CONTENTS 1.0 Executive Summary... 1 2.0 Definition of Terms and Abbreviations... 2 3.0 Introduction... 3 3.1 Background...3 3.2 Scope of Investigation...3
City of Saratoga Springs. Public Safety Impact Fee Facilities Plan
 City of Saratoga Springs Public Safety Impact Fee Facilities Plan Zions Public Finance, Inc. October 2018 IMPACT FEE FACILITIES PLAN CITY OF SARATOGA SPRINGS Executive Summary Background This Impact Fee
WHEREAS, a public hearing was duly noticed and held at the regular scheduled City Council meeting of September 25, 2014;
 Ordinance No. XX-XX AN ORDINANCE AMENDING WATER IMPACT FEE FACILITIES PLAN, THE WATER IMPACT FEE ANALYSIS, AND AMENDING TITLE 11, CHAPTER 13 OF THE MUNICIPAL CODE OF PARK CITY, UTAH SETTING FORTH THE ASSESSMENT
Culinary Water Impact Fee Facilities Plan
 Prepared by: December 2, 2014 WOODS CROSS CITY Culinary Water Impact Fee Facilities Plan WOODS CROSS CITY CORPORATION CULINARY WATER IMPACT FEE FACILITIES PLAN (IFFP) J-U-B #55-13-098 Prepared by: 1 Culinary
PRESSURIZED IRRIGATION SYSTEM MASTER PLAN
 PRESSURIZED IRRIGATION SYSTEM MASTER PLAN (HAL Project No.: 314.04.100) FINAL REPORT January 2009 ACKNOWLEDGMENTS Successful completion of this study was made possible by the cooperation and assistance
Table of Contents. 3.1 Source Capacity Analysis
 Table of Contents 3.1 Source Capacity Analysis... 3-1 3.1.1. Design Criteria... 3-1 3.1.2. Source Capacity Evaluation... 3-1 3.1.2.1 Plateau Zone... 3-1 3.1.2.2 Cascade View Zone... 3-4 3.2 Storage Capacity
Date: March 31, Infrastructure Finance Authority (IFA) Board
 Board") Date: March 31, 2016 To: From: Subject: Infrastructure Finance Authority (IFA) Board Chris Cummings, Assistant Director Robert Ault, Program and Services Division Manager Janna Graham, Finance Officer
Date: March 31, 2016 To: From: Subject: Infrastructure Finance Authority (IFA) Board Chris Cummings, Assistant Director Robert Ault, Program and Services Division Manager Janna Graham, Finance Officer
SALEM CITY REQUEST FOR PROPOSAL CULINARY AND SECONDARY WATER MASTER PLAN 5/2/2018
 SALEM CITY REQUEST FOR PROPOSAL CULINARY AND SECONDARY WATER MASTER PLAN 5/2/2018 Salem City (City) is now accepting Proposals for the development of a comprehensive Salem City Culinary Water and Secondary
PRESSURIZED IRRIGATION SYSTEM MASTER PLAN. (HAL Project No.: )
") PRESSURIZED IRRIGATION SYSTEM MASTER PLAN (HAL Project No.: 348.09.200) May 2012 TABLE OF CONTENTS TABLE OF CONTENTS... i LIST OF TABLES... ii LIST OF FIGURES... ii ACKNOWLEDGEMENTS... iii GLOSSARY OF
PRESSURIZED IRRIGATION SYSTEM MASTER PLAN (HAL Project No.: 348.09.200) May 2012 TABLE OF CONTENTS TABLE OF CONTENTS... i LIST OF TABLES... ii LIST OF FIGURES... ii ACKNOWLEDGEMENTS... iii GLOSSARY OF
Springville City Updated Transportation Impact Fees Analysis
 City Updated Transportation Impact Fees Analysis December 2017 Transportation Impact Fee Analysis Summary This Impact Fee Analysis (IFA) is based on the information provided in the City s Roadway Impact
Montara Water and Sanitary District 2011 New Customer CIP and Water Capacity Charge. Presentation to Board April 21, 2011
 Montara Water and Sanitary District 2011 New Customer CIP and Water Capacity Charge Presentation to Board April 21, 2011 PRESENTATION OUTLINE Master Plan Overview Purpose and Approach Supply and Demand
Overview of Local Facilities. Integrated Resource Planning Advisory Committee
 Overview of Local Facilities Integrated Resource Planning Advisory Committee City of Henderson Utility Services System Overview 2 CITY OF HENDERSON Department of Utility Services The Department of Utility
Update to Facility Capacity Charges Methodology and Schedule. A study for El Dorado Irrigation District. prepared by. Bartle Wells Associates
 APPENDIX A Update to Facility Capacity Charges Methodology and Schedule A study for El Dorado Irrigation District prepared by Bartle Wells Associates Principal Consultants Doug Dove, President Catherine
CITY OF PITTSBURG DEVELOPMENT OF WATER AND SEWER FACILITY RESERVE CHARGES
 FINAL ADMINISTRATIVE DRAFT CITY OF PITTSBURG DEVELOPMENT OF WATER AND SEWER FACILITY RESERVE CHARGES April 2005 Prepared by: 201 North Civic Drive, Suite 115 Walnut Creek, California 94596-3864 March 28,
VILLAGE OF BEAR LAKE. Water Reliability Study & General Plan Update
 VILLAGE OF BEAR LAKE MANISTEE COUNTY, MICHIGAN Water Reliability Study & General Plan Update November 2013 Project No. 811320 TABLE OF CONTENTS PAGES I. EXECUTIVE SUMMARY..........................................
WATER MANAGEMENT AND CONSERVATION PLAN FOR THE BEAVER DAM VILLAGE SPECIAL SERVICE DISTRICT FINAL. September 14, 2004 Job Number:
 WATER MANAGEMENT AND CONSERVATION PLAN FOR THE BEAVER DAM VILLAGE SPECIAL SERVICE DISTRICT FINAL September 14, 2004 Job Number: 0352-05-01 PWS ID Number: 09093 PREPARED FOR: Beaver Dam Village Special
2010 UPDATE OF WATER AND WASTEWATER IMPACT FEES FOR THE CITY OF GEORGETOWN
 2010 UPDATE OF WATER AND WASTEWATER IMPACT FEES FOR THE CITY OF GEORGETOWN Prepared for: City of Georgetown P.O. Box 409 Georgetown, Texas 78627-0409 Prepared by: Capital Improvements Advisory Committee
April 19, Dear Ms. Haskins
 227 West Trade Street Phone 704 373 1199 www.raftelis.com Suite 1400 Fax 704 373 1113 Charlotte, NC 28202 April 19, 2018 Ms. Rhonda Haskins, CPA Director of Financial Planning Fayetteville Public Works
Debt Service Funds. Debt Service Funds 323
 Debt Service Funds Debt Service Funds 323 DEBT SERVICE FUNDS The city utilizes three funds to record the receipt and disbursement of monies used to repay principal and interest charges on city issued debt.
SALEM CITY WASTEWATER IMPACT FEE REPORT FINAL DRAFT APRIL 2017
 SALEM CITY WASTEWATER IMPACT FEE REPORT FINAL DRAFT APRIL 2017 BY: 370 East 500 South, Suite 200 Salt Lake City UT 84111 Forsgren Project No: 05-15-0157 SECTION 1- INTRODUCTION, located in the southern
Final Report Rate, Charge, and Cost of Service Study. For: Parker Water and Sanitation District. December 2014
 Final Report Rate, Charge, and Cost of Service Study For: December December 29, Steve Hellman Chief Financial Officer 18100 E. Woodman Drive Parker, Colorado 80134 On behalf of MWH Global, I d like to
DRAFT. Housing and Redevelopment Authority of the City of Annandale, Minnesota DDA. Tax Increment Financing District No. 1-14
 DRAFT Housing and Redevelopment Authority of the City of Annandale, Minnesota Tax Increment Financing Plan for Tax Increment Financing District No. 1-14 (HS Pintail, LLC Apartment Project) To be Adopted:
Municipal Service Review
 Willow Creek Community Services District Municipal Service Review May 2008 Prepared by: For the District Sphere of Influence Report TABLE OF CONTENTS Page Local Agency Formation Commission Authority...
WATER AND WASTEWATER CAPACITY FEES REPORT PROPOSED
 WATER AND WASTEWATER CAPACITY FEES REPORT PROPOSED B&V PROJECT NO. 197551 Black & Veatch Holding Company 2015. All rights reserved. PREPARED FOR Town of Clayton, North Carolina 4 MAY 2018 Table of Contents
227 West Trade Street Phone Suite 1400 Fax Charlotte, NC 28202
 227 West Trade Street Phone 704 373 1199 www.raftelis.com Suite 1400 Fax 704 373 1113 Charlotte, NC 28202 March 13, 2018 Ms. Courtney Driver Utilities Director Winston-Salem/Forsyth County Utilities PO
FREELAND WATER & SEWER DISTRICT BERCOT ROAD INTERTIE STUDY
 FREELAND WATER & SEWER DISTRICT ISLAND COUNTY WASHINGTON BERCOT ROAD INTERTIE STUDY G&O #13507 NOVEMBER 2013 FREELAND WATER & SEWER DISTRICT ISLAND COUNTY WASHINGTON BERCOT ROAD INTERTIE STUDY G&O #13507
Section 7 Hydraulic Model Development and Evaluation Criteria
 Section 7 Hydraulic Model Development and Evaluation Criteria The hydraulic evaluation conducted to develop this master plan was performed using a computer model of the reclaimed water distribution system.
Memorandum #9 [11/17, DRAFT #3] 1
![Memorandum #9 [11/17, DRAFT #3] 1](/thumbs/87/97328534.jpg "Memorandum #9 [11/17, DRAFT #3] 1") Memorandum #9 DATE: January 31, 2017, Revised 11/15/2017 PROJECT NO.: 527116088 TO: Lisa Barrett, Planning Manager FROM: Christopher Dougherty, AICP, Planner CC: Patricia Tyjeski, AICP, Senior Planner
Memorandum #9 DATE: January 31, 2017, Revised 11/15/2017 PROJECT NO.: 527116088 TO: Lisa Barrett, Planning Manager FROM: Christopher Dougherty, AICP, Planner CC: Patricia Tyjeski, AICP, Senior Planner
CHAPTER 8 CAPITAL IMPROVEMENT PLAN
 INTRODUCTION CHAPTER 8 CAPITAL IMPROVEMENT PLAN This chapter presents 6-, 10-, and 20-year Capital Improvement Plans (CIPs) in accordance with the requirements of WAC 26-290. Water system capital improvements
Start-up of a Secondary Water Supply Company. and First Phase Design of a Regional System
 Start-up of a Secondary Water Supply Company and First Phase Design of a Regional System by Stephen W. Smith and Amy L. Johnson Abstract. Highland Ditch Company formed the Highland Secondary Water Company
Hydraulic Modeling, PUDs & Managing Water System Growth
 Hydraulic Modeling, PUDs & Managing Water System Growth American Water Resources Association Intermountain Section October 9, 2013 Utah Division of Drinking Water Ying-Ying Macauley Presentation Topics
TAX INCREMENT FINANCING
 TAX INCREMENT FINANCING Tax Increment Financing (TIF) is a mechanism under Iowa Code chapter 403 for municipalities (cities and counties) to use to finance public improvement projects or, added later,
Appendix C MINNESOTA DEPARTMENT OF NATURAL RESOURCES DIVISION OF WATERS MINNESOTA RULES RELATED TO WATER APPROPRIATION PERMITS
 Appendix C MINNESOTA DEPARTMENT OF NATURAL RESOURCES DIVISION OF WATERS MINNESOTA RULES RELATED TO WATER APPROPRIATION PERMITS 6115.0610 PURPOSE AND STATUTORY AUTHORITY. These parts set forth minimum standards
City of Stockton California
 Report to: City of Stockton California Delta Water Supply Project (DWSP) Surface Water Supply Fee (SWSF) June 2009 Prepared by HDR, Inc. June 8, 2008 Ms. Melissa Price City of Stockton Municipal Utilities
DRAFT REPORT City of Tracy Water Rate Study August 2017
 DRAFT REPORT City of Tracy Water Rate Study August 2017 August 23, 2017 Mr. Kuldeep Sharma Director of Utilities City of Tracy 3900 Holly Drive Tracy, CA 95304 Subject: Comprehensive Water Rate Study Draft
DRAFT FINAL REPORT. City of Kalispell. Stormwater Impact Fee Study
 DRAFT FINAL REPORT City of Kalispell Stormwater Impact Fee Study April 2017 April 13, 2017 Ms. Susie Turner, P.E. Public Works Director City of Kalispell 201 First Avenue East Kalispell, MT 59901 Subject:
WATER AND SEWER CAPACITY FEE STUDY
 DRAFT WATER AND SEWER CAPACITY FEE STUDY MCKINLEYVILLE COMMUNITY SERVICES DISTRICT APRIL 4, 2011 OVERVIEW McKinleyville Community Services District (the District) retained Willdan to prepare a capacity
This is a digital document from the collections of the Wyoming Water Resources Data System (WRDS) Library.
 Library.") This is a digital document from the collections of the Wyoming Water Resources Data System (WRDS) Library. For additional information about this document and the document conversion process, please contact
This is a digital document from the collections of the Wyoming Water Resources Data System (WRDS) Library. For additional information about this document and the document conversion process, please contact
El Margarita Development Analysis
 303 Second Street, Suite 300 South San Francisco, California 94107 415-243-2150 FAX: 415-896-0999 El Margarita Development Analysis 28 January 2015 Prepared for City of Yuba City 1201 Civic Center Boulevard
WATER AND SEWER CAPACITY FEE STUDY
 DRAFT WATER AND SEWER CAPACITY FEE STUDY MCKINLEYVILLE COMMUNITY SERVICES DISTRICT MAY 5, 2011 OVERVIEW McKinleyville Community Services District (the District) retained Willdan to prepare a capacity fee
The Board of Finance of Baltimore City Department of Finance Bureau of Treasury Management
 The Board of Finance of Baltimore City Department of Finance Bureau of Treasury Management Tax Increment Financing Policy and Project Submission Requirements January 23, 2012 PART I: TAX INCREMENT FINANCING
FINAL REPORT. Lake Arrowhead Community Services District Water and Sewer Capacity Fees January \
 FINAL REPORT Lake Arrowhead Community Services District Water and Sewer Capacity Fees January 2016 24148.00100\20807156.1 January 4, 2016 Ms. Catherine Cerri Finance Manager Lake Arrowhead Community Services
PRELIMINARY REGIONAL WATER IMPACT FEE FACILITIES PLAN & ANALYSIS CALCULATIONS WASHINGTON COUNTY, UTAH
 PRELIMINARY REGIONAL WATER IMPACT FEE FACILITIES PLAN & ANALYSIS CALCULATIONS WASHINGTON COUNTY, UTAH SECTION A: DEMAND CONSIDERATIONS SECTION B: SUPPLY CONSIDERATIONS SECTION C: EXISTING PROJECTS WITH
2014 UPDATE OF WATER AND WASTEWATER IMPACT FEES FOR THE CITY OF UNIVERSAL CITY
 204 UPDATE OF WATER AND WASTEWATER IMPACT FEES FOR THE CITY OF UNIVERSAL CITY Prepared by: Impact Fee Advisory Committee City of Universal City, Texas Assisted by: HDR Engineering, Inc. 440 West Gate Blvd,
GENERAL ASSEMBLY OF NORTH CAROLINA SESSION 2011 SESSION LAW HOUSE BILL 609
 GENERAL ASSEMBLY OF NORTH CAROLINA SESSION 2011 SESSION LAW 2011-374 HOUSE BILL 609 AN ACT TO PROMOTE THE DEVELOPMENT OF WATER SUPPLY RESERVOIRS AND OTHER WATER SUPPLY RESOURCES, TO PROVIDE THAT FUNDS
Project Plan and Financing Plan for Reinvestment Zone Number Two,
 Project Plan and Financing Plan for Reinvestment Zone Number Two, City of Richardson, Texas (Program for Tax Increment Financing) Revised November 2012 Stein Planning, LLC by for the City of Richardson
227 West Trade Street Phone Suite 1400 Fax Charlotte, NC 28202
 227 West Trade Street Phone 704 373 1199 www.raftelis.com Suite 1400 Fax 704 373 1113 Charlotte, NC 28202 March 12, 2018 Mr. Don Chamblee Public Works Director Lincoln County 115 W Main St Lincolnton,
REQUEST FOR COUNCIL ACTION
 REQUEST FOR COUNCIL ACTION Date: June 22, 2015 Item No.: 15.a Department Approval City Manager Approval Item Description: Tax Increment Financing (TIF) District Overview 1 2 3 4 5 6 7 8 9 10 11 12 13 14
SALT LAKE CITY DEPARTMENT OF PUBLIC UTILITIES. Comprehensive Water, Sewer, and Stormwater Rate Study
 SALT LAKE CITY DEPARTMENT OF PUBLIC UTILITIES Comprehensive Water, Sewer, and Stormwater Rate Study Draft-Final Report / July 17, 2018 5619 DTC Parkway Suite 850 Greenwood Village, CO 80111 Phone 303.305.1135
WAUKEE CENTRAL URBAN RENEWAL PLAN WAUKEE CENTRAL URBAN RENEWAL AREA WAUKEE, IOWA
 WAUKEE CENTRAL URBAN RENEWAL PLAN for the WAUKEE CENTRAL URBAN RENEWAL AREA WAUKEE, IOWA October 2017-1 - TABLE OF CONTENTS SECTION A. INTRODUCTION B. DESCRIPTION OF THE URBAN RENEWAL AREA C. AREA DESIGNATION
Municipal Service Review
 Briceland Community Services District Municipal Service Review September 2008 Prepared by: For the District Sphere of Influence Report TABLE OF CONTENTS Page Local Agency Formation Commission Authority...
Central Iron County Water Conservancy District Capital Facilities Plan
 Report prepared by: Capital Facilities Plan March 2011 Table of Contents March 2011 A. Executive Summary... 1 B. Background... 3 C. Planning Period and Scope of Study... 4 D. Current Facilities and Resources...
VILLAGE OF ALGONQUIN 2014 WASTEWATER FACILITY PLAN UPDATE EXECUTIVE SUMMARY
 EXECUTIVE SUMMARY EXECUTIVE SUMMARY INTRODUCTION AND BACKGROUND The Village of Algonquin, located along the Fox River in McHenry County, provides wastewater collection and treatment services to the entire
TOWN OF DRYDEN. Proposed Town of Dryden Ellis Hollow Road Water District
 TOWN OF DRYDEN TOMPKINS COUNTY, NEW YORK April 2006 INTERIM ENGINEER S REPORT Proposed Town of Dryden Ellis Hollow Road Water District PREPARED BY: T. G. Miller, P.C. Engineers and Surveyors Ithaca, New
CHAPTER SEVEN: UTILITIES
 CHAPTER SEVEN: UTILITIES 7.1 Introduction The Water Works Board of the City of Auburn (AWWB) is the primary potable water service provider for the City of Auburn (City) and Auburn University. There are
COMMISSIONERS OF PUBLIC WORKS of the CITY OF CHARLESTON, SOUTH CAROLINA DEVELOPMENT POLICIES
 COMMISSIONERS OF PUBLIC WORKS of the CITY OF CHARLESTON, SOUTH CAROLINA DEVELOPMENT POLICIES TABLE OF CONTENTS DEFINITIONS WATER POLICIES Water System Extensions.... W88001 Water System Activation / Service
FEE SCHEDULE 7 Water Development and Connection Fees Aurora Water (Platted Before January 1, 2017)
") FEE SCHEDULE 7 Water Development and Connection s (Platted Before January 1, 2017) Connection s Connection s consist of three components: 1), 2) Sanitary Sewer Connection and 3) Metro Wastewater District
FEE SCHEDULE 7 Water Development and Connection s (Platted Before January 1, 2017) Connection s Connection s consist of three components: 1), 2) Sanitary Sewer Connection and 3) Metro Wastewater District
Water Development Commission 6920 YELLOWTAIL ROAD TELEPHONE: (307) CHEYENNE, WY 82002
 CHEYENNE, WY 82002") THE STATE OF WYOMING Water Development Commission 6920 YELLOWTAIL ROAD TELEPHONE: (307) 777-7626 CHEYENNE, WY 82002 WATER DEVELOPMENT PROGRAM APPLICATION MUNICIPAL/JOINT POWERS WATER BOARD WATER SYSTEMS
THE STATE OF WYOMING Water Development Commission 6920 YELLOWTAIL ROAD TELEPHONE: (307) 777-7626 CHEYENNE, WY 82002 WATER DEVELOPMENT PROGRAM APPLICATION MUNICIPAL/JOINT POWERS WATER BOARD WATER SYSTEMS
Shakopee, Minnesota Shakopee Economic Development Authority
 Shakopee, Minnesota Shakopee Economic Development Authority Modification to Redevelopment Plan for Minnesota River Valley Housing and Redevelopment Project No. 1 And Tax Increment Financing Plan for Tax
Collectively, these documents will be referred to as the Expert Reports
 RESPONSE TO EXPERT WITNESS REPORTS Edge Homes, LLC et al. v. Timpanogos Special Service District Prepared by Keith J. Larson, P.E. Bowen Collins & Associates, Inc. December 12, 2016 This report is prepared
TOWN OF MOUNT PLEASANT WESTCHESTER COUNTY, NEW YORK
 TOWN OF MOUNT PLEASANT WESTCHESTER COUNTY, NEW YORK COST EVALUATION FOR ROLLING HILLS AREA WATER MAIN EXTENSION PROFESSIONAL CONSULTING, LLC. Octagon 10, Office Center 1719 Route 10, Suite 225 Parsippany,
Tax Incremental District Number 23 City of Mitchell, SD. Economic Development Project Plan In conjunction with
 Tax Incremental District Number 23 City of Mitchell, SD Economic Development Project Plan In conjunction with Prepared by Dougherty & Company LLC May 2017 Table of Contents Introduction... 3 Purpose &
Notice of Public Hearing on Proposed Water Service Rates, Fees and Charges. How to Submit a Protest
 220 Nellen Ave. Corte Madera, CA 94925 Notice of Public Hearing on Proposed Water Service Rates, Fees and Charges The Marin Municipal Water District (MMWD) Board of Directors will hold a public hearing
City of Oak Grove, Missouri. Economic Development Incentives Policy
 City of Oak Grove, Missouri Economic Development Incentives Policy March 2008 TABLE OF CONTENTS Policy Introduction 3 Page Tax Increment Financing (TIF) 4 Chapter 100 Industrial Development Bonds 6 Chapter
ANNUAL DEVELOPMENT ACTIVITY AND DISCLOSURE REPORT $4,115,000 CITY OF WHEELING, WEST VIRGINIA STONE BUILDING RENOVATION PROJECT SERIES 2005 A BONDS
 ANNUAL DEVELOPMENT ACTIVITY AND DISCLOSURE REPORT $4,115,000 CITY OF WHEELING, WEST VIRGINIA STONE BUILDING RENOVATION PROJECT SERIES 2005 A BONDS FOR THE PERIOD ENDING DECEMBER 31, 2008 Prepared by: MUNICAP,
Water, Wastewater and Irrigation Impact Fee Study
 Water, Wastewater and Irrigation Impact Fee Study City of Cape Coral, Florida Prepared by duncan associates October 2006 Table of Contents EXECUTIVE SUMMARY... 1 INTRODUCTION... 4 Background... 4 Legal
WATER SUPPLY APPLICATION ENGINEER S REPORT
 February 2010 WATER SUPPLY APPLICATION ENGINEER S REPORT Burnt Hills Ballston Lake Water District No. 2 Connection to Saratoga County Water Authority East Line Road Metering/Chlorination/ Pump Station
Department of Legislative Services
 Department of Legislative Services Maryland General Assembly 2008 Session HB 377 FISCAL AND POLICY NOTE Revised House Bill 377 (The Speaker, et al.) (By Request Administration) Economic Matters and Ways
Municipal Service Review
 Redway Community Services District Municipal Service Review July 2008 Prepared by: For the District Sphere of Influence Report TABLE OF CONTENTS Page Local Agency Formation Commission Authority... 1 Agency
SUMMARY OF THE NEIGHBORHOOD IMPROVEMENT DISTRICT ACT
 SUMMARY OF THE NEIGHBORHOOD IMPROVEMENT DISTRICT ACT AUGUST 2016 PREPARED BY: Robert D. Klahr Robert J. Mahon Armstrong Teasdale LLP 7700 Forsyth Blvd., Suite 1800 St. Louis, MO 63105 / 314.621.5070 Armstrong
SYSTEM ID: KY 10 NARRATIVE DESCRIPTION
 SYSTEM ID: KY 10 NARRATIVE DESCRIPTION KY 10 is primarily a branched system in Kentucky with the following assets: 13 Tanks, 13 Pumps, 1 Water Treatment Plant, and approximately 1353879 feet of pipe. KY
CHAPTER 6 SANITARY SEWER SUB-ELEMENT
 CHAPTER 6 SANITARY SEWER SUB-ELEMENT Page 1 of 10 CHAPTER 6 SANITARY SEWER SUB-ELEMENT A. OVERVIEW The following Future Land Use categories are considered to be urban and require the provision of sanitary
Research Design for Archaeological Fieldwork Draft 1
 March 2013 FEDERAL WAY LINK EXTENSION Research Design for Archaeological Fieldwork Draft 1 This page intentionally left blank. Sound Transit Federal Way Link Extension Research Design for Archaeological
CITY HALL. Tuesday, January 29, :00 P.M. AGENDA
 455 North Rexford Drive CITY HALL address the agenda listed below: meeting if you require captioning service so that reasonable arrangements can be made. please call the City Manager s Office at (310)
DRAFT REVIEW OF POULTRY HOUSE GROUNDWATER WITHDRAWAL PERMIT APPLICATIONS
 DRAFT REVIEW OF POULTRY HOUSE GROUNDWATER WITHDRAWAL PERMIT APPLICATIONS August 2018 Locations of Poultry Houses that have submitted Groundwater Withdrawal Applications 57 Poultry Houses All located in
CHAPTER 4 HYDRAULIC ANALYSIS
 CHAPTER 4 HYDRAULIC ANALYSIS This chapter presents information on the computer hydraulic model of the City s water system and the results of hydraulic analyses. The purpose of the hydraulic analysis is
SYSTEM ID: KY 3 NARRATIVE DESCRIPTION
 SYSTEM ID: KY 3 NARRATIVE DESCRIPTION KY 3 is primarily a grid system in Kentucky with the following assets: 3 Tanks, 5 Pumps, 1 Water Treatment Plant, and approximately 277,022 feet of pipe. KY 3 provides
Cypress Waters: TIF Plan and MOU Amendments, Related Service Plan/Development Agreements and Boundary Adjustments
 Cypress Waters: TIF Plan and MOU Amendments, Related Service Plan/Development Agreements and Boundary Adjustments Economic Development Committee June 1, 2015 Purpose Update status of Cypress Waters project
Section 5 - Planning Criteria. Section 5
 Section 5 - Planning Criteria Section 5 SECTION 5 PLANNING CRITERIA This section presents the design criteria and methodologies for analysis used to evaluate the existing distribution system and its facilities
HARKERS ISLAND SANITARY DISTRICT AMENDMENT TO WATER SYSTEM MANAGEMENT PLAN
 HARKERS ISLAND SANITARY DISTRICT AMENDMENT TO WATER SYSTEM MANAGEMENT PLAN WHEREAS, the Harkers Island Sanitary District is a body politic and corporate with jurisdiction over that geographic area known
UNIFORM DESIGN AND CONSTRUCTION STANDARDS FOR EXTENDING WATER DISTRIBUTION SYSTEMS SECTION 2 DESIGN STANDARDS
 UNIFORM DESIGN AND CONSTRUCTION STANDARDS FOR EXTENDING WATER DISTRIBUTION SYSTEMS SECTION 2 DESIGN STANDARDS DESIGN STANDARDS SECTION 2 INDEX ITEM DESCRIPTION 2.00 GENERAL STATEMENT 2.01 WATER DISTRIBUTION
CHAPTER 4 SYSTEM DESIGN CRITERIA
 INTRODUCTION CHAPTER 4 SYSTEM DESIGN CRITERIA Adequate design of the District s wastewater conveyance facilities requires the determination of the quantity of wastewater from contributing sources. The
INFRASTRUCTURE ELEMENT Goal, Objectives and Policies
 INFRASTRUCTURE ELEMENT Goal, Objectives and Policies City of Bartow Comprehensive Plan Adopted August 5, 1991 Amended August 2, 1993, Amended 1996 & 1999 Adopted Changes January 16, 2001, Amended April
GLOSSARY OF TERMS FOR ECONOMIC DEVELOPMENT STUDY
 GLOSSARY OF TERMS FOR ECONOMIC DEVELOPMENT STUDY BLIGHTED AREA A blighted area is an area that, by reason of the predominance of defective or inadequate street layout, unsanitary or unsafe conditions,
Planada Community Services District Municipal Service Review
 Final Report Planada Community Services District Municipal Service Review Prepared for: Merced County Local Agency Formation Commission Prepared by: April 2015 As Approved by LAFCO April 15, 2015 EPS #141037
WATER AND WASTEWATER RATE STUDY
 WATER AND WASTEWATER RATE STUDY B&V PROJECT NO. 176244.0100 PREPARED FOR Camrosa Water District MARCH 20, 2013 Black & Veatch Holding Company 2011. All rights reserved. Camrosa Water District WATER AND
[THIS PAGE INTENTIONALLY LEFT BLANK]
![[THIS PAGE INTENTIONALLY LEFT BLANK]](/thumbs/89/99579696.jpg "[THIS PAGE INTENTIONALLY LEFT BLANK]") 4-35 POTABLE WATER [THIS PAGE INTENTIONALLY LEFT BLANK] TABLE OF CONTENTS 4-4 GOAL: TO PROVIDE A COST EFFECTIVE, ENVIRONMENTALLY SOUND POTABLE WATER SYSTEM THAT WILL SERVE EXISTING AND FUTURE DEVELOPMENT....
4-35 POTABLE WATER [THIS PAGE INTENTIONALLY LEFT BLANK] TABLE OF CONTENTS 4-4 GOAL: TO PROVIDE A COST EFFECTIVE, ENVIRONMENTALLY SOUND POTABLE WATER SYSTEM THAT WILL SERVE EXISTING AND FUTURE DEVELOPMENT....
Table of Contents Part Title Page
 Table of Contents Part Title Page 1 System Information 1 2 Rate Structure 1 3 Conservation Goals 2 4 Implementation and Tracking 3 5 Conservation Measures 4 Appendix A Appendix B Appendix C Utility Profile
M E M O R A N D U M. Workshop Discussion: Review of Results Neutral Crosswalk Methodology for Reforming the Comprehensive Plan Utility Elements
 M E M O R A N D U M DATE: April 14, 2015 TO: FROM: RE: Planning and Zoning Board Alaina Ray, Director Planning, Zoning and Building Department Workshop Discussion: Review of Results Neutral Crosswalk Methodology
TASK IV: ANALYSIS OF MILLBROOK SEWER AND WATER SYSTEM CONSUMPTION CHARGES AND SEWER CAPITAL ASSESSMENTS
 TASK IV: ANALYSIS OF MILLBROOK SEWER AND WATER SYSTEM CONSUMPTION CHARGES AND SEWER CAPITAL ASSESSMENTS PREPARED FOR: VILLAGE OF MILLBROOK, NY PREPARED BY: This document was prepared with funds provided
This is a digital document from the collections of the Wyoming Water Resources Data System (WRDS) Library.
 Library.") This is a digital document from the collections of the Wyoming Water Resources Data System (WRDS) Library. For additional information about this document and the document conversion process, please contact
This is a digital document from the collections of the Wyoming Water Resources Data System (WRDS) Library. For additional information about this document and the document conversion process, please contact
AUGUST 30, 2016 DRAFT WATER SYSTEM PLAN TEXT AND TABLES BYWATER BAY WATER SYSTEM WITH SHINE PLAT
 AUGUST 30, 2016 DRAFT WATER SYSTEM PLAN TEXT AND TABLES BYWATER BAY WATER SYSTEM WITH SHINE PLAT 1. SYSTEM OVERVIEW The Bywater Bay Water System (DOH Water System ID number 02043P) is located in eastern
ELECTRIC COST OF SERVICE AND RATE DESIGN STUDY
 DRAFT Report ELECTRIC COST OF SERVICE AND RATE DESIGN STUDY Navajo Tribal Utility Authority August 2007 DRAFT NAVAJO TRIBAL UTILITY AUTHORITY ELECTRIC COST OF SERVICE AND RATE DESIGN STUDY Table of Contents
Water and Wastewater Facilities Land Use Assumptions Plan, Capital Improvements Plan, and Maximum Impact Fees Study. San Antonio Water System
 Carollo Engineers, Inc. 114785 Preston Rd., Ste. 950 Dallas, TX 75254 carollo.com Water and Wastewater Facilities Land Use Assumptions Plan, Capital Improvements Plan, and Maximum Impact Fees Study DRAFT
CERTIFICATION AND FINANCING PROPOSAL
 WATER SUPPLY AND DISTRIBUTION SYSTEM IMPROVEMENTS IN Published: May 25, 2018 CONTENTS EXECUTIVE SUMMARY...1 1. PROJECT OBJECTIVE AND EXPECTED OUTCOMES...3 2. ELIGIBILITY...3 2.1. Project Type and Description...
2010 Utility Plan Amendment Boxelder Sanitation District
 2010 Utility Plan Amendment Boxelder Sanitation District For inclusion of the Harmony Ridge Development November 7, 2014 1612 Specht Point Rd. Ste. 105 Fort Collins, Colorado 80525-9770 p 970.484.7477
M A N I T O B A ) Order No. 117/15 ) THE PUBLIC UTILITIES BOARD ACT ) November 18, 2015
 Order No. 117/15 ) THE PUBLIC UTILITIES BOARD ACT ) November 18, 2015") M A N I T O B A ) ) THE PUBLIC UTILITIES BOARD ACT ) November 18, 2015 BEFORE: Susan Proven, P.H.Ec, Acting Chair The Hon. Anita Neville, P.C., B.A. (Hons.), Member MUNICIPALITY OF KILLARNEY-TURTLE MOUNTAIN
M A N I T O B A ) ) THE PUBLIC UTILITIES BOARD ACT ) November 18, 2015 BEFORE: Susan Proven, P.H.Ec, Acting Chair The Hon. Anita Neville, P.C., B.A. (Hons.), Member MUNICIPALITY OF KILLARNEY-TURTLE MOUNTAIN
SimWater: Simulating Water Supply, Demand, and Management Mountains to Valley: Balancing forests, rivers, and downstream water users
 Name: Date: SimWater: Simulating Water Supply, Demand, and Management Mountains to Valley: Balancing forests, rivers, and downstream water users Water managers are entrusted to best allocate water based