2015 Waste Composition Monitoring Program
|
|
|
- Nelson Barnett
- 6 years ago
- Views:
Transcription


1 2015 Waste Composition Monitoring Program Prepared for: Metro Vancouver 4330 Kingsway, Burnaby, BC V5H 4G8 January 2016 Issued for Use File No.: 704-SWM.SWOP Prepared by: Tetra Tech EBA Inc th FL, 885 Dunsmuir St., Vancouver, BC V6C 1N5 Phone:
2 This page intentionally left blank Waste Composition Monitoring Program IFU.docx
3 2015 WASTE COMPOSITION MONITORING PROGRAM EXECUTIVE SUMMARY Tetra Tech EBA Inc. (Tetra Tech) was retained by Metro Vancouver to conduct the 2015 Waste Composition Monitoring Program. The waste characterization was conducted during November and December The objectives of the study were to establish current data on the composition of solid waste disposed of by a number of sectors that haul their garbage to regional transfer stations, as well as to provide information about the composition of the Single Family Residential organics stream. The composition of solid waste was determined from the following sources: Single Family (SF) Residential; Multi-Family (MF) Residential; Industrial, Commercial and Institutional (ICI); and Drop-Off (DO), or self-haul customers. The sampling was undertaken at four facilities including the Surrey Transfer Station (STS), Metro Vancouver Waste to Energy Facility in Burnaby (WTE), Vancouver South Transfer Station (VSTS), and North Shore Transfer Station (NSTS). The organics samples were collected by North Shore municipalities, and sampling took place at the NSTS Harvest Power organics drop-off area. In total, 107 garbage samples totaling 10,830 kg were sorted at the four facilities. Samples were distributed representatively across the four primary sources, and primary waste composition results for each source and the combined average are summarized in Table E1. Table E1: Waste Composition by Sector Primary Categories Primary Category Combined (not including DLC) SF (N=24) MF (N=25) ICI (N=41) DO (N=17) Disposed Tonnes (2014) 909, , , , ,735 Weighted Mean (%) Paper 17% 16% 17% 22% 8% Plastics 16% 18% 16% 19% 8% Compostable Plastics <1% <1% <1% <1% <1% Compostable 28% 34% 35% 28% 10% Non-Compostable 15% 6% 4% 12% 49% Metals 3% 2% 4% 4% 1% Glass 2% 2% 3% 3% 4% Building Material 5% 1% 2% 3% 17% Electronic Waste 2% 1% 2% 2% <1% Household 1% 1% 1% 2% <1% Household Hygiene 8% 17% 15% 3% <1% Bulky Objects <1% <1% 1% <1% 1% Fines 1% 1% 1% <1% <1% 1 Percentages are rounded to the nearest whole number and may not add up to 100% due to rounding. i 2015 Waste Composition Monitoring Program IFU.docx
4 Disposal (kg/capita) 2015 WASTE COMPOSITION MONITORING PROGRAM The largest component of the garbage was compostable organics (28%), followed by paper (17%), and plastic (16%). Compostable organics mainly comprised food waste (21%), of which 6% was food that could have been donated. Other paper (primarily compostable paper such as napkins, paper plates and food soiled paper) was the largest component of paper (8%). The largest portion of plastic was plastic film (7%). The fourth largest portion of the garbage stream was non-compostable organics (15%), largely from the Drop-Off sector, which consisted primarily of treated or painted wood (11%). A breakdown for each sector is provided in Chapter 3 of the report. A historical comparison of waste disposal per capita by primary category from 2011 to 2015 is provided in Figure E1, and a detailed look at each source is included in Chapter 4 of this report. A summary of waste disposed by sector from 2011 to 2015 is presented in Table E2. This information can be used to help evaluate how waste reduction and diversion programs are affecting the quantity and proportion of materials disposed at Metro Vancouver solid waste facilities. Historical data was obtained from the 2011 and 2013 Metro Vancouver Waste Composition Monitoring Program reports kg/capita 414 kg/capita Fines kg/capita Bulky Objects Household Hygiene Household 300 Electronic Waste 250 Building Material Glass 200 Metals 150 Non-Compostable Compostable 100 Compostable Plastic 50 Plastics Paper Year Figure E1: Waste Disposal per Capita by Primary Category Composition (2011 to 2015) All Sectors Combined (Excluding DLC) Table E2: Historical Waste Disposal by Sector (Excluding DLC) Sector SF (kg/capita) MF (kg/capita) ICI (kg/employee) DO (kg/capita) Combined (kg/capita) ii 2015 Waste Composition Monitoring Program IFU.docx
5 2015 WASTE COMPOSITION MONITORING PROGRAM Trends observed in the per capita waste disposal include: Overall disposal per capita has decreased for all sectors combined (excluding DLC) as well as in SF Residential and ICI alone. DO has remained steady from 2013 and MF Residential has increased slightly. SF Residential compostable organics disposed per capita have significantly decreased by close to 50% (from 77 to 40 kg per capita) from 2011 to The ICI sector compostable organics also decreased, from 138 to 83 kg/employee. Meanwhile MF Residential compostable organics decreased a relatively small amount (from 84 to 79 kg per capita). The per capita disposal of plastics and paper did not generally change from 2011 to 2015 for the SF and MF Residential and ICI sectors. Paper and plastics increased in the DO sector, although these material categories only make up a small portion of the DO disposal stream. In the DO sector, though the disposal per capita did not change, and has been fairly consistent from 2013 to 2015, the proportion of materials has changed. Wood waste became a bigger portion of the waste stream; meanwhile building material became a smaller portion. Household hygiene products have more than doubled from 16 kg per capita in 2011 to 34 kg per capita in 2015 in the MF Residential stream. In total, 25 single family organics samples totaling 2,800 kg were sorted at NSTS. Chapter presents the weighted average primary material composition for SF Residential organics, along with compostable organics being further subdivided into secondary categories of yard and garden waste and food waste. The largest component of organics were uncontaminated compostable materials (96%), which consisted mostly of yard waste (74%) and food waste (22%). The second largest portion of the organics stream were compostables in bag (plastic bags filled with compostable materials) (3%). Currently, Metro Vancouver s residential organics recycling program disallows the use of plastic bags of any type, whether compostable or not; therefore, for the purposes of this study, Metro Vancouver treated any plastic bags encountered in samples of residential organic waste as contamination. During the waste sorts, plastic bags filled with compost and/or garbage were left intact, contents unsorted, and weighed wholly under the respective material category (please see Appendix C for Category Descriptions). Other contaminants identified in the samples amounted to less than 0.5% and included garbage in bag (plastic bags filled with garbage), small amounts of plastic film, pet waste and glass. These waste fractions amount to an overall contamination rate in the SF organics waste stream of nearly 4%. iii 2015 Waste Composition Monitoring Program IFU.docx
6 2015 WASTE COMPOSITION MONITORING PROGRAM ACRONYMS & ABBREVIATIONS Acronyms/Abbreviations CCME DLC DO EPR HDPE ICI LDPE MF NSTS PETE PP PPP PS PVC SF STS WTE VSTS Definition Canadian Council of Ministers of the Environment Demolition, Land-clearing and Construction Drop-off from residential and commercial sources (self-haul) Extended Producer Responsibility High Density Polyethylene (#2 plastic, rigid container and flexible film) Industrial, Commercial and Institutional Low-density Polyethylene (#4 plastic, rigid items and flexible film) Multi-Family Residential North Shore Transfer Station Polyethylene Terephthalate (#1, rigid bottles and thermoforms) Polypropylene (#5 rigid container) Packaging and Printed Paper Polystyrene (#6 rigid and expanded) Polyvinyl Chloride (#3 rigid container) Single Family Residential Surrey Transfer Station Metro Vancouver Waste to Energy Facility in Burnaby Vancouver South Transfer Station Terminology Hauler Load Load Source Material Categories Sample Definition Vehicle delivering the waste Amount of waste contained in a hauler truck Origin of a specific sample Types of materials groupings assessed for the waste characterization Portion of the load that was sorted and weighed vi 2015 Waste Composition Monitoring Program IFU.docx
7 2015 WASTE COMPOSITION MONITORING PROGRAM LIMITATIONS OF REPORT This report and its contents are intended for the sole use of Metro Vancouver and their agents. Tetra Tech EBA Inc. (Tetra Tech) does not accept any responsibility for the accuracy of any of the data, the analysis, or the recommendations contained or referenced in the report when the report is used or relied upon by any Party other than Metro Vancouver, or for any Project other than the proposed development at the subject site. Any such unauthorized use of this report is at the sole risk of the user. Use of this report is subject to the terms and conditions stated in Tetra Tech EBA Inc. s Services Agreement. Tetra Tech s General Conditions are provided in Appendix A of this report. NOTE TO THE READER The samples collected and audited for this study are snapshots in time, meaning the reported quantities are estimates and only represent the conditions for the period of time in which they were collected. Seasonal and annual variability, weather, and other factors can affect the amount and composition of waste and recyclables generated by the various sectors at any given time. Even with combined educational, regulatory and financial initiatives the reader should not assume that it is necessarily easy, practical, or economical to recover a substantial portion of a disposed material from a mixed waste stream or at its source Waste Composition Monitoring Program IFU.docx vii
8 2015 WASTE COMPOSITION MONITORING PROGRAM TABLE OF CONTENTS EXECUTIVE SUMMARY... I 1.0 INTRODUCTION Background Scope of Work METHODOLOGY Sample Collection Data Analysis and Statistical Evaluation WASTE COMPOSITION RESULTS Single Family Residential Garbage Multi-Family Residential Industrial, Commercial and Institutional Drop-Off (Self-Haul) Combined Waste Composition Results WASTE DISPOSAL PER CAPITA Historical Comparison CLOSURE LIST OF TABLES IN TEXT Table 1: Garbage Samples Completed... 2 Table 2: Samples Completed... 2 Table 3: Waste Composition for Single Family Residential Garbage by Facility Primary Categories 1. 5 Table 4: Waste Composition for Single Family Residential Table 5: Waste Composition for Multi-Family Residential Garbage by Facility Primary Categories Table 6: Waste Composition for Industrial, Commercial and Institutional Garbage by Facility Primary Categories Table 7: Waste Composition for Drop-Off Garbage by Facility Primary Categories Table 8: Waste Composition Results Summary Primary Categories Table 9: Waste Disposal per Capita by Primary Categories Table 10: Historical Waste Disposal by Sector iv 2015 Waste Composition Monitoring Program IFU
9 2015 WASTE COMPOSITION MONITORING PROGRAM LIST OF FIGURES IN TEXT Figure 1: Primary Category Composition Single Family Residential Garbage (N=24)... 4 Figure 2: Primary Category Composition Single Family Residential (N=25)... 6 Figure 3: Primary Category Composition Multi-Family Residential Garbage (N=25)... 8 Figure 4: Primary Category Composition Industrial, Commercial & Institutional Garbage (N=41) Figure 5: Primary Category Composition Drop-Off Garbage (N=17) Figure 6: Primary Category Composition Combined Garbage (N=107) Figure 7: Waste Disposal per Capita by Primary Category Composition (2011 to 2015) Single Family Residential Figure 8: Waste Disposal per Capita by Primary Category Composition (2011 to 2015) Multi-Family Residential Figure 9: Waste Disposal per Capita by Primary Category Composition (2011 to 2015) Industrial, Commercial & Institutional Figure 10: Waste Disposal per Capita by Primary Category Composition (2011 to 2015) Drop-Off.. 19 Figure 11: Waste Disposal per Capita by Primary Category Composition (2011 to 2015) All Sectors Combined (Excluding DLC) APPENDIX SECTIONS TABLES Table A Table B Waste Composition Results by Sector All Categories Organic Composition Results All Categories APPENDICES Appendix A Appendix B Appendix C Appendix D Tetra Tech s General Conditions Garbage Category Descriptions Category Descriptions Select Site Photographs v 2015 Waste Composition Monitoring Program IFU
10 2015 WASTE COMPOSITION MONITORING PROGRAM 1.0 INTRODUCTION Tetra Tech EBA Inc. (Tetra Tech) was retained by Metro Vancouver to conduct the 2015 Waste Composition Monitoring Program. The waste characterization was conducted during November and December The objectives of the study were to establish current data on the composition of solid waste disposed of by a number of sectors that haul their garbage to regional transfer stations, as well as to provide information about the composition of the Single Family Residential organics stream. The composition of solid waste was determined from the following sources: Single Family (SF) Residential; Multi-Family (MF) Residential; Industrial, Commercial and Institutional (ICI); and Drop-Off (DO), or self-haul customers. The sampling was undertaken at four facilities including the Surrey Transfer Station (STS), Metro Vancouver Waste to Energy Facility in Burnaby (WTE), Vancouver South Transfer Station (VSTS), and North Shore Transfer Station (NSTS). The organics samples were collected by North Shore municipalities, and sampling took place at the NSTS Harvest Power organics drop-off area. This report discusses the methodology employed for the composition auditing and provides the results and analysis from the sort broken down by each sector, and as a regional average. Using available waste generation data for each sector, the waste disposal per capita was calculated for the material categories, and the results were compared to previous years waste generation profiles. 1.1 BACKGROUND Metro Vancouver provides essential services, including managing the region s solid waste for over two million residents in British Columbia s lower mainland. This includes a WTE facility, six transfer stations, and a long-haul landfill in Cache Creek, BC. Combined with the City of Vancouver s transfer station and local landfill, this publicsector system provides transfer and disposal services to residents, agencies and businesses in the region. Metro Vancouver is also responsible for long-term planning and disposal of the waste generated by residents and businesses in the region. Metro Vancouver has set a waste reduction and recycling goal for the region to achieve 70% diversion of its waste from disposal. Waste composition studies are required to track the progress in achieving the desired diversion targets and to identify areas where more progress is need to achieve the region s diversion goals. This study is intended to produce information that local governments, businesses, and institutions can use as they enhance their waste management and recycling programs Waste Composition Monitoring Program IFU.docx 1
11 2015 WASTE COMPOSITION MONITORING PROGRAM 1.2 SCOPE OF WORK Tetra Tech prepared a sampling framework and protocol customized for this study, working from data completeness, scheduling, safety, and budgetary perspectives. The location and dates the study took place are summarized in Table 1 along with the total number of garbage samples completed. The total number of samples from each sector was proportional to the total proportion of garbage received from each sector in the region in Table 1: Garbage Samples Completed Sector Proportion of Metro Vancouver Garbage (2014) NSTS VSTS STS WTE Total Sorting Dates (2015) Nov 2-10 Nov and Dec 7-8 Nov Nov 30-Dec 4 SF 20% MF 24% ICI 41% DO 15% N/A 1 17 Total 100% There are no drop-off samples that arrive at the WTE. In total, 107 garbage samples totaling 10,830 kg were sorted at the four facilities. The target sample size was 100 kg, and the overall average sample weight for all samples was kg. Some drop-off samples were smaller or larger than this target as the entire drop-off load would be sampled if the load weight was less than or close to 100 kg. Drop-off garbage sample weights ranged from 16.9 kg to kg. Garbage samples were sorted into 16 primary categories, and a total of 138 material subcategories. This included specific subcategories for the identification of food waste as avoidable, donatable or unavoidable. In this study, avoidable food waste refers to foods that could have been eaten, such as leftovers or plate scrapings. Unavoidable food waste refers to waste arising from food or drink preparation that is not edible under normal situations, like bones, egg shells, and tea bags. Donatable food refers to food coming from ICI sources, such as grocery stores selling packaged foods, produce, grains, and canned goods that have passed their sell by date, but not the expiration date. Donatable food from commercial venues includes ready-made, edible food items from convenience stores and cafés, and a portion of food waste from restaurants as a result of over-purchasing. Please see Appendix B Garbage Material Categories for the breakdown. The locations and dates for organics sampling and sorting are summarized in Table 2. In total, 25 organics samples totaling 2,800 kg were sorted at NSTS. Table 2: Samples Completed Sector NSTS Sorting Dates (2015) Nov 5, 6, 12 and 13 SF 25 The target sample size was 100 kg, and the overall average sample weight for all samples was kg. sample weights ranged from 70.7 kg to kg. As samples were retrieved with a loader taking the same volume each time, some samples were under 100 kg due to the majority of the sample containing lighter materials (e.g., yard waste), in which case the entire sample was sorted. Organic samples were sorted into 15 primary categories and 2015 Waste Composition Monitoring Program IFU.docx 2
12 2015 WASTE COMPOSITION MONITORING PROGRAM a total of 28 subcategories. At the time of sampling, only organic material generated by the SF sector was sampled, as the receiving facility was only licensed to accept organics from this source alone. Starting in January 2016, Metro Vancouver and Harvest Power will launch a pilot project at the facility to accept organics from MF and ICI sources. 2.0 METHODOLOGY This section reviews the components of the study, provides an overview of how waste was collected and sampled, and outlines other key factors and considerations for the study. Sampling and sorting was conducted in accordance with the methodology set out in the Recommended Waste Characterization Methodology for Direct Waste Analysis Studies in Canada (Canadian Council of Ministers of Environment [CCME] 1999). Detailed category descriptions are included in Appendix B and C for garbage and organics respectively. 2.1 SAMPLE COLLECTION Sample collection and sorting was completed by waste sorters who were trained on safety and material sorting procedures prior to the fieldwork with oversight from a site supervisor. Personal protective equipment (PPE) was used by staff according to the specifications of Tetra Tech s Health and Safety Plan, which factored in special requirements for working at each solid waste facility. Safety meetings were conducted daily to emphasize key concerns including how to handle material hazards such as sharp or hazardous materials, safe lifting of garbage bags, and working around vehicles. The Tetra Tech site supervisor worked closely with the solid waste facility staff to coordinate identification and selection of the loads to be sampled as they arrived with minimal interruption of daily operations. As selected loads for sampling arrived at the transfer station, Tetra Tech s field supervisor was in radio communication with the scale and loader operators to ensure the load was emptied on the tipping floor. For all loads at the Vancouver South Transfer Station and loads from packer trucks at North Shore Transfer Station and Surrey Transfer Station, the loader operator collected one loader bucket of material that was approximately 300 to 500 kg in weight on average and delivered it to the sorting area. For all loads at the Waste to Energy facility and drop-off loads and loads in compactors at North Shore Transfer Station and Surrey Transfer Station, the loads were sampled directly from where they were tipped adjacent to the sorting area. The field team assisted the supervisor in collecting a sample which consisted of 100 kg of garbage or 100 kg of organics, using a rough grid pattern to minimize potential bias. The sample was photographed and pre-weighed prior to sorting. The materials were then sorted into bins. Sample weights for each material category were recorded and the tare weight of each bin was subtracted to determine the net sample weight. Select sample photographs can be found in Appendix D. 2.2 DATA ANALYSIS AND STATISTICAL EVALUATION Data collection logs and scale tickets (if applicable) were reviewed daily to ensure accuracy. Data was compiled manually into spreadsheets throughout the course of the field work and then quality assurance and quality control methods were employed for accuracy including ensuring the difference between pre-sorting weights of each sample with the calculated final sample weight after sorting was within an acceptable margin of accuracy. The average was calculated using a weighted mean for each waste sector and material category. Standard deviations and 90% confidence intervals for primary material categories by waste sector were calculated. These parameters were determined using waste composition percentages to normalize the data set, as each sample can have a different total sample weight Waste Composition Monitoring Program IFU.docx 3
13 2015 WASTE COMPOSITION MONITORING PROGRAM 3.0 WASTE COMPOSITION RESULTS The waste composition results are reported as weighted average percentages by primary material category in the following sections. Weighted average percentages were calculated by combining all sample data for each sector and/or facility. A 90% confidence interval was calculated for each set of results presented. A summary of the results for all 138 material categories is included in Table A for garbage and Table B for all 28 organics categories. Select photographs from the field auditing are included in Appendix D. 3.1 SINGLE FAMILY RESIDENTIAL Garbage Figure 1 presents the weighted average primary material composition for SF Residential garbage. The largest component of the garbage was compostable organics (34%), followed by plastic (18%), and paper (16%). Compostable organics mainly comprised food waste (28%), of which 9% was food that could have been donated. The largest portion of plastic was plastic film (8%). Other paper (primarily compostable paper such as napkins, paper plates and food soiled paper) was the largest component of paper (9%). The fourth largest portion of the garbage stream was household hygiene (17%) which consisted primarily of diapers (10%). Bulky Objects, <1% 0% Fines, 1% Household Hygiene, 17% Paper, 16% Household, 1% Electronic Waste, 1% Building Material, 1% Glass, 2% Metals, 2% Plastic, 18% Non-Compostable, 6% Compostable Plastic, <1% 0% Compostable, 34% Figure 1: Primary Category Composition Single Family Residential Garbage (N=24) 2015 Waste Composition Monitoring Program IFU.docx 4
14 2015 WASTE COMPOSITION MONITORING PROGRAM Primary material composition results for SF Residential garbage overall, the 90% confidence interval, and results by solid waste facility are presented in Table 3. The calculated confidence intervals for each material category were small (<4% by category), indicating that there was good consistency in composition from sample to sample and between solid waste facilities. SF Residential samples from VSTS and STS had a smaller percentage of organics compared to SF Residential samples from NSTS and the WTE facility. SF Residential samples at STS had considerably more glass than samples at the other facilities. Table 3: Waste Composition for Single Family Residential Garbage by Facility Primary Categories 1 Primary Category Weighted Average (N=24) 90% Confidence Interval 2 NSTS (N=4) STS (N=7) VSTS (N=8) WTE (N=5) Paper 16% ±1% 16% 15% 18% 13% Plastics 18% ±2% 16% 16% 22% 16% Compostable Plastics <1% - <1% <1% 1% <1% Compostable 34% ±4% 39% 31% 32% 40% Non-Compostable 6% ±1% 10% 4% 5% 6% Metals 2% - 1% 2% 2% 3% Glass 2% ±1% 1% 5% 1% 1% Building Material 1% ±1% <1% <1% 1% 2% Electronic Waste 1% ±1% 1% 2% 1% <1% Household 1% ±1% <1% 2% <1% 3% /Household Hygiene 17% ±3% 12% 23% 17% 14% Bulky Objects <1% - <1% <1% <1% <1% Fines 1% - 2% <1% 1% 1% 1 Percentages are rounded to the nearest whole number and may not add up to 100% due to rounding. 2 Only 90% confidence intervals greater than 1% are reported Waste Composition Monitoring Program IFU.docx 5
15 2015 WASTE COMPOSITION MONITORING PROGRAM Figure 2 presents the weighted average primary material composition for SF Residential organics, along with compostable organics being further subdivided into secondary categories of yard and garden waste and food waste. Categories with less than 1% were grouped into other. The largest component of organics were uncontaminated compostable materials (96%), which consisted mostly of yard waste (74%) and food waste (22%). Sampling for the waste composition monitoring program was conducted during leaf collection season; therefore the amount of yard waste was expected to be higher during this time of year. Two of the sampling days took place the week after Halloween, and there was a large number of pumpkins identified during auditing. The second largest portion of the organics stream were compostables in bag (plastic bags filled with compostable materials) 1 (3%). Currently, Metro Vancouver s residential organics recycling program disallows the use of plastic bags of any type, whether compostable or not; therefore, for the purposes of this study, Metro Vancouver treated any plastic bags encountered in samples of residential organic waste as contamination. During the waste sorts, plastic bags filled with compost and/or garbage were left intact, contents unsorted, and weighed wholly under the respective material category (please see Appendix C for Category Descriptions). Other contaminants identified in the samples totaled less than 0.5% and included garbage in bag (plastic bags filled with garbage), small amounts of plastic film, pet waste and glass. These waste fractions amount to an overall contamination rate in the SF organics stream of nearly 4%. Of the materials in the other category, the largest components were garbage in bag and compostable paper. Other, 1% Compostables in Bag, 3% Food waste, 22% Yard and garden waste, 74% Figure 2: Primary Category Composition Single Family Residential (N=25) 1 For residential samples, plastic bags are inclusive of all bag types including compostable, biodegradable, and non-compostable. See Appendix B Garbage Material Categories for plastic bag definitions Waste Composition Monitoring Program IFU.docx 6
16 2015 WASTE COMPOSITION MONITORING PROGRAM Waste composition results for SF Residential organics and the 90% confidence intervals are presented in Table 4. Note that secondary categories with results less than 1% were not presented. The calculated confidence intervals for the primary material categories were very low (1%), indicating that there was good consistency in composition from sample to sample. More variation was observed in food waste and yard and garden waste, which had confidence intervals of 7%. This was expected as the relative proportions of organics varied from sample to sample. Table 4: Waste Composition for Single Family Residential 1 Primary Category Weighted Average (N=25) 90% Confidence Interval 2 Garbage in Bag <1% - Compostables in Bag 3% ±1% Compostable Paper <1% - Non-Compostable Paper <1% - Plastic <1% - Compostable Plastics <1% - Compostable (Total) 96% ±1% Yard and garden waste 74% ±7% Food waste 22% ±7% Non-Compostable <1% - Metals <1% - Glass <1% - Building Material <1% - Electronic Waste <1% - Household <1% - Household Hygiene <1% - Bulky Objects <1% - Fines <1% - 1 Percentages are rounded to the nearest whole number and may not add up to 100% due to rounding. 2 Only 90% confidence intervals greater than 1% are reported Waste Composition Monitoring Program IFU.docx 7
17 2015 WASTE COMPOSITION MONITORING PROGRAM 3.2 MULTI-FAMILY RESIDENTIAL Figure 3 presents the weighted average primary material composition for MF Residential garbage. The largest component of the garbage was compostable organics (35%), followed by paper (17%), and plastic (16%). Compostable organics mainly comprised food waste (33%), of which 9% was food that could have been donated. Other paper (primarily compostable paper such as food soiled paper) was the largest component of paper (8%). The largest portion of plastic was plastic film (7%). The fourth largest portion of the garbage stream was household hygiene (15%) which consisted primarily of diapers (8%). Household Hygiene, 15% Bulky Objects, 1% Fines, 1% Household, 1% Paper, 17% Electronic Waste, 2% Building Material, 2% Glass, 3% Metals, 4% Plastic, 16% Non-Compostable, 4% Compostable Plastic, 0% <1% Compostable, 35% Figure 3: Primary Category Composition Multi-Family Residential Garbage (N=25) 2015 Waste Composition Monitoring Program IFU.docx 8
18 2015 WASTE COMPOSITION MONITORING PROGRAM Primary material composition results for MF Residential garbage overall, the 90% confidence interval, and results by solid waste facility are presented in Table 5. The calculated confidence intervals for each material category were relatively low (<3% by category), indicating that there was good consistency in composition from sample to sample and between solid waste facilities. MF Residential samples from VSTS had a larger proportion of organics compared to samples collected at the NSTS or at the WTE. Table 5: Waste Composition for Multi-Family Residential Garbage by Facility Primary Categories 1 Primary Category Weighted Average (N=25) 90% Confidence Interval 2 NSTS (N=10) VSTS (N=9) WTE (N=6) Paper 17% ±2% 17% 20% 13% Plastics 16% ±1% 17% 14% 17% Compostable Plastics <1% - <1% <1% <1% Compostable 35% ±3% 33% 42% 29% Non-Compostable 4% ±1% 5% 3% 4% Metals 4% ±1% 4% 2% 6% Glass 3% ±1% 3% 3% 2% Building Material 2% ±1% 2% <1% 4% Electronic Waste 2% ±1% 2% 1% 4% Household 1% - 1% 1% <1% Household Hygiene 15% ±2% 15% 13% 18% Bulky Objects 1% ±1% 1% <1% <1% Fines 1% - 1% <1% 1% 1 Percentages are rounded to the nearest whole number and may not add up to 100% due to rounding. 2 Only 90% confidence intervals greater than 1% are reported Waste Composition Monitoring Program IFU.docx 9
19 2015 WASTE COMPOSITION MONITORING PROGRAM 3.3 INDUSTRIAL, COMMERCIAL AND INSTITUTIONAL Figure 4 presents the weighted average primary material composition for ICI garbage. The largest component of the garbage was compostable organics (28%), followed by paper (22%), and plastic (19%). Compostable organics mainly comprised food waste (18%), of which 6% was food that could have been donated. Another notable category found in compostable organics was wood pallets (5%). Other paper (primarily compostable paper such as food soiled paper) was the largest component of paper (10%). The largest components of plastic were plastic film (8%) and textiles (5%). The fourth largest portion of the garbage stream was non-compostable organics (12%), which consisted primarily of treated or painted wood (8%). Household, 2% Electronic Waste, 2% Building Material, 5% Glass, 1% Household Hygiene, 3% Bulky Objects, <1% 0% Fines, <1% 0% Paper, 22% Metals, 4% Non-Compostable, 12% Plastic, 19% Compostable, 28% Compostable Plastic, 0% <1% Figure 4: Primary Category Composition Industrial, Commercial & Institutional Garbage (N=41) 2015 Waste Composition Monitoring Program IFU.docx 10
20 2015 WASTE COMPOSITION MONITORING PROGRAM Primary material composition results for ICI garbage overall, the 90% confidence interval, and results by solid waste facility are presented in Table 6. The calculated confidence intervals for each material category were higher than residential garbage, likely due to the higher variability in the range of generators (i.e., different business sectors). However, the confidence intervals were within 5% by category, indicating acceptable consistency in composition from sample to sample and between solid waste facilities. Samples at the NSTS and VSTS included a significant quantity of paper. This included larger quantities of fine paper, newsprint, single serving cups, and other paper such as napkins. Samples at the WTE facility had the most old corrugated cardboard (OCC), averaging 8%. Table 6: Waste Composition for Industrial, Commercial and Institutional Garbage by Facility Primary Categories 1 Primary Category Weighted Average (N=41) 90% Confidence Interval 2 NSTS (N=6) STS (N=16) VSTS (N=9) WTE (N=10) Paper 22% ±4% 35% 11% 37% 21% Plastics 19% ±4% 19% 17% 23% 19% Compostable Plastics <1% - <1% <1% <1% <1% Compostable 28% ±5% 32% 26% 23% 34% Non-Compostable 12% ±5% 2% 22% 3% 9% Metals 4% ±2% 2% 4% 4% 5% Glass 1% ±1% 1% 1% 1% 2% Building Material 5% ±4% 2% 11% <1% 1% Electronic Waste 2% ±1% <1% 2% 2% 4% Household 2% ±1% 1% 3% 2% 1% Household Hygiene 3% ±1% 1% 2% 4% 3% Bulky Objects <1% ±1% 3% <1% <1% <1% Fines <1% - <1% <1% <1% <1% 1 Percentages are rounded to the nearest whole number and may not add up to 100% due to rounding. 2 Only 90% confidence intervals greater than 1% are reported Waste Composition Monitoring Program IFU.docx 11
21 2015 WASTE COMPOSITION MONITORING PROGRAM 3.4 DROP-OFF (SELF-HAUL) Figure 5 presents the weighted average primary material composition for Drop-Off garbage. The largest component of the garbage was non-compostable organics (49%), followed by building material (17%). Non-compostable organics mainly comprised treated or painted wood (46%). The largest components of building material were gypsum (8%) and carpet (6%). Compostable organics (10%) was the third largest portion and almost all of it consisted of yard and garden waste. It should be noted that in late 2015, Metro Vancouver stopped accepting gypsum at six of its sites due to safety concerns raised for workers who may be exposed to asbestos at downstream processing facilities. Until asbestos testing procedures become feasible at its sites, Metro Vancouver is redirecting gypsum loads straight to the processors. At the time of sampling, multiple DO samples contained up to 30% to 70% gypsum (e.g., auditors found gypsum in garbage bags); however, despite these spikes in gypsum in some isolated samples, its overall fraction in the DO waste stream has only increased by two percentage points since 2013, up from 6%. Household, <1% 0% Electronic Waste, 0% <1% Building Material, 17% Glass, 4% Metals, 1% Household Hygiene, <1% 0% Bulky Objects, 1% Fines, <1% 0% Paper, 8% Plastic, 8% Compostable Plastic, <1% 0% Compostable, 10% Non-Compostable, 49% Figure 5: Primary Category Composition Drop-Off Garbage (N=17) 2015 Waste Composition Monitoring Program IFU.docx 12
22 2015 WASTE COMPOSITION MONITORING PROGRAM Primary material composition results for Drop-Off garbage overall, the 90% confidence interval, and results by solid waste facility are presented in Table 7. It was expected that the 90% confidence intervals for each material category would be higher for Drop-Off due to the variability in the types of users of the transfer stations. The majority of users were contractors with varying amounts of wood waste and building materials. Other users were residential customers with waste from renovations, clean-ups, or home moves. Table 7: Waste Composition for Drop-Off Garbage by Facility Primary Categories 1 Primary Category Weighted Average (N=17) 90% Confidence Interval 2 NSTS (N=5) STS (N=6) VSTS (N=6) Paper 8% ±10% 7% 3% 13% Plastics 8% ±8% 3% 19% 2% Compostable Plastics <1% - <1% <1% <1% Compostable 10% ±10% 1% 7% 21% Non-Compostable 49% ±14% 60% 49% 41% Metals 1% ±1% <1% 3% <1% Glass 4% ±5% <1% 1% 10% Building Material 17% ±9% 25% 16% 12% Electronic Waste <1% - <1% 1% <1% Household <1% ±1% <1% <1% 1% Household Hygiene <1% - <1% <1% <1% Bulky Objects 1% ±2% 4% <1% <1% Fines <1% - <1% <1% <1% 1 Percentages are rounded to the nearest whole number and may not add up to 100% due to rounding. 2 Only 90% confidence intervals greater than 1% are reported Waste Composition Monitoring Program IFU.docx 13
23 2015 WASTE COMPOSITION MONITORING PROGRAM 3.5 COMBINED WASTE COMPOSITION RESULTS The combined (SF, MF, ICI, and DO) weighted average primary material composition results is presented in Figure 6. The largest component of the garbage was compostable organics (28%), followed by paper (17%), and plastic (16%). Compostable organics mainly comprised food waste (21%), of which 6% was food that could have been donated. Other paper (primarily compostable paper such as food soiled paper) was the largest component of paper (8%). The largest portion of plastic was plastic film (7%). The fourth largest portion of the garbage stream was non-compostable organics (15%), largely from the Drop-Off sector, which consisted primarily of treated or painted wood (11%). During the study very little compostable plastic materials were found. In total it amounted to approximately 0.1% of the overall waste composition. Compostable plastic materials that were identified were primarily compostable plastic packaging in SF Residential samples, and compostable plastic bags in ICI samples. Household Hygiene, 8% Household, 1% Electronic Waste, 2% Bulky Objects, <1% 0% Fines, 1% Paper, 17% Building Material, 5% Glass, 2% Metals, 3% Plastic, 16% Non-Compostable, 15% Compostable Plastic, <1% 0% Compostable, 28% Figure 6: Primary Category Composition Combined Garbage (N=107) 2015 Waste Composition Monitoring Program IFU.docx 14
24 2015 WASTE COMPOSITION MONITORING PROGRAM Waste composition results for the combined sectors (excluding Demolition, Land-clearing and Construction [DLC]) and 90% confidence intervals are presented in Table 8 along with the results by sector. The calculated confidence intervals for each material category were less than 4% by category. Table 8: Waste Composition Results Summary Primary Categories 1 By Sector Combined Average (N=107) SF (N=24) MF (N=25) ICI (N=41) DO (N=17) Disposed Tonnes 1 Population or Number of Employees 909, , , , ,735 2,465,031 1,494, ,696 1,291,490 1,494,336 Primary Category Weighted % 2 90% Confidence Interval 3 Weighted % 2 Weighted % 2 Weighted % 2 Weighted % 2 Paper 17% ±2% 16% 17% 22% 8% Plastics 16% ±2% 18% 16% 19% 8% Compostable Plastics <1% - <1% <1% <1% <1% Compostable 28% ±3% 34% 35% 28% 10% Non-Compostable 15% ±4% 6% 4% 12% 49% Metals 3% ±1% 2% 4% 4% 1% Glass 2% ±1% 2% 3% 3% 4% Building Material 5% ±2% 1% 2% 3% 17% Electronic Waste 2% ±1% 1% 2% 2% <1% Household 1% ±1% 1% 1% 2% <1% Household Hygiene 8% ±1% 17% 15% 3% <1% Bulky Objects <1% - <1% 1% <1% 1% Fines 1% - 1% 1% <1% <1% 1 Total tonnes disposed in Percentages are rounded to the nearest whole number and may not add up to 100% due to rounding. 3 Only 90% confidence intervals greater than 1% are reported Waste Composition Monitoring Program IFU.docx 15
25 2015 WASTE COMPOSITION MONITORING PROGRAM 4.0 WASTE DISPOSAL PER CAPITA Waste disposal per capita by primary categories for the combined sectors and individual sectors are presented in Table 9. Solid waste disposed and population by sector (in the case of ICI, number of employees) for the previous year (2014) was provided by Metro Vancouver. This data was used to generate estimates of waste disposed per capita using the waste composition results for Waste disposal per capita estimates by tertiary/quaternary categories are included in Table A at the end of this report. Table 9: Waste Disposal per Capita by Primary Categories Combined Average (N=107) By Sector SF (N=24) MF (N=25) ICI (N=41) DO (N=17) Disposed Tonnes 1 909, , , , ,735 Population or Number of Employees 2,465,031 1,494, ,696 1,291,490 1,494,336 Primary Category % 2 kg/ capita % 2 kg/ capita % 2 kg/ capita % 2 kg/ employee % 2 kg/ capita Paper 17% 64 16% 19 17% 38 22% 66 8% 7 Plastics 16% 61 18% 21 16% 37 19% 56 8% 7 Compostable Plastics <1% <1 <1% <1 <1% <1 <1% <1 <1% <1 Compostable 28% % 40 35% 79 28% 83 10% 9 Non-Compostable 15% 54 6% 7 4% 9 12% 36 49% 44 Metals 3% 12 2% 3 4% 8 4% 12 1% 1 Glass 2% 9 2% 3 3% 6 3% 4 4% 4 Building Material 5% 19 1% 1 2% 4 3% 15 17% 16 Electronic Waste 2% 6 1% 1 2% 4 2% 7 <1% <1 Household 1% 5 1% 2 1% 2 2% 6 <1% <1 Household Hygiene 8% 31 17% 20 15% 34 3% 8 <1% <1 Bulky Objects <1% 2 <1% <1 1% 1 <1% 1 1% 1 Fines 1% 2 1% 1 1% 2 <1% 1 <1% <1 Total Total tonnes disposed in Percentages are rounded to the nearest whole number and may not add up to 100% due to rounding Waste Composition Monitoring Program IFU.docx 16
26 2015 WASTE COMPOSITION MONITORING PROGRAM 4.1 HISTORICAL COMPARISON A historical comparison of waste disposal per capita by primary category from 2011 to 2015 is provided in the following graphs by sector (Figures 7 to 10) and for the combined sectors excluding DLC (Figure 11). A summary of waste disposed by sector from 2011 to 2015 is presented in Table 10. This information can be used to help evaluate how waste reduction and diversion programs are affecting the quantity and proportion of materials disposed at Metro Vancouver solid waste facilities. Historical data was obtained from the 2011 and 2013 Metro Vancouver Waste Composition Monitoring Program reports. Trends observed in the per capita waste disposal include: Overall disposal per capita has decreased for all sectors combined (excluding DLC) as well as in SF Residential and ICI alone. DO has remained steady from 2013 and MF Residential has increased slightly. SF Residential compostable organics disposed per capita have significantly decreased by close to 50% (from 77 to 40 kg per capita) from 2011 to The ICI sector compostable organics also decreased, from 138 to 83 kg/employee. Meanwhile MF Residential compostable organics decreased a relatively small amount (from 84 to 79 kg per capita). The per capita disposal of plastics and paper did not generally change from 2011 to 2015 for the SF and MF Residential and ICI sectors. Paper and plastics increased in the DO sector, although these material categories only make up a small portion of the DO disposal stream. In the DO sector, though the disposal per capita did not change, and has been fairly consistent from 2013 to 2015, the proportion of materials has changed. Wood waste became a bigger portion of the waste stream; meanwhile building material became a smaller portion. Household hygiene products have more than doubled from 16 kg per capita in 2011 to 34 kg per capita in 2015 in the MF Residential stream. Table 10: Historical Waste Disposal by Sector Sector SF (kg/capita) MF (kg/capita) ICI (kg/employee) DO (kg/capita) Combined (kg/capita) Waste Composition Monitoring Program IFU 17
27 Disposal (kg/capita) Disposal (kg/capita) 2015 WASTE COMPOSITION MONITORING PROGRAM kg/capita 156 kg/capita 117 kg/capita Year Fines Bulky Objects Household Hygiene Household Electronic Waste Building Material Glass Metals Non-Compostable Compostable Compostable Plastic Plastics Paper Figure 7: Waste Disposal per Capita by Primary Category Composition (2011 to 2015) Single Family Residential kg/capita 221 kg/capita 224 kg/capita Year Fines Bulky Objects Household Hygiene Household Electronic Waste Building Material Glass Metals Non-Compostable Compostable Compostable Plastic Plastics Paper Figure 8: Waste Disposal per Capita by Primary Category Composition (2011 to 2015) Multi-Family Residential 2015 Waste Composition Monitoring Program IFU 18
28 Disposal (kg/employee) Disposal (kg/employee) 2015 WASTE COMPOSITION MONITORING PROGRAM kg/employee Fines kg/employee 295 kg/employee Bulky Objects Household Hygiene Household Electronic Waste 250 Building Material 200 Glass Metals 150 Non-Compostable Compostable 100 Compostable Plastic 50 Plastics Paper Year Figure 9: Waste Disposal per Capita by Primary Category Composition (2011 to 2015) Industrial, Commercial & Institutional 120 Fines kg/capita 90 kg/capita 91 kg/capita Bulky Objects Household Hygiene Household Electronic Waste Building Material Glass Metals Non-Compostable Compostable Compostable Plastic Plastics Paper Year Figure 10: Waste Disposal per Capita by Primary Category Composition (2011 to 2015) Drop-Off 2015 Waste Composition Monitoring Program IFU 19
29 Disposal (kg/capita) 2015 WASTE COMPOSITION MONITORING PROGRAM kg/capita 414 kg/capita Fines kg/capita Bulky Objects Household Hygiene Household 300 Electronic Waste 250 Building Material Glass 200 Metals 150 Non-Compostable Compostable 100 Compostable Plastic 50 Plastics Paper Year Figure 11: Waste Disposal per Capita by Primary Category Composition (2011 to 2015) All Sectors Combined (Excluding DLC) 2015 Waste Composition Monitoring Program IFU 20


30
31 2015 WASTE COMPOSITION MONITORING PROGRAM TABLES Table A Table B Waste Composition Results by Sector All Categories Organic Composition Results All Categories 2015 Waste Composition Monitoring Program IFU.docx
32 TABLE A FILE: SWM.SWOP JANUARY 2016 ISSUED FOR USE Table A: Waste Composition Results by Sector All Categories Category SF MF ICI DO Combined % kg/capita % kg/capita % kg/emp. % kg/capita % kg/capita PAPER 1 Junk Mail, Flyers, Unaddressed Mail 0.9% % % % % Other Fine Office Paper or 1.7% % % % % Sales, Inserts and Free Prints 0.5% % % % % Other Newsprint 0.3% % % % % Recyclable OCC 1.1% % % % % Waxed OCC 0.0% % % % % Other non-recyclable OCC 0.1% % % % % Cereal Boxes and Other Box 1.7% % % % % Telephone Books 0.0% % % % % Magazines 0.1% % % % % Books 0.2% % % % % Dairy or Dairy Substitute 0.2% % % % % Non-Dairy/Deposit 0.2% % % % % Single Serving Cups and Lids 0.6% % % % % Other 8.2% % % % % 27.9 PAPER TOTAL 15.8% % % % % 64.0 PLASTIC 16 Re-Used Retail & Grocery Bags 1.1% % % % % Empty Retail & Grocery Bags 0.7% % % % % Consumables Packaging Bags and 4.8% % % % % 11.7 Film 19 Garbage Bags 1.1% % % % % Sandwich/Freezer Bags 0.3% % % % % Deposit Beverage Pouches 0.1% % % % % Other Plastic Film 0.2% % % % % Clothing 0.7% % % % % Other Synthetic Textiles 2.6% % % % % Table A.docx
33 TABLE A FILE: SWM.SWOP JANUARY 2016 ISSUED FOR USE Category SF MF ICI DO Combined % kg/capita % kg/capita % kg/emp. % kg/capita % kg/capita 25 Dairy or Dairy Substitute 0.1% % % % % Deposit Containers Water 0.1% % % % % Deposit Containers Other 0.1% % % % % Single Serving Cups 0.1% % % % % Other 0.0% % % % % # 1 PETE Bottles and Jars 0.2% % % % % #1 PETE Other Packaging 0.2% % % % % #2 HDPE Bottles and Jugs 0.3% % % % % #2 HDPE Tubs and Lids 0.1% % % % % #3 PVC 0.0% % % % % #4 LDPE 0.0% % % % % #5 PP 0.4% % % % % #6 PS Non-Foam 0.2% % % % % #6 PS Foam 1.5% % % % % #7 Mixed Resin Plastic 0.0% % % % % Uncoded Packaging/Containers 0.5% % % % % Durable Plastic Products 2.4% % % % % Other/Mixed plastics 0.0% % % % % 0.5 PLASTIC TOTAL 17.8% % % % % 60.7 COMPOSTABLE PLASTIC 43 Cutlery, Cups, Lids, Boxes, Trays 0.0% % % % % Bags and Liners 0.0% % % % % SunChip Bags, Bottles 0.3% % % % % 0.2 COMPOSTABLE PLASTIC TOTAL 0.3% % % % % 0.2 COMPOSTABLE ORGANICS 46 Small Yard Waste 4.9% % % % % Large Yard Waste 0.1% % % % % Unavoidable Food Waste 10.2% % % % % Plate Scrapings, Unfinished Meals 8.2% % % % % Table A.docx
34 TABLE A FILE: SWM.SWOP JANUARY 2016 ISSUED FOR USE Category SF MF ICI DO Combined % kg/capita % kg/capita % kg/emp. % kg/capita % kg/capita 50 Whole Fruits and Vegetables 3.6% % % % % Whole Meats, Fish 0.9% % % % % Full/Unused Ready-Made 1.4% % % % % Baked Goods 1.3% % % % % Deli (cheese, salads) 0.6% % % % % Liquids (drinks, oil in package) 1.4% % % % % Wood Pallets 0.0% % % % % Unfinished Wood Furniture 0.6% % % % % Other Wood 1.2% % % % % Manure, Slaughterhouse, Animals 0.1% % % % % 0.3 COMPOSTABLE ORGANICS TOTAL 34.4% % % % % NON-COMPOSTABLE ORGANICS 60 Pressure Treated Wood 0.8% % % % % Finished Wood 1.2% % % % % Finished Wood Furniture 0.5% % % % % Natural Fiber Clothing 1.1% % % % % Other Textile Products 0.6% % % % % Tires 0.1% % % % % Other Rubber (gloves) 0.5% % % % % Leather 0.0% % % % % Composite Organic Materials 1.2% % % % % 3.0 (shoes) NON-COMP. ORGANICS TOTAL 6.0% % % % % 54.2 METALS 69 Alcoholic 0.0% % % % % Non-Alcoholic 0.0% % % % % Food Containers 0.3% % % % % Spiral-Wound Containers 0.1% % % % % Other Ferrous 0.0% % % % % Food Containers 0.1% % % % % Table A.docx
35 TABLE A FILE: SWM.SWOP JANUARY 2016 ISSUED FOR USE Category SF MF ICI DO Combined % kg/capita % kg/capita % kg/emp. % kg/capita % kg/capita 75 Other Bimetallic 0.0% % % % % Alcoholic 0.0% % % % % Non-Alcoholic 0.1% % % % % Food Containers 0.1% % % % % Foil Trays, Wrap 0.5% % % % % Other Non-Ferrous 0.1% % % % % Household 0.9% % % % % Machine Parts 0.0% % % % % Construction/Industrial 0.0% % % % % 2.2 METALS TOTAL 2.2% % % % % 11.7 GLASS 84 Beer 0.0% % % % % Other Alcohol 0.0% % % % % Non-Alcoholic & Non-Dairy 0.0% % % % % Dairy or Dairy Substitute 0.0% % % % % Food Containers 0.5% % % % % Other Glass and Ceramics 1.6% % % % % 5.8 GLASS TOTAL 2.1% % % % % 8.5 BUILDING MATERIAL 90 Gypsum/Drywall 0.5% % % % % Masonry 0.0% % % % % Rock, Sand, Dirt 0.0% % % % % Rigid Asphalt 0.0% % % % % Carpet Waste 0.1% % % % % Other Inorganics 0.2% % % % % 1.2 BUILDING MATERIAL TOTAL 0.8% % % % % 19.3 ELECTRONIC WASTE 96 Desktop Computers 0.0% % % % % Notebook Computers 0.0% % % % % Table A.docx
36 TABLE A FILE: SWM.SWOP JANUARY 2016 ISSUED FOR USE Category SF MF ICI DO Combined % kg/capita % kg/capita % kg/emp. % kg/capita % kg/capita 98 Computer Peripherals 0.0% % % % % Computer Monitors 0.0% % % % % Printers, Scanners 0.0% % % % % Televisions 0.0% % % % % Other Audio/Video 0.1% % % % % Mobile Phones & Accessories 0.1% % % % % Other 0.0% % % % % Small Appliances & Floor Care 0.3% % % % % Electronic Toys 0.1% % % % % Smoke Detectors 0.0% % % % % Other Electronics 0.4% % % % % 0.8 ELECTRONIC WASTE TOTAL 1.1% % % % % 6.3 HOUSEHOLD HAZARDOUS 109 Lead Acid 0.0% % % % % All Other Batteries 0.2% % % % % Sharps 0.1% % % % % Animal Carcass (pets) 0.0% % % % % Other 0.0% % % % % Stains/Preservatives 0.0% % % % % Latex Paint 0.2% % % % % Oil-Based Paint 0.0% % % % % Paint Aerosols 0.0% % % % % Solvents 0.0% % % % % Cleaners, Soaps etc. 0.1% % % % % % % % % % 0.0 Pesticides/Herbicides/Preservatives 121 Motor Oil 0.0% % % % % Oil Filters 0.0% % % % % Antifreeze 0.0% % % % % Pharmaceuticals 0.1% % % % % Table A.docx
37 TABLE A FILE: SWM.SWOP JANUARY 2016 ISSUED FOR USE Category SF MF ICI DO Combined % kg/capita % kg/capita % kg/emp. % kg/capita % kg/capita 125 Other Petroleum Based Products 0.0% % % % % Other 0.7% % % % % Thermostats and Switches 0.0% % % % % CFLs 0.0% % % % % Other HHW or Containers 0.0% % % % % 0.2 HOUSEHOLD HAZARDOUS TOTAL 1.3% % % % % 4.8 HOUSEHOLD HYGIENE 130 Diapers 9.7% % % % % Pet Waste 3.1% % % % % Other (sanitary products, 3.8% % % % % Personal Care 0.5% % % % % 1.2 HOUSEHOLD HYGIENE TOTAL 17.1% % % % % 30.7 BULKY OBJECTS 134 Large Appliances 0.0% % % % % Mattresses, Box Springs 0.0% % % % % Other Upholstered Furniture 0.0% % % % % Other Furniture 0.0% % % % % 0.6 BULKY OBJECTS TOTAL 0.0% % % % % 1.6 FINES 138 Fines 1.0% % % % % 2.2 FINES TOTAL 1.0% % % % % 2.2 TOTAL 100.0% % % % % Table A.docx
38 TABLE B FILE: SWM.SWOP JANUARY 2016 ISSUED FOR USE Table B: Composition Results All Categories Category Single Family % 1 Garbage in Bag 0.3% 2 in Plastic Bag 2.9% Compostable Paper 3 Newsprint 0.1% 4 Fine, Office, Envelopes 0.2% Non-Compostable Paper 5 Beverage Containers 0.0% 6 Other Non-Compostable Paper 0.0% Plastic 7 Film 0.0% 8 Textiles 0.0% 9 Rigid Beverage Containers 0.0% 10 Rigid (non-beverage) 0.0% 11 Other Plastics 0.0% Compostable Plastics 12 Foodware 0.0% 13 Film 0.0% 14 Other Compostable Plastics 0.0% Compostable 15 Yard & Garden 74.3% 16 Food Waste 21.5% 17 Clean Wood 0.5% Non-Compostable and Other Contamination 18 Treated or Painted Wood 0.0% 19 Other 0.0% 20 Metals 0.0% 21 Glass 0.0% 22 Building Material 0.0% 23 Electronic Waste 0.0% 24 Household 0.0% 25 Pet Waste 0.0% 26 Other Biological 0.0% 27 Bulky Objects 0.0% 28 Fines 0.0% Total 100.0% 1 Table B.docx
39 2015 WASTE COMPOSITION MONITORING PROGRAM APPENDIX A TETRA TECH S GENERAL CONDITIONS 2015 Waste Composition Monitoring Program IFU.docx
40 GENERAL CONDITIONS GEOENVIRONMENTAL REPORT This report incorporates and is subject to these General Conditions. 1.0 USE OF REPORT AND OWNERSHIP This report pertains to a specific site, a specific development, and a specific scope of work. It is not applicable to any other sites, nor should it be relied upon for types of development other than those to which it refers. Any variation from the site or proposed development would necessitate a supplementary investigation and assessment. This report and the assessments and recommendations contained in it are intended for the sole use of Tetra Tech EBA s client. Tetra Tech EBA does not accept any responsibility for the accuracy of any of the data, the analysis or the recommendations contained or referenced in the report when the report is used or relied upon by any party other than Tetra Tech EBA s Client unless otherwise authorized in writing by Tetra Tech EBA. Any unauthorized use of the report is at the sole risk of the user. This report is subject to copyright and shall not be reproduced either wholly or in part without the prior, written permission of Tetra Tech EBA. Additional copies of the report, if required, may be obtained upon request. 3.0 NOTIFICATION OF AUTHORITIES In certain instances, the discovery of hazardous substances or conditions and materials may require that regulatory agencies and other persons be informed and the client agrees that notification to such bodies or persons as required may be done by Tetra Tech EBA in its reasonably exercised discretion. 4.0 INFORMATION PROVIDED TO TETRA TECH EBA BY OTHERS During the performance of the work and the preparation of the report, Tetra Tech EBA may rely on information provided by persons other than the Client. While Tetra Tech EBA endeavours to verify the accuracy of such information when instructed to do so by the Client, Tetra Tech EBA accepts no responsibility for the accuracy or the reliability of such information which may affect the report. 2.0 ALTERNATE REPORT FORMAT Where Tetra Tech EBA submits both electronic file and hard copy versions of reports, drawings and other project-related documents and deliverables (collectively termed Tetra Tech EBA s instruments of professional service), only the signed and/or sealed versions shall be considered final and legally binding. The original signed and/or sealed version archived by Tetra Tech EBA shall be deemed to be the original for the Project. Both electronic file and hard copy versions of Tetra Tech EBA s instruments of professional service shall not, under any circumstances, no matter who owns or uses them, be altered by any party except Tetra Tech EBA. The Client warrants that Tetra Tech EBA s instruments of professional service will be used only and exactly as submitted by Tetra Tech EBA. Electronic files submitted by Tetra Tech EBA have been prepared and submitted using specific software and hardware systems. Tetra Tech EBA makes no representation about the compatibility of these files with the Client s current or future software and hardware systems. 1
41 2015 WASTE COMPOSITION MONITORING PROGRAM APPENDIX B GARBAGE CATEGORY DESCRIPTIONS 2015 Waste Composition Monitoring Program IFU.docx
42 APPENDIX B FILE: SWM.SWOP JANUARY 2016 ISSUED FOR USE Appendix B: Garbage Category Descriptions No. Primary Secondary Tertiary/Quaternary Additional Comments 1 Paper Fine, Office, Envelopes Junk Mail, Flyers, Unaddressed Mail 2 Paper Fine, Office, Envelopes Other Fine Office Paper or Envelopes 3 Paper Newsprint Sales, Inserts and Free Prints Metro, 24, Straight, Now, Newsleader 4 Paper Newsprint Other Newsprint 5 Paper OCC Recyclable OCC 6 Paper OCC Waxed OCC Non-recyclable 7 Paper OCC Other Non-Recyclable OCC Contaminated with food/blood/grease, dirty pizza boxes 8 Paper Boxboard Cereal Boxes and Other Box Packaging 9 Paper Bound Paper Products Telephone Books 10 Paper Bound Paper Products Magazines 11 Paper Bound Paper Products Books 12 Paper Beverage Containers Drink Box/Aseptic 13 Paper Beverage Containers Drink Box/Aseptic Dairy or Dairy Substitute Non-Dairy/Deposit 14 Paper Other Paper Single Serving Cups and Lids Coffee, tea, drinks, etc. 15 Paper Other Paper Other Tar paper, wrappers, paper plates, tissue paper, toweling, etc. 16 Plastic Film Re-Used Retail & Grocery Bags 17 Plastic Film Empty Retail & Grocery Bags Re-used as kitchen catchers: HDPE & LDPE retail and grocery carry out plastic bags containing waste e.g. household and pet waste or for containing recyclables or organics Empty: HDPE and LDPE retail and grocery carryout bags that have not been reused 1 Appendix B Garbage Material Categories.docx
43 APPENDIX B FILE: SWM.SWOP JANUARY 2016 ISSUED FOR USE No. Primary Secondary Tertiary/Quaternary Additional Comments 18 Plastic Film Consumables Packaging Bags and Film Dry cleaning bags, bread bags, frozen food bags, milk bags, toilet paper and toweling over-wrap, lawn seed, soil, peat moss, fertilizer, multi-layer plastic films; meat, poultry and fish wrap; vacuum sealed bacon; luncheon meat and cheese; cereal liners; chip bags and other snack food bags; candy wraps; pasta bags; boil in a bag; plastic based food pouches; bubble wrap; cling wrap; etc. 19 Plastic Film Garbage Bags HDPE & LDPE garbage bags, kitchen catchers, blue or clear bags for recyclables 20 Plastic Film Sandwich/Freezer Bags HDPE & LDPE sandwich, freezer bags, ziplocs and other food use bags 21 Plastic Film Deposit Beverage Pouches 22 Plastic Film Other Plastic Film Pallet / distribution wrap and lumber wrap (nonwoven), tarps, other plastic film 23 Plastic Textiles Clothing 24 Plastic Textiles Other Synthetic Textiles 25 Plastic Rigid Beverage Containers 26 Plastic Rigid Beverage Containers 27 Plastic Rigid Beverage Containers 28 Plastic Rigid Beverage Containers 29 Plastic Rigid Beverage Containers Dairy or Dairy Substitute Deposit Containers Water Deposit Containers Other Single Serving Cups Other Water Bottles All other deposit beverage bottles: juice, pop, alcohol PE, PS, coffee, tea, drinks, etc. 30 Plastic Rigid (non-beverage) # 1 PETE Bottles and Jars 31 Plastic Rigid (non-beverage) #1 PETE Other Packaging Other Bottles and Jars: #1, cooking oil, peanut butter, dish soap, mouthwash, etc. (excluding bottles that contained HHW) Other Packaging: #1, bakery, clamshells, trays, ovenable trays, egg cartons 2 Appendix B Garbage Material Categories.docx
44 APPENDIX B FILE: SWM.SWOP JANUARY 2016 ISSUED FOR USE No. Primary Secondary Tertiary/Quaternary Additional Comments 32 Plastic Rigid (non-beverage) #2 HDPE Bottles and Jugs Other Bottles and Jugs: #2, laundry soap, shampoo, windshield washer fluid, etc. (excluding bottles that contained HHW) 33 Plastic Rigid (non-beverage) #2 HDPE Tubs and Lids Wide mouth tubs and lids, dairy tubs, pails, lawn, garden, pool supplies, kitty litter, etc. 34 Plastic Rigid (non-beverage) #3 PVC Bottles and Jars: #3 bottles and jars, lotions, soaps, bug repellents, shampoos, etc. 35 Plastic Rigid (non-beverage) #4 LDPE Wide mouth tubs and lids, dairy tubs, etc. 36 Plastic Rigid (non-beverage) #5 PP Wide mouth tubs and lids, dairy tubs, pails, lawn, garden, pool supplies, kitty litter, etc. 37 Plastic Rigid (non-beverage) #6 PS Non-Foam #6 PS (non-foam), trays, clamshells, lids, pill and vitamin bottles, seedling trays, etc. 38 Plastic Rigid (non-beverage) #6 PS Foam #6 PS (foam), food trays, clamshells, seedling trays, PS used to protect boxed product, etc. 39 Plastic Rigid (non-beverage) #7 Mixed Resin Plastic Food containers, mustard, ketchup and some juices 40 Plastic Rigid (non-beverage) Uncoded Packaging/Containers Blister packaging, tubes for pharmaceutical & health care/cosmetic products, plant pots, unmarked/coded packaging, etc. 41 Plastic Other Durable Plastic Products Non-packaging such as VCR tapes, CDs, toys, games, plant pots, Tupperware, furniture, siding, plumbing pipes, etc. 42 Plastic Other Other/Mixed Plastics 43 Compostable Plastics Foodware Cutlery, Cups, Lids, Boxes, Trays Compostable plastic cutlery, cups, lids, bowls, deli containers, trays, etc. 44 Compostable Plastics Film Bags and Liners Compostable kitchen catcher bags, toter liners, overwrap, grocery bags, etc. 45 Compostable Plastics Other Compostable Plastics Sunchip Bags, Bottles Sunchip bags, pop bottles, water bottles, or other compostable packaging 3 Appendix B Garbage Material Categories.docx
45 APPENDIX B FILE: SWM.SWOP JANUARY 2016 ISSUED FOR USE No. Primary Secondary Tertiary/Quaternary Additional Comments 46 Compostable 47 Compostable 48 Compostable Yard & Garden Small Yard Waste Small yard waste (leaves, branches, brush, grass clippings, wood chips, plant material, potting soil, peat, etc.) Yard & Garden Large Yard Waste Other large yard wastes (branches, etc. over 15 cm dia. or 1 m long) Food Waste Unavoidable Food Waste Unavoidable food waste arising from food/drink preparation (bones, egg shells, tea bags, peels, oil, fats) 49 Compostable 50 Compostable 51 Compostable Food Waste Donatable Food Waste Donatable Food Waste Plate Scrapings, Unfinished Meals Whole Fruits and Vegetables Whole Meats, Fish 52 Compostable Donatable Food Waste Full/Unused Ready-Made Packaged items, canned foods, condiments 53 Compostable 54 Compostable 55 Compostable Donatable Food Waste Donatable Food Waste Donatable Food Waste Baked Goods Deli (cheese, salads) Liquids (drinks, oil in package) 56 Compostable 57 Compostable 58 Compostable Clean Wood Wood Pallets Unpainted, untreated Clean Wood Unfinished Wood Furniture No composites Clean Wood Other Wood Mixed/dimensional lumber, rotting wood - unpainted, untreated 59 Compostable Other Compostable Manure, Slaughterhouse, Animals 60 Non- Compostable Treated or Painted Wood Pressure Treated Wood Treated lumber, shingles, decking etc. 61 Non- Compostable Treated or Painted Wood Finished Wood Flooring, paneling, siding, glued particle board, plywood, OSB - painted, stained or finished 62 Non- Compostable Treated or Painted Wood Finished Wood Furniture No composites 4 Appendix B Garbage Material Categories.docx
46 APPENDIX B FILE: SWM.SWOP JANUARY 2016 ISSUED FOR USE No. Primary Secondary Tertiary/Quaternary Additional Comments 63 Non- Compostable 64 Non- Compostable 65 Non- Compostable 66 Non- Compostable 67 Non- Compostable 68 Non- Compostable Textiles Textiles Rubber Rubber Leather / Multiple/Composite Organic Materials Leather / Multiple/Composite Organic Materials Natural Fiber Clothing Other Textile Products Tires Other Rubber (gloves) Leather Composite Organic Materials (shoes) 69 Metals Ferrous Alcoholic 70 Metals Ferrous Non-Alcoholic 71 Metals Ferrous Food Containers 72 Metals Ferrous Spiral-Wound Containers Frozen juice containers, coffee cans, chip and nut containers 73 Metals Ferrous Other Ferrous 74 Metals Bimetallic Food Containers 75 Metals Bimetallic Other Bimetallic 76 Metals Non-Ferrous (copper, aluminum, brass) 77 Metals Non-Ferrous (copper, aluminum, brass) 78 Metals Non-Ferrous (copper, aluminum, brass) 79 Metals Non-Ferrous (copper, aluminum, brass) 80 Metals Non-Ferrous (copper, aluminum, brass) 81 Metals Non-Consumable Mixed Metals Alcoholic Non-Alcoholic Food Containers Foil Trays, Wrap Other Non-Ferrous Household Kitchen & bathroom fixtures, coat hangers, other metal fixtures, closet doors, filing cabinets, furnishings, etc. 5 Appendix B Garbage Material Categories.docx
47 APPENDIX B FILE: SWM.SWOP JANUARY 2016 ISSUED FOR USE No. Primary Secondary Tertiary/Quaternary Additional Comments 82 Metals Non-Consumable Mixed Metals 83 Metals Non-Consumable Mixed Metals Machine Parts Construction/Industrial Auto parts, electric motors, bicycles and parts, lawn mowers, etc. Nails, screws, handheld tools, drywall trim, flashing, baseboard heaters, industrial doors, panels, etc. 84 Glass Beverage Containers Beer 85 Glass Beverage Containers Other Alcohol 86 Glass Beverage Containers Non-Alcoholic & Non-Dairy 87 Glass Beverage Containers Dairy or Dairy Substitute 88 Glass Food Containers Food Containers 89 Glass Other Glass and Ceramics Other Glass and Ceramics Dishware, mirrors, incandescent light bulbs, fibreglass insulation, plant pots, coffee cups 90 Building Material Gypsum / Drywall Gypsum/Drywall 91 Building Material Masonry Masonry 92 Building Material Rock, Sand, Dirt Rock, Sand, Dirt 93 Building Material Rigid Asphalt Rigid Asphalt 94 Building Material Carpet Waste Carpet Waste 95 Building Material Other Inorganics Other Inorganics 96 Electronic Waste Computers and Peripherals 97 Electronic Waste Computers and Peripherals 98 Electronic Waste Computers and Peripherals 99 Electronic Waste Computers and Peripherals 100 Electronic Waste Computers and Peripherals 101 Electronic Waste Televisions & AV Equipment 102 Electronic Waste Televisions & AV Equipment 103 Electronic Waste Telephones & Telecommunications Equipment Desktop Computers Notebook Computers Computer Peripherals Computer Monitors Printers, Scanners Televisions Other Audio/Video Mobile Phones & Accessories Including key board, mouse, cables, modems, routers and external hardware other than below 6 Appendix B Garbage Material Categories.docx
48 APPENDIX B FILE: SWM.SWOP JANUARY 2016 ISSUED FOR USE No. Primary Secondary Tertiary/Quaternary Additional Comments 104 Electronic Waste Telephones & Telecommunications Equipment 105 Electronic Waste Small Appliances & Floor Care Appliances Other Small Appliances & Floor Care Appliances Land line phones and accessories, fax machines Microwaves, toasters, vacuum cleaners, coffee makers, corded and cordless, etc. 106 Electronic Waste Electronic Toys Electronic Toys 107 Electronic Waste Smoke Detectors Smoke Detectors 108 Electronic Waste Other Electronics Other Electronics 109 Household 110 Household 111 Household Batteries Lead Acid Car, truck, boat, wheel chair, golf cart batteries over 2 kg under BCBCP Stewardship Program Batteries All Other Batteries All types of Rechargeable and Non Rechargeable Batteries Ni-Cd, Ni-MH, Li-ion and Small Pb under 1 kg, Dry cell, alkaline, copper top, button cell and other household batteries Medical/Biological Sharps Needles 112 Household Medical/Biological Animal Carcass (pets) 113 Household Medical/Biological Other Bandages, IV bags, etc. 114 Household HHW Stains/Preservatives 115 Household HHW Latex Paint 116 Household HHW Oil-Based Paint 117 Household HHW Paint Aerosols 118 Household HHW Solvents 119 Household HHW Cleaners, Soaps etc. 120 Household HHW Pesticides/Herbicides/Pres ervatives With PCP Reg. # 121 Household HHW Motor Oil 7 Appendix B Garbage Material Categories.docx
49 APPENDIX B FILE: SWM.SWOP JANUARY 2016 ISSUED FOR USE No. Primary Secondary Tertiary/Quaternary Additional Comments 122 Household 123 Household 124 Household 125 Household 126 Household 127 Household 128 Household 129 Household 130 Household Hygiene HHW HHW HHW HHW HHW Mercury Containing Items Mercury Containing Items Other HHW Biological Oil Filters Antifreeze Pharmaceuticals Other Petroleum Based Products Other Thermostats and Switches CFLs Other HHW or Containers Diapers 131 Household Hygiene Biological Pet Waste Animal feces, bedding, cat litter 132 Household Hygiene Biological Other (sanitary products, condoms) Sanitary napkins, tampons, condoms 133 Household Hygiene Liquid Product Personal Care Full shampoo bottles, beauty products, creams, etc. 134 Bulky Objects White Goods Large Appliances 135 Bulky Objects Furniture Mattresses, Box Springs 136 Bulky Objects Furniture Other Upholstered Furniture 137 Bulky Objects Furniture Other Furniture Composite furniture 138 Fines Fines Fines Items too small to classify efficiently (e.g. bread tabs, twist ties, typically <1") 8 Appendix B Garbage Material Categories.docx
50 2015 WASTE COMPOSITION MONITORING PROGRAM APPENDIX C ORGANICS CATEGORY DESCRIPTIONS 2015 Waste Composition Monitoring Program IFU.docx
51 APPENDIX B FILE: SWM.SWOP JANUARY 2016 ISSUED FOR USE Appendix B: Garbage Category Descriptions No. Primary Secondary Tertiary/Quaternary Additional Comments 1 Paper Fine, Office, Envelopes Junk Mail, Flyers, Unaddressed Mail 2 Paper Fine, Office, Envelopes Other Fine Office Paper or Envelopes 3 Paper Newsprint Sales, Inserts and Free Prints Metro, 24, Straight, Now, Newsleader 4 Paper Newsprint Other Newsprint 5 Paper OCC Recyclable OCC 6 Paper OCC Waxed OCC Non-recyclable 7 Paper OCC Other Non-Recyclable OCC Contaminated with food/blood/grease, dirty pizza boxes 8 Paper Boxboard Cereal Boxes and Other Box Packaging 9 Paper Bound Paper Products Telephone Books 10 Paper Bound Paper Products Magazines 11 Paper Bound Paper Products Books 12 Paper Beverage Containers Drink Box/Aseptic 13 Paper Beverage Containers Drink Box/Aseptic Dairy or Dairy Substitute Non-Dairy/Deposit 14 Paper Other Paper Single Serving Cups and Lids Coffee, tea, drinks, etc. 15 Paper Other Paper Other Tar paper, wrappers, paper plates, tissue paper, toweling, etc. 16 Plastic Film Re-Used Retail & Grocery Bags 17 Plastic Film Empty Retail & Grocery Bags Re-used as kitchen catchers: HDPE & LDPE retail and grocery carry out plastic bags containing waste e.g. household and pet waste or for containing recyclables or organics Empty: HDPE and LDPE retail and grocery carryout bags that have not been reused 1 Appendix B Garbage Material Categories.docx
52 APPENDIX B FILE: SWM.SWOP JANUARY 2016 ISSUED FOR USE No. Primary Secondary Tertiary/Quaternary Additional Comments 18 Plastic Film Consumables Packaging Bags and Film Dry cleaning bags, bread bags, frozen food bags, milk bags, toilet paper and toweling over-wrap, lawn seed, soil, peat moss, fertilizer, multi-layer plastic films; meat, poultry and fish wrap; vacuum sealed bacon; luncheon meat and cheese; cereal liners; chip bags and other snack food bags; candy wraps; pasta bags; boil in a bag; plastic based food pouches; bubble wrap; cling wrap; etc. 19 Plastic Film Garbage Bags HDPE & LDPE garbage bags, kitchen catchers, blue or clear bags for recyclables 20 Plastic Film Sandwich/Freezer Bags HDPE & LDPE sandwich, freezer bags, ziplocs and other food use bags 21 Plastic Film Deposit Beverage Pouches 22 Plastic Film Other Plastic Film Pallet / distribution wrap and lumber wrap (nonwoven), tarps, other plastic film 23 Plastic Textiles Clothing 24 Plastic Textiles Other Synthetic Textiles 25 Plastic Rigid Beverage Containers 26 Plastic Rigid Beverage Containers 27 Plastic Rigid Beverage Containers 28 Plastic Rigid Beverage Containers 29 Plastic Rigid Beverage Containers Dairy or Dairy Substitute Deposit Containers Water Deposit Containers Other Single Serving Cups Other Water Bottles All other deposit beverage bottles: juice, pop, alcohol PE, PS, coffee, tea, drinks, etc. 30 Plastic Rigid (non-beverage) # 1 PETE Bottles and Jars 31 Plastic Rigid (non-beverage) #1 PETE Other Packaging Other Bottles and Jars: #1, cooking oil, peanut butter, dish soap, mouthwash, etc. (excluding bottles that contained HHW) Other Packaging: #1, bakery, clamshells, trays, ovenable trays, egg cartons 2 Appendix B Garbage Material Categories.docx
53 APPENDIX B FILE: SWM.SWOP JANUARY 2016 ISSUED FOR USE No. Primary Secondary Tertiary/Quaternary Additional Comments 32 Plastic Rigid (non-beverage) #2 HDPE Bottles and Jugs Other Bottles and Jugs: #2, laundry soap, shampoo, windshield washer fluid, etc. (excluding bottles that contained HHW) 33 Plastic Rigid (non-beverage) #2 HDPE Tubs and Lids Wide mouth tubs and lids, dairy tubs, pails, lawn, garden, pool supplies, kitty litter, etc. 34 Plastic Rigid (non-beverage) #3 PVC Bottles and Jars: #3 bottles and jars, lotions, soaps, bug repellents, shampoos, etc. 35 Plastic Rigid (non-beverage) #4 LDPE Wide mouth tubs and lids, dairy tubs, etc. 36 Plastic Rigid (non-beverage) #5 PP Wide mouth tubs and lids, dairy tubs, pails, lawn, garden, pool supplies, kitty litter, etc. 37 Plastic Rigid (non-beverage) #6 PS Non-Foam #6 PS (non-foam), trays, clamshells, lids, pill and vitamin bottles, seedling trays, etc. 38 Plastic Rigid (non-beverage) #6 PS Foam #6 PS (foam), food trays, clamshells, seedling trays, PS used to protect boxed product, etc. 39 Plastic Rigid (non-beverage) #7 Mixed Resin Plastic Food containers, mustard, ketchup and some juices 40 Plastic Rigid (non-beverage) Uncoded Packaging/Containers Blister packaging, tubes for pharmaceutical & health care/cosmetic products, plant pots, unmarked/coded packaging, etc. 41 Plastic Other Durable Plastic Products Non-packaging such as VCR tapes, CDs, toys, games, plant pots, Tupperware, furniture, siding, plumbing pipes, etc. 42 Plastic Other Other/Mixed Plastics 43 Compostable Plastics Foodware Cutlery, Cups, Lids, Boxes, Trays Compostable plastic cutlery, cups, lids, bowls, deli containers, trays, etc. 44 Compostable Plastics Film Bags and Liners Compostable kitchen catcher bags, toter liners, overwrap, grocery bags, etc. 45 Compostable Plastics Other Compostable Plastics Sunchip Bags, Bottles Sunchip bags, pop bottles, water bottles, or other compostable packaging 3 Appendix B Garbage Material Categories.docx
54 APPENDIX B FILE: SWM.SWOP JANUARY 2016 ISSUED FOR USE No. Primary Secondary Tertiary/Quaternary Additional Comments 46 Compostable 47 Compostable 48 Compostable Yard & Garden Small Yard Waste Small yard waste (leaves, branches, brush, grass clippings, wood chips, plant material, potting soil, peat, etc.) Yard & Garden Large Yard Waste Other large yard wastes (branches, etc. over 15 cm dia. or 1 m long) Food Waste Unavoidable Food Waste Unavoidable food waste arising from food/drink preparation (bones, egg shells, tea bags, peels, oil, fats) 49 Compostable 50 Compostable 51 Compostable Food Waste Donatable Food Waste Donatable Food Waste Plate Scrapings, Unfinished Meals Whole Fruits and Vegetables Whole Meats, Fish 52 Compostable Donatable Food Waste Full/Unused Ready-Made Packaged items, canned foods, condiments 53 Compostable 54 Compostable 55 Compostable Donatable Food Waste Donatable Food Waste Donatable Food Waste Baked Goods Deli (cheese, salads) Liquids (drinks, oil in package) 56 Compostable 57 Compostable 58 Compostable Clean Wood Wood Pallets Unpainted, untreated Clean Wood Unfinished Wood Furniture No composites Clean Wood Other Wood Mixed/dimensional lumber, rotting wood - unpainted, untreated 59 Compostable Other Compostable Manure, Slaughterhouse, Animals 60 Non- Compostable Treated or Painted Wood Pressure Treated Wood Treated lumber, shingles, decking etc. 61 Non- Compostable Treated or Painted Wood Finished Wood Flooring, paneling, siding, glued particle board, plywood, OSB - painted, stained or finished 62 Non- Compostable Treated or Painted Wood Finished Wood Furniture No composites 4 Appendix B Garbage Material Categories.docx
55 APPENDIX B FILE: SWM.SWOP JANUARY 2016 ISSUED FOR USE No. Primary Secondary Tertiary/Quaternary Additional Comments 63 Non- Compostable 64 Non- Compostable 65 Non- Compostable 66 Non- Compostable 67 Non- Compostable 68 Non- Compostable Textiles Textiles Rubber Rubber Leather / Multiple/Composite Organic Materials Leather / Multiple/Composite Organic Materials Natural Fiber Clothing Other Textile Products Tires Other Rubber (gloves) Leather Composite Organic Materials (shoes) 69 Metals Ferrous Alcoholic 70 Metals Ferrous Non-Alcoholic 71 Metals Ferrous Food Containers 72 Metals Ferrous Spiral-Wound Containers Frozen juice containers, coffee cans, chip and nut containers 73 Metals Ferrous Other Ferrous 74 Metals Bimetallic Food Containers 75 Metals Bimetallic Other Bimetallic 76 Metals Non-Ferrous (copper, aluminum, brass) 77 Metals Non-Ferrous (copper, aluminum, brass) 78 Metals Non-Ferrous (copper, aluminum, brass) 79 Metals Non-Ferrous (copper, aluminum, brass) 80 Metals Non-Ferrous (copper, aluminum, brass) 81 Metals Non-Consumable Mixed Metals Alcoholic Non-Alcoholic Food Containers Foil Trays, Wrap Other Non-Ferrous Household Kitchen & bathroom fixtures, coat hangers, other metal fixtures, closet doors, filing cabinets, furnishings, etc. 5 Appendix B Garbage Material Categories.docx
56 APPENDIX B FILE: SWM.SWOP JANUARY 2016 ISSUED FOR USE No. Primary Secondary Tertiary/Quaternary Additional Comments 82 Metals Non-Consumable Mixed Metals 83 Metals Non-Consumable Mixed Metals Machine Parts Construction/Industrial Auto parts, electric motors, bicycles and parts, lawn mowers, etc. Nails, screws, handheld tools, drywall trim, flashing, baseboard heaters, industrial doors, panels, etc. 84 Glass Beverage Containers Beer 85 Glass Beverage Containers Other Alcohol 86 Glass Beverage Containers Non-Alcoholic & Non-Dairy 87 Glass Beverage Containers Dairy or Dairy Substitute 88 Glass Food Containers Food Containers 89 Glass Other Glass and Ceramics Other Glass and Ceramics Dishware, mirrors, incandescent light bulbs, fibreglass insulation, plant pots, coffee cups 90 Building Material Gypsum / Drywall Gypsum/Drywall 91 Building Material Masonry Masonry 92 Building Material Rock, Sand, Dirt Rock, Sand, Dirt 93 Building Material Rigid Asphalt Rigid Asphalt 94 Building Material Carpet Waste Carpet Waste 95 Building Material Other Inorganics Other Inorganics 96 Electronic Waste Computers and Peripherals 97 Electronic Waste Computers and Peripherals 98 Electronic Waste Computers and Peripherals 99 Electronic Waste Computers and Peripherals 100 Electronic Waste Computers and Peripherals 101 Electronic Waste Televisions & AV Equipment 102 Electronic Waste Televisions & AV Equipment 103 Electronic Waste Telephones & Telecommunications Equipment Desktop Computers Notebook Computers Computer Peripherals Computer Monitors Printers, Scanners Televisions Other Audio/Video Mobile Phones & Accessories Including key board, mouse, cables, modems, routers and external hardware other than below 6 Appendix B Garbage Material Categories.docx
57 APPENDIX B FILE: SWM.SWOP JANUARY 2016 ISSUED FOR USE No. Primary Secondary Tertiary/Quaternary Additional Comments 104 Electronic Waste Telephones & Telecommunications Equipment 105 Electronic Waste Small Appliances & Floor Care Appliances Other Small Appliances & Floor Care Appliances Land line phones and accessories, fax machines Microwaves, toasters, vacuum cleaners, coffee makers, corded and cordless, etc. 106 Electronic Waste Electronic Toys Electronic Toys 107 Electronic Waste Smoke Detectors Smoke Detectors 108 Electronic Waste Other Electronics Other Electronics 109 Household 110 Household 111 Household Batteries Lead Acid Car, truck, boat, wheel chair, golf cart batteries over 2 kg under BCBCP Stewardship Program Batteries All Other Batteries All types of Rechargeable and Non Rechargeable Batteries Ni-Cd, Ni-MH, Li-ion and Small Pb under 1 kg, Dry cell, alkaline, copper top, button cell and other household batteries Medical/Biological Sharps Needles 112 Household Medical/Biological Animal Carcass (pets) 113 Household Medical/Biological Other Bandages, IV bags, etc. 114 Household HHW Stains/Preservatives 115 Household HHW Latex Paint 116 Household HHW Oil-Based Paint 117 Household HHW Paint Aerosols 118 Household HHW Solvents 119 Household HHW Cleaners, Soaps etc. 120 Household HHW Pesticides/Herbicides/Pres ervatives With PCP Reg. # 121 Household HHW Motor Oil 7 Appendix B Garbage Material Categories.docx
58 APPENDIX B FILE: SWM.SWOP JANUARY 2016 ISSUED FOR USE No. Primary Secondary Tertiary/Quaternary Additional Comments 122 Household 123 Household 124 Household 125 Household 126 Household 127 Household 128 Household 129 Household 130 Household Hygiene HHW HHW HHW HHW HHW Mercury Containing Items Mercury Containing Items Other HHW Biological Oil Filters Antifreeze Pharmaceuticals Other Petroleum Based Products Other Thermostats and Switches CFLs Other HHW or Containers Diapers 131 Household Hygiene Biological Pet Waste Animal feces, bedding, cat litter 132 Household Hygiene Biological Other (sanitary products, condoms) Sanitary napkins, tampons, condoms 133 Household Hygiene Liquid Product Personal Care Full shampoo bottles, beauty products, creams, etc. 134 Bulky Objects White Goods Large Appliances 135 Bulky Objects Furniture Mattresses, Box Springs 136 Bulky Objects Furniture Other Upholstered Furniture 137 Bulky Objects Furniture Other Furniture Composite furniture 138 Fines Fines Fines Items too small to classify efficiently (e.g. bread tabs, twist ties, typically <1") 8 Appendix B Garbage Material Categories.docx
59 2015 WASTE COMPOSITION MONITORING PROGRAM APPENDIX D SELECT SITE PHOTOGRAPHS 2015 Waste Composition Monitoring Program IFU.docx


60 APPENDIX D Photo 1: Sorting set-up at South Vancouver Transfer Station. Photo 2: Sorting set-up at Waste-to-Energy. 1 Appendix D Photos.docx
.")

61 APPENDIX D Photo 3: Single Family Residential Sample (North Shore Transfer Station). Photo 4: Industrial, Commercial & Institutional Sample (North Shore Transfer Station). 2 Appendix D Photos.docx
.")

62 APPENDIX D Photo 5: Drop-Off Sample (Surrey Transfer Station). Photo 6: Industrial, Commercial & Institutional Sample (Surrey Transfer Station). 3 Appendix D Photos.docx
.")

63 APPENDIX D Photo 7: Multi-Family Residential Sample (Vancouver South Transfer Station). Photo 8: Single Family Residential Sample (Vancouver South Transfer Station). 4 Appendix D Photos.docx
.")

64 APPENDIX D Photo 9: Multi-Family Residential Sample (Waste-to-Energy). Photo 10: Single Family Residential Sample (Waste-to-Energy). 5 Appendix D Photos.docx
 Week 1.")
 Week 2.")
65 APPENDIX D Photo 11: Single Family Residential Sample (North Shore Transfer Station) Week 1. Photo 12: Single Family Residential Sample (North Shore Transfer Station) Week 2. 6 Appendix D Photos.docx

.")
66 APPENDIX D Photo 13: 2 - Other Fine Office Paper or Envelopes. Photo 14: 28 - Single Serving Cups (Plastic). 7 Appendix D Photos.docx


67 APPENDIX D Photo 15: 38 - #6 Polystyrene Foam. Photo 16: 48 - Unavoidable food waste. 8 Appendix D Photos.docx

.")
68 APPENDIX D Photo 17: 58 - Other Wood. Photo 18: 66 - Other Rubber (Gloves). 9 Appendix D Photos.docx
.")
.")
69 APPENDIX D Photo 19: 74 - Food Containers (Metal). Photo 20: 88 - Food Containers (Glass). 10 Appendix D Photos.docx


70 APPENDIX D Photo 21: Small Appliances. Photo 22: 130 Diapers. 11 Appendix D Photos.docx
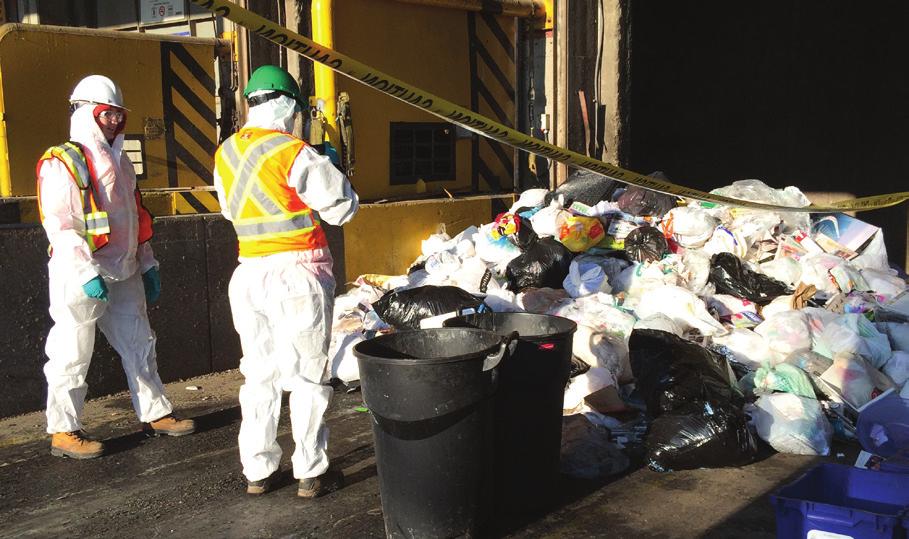


71
2015 Demolition, Land-clearing, and Construction Waste Composition Monitoring Program
 2015 Demolition, Land-clearing, and Construction Waste Composition Monitoring Program PRESENTED TO Metro Vancouver JANUARY 11, 2016 ISSUED FOR USE FILE: SWM.SWOP03008-01 Tetra Tech EBA Inc. Suite 1000
Metro Vancouver. Recycling and Solid Waste Management 2014 Report
 Metro Vancouver Recycling and Solid Waste Management 2014 Report Metro Vancouver Recycling and Solid Waste Management 2014 Summary Page 1 Metro Vancouver is responsible for the planning and management
Summary of Key Results
 Attachment 1 Summary of Key Results The 2016 Waste Characterization Study involved an extensive year-long process that produced a precise estimate of waste quantity and waste composition. Methods used
Household Container Recycling - High School Student Worksheet. Newspapers, Plastic Bottles, Glass Jars, Cardboard Boxes, etc.
 Name: Date: Part I: Introduction 1. List 4 household items that can be recycled. Newspas, Plastic Bottles, Glass Jars, Cardboard Boxes, etc. 2. What is Single Stream Recycling? A system where all types
COMPLETE ONLY ONE OF THE RECYCLING REPORT FORMS! HOW TO DECIDE WHICH REPORT TO SUBMIT:
 Annual Recycling Report Instructions for Forms FM-11, FM-12 or FM-13 COMPLETE ONLY ONE OF THE RECYCLING REPT FMS! HOW TO DECIDE WHICH REPT TO SUBMIT: Act 101 Compliance Report for Commercial, Municipal
Falcon Heights Recycling Report. Greg & Willie Tennis Tennis Sanitation 2/14/2014
 2013 Falcon Heights Recycling Report Greg & Willie Tennis Tennis Sanitation 2/14/2014 Index of Recycling Report Letter of Purpose. Page 1 Recycling Data Summary.... Page 2 Recycling Data (Single Family)...
Tompkins County Solid Waste Management Plan Executive Summary
 Tompkins County Solid Waste Management Plan Executive Summary Tompkins County has prepared a comprehensive, twenty-year Solid Waste Management Plan to comply with the requirements of the Solid Waste Management
2013 Statewide Waste Characterization
 Final Report 2013 Statewide Waste Characterization Minnesota Pollution Control Agency December 2013 2013 Statewide Waste Characterization prepared for Minnesota Pollution Control Agency St. Paul, Minnesota
Chapter 42 SOLID WASTE*
 Chapter 42 SOLID WASTE* * Cross References: Buildings and building regulations, ch. 14; manufactured homes, ch. 22; litter, mud, dirt, stone and debris control, 26-6; utilities, ch. 54. Sec. 42-1. Contracting
Annual Recycling Report Instructions for Form FM-11, FM-12 or FM-13 COMPLETE ONLY ONE OF THE RECYCLING REPORT FORMS!
 Annual Recycling Report Instructions for Form FM-11, FM-12 or FM-13 COMPLETE ONLY ONE OF THE RECYCLING REPT FMS! HOW TO DECIDE WHICH REPT TO SUBMIT: Act 101 Compliance Report for Commercial, Municipal
Consulting Services in Support of Resource Recovery Planning and Implementation
 FINAL REPORT MAY 2014 CITY OF DALLAS SANITATION SERVICES Consulting Services in Support of Resource Recovery Planning and Implementation Consulting Services in Support of Resource Recovery Planning and
Annual Recycling Report Instructions for Form FM-11, FM-12 or FM-13 COMPLETE ONLY ONE OF THE RECYCLING REPORT FORMS!
 Annual Recycling Report Instructions for Form FM-11, FM-12 or FM-13 COMPLETE ONLY ONE OF THE RECYCLING REPT FMS! HOW TO DECIDE WHICH REPT TO SUBMIT: Act 101 Compliance Report for Commercial, Municipal
HALIFAX REGIONAL SCHOOL BOARD Solid Waste Management Policy
 Public X Report No. 13-10-1435 Private Date: October 21, 2013 HALIFAX REGIONAL SCHOOL BOARD Solid Waste Management Policy PURPOSE: BACKGROUND: To seek approval from the Governing Board for revisions to
Commercial and industrial waste in Sydney. Overview. Department of Environment, Climate Change and Water NSW
 Commercial and industrial waste in Sydney Overview Department of Environment, Climate Change and Water NSW House Commercial deconstruction and industrial waste in Sydney Manufacturers, shops and businesses
UNIFIED FACILITIES GUIDE SPECIFICATIONS
 USACE / NAVFAC / AFCEC / NASA UFGS-01 74 19 (January 2007) Change 2-05/15 ---------------------------- Preparing Activity: USACE Superseding UFGS-01 74 19 (October 2006) UNIFIED FACILITIES GUIDE SPECIFICATIONS
Economic Impact of Recycling in Alabama and Opportunities for Growth. Alabama Department of Environmental Management. Land Division Solid Waste Branch
 Economic Impact of Recycling in Alabama and Opportunities for Growth Alabama Department of Environmental Management Land Division Solid Waste Branch June 2012 Alabama Department of Environmental Management
Municipal Organic Waste Diversion and Composting in Metro Vancouver
 May 5, 2015 Municipal Organic Waste Diversion and Composting in Metro Vancouver Greenhouse Gas Emission Reductions and Credits for Climate Action Reporting 2014 Reporting Year (Amended Final Report) This
The purpose of this report is to obtain Council authority to set 2017 solid waste utility rates and fees and amend the Solid Waste By-law.
 ADMINISTRATIVE REPORT Report Date: November 23, 2016 Contact: Albert Shamess Contact No.: 604.873.7300 RTS No.: 11614 VanRIMS No.: 08-2000-20 Meeting Date: December 7, 2016 TO: FROM: SUBJECT: Vancouver
GREATER VANCOUVER SEWERAGE AND DRAINAGE DISTRICT (GVS&DD) BOARD OF DIRECTORS
 BOARD OF DIRECTORS") Meeting 3 of 6 GREATER VANCOUVER SEWERAGE AND DRAINAGE DISTRICT (GVS&DD) BOARD OF DIRECTORS REGULAR BOARD MEETING Friday, January 27, 2017 9:00 A.M. 2 nd Floor Boardroom, 4330 Kingsway, Burnaby, British
Meeting 3 of 6 GREATER VANCOUVER SEWERAGE AND DRAINAGE DISTRICT (GVS&DD) BOARD OF DIRECTORS REGULAR BOARD MEETING Friday, January 27, 2017 9:00 A.M. 2 nd Floor Boardroom, 4330 Kingsway, Burnaby, British
Dirty Regrind Specifications
 Dirty Regrind Specifications Issue: The quality requirements for PET regrind are far more demanding than for baled PET. And, the allowable levels of contamination in PET regrind are in the parts per million
HALIFAX REGIONAL SCHOOL BOARD Solid Waste Management Policy
 Public Report 08-10-1176 Private X Date Jan. 21, 2009 HALIFAX REGIONAL SCHOOL BOARD Solid Waste Management Policy PURPOSE: This report is prepared by Operations Services and submitted for approval from
BOMA BEST Sustainable Buildings 3.0 Waste Auditing Requirements
 BOMA BEST Sustainable Buildings 3.0 Waste Auditing Requirements This document provides the requirements for completing an audit compliant with the BEST Practice. For a more comprehensive description of
CITY CLERK. Blue Box Residue and Recycling of Coloured Glass
 CITY CLERK Clause embodied in Report No. 6 of the, as adopted by the Council of the City of Toronto at its meeting held on May 21, 22 and 23, 2002. 2 Blue Box Residue and Recycling of Coloured Glass (City
3. QUANTITATIVE WASTE DIVERSION ASSESSMENT
 3. QUANTITATIVE WASTE DIVERSION ASSESSMENT 3.1 Automated measurement of residual household waste Ongoing technical problems with the RCV and weighing system throughout the project constrained the amount
Plastics & Municipal Sustainability Opportunities Tools to Enhance Sustainability Through Increased Recovery
 Plastics & Municipal Sustainability Opportunities Tools to Enhance Sustainability Through Increased Recovery Association of Municipalities August 19, 2015 1 Session Overview CPIA s Keys for Sustainable
2010 UNITED STATES NATIONAL POST- CONSUMER PLASTICS BOTTLE RECYCLING REPORT
 2010 UNITED STATES NATIONAL POST- CONSUMER PLASTICS BOTTLE RECYCLING REPORT INTRODUCTION The 2010 edition of the United States National Post-Consumer Plastics Bottle Recycling Report is the 21 st annual
2009 UNITED STATES NATIONAL POST- CONSUMER PLASTICS BOTTLE RECYCLING REPORT
 2009 UNITED STATES NATIONAL POST- CONSUMER PLASTICS BOTTLE RECYCLING REPORT INTRODUCTION The 2009 edition of the United States National Post-Consumer Plastics Bottle Recycling Report is the 20 th annual
APPENDIX G GUIDELINE FOR INTEGRATED MANAGEMENT OF CONSTRUCTION WASTE
 APPENDIX G GUIDELINE FOR INTEGRATED MANAGEMENT OF CONSTRUCTION WASTE Waste is broadly defined by the Department of Water Affairs in 1994 as: an undesirable or superfluous by-product, emission, residue
Regional Waste Management/Material Recovery Facility Study Report
 Regional Waste Management/Material Recovery Facility Study Report PRESENTED TO MD of Foothills No. 31 Town of Black Diamond Town of High River Town of Nanton Town of Okotoks Town of Turner Valley MARCH
Considerations for a Statewide Container Recycling Refund Program. cmconsultinginc.com
 Considerations for a Statewide Container Recycling Refund Program cmconsultinginc.com In business since 1998, Ontario, Canada What we do: Environmental research and report writing Stewardship program planning
VILLAGE OF EDEN RECYCLING ORDINANCE
 VILLAGE OF EDEN RECYCLING ORDINANCE 1.01Title. Recycling Ordinance for Village of Eden, Fond du Lac County, Wisconsin. This ordinance will replace any and all previously adopted ordinances regarding recycling.
REPORT TO THE CHIEF ADMINISTRATIVE OFFICER FROM THE PUBLIC WORKS AND UTILITIES DEPARTMENT PROPOSED LANDFILL TIPPING FEE INCREASES
 July 24, 2014 REPORT TO THE CHIEF ADMINISTRATIVE OFFICER FROM THE PUBLIC WORKS AND UTILITIES DEPARTMENT ON PROPOSED LANDFILL TIPPING FEE INCREASES PURPOSE To seek Council's approval to increase tipping
PSU Urban Center Building
 PSU Urban Center Building Materials Assessment Prepared for Portland State University Eric T. Crum Moonrose Doherty Gretchen Sandau December 9, 2013 Director Materials Assessment Manager Materials Assessment
Arizona Department of Environmental Quality Annual Waste Reduction and Recycling Questionnaire
 Arizona Department of Environmental Quality Annual Waste Reduction and Recycling Questionnaire Fiscal Year 2000: July 1, 1999 to June 30, 2000 Jurisdiction: This questionnaire contains the following five
TN RECYCLES INVEST IN SUSTAINABLE GROWTH REDUCE DISPOSAL REALIZED POTENTIAL CAPTURE VALUE CREATE JOBS
 TN RECYCLES INVEST IN SUSTAINABLE GROWTH CREATE JOBS REDUCE DISPOSAL CAPTURE VALUE REALIZED POTENTIAL Lifecycle of Material in Tennessee s Recycling Economy JOBS MATERIAL COST/VALUE URBAN W/ CURBSIDE &
Source Reduction, Recycling, Composting, and Disposal Information and Worksheets
 Source Reduction, Recycling, Composting, and Disposal Information and Worksheets These pages contain helpful background information and instructions. You are encouraged to read through them and complete
Part 2: Away-from-home Recycling
 Part 2: Away-from-home Recycling Table 2.1 Examples of Away-from-home (AfH) locations where beverage containers are consumed and discarded Category Public spaces Examples Parks, streets, transit stops,
A Guide to Source Separation of Recyclable Materials for Industrial, Commercial and Institutional Sectors and Multi-Unit Residential Buildings
 A Guide to Source Separation of Recyclable Materials for Industrial, Commercial and Institutional Sectors and Multi-Unit Residential Buildings As Required under Ontario Regulation 103/94 You can view and
METRO VANCOUVER MATERIAL DISPOSAL BAN PROGRAM. SWRC Conference April 23, 2015 Brandon Ho, P. Eng. Senior Project Engineer
 METRO VANCOUVER MATERIAL DISPOSAL BAN PROGRAM SWRC Conference 2015 April 23, 2015 Brandon Ho, P. Eng. Senior Project Engineer Presentation Overview Metro Vancouver Solid Waste System Metro Vancouver Integrated
TABLE OF CONTENTS. 1.1 General Background Waste Diversion Waste Disposal WASTE COLLECTION AND DISPOSAL...
 Draft Environmental Assessment Terms of Reference Supplementary Document Waste Management System Summary TABLE OF CONTENTS 1. INTRODUCTION...1 1.1 General...1 1.2 Background...1 1.3 Waste Diversion...1
Municipal Solid Waste Generation, Recycling, and Disposal in the United States: Facts and Figures for 2011
 Municipal Solid Waste Generation, Recycling, and Disposal in the United States: Facts and Figures for 2011 The U.S. Environmental Protection Agency (EPA) has collected and reported data on the generation
Municipal Solid Waste Generation, Recycling, and Disposal in the United States: Facts and Figures for 2010
 Municipal Solid Waste Generation, Recycling, and Disposal in the United States: Facts and Figures for 2010 The U.S. Environmental Protection Agency (EPA) has collected and reported data on the generation
Sustainable NREL. Waste Management and Pollution Prevention. Ellen Fortier. September 18, 2013
 Sustainable NREL Waste Management and Pollution Prevention Ellen Fortier September 18, 2013 NREL is a national laboratory of the U.S. Department of Energy, Office of Energy Efficiency and Renewable Energy,
Master Recycler Training Intro
 Master Recyclers Intro Master Recycler Training Intro Paul Kroening, Recycling Program Manager Paul Kroening, Recycling Program Manager Hennepin County Environment and Energy History of Waste Disposal
GS1 Canada Stewardship Initiative Implementation Guide
 GS1 Canada Stewardship Initiative Implementation Guide November 2011 Purpose The purpose of this document is to define the data attributes required to allow private label product suppliers to synchronize
Dynamic Duo PET AND HDPE // RECYCLED/RECYCLABLE MATERIAL TRAYS
 > Dynamic Duo PET AND HDPE // RECYCLED/RECYCLABLE MATERIAL TRAYS SWITCH TO THE ENVIRONMENTALLY RESPONSIBLE SOLUTIONS TM Replace your foam trays with repeteable TM and rehdpeable trays. Polystyrene (PS)
Supplement to the Republic of Zambia Government Gazette dated XX, 2009 GOVERNMENT OF ZAMBIA
 Supplement to the Republic of Zambia Government Gazette dated XX, 2009 GOVERNMENT OF ZAMBIA STATUTORY INSTRUMENT NO. XX OF 2009 The Environmental Protection and Pollution Control Act (Act No. 12 of 1990)
Converting Waste Plastics into Fuel: A Proposed SWM Project in the City of Cebu, Philippines
 Converting Waste Plastics into Fuel: A Proposed SWM Project in the City of Cebu, Philippines Presented by: Nigel Paul C. Villarete City Planning and Development Office Cebu City, PHILIPPINES Outline of
Waste Watch Keeping Our Island Green
 Waste Watch Keeping Our Island Green 18th National Composting Conference Chateau Mont-Sainte-Anne, Quebec September 17-19, 2008 Presented By: Heather Myers, Disposal Manager Island Waste Management Corporation
Fauquier County Department of Environmental Services
 Fauquier County Department of Environmental Services W. Nathaniel Townley Commodity Coordinator Former Chairman VRA C&D Committee Building Contractor Phone : 540-347-6811 Mobile : 540-631-4321 Fax : 540-341-7129
San Francisco s Food Composting Program
 San Francisco s Food Composting Program Alexa Kielty Department of the Environment City and County of San Francisco alexa.kielty@sfgov.org Mid-Atlantic Organics Summit November 30, 2006 San Francisco Background
THE FACTS: CHINA S TIGHTER CONTROLS ON THE QUALITY OF WASTE IMPORTS
 UPDATED 16 th February 2018 THE FACTS: CHINA S TIGHTER CONTROLS ON THE QUALITY OF WASTE IMPORTS The recycling, recovery and trade in recovered materials is a multi-billion dollar global business. Millions
European Approach to Recycling Depots. Paul van der Werf, 2cg Inc. RCBC Conference. Whistler, BC. 29 May 2014
 European Approach to Recycling Depots Paul van der Werf, 2cg Inc. RCBC Conference. Whistler, BC. 29 May 2014 Introduction Overview European examples Drivers Best practices Statistics Conclusions Recycling
THE FACTS: CHINA S TIGHTER RESTRICTIONS ON WASTE IMPORTS
 THE FACTS: CHINA S TIGHTER RESTRICTIONS ON WASTE IMPORTS The recycling, recovery and trade in recovered materials is a multi-billion dollar global business. Millions of tonnes of recovered materials are
Reduce, Reuse, Recycle. Lesson Plan: NRES G1-1
 Reduce, Reuse, Recycle Lesson Plan: NRES G1-1 1 Anticipated Problems 1. What do reduce, reuse, and recycle mean? 2. Why is reducing, reusing, and recycling important? 2 Terms recycling reducing reusing
A GUIDE TO WORKPLACE COMPOSTING
 A GUIDE TO WORKPLACE COMPOSTING CONTENTS INTRODUCTION.... 3 START UP CHECK LIST: THE 6 C S.... 5 PLANNING A COMPOSTING PROGRAM AT THE WORKPLACE.... 6 Step One: Confirm Availability of Organics Collection....
County of Simcoe. Solid Waste Management Strategy Update Potential Options and Initiatives
 County of Simcoe Solid Waste Management Strategy Update Potential Options and Initiatives December 8, 2015 Today s Objectives 1. Review existing Strategy, current system, and performance; 2. Consider potential
Appendix D: Summary of Municipal Services Provided to the IC&I Sector
 Appendix D: Summary of Municipal Services Provided to the IC&I Sector THE GREATER GOLDEN HORSESHOE Region/City IC&I Services Provided by Municipalities Additional Information Region of Niagara City of
Waste Audit Report 2010
 Waste Audit Report 2010 Submitted by Kisti Thomas April 21, 2010 EXECUTIVE SUMMARY The 2010 waste audit was conducted the third week of March at the University of Winnipeg. The annual audit serves to assess
Green Bin Audit Report Understanding contamination in curbside organics collection
 Green Bin Audit Report 2015 Understanding contamination in curbside organics collection Contents Executive Summary... 3 Audit 2015... 4 Background... 4 How Organic Waste is collected... 4 Education...
RESIDENTIAL WASTE DIVERSION STRATEGY November 30, 2015
 RESIDENTIAL WASTE DIVERSION STRATEGY November 30, 2015 Waste & Recycling Services Table of Contents WHY DO WE NEED A STRATEGY?...2 WHAT ARE WE WASTING?...4 WHAT ARE WE DIVERTING?...5 WHAT COULD WE DO
Chenango County Department of Public Works DRAFT. Comprehensive Solid Waste Management Plan Modification. June Prepared By:
 Chenango County Department of Public Works DRAFT Comprehensive Solid Waste Management Plan Modification June 2009 Prepared By: Chenango County Department of Public Works 79 Rexford Street Norwich, NY 13815
Developing a Zero Waste Implementation Plan, Montgomery County, MD MRN/SWANA-MidAtlantic Annual Conference Maryland Recycling Network
 Developing a Zero Waste Implementation Plan, Montgomery County, MD 2014 MRN/SWANA-MidAtlantic Annual Conference Maryland Recycling Network Bill Davidson, DSWS, June 19, 2014 Key Thoughts Eye on the Ball
Future of Solid Waste Management
 Future of Solid Waste Management T E D S I E G L E R D S M E N V I R O N M E N T A L S E R V I C E S, I N C. W I N D S O R, V T ( 8 0 2 ) 6 7 4-2840 W W W. D S M E N V I R O N M E N T A L. C O M Caution
RECYCLING & TRASH REPORT FY 2015
 RECYCLING & TRASH REPORT FY 2015 EXECUTIVE SUMMARY In May 2010, Temple University adopted its Climate Action Plan, which addresses the role of recycling and waste minimization as part of its comprehensive
On the Road to Zero Waste
 On the Road to Zero Waste RABANCO Operator of the Roosevelt Regional Landfill, Klickitat County Gas-to-Energy System & Recycled Material Recovery Facility Award Winning Gas-to-Energy Plant Rabanco s History
Solid Waste Analysis Protocol. Summary Procedures
 Solid Waste Analysis Protocol Summary Procedures Published in March 2002 by the Ministry for the Environment PO Box 10-362, Wellington, New Zealand ISBN 0-478-24058-9 ME number 430 This document is available
Source Reduction, Recycling, Composting, and Disposal Information and Worksheets
 Source Reduction, Recycling, Composting, and Disposal Information and Worksheets These pages contain helpful background information and instructions. You are encourage to read through them and complete
3 UPDATE ON MANDATORY COMPOSTABLE BAGS IN THE GREEN BIN PROGRAM
 3 UPDATE ON MANDATORY COMPOSTABLE BAGS IN THE GREEN BIN PROGRAM The Environmental Services Committee recommends the adoption of the recommendations contained in the following report dated April 26, 2013,
Canadian Residential Plastics Packaging: Recycling Program Access Report
 Canadian Residential Plastics Packaging: Recycling Program Access Report Determining the level of access to recycling of plastic materials via residential recycling programs and return to retail programs
Recycling Re-education in New Jersey. What are we covering?
 Recycling Re-education in New Jersey Center for Government Services Conference Eric Gabrielson Recycling Consultant March 19, 2015 What are we covering? Material values/current recycling markets Vendor
Approved University Standards Indoor Bins and Signs for Recycling, Trash and Compost. Last updated by Joe Abraham on
 Approved University Standards Indoor Bins and Signs for Recycling, Trash and Compost Last updated by Joe Abraham on 8-1-17 Introduction This document presents proposed standards for indoor recycle, compost
 ... 1. Packaging Industry Overview Indian packaging industry is valued at about US$ 13 billion. The industry is expected to grow at a 10-year compound annual growth rate (CAGR) of over 15 per cent to about
GREATER VANCOUVER SEWERAGE AND DRAINAGE DISTRICT BYLAW NO. 287, A Bylaw to Establish the Tipping Fee and Solid Waste Disposal Regulation
 GREATER VANCOUVER SEWERAGE AND DRAINAGE DISTRICT BYLAW NO. 287, 2014 A Bylaw to Establish the Tipping Fee and Solid Waste Disposal Regulation WHEREAS: A. Pursuant to the Greater Vancouver Sewerage and
CONSTRUCTION WASTE MANAGEMENT PLAN
 CONSTRUCTION WASTE MANAGEMENT PLAN Project: Construction Manager: Location: Prepared by: PREMIER FACILITY MANAGEMENT (PFM) Date: I. OBJECTIVES The objectives of this plan are to: 1. Recycle, reuse or salvage
SWANA RECYCLING TECHNICAL ASSISTANCE STUDY PROPOSED BRADFORD COUNTY FIBER PROCESSING FACILTITY
 SWANA RECYCLING TECHNICAL ASSISTANCE STUDY PROPOSED BRADFORD COUNTY FIBER PROCESSING FACILTITY Prepared for: NORTHERN TIER SOLID WASTE AUTHORITY WEST BURLINGTON TOWNSHIP, BRADFORD COUNTY, PENNSYLVANIA
Volume to Weight Conversion Ratios for Commercial Office Waste in New York City
 Volume to Weight Conversion Ratios for Commercial Office Waste in New York City Authors: Amy Marpman, Matthew Shurtleff, Ross Guberman, Richard Fuller Date: January 2013 Abstract This paper establishes
Solid Waste Management in Middlesex County
 A Profile of Solid Waste Management in Middlesex County Division of Solid Waste Management 711 Jersey Avenue New Brunswick, NJ 08901 732-745-4170 1 Solid Waste Management in Middlesex County Middlesex
May Organics Disposal Ban Readiness Research
 May 2015 Organics Disposal Ban Readiness Research 1 Background and Research Objectives On January 1, 2015, Metro Vancouver introduced the Organics Disposal Ban, encouraging all businesses and residential
Town of The Blue Mountains Waste Diversion Plan
 Report on Waste Diversion Plan Completed by: Adam McMullin Environmental Initiatives Coordinator October 2012 This Project has been delivered with the assistance of Waste Diversion Ontario s Continuous
STATUS REPORT ON WASTE MANAGEMENT
 COUNTY OF BRUCE STATUS REPORT ON WASTE MANAGEMENT 2013 Prepared by: Bruce County Highways Department October 31, 2014 TABLE OF CONTENTS 1. Introduction 2 2. Background 2 2.1. County Responsibilities 2
APPENDIX B CONSTRUCTION WASTE MANAGEMENT SAMPLE SPECIFICATION
 APPENDIX B CONSTRUCTION WASTE MANAGEMENT SAMPLE SPECIFICATION The following appendix includes information and standard drawings that are diagrammatic and are used only to convey intent. Construction Waste
Sort waste correctly. We will help you.
 www.tespra-hodonin.cz, phone: +420 518 397 111 Sort waste correctly. We will help you.. YOUR PARTNER FOR WASTE How to sort paper correctly? Paper is a very well recyclable material. Why then to destroy
war on waste food packaging study: wave 1
 war on waste food packaging study: wave 1 War on Waste Report October 2007 Prepared for: Local Government Association Prepared by: Claire Bassett Angela Charlton BMRB Social Research Telephone: 020 8433
BAG QUANTITY ASSUMPTIONS
 BAG QUANTITY ASSUMPTIONS BEACON Single Use Carryout Bag Ordinance By Anthony van Leeuwen, 4 March 2013 Plastic Carry Out Bags The BEACON Single Use Carryout Bag Ordinance Draft Environmental Impact Report
1. Background 2 2. Methodology Audit Analysis Mixed Recycling Audit Analysis General Waste. 5. Audit Analysis - Composting 11
 Contents 1. Background 2 2. Methodology 3 3. Audit Analysis Mixed Recycling 4 4. Audit Analysis General Waste 8 5. Audit Analysis - Composting 11 6. Audit Analysis Cardboard 11 7. Conclusion 12 8. Recycling
E. Appendix. Master Plan Update. Appendix E WASTE MANAGEMENT AND RECYCLING BASELINE ASSESSMENT
 E. Appendix E.1. WASTE MANAGEMENT AND RECYCLING BASELINE ASSESSMENT The Federal Aviation Administration (FAA) Reauthorization bill (FAA Modernization and Reform Act of 2012) requires airport master plans
Nicosia Municipality Waste Management Practices and Policies. Nicosia 23 October 2016
 Nicosia Municipality Waste Management Practices and Policies Nicosia 23 October 2016 1 Michael Lagos Municipal Health Inspector Head of Nicosia Municipality Cleaning and Health Department 2 Task of the
CITY OF FONTANA COMMUNITY DEVELOPMENT DEPARTMENT Building and Safety Division Construction Waste Management Plan (CWMP) (Provide During Plan Review)
 (Provide During Plan Review)") CITY OF FONTANA COMMUNITY DEVELOPMENT DEPARTMENT Building and Safety Division Construction Waste Management Plan (CWMP) (Provide During Plan Review) Building permit applicants must prepare a Construction
CITY OF FONTANA COMMUNITY DEVELOPMENT DEPARTMENT Building and Safety Division Construction Waste Management Plan (CWMP) (Provide During Plan Review) Building permit applicants must prepare a Construction
Data Collection & Management to Assess Performance
 Data Collection & Management to Assess Performance Tara Wilcox, M.Sc.Eng Jennifer White, P.Eng May, 2015 Page 1 Waste Management in Canada What is measured? How is it measured? Data Collection Challenges
WASTE AUDIT AND INVENTORY
 California State University East Bay WASTE AUDIT AND INVENTORY FINAL REPORT Prepared by Cascadia Consulting Group, Inc. December 17, 2015 EXECUTIVE SUMMARY California State University East Bay (CSU EB)
Solid Waste Management Strategy
 APPENDIX A Whistler Solid Waste Management Strategy Solid Waste Management Strategy The Resort Municipality of Whistler July 2, 2013 TABLE OF CONTENTS 1. Executive Summary... 1 1.1. Background... 1 1.2.
Proposed goal: Reduce resource consumption and the generation of waste*
 Resource Use and Waste reduction action plan Last revised September 26, 2011 GOAL Proposed goal: Reduce resource consumption and the generation of waste* *Rational: The Waste Advisory Committee has suggested
Saskatchewan Solid Waste Management Strategy
 April/17 Saskatchewan Solid Waste Management Strategy Discussion Paper March 2017 saskatchewan.ca/environment Table of Contents Introduction...........................................................................
MMBC Program Update. Allen Langdon, Managing Director. CAO and Chair Forum March 29 th, 2015
 MMBC Program Update Allen Langdon, Managing Director CAO and Chair Forum March 29 th, 2015 About MMBC! MMBC is a not-for-profit agency formed under the BC Society Act to develop a stewardship plan to satisfy
An Integrated Waste Management System
 An Integrated Waste Management System Data and Recommendations for Guelph, Ontario L. Otten, S.H. Birkett and D. Hoornweg School of Engineering, University of Guelph, Guelph, Ontario N1G 2W1 Wellington
LARNAKA SOLID WASTE MANAGEMENT
 LIFE2015/ENV/PT/000609 LARNAKA SOLID WASTE MANAGEMENT / Acting Municipal Secretary, Solid Waste Management (1) The facility is designed to handle mixed municipal solid waste (MSW) and is located 10km from
Feasibility Study: Curbside Recycling Collection in the District of Squamish
 Feasibility Study: Curbside Recycling Collection in the District of Squamish Prepared for District of Squamish Submitted by Gartner Lee Limited December 2007 Feasibility Study: Curbside Recycling Collection
RFP PS Provision of Weigh Scale Management and Point of Sale System
 RFP PS20161055 Provision of Weigh Management and Point of Sale System List of Appendices: Appendix 1-A Site Layout Diagrams (3 pages) Appendix 1-B Workflows (8 pages) Appendix 1-C Schematic Network Architecture
Technical Memorandum No. 1. Current System Summary
 Technical Memorandum No. 1 Current System Summary Table of Contents 1 Introduction and Background... 1 1.1 Current Waste Management System Overview... 2 1.2 Why a Long Term Waste Management Strategy is