Staten Island Green Zone Study
|
|
|
- Moses Turner
- 6 years ago
- Views:
Transcription

1 Staten Island Green Zone Study
2

3 B e s t P r a c t i c e s i n t h e R e d e v e l o p m e n t o f G r e e n / I n d u s t r i a l Z o n e s Staten Island Economic Development Corporation Submitted by: Parsons Brinckerhoff PlaceMaking 21 November 2011
4
5 TABLE OF CONTENTS INTRODUCTION 5 CASE STUDIES Toledo, Ohio Buffalo, New York Pittsburgh, Pennsylvania Baltimore, Maryland Menomonee Valley, Wisconsin CONCLUSION 29 ATTACHMENTS 33
6


7 introduction
8 Best Practices in the Redevelopment of Green/Industrial Zones why best practices? The Staten Island Economic Development Corporation (SIEDC) is searching for applicable organizations that have successfully redeveloped industrial zones in order to gain insight and knowledge that will help in crafting a Staten Island Green Zone development approach. Through our best practice research, we have been able to capture leadership structure, the critical path required, and the unique steps taken to achieve success made by five representative industrial redevelopment organizations. These stories will serve as context for the approach that we will develop for the Staten Island Green Zone. Our effort involved exploratory research, interviews with key individuals and cataloguing of relevant materials, all of which will inform our strategic approach. Through this exercise, we have learned what has been successful, what has challenged these organizations, the steps taken and the levers available to achieve redevelopment. We recognize that every zone is a unique district containing governmental, physical, financial and economic structures. We have learned that each redevelopment plan requires the ability to respond to the local condition. It is clear from our research that there are some common themes and some transportable actions and strategies that warrant further scrutiny as we tackle the issues inherent to the Staten Island Green Zone. 6 Parsons Brinckerhoff PlaceMaking
9 Introduction We researched numerous zones in order to develop our best practices, including the Philadelphia Naval Ship Yard, Bridgeport Eco-Industrial Park and Devens, Massachusetts. The findings from all investigations will factor in to our economic development strategy. The best practices report will focus specifically on five representative examples ranging from recently started zones to well established zones, each having a specific characteristic that attracted our attention. TRACE - Toledo, OH: A green zone that is currently in formation in an economically depressed rust belt city Buffalo, NY: An established industrial development zone in New York State ARTEZ - Allegheny River Towns, PA: A Green Development Zone that has been successful in attracting new industrial growth Fairfield Industrial Park, Baltimore, MD: An urban Eco- Industrial Park Menomonee Valley, WI: A signature successful industrial redevelopment zone built on green principles We recognized that there are three over-arching commonalities associated with all of the zones studied: Perseverance this type of development takes time (in most cases, significant progress was reported after years) Leadership organizations had strong leadership built from within as well as champions within their respective city and state elected officials Partnerships whether they re with institutions, industry or environmental groups, all of these organizations recognized they could not be successful alone. These three ingredients were consistent across the board and constantly referenced when discussing how redevelopment strategies were implemented. We will need to consider how these ingredients play out with the Staten Island Green Zone. 7

10 Best Practices in the Redevelopment of Green/Industrial Zones case study one 8 Parsons Brinckerhoff PlaceMaking

11 Toledo Regional Architects, Contractors and Engineers Association (TRACE), Toledo, Ohio Toledo, Ohio is an aging rust belt city situated along the western edge of Lake Erie. The economic lifeline for this City for most of the twentieth century was centered upon auto manufacturing and manufacturing of automobile parts especially for the Chrysler brands. As the business of making automobiles shifted out of the United States and global competition bit deeply into the profits of the big three auto makers in the United States, the auto industry in Toledo was virtually wiped out. Former manufacturing plants were abandoned and jobs were lost, neighborhoods suffered tremendous blight. As Toledo now looks to shift its focus to a more diversified economy, projects are focusing on specific industrial locations that have the opportunity to be re-adapted for new use. TRACE has focused on The Jeep Parkway plant which was formally closed in 2006 when Jeep made the commitment to build a new plant outside of the United States. This large industrial site employed more than 1000 workers in its heyday. A number of institutions are trying to combat industrial flight in the city and have partnered to try and transform the Toledo economy. The Toledo-Lucas County Port Authority 9

12 Best Practices in the Redevelopment of Green/Industrial Zones HISTORIC JEEP PLANT in Toledo, Ohio ( Port Authority ), Toledo Regional Architects, Contractors and Engineers ( TRACE ) and the local universities have all developed programs and initiatives to help develop a green economy in the region. The Port Authority has created a brownfield financing program to redevelop privately owned sites, and has taken ownership of the larger more complex brownfield sites. TRACE provides technical assistance leveraging their membership s expertise in both the design of real estate and manufacturing processes. The University of Toledo expanded their research efforts to promote a green economy in the city. They created the Clean and Alternative Energy and secured over $46 million in Federal and State funding for the Wright Center for Photovoltaic Innovation and Commercialization. process The Port Authority along with other local stakeholders identified the former Jeep site, the largest available contiguous vacant land within Toledo, as a redevelopment priority. The former Jeep plant is a 110-acre site, purchased by the Port Authority in September 2010 for $95,000. The Port Authority has been focused on the cleanup and preparation of the property for redevelopment. It recently secured two Clean Ohio Revitalization Fund Grants totaling just under $4.5 million to remediate soils and demolish existing building foundations. The Port Authority also received $1.3 million from the U.S. HUD Economic Development Initiative Grant Program to cover a portion of the costs associated with the acquisition and remediation of the site. The City of Toledo provided a $340,000 grant from its Revolving Loan Fund for the removal of trichloroethylene (TCE) from the site. The Ohio EPA also awarded its first Environmental Insurance Subsidy request to the Port Authority for $15,000 to protect it from liabilities that are not covered in the Ohio EPA Voluntary Action Plan. Key Features of the new Green Business Park: The larger building with fewer outside walls will be retained and subdivided to reduce energy loss and building construction costs Solar and geothermal will be used at the site to reduce energy costs A bus transfer station is being developed next door in order to ensure workers have access to multi-modal transportation A recruitment center to attract workers to the site is planned A job-training center will be established to ensure businesses in the park have highly trained workers Primary target market will be the recruitment of high tech and green businesses to support the auto sector A new gateway to the community is planned to create a better connection with the neighborhood The Port Authority engaged TRACE, to help provide a broad redevelopment vision for the site. Through TRACE, a master plan for the site was completed during the summer of The long-term vision for the former Jeep site is to transform the vacant industrial property into a job source with new business opportunities, and to serve as a model for renewable energy and sustainable design. The final plan created a seven building complex, with 930,000 sq. ft. of flex commercial/industrial space. The plan also includes a number of opportunities for recreational activity on the site including trails, gazebos and historical signage. The redevelopment includes a number of green strategies, including solar panels, bio-swales, native vegetation, and rail access. TRACE also recognized that the surrounding neighborhood is an important ingredient in the redevelopment strategy. With the support of US EPA and the Toledo Foundation, an initiative to improve and green the neighborhood surrounding the site has been initiated. Aspects of this process include but are not limited to: improving boulevards surrounding the site, creating bike lanes and greenway connections for multi-modal access for those without cars, improving housing stock, identifying sites with synergies to the Old Jeep Plant site, identifying an educational cluster that will support employers in the new business park. 10 Parsons Brinckerhoff PlaceMaking


13 Case Study One CONSIDERABLE THOUGHT HAS BEEN DEVOTED to not just the redevelopment of the former Jeep Plant site, but how it fits in the larger regional context and how connections and mobility can be addressed at a more regional level. lessons learned Although the project is still in the formative stages, a number of lessons learned can be gleaned from the initial success of the project. The initial success in securing funding and developing the master plan can be traced directly to the partnerships between local, regional and federal jurisdictions on the goals of the project. The partnering extends beyond the agencies to the business community, not-for-profits, and local residents. The creation of common goals and identifying expectations such as local jobs, can minimize points of friction as the development moves forward. The project also builds on relationships between governmental and educational institutions, in creating synergies that can bring new business and technologies on line faster. A CONCEPTUAL PLAN shows possible building cluster and maximizing the amount of green space as well as bike and pedestrian trails within the site. The second key is that green zones should build on the strengths of the area and the site. In the case of the Jeep Parkway Property, the site takes advantage of its large footprint to allow for the positioning of a number of larger buildings that can be used for business incubators that can share resources. The site plan also leverages institutional knowledge from existing or former industry in the area, including the auto and solar industries. 11
![case study two LOREM IPSUM DOLOR SIT AMET LOREM IPSUM DOLOR [H1] Lorem ipsum dolor sit amet, consectetur adipisicing elit, sed do eiusmod tempor incididunt ut labore et dolore magna aliqua.](/docs-images/80/80571462/images/14-0.jpg "Ut enim ad minim veniam, quis nostrud exercitation ullamco laboris nisi ut aliquip ex ea commodo consequat.")
14 case study two LOREM IPSUM DOLOR SIT AMET LOREM IPSUM DOLOR [H1] Lorem ipsum dolor sit amet, consectetur adipisicing elit, sed do eiusmod tempor incididunt ut labore et dolore magna aliqua. Ut enim ad minim veniam, quis nostrud exercitation ullamco laboris nisi ut aliquip ex ea commodo consequat. Duis aute irure dolor in reprehenderit in voluptate velit esse cillum dolore eu fugiat nulla pariatur. Excepteur sint occaecat cupidatat non proident, sunt in culpa qui officia deserunt mollit anim id est laborum. Lorem ipsum dolor sit amet, consectetur adipisicing elit, sed do eiusmod tempor incididunt ut labore et dolore magna aliqua. Ut enim ad minim veniam, quis nostrud exercitation ullamco laboris nisi ut aliquip ex ea commodo consequat. Duis aute irure dolor in reprehenderit in voluptate velit esse cillum dolore eu fugiat nulla pariatur. Lorem ipsum dolor sit amet, consectetur adipisicing elit, sed do eiusmod tempor incididunt ut labore et dolore magna aliqua. Ut enim ad minim veniam, quis nostrud exercitation ullamco laboris nisi ut aliquip ex ea commodo consequat. Lorem ipsum dolor sit amet Lorem ipsum dolor [H2] Lorem ipsum dolor sit amet, consectetur adipisicing elit, sed do eiusmod tempor incididunt ut labore et dolore magna aliqua. Ut enim ad minim veniam, quis nostrud exercitation ullamco laboris nisi ut aliquip ex ea commodo consequat. Duis aute irure dolor in reprehenderit in voluptate velit esse cillum dolore eu fugiat nulla pariatur. Excepteur sint occaecat cupidatat non proident, sunt in culpa qui officia deserunt mollit anim id est laborum. Lorem quis nostrud exercitation ullamco laboris nisi ut aliquip ex ea commodo consequat. Lorem ipsum dolor sit amet Lorem [H3] Lorem ipsum dolor sit amet, consectetur adipisicing elit, sed do eiusmod tempor incididunt ut labore et dolore magna aliqua. Ut enim ad minim veniam, quis nostrud exercitation ullamco laborisit esse cillum dolore eu fugiat nulla pariatur. Ut enim ad minim veniam, quis nostrud exercitation ullamco laboris nisi ut aliquip ex ea PB Team Role % SOW Primary Contact DBE* Parsons Brinckerhoff (Prime) TOD, Planning, Urban Design 60% PM Name - Address City, State Phone # Buro Happold ME&P 10% - Selbert Perkins Deisgn Landscape Architecture 10% YES - CA (24574) Public Involvement 20% 12 Parsons Brinckerhoff PlaceMaking
.")
15 Buffalo Lakeside Commerce Park, Buffalo, New York Buffalo Lakeside Commerce Park (BLCP) is a redevelopment project located along the waterfront in the City of Buffalo, New York. The project has been developed with the support of the Buffalo Urban Development Corporation (BUDC). Nearly $30 million has been invested by New York State, Erie County, the City of Buffalo and National Grid in site preparation and infrastructure construction, to reclaim this once un(der)developed land for productive use. CertainTeed Corp., Cobey, Inc. and Sonwil Distribution have made multimillion dollar investments as the initial land purchasers, employing approximately 400 workers in and around the park. The conversion of the Union Ship Canal area into the BLCP has been both physical and programmatic. The physical improvements that have been completed in order to bring sites within the zone to a development ready state include geo-technical analyses, surface and sub-surface environmental investigations, demolition, site clearance, and infrastructure construction. 13
 New York Power Authority Hydropower Zone Competitive Land Pricing Completed Generic Environmental Impact")
16 Best Practices in the Redevelopment of Green/Industrial Zones HISTORIC BUFFALO S Hanna Funace Union Ship Canal Buffalo Lakeside Commerce Park offers a number of inducements to prospective developers: NYS Brownfield Cleanup Program Tax Credits NYS Excelsior Program Benefits (Investment Zone) New York Power Authority Hydropower Zone Competitive Land Pricing Completed Generic Environmental Impact Statement for SEQR Design Guidelines Established (Zoning/Land Use) Environmentally-Sensitive Business Park process Buffalo Urban Development Corporation (BUDC) is the City of Buffalo s not-for-profit development agency, with a mission of reclaiming distressed land for future development. BLCP is an important component of a larger planning initiative, known as the South Buffalo Brownfield Opportunity Area (BOA). The South Buffalo BOA, which includes nearly 2,000 acres of land situated near the shores of Lake Erie and the Buffalo River, is a project that seeks to guide investments for the purpose of reclaiming former industrial lands. Site-specific plans for BLCP have been and will continue to be completed in concert with the long-term vision and goals of the South Buffalo BOA. BLCP is an urban commerce park located on reclaimed waterfront land off of Route 5 and centered on the former Union Ship Canal, with access to multi-modal transportation. Utilizing the distinct waterfront feature of the historic Union Ship Canal, this brownfield redevelopment project has already reclaimed formerly fallow land for an office and light industrial commerce park, featuring a mix of buildings near the canal and light manufacturing buildings on the outer perimeter of the site. In 2004, Phase I and II of the BLCP were completed, providing access roads and necessary utilities to service new construction. Phase III of the infrastructure plan was completed in 2008, which included securing funding and land. The BUDC has recently acquired additional property to expand the size of the BLCP, which is now a 200-acre parcel of redeveloped brownfield. They are also working with the Erie County Industrial Development Agency (ECIDA) and Erie County Sewer Districts (ECSD) to upgrade a sewer pump station so that proper sewer permits can be provided to meet anticipated demand. To provide additional technology for site users, the BUDC obtained a designation as a State Wireless Community to provide for Wi-Fi availability. In 2002, a Generic Environmental Impact Statement (GEIS) for Development of the Union Ship Canal District was completed and in 2003, the Union Ship Canal Urban Renewal Plan was adopted which involved the following activities: acquisition and disposition of land parcels for public and private development; construction of new public infrastructure supporting site development; and, drafting and adoption of new zoning and design guidelines regulating future site development. The Buffalo Brownfield Redevelopment Fund (BRF) was created by ECIDA in 2004 and uses funds generated by the tenants in the BLCP to pay for road work and other improvements at the industrial park. The BRF uses money from payment-in-lieu-of-taxes agreements with the park s tenants to pay for installing roads and other infrastructure in the northern half of the industrial park. The Environmental Protection Agency s Brownfields Economic Redevelopment Initiative awarded the City of Buffalo supplemental assistance for its Brownfields 14 Parsons Brinckerhoff PlaceMaking

17 Case Study Two Assessment Demonstration Pilot. The Pilot is guided by the Buffalo Brownfields Task Force, comprising county and city department officials; regional state regulatory agency officials; a member of the Interagency Working Group on Environmental Justice; representatives from the city s official Buffalo Environmental Management Commission; members of the banking, legal, real estate, business, and university communities; and the general public. Buffalo Niagara Enterprise (BNE) handles the research, marketing and business attraction function rather than those duties falling to the BUDC so that the BUDC is singularly focused on the redevelopment efforts at Buffalo Lakeside Commerce Park as well as other, similar locations throughout the Buffalo area. lessons learned The serious work to establish shovel ready development sites within the BLCP has taken approximately 10 years including work on acquisition of property, the Urban Renewal Plan, the GEIS, and the funding for the public park (Ship Canal Commons). Redevelopment of this nature, at least in Buffalo, can be a time-consuming process and the recommendation is to prepare for the long haul. There is a good working relationship between BUDC and the regional New York State Department of Environmental Conservation (NYSEDC) office and throughout this process, the relationship and the open communication between the two parties is credited with expediting the process. There is a strong recommendation to keep NYSDEC a partner on the redevelopment project and process and to alert them in advance when important deadlines and decisions are to be made. The Army Corps of Engineers (ACOE) used the Union Ship Canal site as a training location for clean-up activities as a way to make progress on some of the areas in need of cleanup and investment rather than waiting for the cost to be picked up by an eventual developer. A number of funding sources were cobbled together and strategically implemented in order to optimize redevelopment potential for the site. A great deal of effort was expended in retaining these pots of money and executing effective redevelopment measures based upon the restrictions associated with available funds. However, it was the aggregate effect of these funds that enabled the BUDC to reach a point where they could bring marketable sites to the general public. 15

18 Best Practices in the Redevelopment of Green/Industrial Zones case study three 16 Parsons Brinckerhoff PlaceMaking

19 Allegheny River Towns Enterprise Zone (ARTEZ), Pittsburgh, PA The Allegheny River Towns Enterprise Zone (ARTEZ) is a designated area of seven municipalities north of the City of Pittsburgh in western Pennsylvania. The seven towns had each experienced some economic downturn as manufacturing moved away from the area, losing both businesses and residents, and each had been seeking new ways to participate in the green economy. ARTEZ is not a Green Zone in the same way as the proposed Staten Island initiative, but is instead an enterprise zone spread throughout developed and underutilized areas across seven municipalities. The goal of the Zone is to connect both sides of the Allegheny (between the municipalities and Pittsburgh) and to cross municipal boundaries. The initial project was driven by Pennsylvania State Senator Jim Ferloand the Northside Industrial Development Corporation. ARTEZ was structured to be an independent agency but primarily incorporated to manage the state enterprise program for the Zone. 17
20 Best Practices in the Redevelopment of Green/Industrial Zones process Once the organization was established, ARTEZ worked with the seven municipalities to set the boundaries, ultimately deciding on a mix of industrial and commercially zoned areas. Similar to the SIEDC green zone, there are also some small residential areas tucked in and around the zone. While the close proximity of residential to industrial in parts of the zone presents potential conflicts, there is also the possibility that this interaction can foster partnering opportunities for testing technologies and products developed in the Zone. ARTEZ is managed by a board of directors. Each municipality appoints a person from the public sector and business community (14 people total) and there are five at-large positions (usually filled by the county, maybe a senator). ARTEZ is set up as an independent non-profit; there is no official relation to government, and the relationship with the municipalities is purely contractual. ARTEZ is targeting industries and uses in high technology (as spin offs from universities), renewable energy, and building materials (for which there is a long history in the area, and which is now transitioning to green materials). The Zone is investigating how they might tailor State incentive programs to specifically attract and retain these industry types. The Allegheny Conference the regional economic development and business attraction group - is focusing on the energy sector and has been working in partnership with the Zone. Recent successes have included Phar Technology, which has expanded into the office park, and has been looking to invest into a new facility to fit their new process. This facility will be adding geothermal heating system and ARTEZ is looking to use this as a case study and demonstration project for grren practice in the community. ARTEZ has just started the process of creating a special zoning overlay for the industrial park. ARTEZ is considering green development guidelines as part of this overlay. The zone is primarily privately owned and to-date, ARTEZ does not own and has not purchased any property within the zone or acted as a property developer. Instead, they work with the Allegheny County Redevelopment Authority to shape land disposition and to help establish guidelines. lessons learned Partnering at the Regional Level: ARTEZ only works if the seven municipalities are able to work together and embrace regionalism. This early lesson has allowed ARTEZ some measure of success in coordinating land planning, marketing, and network building. It has not yet extended to land use planning and permitting, although this would be a helpful step. Regional partnership has been challenging because there are so many groups and resources that they feel like a little fish in a big pond. Nonetheless, ARTEZ has still relied upon these partnerships as key to overall success. Networks: The importance of building networks among existing local businesses, their suppliers, immediate customers, and other local industry organizations. Ushering in the Green Economy: ARTEZ also played a large role in ushering existing businesses into the new Green Economy. The group was successful in helping companies already in the Zone or nearby to develop green products/ services based on existing products/service, adding to the concentration of the green cluster. Their revolving loan fund was a key tool for this purpose. Economic Development at State and Local Level: The Zone also learned the importance and power of strengthening relationships with state and local economic development agencies. These agencies had no previous awareness of ARTEZ nor of the strengths it could bring to assist in larger redevelopment strategies. Targeted Marketing: Having specific focus on what types of companies ARTEZ was seeking helped to channel the right opportunities. 18 Parsons Brinckerhoff PlaceMaking

 and Aspinwall (left after the")
21 Case Study Three THE HIGHLAND PARK BRIDGE and rail bridge in the distance are just two of the many bridges that span the Allegheny River. THE ALLEGHENY RIVER is a collection of several municipalities, pictured here are Sharpsburg (to the left, before the bridge) and Aspinwall (left after the bridge), and Pittsburgh (right). 19

22 Best Practices in the Redevelopment of Green/Industrial Zones case study four 20 Parsons Brinckerhoff PlaceMaking
23 Fairfield Industrial Park, Baltimore, MD The City of Baltimore s Empowerment Zone included three discrete zones, one of which is the 1,270-acre industrialized peninsula on Baltimore s Outer Harbor called Fairfield- Wagner s Point. Fairfield Ecological Industrial Park is the centerpiece of the aforementioned Zone and was established to focus on innovative and environmentally-friendly business development. The entire area is zoned for heavy industry, with transportation, chemical manufacturing, and petroleum-related businesses being the primary activities. Fairfield is linked to all major transportation venues water, rail and highway a condition that has been instrumental in its redevelopment plan. 21
.")

24 Best Practices in the Redevelopment of Green/Industrial Zones THE FAIRFIELD INDUSTRIAL PARK in Baltimore, Maryland is the location of much of the maritime and industrial uses in the Port of Baltimore. process All three zones were designated in 1994 to share $100 million in economic development funds from the U.S. Department of Housing and Urban Development (HUD). That funding allowed the City of Baltimore, the Empower Baltimore Management Corporation (EBMC), the Baltimore Development Corporation (BDC), and the Departments of City Planning and Public Works to publish the Fairfield EIP Master Plan in the mid 1990s. The Master Plan process helped to produce site ownership and environmental quality matrices, electric and natural gas line grids, inter-modal transportation and commuter alternatives, and infrastructure suggestions and priorities tied t o promoting sustainable business practices. The Fairfield Industrial Park in Baltimore, Maryland, was first established as an Ecological Industrial park approximately 15 years ago, with green targets including zero emissions, industrial ecology, and waste to input methods. The park was a pioneer in thinking that the green economy could be achieved in an industrial area and the bar was set very high for the standards that it wished to achieve. As the industrial park began the redevelopment process, it morphed from an eco-industrial park to an urban renewal area, keeping its mandate and goal to be sustainable by instituting good neighbor policies as a centerpiece of its redevelopment strategy. While the initial goal of an eco-industrial park has shifted to a more tradition industrial development site, the redevelopment of the park has been successful and achieved a measure of sustainability as well. The inability to meet the initial mission may have been due to a lack of proven success stories and best practices for eco-industrial parks within the U.S. and the state of Maryland. As with the other sites analyzed, a master planning process laid the foundation for future work on the site. In 2004, an Urban Renewal Plan for Fairfield was completed. The plan outlined permitted land uses within the area, established techniques that would be used to achieve the plan s goals (i.e., acquisition, relocation, public improvements), and general regulations, controls, and restrictions all to be applied on the Fairfield area. These included general controls on bulk regulations, signs, parking, waste disposal, and compliance. The goals of the Fairfield Urban Renewal Area were similar to the goals of the Master Planning process and seemed to center around the idea of promoting environmentally responsible industrial business development in Fairfield and providing employment opportunities for Baltimore City residents. Additionally, Baltimore enacted a Maritime Industrial Overlay District (MIZOD) in 2004 to protect Baltimore s maritime industries by demarcating deep-water access areas in industrial districts and preserving them for industrial use. This is an important and very relevant action to the SIEDC Green Zone which is also a waterfront heavy industry zone with maritime roots. The need for such protections arose during a real estate boom which heightened the pressure to convert waterfront industrial properties to mixed-use with residential, largely through the use of Planned Unit Developments (PUDs). The MIZOD, therefore, preserves maritime properties with deep water, rail and highway access in order to protect maritime-dependent uses and intermodal freight movement. 22 Parsons Brinckerhoff PlaceMaking

25 Case Study Four lessons learned Critical Path: According to the Baltimore Development Corporation it s taken roughly 15 years of work and redevelopment to consider Fairfield truly successful, and successful it is, at this point BDC does not have to do any targeted marketing when they have available properties because demand stays high. They are currently disposing their last property now. Accurate Assessment: An important first step for BDC was to actually understand what they had to offer, meaning, land ownership, level of contamination, the waterways, access to transportation and many more. Act as Developer: One of the goals of the Urban Renewal Plan was to acquire certain properties within the Project Area in order to assemble redevelopment parcels and to provide standards and controls for their redevelopment. This is another instance where the power of acquisition was used by the redevelopment agency or municipality to help move the redevelopment efforts forward and ensure a cohesive, areawide implementation. Good Neighbor Green Policies: The Good Neighbor policies established for Fairfield set guidelines and thresholds for site owners and users to follow that were under the Five E s: Environmental Achievement, Environmental Leadership, Environmental Management, Environmental Community Outreach, and Environmental Commitment. The policy outlines several different ways that a business can demonstrate their environmental ethic in each category (see Attachment: The Five E s: Elements of a Good Neighbor from the Fairfield Urban Renewal Area). Preservation of Maritime Industry: The MIZOD is important to Baltimore because the Port of Baltimore generates 50,000 well paying jobs, and is one of the most significant contributors to the economy of Baltimore City and the State of Maryland. Additionally, the federal government invests nearly $50 million annually in the Port of Baltimore, and that investment is at risk if the business starts to decline. Flexibility: When the original Eco-Industrial Park model proved unsuccessful, the City continued to refine its approach and was able to continue forward with successful job promoting and sustainable redevelopment. The The Five E s: Elements of a Good Neighbor, a document which outlined a good neighbor policy: establish guidelines that will help to protect area property values and ensure that neighboring businesses and communities are not subjected to business practices that could present environmental liabilities, ecological damage, or public health risks. Good business neighbors will ensure the aesthetic quality of the site, thus encourage further business development. Finally, good neighbor business policies will foster a positive relationship with the local communities, allowing communities businesses to prosper. 23

26 Best Practices in the Redevelopment of Green/Industrial Zones case study five 24 Parsons Brinckerhoff PlaceMaking

27 Menomonee Valley, Milwaukee, Wisconsin Menomonee Valley Partners (MVP) is a non-profit organization with a mission to revitalize the Menomonee Valley for the benefit of the entire Milwaukee community. The Menomonee Valley is recognized worldwide as a success story and it stands as an excellent best practice model for the SIEDC to emulate as it considers its own green zone redevelopment strategy. The Menomonee River Valley is a lowland area in the City of Milwaukee limits with a storied history. Originally a rice marsh, it served as an early fur trading post and, by the early 1900s developed into what has been referred to as the machine shop of the world with farm machinery, rail cars, electric motors, and cranes all being manufactured all within the valley. As was experienced in most other manufacturing towns and cities across the nation, the late 1900s marked a period of decline and disinvestment in Milwaukee and the Menomonee Valley was hit hard. Residents in the neighborhoods adjacent to the Valley suffered from poor access to jobs and recreational opportunities and experienced high levels of poverty and poor health (asthma and obesity). 25

28 Best Practices in the Redevelopment of Green/Industrial Zones In 1998, the City of Milwaukee, the Menomonee Valley Business Association and the Milwaukee Metropolitan Sewerage District prepared a land use plan for the Menomonee Valley, a road map for its redevelopment. Concurrently, the State of Wisconsin was laying the groundwork for the Hank Aaron State Trail. As a result of these various planning efforts, Menomonee Valley Partners was formed as a nonprofit organization, a public-private partnership, to facilitate business, neighborhood, and public partnering efforts to revitalize the Valley. process At the outset, there was a master planning effort in 1998 that jumpstarted most of the redevelopment that has happened in the Menomonee Valley. The master planning process consisted of community involvement, economic evaluation, a market assessment, land use and engineering analysis, and an implementation strategy. This effort laid the groundwork for the subsequent redevelopment activities. The recommendations were that the Menomonee Valley study area be revitalized and redeveloped as an industrial and mixed-use district that would provide sites with a wide range of potential land uses. The activity was focused on key sites at the beginning of implementation. The Partnership was very interested in setting green standards for industrial development in the zone and developed a creative and highly effective approach in order to push a green initiative. Within the zone were a number of publicly held lots. Additionally, the MVP recognized several key sites that would be critical catalysts to further redevelopment. The MVP purchased some of these sites from owners who were not interested or capable of navigating the onerous remediation and development permitting process that would be required to get the sites to a state of readiness. The MVP became stewards of these sites through that process (often taking several years) and as a condition for redevelopment, placed green restrictions on the development that could take place on the site. An additional benefit to MVP was that they were able to realize a positive return on their investments. The City partnered with MVP and placed the same green restrictions on any City owned site that was put up for sale. Since the sites were shovel ready and public investment had already been made, developers were eager to build and did not see the restrictions as a roadblock to development. These sites led the way and actually served to attract additional interest. Within a few years, most of the private owners in the zone have voluntarily adopted the restrictions as part of their redevelopment mandate, helping to brand the zone as a green development zone. Growing out of those initial planning efforts, 33 companies have moved to or expanded in the Valley, 4,200 jobs have been created; 45 acres of native plants have been established; seven miles of trails have been constructed; and, a nationally recognized shared stormwater treatment system has been established. Additionally, 10 million people visit the Valley s recreation and entertainment destinations each year. Today, the Menomonee Valley is a national model of economic and environmental sustainability. Recognized by the Sierra Club as One of the 10 Best Developments in the Nation, the Menomonee Valley continues to receive local and national recognition. Menomonee Valley received a $750,000 economic development grant from (source). This grant funded the work necessary to get high priority sites development ready, including environmental reports, market analysis, and site layouts. In 2002, Menomonee Valley was also the location for a National Design Competition, by the National Endowment for the Arts New Public Works Initiative, for a 140-acre site within their redevelopment zone. The Menomonee River Valley National Design Competition: Natural Landscapes for Living Communities touched on a number of green issues like building design, energy efficiency, stormwater management, waste and recycling, water conservation, and many more. EMPLOYEES can bike to work and visitors can bike throughout the Valley. 26 Parsons Brinckerhoff PlaceMaking

29 Case Study Five lessons learned Menomonee Valley is indeed recognized nationwide as a model for success on many fronts and they credit the success to three main best practices: visionary planning, bold goals and objectives, and value added after the deal. Holistic Approach to Business Development: Menomonee Valley is credited with having bold goals and objectives including development objectives for job density, sustainable design guidelines, and recruitment for high-growth companies. Additionally, MVP takes pride in adding value after the transaction; they address the ongoing needs of the businesses located within their zones as well as the adjacent communities. For example, there are programs to help businesses grow in place, they help build business-tobusiness connections, connect businesses to resources, facilitate a sense of neighborhood or place and be the catalyst for the creation of new amenities. Wide Range of Financing and Funding Incentives: As part of MVP s vision, they re committed to helping to create a redeveloped Menomonee Valley economically with strong companies and jobs near workers homes. In this realm, MVP has created a list of funds and financing opportunities as well as a list of tax incentives that they share with their companies and prospective companies. For example, listed below are potential funding sources and/or tax credits that could be THE HANK AARON STATE TRAIL is a beneficial resource for neighboring communities, visitors to the Menomonee Valley and to workers in the zone. The trail and its adjoining open spaces have been successful in turning the Valley into a live, work and play destination. available to companies that locate within the Menomonee Valley. Details about these funds and financing opportunities are available in the Attachment section of this report. US Department of Treasury, the New Markets Tax Credit Program State of Wisconsin, Brownfields Initiative Grant Program Milwaukee Economic Development Corporation Loan Products State of Wisconsin, Brownfield Site Assessment Grant Community Renewal Act of 2000 Community Development Zone Wage Tax Credits Wisconsin Department of Commerce, Tax Credits for Environmental Remediation Work Opportunity Tax Credit (WOTC) and Welfare to Work (WtW) Wisconsin Technology Zone Tax Credit Program Creative Redevelopment Strategies: Efforts like the National Design Competition (National Endowment of the Arts, 2002) which brought significant interest to an early catalyst development site, design charrettes, property acquisitions and partnering with the City on goals and objectives have greatly enhanced the redevelopment process. Integrated Site Planning: Thinking about the many systems that can affect a site, the MVP plans for and provides assistance with many aspects of the development, including: Stormwater management Parking Hank Aaron State Trail Adaptive reuse 27

30 Best Practices in the Redevelopment of Green/Industrial Zones conclusion 28 Parsons Brinckerhoff PlaceMaking

31 best practices There were a number of actions that were taken in each of the zones studied that are pertinent to the Staten Island Green Zone. Below are just a few of the unique actions taken by each zone that can help us to shape our strategic effort in Staten Island. In Toledo, a very difficult redevelopment strategy has enlisted universities to help promote a green strategy for incorporating solar power into the zone. In Buffalo, the State of New York and the DEC in particular, has played a key role in promoting redevelopment. In Allegheny County, a targeted focus on specific businesses best suited for the region has helped to structure the marketing approach. In Baltimore, a specific maritime industrial zone overlay was established to preserve the maritime industry that had been the legacy of a site with many similar industrial conditions. In Menomonee Valley, the EDC stepped up to the plate and purchased underperforming properties and took the lead on redevelopment steps, converting properties to shovel ready status and ultimately realizing a return on investment. 29
32 Best Practices in the Redevelopment of Green/Industrial Zones keys to success The sites that we investigated all provide lessons learned that can help to shape the approach industrial redevelopment on Staten Island s West Shore. The exercise illustrated some universal and often used strategies and some truly creative approaches that could be considered in Staten Island or used as a point of departure for creative redevelopment strategies. Clearly the most successful redevelopments build off of a plan. Both Fairfield and Buffalo used the Master Planning and Urban Renewal processes as a framework for their redevelopment activities. Menomonee Valley prepared a master plan, these processes also have the advantage of offering funding supply for the preliminary studies, inventories, and environmental investigations that undoubtedly are required in and around former industrial sites. In interviewing each of these projects, there is a clear local champion who has been involved and spearheading the redevelopment process. The path is often complex and there are many players, but there always seems to be one organization with clear responsibility for the redevelopment of a particular area. That champion then pulls in other entities that can help in order to enhance capabilities. None of these agencies or organizations have gone it alone. While they may lead, it is clear that large and complex partnerships with government, with community and with business are needed to navigate the intricacies of converting white elephant sites into viable marketable redevelopment properties. It is also clear that plans are not enough. A plan can help to form the basis for action, but public funds are essential to catalyze private investment. In each of these cases, a strategic public infusion of money effectively used became the critical action that pushed redevelopment from vision into solution. There is money out there that we can leverage. It may primarily private, it may be through revolving loans or tax credits or even federal grants, but there is money out there. In each of these cases, multiple sources of funds were combined together to move projects through various stages of clean-up, assessment, permitting and infrastructure improvement. A formula with multiple choices is very important so that the leader of the redevelopment effort can search a number of options to find those sources appropriate to the needs of the project. The most successful projects have been very proactive in marketing their sites and have engaged in flexible outof-the-box thinking in order to achieve success. MVP placing guidelines on properties that it redevelops, ARTEZ undertaking a targeted assessment to market to and attract specific businesses, Baltimore switching from its plan to adapt to a changing marketplace, these are all examples of ways in which organizations have been able to distinguish zones and capture market share. HAVE A PLAN LEAD THE WAY PARTNER WITH OTHER AGENCIES AND ORGANIZATIONS IN THE REGION GENERATE INITIAL FUNDS FOR SITE DEVELOPMENT CREATE A WIDE RANGE OF INCENTIVES AND PACKAGE INCENTIVES TOGETHER BE CREATIVE FIND A NICHE 30 Parsons Brinckerhoff PlaceMaking

33 Conclusion NRG ENERGY PLANT located within the proposed Green Zone on Victory Boulevard. THE ARTHUR KILL LIFT BRIDGE, which reopened in 2006 and resumed normal trash removal operations in THE STATEN ISLAND GREEN ZONE has the potential to tap into rail, truck, and water transport sytems. 31


34 attachments 32 Parsons Brinckerhoff PlaceMaking

35 Fairfield Industrial Park, Baltimore Maryland The 5 E s: Elements of a Good Neighbor The Good Neighbor Policy from the Fairfield Industrial Park is an example of setting zone-wide standards on a voluntary basis with the goal of ensuring that neighboring businesses and communities are not subjected to business practices that could present environmental liabilities, ecological damage, or public health risks. This policy is an effective tool to use when the organization is dealing with multiple private land owners and does not have any real authority, other than zoning, to enact specific controls. Baltimore Maritime Industrial Zoning Overlay District (MIZOD) The Maritime Industrial Zoning Overlay District (MIZOD) was enacted in 2004 in an effort to reduce increasing conflicts between mixed-use development and maritime shipping by demarcating deep water areas in industrial precincts and reserving them for industrial use. The Staten Island Green Zone is situated directly south of major Port of New York/New Jersey operations at Howland Hook and this type of district, or something similar, could be useful in researching as the development of the Green Zone continues. Menomonee Valley Design Guidelines The Menomonee Valley Design Guidelines are an excellent resource of green design guidelines that can be applied to an entire redevelopment zone. Menomonee Financing Resources The Menomonee Valley Partnership (MVP) provides guidance to business owners on what funding and financing resources may be available from the federal, state, and local governments and this flysheet is just an example of the collateral they have developed and regularly distribute in and around their zone. 33
36 ATTACHMENT A THE FIVE E s: ELEMENTS OF A GOOD NEIGHBOR The Five E s rationale for a good neighbor policy is to establish guidelines that will help to protect area property values and ensure that neighboring businesses and communities are not subjected to business practices that could present environmental liabilities, ecological damage, or public health risks. Good business neighbors will ensure the aesthetic quality of the site, thus encourage further business development. Finally, good neighbor business policies will foster a positive relationship with the local communities, allowing communities businesses to prosper. Activities or programs within the following five areas, known collectively as the Five E s, demonstrate an existing or emerging environmental ethic: (1) Environmental Achievement; (2) Environmental Leadership; (3) Environmental Management; (4) Environmental Community Outreach; and (5) Environmental Commitment. There are a variety of ways a business can demonstrate an existing or emerging environmental ethic within each area. Among these five areas, no one area is any more important than another in defining an emerging or existing environmental ethic. Environmental responsibility can be indicated by one or more of the following categories; businesses do not need to demonstrate all the attributes listed below to meet a criterion. (1) Demonstration of Environmental Achievement Environmental achievement starts with compliance with local, state, and federal environmental regulations and can extend to performance that surpasses these requirements. Environmental achievement is comprised of a range of business activities that integrate environmental thinking into traditional business functions such as planning, research, marketing, purchasing, process controls and maintenance. A business does not need to demonstrate all the attributes listed below to meet this criterion. Examples of Environmental Achievement activities could include: Resource Efficiency, Environmental Compliance, Plans/Schedule to Achieve Compliance including turnaround environmental performers, State-of-the-Art Processes and Controls, Product Stewardship, Emergency Preparedness/Prevention, Research and Development. (2) Demonstration of Environmental Leadership Environmental leadership entails either striving for superior environmental performance within one s plant/division. A business does not need to demonstrate all the attributes listed below to meet this criterion. A-1
37 Examples of Environmental Leadership activities could include: Mentoring/Recruitment, Recognition of Environmental Leadership, Procurement, Product Line. (3) Demonstration of Environmental Management Environmental management is a combination of organizational structures and policies that help integrate environmental responsibility into the culture of the company. Environmental management structures and policies demonstrate that environmental performance is an accepted part of a business and the responsibility of all employees. A business does not need to demonstrate all the attributes listed below to meet this criterion. Examples of Environmental Management activities could include: Environmental Policy, Planning, or Implementation, Audit/Corrective Action, Management Review, Incentives. (4) Demonstration of Environmental Community Outreach Being a part of a community involves interacting with neighboring property owners and giving back to the community of which the business is a part. Environmental community outreach helps to build relationships among community residents and neighboring businesses by opening and maintaining lines of communication. In addition to sharing information and views, environmental community outreach may also incorporate sharing resources (e.g., time and money) to enhance the quality of life in the community. A business does not need to demonstrate all the attributes listed below to meet this criterion. Examples of Environmental Community Outreach activities could include: Community Investment, Environmental Education/Outreach, Public Access to Information, Public Dialogue. (5) Demonstration of Environmental Commitment An environmental ethic continually evolves as a business changes over time. Therefore, a business should not only be able to demonstrate its environmental ethic through current achievements, leadership, management, and community outreach, but also through a commitment to pursue and embrace this ethic in the future. A business does not need to demonstrate all the attributes listed below to meet this criterion. A-2
38 Examples of Environmental Commitment activities could include: Can the business provide documentation to supports its: Environmental Achievement; Environmental Leadership; Environmental Management; and Environmental Community Outreach? Is the business willing to share this supporting documentation with the City? Will the business s management be willing to pledge to the accuracy of this supporting documentation? Will the business's management be willing to pledge to maintain and improve the business's environmental ethic within the five areas? Is the business willing to share this pledge with the community? Is the business willing to share this pledge and promote the goals and vision of the Fairfield Ecological Business Park with other businesses? A-3

39 Maritime Industrial Zoning Overlay District 2007 Annual Report
40 Introduction The Maritime Industrial Zoning Overlay District (MIZOD) was enacted in 2004 in an effort to reduce increasing conflicts between mixed-use development and maritime shipping by demarcating deep water areas in industrial precincts and reserving them for industrial use. In general, it is difficult and costly for maritime and mixed uses to co-exist. Maritime shipping activity creates noise, dust, substantial truck traffic, unattractive and extensive outdoor storage areas, and twenty-four hour activity, all of which conflict with housing, entertainment and office uses. Yet, maritime users must have access to deep water; they also must invest in expensive infrastructure and dredging that can only be justified if a long amortization period can be assured. The expensive dredging required to maintain shipping access is also most cost effective when terminal sites are clustered together, and not scattered among uses for which deep water access is not necessary. A recent Baltimore Development Corporation study 1 reported that needed investment in port facilities may be deferred due to uncertainty as to the City s policy regarding change of use. Once deep water sites are redeveloped for mixed use, it would be very difficult, if not impossible, to regain them for maritime use, irrespective of future need or economic necessity. Zoning is one of the few practical methods available for assuring the availability of deep water land for maritime shipping use. However, the recent success of mixed-use redevelopment on the waterfront presented the City with a policy decision regarding the relative importance of two critical City objectives: Expansion of the new business and residential uses made possible by waterfront redevelopment, and, Preservation for maritime use of the deep water access essential to the Port of Baltimore. The goal of establishing the MIZOD was to balance the needs of both mixed use and maritime shipping, maximizing each to the extent possible without harming the other. Therefore, the waterfront in the deep water sections of the harbor was categorized into two areas: Mixed-Use and Maritime Industrial. In the first, mixed use would be allowed, enabled and encouraged. In the second, maritime uses would be protected by the MIZOD by prohibiting conversion of land to nonindustrial uses. The intention of demarcating the waterfront into clearly defined mixed-use and maritime industrial areas was to help streamline the development process by avoiding costly and time-consuming delays associated with site-by-site decision-making regarding change of use (See Figure 1). Importantly, it is intended to protect the integrity of the maritime area, avoiding the leapfrogging of mixed use into maritime areas that has begun to threaten continued investment in the maritime commerce of the Port of Baltimore. 1 Industrial Land Use Analysis, City of Baltimore, Maryland, prepared for Baltimore Development Corporation by Bay Area Economics, November 26, 2002, page 22. 2

41 Figure 1: Map of Maritime Industrial Zoning Overlay District (MIZOD) Included in the overlay district are existing industrial properties with deep water access and zoned Heavy Industrial (M-3) in portions of Canton, Fairfield, Curtis Bay, Hawkins Point, and Locust Point. Preservation of these areas for maritime industrial use is accomplished by applying the following provisions in the overlay area: Disallow Planned Unit Developments (PUD), which are currently the principal method of accomplishing conversion from industrial to mixed use (See Figure 2). Delete office as a principal use and hotel/motel from the conditional use lists. Allow only accessory use of offices, restaurants and taverns. The underlying zoning remains M-3. 3
 around the")
42 Figure 2: Boundaries and Dates of Adoption of Planned Unit Developments (PUD) around the MIZOD 4
43 Sustainable Design Guidelines for the Menomonee River Valley m i l w a u k e e w i s c o n s i n Table of Contents I. Site Design Site Analysis & Planning Stormwater Management Natural Landscape Parking & Transportation Site Lighting II. III. IV. Building Design & Energy Use Building Design Energy Efficiency Daylighting & Interior Lighting Alternative Energy Building Commissioning (Quality Control) Materials & Resources Exterior and Interior Materials Water Conservation Construction/Demolition Waste & Recycling Erosion & Dust Control Pre-Occupancy Controls for Indoor Air Quality V. Indoor Environmental Quality Indoor Air Quality Acoustic Quality Appendix 1 U.S. Green Building Council & the LEED TM Green Building Rating System Appendix 2 Environmental & Geotechnical Considerations in the Menomonee River Valley Appendix 3 Designing Your Site and Facility to Achieve Stormwater Management Objectives Appendix 4 Considerations to Guide Menomonee River Valley Landscape Installations Appendix 5 Achieving a 25% Reduction in Energy Consumption in Your Office, Assembly & Manufacturing, and Warehouse Space Appendix 6 Guidance to Manage Construction and Demolition Debris VI. Operations & Maintenance Operations Manual & Monitoring Facility Maintenance Maintenance and Stewardship of Site & Landscape Elements Menomonee Valley Sustainable Design Guidelines page 1 of 10
44 I. Site Design Purpose: Promote adaptive reuse of Valley lands that recognizes the ecological context, river influence, existing landmarks, building stock and industrial heritage, and improve existing infrastructure (sidewalks, streets, storm drainage). Sustainable site design should address water quality, quantity and floodplain issues, native species, open space that provides recreation, wildlife habitat, cultural and neighborhood connections; and alternative transportation, lighting and parking design. 1 Site Analysis & Planning Site planning guidelines are intended to maximize the build out area and create a cohesive image for the Menomonee Valley. A. Design all parking facilities and open spaces to work together to manage stormwater, create connections to the river and Hank Aaron State Trail [ and improve the aesthetics of your site. B. From the outset of the development project, integrate site, landscape and soil needs into architectural and construction sequences. C. Preserve and enhance cultural resources that might exist on or near your property. Refer to the Menomonee Valley Cultural Resource Management Plan. [ D. Maintain a ratio of total gross floor area to total lot area of no less than 25% for initial site build-out. E. Build to street-fronting property lines, or to the setback of neighboring buildings. When buildings cannot be at property lines, minimize parking along the street frontage. F. Do not construct within ten feet of any interior side lot line of the property. Side yards on the street side of corner lots shall have no minimum required width. G. Attach signage to a vertical surface of the building or to a ground-mounted base. Do not post signs other than corporate identification signs, directional and educational or interpretive signs. H. Where feasible, install utility lines underground. 2 Stormwater Management Cost effective natural systems use water efficiently and enhance water quality. A. Connect to regional stormwater treatment areas where available (Contact Menomonee Valley Partners for site specific information, ), or share stormwater management practices with neighboring parcels. B. Design your stormwater conveyance system to use a connected series of vegetated swales and channels for stormwater infiltration in place of enclosed storm sewers. C. Design your stormwater treatment system to avoid the direct concentrated discharge of stormwater into the river or canals. Use the techniques identified in Appendix 3 to capture and infiltrate stormwater up to a 2-year storm event without any discharge to surface water or municipal storm sewers. D. Design landscape planting materials, soils and sub-soils for infiltration and evapotranspiration of rainwater. Note that soils and subsoils placed above a remedial cap can serve to store and evapotranspire collected stormwater. E. Use drought resistant plantings, eliminating irrigation other than collected rainwater. Menomonee Valley Sustainable Design Guidelines page 2 of 10
45 F. Consider using green roof systems to collect and evapotranspire rainwater, thus reducing runoff as well as heating and cooling loads. 3 Natural Landscape Well designed landscaping with native species reduces water consumption and long-term maintenance costs and improves building energy efficiency and aesthetics. A. Specify native plant and tree species for at least 80% of planted area. See Appendix 4 for tips on planning, installing, and maintaining a native landscape, as well as a list of locally native plants and invasive species. B. Landscape all open areas, except those required for driveways, parking, or walks, not later than 6 months after occupancy. C. Use deciduous shade trees, vegetative cover and exterior structures such as louvers, arbors and trellises to provide 30% shade over non-roof impervious areas within 5 years. D. Where rooting area will be limited, use strategies such as connected planting beds, rooting breakouts under parking, or walkways floating on root-permeable soils to extend rooting space and increase plant vigor. Establish engineering specifications for these strategies, drainage patterns, and installation of structural soils as part of the building design and site grading plans. E. Use Integrated Pest Management practices and appropriate plantings to eliminate the use of pesticides, herbicides and fertilizers. 4 Parking and Transportation Well designed parking areas efficiently use space, accommodate pedestrians and are aesthetically pleasing. A. Encourage transportation alternatives for employees and visitors by providing o o o o Bicycle racks and employee shower/changing facilities. Free bike racks are available from the City of Milwaukee. [ Covered bus shelters or waiting areas. Pleasant, safe and accessible walkways. Preferred parking for carpools. B. Provide a buffer of native plantings between parking areas and the river edge. C. Do not locate parking or waste facilities within 10 feet of the front line of the property, and screen these areas from view. Contain all refuse in an appropriate receptacle further enclosed by a 6-foot fence of solid material. D. Provide no more than two drive openings, and provide appropriate traffic control measures at all entrances to public rights-of-way. E. Locate truck loading berths at the side or rear of the building. F. Include on-street and shared parking resources in parking calculations. Minimize parking stall dimensions to 9 x 18, as smaller stalls will decrease the parking lot size and allow for a large building footprint. G. Use concrete pavement rather than asphalt where possible to keep parking areas cool. H. Incorporate green spaces into parking areas to break up large expanses of concrete. I. Consider using porous paving systems to extend the life of the pavement, allow for stormwater infiltration, reduce maintenance costs, and reduce the urban heat island effect in summer. See Appendix 3 for additional guidance on using porous paving systems. Menomonee Valley Sustainable Design Guidelines page 3 of 10
46 5 Site Lighting Effective and efficient site lighting improves aesthetics, reduces energy use and maintenance, and preserves the night sky. A. Provide site lighting appropriate for the security needs of the site while maintaining an overall low-lighting profile for the complex. B. Use high efficiency lighting (metal halide or high pressure sodium lamps) with low cut off angles and downlighting for landscaping. C. Utilize reflective-type lighting fixtures to reduce or eliminate glare and provide safer, more human-scaled nightscapes. D. Allow zero direct-beam exterior lighting at the property line. E. To reduce dependence on high-wattage electrical lighting at night, use light colored or reflective edges along driveways or walkways. Menomonee Valley Sustainable Design Guidelines page 4 of 10

47 II. Building Design and Energy Use Purpose: Generate operating cost savings by designing for energy efficiency and ensuring that the building is capable of operating in accordance with its design. Building design should address energy efficiency, daylighting techniques, building commissioning, improved systems controllability and improved aesthetics. 1 Building Design Thoughtful building design creates a uniform and inviting sense of place for employees and customers. A. Ensure that the scale and design of new buildings are compatible with adjacent buildings. At pedestrian areas of the building, use awnings, landscaping, windows and doors to lower the scale of the building. B. Design a principal façade and obvious entrance parallel to the street edge. Do not face blank walls towards public streets. C. Utilize brick (reclaimed or new), architectural pre-cast concrete panels, decorative concrete block or cut stone. Corrugated sheet metal, vinyl siding, reflective glass and imitation stone siding are discouraged. D. Screen sources of mechanical noise, odors and loading operations from public open space areas and adjacent properties. E. Locate utility meters and exhaust vents on the side or rear of building. F. Screen or locate roof-top mechanical equipment so it is not visible from the street. G. Design to accommodate areas for recycling of waste materials. Provide a centralized ground-floor location for collection and storage of recyclables. H. Where possible, orient buildings along an east-west axis for maximum daylighting benefits. 2 Energy Efficiency Simple energy-saving techniques and technologies generate significant operating cost savings. A. Design for energy performance that improves upon State of Wisconsin Building Code [ by 25%, and demonstrate energy efficiency using hourly simulation tools. See Appendix 5 for guidance on meeting this objective for Office, Assembly/Manufacturing and Warehouse spaces. Additionally, consider the following strategies: o o o o Group spaces for similar functions or requirements to concentrate similar heating and cooling demands, and use non-program spaces as climate buffers. Use thermal mass such as masonry or concrete to moderate interior temperatures and to achieve desired R-value in foundation, walls and roof. Design air-lock entrances to reduce heat loss or gain. Use Energy Star Roof-compliant, high reflectance and high emissivity roofing to reduce heat retention in summer, unless using a green roof. B. Specify Energy Star [ equipment and appliances. C. Consider separate circuitry to isolate HVAC, lighting and plug loads, enabling operations and maintenance staff to monitor energy use on site. Menomonee Valley Sustainable Design Guidelines page 5 of 10
48 3 Daylighting and Interior Lighting Daylighting and efficient interior lighting reduce energy use and create a pleasant, productive work environment. A. Maximize daylight in your building through the appropriate use of the following strategies: o o o o Maximize window height, and use roof monitors, clerestory windows, skylights, and light-pipe technology to transmit light to spaces not reachable by other means. Balance glazing color for view, daylight and energy performance. Note that City of Milwaukee zoning ordinance requires that street level glazing must be at least 65% transparent. Use interior windows, light shelves and low partitions to bring daylight deeper into the space, manage glare, and balance light levels. Use south-facing windows with appropriate overhangs to reduce summer sun and admit winter sun. B. Supplement daylighting with highly efficient electric light distribution that improves visual quality while reducing electricity use. For instance: o o o o Rely on low ambient lighting levels for general illumination (predominantly light reflected from the ceiling where achievable) boosted by high quality, flexible task lighting. For general office space and noncritical manufacturing task areas, consider achieving a lighting power density (LPD) goal of between 0.8 and 1.0 watts/ft2. Use high efficiency lamps and luminaires with electronic ballasts. Employ efficiency-based controls such as dimmers, occupancy sensors, and lumen maintenance controls. Wire luminaires parallel to walls with windows so they can be dimmed or turned off by row. 4 Alternative Energy Alternative conventional and renewable energy sources reduce your energy costs and your impact on natural resources. A. Purchase power generated from renewable sources (solar, wind, biomass, or low-impact hydro sources) through We Energies Energy for Tomorrow Program. [ B. Consider closed-loop ground-source (geothermal) heating and cooling. 5 Building Commissioning (Quality Control) Building Commissioning is a systematic and documented process of ensuring that the owner's operational needs are met, building systems perform efficiently, and building operators are properly trained. Commissioning can be applied in new construction, post construction and existing buildings. A. Contract with an independent commissioning authority from the beginning of the design process to review design options and expected operation of building and its component systems. B. Have commissioning agent train building staff to operate and maintain the building. C. Ensure that energy measures are installed and operating one year after completion of construction. D. Use long-term continuous measurement of performance for building and site systems. Menomonee Valley Sustainable Design Guidelines page 6 of 10
49 III. Materials and Resources Purpose: Reduce impact on natural resources as well as reduce costs, increase performance and improve aesthetics and the working environment. Selection of building materials and resources should involve consideration of available and renewable natural resources in addition to more traditional criteria such as cost, durability, performance, and aesthetics. 1 Exterior and Interior Materials Using building materials with low life cycle costs, high-recycled content and low toxicity reduces environmental impacts. A. Reuse existing building shells and components where feasible. B. If on-site reuse is not possible, create a demolition management plan that identifies opportunities to reuse, recycle or sell salvaged materials. C. For historic buildings (constructed before 1935), make changes to exterior in accordance with US Department of the Interior Rehabilitation Guidelines. [ D. Use with Wisconsin Green Building Alliance s Wisconsin Built Directory [ to locate sources of the following building materials, and achieve the following goals: o o o Use 25% materials with post-consumer and post-industrial recycled content. Use 20% materials and products that are manufactured within a radius of 500-mile radius. Specify US Forest Stewardship Council-certified wood-based materials and products for 25% of all wood used in the project. E. Specify mold- and moisture-inhibiting construction materials. F. Use low-voc sealants and adhesives. For standards, see the California South Coast Air Quality Management District Rule #1168 [ and California Bay Area Air Quality Management District Regulation 8, Rule 51 [ G. Use paints and coatings that are certified by Green Seal for VOC and chemical component limits. H. Use carpet systems that meet the requirements of the Carpet and Rug Institute s Green Label Indoor Air Quality Test Program. [ I. Use composite wood and agrifiber products that do not contain added urea-formaldehyde resins. J. Specify building materials (e.g. insulation, carpet pad) that do not use CFC s or HCFC s as foaming agents or in other parts of the manufacturing products. K. Use CFC-free HVAC&R equipment. 2 Water Conservation Off-the-shelf technologies can significantly reduce water consumption and associated costs. A. Employ whole-building design strategies and use the following high-efficiency plumbing fixtures to reduce aggregate water use: o o o Specify lavatory faucet aerators. Specify low-flow electronic sensor faucets in lavatories or provide lavatories with pedal controls. Consider waterless urinals as a way of reducing first cost in plumbing risers and to reduce water consumption. Menomonee Valley Sustainable Design Guidelines page 7 of 10
50 IV. Construction & Demolition Purpose: Improve construction and demolition waste management practices to reduce waste, costs and environmental impacts of demolition and construction activities and transform wastes into resources. The materials in Appendix 6 are designed to assist you in managing Construction and Demolition waste. 1 Waste and Recycling Reduce, Reuse and Recycle construction and demolition waste to protect on-site materials and reduce environmental impacts. A. Reuse existing building shells and components. Salvage materials for reuse or resale. B. Implement a Construction or Demolition Waste Management Plan to recycle and/or salvage at least 50% of construction, demolition and land clearing waste. Include waste reuse and recycling in project specifications. Calculations can be done by weight or volume, but must be consistent throughout. This plan should cover: o o o o o o o Identification of a Plan Manager. Identification of opportunities to reduce site disturbance and minimize environmental impact of construction activities. A list of materials to be separated for recovery and designation of areas for collection. A plan to educate workers about separation requirements Procedures for waste auditing. On-site soils management, including areas of concern, types of contamination and disposal or encapsulation methods. List sorting/separation/tracking rules. 2 Erosion and Dust Control Appropriate control measures protect air and water quality. A. Follow Wisconsin Administrative Code NR 216 [ and City of Milwaukee Chapter 290 [ regardless of the size of disturbance. B. Decrease work during high winds and spray loose soils with water. 3 Pre-Occupancy Controls for Indoor Air Quality Protection of mechanical equipment and building materials during construction will ensure healthy indoor air quality after occupancy. A. Protect stored on-site or installed absorptive materials from moisture damage and mold, and replace all filtration media immediately prior to occupancy. B. Install wet materials before dry in construction sequence to reduce indoor air pollutants. C. Consider a two-week flush of systems at 100% outside air before occupancy. Menomonee Valley Sustainable Design Guidelines page 8 of 10
51 V. Indoor Environmental Quality Purpose: Provide a healthy and productive environment for facility occupants; increase the comfort and alertness of occupants; improve productivity and reduce absenteeism. Good indoor environmental quality encompasses such factors as temperature and relative humidity, adequate ventilation, visual comfort, and noise control. 1 Indoor Air Quality Indoor air quality affects occupants health, which can impact absenteeism rates and employee productivity. A. Meet the minimum requirements of voluntary consensus standard ASHRAE , Ventilation for Acceptable Indoor Air Quality, and approved Addenda (see ASHRAE , Appendix H, for a complete compilation of Addenda) using the Ventilation Rate Procedure. B. Replace all filtration media immediately prior to occupancy using filtration media that have a Minimum Efficiency Reporting Value (MERV) of 13, as determined by ASHRAE C. Increase ventilation to exceed air change effectiveness of 0.9 per ASHRAE D. Provide for the use of natural ventilation in transition seasons. Take advantage of cross ventilation, prevailing winds and stack effects when possible. E. Provide direct exhaust for all spaces that generate moisture and pollutants, including manufacturing, toilet and locker rooms, copy rooms and rooms where chemicals and cleaners are stored. F. Provide mats or grills at entry areas to control dirt and dust. G. Prohibit smoking in the building. H. Consider a carbon dioxide monitoring system in spaces of variable occupancy to provide feedback on space ventilation performance. Specify initial operational set point parameters to ensure indoor carbon dioxide levels do not exceed outdoor levels by more than 530 ppm at any time. 2 Acoustic Quality Improved acoustic quality ensures high employee productivity, attention span and minimizes stress. A. Maintain a maximum interior Noise Criteria of 35 decibels in occupied areas. Ceiling panels and carpeting can assist in absorbing sound. B. Place acoustic buffers (corridors, lobbies, stairwells, storage rooms, etc.) and sound-insulated partitions between noise-producing spaces and noise-sensitive areas. C. Place vibrating equipment on isolation pads and enclose in sound-absorbing walls, floors and ceilings. D. Maintain a maximum external decibel reading of 50 db at property line. E. In areas of high ambient noise, specify windows rated at an STC of 40 or better. F. In other areas, specify windows rated at 35 or better. Menomonee Valley Sustainable Design Guidelines page 9 of 10
52 VI. Operations and Maintenance Purpose: Ensure the building operates at its designed efficiency, reducing costs and increasing occupant productivity over the full life of the facility. 1 Operations Manual and Monitoring A building that is operated in accordance with its design and construction will maintain its value and continue its high performance. A. Prepare an Operations & Maintenance manual, including monitoring of energy use, luminaire and filter maintenance, in accordance with ASHRAE This plan should clearly describe the principles of design intentions, O&M procedures, and should be accessible to building occupants. B. Schedule regular systems review and maintenance. C. Prepare an operational waste prevention and recycling plan. D. Design to accommodate areas for recycling of waste materials. 2 Facility Maintenance Proper housekeeping and operations activities can protect the health and comfort of occupants and decrease the impact of the building on the environment. A. Maintain healthy and efficient custodial operations using Green Seal [ or equivalent cleaning products. B. Frequently inspect for fungus and molds. C. Form an in-house "Green Team" to raise awareness of workplace associated environmental concerns. D. Provide centralized ground-floor location for collection and storage of recyclables. Train occupants on recycling procedures and consider incorporating recycling facilities such as compactors, chutes or other technologies to accommodate predicted volumes. E. Do not store materials, products or equipment outdoors, except finished product in transit and company-owned vehicles. 3 Maintenance and Stewardship of Site and Landscape Elements Proper long term maintenance of landscape elements will maintain their aesthetic beauty and financial value. A. Prepare and implement a landscape care and maintenance manual or plan to ensure long-term viability of plantings. This should identify any long-term sequencing actions that are intended by the landscape designer. Menomonee Valley Sustainable Design Guidelines page 10 of 10
53 RESOURCES FOR REDEVELOPING THE MENOMONEE VALLEY FUNDS AND FINANCING NEW MARKETS TAX CREDIT (NMTC) Managed through the US Department of Treasury, the New Markets Tax Credit Program will spur approximately $15 billion in investments into privately managed investment institutions. In turn, these privately managed investment institutions, or Community Development Entities (CDEs), will make loans and capital investments in businesses in underserved areas (the entire Menomonee Valley qualifies). By making an investment in a CDE, an individual or corporate investor can receive a tax credit worth 39 percent (30 percent net present value) of the initial investment, distributed over 7 years, along with any anticipated return on their investment in the CDE. Several Wisconsin financial institutions have received tax allocation authority, and as a result, have funds to invest in the form of equity and debt in qualifying projects. The terms and deal structure varies with each institution so it is recommended to shop around. For information see STATE OF WI BROWNFIELD GRANT PROGRAM The Brownfields Initiative Grant Program is a $7-million per fiscal year grant program administered by the Department of Commerce (DOC). Funding is available for Brownfield projects that promote economic development and have a positive effect on the environment. The average grant size in FY04 was $476,000. MVP has worked closely with the DOC on many Valley projects. Website Contact: Jason Scott, (608) , jscott@commerce.state.wi.us. VALLEY FINANCIAL RESOURCES PAGE 1 of 3
54 MEDC LOAN PRODUCTS The Milwaukee Economic Development Corporation (MEDC) is a City-sponsored lending and land development company that offers financing programs to small companies in the City of Milwaukee and the four-county metropolitan area. MEDC has several loan products that serve the needs of small and larger businesses. The investment of more than $205 million has resulted in the creation of nearly 12,000 jobs in the Milwaukee area and stimulated over $790 million in private investment. MEDC borrowers range from manufacturing firms to bakeries, from software developers to specialty groceries. Website: Contact: David Latona, (414) , david.latona@medconline.com STATE OF WI BROWNFIELD SITE ASSESSMENT GRANT Up to $25,000 is available to existing or potential property owners as matching funds for site assessment, confirmatory sampling and remedial action plans for sites located in the City of Milwaukee with a proposed redevelopment project. MVP has secured $30,000 for the Stockyards site through this program. Website: Contact: Dave Misky, (414) , David.Misky@milwaukee.gov TAX INCENTIVES RENEWAL COMMUNITY TAX INCENTIVES The City of Milwaukee has been recognized under the Community Renewal Act of 2000 as a Renewal Community (RC), a status that gives a designated area exclusive access to tax incentives to spur economic development initiatives. The entire Valley is within the boundaries of Milwaukee s RC. The package of tax incentives includes two very attractive incentives for this site: 1. RC Wage Credits: Up to $1,500 per year per employee (new & existing) that lives and works in the RC. The credit is self-verified and claimed on IRS form Commercial Revitalization Deduction (CRD): Businesses that construct or rehabilitate commercial property in the RC and receive approval through the Redevelopment Authority of the City of Milwaukee (RACM) can deduct a portion of the costs of acquisition and rehabilitation over a shorter period of time than permitted under standard depreciation rules. A business can elect a deduction of one-half of qualifying expenditures up to $10 million for any one project in the year the building is placed in service or can deduct all qualifying expenditures pro rata over 10 years. Website: Contact: David Latona, (414) , david.latona@medconline.com VALLEY FINANCIAL RESOURCES PAGE 2 of 3
55 COMMUNITY DEVELOPMENT ZONE WAGE TAX CREDITS Credit against Wisconsin state income tax liability of $3,000-$8,000 for new jobs created. Credits awarded based on starting wages, benefits, and other considerations. The business must be expanding in, or relocating to, designated areas (most of Valley is within the zone). New jobs created must be fulltime equivalent. Must be approved by the City and Wisconsin Department of Commerce. Websites: Contact: Marcia Theusch, (414) , TAX CREDITS FOR ENVIRONMENTAL REMEDIATION Businesses locating or expanding in the City of Milwaukee's Development Zones, designated by the Wisconsin Department of Commerce, may qualify for tax credits for initiating environmental remediation. Up to 50% of the costs of remediation and testing may qualify for tax credits. Nearly all areas zoned for manufacturing uses in the City are included in the Development Zone. Website: Contact: Dave Misky, MEDC, (414) , WORK OPPORTUNITY TAX CREDIT (WOTC) WELFARE TO WORK (WTW) CREDIT WOTC: Credit up to $2,400 against Federal taxes for businesses for each new hire from groups that have high unemployment rates or other special employment needs. Business must receive approval from Department of Workforce Development (DWD) to certify employee is in targeted group. WtW: Two-year credit against Federal taxes for businesses that hire long-term family assistance recipients. Credits up to $3,500 for the first year, and $5,000 for the second year for each new hire. Business must receive approval from DWD. Website: Contact: Vern Muche, (608) , TECHNOLOGY ZONE TAX CREDITS Milwaukee is participating in the Wisconsin Technology Zone Program with two Technology Zones allocated to Southeast Wisconsin. The maximum tax credit available through this program is $500,000. Tax credit certification is provided by the Wisconsin Department of Commerce based upon a recommendation from the Southeast Wisconsin Regional Economic Partnership. Websites: Contact: Marcia Theusch, (414) , marcia.theusch@medconline.com VALLEY FINANCIAL RESOURCES PAGE 3 of 3
56 SIEDC Green Zone Consulting Services Task 1.2 Emerging Trends in the Green Sector Introduction Just as the economy is evolving to recognize the challenges and embrace the opportunities generated by the need for green products, green developments are maturing and adopting new strategies for success. These strategies are increasingly based on a pragmatic understanding of market supply and demand and often adapt the policies and industries of an earlier day to build upon known strengths rather than creating an industry or culture anew. Communities which have successfully adopted a green economic approach or have developed a park exclusively targeted towards the green economy have done so from a fundamental understanding of the direction of movement from traditional to renewable industry. They have then developed a strategy which transforms parts of the economy. In these ways, incremental change can result in economic development and measurable change. The following broad green industry trends can provide examples for SIEDC to adopt or adapt to the community s specific goals. These trends are as listed below and explained in further detail with benefits outlined and examples provided. Land Control Closed Loop Opportunities Green Infrastructural Strategies Mixed Use Development Strategies Migration to the Green Economy Land Control Given the multiple steps, multiple agency requirements and other site difficulties encountered in the redevelopment of industrial brownfield properties and other encumbered lands, property owners with limited sophistication, minimal capital, and minimal interest in acting as a developer or in considering alternative uses for their site are often not effective stewards of a redevelopment process. While many property owners are willing to wait out the redevelopment cycle and move forward once value achievement is imminent, many sites that are key to larger urban redevelopment strategies become the focus of not for profit corporation redevelopment strategies. Increasingly, redevelopment agencies experienced in the process, and cognizant of the time that will be required to remove the impediments to redevelopment and prepare a site for redevelopment, see themselves as effective property stewards, facilitators of process and appropriate leaders to package financing incentives for redevelopment. To move sites expeditiously and to position sites for financing and redevelopment planning, notfor profit economic development entities are increasingly stepping into an ownership capacity, buying properties to hold them in order to structure an effective redevelopment strategy for the site. Task 1.2 Emerging Trends in the Green Sector 1
 Public private partnerships Development restrictions and development overlay districts Revolving loan funds to purchase properties Combining properties to enhance value and package")

57 SIEDC Green Zone Consulting Services BENEFITS: Securing tax incentives (this can both work for and against the local development corporation ownership model) Development of an Industrial Development Corporation ( IDC) Public private partnerships Development restrictions and development overlay districts Revolving loan funds to purchase properties Combining properties to enhance value and package capital improvements EXAMPLES: Menomenee Valley Partnership (MVP) Milwaukee, Wisc purchased private industrial lands, packaged sites together and placed green development standards on the sites to set an example for the larger, primarily private industrial district. The sale and development of the MVP sites has led to private lands adopting the development standards and has provided financial revenues that have supported the operations of MVP and the expansion of the buy and redevelopment program. The Fairfield Eco Industrial Park Baltimore, Md the Baltimore Development Corporation acted as the agent on behalf of the City of Baltimore, condemning roughly 20+ acres properties mainly small postage stamp residential sites within a larger industrial area to create larger assemblages. The Baltimore Development Corporation (BDC) handled all of the preparation work including acquisition, disposal, and solicitation for this process for the City of Baltimore. Figure 1: Menomonee Valley Partnership Development Site Before and After Task 1.2 Emerging Trends in the Green Sector 2

 certification is a prestigious certification that manufacturers seek for their product lines.")
58 SIEDC Green Zone Consulting Services Closed Loop Opportunities Closed loop opportunities look to capture the waste of one manufacturer, harness that waste and transform it into an input for another manufacturer. This process is also known as industrial ecology or waste to input. The goal is to transform business cost centers into profit centers. Many existing manufacturers on Staten Island are forced to ship their waste off island, adding toll costs to trucking and disposal costs. Figure 2 Kalundborg Industrial Ecology Model The cradle to cradle (C2C) certification is a prestigious certification that manufacturers seek for their product lines. C2C can be a component of a closed loop focused Green Zone. This is because C2C products contain materials that can be reused ( technical metabolism ) or organic materials that can be returned to the soil ( biological metabolism ). The certifying body explains in further detail below: At its core, Cradle to Cradle design perceives the safe and productive processes of nature s biological metabolism as a model for developing a technical metabolism flow of industrial materials. Product components can be designed for continuous recovery and reutilization as biological and technical nutrients within these metabolisms. The Cradle to Cradle framework also addresses energy, water and social responsibility through the following tenets: Eliminate the concept of waste. Waste equals food. Design products and materials with life cycles that are safe for human health and the environment and that can be reused perpetually through biological and technical metabolisms. Create and participate in systems to collect and recover the value of these materials following their use. Power with renewable energy. Use current solar income. Maximize the use of renewable energy. Respect human & natural systems. Celebrate diversity. Manage water use to maximize quality, promote healthy ecosystems and respect local impacts. Guide operations and stakeholder relationships using social responsibility. There are nearly 500 products which have been certified at various levels. The principal is intriguing, but common practice has thus far proven elusive to other industrial parks and green zones in the United States. SIEDC may be able to attract businesses that are compatible with existing industries on the island. Alternately, a new master industrial ecology plan could attract multiple green manufacturers at the same time. BENEFITS: Reduction in natural resources use for inputs, pollution, energy use, and disposal of wastes Task 1.2 Emerging Trends in the Green Sector 3
59 SIEDC Green Zone Consulting Services Increase in value of non product outputs (cost centers of existing industries can be converted to profit centers) Tolls can be avoided Energy and other raw materials provided inexpensively Third party certification of products manufactured adds prestige and credibility to the Green Zone Improvement in wastewater permitting and discharge Incentive to site a company that has a particular need that can be met locally Economies of scale if multiple companies can benefit EXAMPLE: Perhaps the most commonly cited example of an industrial ecology, Kalundborg, Denmark is a zone based on local industry and farming working together. Devens, Massachusetts is a 4,400 acre masterplanned community offering 2,100 protected acres of open space. All properties feature 75 day permitting process and access to low cost utilities. Devens is focusing on water and energy systems and the following six material flows: cardboard, paper, plastic, metal, palettes, and machine oil. Devens companies on average have saved $75,000 per year on disposal costs. Figure 3: Aerial View of Kalundborg Industrial Eco Park Green Infrastructural Strategies Industrial sites, especially urban industrial sites, tend to be encumbered by brownfield and wetland issues and are often, due to the historical context of the prior industrial use, located on the waterfront. Increasingly, the redevelopment strategies for these sites involve an environmental response that can be tied in as part of the packaging of the redevelopment of the site. A number of site redevelopment strategies are being connected with a larger environmental benefit in order to create a successful redevelopment strategy. Natural stormwater management and alternative energy are two green infrastructural strategies that are helping to reactivate industrial sites. BENEFITS: Environmental incentives Successful permitting strategies (this can be both a positive and a negative as many jurisdictions do not see natural stormwater management strategies as readily permittable) Lower cost energy (wind, solar, thermal) Public Support for environmentally sensitive strategies Capital cost savings EXAMPLE: Stormwater management and green space were key elements of early plans for redevelopment in the Menomonee River Valley. The area is within the 100 year flood plain for the region, and the site s proximity to the Menomonee River posed a risk for contaminated run off to flow into the water and towards Lake Michigan. Early concepts for the redevelopment focused heavily on balancing the needs of the industrial center with the space required for green areas. Task 1.2 Emerging Trends in the Green Sector 4

60 SIEDC Green Zone Consulting Services Plots designated for development were filled in to be raised up above the flood plain. The Partnership also graded the entire industrial park to accommodate effective stormwater flow. Builders are encouraged to develop properties with as much permeable surface as possible, so that water can return to the ground. In places where that is not possible, potentially contaminated rain and snow runoff is routed through a system of subsurface pipes. Water settles in shallow wetland meadows and is filtered through a layer of crushed concrete. Finally, gravity takes the runoff even further down the line to the Swamp Forest section of the park, where natural vegetation absorbs many remaining contaminants. The entire process removes more than 80% of total suspended solids, as well as phosphorous, nitrogen, and heavy metals. The system is designed to handle days of extreme rainfall, without dumping overflow into the river. Mixed Use Development Strategies Diversity in site use allows for flexibility of redevelopment strategies, expands the group of potential users and creates uses that can be compatible with industrial use. There are a number of examples of mixed use redevelopment projects that could provide insight into development opportunities with the Staten Island Green Zone, including: retrofitting strip centers, greyfield development, creation of mixed use centers that serve an industrial base, maritime support facilities like boat services and maritime employee services and the coupling of education uses with industrial uses. BENEFITS: Greater diversity of uses for a site, greater opportunity for expansion Increased community support for use Partnerships Community redevelopment benefits EXAMPLE: The Philadelphia Navy Yard is a vibrant campus that is buzzing with activity that set a vision to convert its facilities to attract a diverse group of tenants. In 2004, The Navy Yard unveiled a master plan which detailed a new, comprehensive vision for The Navy Yard. In the plan were specific recommendations for adding over 12 million square feet of new construction and historic renovation supporting office, R&D, industrial and residential development and complemented with commercial retail amenities, dynamic open spaces and expanded mass transit. At full build, The Navy Yard will support more than Figure 4: Stormwater Park Menomonee Industrial Park Task 1.2 Emerging Trends in the Green Sector 5


61 SIEDC Green Zone Consulting Services 20,000 employees and over $2 billion in private investment. With this plan as a guide, The Navy Yard has experienced a tremendous amount of connection with a larger mandate, it can result in cross branding of business and in marketing a shared green approach to business practice. are Create opportunities for existing businesses to migrate to a green economy BENEFITS: Marketing and branding Access to incentives Partnerships Figure 5: Phila Navy Ship Yard development in a short period of time. Migration to the Green Economy Marketing Green as a Component of Business Practice The green phenomenon has begun to take root in many industries and increasingly businesses are recognizing that their clients and their competition are securing a market advantage through green practice. That is leading to many firms in existence in locations migrating towards becoming green. When this is done in EXAMPLE: Allegheny River Towns Enterprise Zone (ARTEZ) Begun in 2005, seven towns north of the City of Pittsburgh established ARTEZ to determine how these older industrial communities might transform themselves to participate effectively in the 21st century green marketplace. Through identifying companies already participating in green industries, developing supplier/vendor networks, and assisting smaller companies to change product lines through small financing, the zone is using the manufacturing and engineering talents of the past to build innovative energy efficient products of the future. The zone is currently focusing on hightech companies in the building materials and renewable energy sectors, leveraging the industrial base currently in the zone. Figure 6: Aerial View of the River Towns Area Task 1.2 Emerging Trends in the Green Sector 6
62 Task 1.3 Brownfield Remediation Programs Introduction Brownfields are defined as real property, the redevelopment, expansion, or reuse of which may be complicated by the presence or potential presence of a hazardous substance, pollutant, or contaminant. There are a number of programs offered on the Federal, State and Local levels to help municipalities, community organizations and developers address the challenges of redeveloping these types of properties, some of which may be applicable to locations on Staten Island within the proposed Green Zone. The following section and accompanying matrix outlines specific programs that are offered by each level of government federal, state, and local. Most federal programs are targeted to municipalities and not for profits to help get sites shovel ready and to reduce the uncertainty and costs associated with brownfield redevelopment through assessment, cleanup and financing assistance. The NYS Brownfield Cleanup Program is designed for owners and developers trying to redevelop specific brownfield sites by offering incentives such as liability protection and currently limited financial incentives for remediation and redevelopment. New York City's new brownfield program offers similar protections to the New York State program and is aimed at properties with lower amounts of contamination, with correspondingly rapid review and modest amounts of financial incentives. Federal Government U.S. Environmental Protection Agency (EPA) Area Wide Planning Pilot Program EPA is piloting this area wide planning approach to community brownfield challenges, which recognizes that revitalization of the area surrounding the brownfield site(s) is critical to the successful reuse of the property as assessment, cleanup, and redevelopment of an individual site. The area wide planning approach will enhance EPA's core brownfields assistance programs by encouraging continued meaningful involvement in a locally driven planning process that will result in a strategy for making brownfields site assessment, cleanup and/or redevelopment decisions for the future. The pilot program will help further communitybased partnership efforts within underserved or economically disadvantaged neighborhoods by confronting local environmental and public health challenges related to brownfields, while creating a planning framework to advance economic development and job creation. Assessment Grants Assessment grants provide funding for a grant recipient to inventory, characterize, assess, and conduct planning and community involvement related to brownfields sites. An eligible entity may apply for up to $200,000 to assess a site contaminated by hazardous substances, pollutants, or contaminants (including hazardous substances co mingled with petroleum) and up to $200,000 to address a site contaminated by petroleum. Applicants may seek a waiver of the $200,000 limit and request Task 1.3 Brownfield Remediation Programs 1
63 up to $350,000 for a site contaminated by hazardous substances, pollutants, or contaminants and up to $350,000 to assess a site contaminated by petroleum. Such waivers must be based on the anticipated level of hazardous substances, pollutants, or contaminants (including hazardous substances co mingled with petroleum) at a single site. A coalition of three or more eligible applicants can submit one grant proposal under the name of one of the coalition members for up to $ 1,000,000. The performance period for these grants is three years. Revolving Loan Fund Revolving Loan Fund (RLF) grants provide funding for a grant recipient to capitalize a revolving loan fund and to provide subgrants to carry out cleanup activities at brownfield sites. Through these grants, EPA seeks to strengthen the marketplace and encourage stakeholders to leverage the resources needed to clean up and redevelop brownfields. When loans are repaid, the loan amount is returned into the fund and re lent to other borrowers, providing an ongoing source of capital within a community. Cleanup Grants Cleanup grants provide funding for a grant recipient to carry out cleanup activities at brownfield sites. An eligible entity may apply for up to $200,000 per site. Due to budget limitations, no entity can apply for funding cleanup activities at more than three sites. These funds may be used to address sites contaminated by petroleum and hazardous substances, pollutants, or contaminants (including hazardous substances co mingled with petroleum). Cleanup grants require a 20 percent cost share, which may be in the form of a contribution of money, labor, material, or services, and must be for eligible and allowable costs (the match must equal 20 percent of the amount of funding provided by EPA and cannot include administrative costs). A cleanup grant applicant may request a waiver of the 20 percent cost share requirement based on hardship. An applicant must own the site for which it is requesting funding at time of application. The performance period for these grants is three years. Environmental Workforce Development and Job Training Grants Through an annual grant competition, Environmental Workforce Development and Job Training grant funds are provided to nonprofit organizations and other eligible entities to recruit, train, and place predominantly lowincome and minority, unemployed and underemployed residents from solid and hazardous waste impacted communities. Residents learn the skills needed to secure full time, sustainable, employment in the environmental field, including a focus on assessment and cleanup activities. These grants help to create green jobs that reduce environmental contamination and build more sustainable futures for communities. Training Research and Technical Assistant Grants This statute authorizes EPA to provide, or fund eligible entities or nonprofit organizations to provide brownfields training, research, and technical assistance to individuals and organizations. EPA awards grants and cooperative agreements under a statutory ranking system that includes factors relating to community need, impact on human health and the environment, stimulation or leveraging of other funds, eligibility for funding from other sources, effective use of existing infrastructure. In addition to the statutory factors, EPA also evaluates applicants based on their ability to Task 1.3 Brownfield Remediation Programs 2
64 manage grants and other policy based factors intended to promote effective stewardship of Federal funds. Targeted Brownfield Assessments EPA's Targeted Brownfields Assessment (TBA) program is designed to help states, tribes, and municipalities especially those without EPA Brownfields Assessment Pilots/Grants minimize the uncertainties of contamination often associated with brownfields. Targeted Brownfields Assessments supplement and work with other efforts under EPA's Brownfields Program to promote the cleanup and redevelopment of brownfields. EPA's TBA assistance is available through two sources: directly from EPA through EPA Regional Brownfields offices under Subtitle A of the law, and from state or tribal voluntary response program offices receiving funding under Subtitle C of the law. Internal Revenue Service (IRS) Brownfield Tax Incentive Section 198(a) The Brownfields Tax Incentive encourages the cleanup and reuse of brownfields. Under the Brownfields Tax Incentive, environmental cleanup costs are fully deductible in the year incurred, rather than capitalized and spread over time. Improvements in 2006 expanded the tax incentive to include petroleum cleanup. U.S. Department of Housing and Urban Development (HUD) Brownfield Economic Development Initiative It is important to note that the BEDI program has been terminated, as there are no funds for the program in the Continuing Resolution for this fiscal year, and it is neither in the House nor Senate write ups for the next fiscal year, however, it remains on this list and will be an initiative that is monitored. The purpose of the BEDI program is to spur the return of brownfields to productive economic use through financial assistance to public entities in the redevelopment of brownfields, and enhance the security or improve the viability of a project financed with Section 108 guaranteed loan authority. Therefore BEDI grants must be used in conjunction with a new Section 108 guaranteed loan commitment. Section 108 Loan Program The HUD Section 108 loan program provides the means for cities and urban counties to borrow funds to spend on any Community Development Block Grant (CDBG) eligible activity. Those include site environmental remediation, demolition, relocation payments and off site improvements, which are common costs associated with brownfields sites. Each entitlement city (over 50,000 population) and urban county (100,000 population in the unincorporated area and the sum of the cities under 50,000 population), may borrow up to five times their annual CDBG allocation. The repayment can be up to 20 years. The interest rate on the interim loans is 25 basis points over 3 Month LIBOR (less than 1%) and the permanent rates (once HUD conducts a public offering) averages the same a 10 year Treasuries (less than 3%). Both rates are very low as compared to any other means of financing projects. The Section 108 loan funds can be provide to the private sector as a grant or loan under the special economic development activities, CDBG eligible activity. Task 1.3 Brownfield Remediation Programs 3
65 New York State New York State Department of Environmental Conservation (NYSDEC) Brownfield Cleanup Program The goal of the Brownfield Cleanup Program (BCP) is to enhance private sector cleanups of brownfields and to reduce development pressure on "greenfields". A brownfield site is real property, the redevelopment or reuse of which may be complicated by the presence or potential presence of a contaminant. Contaminants include hazardous waste and/or petroleum. Environmental Restoration Program The Environmental Restoration Program, the State provides grants to municipalities to reimburse up to 90 percent of on site eligible costs and 100% of off site eligible costs for site investigation and remediation activities. Once remediated, the property may then be reused for commercial, industrial, residential or public use. New York State Department of State (NYSDOS) Brownfield Opportunity Area Program The Brownfield Opportunity Areas (BOA) Program provides grants and technical support to help municipalities and community organizations complete and implement brownfield redevelopment plans for their communities. BOA funded projects may be reimbursed for up to 90 percent of the total eligible project costs. Our goal is to work in partnership with local communities and organizations to develop and realize a community vision for redevelopment and revitalization. Office of the New York State Comptroller (NYSOSC) New York State Oil Spill Fund This fund, more commonly known as the Oil Spill Fund (Fund), is responsible for the cleanup of oil spills, the protection of the environment and public health, and the reimbursement of costs related to oil spills. The Oil Spill Fund s accountability and oversight help to keep petroleum license fees low and to assure that irresponsible petroleum handlers and property owners bear financial responsibility for their spills. New York City New York City Office of Environmental Remediation (NYC MOER) New York City Brownfield Cleanup Program NYC will ensure that brownfield sites with light to moderate levels of contamination are cleaned up under governmental oversight utilizing remedies that are protective of human health and the environment. The benefits communities will receive as a result of environmental cleanup and brownfield redevelopment will include neighborhood revitalization, job creation, and an increase in local amenities. On successful completion of the NYC BCP, enrollees will obtain a Notice of Completion and liability limitation against future environmental claims on the property, which will provide lenders with assurances that these properties have been cleaned up under government oversight to a standard that is protective of human health and the environment. Task 1.3 Brownfield Remediation Programs 4
66 New York City Brownfield Incentive Grant (BIG) program The NYC Brownfield Incentive Grant (BIG) Program provides an easy and flexible way to reduce the cost of Brownfield redevelopment in New York City. Grants assist brownfields throughout the development process, from the earliest stages of information gathering through environmental investigation and cleanup work. Grants are intended to make redevelopment on Brownfield sites more competitive with clean properties. The MOER has set aside $550,000 starting in December of 2011 for phase I and phase II assessment monies. Phase I studies tend to cost roughly $5000 and phase II assessments typical run between $10,000 and $25,000, depending upon site conditions. MOER has also provided more than $2.3 million in clean up grants which range in size from $ to $100,000. The BIG program also funds initial development grant funds, Bonus Clean up grants and BOA (State program) matching funds. Environmental Technical Assistance To address this need, members of the Partnership that are environmental consultants are available to provide pro bono counseling services. If a community requests such assistance, an environmental consultant in the Partnership with no conflict of interest on the specific project will be provided with a copy of the cleanup plan, will initiate a review and will reach out to the community. This process is intended to be confidential. The environmental consultant will provide timely document review and communication including a candid, impartial assessment and consultation on the cleanup plan. Member organizations of the Partnership provide these services free of charge and independent of New York City government. Brownfield WORKS! Employers can receive up to six months of wage subsidy by providing training and work to qualified workers who have 40 hour HAZWOPER and other environmental certifications through STRIVE, St. Nick s Alliance, Building Works, SoBRO, or Sustainable South Bronx. The subsidy reimburses you up to $12/hour plus % of fringe benefits. Enroll by spring to take full advantage of the sixmonth subsidy period. Green Jobs Training Grant OER has created Brownfield WORKS!, which offers employers of qualified workers reimbursement of up to $12/hour and 8.9% for fringe benefits for 35 hours per week for three months. Experience and on the job training from environmental employers is vital to helping local communities develop skilled labor for cleanup of brownfields and other contaminated sites. BOEDC Low Interest Loans for Clean up This program is only available in the South Bronx through the BOEDC, but represents a way in which local EDC s can partner with City and State agencies in providing funding and financing incentives to offset brownfield cleanup costs. This particular program provides 2% revolving loans for up to $150,000 to qualifying owners and developers. Task 1.3 Brownfield Remediation Programs 5
67 STATEN ISLAND ECONOMIC DEVELOPMENT CORPORATION GREEN ZONE CONSULTANT SERVICES BROWNFIELD REMEDIATION MATRIX (1.3) Task Brownfields Remediation Programs Matrix FEDERAL STATE CITY Eligible Entity Type of Incentive Eligible Activities Program Name Area Wide Planning Pilot Program EPA x x x No Yes Yes x EPA x Assessment Grants EPA x x Yes x Yes x EPA x Revolving Loan Fund EPA x x Yes x Yes x EPA x Cleanup Grants EPA x x x No x Yes x EPA x Environmental Workforce Development and Job Training Grants EPA x x x No x x EPA x Training Research and Technical Assistant Grants EPA Targeted Brownfield Assessments EPA x x Brownfield Tax Incentive IRS x x yes x EPA x Brownfield Economic Development Initiative HUD x x x x X HUD x x Brownfield Cleanup Program* DEC x x x x DEC x x x Environmental Restoration Program DEC x x x x x DEC x x Brownfield Opportunity Area Program DOS x x x x DEC x New York State Oil Spill Fund NYS OSC x x x x NYS OSC x New York City Brownfield Cleanup Program OER x x x x x OER x New York City Brownfield Incentive Grants OER x x x x OER x x x Environmental Technical Assistance OER x OER x x Brownfield WORKS! OER x x OER x x x x Green Jobs Training Grant OER x x OER x x x x Note: Key: * NYS BCP Program is currently suspended. 1 Administrator 11 Indemnified from CERCLA Required *Tax credits amounts are dependant on cleanup levels, location at 2 Local Government 12 Petroleum and use with a cap of $35 MM. Tax credits are not being awarded 3 Quasi Governmental Entity 13 Source this time. The program offers off site liability protection also. 4 Not For Profit 14 Assessment/Investigation 5 Developer 15 Remediation 6 Pass Through to Property Owners/Developers 16 Development 7 Loan 17 Insurance 8 Grant 18 Planning 9 Statement of Remediation (Liability Relief) 19 Job Training 10 Tax Credit
68 Task 1.4 Green Zone Boundary Justification Introduction The SIEDC is looking to establish a Green Zone as a strategic approach for marketing the largely industrial West Shore of Staten Island. While creating a brand around the establishment of green practices will benefit SIEDC s attempts to market properties, a further goal of the effort is to establish specific physical boundaries for the zone that could be tied to specific local, State and Federal incentives that will help to distinguish the zone as a preferred siting option for new businesses and provide much needed assistance and incentive to existing businesses. To that end, the SIEDC has established a boundary encompassing a large portion of the West Shore of Staten Island largely defined by some distinct boundaries. To the west the site is bounded by the Arthur Kill and to the North by the Staten Island Expressway (I 278) and the Goethals Bridge. To the East, the boundary is represented primarily by the residential communities and is separated from the zone by Richmond Avenue and Travis Avenue. The southern boundary is the southern edge of Fresh Kills Park. Our task is to review the boundary and the rationale for its creation and to make recommendations for refinement, contraction and/or expansion. The zone purposefully includes Fresh Kills Park, the town of Travis and the Teleport, a corporate Park straddling South Avenue. At the same time, the boundary does not include some large industrial assemblages including Howland Hook and the industrial waterfront of Rossville. Our team has developed overarching criteria for the types of uses that should comprise the zone to help determine zone boundaries. The criteria represent the types of properties that SIEDC would wish to be included within the SIEDC Green Zone. The criteria are meant solely to guide a process for boundary selection and should not be viewed as proscriptive requirements for green zone inclusion as there are a number of unique conditions and expectations that will necessarily be included within a large zone that encompasses a multiplicity of properties and use groups. This initial set of GREEN ZONE CRITERIA Non residential Green Zone target development sites are not intended for residential use Same Use Continuity The Green Zone should be separated from primarily residential zones (with the exception of the Travis community) Development Potential Green Zone should target sites that are underdeveloped or undeveloped Green Opportunity the Green Zone should contain sites that could enhance or provide green opportunities through energy, waste, stormwater management or other means criteria was vetted through the SIEDC Green Zone steering committee and a revised list of criteria to guide green zone boundary establishme nt was developed. 1.4 GZ Boundary Justification 1
69 Using these criteria as a guide to determine boundary designation, we then looked at the existing boundary to determine if expressed boundary limits met the criteria the SIEDC and the team had developed. Existing Boundary Review Travis Residential Community The stated goal of the SIEDC for the Green Zone is to seek redevelopment opportunities for underperforming industrial properties. Additionally, SIEDC has established the Green Zone concept and the specific physical zone in order to retain and preserve existing industrially zoned lands against the proliferation of residential growth. Therefore, on the face of it, the mostly residential neighborhood of Travis would not be a candidate neighborhood for the green zone as it is a well established residential community that would never be considered as a candidate location for industrial expansion. However, there are several unique characteristics associated with Travis that bear further review for inclusion in the green zone even though it would not be a candidate for industrial development. First and foremost, the Travis neighborhood represents a large residential island within a much larger green zone boundary and slicing it out of the Green Zone would create a big donut hole in the middle of the zone. A second important point is that Travis is actually bounded on both ends by potential development and redevelopment sites that are zoned for either industrial or commercial use that could benefit from green zone designation, irrespective of future use (industrial, commercial, residential). A third consideration is that the industrial strategies that we will be considering for the larger green zone have the potential to partner with and complement the residential community of Travis. Potential redevelopment strategies for energy generation, stormwater management or other industrial or commercial uses may result in opportunities to provide enhancements to the community of Travis through enhanced park access, local energy opportunity and most importantly job creation strategies. It is important to note that it is not and never will be the intent of the SIEDC to develop any sites that are currently zoned and/or designated as residential sites, and that the Travis neighborhood requires a special designation as a non development zone within the larger green zone. Recommendation: classify the entire residentially zoned district of Travis as a nondevelopment zone within the Green Zone. 1.4 GZ Boundary Justification 2

70 Fresh Kills Park There are a number of park sites within the Green Zone, including some isolated sites in the Teleport area and sites along the waterfront that contain significant water conditions. However, the Fresh Kills site represents a 2200 acre assemblage that encompasses the entire southern section of the current Green Zone. The SIEDC incorporated Fresh Kills because they recognized the opportunity for energy generation at the site and the potential to partner that energy generation with a larger green zone energy strategy. Fresh Kills is a world famous reclamation of a former industrial site and therefore represents a truly unique opportunity for incorporating landfill reclamation into a larger development strategy. We recognize that there are established plans for Fresh Kills to convert the site into a park. Any potential partnership with the park would need to be in keeping with park development and would need to be seen as an enhancement to the redevelopment strategy for the park. As the site is currently a landfill, it produces methane and will continue to do so for several decades. There may be potential to connect that local energy generation strategy with a development strategy for the Green Zone, or to consider wind or solar alternative energy generation that could support a carbon reduction strategy for the island. The opportunity to consider such transformative measures with a world famous project could significantly benefit the larger green zone. Additionally, given the long term redevelopment timeframe for the site, smaller scale and short term opportunities for soil generation, composting or other pilot demonstration projects could incorporate a portion of the Fresh Kills footprint for a plan that could prove mutually beneficial for park development and green zone development. Recommendation: Retain and designate Fresh Kills Park as a potential resource for green zone strategies Fresh Kills Park Boundary Expansion Analysis While our analysis confirms that the properties within the existing boundary make sense for green zone designation, with some specific stipulations for special designation for the Travis residential neighborhood and for Fresh Kills Park, we also undertook an analysis of potential boundary expansion to take in additional West Shore locations that met the guiding criteria developed by the team. We analyzed adjacent properties to the North, the East and the South of the existing green zone. 1.4 GZ Boundary Justification 3

71 Northern Expansion large primarily residential sites that do not fit the complexion of goals of the green zone. Recommendation: Hold the eastern boundary at the current location Southern Expansion The site boundary has been drawn at the Staten Island Expressway, a very clear northern boundary for the zone. The industrial nature of the western section of Staten Island continues north of the site all the way to the Kill Van Kull, encompassing Port Ivory, Howland Hook Marine Terminal and lands that have been designated for Port expansion. In reviewing a possible expansion to the north, the team collectively agreed that the Howland Hook Marine terminal and adjacent lands were a clearly established industrial use that would not particularly benefit from green zone designation. Recommendation: Hold the northern boundary at I 278 Eastern Expansion The Green Zone eastern boundary is clearly defined along its eastern edge by a series of dense residential communities. While Richmond Avenue, which defines a large section of the eastern boundary, contains a number of commercial sites, including the Staten Island Mall, these commercial sites lie at the edge of The area to the south of the current green zone boundary is worthy of further study and consideration. While much of the land south of Fresh Kills Park is residential, the residential boundary sits to the south of Arthur Kill Road. However, in Rossville, north of Arthur Kill Road, there are a number of industrial waterfront sites that are the subject of considerable scrutiny by the New York City Department of City Planning, the New York City Economic Development Corporation and SIEDC. The ultimate direction of these properties is unknown and ultimate land usage could stem from entirely industrial to a mix of industrial and commercial uses. In conversations with the SIEDC steering committee, the SIEDC sees opportunity in incorporating the industrial sections of Rossville into the Green Zone. Some of the lands are actively being pursued for 1.4 GZ Boundary Justification 4
72 disposition and there is a mix of city owned, State owned and private vacant land that become a focal point for future green zone strategies. Recommendation: Incorporate the industrial waterfront of Rossville bounded by the Kill Van Kull, the West Shore Expressway southbound service road and Arthur Kill Road and Ellis Road into future Green Zone expansion plans. Conclusion Based upon the criteria established, the Green Zone boundary as it currently stands represents an effective green zone boundary. The neighborhood of Travis should be kept in the Green Zone and specially designated as a Non Development Zone. Fresh Kills Park should also be included in the zone and designated as Green Zone Partnership Site. As the SIEDC considers expansion opportunities, the team recommends that the boundary of the Green Zone be extended south of the current designation to incorporate the industrial waterfront parcels of Rossville (see figure map of current and proposed Green Zone boundary). 1.4 GZ Boundary Justification 5

73 1.4 GZ Boundary Justification 6
74 Task 1.5 List of Green Zone Pros and Cons Doing Business in the Staten Island Green Zone Introduction The team is exploring the challenges and benefits of the green zone through interviews with existing businesses, study of best practices, analysis of economic conditions, targeting specific business subgroups based upon knowledge of site and zone conditions. In Task 1.5, the team, in concert with the SIEDC Green Zone steering committee, has developed a preliminary list of pros and cons which will help shape the analysis of the green zone, the determination of target businesses and the development of green redevelopment strategies for the zone. This should be viewed as a living document and a preliminary assembly of positive and negative factors that we will build upon as the study progresses. This pros and cons list will lead into a final determination of challenges and benefits as part of the final strategic plan for the green zone. There are many challenges to doing business on Staten Island, both real and perceived. Often times, these challenges lead companies and employers to locate in other boroughs, elsewhere in the greater New York metropolitan region, elsewhere in the country or even overseas.. As part of the process of identifying industries to locate on Staten Island within the Green Zone, it is important to understand these challenges while at the same time identifying the benefits of the Green Zone s location. Early in the data collection effort, the team conducted an internal brainstorm session to develop a list of pros and cons for the green zone. The pros and cons ranged across a number of topics including physical, economic, market, financial and government process. Sessions were held with both the SIEDC Green Zone steering committee and the SIEDC board of directors to solicit staff and board opinion on the relative pros and cons of the West Shore of Staten Island as a place to do business. All three lists were compiled into a cumulative list of pros and cons which will form the basis for our approach to tasks 3 and 4, the development of the green zone plan and identification of incentives to attract and retain business in the green zone. The following pages list the compiled preliminary list of green zone pros and cons as well as the pros and cons lists developed through dialogue with the steering committee and board of directors. Task 1.5 Benefits and Challenges 1
75 GZ Consulting Services Preliminary Pros and Cons List Pros Large continuous assemblage of industrial space within NYC Isolated from residential uses and residential development pressures Linked to region by significant multi modal transportation assets (water, road, rail) Accessible to Newark Airport, JFK and Port Newark major industrial/freight generators Proximate to central NJ and Western LI industries Proximate to a large population and creative talent Located within NYC suburban environment w/out suburban regulatory structure (home rule) (layering of City and State regulations and complexity of working with multiple city agencies also seen as an impediment see cons) Capable of building off of larger NYC policies that are complementary to goals of SIEDC Able to capitalize on NYC and NYS focus on brownfield revitalization Opportunity for increased development dialogue with NYS DEC on wetland issues Major infrastructure improvement projects being planned and implemented (this may also be a negative as discussion and delay over these regional infrastructure projects could delay or impede local development interest) Industrial legacy of location focus on Maritime Industrial Use Proximate to Fresh Kills Park Cons Tolls on any off island travel seen as a negative both for business practice and for employee recruitment Tax structure New Jersey is perceived as a friendlier place to do business (Higher income tax, higher sales tax, business tax) Road congestion on island and throughout region encumbering logistics movement and discouraging labor market Quality of life perceptions Staten Island is not seen as a preferred place to live or to do business (negative perception and low self esteem are factors to be considered) Poorly marketed amenities Lack of coordination with New York City policy Uncompetitive incentive structure New Jersey has a more comprehensive brownfield law with better incentives and a clearer path to environmental approvals than New York Suburban community within a largely urban city with urban solutions and tools (goals of larger City not in line with goals of community) NJ government is proactive about business outreach and attraction Negative perception of Fresh Kills (this is changing) Task 1.5 Benefits and Challenges 2
76 Observations While this initial brainstorm is not a definitive list, the initial pros and cons paint a very clear picture of the issues faced by businesses on the West Shore of Staten Island and the agencies that are looking to generate development interest. The challenges are significant, but the unique nature of the district provides insights into how the team can focus a strategy for redevelopment that will capitalize upon strengths and approach our redevelopment strategy. The following two lists provide highlights from the conversations conducted with the steering committee and the board of directors. Some of the pros and cons that were synonymous with the internal list were shared by both the steering committee and the board of directors and the following lists highlight some of the emphasis placed by these parties on the pros and cons. Green Zone Steering Committee The following is the list of benefits and challenges identified by the Green Zone Steering Committee on October 19, Pros Location has a good proximity to Central NJ and Western Long Island industrial centers Large sites within New York City boundaries Suburban site without suburban regulations Slightly more consolidated can SIEDC help? Can build off of NYC policies NYC can send ideas/businesses to SI? Cons Not Proactive and engaged business environment like Jersey Everyone chooses NJ Tax structure Lower income/sales tax Pay no matter where you go by truck Employees moving to Staten Island Marketing for SI is poor Amenities exist, but is bad SIEDC Board of Directors The following is the list of benefits and challenges identified by the SIEDC Board of Directors on October 20, Pros Some businesses that supply SI are finding it more cost effective to just locate on SI possible opportunity Cons Overwhelming negative to businesses is the tolls! Disconnect between goals of NYC Government and local government Suppliers on SI tend towards small scale distribution of diverse goods (aka fragrances). It is increasingly difficult for these businesses to recruit companies to come to Staten Island to make pick ups for local and regional delivery. Task 1.5 Benefits and Challenges 3
77 Task 2: Zoning and Boundaries Prepared for: Staten Island Economic Development Corporation Prepared by: Parsons Brinckerhoff CWS Consulting Vita Nuova November 2011
78 Task 2.1: Green Zone Parcel Registry The Green Zone parcel registry is meant to be a living document that will be refined and added to throughout the duration of the project. As a preliminary draft, the following information has been collected for all 1,443 parcels that fall within the boundaries of the proposed Green Zone on Staten Island. The data that is in the preliminary registry is based on extensive land use and geographic data at the tax lot level in ASCII commadelimited format from NYC (PLUTO data). The PLUTO files contain data derived from and maintained by city agencies. Block Lot Community District Census Tract Census Block Address Owner Name* Zoning District Land Use X and Y Coordinates It is important to note that Owner Name does not translate universally to business name. So this document is not meant to be a business name database or listing. Because this is a working document, it will be continually monitored for errors, for example, there may not be an owner associated with a site, or there may not be a valid land use (e.g., a site is labeled as vacant land when really it s an industrial facility/property). As the parcel registry continues to develop, we will supplement the preliminary registry data with data mined from other sources. For example, there may be further sources of site characteristic data (e.g., FAR, building footprint, etc.) as well as sources of economic, sustainability, and environmental related data that can be tied to block and lot information, especially on parcels that are marketable, that may help SIEDC to better understand the Green Zone. Some of this type of data is readily and publicly available, other data will have to be purchased, and some data may be more difficult to source. This list should be reviewed by SIEDC. Site Characteristics Zoning overlay FAR Building footprint Total building (SF) Floors Site dimensions Site size (SF) Current Use Business name (or vacant, undeveloped as applicable) Business owner s name, company, address Employment NAICS code Economic Indicators Assessed value Actively marketing Developability factor Sustainability Indicators ISO Environmental Management Compliance ISO Cradle to cradle producers/manufacturers LEED accredited facility Environmental Indicators Tidal wetland Fresh water wetland Petro spill Chemical bulk storage Petro bulk storage Major oil storage Regulated facility Superfund Petro spill Task 2.1 Green Zone Parcel Registry 1
79 SIEDC Green Zone Consultant Services Property Parcel Registry Living Document (2.1) Task 2.1: Preliminary Green Zone Parcel Registry Updated: November 10, 2011 General Site Information Zoning & Land Use Designations Coordinates Block Lot Community District Census Tract Census Block Street Address Owner Name Zoning Land Use X Y B 300 WILD AVENUE MCSAM STATEN ISLAND, M1 1 Commerical & Office Buildings WAKEFIELD AVENUE ICP REALTY LLC M1 1 Commerical & Office Buildings VICTORY BOULEVARD JOHN J GADOMSKI R3A Commerical & Office Buildings VICTORY BOULEVARD CAROL A BURT R3A Commerical & Office Buildings SOUTH AVENUE NICOTRA 1100 LLC M1 1 Commerical & Office Buildings RICHMOND AVENUE LAR ASSOCIATES C3 Commerical & Office Buildings SOUTH AVENUE SOUTH PORT LLC M1 1 Commerical & Office Buildings VICTORY BOULEVARD ORACLE REALTY LLC R3A Commerical & Office Buildings RICHMOND AVENUE THE PASSARELLI FAMILY R3X Commerical & Office Buildings VICTORY BOULEVARD ANVAN IND LTD M1 1 Commerical & Office Buildings A VICTORY BOULEVARD ANVAN IND LTD M1 1 Commerical & Office Buildings TELEPORT DRIVE TELEPORT 1 M1 1 Commerical & Office Buildings VICTORY BOULEVARD SALVATORE SCIANDRA IR M1 1 Commerical & Office Buildings SOUTH AVENUE M1 1 Commerical & Office Buildings EDWARD CURRY AVENUE ADDWEL LLC M2 1 Commerical & Office Buildings VICTORY BOULEVARD MANNINO, MAX R3A Commerical & Office Buildings TELEPORT DRIVE TELEHOUSE M1 1 Commerical & Office Buildings TELEPORT DRIVE MERRILL LYNCH M1 1 Commerical & Office Buildings WEST SERVICE ROAD VALENCIA DEVELOPERS I M2 1 Commerical & Office Buildings RICHMOND AVENUE STATEN ISLAND PLAZA L C4 1 Commerical & Office Buildings VICTORY BOULEVARD MR ALAN PORITZ R3A Commerical & Office Buildings B 290 WILD AVENUE RISINGSAM STATEN ISLA M1 1 Commerical & Office Buildings VICTORY BOULEVARD 3801 VICTORY BOULEVAR M1 1 Commerical & Office Buildings VICTORY BOULEVARD LETO, SALVATORE R3A Commerical & Office Buildings B 141 EAST SERVICE ROAD SI SHOWPLACE LLC M1 1 Commerical & Office Buildings RICHMOND AVENUE LANGOLD LLC C4 1 Commerical & Office Buildings VICTORY BOULEVARD SALVATORE SCIANDRA IR M1 1 Commerical & Office Buildings B 145 EAST SERVICE ROAD ACADIA WEST SHORE EXP M1 1 Commerical & Office Buildings A 4184 VICTORY BOULEVARD 4174 VICTORY REALTY C R3A Commerical & Office Buildings VICTORY BOULEVARD DAVID M FURST M1 1 Commerical & Office Buildings SOUTH AVENUE GARDENS OFFICE II LLC M1 1 Commerical & Office Buildings A TELEPORT DRIVE MERRILL LYNCH M1 1 Commerical & Office Buildings VICTORY BOULEVARD VICTORY VETERINARY PR M3 1 Commerical & Office Buildings VICTORY BOULEVARD KRIFCA, REJMONDA R3A Commerical & Office Buildings VICTORY BOULEVARD R. AMOS REAL ESTATE M3 1 Commerical & Office Buildings VICTORY BOULEVARD ANVAN IND LTD M1 1 Commerical & Office Buildings SOUTH AVENUE SHORE PLAZA LLC C/O A C4 3 Commerical & Office Buildings SOUTH AVENUE UNISON SITE MANAGEMEN M1 1 Commerical & Office Buildings VICTORY BOULEVARD CORDARO SHIPPING CO., M3 1 Commerical & Office Buildings VICTORY BOULEVARD IMBURGIA ROBERT I R3A Commerical & Office Buildings Green Zone Parcel Registry, Working Version 1 of 33
80 General Site Information SIEDC Green Zone Consultant Services Property Parcel Registry Living Document (2.1) Zoning & Land Use Designations Coordinates Block Lot Community District Census Tract Census Block Street Address Owner Name Zoning Land Use X Y TELEPORT DRIVE TELEPORT 1 M1 1 Commerical & Office Buildings B 310 WILD AVENUE BRISAM STATEN ISLAND, M1 1 Commerical & Office Buildings VICTORY BOULEVARD TOP TOMATOE PLAZA LL M1 1 Commerical & Office Buildings SOUTH AVENUE NICOTRA HOTEL I HOLD M1 1 Commerical & Office Buildings VICTORY BOULEVARD ALESSANDRO C SCARSELL M3 1 Commerical & Office Buildings VICTORY BOULEVARD GARY OLIVIERI M2 1 Commerical & Office Buildings TELEPORT DRIVE TELEPORT 1 M1 1 Commerical & Office Buildings VICTORY BOULEVARD PIK REALTY USA LLC M1 1 Commerical & Office Buildings SOUTH AVENUE NICOTRA LOIS M1 1 Commerical & Office Buildings VICTORY BOULEVARD WEST SHORE INN RESTAU R3A Commerical & Office Buildings B 3812 VICTORY BOULEVARD MANNINO ANN M1 1 Commerical & Office Buildings GULF AVENUE RICHMOND REALTY LLC M2 1 Commerical & Office Buildings A 900 SOUTH AVENUE GS CELL SITE HOLDING M1 1 Commerical & Office Buildings WAKEFIELD AVENUE CATTAIL CORP M1 1 Commerical & Office Buildings ARTHUR KILL ROAD 1281 ARTHUR KILL ROAD M1 1 Commerical & Office Buildings ARTHUR KILL ROAD TOMAR MANAGEMENT, LLC M1 1 Commerical & Office Buildings ARTHUR KILL ROAD ROBERT LOMBARDI M1 1 Commerical & Office Buildings ARTHUR KILL ROAD DIAMOND, DAVID M1 1 Commerical & Office Buildings SOUTH AVENUE VANBRO CORP M3 1 Industrial & Manufacturing RIVER ROAD 380 DEVELOPMENT, LLC M3 1 Industrial & Manufacturing VICTORY BOULEVARD 4384 VICTORY LLC M3 1 Industrial & Manufacturing GULF AVENUE SI SELF STORAGE CORP M2 1 Industrial & Manufacturing VICTORY BOULEVARD AVA LAND DEVELOPMENT M1 1 Industrial & Manufacturing BARON BOULEVARD ROBERT HOKE C/O PAUL M1 1 Industrial & Manufacturing WILD AVENUE R. AMOS REAL ESTATE M3 1 Industrial & Manufacturing WILD AVENUE HL LAND CORP M3 1 Industrial & Manufacturing VICTORY BOULEVARD TANJ PROPERTIES LLC C M1 1 Industrial & Manufacturing WILD AVENUE R. AMOS REAL ESTATE M3 1 Industrial & Manufacturing VICTORY BOULEVARD ABBRUZZESE DONNA M M1 1 Industrial & Manufacturing WILD AVENUE HL LAND CORP M3 1 Industrial & Manufacturing MEREDITH AVENUE J&A BRUNO LLC M3 1 Industrial & Manufacturing WILD AVENUE HL LAND CORP M3 1 Industrial & Manufacturing MEREDITH AVENUE J A BRUNO LLC M3 1 Industrial & Manufacturing SOUTH AVENUE VANBRO CORPORATON M3 1 Industrial & Manufacturing WILD AVENUE VICTORY AND WILD LLC M3 1 Industrial & Manufacturing VICTORY BOULEVARD AVA LAND DEVELOPMENT M1 1 Industrial & Manufacturing GULF AVENUE SUZANNE SHAUGHNESSY M2 1 Industrial & Manufacturing WILD AVENUE HL LAND CORP M3 1 Industrial & Manufacturing VICTORY BOULEVARD ALESSANDRO C SCARSELL M3 1 Industrial & Manufacturing ng Fac SPENCER STREET ANASTASIOS GLIKIS M3 1 Industrial & Manufacturing GOETHALS ROAD NORTH SIGN UP USA LL M3 1 Industrial & Manufacturing CHELSEA ROAD JOYCE CISLUYEIS M3 1 Industrial & Manufacturing TRAVIS AVENUE U P S INC M1 1 Industrial & Manufacturing VICTORY BOULEVARD 3525 VICTORY REALTY L M1 1 Industrial & Manufacturing Green Zone Parcel Registry, Working Version 2 of 33
81 General Site Information SIEDC Green Zone Consultant Services Property Parcel Registry Living Document (2.1) Zoning & Land Use Designations Coordinates Block Lot Community District Census Tract Census Block Street Address Owner Name Zoning Land Use X Y WILD AVENUE HL LAND CORP M3 1 Industrial & Manufacturing WILD AVENUE HL LAND CORP M3 1 Industrial & Manufacturing CHELSEA ROAD SOUTH SHORE ENTERPRIS M3 1 Industrial & Manufacturing INDUSTRY ROAD 501 INDUSTRY ROAD LLC M2 1 Industrial & Manufacturing WAKEFIELD AVENUE CAT TAIL CORP M1 1 Industrial & Manufacturing VICTORY BOULEVARD BLOCK 2172 PROPERTY C M1 1 Industrial & Manufacturing TRAVIS AVENUE VICTORY AND TRAVIS, L M1 1 Industrial & Manufacturing SPENCER STREET MARY A VENOSA M3 1 Industrial & Manufacturing VICTORY BOULEVARD THE CITY OF NEW YORK M3 1 Industrial & Manufacturing GULF AVENUE SUZANNE SHAUGHNESSY M2 1 Industrial & Manufacturing WILD AVENUE HL LAND CORP M3 1 Industrial & Manufacturing CHELSEA ROAD CHELSEA SOUTH ASSOCIA M2 1 Industrial & Manufacturing BLOOMFIELD AVENUE SOUTH SHORE ENTERPRIS M3 1 Industrial & Manufacturing GULF AVENUE SAPERSTEIN ENTERPRISE M2 1 Industrial & Manufacturing WILD AVENUE HL LAND CORP M3 1 Industrial & Manufacturing WILD AVENUE 493 WILD AVENUE LLC M2 1 Industrial & Manufacturing LATIMER AVENUE JEFFREY SANTORA M1 1 Industrial & Manufacturing WILD AVENUE R. AMOS REAL ESTATE M3 1 Industrial & Manufacturing WILD AVENUE R. AMOS REAL ESTATE M3 1 Industrial & Manufacturing VICTORY BOULEVARD BLOCK 2172 PROPERTY C M1 1 Industrial & Manufacturing VICTORY BOULEVARD 4384 VICTORY LLC M3 1 Industrial & Manufacturing WILD AVENUE HL LAND CORP M3 1 Industrial & Manufacturing SHENANDOAH AVENUE 16 SHENANDOAH AVENUE, M1 1 Industrial & Manufacturing A ARDEN AVENUE ESS PRISA II LLC M1 1 Industrial & Manufacturing GULF AVENUE F LIQUORI M2 1 Industrial & Manufacturing VICTORY BOULEVARD RAYMOND J BRUNO M3 1 Industrial & Manufacturing ARTHUR KILL ROAD MARCIANO WHOLESALE CA M1 1 Industrial & Manufacturing LATIMER AVENUE FRANCES M HOKE M1 1 Industrial & Manufacturing VICTORY BOULEVARD 4038 VICTORY REALTY I R3A Mixed Residential & Commerical Buildings B 3860 VICTORY BOULEVARD MOSTAFAVI, RAMIN R3A Mixed Residential & Commerical Buildings WILD AVENUE G & S ASSOCIATES OF S M3 1 Mixed Residential & Commerical Buildings VICTORY BOULEVARD EDWARD ZDANOWICZ JR M2 1 Mixed Residential & Commerical Buildings VICTORY BOULEVARD VICTORY & TRAVIS LLC M1 1 Mixed Residential & Commerical Buildings VICTORY BOULEVARD ANNE T. DIBENEDETTO R3A Mixed Residential & Commerical Buildings VICTORY BOULEVARD FRANCESCO COLUCCIO R3A Mixed Residential & Commerical Buildings WILD AVENUE PETER GIOELLO M3 1 Mixed Residential & Commerical Buildings B 3956 VICTORY BOULEVARD MONITELLO, DOREEN R3A Mixed Residential & Commerical Buildings B 185A BURKE AVENUE MARINO, HANNA R3A Mixed Residential & Commerical Buildings VICTORY BOULEVARD DIECI, LLC M3 1 Mixed Residential & Commerical Buildings VICTORY BOULEVARD JOSEPH TOLAS R3A Mixed Residential & Commerical Buildings LEROY STREET MONITELLO, DOREEN R3A Mixed Residential & Commerical Buildings VICTORY BOULEVARD WEINTRAUB DORIS M2 1 Mixed Residential & Commerical Buildings VICTORY BOULEVARD ASR REALTY HOLDING CO M2 1 Mixed Residential & Commerical Buildings VICTORY BOULEVARD FRANCESCO COLUCCIO R3A Mixed Residential & Commerical Buildings Green Zone Parcel Registry, Working Version 3 of 33
82 General Site Information SIEDC Green Zone Consultant Services Property Parcel Registry Living Document (2.1) Zoning & Land Use Designations Coordinates Block Lot Community District Census Tract Census Block Street Address Owner Name Zoning Land Use X Y B 1815 ARTHUR KILL ROAD GALLO UMBERTO R3 2 Mixed Residential & Commerical Buildings WILD AVENUE 463 WILD AVE, INC M3 1 Mixed Residential & Commerical Buildings SHELLEY AVENUE JOHN J GADOMSKI R3A Multi Family Walk up Buildings B 3954 VICTORY BOULEVARD MONITELLO, PATRICK R3A Multi Family Walk up Buildings ALBERTA AVENUE JOSEPH D. ANDRUZZI R3A Multi Family Walk up Buildings MILDRED AVENUE MONITELLO, PATRICK R3A Multi Family Walk up Buildings MILDRED AVENUE LOPEZ, LEOBARDO R3A Multi Family Walk up Buildings VICTORY BOULEVARD R3 2 Multi Family Walk up Buildings A SIGNS ROAD R3 2 Multi Family Walk up Buildings MELVIN AVENUE NICHOLAS BLANCHARD R3A One & Two Family Buildings B 102 CHURCH AVENUE BLAKE SAMANTHA R3A One & Two Family Buildings B 19 SIMMONS LOOP TANG, CHI KEUNG R3A One & Two Family Buildings PARISH AVENUE BORTUNA, SALVATORE R3A One & Two Family Buildings WATSON AVENUE CARL MARTELLO R3 2 One & Two Family Buildings PEARSON STREET OSORIO, FRANK R3 2 One & Two Family Buildings PEARSON STREET ALAMEDA REHUEL R3A One & Two Family Buildings BURKE AVENUE JOANN VESCI R3A One & Two Family Buildings WILD AVENUE KEITH BECKMANN R3A One & Two Family Buildings B 27 BERESFORD AVENUE EMELIA VELEZ R3 2 One & Two Family Buildings WATSON AVENUE BEHDAQUI HAMID R3 2 One & Two Family Buildings CANNON AVENUE K BRAHN R3A One & Two Family Buildings ALBERTA AVENUE JOHN P FERRACO SR R3A One & Two Family Buildings SHELLEY AVENUE RICHARD A. WARNER R3A One & Two Family Buildings B 186 BURKE AVENUE MARCANTONIO JAMES R3A One & Two Family Buildings MILDRED AVENUE STRAUB, CHRISTOPHER R3A One & Two Family Buildings GRAHAM AVENUE VITO CATALDO R3X One & Two Family Buildings B 77 SIMMONS LANE GRIESIENE, DANGUOLE R3A One & Two Family Buildings BURKE AVENUE SORRENTINO, JOSEPH R3A One & Two Family Buildings B 39 BERESFORD AVENUE SHENINGER, ERIC R3 2 One & Two Family Buildings B 252 MELVIN AVENUE MAHMOUD, AHMED G R3A One & Two Family Buildings MELVIN AVENUE JOHN MAZZOLA R3A One & Two Family Buildings FELTON STREET ALEXANDER LEYFERMAN R3 2 One & Two Family Buildings PEARSON STREET DIMIAN, MICHEL R3 2 One & Two Family Buildings CANNON AVENUE GIORGIANNI, MARY I R3A One & Two Family Buildings MEREDITH AVENUE HELEN DECKER M3 1 One & Two Family Buildings B 196 WILD AVENUE ANTONIO AMATO R3A One & Two Family Buildings WILD AVENUE 13 WILD AVENUE PROPER R3A One & Two Family Buildings B 125 ALBERTA AVENUE PITONZA, FRANK J R3 2 One & Two Family Buildings A 46 ALBERTA AVENUE JOHN PLESZEWICZ R3A One & Two Family Buildings LATIMER AVENUE RICHARD M. AUGULIS M1 1 One & Two Family Buildings B 117 ALBERTA AVENUE JOHN PURPURA R3 2 One & Two Family Buildings ROSWELL AVENUE LORI FELITTI R3A One & Two Family Buildings PARISH AVENUE PAUL SALADIS R3 2 One & Two Family Buildings PARISH AVENUE DOBBYN, VERONICA A R3A One & Two Family Buildings Green Zone Parcel Registry, Working Version 4 of 33
83 General Site Information SIEDC Green Zone Consultant Services Property Parcel Registry Living Document (2.1) Zoning & Land Use Designations Coordinates Block Lot Community District Census Tract Census Block Street Address Owner Name Zoning Land Use X Y VICTORY BOULEVARD EDWARD MATUSIAK M1 1 One & Two Family Buildings LATIMER AVENUE MARK KRAWCZYK M1 1 One & Two Family Buildings B 48 WATSON AVENUE DEIRDRE E. MALONE R3A One & Two Family Buildings ng Fac VICTORY BOULEVARD DITTA BEVERLY J R3A One & Two Family Buildings B 118 ROSWELL AVENUE MALANDRO, FRANK L III R3 2 One & Two Family Buildings ROSWELL AVENUE GABRIELE SIKORJAK R3A One & Two Family Buildings WILD AVENUE WHALEN, SCOTT R3A One & Two Family Buildings B 51 SIMMONS LANE ERNEST CAMERLINGO REV R3A One & Two Family Buildings B 25 BERESFORD AVENUE HADLEY, DAWN R3 2 One & Two Family Buildings B 25 SIMMONS LOOP RAYMOND ORTIZ R3A One & Two Family Buildings GRAHAM AVENUE BOVE, VINCENZO R3X One & Two Family Buildings B 69 SIMMONS LOOP TAMMY LANGER R3A One & Two Family Buildings B 23 SIMMONS LOOP HANDOG MANUEL R3A One & Two Family Buildings B 132 ALBERTA AVENUE MARRO, ELIZABETH R3 2 One & Two Family Buildings CANNON AVENUE ALEX A MALDONADO R3 2 One & Two Family Buildings B 115 ALBERTA AVENUE RASPANTI, MELISSA A R3 2 One & Two Family Buildings ROSWELL AVENUE SALVATORE RANDAZZO R3A One & Two Family Buildings WATSON AVENUE BERNARDO FONTANA R3 2 One & Two Family Buildings B 242 MELVIN AVENUE MICHAEL BONANNO R3A One & Two Family Buildings A 40 ALBERTA AVENUE MIRIAM GOMEZ VEGNILLA R3A One & Two Family Buildings MELVIN AVENUE BOCOBO, PRISCILLA R3A One & Two Family Buildings B 200 WILD AVENUE EGBERT, KENNETH R3A One & Two Family Buildings B 59 SIMMONS LANE WALLACE P KAMPER R3A One & Two Family Buildings B 88 CHURCH AVENUE BORAZZO, PHILIP R3A One & Two Family Buildings B 34 SIMMONS LANE MICHAEL SCOTTI R3A One & Two Family Buildings B 25 CHURCH AVENUE JAMES CUNNINGHAM R3A One & Two Family Buildings VICTORY BOULEVARD HELEN MARTIN M2 1 One & Two Family Buildings MEREDITH AVENUE BARRETT JOHN R3A One & Two Family Buildings CASWELL LANE RODRIGUEZ, ADA L R3 2 One & Two Family Buildings B 36 TEMPLE COURT TARANTINO, MARGARET R3A One & Two Family Buildings B 28 CHURCH AVENUE ACT PROPERTIES,LLC R3A One & Two Family Buildings GAULDY AVENUE DALGIN, PHILLIP R3 2 One & Two Family Buildings BURKE AVENUE ISOLA, MARLENE J R3A One & Two Family Buildings B 3922 VICTORY BOULEVARD JAMES W SMITH R3A One & Two Family Buildings B 137 ALBERTA AVENUE EDWARD BOWEN R3 2 One & Two Family Buildings A 16 ALBERTA AVENUE KURT TRACH R3A One & Two Family Buildings LATIMER AVENUE FRANCIS MANZELLA M1 1 One & Two Family Buildings B 186 WILD AVENUE MINARDI CORRADO R3A One & Two Family Buildings B 44 FAHY AVENUE R3 2 One & Two Family Buildings B 3900 VICTORY BOULEVARD ROBERT S ONTEK R3A One & Two Family Buildings SIMMONS LANE THOMAS ANDERSON R3A One & Two Family Buildings B 14 AYE COURT JOHN & DONNA FORTUNE R3 2 One & Two Family Buildings B 131 RIDGEWAY AVENUE GERITANO, ANGELA R3 2 One & Two Family Buildings B 39 SIMMONS LOOP LEMBERG, IRA R3A One & Two Family Buildings Green Zone Parcel Registry, Working Version 5 of 33
84 General Site Information SIEDC Green Zone Consultant Services Property Parcel Registry Living Document (2.1) Zoning & Land Use Designations Coordinates Block Lot Community District Census Tract Census Block Street Address Owner Name Zoning Land Use X Y ROSWELL AVENUE EDWARD PILIS R3A One & Two Family Buildings GLEN STREET JOSEPH P MODZELEWSKI R3A One & Two Family Buildings CANNON AVENUE GIOVENCO JOHN & VICTO R3A One & Two Family Buildings B 11 TEMPLE COURT SALLY ANN BARBATEI R3A One & Two Family Buildings BURKE AVENUE CORDERO, JOSEPH A R3A One & Two Family Buildings B 45 CHURCH AVENUE SOLOMON SHEILA D R3A One & Two Family Buildings CANNON AVENUE EUGENE GUERRA R3 2 One & Two Family Buildings MILDRED AVENUE N NELSON R3A One & Two Family Buildings B 101 RICHE AVENUE DORIS TOLAS YELLEN R3A One & Two Family Buildings B 15 SIMMONS LANE GOLDBERG, RANDI R3 2 One & Two Family Buildings CANNON AVENUE JUNE GAMBUZZA AS TRUS R3 2 One & Two Family Buildings B 18 SIMMONS LANE DELUCA, DEBBY R3A One & Two Family Buildings EGRIT COURT BAVA, ROBERT H R3A One & Two Family Buildings B 47 SIMMONS LOOP SMITH, YENIVA DAMARIS R3A One & Two Family Buildings WILD AVENUE REGAN, ALLISON R3A One & Two Family Buildings WILD AVENUE PHILIP SICILIANO M3 1 One & Two Family Buildings CANNON AVENUE WILLIAM GRIFFIN R3 2 One & Two Family Buildings PEARSON STREET SULLIVAN, MAUREEN R3 2 One & Two Family Buildings B 3906 VICTORY BOULEVARD OSKIN, ALEKSANDER R3 2 One & Two Family Buildings A 24 ALBERTA AVENUE AGANES SMARSCH R3A One & Two Family Buildings A 22 CALVANICO LANE BUCUR, GABRIEL R3 2 One & Two Family Buildings B 59 RIDGEWAY AVENUE GIOIA, MARIA R3 2 One & Two Family Buildings MELVIN AVENUE PAUL & MARGARET SHOVA R3A One & Two Family Buildings B 65 BERESFORD AVENUE LUMAPAT, MICHAEL R3 2 One & Two Family Buildings B 10 AYE COURT RHODEN, RANDALL R3 2 One & Two Family Buildings SHELLEY AVENUE J WOLENSKI R3A One & Two Family Buildings B 3902 VICTORY BOULEVARD ANTHONY MARIOCC R3A One & Two Family Buildings CANNON AVENUE DURANTAS, KUBILAY R3A One & Two Family Buildings B 87 SIMMONS LANE Ashraf Mondal R3A One & Two Family Buildings LEIGH AVENUE KRUSHELNITSKIY, IGOR R3 2 One & Two Family Buildings WILD AVENUE EDWARD MORENO R3A One & Two Family Buildings B 30 WATSON AVENUE P QUICK R3A One & Two Family Buildings B 134 ALBERTA AVENUE EDILLON, CHRISTINE S R3 2 One & Two Family Buildings B 30 SIMMONS LANE JAMES BRIDESON R3A One & Two Family Buildings B 134 RICHE AVENUE BRIAN CORSON R3A One & Two Family Buildings SHELLEY AVENUE ANN MARIE TELLEFSEN R3A One & Two Family Buildings B 16 TEMPLE COURT CAGGIANO ROSEANN R3A One & Two Family Buildings B 69 TOWERS LANE KHALID SHEIKH MOHAMMA R3A One & Two Family Buildings GLEN STREET J FERRITO R3A One & Two Family Buildings GLEN STREET KOUROUI, LARISSA R3 2 One & Two Family Buildings B 140 RICHE AVENUE MAE R RUDICK R3A One & Two Family Buildings B 20 PEARSON STREET CRUCIATA, MARIA R3A One & Two Family Buildings B 79 CHURCH AVENUE WERNER, MICHAEL J R3A One & Two Family Buildings ROSWELL AVENUE ROBERT CHARLES OLSEN, R3A One & Two Family Buildings Green Zone Parcel Registry, Working Version 6 of 33
85 General Site Information SIEDC Green Zone Consultant Services Property Parcel Registry Living Document (2.1) Zoning & Land Use Designations Coordinates Block Lot Community District Census Tract Census Block Street Address Owner Name Zoning Land Use X Y B 18 AYE COURT ISAAC KEROUB R3 2 One & Two Family Buildings PARISH AVENUE SOLOMON, LANCE R3A One & Two Family Buildings CANNON AVENUE DALTON, JOHN R3A One & Two Family Buildings B 62 FAHY AVENUE NICHOLAS SIRAGUSA, JR R3 2 One & Two Family Buildings B 135 GAULDY AVENUE ZAPPULLA JOSEPH R3 2 One & Two Family Buildings MEREDITH AVENUE METZGER MARIA R3A One & Two Family Buildings CANNON AVENUE MERCADO, GAYLORD M R3A One & Two Family Buildings MILDRED AVENUE ALBERT, MICHAELENE R3A One & Two Family Buildings FELDMEYERS LANE THE REGINA A EDKINS I M2 1 One & Two Family Buildings B 3942 VICTORY BOULEVARD JOHN WALKIE R3A One & Two Family Buildings SHELLEY AVENUE R DANTONI R3A One & Two Family Buildings B 4004 VICTORY BOULEVARD PETER H ADINOLFI R3A One & Two Family Buildings PARISH AVENUE PETE PALLADINO R3 2 One & Two Family Buildings ALBERTA AVENUE O'NEIL, WARREN R3A One & Two Family Buildings B 28 AYE COURT YUET MING POON R3 2 One & Two Family Buildings GRAHAM AVENUE JAIME A. DIAB R3X One & Two Family Buildings B 61 RIDGEWAY AVENUE NEVILLE S CHIN R3 2 One & Two Family Buildings B 19 FELTON STREET RALPH MALPICA R3 2 One & Two Family Buildings B 34 TEMPLE COURT ORJI, IJEOMA R3A One & Two Family Buildings CANNON AVENUE R3A One & Two Family Buildings B 129 ALBERTA AVENUE CIVILETTI PIETRO R3 2 One & Two Family Buildings B 8 TEMPLE COURT LYNN, DIANE R3A One & Two Family Buildings B 27 SIMMONS LANE MONCAYO, DIANA R3 2 One & Two Family Buildings B 67 BERESFORD AVENUE QURESHI, MUHAMMAD R3 2 One & Two Family Buildings MELVIN AVENUE ALBERT LAWLESS R3A One & Two Family Buildings A 60 ALBERTA AVENUE JOHN CINCOTTA R3A One & Two Family Buildings B 3892 VICTORY BOULEVARD PETER WOLNY R3A One & Two Family Buildings LATIMER AVENUE BLACK TREVOR M1 1 One & Two Family Buildings ROSWELL AVENUE JOSEPH REHAK R3A One & Two Family Buildings B 121 BURKE AVENUE ANTHONY R CONTI R3A One & Two Family Buildings PRICES LANE MARY A LOCH R3 2 One & Two Family Buildings PRICES LANE JOHN O'SULLIVAN R3 2 One & Two Family Buildings CANNON AVENUE EDKINS, REGINA R3A One & Two Family Buildings CANNON AVENUE AKINTOYE, LUKMAN R3A One & Two Family Buildings PARISH AVENUE FRANCIS H CHING R3 2 One & Two Family Buildings PRICES LANE PERCIA CHARLES R3 2 One & Two Family Buildings VICTORY BOULEVARD FRANK VOCCIO R3A One & Two Family Buildings MILDRED AVENUE THOMAS WALTERS R3A One & Two Family Buildings B 55 SIMMONS LOOP GINA M ANNUNZIATA R3A One & Two Family Buildings B 140 ALBERTA AVENUE SALAZAR, MARK R3 2 One & Two Family Buildings PRICES LANE VICTORIA A TUITE R3A One & Two Family Buildings A 48 CALVANICO LANE MEADOWVIEW I LLC R3 2 One & Two Family Buildings ALBERTA AVENUE DESMOND VAN PELT R3A One & Two Family Buildings ALBERTA AVENUE JOHN F & DOROTHY M KE R3A One & Two Family Buildings Green Zone Parcel Registry, Working Version 7 of 33
86 General Site Information SIEDC Green Zone Consultant Services Property Parcel Registry Living Document (2.1) Zoning & Land Use Designations Coordinates Block Lot Community District Census Tract Census Block Street Address Owner Name Zoning Land Use X Y LATIMER AVENUE Robert Bellach M1 1 One & Two Family Buildings BURKE AVENUE LORRAINE HICKS R3A One & Two Family Buildings VICTORY BOULEVARD GIUSEPPE SCHIRRIPA M3 1 One & Two Family Buildings GLEN STREET JOSEPH B PROSUH JR R3A One & Two Family Buildings B 11 CHURCH AVENUE GUINAN, PATRICIA R3A One & Two Family Buildings LEIGH AVENUE CAROL D FONTANA R3 2 One & Two Family Buildings B 131 ALBERTA AVENUE CUCIANO GRAFFAGNINO R3 2 One & Two Family Buildings MILDRED AVENUE BERNARD H NOLAN R3A One & Two Family Buildings WATSON AVENUE LEAVER, KATHLEEN R3 2 One & Two Family Buildings MEREDITH AVENUE ALICE VAN PELT R3A One & Two Family Buildings SHELLEY AVENUE MANISCALCO, ANTHONY, R3A One & Two Family Buildings B 3896 VICTORY BOULEVARD JOHN A MURPHY R3A One & Two Family Buildings B 22 AYE COURT TOM PING C CHAN R3 2 One & Two Family Buildings TRAVIS AVENUE SCARSO, CHRISTINE R3 1 One & Two Family Buildings ALBERTA AVENUE HERMAN LINDA R3A One & Two Family Buildings ROSWELL AVENUE REYNOLDS, PAUL R3A One & Two Family Buildings A 62 ALBERTA AVENUE LAI YUNG LEE R3A One & Two Family Buildings GRAHAM AVENUE GREGORY J. MONTESANTO R3X One & Two Family Buildings B 126 ALBERTA AVENUE D'ASSISI, JENNIFER R3 2 One & Two Family Buildings GRAHAM AVENUE GIAM BATTISTA R3X One & Two Family Buildings FELTON STREET TAYLOR, ALLISON R3 2 One & Two Family Buildings B 55 SIMMONS LANE UNGER GAYLE R3A One & Two Family Buildings B 40 SIMMONS LANE ALAJ, HALIL R3A One & Two Family Buildings ALBERTA AVENUE CLAIRE RICETTI R3A One & Two Family Buildings B 133 GAULDY AVENUE MATIAS, VERONICA R3 2 One & Two Family Buildings MELVIN AVENUE NICHAS, DIANNE R3A One & Two Family Buildings MEREDITH AVENUE STASI, JOSEPH R3A One & Two Family Buildings B 98 CHURCH AVENUE DUMAS, MICHELLE R3A One & Two Family Buildings CASWELL LANE ABUHASHISH, IHSAN R3 2 One & Two Family Buildings BURKE AVENUE RONALD FAVER R3A One & Two Family Buildings MELVIN AVENUE SANCHEZ, EDWARD R3A One & Two Family Buildings FELTON STREET KAREN CHIGHINE R3 2 One & Two Family Buildings MELVIN AVENUE MICHAEL E HEINZ R3A One & Two Family Buildings A 32 CALVANICO LANE VILLAFANE, CHRISTY R3 2 One & Two Family Buildings MELVIN AVENUE FARELLA, PAUL R3A One & Two Family Buildings VICTORY BOULEVARD V KOSTICK R3A One & Two Family Buildings B 51 BERESFORD AVENUE GINA R. CAMBRIA R3 2 One & Two Family Buildings B 95 SIMMONS LANE PLATT, SUE ANN R3A One & Two Family Buildings CANNON AVENUE MCMANUS TYRONE R3A One & Two Family Buildings WILD AVENUE OSLANDO, JOSEPH R3A One & Two Family Buildings PARISH AVENUE WILLIAM H. OTTO R3 2 One & Two Family Buildings CANNON AVENUE ROBERT CURRY R3A One & Two Family Buildings B 151 ALBERTA AVENUE SERRANO, JOSE E R3 2 One & Two Family Buildings LATIMER AVENUE SANTORA FRANCIS J M1 1 One & Two Family Buildings Green Zone Parcel Registry, Working Version 8 of 33
87 General Site Information SIEDC Green Zone Consultant Services Property Parcel Registry Living Document (2.1) Zoning & Land Use Designations Coordinates Block Lot Community District Census Tract Census Block Street Address Owner Name Zoning Land Use X Y B 100 CHURCH AVENUE MALLON, DOROTHY R3A One & Two Family Buildings MELVIN AVENUE PIPITONE, PAUL R3A One & Two Family Buildings B 7 TEMPLE COURT HSUEH, FRANKLIN C R3A One & Two Family Buildings MEREDITH AVENUE J&A BRUNO LLC M3 1 One & Two Family Buildings PARISH AVENUE BARBARA A ABDAILE R3 2 One & Two Family Buildings B 77 CHURCH AVENUE WRIGHT, JOANNE M R3A One & Two Family Buildings BURKE AVENUE ROSENBERG, STEPHEN R3A One & Two Family Buildings PRICES LANE MAHER MICHAIL R3 2 One & Two Family Buildings CANNON AVENUE PETER RAZZANO R3 2 One & Two Family Buildings A 40 CALVANICO LANE QUILES, ROBERT R3 2 One & Two Family Buildings B 5 TOWERS LANE CHIN ANA S R3A One & Two Family Buildings B 49 CHURCH AVENUE MICHAEL J RAGONESE R3A One & Two Family Buildings PEARSON STREET LOUIE A CARRION R3 2 One & Two Family Buildings B 115 BURKE AVENUE DOMINICK TRIPODI R3A One & Two Family Buildings B 48 FAHY AVENUE THOMAS BARBARIA R3 2 One & Two Family Buildings PARISH AVENUE SIEBOLD JOAN R3 2 One & Two Family Buildings TRAVIS AVENUE CONTI DOMINICK R3 1 One & Two Family Buildings B 141 ALBERTA AVENUE JOHN MORSE R3 2 One & Two Family Buildings DRAPER PLACE BIAGIO NAPOLITANO R3 1 One & Two Family Buildings LEIGH AVENUE MISCIAGNA, HOLLY R3 2 One & Two Family Buildings B 15 RAWSON PLACE PEDRO TORRES R3A One & Two Family Buildings B 4002 VICTORY BOULEVARD IBRAHIM, MOHAMED R3A One & Two Family Buildings BURKE AVENUE SZYMANSKI, KRTYSZTOF R3A One & Two Family Buildings MILDRED AVENUE VINCENT POSNIAK R3A One & Two Family Buildings B 152 ALBERTA AVENUE CORALLO, ANTONIO R3 2 One & Two Family Buildings ROSWELL AVENUE Charles Saladis R3A One & Two Family Buildings WILD AVENUE KEVIN MADDEN R3A One & Two Family Buildings BURKE AVENUE IVAN TURNER R3A One & Two Family Buildings B 232 MELVIN AVENUE KOGAN, EUGENE R3A One & Two Family Buildings LATIMER AVENUE SANTANA PEDRO F M1 1 One & Two Family Buildings B 17 SIMMONS LANE KOTLOVSKAYA, LYUBOV R3 2 One & Two Family Buildings B 266 MELVIN AVENUE WALTER, DELGRASSO R3A One & Two Family Buildings PARISH AVENUE PATRICK MALARKEY R3 2 One & Two Family Buildings B 224 WILD AVENUE CAROLEO, BLAISE R3 2 One & Two Family Buildings VICTORY BOULEVARD DENNIS O'ROURKE M1 1 One & Two Family Buildings B 33 SIMMONS LOOP MICHAEL FIORENTINO R3A One & Two Family Buildings B 35 BERESFORD AVENUE DEUTSCHE BANK NANTION R3 2 One & Two Family Buildings WILD AVENUE LAURIE GIOVANSANTI, A R3A One & Two Family Buildings BURKE AVENUE KRAVITZ, JON F R3A One & Two Family Buildings SIMMONS LOOP ANDREA CITTADINI R3A One & Two Family Buildings TRAVIS AVENUE F BARNARD JR M1 1 One & Two Family Buildings MILDRED AVENUE CRAIG HARTY R3A One & Two Family Buildings B 19 CHURCH AVENUE WILLIAM J CASTELLO R3A One & Two Family Buildings FELTON STREET WILLIAM L CREECH R3 2 One & Two Family Buildings Green Zone Parcel Registry, Working Version 9 of 33
88 General Site Information SIEDC Green Zone Consultant Services Property Parcel Registry Living Document (2.1) Zoning & Land Use Designations Coordinates Block Lot Community District Census Tract Census Block Street Address Owner Name Zoning Land Use X Y WILD AVENUE C SCEPKOWSKI R3A One & Two Family Buildings BURKE AVENUE MIRANDA, ALEXANDRA R3A One & Two Family Buildings CANNON AVENUE MARTINO IRAIDA R3A One & Two Family Buildings B 3880 VICTORY BOULEVARD LUCARINI, LEONELLO R3A One & Two Family Buildings B 65 SIMMONS LANE DUBINSKY JAN R3A One & Two Family Buildings SIMMONS LOOP WANDA TORRES R3A One & Two Family Buildings B 71 SIMMONS LOOP BERTONE JOSEPH R3A One & Two Family Buildings MILDRED AVENUE ANNAND SEETAHAL R3A One & Two Family Buildings ng Fac VICTORY BOULEVARD KHINOY, BARBARA R3A One & Two Family Buildings B 128 ALBERTA AVENUE SELVAGGIO, ROCCO R3 2 One & Two Family Buildings B 83 CHURCH AVENUE JOHN J GAMBARDELLA R3A One & Two Family Buildings B 99 CHURCH AVENUE JOSE ROSSELL R3A One & Two Family Buildings B 125 RIDGEWAY AVENUE MOGA HOLDINGS LLC R3 2 One & Two Family Buildings VICTORY BOULEVARD MASSIMILIANO MANNINO R3A One & Two Family Buildings BURKE AVENUE LUIS N ESCOBOSA R3A One & Two Family Buildings LEROY STREET R MODZELEWSKI R3A One & Two Family Buildings B 31 SIMMONS LOOP PAUL BRABHAM R3A One & Two Family Buildings LAMBERTS LANE MAHROUS SHEHATA R3 2 One & Two Family Buildings B 67 SIMMONS LOOP ROSEMARIE MANDART R3A One & Two Family Buildings B 145 ALBERTA AVENUE JOSEPH DI BELLA R3 2 One & Two Family Buildings B 272 MELVIN AVENUE BLACK KERI R3A One & Two Family Buildings A 12 CALVANICO LANE BUNJAKU, LORENTINA R3 2 One & Two Family Buildings VICTORY BOULEVARD C BRAY R3A One & Two Family Buildings B 45 TOWERS LANE TRIVELLONI, REGINA R3A One & Two Family Buildings B 15 FELTON STREET DI MARE, VINCENT R3 2 One & Two Family Buildings SIMMONS LOOP JULIO FERREIRA R3A One & Two Family Buildings WILD AVENUE Marie Fumando R3A One & Two Family Buildings B 80 TOWERS LANE FIUMEFREDA, JOHN R3A One & Two Family Buildings GAULDY AVENUE CARNESI, ANTHONY R3 2 One & Two Family Buildings PRICES LANE GIACOBONE, EILEEN R3 2 One & Two Family Buildings B 25 SIMMONS LANE KOSTANTYNOVA, TETYANA R3A One & Two Family Buildings PRICES LANE ROSALIE SICONOLFI R3 2 One & Two Family Buildings A 36 ALBERTA AVENUE KATHLEEN KING COLLURA R3A One & Two Family Buildings B 16 AYE COURT MAURICE MUINGA R3 2 One & Two Family Buildings TRAVIS AVENUE F OTTOMANELLI R3 1 One & Two Family Buildings CANNON AVENUE DEVAYNES JOHN R3A One & Two Family Buildings MILDRED AVENUE KEVIN KWAN R3A One & Two Family Buildings B 170 BURKE AVENUE JUNE P HOPE R3A One & Two Family Buildings VICTORY BOULEVARD MURAWSKI DOLORES M1 1 One & Two Family Buildings LAMBERTS LANE JOHN PACELLI R3 2 One & Two Family Buildings GAULDY AVENUE JAN HARUM R3 2 One & Two Family Buildings B 116 ALBERTA AVENUE TORRES, AIDA R3 2 One & Two Family Buildings CANNON AVENUE HOWLEY, NICHOLAS R3A One & Two Family Buildings B 136 ROSWELL AVENUE RICARDO JOHN R3 2 One & Two Family Buildings Green Zone Parcel Registry, Working Version 10 of 33
89 General Site Information SIEDC Green Zone Consultant Services Property Parcel Registry Living Document (2.1) Zoning & Land Use Designations Coordinates Block Lot Community District Census Tract Census Block Street Address Owner Name Zoning Land Use X Y CANNON AVENUE CAPOBIANCO, JODI ANN R3A One & Two Family Buildings B 9 TEMPLE COURT THAMPAN, RUBY R3A One & Two Family Buildings B 228 MELVIN AVENUE CONCORD PROPERTIES RO R3A One & Two Family Buildings B 157 ALBERTA AVENUE ARLENE MELE R3 2 One & Two Family Buildings B 68 TOWERS LANE CARMELITA DE JESUS R3A One & Two Family Buildings WATSON AVENUE CHARLES MARTINEZ R3 2 One & Two Family Buildings B 123 GAULDY AVENUE ASHENFARB AMY L R3 2 One & Two Family Buildings BURKE AVENUE OBRIEN MARY ANN R3A One & Two Family Buildings ROSWELL AVENUE ROBERT RICHARD NIEMIS R3A One & Two Family Buildings MELVIN AVENUE ROCKY ANNUNZIATO R3A One & Two Family Buildings B 36 SIMMONS LANE IDA LANDERS R3A One & Two Family Buildings WATSON AVENUE JAMES A. WHITE R3 2 One & Two Family Buildings BURKE AVENUE KEVIN JOHNSEN, AS TRU R3A One & Two Family Buildings WATSON AVENUE JOHN BRODY R3 2 One & Two Family Buildings B 120 RICHE AVENUE ROCKY & NANCY ANNUNZI R3A One & Two Family Buildings PRICES LANE ARNONE THOMAS R3 2 One & Two Family Buildings GLEN STREET LUCILLE VIGLIOTTI R3A One & Two Family Buildings ROSWELL AVENUE BILOTTI DOMINICK R3A One & Two Family Buildings VICTORY BOULEVARD H DECKER JR M3 1 One & Two Family Buildings B 139 RICHE AVENUE RICHARD SALERNO R3A One & Two Family Buildings VICTORY BOULEVARD DONNA M ABBRUZLESE M1 1 One & Two Family Buildings B 212 WILD AVENUE WHALEN, SCOTT R3A One & Two Family Buildings MELVIN AVENUE BAEZ JAMES R3A One & Two Family Buildings WATSON AVENUE FRANK OTTOMANELLI R3 2 One & Two Family Buildings B 63 SIMMONS LANE TIMMINS, PETER R3A One & Two Family Buildings B 55 TOWERS LANE KAMEL FAYEZ I R3A One & Two Family Buildings CANNON AVENUE ROY P ALBERTI R3 2 One & Two Family Buildings PARISH AVENUE PETEER DOBROW R3 2 One & Two Family Buildings MILDRED AVENUE J RAPEWSKI R3A One & Two Family Buildings PRICES LANE JAMES M SILVESTRI R3 2 One & Two Family Buildings B 146 ROSWELL AVENUE DENNIS SMYTH R3 2 One & Two Family Buildings MELVIN AVENUE MICHAEL BURKE R3A One & Two Family Buildings WILD AVENUE D'ALESSANDRO, ALBERT R3A One & Two Family Buildings WILD AVENUE GEORGE ELOT R3A One & Two Family Buildings ng Fac BURKE AVENUE ANDREJUK, KATARZYNA R3A One & Two Family Buildings BURKE AVENUE GEORGE A DECKER R3 2 One & Two Family Buildings B 143 RICHE AVENUE CATHERINE E ERNST R3A One & Two Family Buildings ROSWELL AVENUE EDWARD J. ROIAS JR. R3A One & Two Family Buildings B 142 ROSWELL AVENUE ANGELA TANG LEUNG R3 2 One & Two Family Buildings CANNON AVENUE 99 CANNON AVENUE CORP R3A One & Two Family Buildings B 33 TEMPLE COURT LI, MEI DUAN R3A One & Two Family Buildings VICTORY BOULEVARD ROCCO SCHIRRIPA M1 1 One & Two Family Buildings GRAHAM AVENUE SALVATORE CANGELOSI E R3X One & Two Family Buildings A 14 CALVANICO LANE MEADOWVIEW I LLC R3 2 One & Two Family Buildings Green Zone Parcel Registry, Working Version 11 of 33
90 General Site Information SIEDC Green Zone Consultant Services Property Parcel Registry Living Document (2.1) Zoning & Land Use Designations Coordinates Block Lot Community District Census Tract Census Block Street Address Owner Name Zoning Land Use X Y B 37 TEMPLE COURT MEGALA, `MONA A R3A One & Two Family Buildings B 81 SIMMONS LANE RAFAEL B. PEREZ R3A One & Two Family Buildings PARISH AVENUE SAWICKI WILLIAM R3A One & Two Family Buildings B 65 RIDGEWAY AVENUE GULINELLO JOSEPH J R3 2 One & Two Family Buildings B 91 SIMMONS LANE PO H LO R3A One & Two Family Buildings B 31 SIMMONS LANE DININ LEONID R3 2 One & Two Family Buildings CANNON AVENUE MARCELLO, JOSEPH R3A One & Two Family Buildings VICTORY BOULEVARD FRANCES MATHEU R3A One & Two Family Buildings B 17 SIMMONS LOOP CHARLES GALLETTA R3A One & Two Family Buildings MELVIN AVENUE MANEATES MANCY R3A One & Two Family Buildings A 10 CALVANICO LANE YESQUEN, MONICA R3 2 One & Two Family Buildings BURKE AVENUE GENEVIEVE ANDJESKI R3A One & Two Family Buildings EGRIT COURT PARK, SUK KWANG R3A One & Two Family Buildings B 119 ALBERTA AVENUE LIPARI, MICHAEL R3 2 One & Two Family Buildings GRAHAM AVENUE MARTIN M RUAN R3X One & Two Family Buildings B 222 WILD AVENUE KATHLEEN O'BRIEN R3A One & Two Family Buildings ROSWELL AVENUE CAROL OKRASZEWSKI R3A One & Two Family Buildings MILDRED AVENUE JOSEPH CAMERA R3A One & Two Family Buildings B 77 SIMMONS LOOP JOHN NUCERO R3A One & Two Family Buildings B 145 RIDGEWAY AVENUE REMINI, JEAN R3 2 One & Two Family Buildings PARISH AVENUE LAUREN CROZIER R3 2 One & Two Family Buildings ng Fac B 158 BURKE AVENUE F LAUB R3A One & Two Family Buildings MEREDITH AVENUE MISTLER ANDREW R3A One & Two Family Buildings A MELVIN AVENUE EMMANUELLE LICITRA R3A One & Two Family Buildings VICTORY BOULEVARD 4158 VICTORY BLVD, LL R3A One & Two Family Buildings WILD AVENUE J SABLOWSKI R3A One & Two Family Buildings B 51 SIMMONS LOOP GENEVIEVE FRANZ R3A One & Two Family Buildings B 45 SIMMONS LOOP POWELL KENNETH R3A One & Two Family Buildings B 33 SIMMONS LANE VELEZ, WENDY R3A One & Two Family Buildings PARISH AVENUE WILLIAM & JEAN SHOLES R3 2 One & Two Family Buildings VICTORY BOULEVARD JANET LINDSEY R3A One & Two Family Buildings PRICES LANE MOHAMMED ABRMEILEH R3 2 One & Two Family Buildings B 148 BURKE AVENUE TARA BENEDETTO R3A One & Two Family Buildings PARISH AVENUE SULLIVAN, SUSAN R3 2 One & Two Family Buildings SHELLEY AVENUE SHARRON L BORIK R3A One & Two Family Buildings VICTORY BOULEVARD ROSSI, JOHN E R3A One & Two Family Buildings B 69 SIMMONS LANE CALLAHAN, LISA R3 2 One & Two Family Buildings MELVIN AVENUE TOTINO, GIUSEPPE R3A One & Two Family Buildings PARISH AVENUE JOHN L NAVARRIA R3 2 One & Two Family Buildings CANNON AVENUE HUGO SALAZAR R3 2 One & Two Family Buildings MELVIN AVENUE JAMES J DARRAGH R3A One & Two Family Buildings B 79 SIMMONS LANE SUSAN GOOLD R3A One & Two Family Buildings B 105 SHELLEY AVENUE EAGLE, DENISE R3A One & Two Family Buildings B 139 RIDGEWAY AVENUE SEMBLER, ROBERT J R3 2 One & Two Family Buildings Green Zone Parcel Registry, Working Version 12 of 33
91 General Site Information SIEDC Green Zone Consultant Services Property Parcel Registry Living Document (2.1) Zoning & Land Use Designations Coordinates Block Lot Community District Census Tract Census Block Street Address Owner Name Zoning Land Use X Y B 95 BURKE AVENUE KDC OF STATEN ISLAND, R3A One & Two Family Buildings B 35 SIMMONS LOOP SANTANA, DANIELLE R3A One & Two Family Buildings TRAVIS AVENUE STRAUBER, MICHAEL R3 1 One & Two Family Buildings B 87 SHELLEY AVENUE R PENTONY R3A One & Two Family Buildings BURKE AVENUE SCOTTO, PAUL R3A One & Two Family Buildings B 51 CALVANICO LANE RIVERA, JR PASQUAL R3A One & Two Family Buildings CANNON AVENUE ELLY HAYNBERG R3 2 One & Two Family Buildings PARISH AVENUE PAULETTE BELLAVIA R3A One & Two Family Buildings B 4006 VICTORY BOULEVARD PETER ADINOLFI R3A One & Two Family Buildings WILD AVENUE ELLEN TATAR R3A One & Two Family Buildings WATSON AVENUE DANIEL P. WOODS R3 2 One & Two Family Buildings BURKE AVENUE UNGER THOMAS R3A One & Two Family Buildings B 20 SIMMONS LANE TRIOLO MASSINO R3A One & Two Family Buildings B 149 ALBERTA AVENUE CAPONI, JOSEPH R R3 2 One & Two Family Buildings MELVIN AVENUE THOMAS A VITALE R3A One & Two Family Buildings B 37 SIMMONS LOOP TIMOTHY REGAN R3A One & Two Family Buildings CASWELL LANE MARY JANE DESALVO R3 2 One & Two Family Buildings B 234 MELVIN AVENUE LIN, BAI R3A One & Two Family Buildings A 221 WILD AVENUE PURPORA, HELENE R3A One & Two Family Buildings LATIMER AVENUE RONALD KRAWCZYK M1 1 One & Two Family Buildings B 29 BERESFORD AVENUE HAN, MUN K R3 2 One & Two Family Buildings WATSON AVENUE LUIS SANTIAGO R3 2 One & Two Family Buildings B 138 ALBERTA AVENUE HANWACKER, DEBRA R3 2 One & Two Family Buildings B 93 CHURCH AVENUE SMITH, JAMES R3A One & Two Family Buildings B 140 BURKE AVENUE HAMSHO KHALID R3A One & Two Family Buildings B 173 BURKE AVENUE DESIDERIO, MELISSA R3A One & Two Family Buildings GLEN STREET DE SISTO, LEONARD R3A One & Two Family Buildings B 226 WILD AVENUE CIPRIANO, EUGENE R3A One & Two Family Buildings ROSWELL AVENUE SALADINO, LOUISE R3A One & Two Family Buildings B 83 SIMMONS LOOP SCHWARTZ, MARK A R3A One & Two Family Buildings A ALBERTA AVENUE VILLANUEVA, EDGAR R3A One & Two Family Buildings B 16 SIMMONS LANE GUILLEROMO M VALENCIA R3A One & Two Family Buildings GRAHAM AVENUE BETULIA, MARIE R3X One & Two Family Buildings WILD AVENUE CONROY KEVIN R3A One & Two Family Buildings TRAVIS AVENUE JOHN BOORRAZZO R3 1 One & Two Family Buildings B 143 RIDGEWAY AVENUE COTES, MARGARET R R3 2 One & Two Family Buildings ROSWELL AVENUE ANTHONY CIRILLO R3A One & Two Family Buildings B 180 WILD AVENUE DANIEL LENZA R3A One & Two Family Buildings CANNON AVENUE GEORGETTE A EDKINS R3 2 One & Two Family Buildings A 20 CALVANICO LANE RAYMOND LASTRA R3 2 One & Two Family Buildings CANNON AVENUE ALEXANDRID, ATHANASIO R3A One & Two Family Buildings B 151 BURKE AVENUE MICHAEL CONNERS R3A One & Two Family Buildings ROSWELL AVENUE PORTARO, MICHELLE M R3A One & Two Family Buildings CANNON AVENUE KELLY L KRYTSTOF R3A One & Two Family Buildings Green Zone Parcel Registry, Working Version 13 of 33
92 General Site Information SIEDC Green Zone Consultant Services Property Parcel Registry Living Document (2.1) Zoning & Land Use Designations Coordinates Block Lot Community District Census Tract Census Block Street Address Owner Name Zoning Land Use X Y CANNON AVENUE LUISI, JAMES R3A One & Two Family Buildings B 79 TOWERS LANE SIU NG R3A One & Two Family Buildings B 73 SIMMONS LANE VIRTUSIO, JERICHO N R3A One & Two Family Buildings ALBERTA AVENUE F VALLEDOLMO R3A One & Two Family Buildings B 3910 VICTORY BOULEVARD VOLSHTEYN GOARA R3 2 One & Two Family Buildings MELVIN AVENUE F WALTER R3A One & Two Family Buildings ROSWELL AVENUE MARGARET CHOBAN ROZMA R3A One & Two Family Buildings TRAVIS AVENUE GILBERTI, KAREN R3 1 One & Two Family Buildings B 95 SHELLEY AVENUE JOSEPH GILL R3A One & Two Family Buildings PARISH AVENUE NICHOLAS OLIVIERI R3A One & Two Family Buildings WILD AVENUE MURPHY, KELLY A R3A One & Two Family Buildings CANNON AVENUE WASHINGTON, ERNEST R3 2 One & Two Family Buildings B 15 CHURCH AVENUE GAGLIARDI, CHASE M R3A One & Two Family Buildings SHELLEY AVENUE MARK BLANCHARD R3A One & Two Family Buildings MELVIN AVENUE HADLEY, JOHN W JR R3A One & Two Family Buildings B 133 RICHE AVENUE ROBERT CORSON R3A One & Two Family Buildings B 93 SIMMONS LANE FOX, ANITA R3A One & Two Family Buildings B 147 BURKE AVENUE PECHERSKI JANE R3A One & Two Family Buildings B 12 WATSON AVENUE JEFFREY ANDERSEN R3A One & Two Family Buildings VICTORY BOULEVARD ARTHUR E BARNARD M1 1 One & Two Family Buildings MELVIN AVENUE BOGDAN & MARIE LIPINS R3A One & Two Family Buildings LATIMER AVENUE JOAN MCNEIL EMERY M1 1 One & Two Family Buildings A 26 ALBERTA AVENUE MICHAEL L. SCOZZARI R3A One & Two Family Buildings B 50 FAHY AVENUE R3 2 One & Two Family Buildings B 3916 VICTORY BOULEVARD CARRASCO, EDWARD R3A One & Two Family Buildings WILD AVENUE WILLIAM ALCOCK R3A One & Two Family Buildings A 48 ALBERTA AVENUE PIZZULLI LEWIS R3A One & Two Family Buildings TRAVIS AVENUE MELVIN FELDSTEIN R3 1 One & Two Family Buildings SHELLEY AVENUE MARIA E MARMO R3A One & Two Family Buildings MEREDITH AVENUE LONGO BARBARA R3A One & Two Family Buildings A 28 CALVANICO LANE MARY L PASTORE R3 2 One & Two Family Buildings MILDRED AVENUE GALLIS DAWN R3A One & Two Family Buildings GRAHAM AVENUE ALAN COOPER R3X One & Two Family Buildings B 60 FAHY AVENUE GADALLA, GEORGE R3 2 One & Two Family Buildings B 124 RICHE AVENUE JOHNSON, LINDA R3A One & Two Family Buildings B 40 FAHY AVENUE SON T. GIANG R3 2 One & Two Family Buildings CANNON AVENUE NOLA KATHY R3A One & Two Family Buildings WILD AVENUE HANS JERLIN R3A One & Two Family Buildings B 3904 VICTORY BOULEVARD VILLEGAS, DIGNA E R3 2 One & Two Family Buildings VICTORY BOULEVARD TARAF, AMAR R3A One & Two Family Buildings ROSWELL AVENUE RICHARD S MODZELEWSKI R3A One & Two Family Buildings B 150 ALBERTA AVENUE MARIANO, CARMINE R3 2 One & Two Family Buildings SIMMONS LANE RICCI, ANTHONY M R3A One & Two Family Buildings B 29 SIMMONS LANE DININ, HARVEY R3 2 One & Two Family Buildings Green Zone Parcel Registry, Working Version 14 of 33
93 General Site Information SIEDC Green Zone Consultant Services Property Parcel Registry Living Document (2.1) Zoning & Land Use Designations Coordinates Block Lot Community District Census Tract Census Block Street Address Owner Name Zoning Land Use X Y CANNON AVENUE TORRES, VICTOR HUGO R3A One & Two Family Buildings WATSON AVENUE ROSADO, OSVALDO R3 2 One & Two Family Buildings B 119 RICHE AVENUE RICHARD CALIRI R3A One & Two Family Buildings ng Fac B 174 WILD AVENUE JOSEPH BARRESE R3A One & Two Family Buildings WATSON AVENUE RICHARD ROMAN R3 2 One & Two Family Buildings EGRIT COURT NOVAK, SUZANNE R3A One & Two Family Buildings A 50 ALBERTA AVENUE OMAIRA, KELLY R3A One & Two Family Buildings B 36 WATSON AVENUE MAUREEN WOLENSKI R3A One & Two Family Buildings VICTORY BOULEVARD VILLANUEVA, DON R3A One & Two Family Buildings B 123 RIDGEWAY AVENUE CUOZZO, ANNE M R3 2 One & Two Family Buildings B 14 SIMMONS LANE LUIGI PARADISO R3A One & Two Family Buildings B 32 TEMPLE COURT ROSEANN SAVOCA R3A One & Two Family Buildings CASWELL LANE FLORENCE A PISCITELLI R3 2 One & Two Family Buildings GRAHAM AVENUE KARAGOZLER, RESAT R3X One & Two Family Buildings B 18 CHURCH AVENUE LE ROY BRAHN R3A One & Two Family Buildings ROSWELL AVENUE R3A One & Two Family Buildings A 18 CALVANICO LANE GOEPEL, MARLEEN R3 2 One & Two Family Buildings CANNON AVENUE JAMES A JOHNSON R3 2 One & Two Family Buildings MELVIN AVENUE PISCOPO, TRACY R3A One & Two Family Buildings B 12 SIMMONS LANE DEPAOLO, JAMES A R3A One & Two Family Buildings WILD AVENUE JOSE B ANDRADE R3A One & Two Family Buildings LATIMER AVENUE NAGENDRANATH NANDIVAD M1 1 One & Two Family Buildings PARISH AVENUE GENNARO D BERTONE R3 2 One & Two Family Buildings B 182 WILD AVENUE ARLENE FEOLA R3A One & Two Family Buildings B 26 AYE COURT JAMES E WILSON R3 2 One & Two Family Buildings B 10 TEMPLE COURT LEONIDAS GIL R3A One & Two Family Buildings B 47 BERESFORD AVENUE DANTONI, THOMAS R3 2 One & Two Family Buildings CANNON AVENUE COLCHAMIRO DICKS, REB R3A One & Two Family Buildings B 3970 VICTORY BOULEVARD SOLVEIG K BENTSEN R3A One & Two Family Buildings GRAHAM AVENUE BRILL, RICHARD OWEN R3X One & Two Family Buildings B 54 FAHY AVENUE RAMSIS M AZER R3 2 One & Two Family Buildings SHELLEY AVENUE BLANCHARD BARRY R3A One & Two Family Buildings BURKE AVENUE VENTURA, LAWRENCE R3A One & Two Family Buildings B 22 WATSON AVENUE THOMAS DEFAZIO R3A One & Two Family Buildings VICTORY BOULEVARD MARK HARRIS M3 1 One & Two Family Buildings SHELLEY AVENUE JOHN NOONAN R3A One & Two Family Buildings B 46 FAHY AVENUE G COUTIN R3 2 One & Two Family Buildings TRAVIS AVENUE ANN SILVERMAN A/K/A A R3 1 One & Two Family Buildings B 71 SIMMONS LANE FERGUSON, LUIS R3A One & Two Family Buildings A 217 WILD AVENUE ELASSAD ROBERT R3A One & Two Family Buildings B 135 ALBERTA AVENUE GREGORY BOWEN R3 2 One & Two Family Buildings B 116 ROSWELL AVENUE KELLY BARONECK R3 2 One & Two Family Buildings B 155 ALBERTA AVENUE DANNA LOIS R3 2 One & Two Family Buildings B 61 SIMMONS LOOP LOUISA, STEVEN R3A One & Two Family Buildings Green Zone Parcel Registry, Working Version 15 of 33
94 General Site Information SIEDC Green Zone Consultant Services Property Parcel Registry Living Document (2.1) Zoning & Land Use Designations Coordinates Block Lot Community District Census Tract Census Block Street Address Owner Name Zoning Land Use X Y B 42 SIMMONS LANE LESLIE GOLDBERG R3A One & Two Family Buildings WILD AVENUE FINN, DAVID W MD R3A One & Two Family Buildings B 37 CHURCH AVENUE VINCENT SORIANO R3A One & Two Family Buildings BURKE AVENUE JOHN GRASSADONIO II R3A One & Two Family Buildings FELDMEYERS LANE WENDY ANN EDKINS M2 1 One & Two Family Buildings B 111 SHELLEY AVENUE AIDA LOPEZ R3A One & Two Family Buildings SHELLEY AVENUE ROBERT MOSES R3A One & Two Family Buildings B 3998 VICTORY BOULEVARD MESSANADDS ANGELO R3A One & Two Family Buildings B 96 CHURCH AVENUE ADONIS EL ASMAR R3A One & Two Family Buildings MELVIN AVENUE FRANK RENO ASSET MANA R3A One & Two Family Buildings B 24 SIMMONS LANE NELIA THEN R3A One & Two Family Buildings B 111 BURKE AVENUE VENDITTI, ROBERT R3A One & Two Family Buildings B 156 ALBERTA AVENUE BARRERA, REGINA R3 2 One & Two Family Buildings CANNON AVENUE MICHAEL VASILOPOULOS R3A One & Two Family Buildings PARISH AVENUE PETERS MARY J R3A One & Two Family Buildings ROSWELL AVENUE JOSEH KUSACK R3A One & Two Family Buildings B 12 AYE COURT AGONCILLO, JOSEPHINE R3 2 One & Two Family Buildings B 15 TEMPLE COURT WONG, LYLE R3A One & Two Family Buildings TRAVIS AVENUE PATRICK CLEMENTS R3 1 One & Two Family Buildings GRAHAM AVENUE THOMAS J TESORIERO R3X One & Two Family Buildings WAKEFIELD AVENUE YAHM KENNETH M1 1 One & Two Family Buildings B 24 AYE COURT TEODULO S TOPACIO R3 2 One & Two Family Buildings TRAVIS AVENUE SCARSO, CHRISTINE R3 1 One & Two Family Buildings LEIGH AVENUE HECTOR VALERO R3 2 One & Two Family Buildings B 112 ROSWELL AVENUE MICHAEL CASHIN R3 2 One & Two Family Buildings ALBERTA AVENUE LUIS RUIZ R3A One & Two Family Buildings CANNON AVENUE CARLO J REALBUTO R3A One & Two Family Buildings WILD AVENUE ROBERT VAN CLEAF R3A One & Two Family Buildings B 3820 VICTORY BOULEVARD JOSEPH L POTENZA R3A One & Two Family Buildings B 131 BURKE AVENUE MILLER, JULIA R3A One & Two Family Buildings MELVIN AVENUE M OPULSKI R3A One & Two Family Buildings WILD AVENUE ZIELINSKI, BRYAN S R3A One & Two Family Buildings VICTORY BOULEVARD FANELLE, WILLIAM R3A One & Two Family Buildings PRICES LANE P SALADIS R3 2 One & Two Family Buildings MILDRED AVENUE ROBERT J HORAI R3A One & Two Family Buildings SHELLEY AVENUE MARK HAYES R3A One & Two Family Buildings WILD AVENUE CAROL KELLY R3A One & Two Family Buildings A 70 ALBERTA AVENUE KATHRYN M KRYGER R3A One & Two Family Buildings MELVIN AVENUE BLANCHARD, JANICE R3A One & Two Family Buildings B MELVIN AVENUE MCNIECE, MAUREEN R3A One & Two Family Buildings B 89 SIMMONS LANE BARBARA A CASELLA R3A One & Two Family Buildings BURKE AVENUE MICHAEL PORCU R3A One & Two Family Buildings B 130 RICHE AVENUE EARL J TUCKER R3A One & Two Family Buildings B 101 SHELLEY AVENUE RICHMOND G COOMBS R3A One & Two Family Buildings Green Zone Parcel Registry, Working Version 16 of 33
95 General Site Information SIEDC Green Zone Consultant Services Property Parcel Registry Living Document (2.1) Zoning & Land Use Designations Coordinates Block Lot Community District Census Tract Census Block Street Address Owner Name Zoning Land Use X Y B 130 ALBERTA AVENUE BALZANO, CHRISTOPHER R3 2 One & Two Family Buildings WILD AVENUE STANLEY TATAR R3A One & Two Family Buildings CANNON AVENUE YOLANDA ALLICOTT R3A One & Two Family Buildings B 147 ALBERTA AVENUE LAWRENCE DAPONTE R3 2 One & Two Family Buildings VICTORY BOULEVARD THOMAS MC KEON M3 1 One & Two Family Buildings CANNON AVENUE RUAS, MARK R3 2 One & Two Family Buildings B 69 BERESFORD AVENUE GEYGEL, JIMMY R3 2 One & Two Family Buildings B 49 SIMMONS LOOP ANNE T OLIVO R3A One & Two Family Buildings B 59 BERESFORD AVENUE DI RESTA, KERICE R3 2 One & Two Family Buildings ALBERTA AVENUE JOSEPH G HORAI R3A One & Two Family Buildings B 10 SIMMONS LANE JOHN J LOMAGNO R3A One & Two Family Buildings LATIMER AVENUE WESTLYE CATHLEEN M M1 1 One & Two Family Buildings B 63 RIDGEWAY AVENUE RIVECCIO, MICHAEL P R3 2 One & Two Family Buildings B 120 ALBERTA AVENUE GREGORY LESHINGER R3 2 One & Two Family Buildings CANNON AVENUE JOHN J GADOMSKI R3A One & Two Family Buildings ALBERTA AVENUE ANTHONY SERIO R3A One & Two Family Buildings B 21 CHURCH AVENUE KRUSZKA, FRANK L R3A One & Two Family Buildings LATIMER AVENUE HENRY DRAGULA M1 1 One & Two Family Buildings B 105 CHURCH AVENUE R3A One & Two Family Buildings A 16 CALVANICO LANE REBACK ADAM R3 2 One & Two Family Buildings B 83 SIMMONS LANE JIMENEZ, JUSTINO R3A One & Two Family Buildings B 103 CHURCH AVENUE JOHN W CURCIO R3A One & Two Family Buildings B 67 SIMMONS LANE GUIDO PASSARELLI R3A One & Two Family Buildings CANNON AVENUE V INFUSO R3 2 One & Two Family Buildings B 20 TEMPLE COURT ANDREW CROSS R3A One & Two Family Buildings B 137 RIDGEWAY AVENUE KELLEY, MAXWELL R3 2 One & Two Family Buildings WILD AVENUE ROBERT ROSTAWANIK R3A One & Two Family Buildings MILDRED AVENUE THOMAS GERBINO R3A One & Two Family Buildings B 17 FELTON STREET ANTONIO AGONCILLO R3 2 One & Two Family Buildings B 53 SIMMONS LOOP BLAES CHARLES R3A One & Two Family Buildings ROSWELL AVENUE RONALD RENO R3A One & Two Family Buildings MILDRED AVENUE KISSEL, WALTER J III R3A One & Two Family Buildings SHELLEY AVENUE JAMES D THOMPSON R3A One & Two Family Buildings CASWELL LANE ELAN OZANA R3 2 One & Two Family Buildings PARISH AVENUE BORTUNA, SALVATORE R3A One & Two Family Buildings MELVIN AVENUE LEONARD J PORSELLO R3A One & Two Family Buildings B 23 SIMMONS LANE DININ, LOENID R3 2 One & Two Family Buildings B 65 SIMMONS LOOP NAVENTA, JAIME R3A One & Two Family Buildings B 129 RICHE AVENUE VINCENT MIKOS R3A One & Two Family Buildings CRABBS LANE OKRASZEWSKI JOHN W M3 1 One & Two Family Buildings B 57 RIDGEWAY AVENUE BRANDWEIN, TONI ANN R3 2 One & Two Family Buildings B 24 CHURCH AVENUE MAZZA GAETANO O R3A One & Two Family Buildings B 124 ALBERTA AVENUE BILOTTI, CATHERINE R3 2 One & Two Family Buildings A 52 ALBERTA AVENUE JOHN ANDERSEN R3A One & Two Family Buildings Green Zone Parcel Registry, Working Version 17 of 33
96 General Site Information SIEDC Green Zone Consultant Services Property Parcel Registry Living Document (2.1) Zoning & Land Use Designations Coordinates Block Lot Community District Census Tract Census Block Street Address Owner Name Zoning Land Use X Y B 17 TEMPLE COURT STORNIOLO, DONALD R3A One & Two Family Buildings MELVIN AVENUE KATHLEEN FOX R3A One & Two Family Buildings B 53 RIDGEWAY AVENUE JOSEPH LUPO R3 2 One & Two Family Buildings MELVIN AVENUE R3A One & Two Family Buildings WILD AVENUE 495 WILD AVENUE LLC M3 1 One & Two Family Buildings SIMMONS LOOP PETER MISCIONE JR R3A One & Two Family Buildings B 78 SIMMONS LANE CHEN CHI SHAO R3A One & Two Family Buildings MELVIN AVENUE WINFIELD KLUTH R3A One & Two Family Buildings B 81 CHURCH AVENUE JOSEPH DANZIERI R3A One & Two Family Buildings B 140 ROSWELL AVENUE HERMINO RODRIGUEZ R3 2 One & Two Family Buildings GRAHAM AVENUE A MACRI M1 1 One & Two Family Buildings B 120 ROSWELL AVENUE CRONIN, CHARLES J R3 2 One & Two Family Buildings B 43 SIMMONS LOOP FRANCES, KEVIN R3A One & Two Family Buildings B 39 CHURCH AVENUE PETER PASCALE R3A One & Two Family Buildings B 131 GAULDY AVENUE EUGENE L OVERTON R3 2 One & Two Family Buildings A 34 CALVANICO LANE CRUZ, ANNETTE R3 2 One & Two Family Buildings B 176 WILD AVENUE MICHAEL CARLETTI R3A One & Two Family Buildings B 3890 VICTORY BOULEVARD JOSEPH CANNIZZARO R3A One & Two Family Buildings B 18 TEMPLE COURT ARDIZZONE, THOMAS R3A One & Two Family Buildings EGRIT COURT VUOSO, JOHN R3A One & Two Family Buildings LEROY STREET SANDRA SANCHEZ R3A One & Two Family Buildings B 260 MELVIN AVENUE WILLIAM COLLYER R3A One & Two Family Buildings A 24 CALVANICO LANE VIACRUCIS, MARIA J R3 2 One & Two Family Buildings WATSON AVENUE THOMAS E SOTTILE R3 2 One & Two Family Buildings B 50 CHURCH AVENUE CONNORS, MICHAEL J R3A One & Two Family Buildings GAULDY AVENUE SHU YAN ENG R3 2 One & Two Family Buildings MELVIN AVENUE O'NEIL, CHRIS R3A One & Two Family Buildings ALBERTA AVENUE SMIDHUM, JR., GEORGE R3A One & Two Family Buildings B 85 CHURCH AVENUE BLAINE, ERIC R3A One & Two Family Buildings B 45 BERESFORD AVENUE GERACI, ANDREW R3 2 One & Two Family Buildings B 53 SIMMONS LANE RAWLS, KARMA JOHARI R3A One & Two Family Buildings CANNON AVENUE PATRICIA DESOUSA M1 1 One & Two Family Buildings B 15 SIMMONS LOOP ZOLTON SEREGILY R3A One & Two Family Buildings B 97 CHURCH AVENUE TOMPKINS RICHARD R3A One & Two Family Buildings B 51 RIDGEWAY AVENUE MEADOW I LLC R3 2 One & Two Family Buildings MEREDITH AVENUE WEYERSHAUSEN, MARY RO R3A One & Two Family Buildings VICTORY BOULEVARD BAUDILLE, STEVEN R3A One & Two Family Buildings WILD AVENUE SALLY BECKER R3A One & Two Family Buildings PARISH AVENUE DIANE PRZYBYSZEWSKI R3 2 One & Two Family Buildings WILD AVENUE RAE BRUNONE R3A One & Two Family Buildings WATSON AVENUE MICHAEL THOMAS R3 2 One & Two Family Buildings B 63 SIMMONS LOOP THOMAS TEDESCO R3A One & Two Family Buildings B 105 RICHE AVENUE ESTHER G KACZMAREK R3A One & Two Family Buildings B 20 AYE COURT STOLA, KENIG R3 2 One & Two Family Buildings Green Zone Parcel Registry, Working Version 18 of 33
97 General Site Information SIEDC Green Zone Consultant Services Property Parcel Registry Living Document (2.1) Zoning & Land Use Designations Coordinates Block Lot Community District Census Tract Census Block Street Address Owner Name Zoning Land Use X Y B 80 CHURCH AVENUE DOWNS LAUREL J R3A One & Two Family Buildings B 150 BURKE AVENUE KORENSKI CATHERINE M R3A One & Two Family Buildings CANNON AVENUE MATHEW DREYER R3A One & Two Family Buildings CANNON AVENUE MANUEL, RENELITA C R3A One & Two Family Buildings BURKE AVENUE BELPEDIO, VANESSA R3A One & Two Family Buildings A 42 CALVANICO LANE MEADOWVIEW I LLC R3 2 One & Two Family Buildings B 65 TOWERS LANE MICEK, BOGDAN & ELZBI R3A One & Two Family Buildings B 82 CHURCH AVENUE LASSIE GATLING R3A One & Two Family Buildings B 3938 VICTORY BOULEVARD ROBERT GILL R3A One & Two Family Buildings B 28 SIMMONS LANE ERNEST DEROSA JR R3A One & Two Family Buildings WILD AVENUE ROSARIO, EDWIN R3A One & Two Family Buildings MELVIN AVENUE RUTH A KAHMANN R3A One & Two Family Buildings B 71 SHELLEY AVENUE HERMAN CORRENTE R3A One & Two Family Buildings B 136 ALBERTA AVENUE EVANHELISTA, ROBERT R3 2 One & Two Family Buildings MELVIN AVENUE STEPHEN D. MCKEON R3A One & Two Family Buildings B 3992 VICTORY BOULEVARD MUAMET SACIROVSKI R3A One & Two Family Buildings GRAHAM AVENUE EUGENE BERMAN R3X One & Two Family Buildings CANNON AVENUE FRANCESCO COLUCCIO R3A One & Two Family Buildings B 55 BERESFORD AVENUE KLAMMER, EDWARD L R3 2 One & Two Family Buildings B 40 WATSON AVENUE ROBERT G BARTOW R3A One & Two Family Buildings GRAHAM AVENUE S FORBES R3X One & Two Family Buildings VICTORY BOULEVARD VICTORY AND TRAVIS, L M1 1 One & Two Family Buildings B 121 ALBERTA AVENUE JASON ZELEVANSKY R3 2 One & Two Family Buildings WILD AVENUE HELEN DICKSON JERLIN R3A One & Two Family Buildings B 21 SIMMONS LOOP KVETKO, SLAVOMIR R3A One & Two Family Buildings MELVIN AVENUE JOSEPH GOETZ R3A One & Two Family Buildings A 46 CALVANICO LANE JOHNSON JAMES M R3 2 One & Two Family Buildings LATIMER AVENUE AUGUSTINE BENEDETTO S M1 1 One & Two Family Buildings PRICES LANE DOUGLAS SEPULVEDA R3 2 One & Two Family Buildings A 52 CALVANICO LANE SUDOL, DANUTA R3 2 One & Two Family Buildings B 31 CHURCH AVENUE MARGARET M AUDITORE R3A One & Two Family Buildings B 192 WILD AVENUE MASTERSON SEAN L R3A One & Two Family Buildings PEARSON STREET STERN, MELISSA D R3 2 One & Two Family Buildings B 3858 VICTORY BOULEVARD MOSTAFAVI, RAMIN R3A One & Two Family Buildings SIMMONS LOOP PAUL STUFFER R3A One & Two Family Buildings B 138 ROSWELL AVENUE MARTINS, CAMIL A R3 2 One & Two Family Buildings SHELLEY AVENUE PEPPER, EILEEN R3A One & Two Family Buildings B 148 ALBERTA AVENUE YASCUR, CHRISTOPHER R3 2 One & Two Family Buildings B 27 TOWERS LANE V FREIST R3A One & Two Family Buildings B 79 SIMMONS LOOP EDWARD FLYNT R3A One & Two Family Buildings A 44 ALBERTA AVENUE MAHNKEN, JOHN R3A One & Two Family Buildings B 40 CHURCH AVENUE BUSH, GLADYS R3A One & Two Family Buildings B 127 ALBERTA AVENUE ROBERT R. COLUCCI R3 2 One & Two Family Buildings CANNON AVENUE TADRAS, SAHAR R3 2 One & Two Family Buildings Green Zone Parcel Registry, Working Version 19 of 33
98 General Site Information SIEDC Green Zone Consultant Services Property Parcel Registry Living Document (2.1) Zoning & Land Use Designations Coordinates Block Lot Community District Census Tract Census Block Street Address Owner Name Zoning Land Use X Y B 57 BERESFORD AVENUE KLAMMER, EDWARD L R3 2 One & Two Family Buildings A 30 CALVANICO LANE D'ESPOSITO, KERRIE A R3 2 One & Two Family Buildings A 44 CALVANICO LANE MOSELEY, KEVIN T R3 2 One & Two Family Buildings CASWELL LANE MICHAEL KOZLOWSKI R3 2 One & Two Family Buildings ng Fac TRAVIS AVENUE IVAN SKALA R3 1 One & Two Family Buildings CANNON AVENUE JON CICCONE R3A One & Two Family Buildings TRAVIS AVENUE NUNEZ, ELIGIO R3 1 One & Two Family Buildings B 154 ALBERTA AVENUE VASQUEZ, ANDRES R3 2 One & Two Family Buildings B 81 SIMMONS LOOP WILSON MALDONADO R3A One & Two Family Buildings MELVIN AVENUE NICHOLAS V BLANCHARD R3A One & Two Family Buildings B 51 CHURCH AVENUE JOHN F KEILING R3A One & Two Family Buildings CANNON AVENUE RODOLFO GHELLER R3A One & Two Family Buildings A 50 CALVANICO LANE RODRIGUEZ, NOEME R3 2 One & Two Family Buildings B 4000 VICTORY BOULEVARD 4060 AMBOY ROAD REALT R3A One & Two Family Buildings BURKE AVENUE MARIE J BARRACATO R3A One & Two Family Buildings PRICES LANE SAMUEL CONANAN R3 2 One & Two Family Buildings WILD AVENUE ARDOLINO DANA MARIE R3A One & Two Family Buildings WILD AVENUE NIEVES, ROBERTO R3A One & Two Family Buildings B 141 RIDGEWAY AVENUE HERNANDEZ, IVETTE R3 2 One & Two Family Buildings B 57 SIMMONS LANE VINCENT COSTRO R3A One & Two Family Buildings B 33 CHURCH AVENUE RICHARD FATTORUSSO R3A One & Two Family Buildings B 106 ROSWELL AVENUE DOMINICK MIRANDA R3 2 One & Two Family Buildings B 3912 VICTORY BOULEVARD BARR, ADAM R3A One & Two Family Buildings B 204 WILD AVENUE JAIMAN, JAMES R3A One & Two Family Buildings B 55 RIDGEWAY AVENUE VARGAS, VERONICA R3 2 One & Two Family Buildings PARISH AVENUE KELLY MARK J R3A One & Two Family Buildings CASWELL LANE ROBERTO SARVIDA R3 2 One & Two Family Buildings B 56 FAHY AVENUE NARDA L MELENDEZ R3 2 One & Two Family Buildings CANNON AVENUE JOSEPH MUTOLI R3A One & Two Family Buildings LEIGH AVENUE PIETRINA RACCUGLIA R3 2 One & Two Family Buildings SHELLEY AVENUE TRACEY, DAVID R3A One & Two Family Buildings B 100 RICHE AVENUE ALBANO LOUISE A R3A One & Two Family Buildings PARISH AVENUE DOYLE, ALEXANDER P R3A One & Two Family Buildings B 27 CHURCH AVENUE ROBERT C SAUTER R3A One & Two Family Buildings WILD AVENUE JAMES E BRAHN M3 1 One & Two Family Buildings B 246 MELVIN AVENUE ARCURI SALVATORE R3A One & Two Family Buildings MEREDITH AVENUE HELEN GOZAN R3A One & Two Family Buildings B 84 CHURCH AVENUE PATRICIA SUTLER R3A One & Two Family Buildings GRAHAM AVENUE KATZ AHUVA R3X One & Two Family Buildings B 104 CHURCH AVENUE MONICA DELGADO VELEZ R3A One & Two Family Buildings MILDRED AVENUE RONALD DEMARCO R3A One & Two Family Buildings B 135 RIDGEWAY AVENUE OSEI, STANLEY R3 2 One & Two Family Buildings CANNON AVENUE GERALD MADDALONE R3A One & Two Family Buildings B 37 BERESFORD AVENUE AMBROSIO, CIRO R3 2 One & Two Family Buildings Green Zone Parcel Registry, Working Version 20 of 33
99 General Site Information SIEDC Green Zone Consultant Services Property Parcel Registry Living Document (2.1) Zoning & Land Use Designations Coordinates Block Lot Community District Census Tract Census Block Street Address Owner Name Zoning Land Use X Y CANNON AVENUE MUIA, JAMIE R3A One & Two Family Buildings B 72 TOWERS LANE ANTONIO ROBLES JR R3A One & Two Family Buildings TRAVIS AVENUE ISADORE GREENSPAN R3 1 One & Two Family Buildings B 115 RIDGEWAY AVENUE PANARELLA, LOUIS R3 2 One & Two Family Buildings B 127 GAULDY AVENUE JEROME HIGGINS R3 2 One & Two Family Buildings CANNON AVENUE B TYSDAL R3 2 One & Two Family Buildings ALBERTA AVENUE OSMANI, AGRON R3A One & Two Family Buildings WILD AVENUE ANNA DUVAL M3 1 One & Two Family Buildings B 3964 VICTORY BOULEVARD STEPHEN FOX R3A One & Two Family Buildings LATIMER AVENUE WALSH, DONNA J M1 1 One & Two Family Buildings WAKEFIELD AVENUE EMANUEL JAY QUINONES M1 1 One & Two Family Buildings GRAHAM AVENUE KNOTT, JENNIFER R3X One & Two Family Buildings MELVIN AVENUE MICHAEL KESTENBAUM R3A One & Two Family Buildings B 146 ALBERTA AVENUE FEDERAL HOME LOAN MOR R3 2 One & Two Family Buildings MILDRED AVENUE VINCENT DI DONATO R3A One & Two Family Buildings B 110 ROSWELL AVENUE JEFFREY A AIELLO R3 2 One & Two Family Buildings WILD AVENUE J LEACH M3 1 One & Two Family Buildings VICTORY BOULEVARD SALVATORE COLUCCIO R3A One & Two Family Buildings B 41 BERESFORD AVENUE TRONOLONE, JOSEPH R3 2 One & Two Family Buildings MELVIN AVENUE GRAZIA MINARDI R3A One & Two Family Buildings BURKE AVENUE JOSEPH J BRENNAN R3A One & Two Family Buildings MEREDITH AVENUE RICHARD ASSANTE R3A One & Two Family Buildings SHELLEY AVENUE JOHN MILLER R3A One & Two Family Buildings B 3894 VICTORY BOULEVARD PICONE THERESA R3A One & Two Family Buildings PARISH AVENUE RICHARD COHEN R3 2 One & Two Family Buildings BURKE AVENUE RAJEWSKI RICHARD R3A One & Two Family Buildings CANNON AVENUE LOUIS DEL PRIORE R3 2 One & Two Family Buildings SHELLEY AVENUE THOMAS MCCORMACK R3A One & Two Family Buildings B 107 BURKE AVENUE HILDA TATAR R3A One & Two Family Buildings CANNON AVENUE BRUNILDA HERNANDEZ R3A One & Two Family Buildings MELVIN AVENUE RODNEY J DURAN R3A One & Two Family Buildings MEREDITH AVENUE R3A One & Two Family Buildings B 9 TOWERS LANE PEARL NAILS R3 2 One & Two Family Buildings A 36 CALVANICO LANE MABEN, JAMES R3 2 One & Two Family Buildings B 72 TOWERS LANE FIDEL MARTINEZ R3A One & Two Family Buildings GLEN STREET PINTO, SOPHIA JEAN R3A One & Two Family Buildings ROSWELL AVENUE SIMONE, JAMES R3A One & Two Family Buildings B 59 TOWERS LANE BUTT SHABANA R3A One & Two Family Buildings TRAVIS AVENUE ALLAN MIONIS R3 1 One & Two Family Buildings B 142 ALBERTA AVENUE DAPONTE, ANDREW R3 2 One & Two Family Buildings MELVIN AVENUE GRACE REARDON R3A One & Two Family Buildings CANNON AVENUE JAMES MC GINN R3A One & Two Family Buildings B 122 ROSWELL AVENUE GARCIA, FELIPE J R3 2 One & Two Family Buildings B 81 TOWERS LANE TINA M. INCHIERCHIERA R3A One & Two Family Buildings Green Zone Parcel Registry, Working Version 21 of 33
100 General Site Information SIEDC Green Zone Consultant Services Property Parcel Registry Living Document (2.1) Zoning & Land Use Designations Coordinates Block Lot Community District Census Tract Census Block Street Address Owner Name Zoning Land Use X Y CASWELL LANE MICHELE ROSEFELT R3 2 One & Two Family Buildings PARISH AVENUE JAHAJ, SAFET R3 2 One & Two Family Buildings B 117 RIDGEWAY AVENUE AST, DAN R3 2 One & Two Family Buildings B 171 BURKE AVENUE PANTALEON ALFREDO R3A One & Two Family Buildings SIMMONS LOOP MARY MELCONE R3A One & Two Family Buildings A 56 ALBERTA AVENUE JOSE VELEZ R3A One & Two Family Buildings CANNON AVENUE SOENARIE PETER S R3 2 One & Two Family Buildings GAULDY AVENUE FOK BING YEE R3 2 One & Two Family Buildings VICTORY BOULEVARD DOROTHY PARADZINSKI R3A One & Two Family Buildings B 182 BURKE AVENUE SANFILIPPO C CHRISTIA R3A One & Two Family Buildings B 12 TEMPLE COURT CARMINE F FERRARI R3A One & Two Family Buildings WILD AVENUE ANTHONY J CATANEO R3A One & Two Family Buildings B 49 TOWERS LANE IRAM SOHAIL R3A One & Two Family Buildings TRAVIS AVENUE SCHIRRIPA MARIA M1 1 One & Two Family Buildings B 133 RIDGEWAY AVENUE LEVYA, PEDRO R3 2 One & Two Family Buildings B 85 SIMMONS LANE DENISE LAERUM R3A One & Two Family Buildings B 129 GAULDY AVENUE JOHN ZIELKOWSKI R3 2 One & Two Family Buildings WILD AVENUE CONCEPCION ALBERT R3A One & Two Family Buildings B 3816 VICTORY BOULEVARD DEBBIE BOSTWICK M1 1 One & Two Family Buildings B 129 RIDGEWAY AVENUE MOGA HOLDINGS LLC R3 2 One & Two Family Buildings MELVIN AVENUE LOUIS &G COLONE R3A One & Two Family Buildings ng Fac VICTORY BOULEVARD FRANCINE S ATLAK M1 1 One & Two Family Buildings BURKE AVENUE KDC OF STATEN ISLAND R3A One & Two Family Buildings TRAVIS AVENUE US BANK NATIONAL ASSO R3 1 One & Two Family Buildings B 85 SIMMONS LOOP PO LEUNG LO R3A One & Two Family Buildings B 49 SIMMONS LANE ADORNO, MICHAEL R3A One & Two Family Buildings B 256 MELVIN AVENUE BLACK, DANIEL R3A One & Two Family Buildings WILD AVENUE 497 WILD AVENUE LLC M3 1 One & Two Family Buildings B 78 TOWERS LANE Silem Hanna R3A One & Two Family Buildings B 3874 VICTORY BOULEVARD COTRONEO WEIBERG, PAT R3A One & Two Family Buildings A MELVIN AVENUE RAMADHIN ANMATEE R3A One & Two Family Buildings WILD AVENUE RONALD DUVAL SR R3A One & Two Family Buildings BURKE AVENUE POLITO, MICHAEL R3A One & Two Family Buildings B 75 SIMMONS LOOP HELEN GRANTON R3A One & Two Family Buildings PARISH AVENUE RICHARD FRANCIS R3 2 One & Two Family Buildings MELVIN AVENUE JIMMY J DESOUZA R3A One & Two Family Buildings VICTORY BOULEVARD LARA, RAMIRO R3A One & Two Family Buildings PARISH AVENUE V 858 CORP. R3 2 One & Two Family Buildings B 135 BURKE AVENUE GERESSY CHRISTOPHER R3A One & Two Family Buildings B 31 BERESFORD AVENUE OUTERIE, JOINT SURVIV R3 2 One & Two Family Buildings SHELLEY AVENUE SMITH, EARL M R3A One & Two Family Buildings MEREDITH AVENUE 364 MEREDITH AVENUE, M3 1 One & Two Family Buildings SHELLEY AVENUE ASPROMONTE, VITTORIO R3A One & Two Family Buildings B 218 WILD AVENUE KENNETH F CLAIR JR R3A One & Two Family Buildings Green Zone Parcel Registry, Working Version 22 of 33
101 General Site Information SIEDC Green Zone Consultant Services Property Parcel Registry Living Document (2.1) Zoning & Land Use Designations Coordinates Block Lot Community District Census Tract Census Block Street Address Owner Name Zoning Land Use X Y B 104 RICHE AVENUE JAMES CHUISANO R3A One & Two Family Buildings CANNON AVENUE JOHN RROSS R3A One & Two Family Buildings B 66 TOWERS LANE PATRICIA GRICE R3A One & Two Family Buildings B 63 BERESFORD AVENUE TORRES, MICHAEL R3 2 One & Two Family Buildings B 95 CHURCH AVENUE SUYAPA CASTRO R3A One & Two Family Buildings SIMMONS LOOP PAUL MEDORDI R3A One & Two Family Buildings PARISH AVENUE JOSEPH J CASTRO R3A One & Two Family Buildings VICTORY BOULEVARD V KOSTICK R3A One & Two Family Buildings B 31 TEMPLE COURT LEE, XIAO P R3A One & Two Family Buildings MILDRED AVENUE RISPOLI TUMINELLO, DO R3A One & Two Family Buildings CANNON AVENUE WILLIAMS, MELISSA R3 2 One & Two Family Buildings B 41 SIMMONS LOOP WANG DAN XI R3A One & Two Family Buildings PEARSON STREET FRANK BONOMO R3A One & Two Family Buildings B 122 ALBERTA AVENUE ZAMMITTO, NICOLE R3 2 One & Two Family Buildings MELVIN AVENUE THOMAS RENO R3A One & Two Family Buildings B 21 SIMMONS LANE R3 2 One & Two Family Buildings ALBERTA AVENUE MARTHA FISCARDI R3A One & Two Family Buildings WILD AVENUE JOHN R. KEILING R3A One & Two Family Buildings B 188 ROSWELL AVENUE PESANTEZ, MANUEL R3A One & Two Family Buildings A 78 ALBERTA AVENUE STACIA LAMARCA R3A One & Two Family Buildings CANNON AVENUE DKINS, KIM R3A One & Two Family Buildings CANNON AVENUE PAUL QUICK R3A One & Two Family Buildings B 38 SIMMONS LANE WONG TING W R3A One & Two Family Buildings CRABBS LANE OKRASZEWSKI JOHN M3 1 One & Two Family Buildings B 86 CHURCH AVENUE PETER SEIJO R3A One & Two Family Buildings CANNON AVENUE RONALD RATZ R3A One & Two Family Buildings WILD AVENUE NELSON NIEVES R3A One & Two Family Buildings B 11 TOWERS LANE ALIBEGOVIC, HODO R3 2 One & Two Family Buildings MEREDITH AVENUE THOMAS MAHONEY R3A One & Two Family Buildings B 87 CHURCH AVENUE DNATO, MICHAEL R3A One & Two Family Buildings B 73 SIMMONS LOOP TAPIA, BRIAN R3A One & Two Family Buildings CANNON AVENUE CONDE, ROSITA J R3A One & Two Family Buildings B 3934 VICTORY BOULEVARD JAMES E DECKER R3A One & Two Family Buildings VICTORY BOULEVARD VINCENT KASPROVITZ R3A One & Two Family Buildings B 73 TOWERS LANE WAGUIH GUIRGUIS R3A One & Two Family Buildings B 34 CHURCH AVENUE PAYNE, MICHAEL R3A One & Two Family Buildings FELDMEYERS LANE ERIC KORENSKI M2 1 One & Two Family Buildings B 19 SIMMONS LANE OSTROVSKY, ZINOVLY R3 2 One & Two Family Buildings B 3932 VICTORY BOULEVARD MR/MRS LAWRENCE CAPEL R3A One & Two Family Buildings VICTORY BOULEVARD VERA P SCHOPPMANN R3A One & Two Family Buildings CANNON AVENUE RICHARD SILVESTRI R3A One & Two Family Buildings PRICES LANE VICTOR DEROSA R3 2 One & Two Family Buildings B 121 RIDGEWAY AVENUE MOGA HOLDINGS LLC R3 2 One & Two Family Buildings ROSWELL AVENUE JOSEPH ROSCHBACH R3A One & Two Family Buildings Green Zone Parcel Registry, Working Version 23 of 33
102 General Site Information SIEDC Green Zone Consultant Services Property Parcel Registry Living Document (2.1) Zoning & Land Use Designations Coordinates Block Lot Community District Census Tract Census Block Street Address Owner Name Zoning Land Use X Y ROSWELL AVENUE PASQUALE F. SANTANELL R3A One & Two Family Buildings B 123 RICHE AVENUE L JOZWIAK R3A One & Two Family Buildings CANNON AVENUE JAMES VINCENT POMPA R3A One & Two Family Buildings WILD AVENUE THE RENO FAMILY IRREV R3A One & Two Family Buildings ROSWELL AVENUE JOSEPH WALTER R3A One & Two Family Buildings B 49 BERESFORD AVENUE HERNANDEZ, ELVIS R3 2 One & Two Family Buildings B 254 MELVIN AVENUE JOSEPH D BLACK R3A One & Two Family Buildings MILDRED AVENUE LOUIS BIONDO R3A One & Two Family Buildings A 38 CALVANICO LANE PETER FAZIO R3 2 One & Two Family Buildings A 42 ALBERTA AVENUE JOSEPH GOMEZ R3A One & Two Family Buildings B 43 CHURCH AVENUE MARIE NOLDE R3A One & Two Family Buildings B 101 CHURCH AVENUE STEFAN NEWMAN R3A One & Two Family Buildings MELVIN AVENUE KEVIN MCNERNEY R3A One & Two Family Buildings ARTHUR KILL ROAD LUCAS, IRENE M1 1 One & Two Family Buildings MELVIN AVENUE SUSAN WICINSKI R3A One & Two Family Buildings VICTORY BOULEVARD ROCCO SCHIRRIPA M1 1 One & Two Family Buildings B 42 FAHY AVENUE SANTO&AMELIA CROPANO R3 2 One & Two Family Buildings TRAVIS AVENUE FALLAH, EMMANUEL R3 1 One & Two Family Buildings B 8 AYE COURT JOHNSON, CHRISTOPHER R3 2 One & Two Family Buildings VICTORY BOULEVARD PRETE ALAN J R3A One & Two Family Buildings TRAVIS AVENUE AMETI, MUBERA R3 1 One & Two Family Buildings B 30 TEMPLE COURT CALCO, ROSARIO R3A One & Two Family Buildings SHELLEY AVENUE FERRAIOLI BARBARA R3A One & Two Family Buildings CANNON AVENUE RICHARD S MODZELEWSKI R3A One & Two Family Buildings B 52 WATSON AVENUE LINDA KLEIN R3A One & Two Family Buildings B 3980 VICTORY BOULEVARD S I CHRISTIAN CHURCH R3A One & Two Family Buildings B 148 ROSWELL AVENUE JOSEPH CASTORE R3 2 One & Two Family Buildings WILD AVENUE KEVIN KEMPTON R3A One & Two Family Buildings B 7 TOWERS LANE ZHU, RU RI R3 2 One & Two Family Buildings B 119 RIDGEWAY AVENUE GOODYEAR, DANIEL T R3 2 One & Two Family Buildings B 127 BURKE AVENUE ROMANO, JEANNINE R3A One & Two Family Buildings B 19 TEMPLE COURT BERTUNA, MICHAEL R3A One & Two Family Buildings CANNON AVENUE A J PERGOLA R3A One & Two Family Buildings MELVIN AVENUE MOSHIN, ADNAN R3A One & Two Family Buildings CANNON AVENUE TIMOTHY GOLDEN R3A One & Two Family Buildings B 75 TOWERS LANE DI TOMMASO, FRANK R3A One & Two Family Buildings VICTORY BOULEVARD FRANK C BARNARD JR M1 1 One & Two Family Buildings B 125 GAULDY AVENUE GERALD CHIGHINE R3 2 One & Two Family Buildings PRICES LANE Francine Kardel R3 2 One & Two Family Buildings ROSWELL AVENUE TONG YON MOORE R3A One & Two Family Buildings A 26 CALVANICO LANE ESPIN, ERICK E R3 2 One & Two Family Buildings MILDRED AVENUE BRIAN P WALSH R3A One & Two Family Buildings B 127 RIDGEWAY AVENUE HILL, NORRIS SR R3 2 One & Two Family Buildings MILDRED AVENUE KENNETH TYSDAL R3A One & Two Family Buildings Green Zone Parcel Registry, Working Version 24 of 33
103 General Site Information SIEDC Green Zone Consultant Services Property Parcel Registry Living Document (2.1) Zoning & Land Use Designations Coordinates Block Lot Community District Census Tract Census Block Street Address Owner Name Zoning Land Use X Y PRICES LANE HAYWARD, RONALD R3 2 One & Two Family Buildings B 61 SIMMONS LANE VINCENT MILO R3A One & Two Family Buildings B 32 MAZZA COURT BOK MIN R3 2 One & Two Family Buildings B 22 SIMMONS LANE THERESA RICCIO R3A One & Two Family Buildings B 53 CALVANICO LANE KARPATHIOS, NIKOLAOS R3 2 One & Two Family Buildings B 3918 VICTORY BOULEVARD MUI DAVY R3A One & Two Family Buildings MILDRED AVENUE YOFFREDO, RONALD R3A One & Two Family Buildings B 167 BURKE AVENUE M DOOD R3A One & Two Family Buildings ROSWELL AVENUE F WILKES R3A One & Two Family Buildings PARISH AVENUE DPETER M SILECCHIO R3 2 One & Two Family Buildings PRICES LANE ROBERT RONNE R3 2 One & Two Family Buildings B 53 BERESFORD AVENUE CASTELLANO, DREW R3 2 One & Two Family Buildings VICTORY BOULEVARD KENNETH P MORRIS R3A One & Two Family Buildings VICTORY BOULEVARD PAUL HENRY DIETRICH M1 1 One & Two Family Buildings ROSWELL AVENUE PERCOCO, STEVEN R3A One & Two Family Buildings B 34 MAZZA COURT BONANNO, VICKIE R3 2 One & Two Family Buildings B 28 MAZZA COURT MAN HO IP R3 2 One & Two Family Buildings WEST SERVICE ROAD J NEIS M1 1 One & Two Family Buildings B 1915 ARTHUR KILL ROAD MASTROPIERO, JOHN R3 2 One & Two Family Buildings B 118 ALBERTA AVENUE DAVID PROSCIA R3 2 One & Two Family Buildings B 35 TEMPLE COURT CHU, BO SAN R3A One & Two Family Buildings PARISH AVENUE R HANSON R3 2 One & Two Family Buildings B 3884 VICTORY BOULEVARD EDWIN J REID JR R3A One & Two Family Buildings B 94 CHURCH AVENUE SZYMANSKI, SLAWOMIR R3A One & Two Family Buildings CANNON AVENUE R3A One & Two Family Buildings MEREDITH AVENUE FAVARA, JASON R3A One & Two Family Buildings B 20 MAZZA COURT CHRISTOPHER STRABINIC R3 2 One & Two Family Buildings B 26 MAZZA COURT MAN KEI IP R3 2 One & Two Family Buildings B 22 MAZZA COURT BROOKS, LEONARD R3 2 One & Two Family Buildings B 24 MAZZA COURT LINDA VAN PELT R3 2 One & Two Family Buildings B 30 MAZZA COURT GLENDALE REALTY ASSOC R3 2 One & Two Family Buildings ARTHUR KILL ROAD D COSSEAN SR M2 1 One & Two Family Buildings MELVIN AVENUE MELVIN HOLDINGS, LLC R3A One & Two Family Buildings B 1927 ARTHUR KILL ROAD KENILWORTH HOLDINGS L R3 2 One & Two Family Buildings B 1931 ARTHUR KILL ROAD R3 2 One & Two Family Buildings MELVIN AVENUE R3A One & Two Family Buildings B 1929 ARTHUR KILL ROAD R3 2 One & Two Family Buildings ALBERTA AVENUE J ATLAK R3A One & Two Family Buildings SIMMONS LOOP KIN LAP MAK R3A One & Two Family Buildings B 139 ALBERTA AVENUE ANTHONY BUTTA R3 2 One & Two Family Buildings B 3908 VICTORY BOULEVARD MARINA KOGAN R3 2 One & Two Family Buildings MILDRED AVENUE REIN, RENEE R3A One & Two Family Buildings B 238 MELVIN AVENUE R TRICORICO R3A One & Two Family Buildings VICTORY BOULEVARD FRANK FILIPOWICZ R3A One & Two Family Buildings Green Zone Parcel Registry, Working Version 25 of 33
104 General Site Information SIEDC Green Zone Consultant Services Property Parcel Registry Living Document (2.1) Zoning & Land Use Designations Coordinates Block Lot Community District Census Tract Census Block Street Address Owner Name Zoning Land Use X Y B 100 SHELLEY AVENUE JEFFREY SANTORA R3A One & Two Family Buildings B 3808 VICTORY BOULEVARD PARKS AND RECREATION PARK Open Space & Outdoor Recreation GULF AVENUE PARKS AND RECREATION PARK Open Space & Outdoor Recreation SIGNS ROAD PARKS AND RECREATION PARK Open Space & Outdoor Recreation VICTORY BOULEVARD NANSEN PROP INC M1 1 Open Space & Outdoor Recreation RICHMOND AVENUE PARKS AND RECREATION PARK Open Space & Outdoor Recreation BLOOMFIELD ROAD PARKS DEPARTMENT PARK Open Space & Outdoor Recreation BLOOMFIELD AVENUE PARKS DEPARTMENT PARK Open Space & Outdoor Recreation TRAVIS AVENUE PARKS AND RECREATION PARK Open Space & Outdoor Recreation TRAVIS AVENUE MID ISLAND LITTLE LEA M1 1 Open Space & Outdoor Recreation SHENANDOAH AVENUE MID ISLAND LITTLE LEA M1 1 Open Space & Outdoor Recreation BLOOMFIELD AVENUE PARKS AND RECREATION PARK Open Space & Outdoor Recreation WAKEFIELD AVENUE MID ISLAND LITTLE LEA M1 1 Open Space & Outdoor Recreation CHELSEA ROAD PARKS AND RECREATION PARK Open Space & Outdoor Recreation TRAVIS AVENUE PARKS AND RECREATION PARK Open Space & Outdoor Recreation SIGNS ROAD THE HILLSIDE SWIMMING R3X Open Space & Outdoor Recreation GULF AVENUE PARKS DEPARTMENT PARK Open Space & Outdoor Recreation TRAVIS AVENUE PARKS AND RECREATION PARK Open Space & Outdoor Recreation SOUTH AVENUE PARKS AND RECREATION PARK Open Space & Outdoor Recreation VICTORY BOULEVARD DEPT OF GENERAL SERVI PARK Open Space & Outdoor Recreation LATIMER AVENUE MID ISLAND L LEAGUE M1 1 Open Space & Outdoor Recreation LATIMER AVENUE MID ISLAND L LEAGUE M1 1 Open Space & Outdoor Recreation B 385 WILD AVENUE WESTSHORE TENNIS CLUB M2 1 Open Space & Outdoor Recreation RICHMOND AVENUE PARKS AND RECREATION PARK Open Space & Outdoor Recreation MEREDITH AVENUE PARKS AND RECREATION PARK Open Space & Outdoor Recreation B MELVIN AVENUE PARKS AND RECREATION PARK Open Space & Outdoor Recreation BLOOMFIELD AVENUE PARKS DEPARTMENT PARK Open Space & Outdoor Recreation WEST SERVICE ROAD D & M REALTY HOLDING M2 1 Open Space & Outdoor Recreation CHELSEA ROAD PARKS AND RECREATION PARK Open Space & Outdoor Recreation VICTORY BOULEVARD MID ISLAND LITTLE LEA M1 1 Open Space & Outdoor Recreation BLOOMFIELD ROAD PARKS DEPARTMENT PARK Open Space & Outdoor Recreation TRAVIS AVENUE PARKS AND RECREATION PARK Open Space & Outdoor Recreation TRAVIS AVENUE PARKS AND RECREATION PARK Open Space & Outdoor Recreation GULF AVENUE PARKS AND RECREATION PARK Open Space & Outdoor Recreation LATIMER AVENUE MID ISLAND L LEAGUE M1 1 Open Space & Outdoor Recreation ARTHUR KILL ROAD SANITATION R3 2 Open Space & Outdoor Recreation SPENCER STREET NEW HYLAN REALTY, LLC M3 1 Parking Facilities A 26A ALBERTA AVENUE MICHAEL L. SCOZZARI R3A Parking Facilities CHELSEA ROAD EMERSON INVESTORS, LL M3 1 Parking Facilities VICTORY BOULEVARD VICTORY & TRAVIS LLC M1 1 Parking Facilities VICTORY BOULEVARD NICHOLAS OLIVIERI M2 1 Parking Facilities ROSWELL AVENUE T.E.S. DEVELOPMENT CO R3A Parking Facilities SPENCER STREET 934 CRESCENT STREET, M3 1 Parking Facilities MEREDITH AVENUE HELEN DECKER M3 1 Parking Facilities Green Zone Parcel Registry, Working Version 26 of 33
105 General Site Information SIEDC Green Zone Consultant Services Property Parcel Registry Living Document (2.1) Zoning & Land Use Designations Coordinates Block Lot Community District Census Tract Census Block Street Address Owner Name Zoning Land Use X Y VICTORY BOULEVARD ANVAN IND LTD M1 1 Parking Facilities WILD AVENUE CANDELLA, THOMAS R R3A Parking Facilities BURKE AVENUE PECHERSKI JANE R3A Parking Facilities VICTORY BOULEVARD VICTORY & TRAVIS LLC M1 1 Parking Facilities WATSON AVENUE WATSON AVE HOMEOWNERS R3 2 Parking Facilities VICTORY BOULEVARD RC CHUR ST ANTHONY R3A Public Facilities & Institutions CANNON AVENUE GOLD STAR POST #1365 R3A Public Facilities & Institutions SHELLEY AVENUE RC CHUR ST ANTHONY R3A Public Facilities & Institutions VICTORY BOULEVARD NANSEN PROP INC M1 1 Public Facilities & Institutions B 3730 VICTORY BOULEVARD FIRE DEPARTMENT M1 1 Public Facilities & Institutions BLOOMFIELD AVENUE S I SPORTSMENS CLUB M3 1 Public Facilities & Institutions BLOOMFIELD AVENUE BLOOMFEILD MANAGEMENT M3 1 Public Facilities & Institutions B 3984 VICTORY BOULEVARD THE STATEN ISLAND CHR R3A Public Facilities & Institutions ARTHUR KILL ROAD JEWISH COMMUNITY CENT M1 1 Public Facilities & Institutions VICTORY BOULEVARD BOARD OF EDUCATION R3A Public Facilities & Institutions B 4010 VICTORY BOULEVARD OCEANIC HOOK & LADDER R3A Public Facilities & Institutions RICHMOND AVENUE SANITATION R3 2 Transportation & Utility FELDMEYERS LANE S I CABLE M2 1 Transportation & Utility BLOOMFIELD AVENUE DEPARTMENT OF BUSINES M3 1 Transportation & Utility VICTORY BOULEVARD ARTHUR KILL POWER LLC M3 1 Transportation & Utility VICTORY BOULEVARD AVA LAND DEVELOPMENT M1 1 Transportation & Utility WESTERN AVENUE DEPARTMENT OF BUSINES M3 1 Transportation & Utility WILD AVENUE M3 1 Transportation & Utility FOREST AVENUE HUMBLE OIL M3 1 Transportation & Utility MEREDITH AVENUE NEW HYLAN REALTY, LLC M3 1 Transportation & Utility VICTORY BOULEVARD ARTHUR KILL POWER LLC M3 1 Transportation & Utility VICTORY BOULEVARD NEW YORK TELEPHONE CO M1 1 Transportation & Utility RIVER ROAD DEPARTMENT OF BUSINES M3 1 Transportation & Utility BLOOMFIELD ROAD DEPARTMENT OF BUSINES M3 1 Transportation & Utility BLOOMFIELD AVENUE SITESTAR INC M2 1 Transportation & Utility ng Fac CANNON AVENUE DEPT RE CITY OF NY M1 1 Transportation & Utility CHELSEA ROAD M3 1 Transportation & Utility MEREDITH AVENUE DEPARTMENT OF BUSINES M2 1 Transportation & Utility BLOOMFIELD ROAD DE SANTIS, HELEN M3 1 Transportation & Utility CHELSEA ROAD DEPARTMENT OF BUSINES M2 1 Transportation & Utility VICTORY BOULEVARD M3 1 Transportation & Utility TRAVIS AVENUE DEPARTMENT OF BUSINES C4 3 Transportation & Utility GULF AVENUE KEYSPAN ENERGY M2 1 Transportation & Utility VICTORY BOULEVARD AVA LAND DEVELOPMENT M1 1 Transportation & Utility BLOOMFIELD ROAD DEPARTMENT OF BUSINES M3 1 Transportation & Utility WEST SHORE EXPWY SANITATION M1 1 Transportation & Utility BLOOMFIELD AVENUE S DIFAZIO & SONS CONS M3 1 Transportation & Utility TRAVIS AVENUE DEPT OF GENERAL SERVI M1 1 Transportation & Utility SPENCER STREET SPEHCER MARINE,LLC M3 1 Transportation & Utility Green Zone Parcel Registry, Working Version 27 of 33
106 General Site Information SIEDC Green Zone Consultant Services Property Parcel Registry Living Document (2.1) Zoning & Land Use Designations Coordinates Block Lot Community District Census Tract Census Block Street Address Owner Name Zoning Land Use X Y CHELSEA ROAD KENNETH POESL (PIERS) M3 1 Transportation & Utility B 1550 ARTHUR KILL ROAD 1550 WEST SERVICE ROA M2 1 Transportation & Utility WEST SERVICE ROAD JOSEPH FORMICA M2 1 Transportation & Utility B 1540 ARTHUR KILL ROAD SANITATION M3 1 Transportation & Utility CANNON AVENUE DEPARTMENT OF BUSINES M2 1 Transportation & Utility ARTHUR KILL ROAD SUNOCO CO R3 2 Transportation & Utility ARDEN AVENUE SANITATION R3 2 Transportation & Utility ARTHUR KILL ROAD DEPT OF GENERAL SERVI M1 1 Transportation & Utility WEST SERVICE ROAD SANITATION M1 1 Transportation & Utility ARTHUR KILL ROAD TOMLEN REALTY CORP M1 1 Transportation & Utility B 1951 ARTHUR KILL ROAD DEPT OF GENERAL SERVI R3 2 Transportation & Utility ARTHUR KILL ROAD SHELL OIL CORP M1 1 Transportation & Utility DEAN AVENUE SANITATION M1 1 Vacant Land WEST SERVICE ROAD VALENCIA DEVELOPERS M2 1 Vacant Land OLD PLACE PEOPLE OF THE STATE O M2 1 Vacant Land CHURCH AVENUE EVERGREEN MANOR HOMEO R3A Vacant Land GULF AVENUE PEOPLE OF THE STATE O M2 1 Vacant Land WASHINGTON AVENUE JOHN STOCKTON M3 1 Vacant Land BLOOMFIELD ROAD OFFICE OF ECONOMIC DE M3 1 Vacant Land WAKEFIELD AVENUE PEOPLE STATE OF NEW Y M1 1 Vacant Land FOREST AVENUE JOHN DILEO M2 1 Vacant Land CARTLEDGE AVENUE RS WILD AVENUE LLC M1 1 Vacant Land CANNON AVENUE PARKS AND RECREATION M2 1 Vacant Land SOUTH AVENUE TELEPORT 1 M1 1 Vacant Land CANNON AVENUE RED HEAD BUILDING COR M1 1 Vacant Land BLOOMFIELD AVENUE GATX SI INC M3 1 Vacant Land GULF AVENUE PARKS AND RECREATION M2 1 Vacant Land SOUTH AVENUE PORT AUTHORITY OF NY M1 1 Vacant Land VICTORY BOULEVARD PETER WOLNY R3A Vacant Land BLOOMFIELD ROAD HCC DEV INC M3 1 Vacant Land GULF AVENUE PEOPLE OF THE STATE O M3 1 Vacant Land SOUTH AVENUE VANBRO CORPORATON M3 1 Vacant Land ROSWELL AVENUE FULTON FIREHOUSE CORP R3A Vacant Land CANNON AVENUE CANNON GROUP NETWORK, M1 1 Vacant Land VICTORY BOULEVARD MISTLER, ANDREW M3 1 Vacant Land SOUTH AVENUE BLOOMFIELD CONSERVANC M1 1 Vacant Land INDUSTRY ROAD DEPT OF GENERAL SERVI M3 1 Vacant Land VICTORY BOULEVARD OFFICE OF ECONOMIC DE M2 1 Vacant Land OLD PLACE PEOPLE OF THE STATE O M3 1 Vacant Land BLOOMFIELD AVENUE PARKS AND RECREATION M3 1 Vacant Land BLOOMFIELD AVENUE DE SANTIS, HELEN M3 1 Vacant Land WEST SHORE EXPWY NICOTRA HOTEL I HOLDI M1 1 Vacant Land FOREST AVENUE DEPARTMENT OF BUSINES M3 1 Vacant Land VICTORY BOULEVARD VICTORY SIMON HOLDING M1 1 Vacant Land Green Zone Parcel Registry, Working Version 28 of 33
107 General Site Information SIEDC Green Zone Consultant Services Property Parcel Registry Living Document (2.1) Zoning & Land Use Designations Coordinates Block Lot Community District Census Tract Census Block Street Address Owner Name Zoning Land Use X Y B ROSWELL AVENUE EMELIA VELEZ R3A Vacant Land GULF AVENUE PEOPLE OF THE STATE O M2 1 Vacant Land VICTORY BOULEVARD VICTORY SIMON HOLDING M1 1 Vacant Land BLOOMFIELD AVENUE DE SANTIS, HELEN M3 1 Vacant Land BERESFORD AVENUE BELAIR RIDGE DEVELOPM M1 1 Vacant Land MEREDITH AVENUE ECONOMIC DEVELOPMENT C4 3 Vacant Land SOUTH AVENUE TELEPORT 1 M1 1 Vacant Land RIVER ROAD PARKS AND RECREATION M3 1 Vacant Land BLOOMFIELD AVENUE NYC ECONOMIC DEV CORP M3 1 Vacant Land VICTORY BOULEVARD MAHNKEN, JOHN R3A Vacant Land VICTORY BOULEVARD JOHN J GADOMSKI R3A Vacant Land BLOOMFIELD AVENUE RONALD FANELLI M3 1 Vacant Land TRAVIS AVENUE PARKS AND RECREATION M1 1 Vacant Land WEST SHORE PARKWAY DCAS C4 3 Vacant Land SOUTH AVENUE TELEPORT 1 M1 1 Vacant Land SOUTH AVENUE TELEPORT 1 M1 1 Vacant Land SOUTH AVENUE TELEPORT 1 M1 1 Vacant Land A SOUTH AVENUE BLOOMFIELD CONSERVANC M1 1 Vacant Land BLOOMFIELD AVENUE I C LAND, LLC M3 1 Vacant Land GULF AVENUE CHRISTOFFERSEN ALAN M2 1 Vacant Land BLOOMFIELD AVENUE SOUTH SHORE ENTERPRIS M3 1 Vacant Land MEREDITH AVENUE SAM & FRANK MEZZACAPP M3 1 Vacant Land BURKE AVENUE ANTHONY R CONTI R3A Vacant Land VICTORY BOULEVARD N BLANCHARD R3A Vacant Land BLOOMFIELD ROAD ECONOMIC DEVELOPMENT M3 1 Vacant Land WILD AVENUE HELEN DICKSON JERLIN R3A Vacant Land VICTORY BOULEVARD DOROTHY PARADZINSKI R3A Vacant Land FOREST AVENUE DEPT RE CITY OF NY M2 1 Vacant Land VICTORY BOULEVARD ANNE T. DIBENEDETTO R3A Vacant Land WASHINGTON AVENUE PORT OF NY AUTH M3 1 Vacant Land BLOOMFIELD AVENUE NEW YORK CITY TRANSIT M2 1 Vacant Land LAMBERTS LANE FARR PROPERTIES LLC R3 2 Vacant Land GULF AVENUE LIQUORI, FRANK M2 1 Vacant Land DEAN AVENUE SANITATION R3 2 Vacant Land B ROSWELL AVENUE R3A Vacant Land BLOOMFIELD AVENUE PARKS AND RECREATION M3 1 Vacant Land SOUTH AVENUE TELEPORT 1 M1 1 Vacant Land ng Fac 502 LAMBERTS LANE CITY OF NEW YORK M2 1 Vacant Land FOREST AVENUE PORT OF NY AUTH M3 1 Vacant Land MEREDITH AVENUE VICTORY SIMON HOLDING R3A Vacant Land BLOOMFIELD ROAD DEPT OF ENVIRONMENTAL M3 1 Vacant Land WESTERN AVENUE PORT OF NY AUTH M3 1 Vacant Land MEREDITH AVENUE VICTORY SIMON HOLDING R3A Vacant Land GULF AVENUE PEOPLE OF THE STATE O M3 1 Vacant Land Green Zone Parcel Registry, Working Version 29 of 33
108 General Site Information SIEDC Green Zone Consultant Services Property Parcel Registry Living Document (2.1) Zoning & Land Use Designations Coordinates Block Lot Community District Census Tract Census Block Street Address Owner Name Zoning Land Use X Y GULF AVENUE DEPARTMENT OF BUSINES M2 1 Vacant Land WILD AVENUE JOHN DE PIETRO M1 1 Vacant Land CANNON AVENUE EDWARD V MATUSIAK R3A Vacant Land VICTORY BOULEVARD PARKS AND RECREATION R3A Vacant Land BLOOMFIELD ROAD PARKS AND RECREATION M3 1 Vacant Land MEREDITH AVENUE ECONOMIC DEVELOPMENT C4 3 Vacant Land GULF AVENUE DEPT OF TRANSPORTATIO M2 1 Vacant Land OLD PLACE DEPARTMENT OF BUSINES M3 1 Vacant Land WILD AVENUE JAMES E BRAHN M3 1 Vacant Land B BURKE AVENUE MICHAEL ARPAIA R3A Vacant Land GULF AVENUE PEOPLE OF THE STATE O M2 1 Vacant Land GLEN STREET PARKS AND RECREATION M1 1 Vacant Land CHELSEA ROAD M & M GROUP, LLC. M3 1 Vacant Land SOUTH AVENUE M1 1 Vacant Land TRAVIS AVENUE FRANK BARNARD JR M1 1 Vacant Land FOREST AVENUE DEPARTMENT OF BUSINES M3 1 Vacant Land RIDGEWAY AVENUE MEADOW VIEW 1, LLC M1 1 Vacant Land VICTORY BOULEVARD DEPT OF TRANSPORTATIO M2 1 Vacant Land RIDGEWAY AVENUE PARKS AND RECREATION M1 1 Vacant Land BARON BOULEVARD HOKE, ROBERT J M1 1 Vacant Land CARTLEDGE AVENUE RS WILD AVENUE LLC M1 1 Vacant Land VICTORY BOULEVARD JOHN J GADOMSKI R3A Vacant Land WEST SHORE PARKWAY DEPT OF TRANSPORTATIO M3 1 Vacant Land B ROSWELL AVENUE ELASSAD ROBERT R3A Vacant Land GULF AVENUE 380 DEVELOPMENT LLC M2 1 Vacant Land SHELLEY AVENUE KEVIN TELLEFSEN R3A Vacant Land BLOOMFIELD AVENUE PARKS AND RECREATION M3 1 Vacant Land BLOOMFIELD ROAD ECONOMIC DEVELOPMENT M3 1 Vacant Land GULF AVENUE RAMAKRISHNA CHERUKURI M2 1 Vacant Land SOUTH AVENUE TELEPORT 1 M1 1 Vacant Land FELDMEYERS LANE EDWARD ZDANOWICZ JR M2 1 Vacant Land SOUTH AVENUE TELEPORT 1 M1 1 Vacant Land FOREST AVENUE 380 DEVELOPMENT LLC M3 1 Vacant Land VICTORY BOULEVARD CHUR ST ANTHONY R3A Vacant Land VICTORY BOULEVARD OFFICE OF ECONOMIC DE M2 1 Vacant Land BLOOMFIELD AVENUE PARKS AND RECREATION M3 1 Vacant Land BURKE AVENUE MICHAEL CONNERS R3A Vacant Land SHELLEY AVENUE JOSEPH S KORENSKI R3A Vacant Land VICTORY BOULEVARD M3 1 Vacant Land BLOOMFIELD ROAD HCC DEV INC M3 1 Vacant Land BLOOMFIELD AVENUE SOUTH SHORE ENTERPRIS M3 1 Vacant Land SOUTH AVENUE TELEPORT 1 M1 1 Vacant Land SOUTH AVENUE TELEPORT 1 M1 1 Vacant Land WILD AVENUE D & M RICHMOND REALTY M2 1 Vacant Land Green Zone Parcel Registry, Working Version 30 of 33
109 General Site Information SIEDC Green Zone Consultant Services Property Parcel Registry Living Document (2.1) Zoning & Land Use Designations Coordinates Block Lot Community District Census Tract Census Block Street Address Owner Name Zoning Land Use X Y GULF AVENUE SUZANNE SHAUGHNESSY M2 1 Vacant Land RIVINGTON AVENUE PEOPLE OF THE STATE O M2 1 Vacant Land VICTORY BOULEVARD MAZZA GAETANO O R3A Vacant Land FOREST AVENUE DEPARTMENT OF BUSINES M3 1 Vacant Land BURKE AVENUE MICHAEL CONNERS R3A Vacant Land BLOOMFIELD AVENUE DEPT OF GENERAL SERVI M3 1 Vacant Land GULF AVENUE PEOPLE OF THE STATE O M2 1 Vacant Land BLOOMFIELD AVENUE PARKS AND RECREATION M3 1 Vacant Land BLOOMFIELD ROAD A C EQUIPMENT M3 1 Vacant Land BLOOMFIELD AVENUE PARKS AND RECREATION M3 1 Vacant Land HUGHES AVENUE PARKS AND RECREATION M3 1 Vacant Land MEREDITH AVENUE BARRETT JOHN R3A Vacant Land WEST SHORE EXPWY SANITATION M3 1 Vacant Land SIMMONS LANE GUIDO PASSARELLI M1 1 Vacant Land BLOOMFIELD AVENUE CHELSEA ROAD REALTY, M3 1 Vacant Land GULF AVENUE DEPT OF TRANSPORTATIO M2 1 Vacant Land GLEN STREET M1 1 Vacant Land BLOOMFIELD AVENUE GATX SI INC M3 1 Vacant Land SOUTH AVENUE TELEPORT 1 M1 1 Vacant Land RIVER ROAD 380 DEVELOPMENT LLC M3 1 Vacant Land BLOOMFIELD ROAD PARKS AND RECREATION M3 1 Vacant Land WEST SERVICE ROAD VALENCIA DEVELOPERS A M3 1 Vacant Land SOUTH AVENUE TELEPORT 1 M1 1 Vacant Land PRICES LANE CHAUDHURY, NAFASAT A R3 2 Vacant Land VICTORY BOULEVARD PARKS AND RECREATION M1 1 Vacant Land VICTORY BOULEVARD PARKS AND RECREATION M2 1 Vacant Land BARON BOULEVARD SETTINIERI JOHN M1 1 Vacant Land BLOOMFIELD ROAD GATX SI INC M3 1 Vacant Land GULF AVENUE PEOPLE OF THE STATE O M3 1 Vacant Land INDUSTRY ROAD 501 INDUSTRY ROAD LLC M3 1 Vacant Land GULF AVENUE PEOPLE OF THE STATE O M2 1 Vacant Land RICHMOND AVENUE SANITATION R3 2 Vacant Land VICTORY BOULEVARD VICTORY AND WILD LLC M3 1 Vacant Land EDWARD CURRY AVENUE DEGARLIA HOLDINGS LLC M3 1 Vacant Land MEREDITH AVENUE PARKS AND RECREATION M1 1 Vacant Land SOUTH AVENUE NYC PUB DEV CORP M1 1 Vacant Land CANNON AVENUE OFFICE OF ECONOMIC DE M2 1 Vacant Land MEREDITH AVENUE ANTHONY BRUNO M3 1 Vacant Land VICTORY BOULEVARD PARKS AND RECREATION R3A Vacant Land VICTORY BOULEVARD DRES M1 1 Vacant Land WASHINGTON AVENUE PORT OF NY AUTH M3 1 Vacant Land MEREDITH AVENUE J&A BRUNO LLC M3 1 Vacant Land CANNON AVENUE HAYNBERG SVEN M1 1 Vacant Land SOUTH AVENUE TELEPORT 1 M1 1 Vacant Land Green Zone Parcel Registry, Working Version 31 of 33
110 General Site Information SIEDC Green Zone Consultant Services Property Parcel Registry Living Document (2.1) Zoning & Land Use Designations Coordinates Block Lot Community District Census Tract Census Block Street Address Owner Name Zoning Land Use X Y BURKE AVENUE JOHN V HOPE R3A Vacant Land GULF AVENUE PARKS AND RECREATION M2 1 Vacant Land B ROSWELL AVENUE EMELIA VELEZ R3A Vacant Land B VICTORY BOULEVARD ACADIA WEST SHORE EXP R3A Vacant Land OLD PLACE DEPARTMENT OF BUSINES M3 1 Vacant Land TRAVIS AVENUE PARKS AND RECREATION M1 1 Vacant Land GULF AVENUE PEOPLE OF THE STATE O M2 1 Vacant Land GULF AVENUE PEOPLE OF THE STATE O M3 1 Vacant Land GULF AVENUE SINGH SATNAM M2 1 Vacant Land WAKEFIELD AVENUE ROBERT HOKE C/O PAUL M1 1 Vacant Land BLOOMFIELD ROAD PARKS AND RECREATION M3 1 Vacant Land BLOOMFIELD AVENUE PARKS AND RECREATION M3 1 Vacant Land BLOOMFIELD AVENUE SOUTH SHORE ENTERPRIS M3 1 Vacant Land BLOOMFIELD AVENUE ADDWEL LLC M2 1 Vacant Land VICTORY BOULEVARD JOHN J GADOMSKI R3A Vacant Land GLEN STREET JOSEPH DESISTO R3A Vacant Land RICHMOND AVENUE SANITATION R3 2 Vacant Land GULF AVENUE PEOPLE OF THE STATE O M3 1 Vacant Land VICTORY BOULEVARD VALENCIA DEVELOPERS A M3 1 Vacant Land BLOOMFIELD AVENUE DE SANTIS, HELEN M3 1 Vacant Land TRAVIS AVENUE DEPT OF TRANSPORTATIO M1 1 Vacant Land VICTORY BOULEVARD N BLANCHARD R3A Vacant Land GLEN STREET PARKS AND RECREATION M1 1 Vacant Land VICTORY BOULEVARD FRANK COLUCCIO R3A Vacant Land SHELLEY AVENUE JAMES D THOMPSON R3A Vacant Land MEREDITH AVENUE VICTORY SIMON HOLDING R3A Vacant Land WASHINGTON AVENUE PORT OF NY AUTH M3 1 Vacant Land BARON BOULEVARD HOKE ROBERT J M1 1 Vacant Land ARTHUR KILL ROAD IMTT PIPELINE M3 1 Vacant Land CANNON AVENUE R3A Vacant Land FOREST AVENUE PORT OF NY AUTH M2 1 Vacant Land MEREDITH AVENUE DCAS C4 3 Vacant Land DEAN AVENUE SANITATION R3 2 Vacant Land LATIMER AVENUE ECONOMIC DEVELOPMENT M1 1 Vacant Land ROSWELL AVENUE GLM DEVELOPMENT CORP. R3A Vacant Land VICTORY BOULEVARD 4384 VICTORY LLC M3 1 Vacant Land BLOOMFIELD AVENUE PARKS AND RECREATION M3 1 Vacant Land TRAVIS AVENUE PARKS AND RECREATION M1 1 Vacant Land GLEN STREET PARKS AND RECREATION M1 1 Vacant Land ALBERTA AVENUE DESMOND VAN PELT R3A Vacant Land WEST SHORE EXPWY SHOPS AT THE GARDENS M1 1 Vacant Land TEMPLE COURT TEMPLE COURT HOMEOWNE R3A Vacant Land FELDMEYERS LANE EDKINS REGINA M2 1 Vacant Land SOUTH AVENUE TELEPORT 1 M1 1 Vacant Land Green Zone Parcel Registry, Working Version 32 of 33
111 General Site Information SIEDC Green Zone Consultant Services Property Parcel Registry Living Document (2.1) Zoning & Land Use Designations Coordinates Block Lot Community District Census Tract Census Block Street Address Owner Name Zoning Land Use X Y GULF AVENUE PEOPLE OF THE STATE O M2 1 Vacant Land BLOOMFIELD ROAD ECONOMIC DEVELOPMENT M3 1 Vacant Land BLOOMFIELD ROAD HCC DEV INC M3 1 Vacant Land CHELSEA ROAD ECONOMIC DEVELOPMENT C4 3 Vacant Land SOUTH AVENUE PARKS AND RECREATION M1 1 Vacant Land WILD AVENUE VALENCIA DEVELOPERS A M3 1 Vacant Land CHURCH AVENUE EVERGREEN MANOR HOMEO R3A Vacant Land BLOOMFIELD AVENUE DEPT OF GENERAL SERVI M3 1 Vacant Land ARTHUR KILL ROAD SANITATION R3 2 Vacant Land ARTHUR KILL ROAD N Y S R3 2 Vacant Land ARTHUR KILL ROAD PARKS AND RECREATION M1 1 Vacant Land ARDEN AVENUE SANITATION R3 2 Vacant Land WEST SERVICE ROAD CITY OF NEW YORK M2 1 Vacant Land DEAN AVENUE SANITATION M1 1 Vacant Land ARTHUR KILL ROAD SANITATION M1 1 Vacant Land ARTHUR KILL ROAD JOHN PETER PROPERTIES M1 1 Vacant Land ARTHUR KILL ROAD DEPT OF TRANSPORTATIO R3 2 Vacant Land GULF AVENUE PEOPLE OF THE STATE O M2 1 Vacant Land B BERESFORD AVENUE RCLS PROPERTY MANAGEM M1 1 Vacant Land RIVER ROAD PARKS AND RECREATION M3 1 Vacant Land WILD AVENUE HL LAND CORP M CHELSEA ROAD RONALD FANELLI M SPENCER STREET BLOCK 1802 REALTY, L M Green Zone Parcel Registry, Working Version 33 of 33
112 Task 2.2 Base Mapping One of the critical baseline tasks of the SIEDC green zone initiative is to develop accurate baseline data for use by the SIEDC in multiple formats. To that end, our team has created base maps depicting conditions in the zone using readily available data sets provided by the City of New York and other regional data sources. This information catalogues existing conditions in the areas of: Zoning Land use Fresh water wetlands Tidal wetlands Park properties Superfund sites Spill sites Regulated Facilities and Storage Sites Sites with other contamination As the project progresses, this baseline data will be enhanced with economic data, energy and waste usage data and other data inputs deemed important to the study effort. This information, while developed in GIS for mapping purposes, will be connected to the parcel registry so that SIEDC will be connected to a living database of information for development sites that they will be able to utilize in the future to assist with marketing. One specific request that we will be producing as part of Task 3 green zone properties task, will be to evaluate the factors and conditions affecting sites and to develop a Relative Development Potential map that categorizes the conditions affecting sites and provides a physical depiction of the green zone from a developability perspective. This mapping exercise will be conducted in concert with SIEDC staff and the green zone steering committee. Another specific action that will come out of the base map information will be a physical infrastructure map, identifying major planned infrastructure improvements and detailing their relationship and possible impact upon the green zone. Ultimately, the SIEDC is looking to take control of the data compiled through this process and to be able to utilize this information and build upon this database through its own GIS capabilities. Our team will be working with the SIEDC to determine the best approach to importing this information to SIEDC and structuring how to physically map and show the data Proposed Zoning Recommendations within the Green Zone 2.3 Green Zone Zoning Analysis 1


113 278 Goethals Bridge Western Ave South Ave Forest Ave Richmond Ter Bayonne Bridge UV 440 Port Richmond Ave Jewett Ave Cas tleton Ave Clove Rd 95 Union Gulf Ave Goethals Rd Lamberts Ln Richmond Ave Willowbrook Pky Willow Rd Willowbrook Rd Watchogue Rd YW Victory Blvd 278 Gannon Ave Bradley Ave Perry Ave Middlesex YW YW YW YW YWYW West Shore Expy YW YW Travis Ave YW YW Richmond Hill Rd Rockland Ave Forest Hill Rd Brielle Ave Manor Rd Richmond Rd Arthur Kill Rd Guyon Ave UV 440 Huguenot Ave YW Arden Ave UV 909 Giffords Ln Amboy Rd Hylan Blvd Green Zone Area: Sites of Potential Environmental Concern Green Zone Boundary r Chemical Bulk Storage YW Petro Spill po Major Oil Storage Facility State Superfund Program Class 2 cg po Petroleum Bulk Storage Designated 0 2,500 5,000 Feet ± Regulated Facilites DEC Freshwater Wetlands Tidal Wetlands Source Data: Park Land NYC DOITT, NYS DEC NYC DCP Pluto, ESRI Base Maps


114 West Shore Expy 278 Goethals Bridge Western Ave South Ave Forest Ave UV 440 Richmond Ter Bayonne Bridge UV440 Victory Blvd Port Richmond Ave Jewett Ave Cas tleton Ave Clove Rd 95 Union Gulf Ave Goethals Rd Lamberts Ln Richmond Ave Willowbrook Pky Willow Rd Willowbrook Rd Watchogue Rd Victory Blvd 278 Gannon Ave Bradley Ave Perry Ave Travis Ave Rockland Ave Brielle Ave Manor Rd Richmond Hill Rd Middlesex Forest Hill Rd Richmond Rd Arthur Kill Rd Guyon Ave UV 440 Huguenot Ave Arden Ave UV 909 Giffords Ln Amboy Rd Hylan Blvd Green Zone Area: Zoning Green Zone Boundary Commerical Overlay Zoning Slated to be rezoned Park C1-2 C2-1 R3-2 R3A M1-1 M2-1 M3-1 C4-1 C ,500 5,000 PARK Feet ± Source Data: C8-1 NYC DOITT, NYS DEC NYC DCP Pluto, ESRI Base Maps


115 West Shore Expy 278 Goethals Bridge Western Ave South Ave Forest Ave UV 440 Richmond Ter Bayonne Bridge UV440 Victory Blvd Port Richmond Ave Jewett Ave Cas tleton Ave Clove Rd 95 Union Gulf Ave Goethals Rd Lamberts Ln Richmond Ave Willowbrook Pky Willow Rd Willowbrook Rd Watchogue Rd Victory Blvd 278 Gannon Ave Bradley Ave Perry Ave Travis Ave Rockland Ave Brielle Ave Manor Rd Richmond Hill Rd Middlesex Forest Hill Rd Richmond Rd Arthur Kill Rd Guyon Ave UV 440 Huguenot Ave Arden Ave UV 909 Giffords Ln Amboy Rd Hylan Blvd Green Zone Area: Landuse Green Zone Boundary Unknown One & Two Family Multi-Family Buildings Multi-Family Elevator Buildings Mixed Residential & Commercial Commercial & Office Buildings Industrial & Manufacturing Transportation & Utility Public Facilities & Institutions Open Space/Park Parking Facilities 0 2,500 5,000 Vacant Feet ± Source Data: NYC DOITT, NYS DEC NYC DCP Pluto, ESRI Base Maps


116 West Shore Expy 278 Goethals Bridge Western Ave South Ave Forest Ave Richmond Ter Bayonne Bridge UV 440 Port Richmond Ave Jewett Ave Cas tleton Ave Clove Rd 95 Union Gulf Ave Goethals Rd Lamberts Ln Richmond Ave Willowbrook Pky Willow Rd Willowbrook Rd Watchogue Rd Victory Blvd 278 Gannon Ave Bradley Ave Perry Ave Travis Ave Rockland Ave Brielle Ave Manor Rd Richmond Hill Rd Middlesex Forest Hill Rd Richmond Rd UV 440 Huguenot Ave Arden Ave Arthur Kill Rd UV 909 Giffords Ln Amboy Rd Hylan Blvd Guyon Ave Staten Island Passenger Rail Green Zone Area: 0 2,500 5,000 Parks and Wetlands Green Zone Boundary DEC Freshwater Wetlands Tidal Wetlands Designated Park Land Feet ± Source Data: NYC DOITT, NYS DEC NYC DCP Pluto, ESRI Base Maps
117 Task 2.3 Staten Island Green Zone Zoning Analysis There are no planned or active zoning changes within the green zone boundary or in the neighborhoods immediately surrounding the zone. However, there have been a number of studies in recent years that have produced recommendations for consideration for future zoning strategies both in the zone and in its immediate vicinity. We have compiled the various recommendations that we have been able to research and have provide a synopsis and analysis of the relative impacts of those plans and recommendations as they relate to the goals of the green zone. Proposed Zoning Recommendations within the Green Zone While much of the Green Zone is currently zoned for manufacturing and there are no plans in the works to make any adjustments to that condition, the Department of City Planning has identified the lands surrounding the proposed transit hub North of Fresh Kills Park on the West Shore Expressway as a zone that has the potential to accommodate greater diversity and density. Using the transit hub as a catalyst, the Department of City Planning sees an opportunity to expand the size of the corporate office park assembled along both sides of South Avenue across the West Shore Expressway to encompass the lands directly facing the West Shore Expressway southbound service road. While the industrial lands closest to the West Shore Expressway are identified as having the opportunity to increase density and capture opportunity for commercial use, those industrial lands closer to the waterfront continue to be viewed as purely industrial property. It is important to stress that no specific zoning recommendations have been made for the area and that the recommendations put forth are based upon the opportunity to rethink current land uses based upon new transit. SIEDC was the agency that first put forth the concept of the West Shore Transit link and has been an advocate and supporter since its first study of the link in Transit-Oriented Development has worked consistently and in many contexts throughout the country and should be a consideration as part of the future growth plan within the Green Zone. The plan for the West Shore Expressway Transit Hub would allow for redevelopment and greater intensity of developments and allow for a mix of compatible development uses in this area. This designation can only help to spur economic activity in and around the Teleport and should be viewed as complementary to the goals of the Green Zone. Zoning Conditions to be Preserved within the Green Zone There are two notable locations within the Green Zone where the Department of City Planning has recommended that current zoning designations remain. The first is the residential neighborhood of Travis that bounds either side of Victory Boulevard north of Fresh Kills Park. The SIEDC has identified the Travis neighborhood as an important community within the Green Zone whose nature should be preserved and maintained as a residential community within the larger Green Zone 2.3 Green Zone Zoning Analysis 1
118 boundary, making the recommendations of the Department of City Planning and SIEDC consistent concerning the residential community of Travis. SIEDC and DCP are also in agreement about the far end of Victory Boulevard, a heavy manufacturing zone that houses NRG Energy, Pratt Industries and the DSNY Sanitation facility. The Department of City Planning recommends that this district remain industrial and the SIEDC has identified the location as a key industrial development district within the larger Green Zone. Proposed Zoning Recommendations Surrounding the Green Zone A second transit node for future West Shore Transit is planned for the WSE/Arthur Kill Road corridor in the neighborhood of Rossville. This mixed industrial area could see similar growth catalyzed by mass transit and the Department of City Planning has proposed similar thinking about expanding zoning to allow for greater density and commercial development in portions of the lands surrounding this node. Similar to the transit node to the north, DCP has only identified the portions of a larger industrial corridor that immediately surround the transit hub for diversification of use, while looking to preserve other areas in the Rossville industrial waterfront for industrial use. Zoning Conditions to be Preserved Surrounding the Green Zone In our research of the neighborhoods surrounding the green zone, it should be noted that the Department of City Planning, in the Working West Shore 2030 plan, did note that the Goethals Garden Homes, a residential community that lies just to the north of the Staten Island Expressway should be preserved as a residential community. The SIEDC has considered and rejected an expansion of the zone to the north of I-278 and so any future expansion would not encompass this residential community. There are additional minor recommendations concerning the South Richmond Special District Overly, but none that would materially affect the green zone. Conclusion There are no short-term rezoning actions under consideration at this time. The recommendations and plans for zoning along the West Shore are very preliminary, and there is ample room for further discussions on approach to zoning in and around the proposed transit hubs envisioned for the West Shore, both within and adjacent to the zone. The SIEDC should continue to monitor the planning for West Shore Transit, and through that process should accommodate analysis for the zoning and development strategies that should be undertaken around the transit hubs. 2.3 Green Zone Zoning Analysis 2


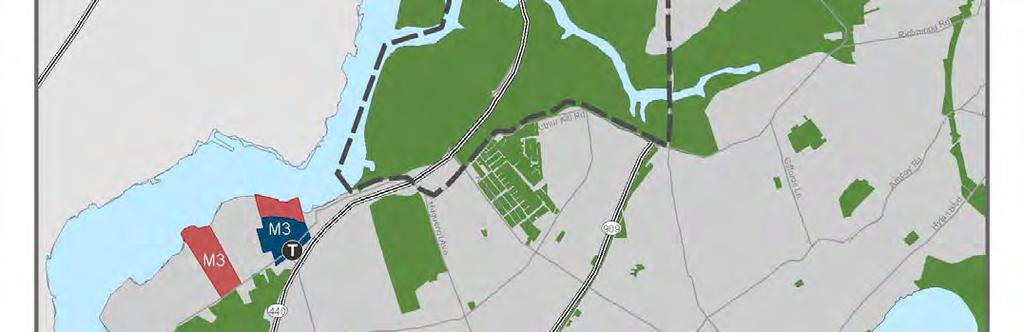

119 2.3 Green Zone Zoning Analysis 3

120 Staten Island Economic Development Corporation February 16, 2012 Page i Task 3 Green Zone Consulting Services Parsons Brinckerhoff CWS Consulting Vita Nuova CWS Consulting Group LLC
121 ii
122 Table of Contents INTRODUCTION... 1 DEFINING THE GREEN ZONE... 1 GREEN BUILDINGS... 3 GREEN BUSINESSES AND JOBS... 4 GREEN LAND... 5 RECOMMENDATIONS... 7 CREATING CLEAN AND GREEN STANDARDS AND INCENTIVES... 8 DETERMINING STANDARDS... 8 CREATING INCENTIVES RECOMMENDATIONS CASE STUDY: A TOOL TO ESTABLISH GREEN BUSINESS INVENTORY OF GREEN BUSINESSES EXISTING COMPANY BASE INTERVIEW GREEN AND CLEAN BUSINESSES MARKET ACCESS LABOR AND OPERATING COSTS REGULATORY UNCERTAINTIES OPPORTUNITIES INDUSTRIES AND SPECIFIC FIRMS THAT WOULD BENEFIT FROM GREEN ZONE INITIAL TARGETS LONGER-TERM TARGETS RECOMMENDATIONS GREEN ZONE MARKETING STRATEGY CONSIDERATIONS GOALS KEY MESSAGES STRATEGIC MARKETING ACTIONS WEBSITE MARKETING PLAN PARTNERSHIP OPPORTUNITIES STATEN ISLAND NEW YORK CITY STATE AND REGIONAL PARTNERSHIPS FEDERAL PRIVATE iii

123 Introduction The Staten Island Economic Development Corporation (SIEDC) is looking to attract new companies to its Green Zone along the Western Shore of Staten Island through targeted marketing of industries that could benefit from the assets associated with the location. To accomplish this, the SIEDC is looking to brand the area as a green industrial corridor. Recognizing that this area is already an active industrial district, the SIEDC is looking for ways that existing businesses can also benefit from a Green Zone designation. Task 3 focuses on who we can target to attract to the Green Zone, what incentive packages we can develop to entice business to locate here, what programs can be set up to assist businesses already located in the district, a strategy designed specifically for SIEDC to market the Green Zone to target businesses and a list of targeted industries and firms that SIEDC can reach out to as they connect potential business opportunities to specific sites. Defining the Green Zone Our Green Zone strategy provides opportunities for new and existing businesses to improve upon their green processes, practices and products. The Green Zone strategy is a three-pronged approach that leverages and promotes the strengths of the district while addressing the challenges of locating a business on Staten Island. This approach allows SIEDC to use the Green Zone designation as a business retention and expansion, as well as attraction strategy for a wide range of businesses and industries. This includes businesses that are green as well as those that want to become green. The Menomonee Valley Partnership (MVP), as presented in our Best Practices Report (Task 1) developed a creative and highly effective approach in order to push a green initiative for their district. Recognizing that they had a large amount of underdeveloped land and publicly-owned land and significant wetland conditions, they structured a business growth strategy by setting green standards for industrial development within their zone. The MVP became stewards of several publicly owned lots as well as select catalytic sites that they purchased. Through that process (often taking several years) and as a condition for redevelopment, they placed green restrictions on the development that could take place on MVP owned sites. The City of Milwaukee partnered with MVP and placed the same green restrictions on any City owned site that was put up for sale. They worked with local agencies to prepare the sites to be shovel ready. Because risk was reduced and sites were marketed effectively, developers were eager to build and did not see the restrictions as a roadblock to development. These sites led the way and actually served to attract additional interest. Within a few years, most of the private owners in the zone have voluntarily adopted the restrictions as part of their redevelopment mandate, helping to brand the zone as a green development zone. As part of MVP s vision, they have created a list of available funds and financing opportunities as well as a list of tax incentives that they share with their companies and prospective companies. 1
124 To be successful like Menomonee Valley, the Green Zone needs to offer a variety of programs and incentives to businesses employing sustainable practices in the production of goods and services. Businesses located within the Green Zone gain a competitive advantage through synergistic collaborations, cost saving technologies, access to subsidies, and innovative marketing while being centrally located within one of the largest consumer and industrial markets in the world. Our goal for defining the Zone is to provide a number of means towards becoming green. Given the fact that companies operate in very different structures, we are looking to a formula that allows companies to approach this as an opportunity through multiple potential business practices. Our programs can be categorized by three overlapping categories: Green Buildings Green Businesses and Jobs Green Land This breakdown attempts to provide a user-friendly approach to navigate the multitude of possible incentives available to businesses using non-jargon language. For example, a property owner may not seek advice from the SIEDC to develop green approaches to stormwater runoff management specifically, but they may ask SIEDC with help preventing flooding on their property. The Green Zone can then point the way to achieving both. This approach also attempts to overcome the barriers that business and property owners face when looking for incentives that may be right for them. One result of our research is that incentives are not being fully taken advantage of because there is no one-stop-shop for incentive information; the point of entry for information is confusing; there is a lack of interest in connecting to government as a business owner, especially for industrial business owners; and, there is a recognition of significant time and paperwork associated with incentives. Recommendation There is a role here for SIEDC to become a technical advisor for businesses on Staten Island, in the Green Zone, or looking to relocate to either, and convert many of these barriers to opportunities. In each of the following sections Green Buildings, Green Jobs, and Green Land we provided examples of incentives. A sortable matrix outlining the funder, a description of the incentive, eligible entities (i.e., government, quasi-government, not-for-profit, or developer), the incentive type (i.e., loan, grant, tax credit, etc.), and eligible activities (i.e., remediation, assessment, planning, insurance, etc.) is provided in Appendices I and II. This matrix can be used by the SIEDC as a tool when working with existing businesses and to attract new businesses to connect businesses to specific opportunities based upon their needs. 2
125 Green Buildings There are many definitions of a green building, along with rules and regulations that govern certification and maintenance. Traditionally, green buildings have been defined as the practice of creating and using healthier and more energy and resource-efficient models of construction, renovation, operation, maintenance and demolition 1. Nationally, the most well known of the green building certification systems are the EPA's Energy Star for Buildings 2 & Plants and the US Green Build Council's (USGBC) Leadership for Energy and Environmental Design (LEED ) 3. Over the past five years New York City, through local laws and Executives Orders, has created regulations and guidelines regarding new construction and upgrades to existing buildings that range from tracking energy usage in order to reduce emissions, to banning the sale of products that hinder indoor air quality. LEED conformance has often been led by the public sector and on Staten Island, one of the earliest examples of green design was the restoration of the St. George Ferry Terminal, which boasts an 18,500 sf living roof, an energy efficient stratified air conditioning system, daylighting and a number of additional energy efficient design strategies. Building off of this initial project, there are a number of green buildings being planned or recently completed on Staten Island with a variety of uses, including the Staten Island Mental Health Society, which includes geothermal heating and cooling systems, solar roof panels, and porous paving material among other elements; NYPD s 121 st Precinct Station House; the Staten Island Courthouse in St. George, which takes advantage of the morning and afternoon light in its design; and the Homeport Navy Base. Dana Ford Lincoln Mercury (Dana FLM), an auto dealership located within the Green Zone, is currently undergoing an expansion to accommodate Ford vehicles and as such is adopting Ford s environmentally friendly and sustainable initiatives. Some of the key potential efficiency measures being studied for this site are the use of single pane windows in the showroom; the replacement of thermostats with intelligent recovery type thermostats; the addition of weather stripping to exterior doors of showroom; among many other measures. Dana FLM is an example of a business taking advantage of currently available technologies for green buildings. Recommendation The SIEDC can play a strategic role in guiding businesses towards appropriate incentives and in providing technical assistance to help focus in on opportunities. The opportunity to take advantage of funding and incentives to enhance efficiency, improve energy performance, capture stormwater and make additional sustainable improvements to buildings has grown dramatically over the past decade. However, deciphering the incentive opportunities and navigating a course to focus on incentives appropriate to each specific condition can be daunting. The SIEDC can play a strategic role in guiding businesses towards appropriate incentives and in providing technical assistance to help focus in on opportunities. 1 USA EPA: 2 Energy Star: 3 USGBC: 3
126 Examples of existing green building incentives that can be applicable to buildings in the Green Zone include: Con Edison, Energy Audit Program: Provides low-cost, walk-through energy audits to small businesses and other non-residential facilities to help them make informed electrical decisions and identify improvements that yield electric savings. Certified customers of Con Edison with annual electric utility bills less than $75,000 are eligible. IRS, Energy Efficient Commercial Buildings Tax Deduction: A tax deduction of $1.80 per square foot is available to owners of new or existing buildings who install (1) interior lighting, (2) building envelope, or (3) heating, cooling, ventilation, or hot water systems that reduce the building s total energy and power cost by 50%or more in comparison to a building meeting minimum requirements set by ASHRAE Standard NYSDEC, Green Building Tax Credit Program: A New York State tax credit available to owners and tenants of eligible buildings and tenant spaces which meet certain green standards that increase energy efficiency, improve indoor air quality and reduce the environmental impacts of large commercial and residential buildings. For period two (which allows tax credits to be received in years 2006 through 2014), there is a $2 million cap per credit component certificates in aggregate per building. Green Businesses and Jobs Green business and job incentives are for businesses that create green products, or utilize green processes for traditional projects. These businesses and jobs can be broadly clustered in two (overlapping) categories. The first category includes businesses and jobs that are specifically green in their purpose, products and services such as cleantech and environmental restoration ( e.g., a solar panel manufacturer). The second group consists of those businesses and jobs that conscientiously reduce the environmental footprint of their own activities by using integrative design or resource efficiency ( e.g., green product procurement process). The United Nations (UN) has defined Green Jobs as "work in agricultural, manufacturing, research and development (R&D), administrative, and service activities that contribute substantially to preserving or restoring environmental quality. Specifically, but not exclusively, this includes jobs that help to protect ecosystems and biodiversity; reduce energy, materials, and water consumption through high efficiency strategies; de-carbonize the economy; and minimize or altogether avoid generation of all forms of waste and pollution." 4. Examples of existing green business and jobs incentives that are applicable to the Green Zone include: NYSERDA, Business Partners Commercial Lighting Program Incentives: Provides up to $50,000 per Business Partner for effective, energy-efficient lighting projects. A project may be eligible if it is a space between 1,000 and 100,000 square feet and is either: 1) a lighting improvement project in a Commercial Space that meets the Program criteria; or, 2) a design for a lighting project and its installation. IRS, Alternative Fuel Excise Tax Credit: A tax incentive is available for alternative fuel that is sold for use or used as a fuel to operate a motor vehicle. A tax credit in the amount of $0.50 per gallon is available 4 UN Environment Programme, Labor and the Environment Unit, GreenJobs: Towards Decent Work in a Sustainable, Low-Carbon World,

127 for the following alternative fuels: compressed natural gas (based on 121 cubic feet), liquefied natural gas, liquefied petroleum gas, P-Series fuel, liquid fuel derived from coal through the Fischer-Tropsch process, and compressed or liquefied gas derived from biomass. For an entity to be eligible to claim the credit they must be liable for reporting and paying the federal excise tax on the sale or use of the fuel in a motor vehicle. Tax exempt entities such as state and local governments that dispense qualified fuel from an on-site fueling station for use in vehicles qualify for the incentive. Eligible entities must be registered with the Internal Revenue Service (IRS). The incentive must first be taken as a credit against the entity's alternative fuel tax liability; any excess over this fuel tax liability may be claimed as a direct payment from the IRS. NYSERDA, New Construction Program: The New Construction Program (NCP) can provide assistance when incorporating energy-efficiency measures into the design, construction, and operation of new and substantially renovated buildings. These measures are designed to save energy through reduced electric demand, thereby lowering building operating costs. Technical Assistance is available to help evaluate energy-efficiency measures and provide guidance to your design team on incorporating new and emerging energy-efficient technologies into your building. Funding is available to offset the additional costs associated with the purchase and installation of approved equipment. Assistance also may be available for commissioning services and green building opportunities. Green Land Green land programs and incentives are targeted to the land associated with sites by improving the quality of the land and groundwater, and reducing or eliminating the need for traditional infrastructure requirements. Green land initiatives are not as clearly defined as the initiatives associated with green buildings. A number of organizations have begun to develop certification standards for green land including Sustainable Land Development International 5 and the Sustainable Sites Initiatives 6. Within New York City, a number of green land initiatives have already taken form. The New York City Mayor s Office of Environmental Remediation (OER) offers Green Property Certification for brownfield sites that have undergone a remedial investigation and remediation 7. The Staten Island Bluebelt is another example of a green land initiative, which uses natural drainage corridors to handle stormwater, instead of building new sewers. The Staten Island Bluebelt is a storm water management system that covers approximately one third of Staten Island s land area, or close to 5,000 acres concentrated on the south and eastern shores. The program preserves natural drainage corridors, called Bluebelts, including streams, ponds, and other wetland areas. Preservation of these wetland systems allows them to perform their functions of conveying, storing, and filtering storm water. Recommendation The Green Zone should be designated as a Bluebelt area to reduce time and effort for permitting and remove risk from the timetable

128 The Bluebelt program saves tens of millions of dollars in infrastructure costs when compared to providing conventional storm sewers for the same land area. To control storm water discharges, DEP has undertaken a major capital program to build special Bluebelt facilities where the storm sewers end and the natural areas begin. These facilities, known as Best Management Practices or BMPs (two of which are pictured), minimize the negative impacts of storm sewer discharges on those natural areas. These facilities include constructed wetlands, storm water detention ponds, and stream restoration projects. Identifying the Green Zone as Bluebelt would generate significant environmental and economic benefit for the area. As the area is industrial, future sewer systems will prove very costly to construct. Developing acceptable permitting solutions for individual site stormwater management will be costly and time consuming for both private owners and the regulatory entities responsible. By designating the area as a bluebelt, a blanket design approach for all stormwater management within the district can be developed that individual owners and developers will need to conform to. Having clear design standards will reduce time and effort for permitting and remove risk from the development timetable. The public sector will gain from the reduced cost of implementing the bluebelt system in the public realm. The private sector will gain from a lower cost approach to storm water management. The public will gain from increased accessible open space. A more detailed bluebelt plan of action is sited as part of the task 4 deliverable. In addition to the bluebelt concept, there are a number of additional programs that could potentially suit improvements being made by existing and/or future businesses. Examples of existing green land incentives that are applicable to the Green Zone include: NYC Department of Buildings, NYC Green Roof Tax Abatement: Offers building owners property tax abatement equal to $4.50 / square foot up to $100,000 for green roof installations that cover at least 50% of a roof. Applications must be submitted by March 15th for tax abatement to be applied to the current fiscal year s property taxes. NYSERDA, Flexible Technical Assistance: NYSERDA has contracted with engineering firms to offers companies a variety of energy-related technical assistance services. These services are provided on a cost-shared basis and include: engineering feasibility and technical assistance studies; detailed analyses of specific energy projects; process improvement studies; energy operations management; and sustainable design and green building assistance. Certified customers of Con Edison of New York are eligible. New York Power Authority, Green Zones: NYPA also partners with local governments and public universities to develop Green Zones in which traditional, polluting equipment is replaced with clean alternatives - both commercially available and new technologies. The program is targeted for parks, college campuses and other limited access areas. We work with our partners to identify appropriate equipment and provide technical assistance and co-funding to help with purchase and implementation. Participants are asked to provide data on the performance of the new vehicles and equipment and we calculate resulting emissions reductions and fuel savings. 6

129 Recommendations SIEDC can become an invaluable resource for developers, property and business owners within the Green Zone and on Staten Island if they can own, organize, and grow the incentive information presented here and in Appendices II and III. Taking it a step further, SIEDC should build a web-based search tool to assist interested parties in their development planning. Recommendation Create a web-based search tool to help interested parties navigate incentives specific to their needs. The Renewable Energy Permitting Wizard, developed for the Hawaii State Energy Office to help those proposed renewable energy projects better understand the county, state, and federal permits that may be required for their individual project, is a great model for making an often complicated set of processes more user-friendly. This tool has several features which would also benefit SIEDC existing and potential member businesses, such as: real-time display of permit requirements; database of renewable energy permits; user registration allowing save my session functionality; and Federal and State contract resources. 7
130 Creating Clean and Green Standards and Incentives The process of connecting incentives and funding opportunities to businesses for the Green Zone can be a complex task. Often the standards for various programs conflict with each other and there is little information to organize a specific business approach to optimizing incentive opportunities. However, in order to establish the Green Zone and attract private investment as quickly as possible, SIEDC should take advantage of the existing standards and market existing programs as part of the overall Green Zone strategy. A program that SIEDC is in support of and one that could potentially serve as guidance for the Green Zone is the New York State Green Economic Zones Act, introduced in 2011 and currently in the Ways and Means Committee of the New York State Assembly. New York State Green Economic Zones Act As described in the text of the legislation, the Green Economic Zones Act boundary mirrors that of the Green Zone. The Act is aimed at attracting companies that produce green goods and services, or who incorporate green technology into the practice. SIEDC and the State Assembly sponsors of this bill are in agreement on the study area and the main goals of the Act. Recommendation SIEDC should continue its vocal support of the Green Economic Zones Act and build additional support and consensus around its development and job creation benefits. Other anticipated impacts of the Act are detailed below, excerpted from the Memorandum accompanying the legislation: The Green Zone and the initiatives of Green Zone companies will educate local companies and residents about the Green economy. This education and availability of resources will allow for efficiency retrofits, professional support and guidance for companies seeking financial incentives for Green investment, promote Green Collar job retraining options, improve alternative energy development, and attract Green businesses that create sustainable employment opportunities for Islanders. Definitions in Legislation The legislation contains critical language to define how the NY Assembly defines a Green Business, and Green Production Company. Those are featured below. Green Business shall mean a business that primarily operates in one or more of four (4) areas: production, service and repair, research and development and the application and installation of green products and services. A green production company is a company dealing primarily with the manufacturing and distribution of energy efficiency technologies and GHG emission reduction technologies. Green production companies include but are not limited to: bio fuel development, solar panel production/assembly, wind turbine production/assembly, carbon capture and storage mechanism, clean fuel vehicles, renewable energy development, or energy efficiency technologies. Additional green production shall mean in certain cases but not limited to: (1) Greenhouse emission reduction technologies 8
131 (2) The assembly of essential components for a clean-fueled vehicle (3) Energy efficiency technologies Other types of green businesses identified in the legislation include: Renewable Energy Development Green Service and Repair Green Research and Development Green Application and Installation Green Zone Tax Reduction Credit The proposed tax credit as proposed in the legislation would give business owners a chance to claim a 30 percent credit for one year s worth of capital spent. The credit would go into effect in 2013 and would only be allowed to be used once. This proposed tax exemption has the potential to stimulate green economic development and accelerate developing clean tech industries that locate within the zone, allowing lower cost for green products sold in New York City and State, the largest consumer market in the country. This tax exemption can be added to the other incentives and programs some of which are described below. Relationship between Legislation and GZ Standards & Definitions In this report, we have included an inventory of green businesses currently located on Staten Island. This list includes businesses that are not necessarily green by definition, but possess the skills and activity characteristics which could be considered as participating in the green economy. We have also outlined ways for businesses to qualify as green by being considered a green business (or having green jobs ), having a green building or being established on green land. The Green Economic Zones Act tax credit can be applied to two of these categories: green buildings and green businesses/jobs. These definitions were created to establish clear thresholds for green practice and as a basis for establishing a certification program. Green Buildings connects with the legislation s language that states, Businesses that take measurable steps in increasing energy and material efficiency will be the standard-bearers for increased green initiatives throughout the region. That said, opportunities to take advantage of funding and incentives to enhance efficiency, improve energy performance, capture stormwater and make additional sustainable improvements to buildings are numerous and both this legislation and other programs support this. The Memorandum on the legislation provides further justification, adding: This education and availability of resources will allow for efficiency retrofits, and professional support and guidance for companies seeking financial incentives for green investment, promote Green Collar job retraining options, improve alternative energy development, and attract Green businesses that create sustainable employment opportunities for [Staten] Islanders. Green Businesses and Jobs supports businesses that create green products or utilize green processes for traditional products. This categorization goes hand in hand with the proposed legislation language. When we looked at the industries and specific firms that would benefit from the Green Zone, we indentified the following initial targets: Freight Consolidation and Redistribution 9
132 Integrated Logistics Center (Freight Village) Waste to Energy Construction & Demolition Recycling Manufacturing Using Recycled or Repurposed Materials These initial targets include industrial practices that would qualify for the Green Zones tax credit in the legislation. For example, waste to energy is a green practice in and of itself, so it is automatically considered a green business or industry. The same is true of the manufacturing using recycled or repurposed materials industry. Distribution and consolidation (pertaining to both the Freight Consolidation/Redistribution and Integrated Logistics Center industries) of goods could possibly include green goods and so firms that fall into this category may also be qualified for this incentive. Recommendation SIEDC should create stronger partnerships with City and State agencies. The linkages that exist between the Act and the recommendations for the Green Zone will provide an additional rationale for SIEDC s support for this legislation. Determining Standards for the Green Zone As SIEDC markets existing programs to existing and target businesses, customized green zone incentive packages should be created that illustrate eligibility. This can be achieved by applying a set of filters to the lengthy list of incentives (provided in Appendices I and II) to assist in the ongoing and specific targeting of SIEDC resources and outreach efforts. This targeting can also provide the basis for attraction strategies for future marketing and for retention strategies as well. Suggested criteria SIEDC may weigh to reflect its values and priorities for the Green Zone could include the following: Fits "environmental business" targets Uses distinctive local resources Fills empty niche in local economy Fills present or emerging market need Builds on indigenous business activity Offers upward mobility to employees Support from existing research institutions Synergy with existing businesses Appropriate space needs Zero or low pollution Efficient use of natural resources especially energy Fast growing (3-5 year growth) Builds lasting value for local economy Creating Incentives The incentives that are packaged or created as part of this process need to differentiate the SIEDC Green Zones from other areas in New York City and the region. These incentives fall into two broad categories: Technical incentives (assistance with permitting, site selection, and business plan evaluation) 10
133 Financial incentives (economic incentive zones, reduced tax rates, tax rebates, loan guarantees, and reduced utility rates and business license fees) Incentives in both of these broad categories currently exist and can be used in the short or long term, which are explained in more detail in the following sections. Short Term Incentives (0-1 Years) In many cases these programs already exist. Through strategic partnerships, innovative marketing, and identifying funding sources for these programs, SIEDC can provide a number of Green Zone incentives directly. These programs can be packaged based on target markets. Through partnerships with NYSERDA, Con Edison, NYC Small Business Services (SBS), the Mayor's Office of Industry and Manufacturing, and the Mayor's Office of Environmental Remediation (MOER), SIEDC can develop relationships with experts who can provide businesses with the technical assistance to evaluate business plans, site plans and building plans to ensure that they meet green standards. Partnerships with organizations like the Green Business Bureau can enable SIEDC to provide green business certification, and create green business directory resources. Working with New York City Economic Development Corporation (NYCEDC) and its Industrial Development Agency, SIEDC can create a program similar to FRESH NYC 8 program. The FRESH program markets existing NYC IDA programs of Real Estate Tax Reductions, Sales Tax Exemption and a Mortgage Recording Tax deferral specifically to grocery stores and other fresh food providers/retailers. SIEDC can also leverage existing relationships with banks and notfor-profit lenders to identify various financing tools for business and developers in the Green Zone. SBA loans including the 7(A) Loan Program, 504 Loan Program, and the Minority and Women Pre- Qualification Loan Program can all be used to support green businesses and buildings. A number of lending institutions have developed new financing tools using tax credits and rebates for certain green upgrades for buildings and business processes. Recommendation SIEDC should review potential green financing opportunities offered by local banks and not-for-profit lenders. Long Term Incentives (1+ Year) As the Green Zone starts to develop an identity, SIEDC should begin to look for direct funding and develop additional policies that it can then use to incentivize businesses and real estate developments. Unlike existing programs, SIEDC can create specific programs that will advance their goals. SIEDC should look to funding sources such as Empire State Development s (ESDC) Regional Economic Development Council to secure funding that can be used to create new infrastructure and/or revolving loan funds to advance specific Green Zone strategies such as the Integrated Freight Logistics Center, District Energy Plan or the Bluebelt/Stormwater Management Strategy (these strategies are described in more detail in the Task 4 report). In addition to funding area-wide strategies, SIEDC can help subsidize fees associated with third-party green certifications for buildings, sites, and businesses. The City of New York, primarily through the NYCEDC, can also offer a range of support. 8 The Food Retail Expansion to Support Health (FRESH) program is open to grocery store operators renovating existing retail space or developers seeking to construct or renovate retail space that will be leased by a full-line grocery store operator. Stores that benefit from the program must fall within designated FRESH-eligible areas, shown below. 11

134 In addition to developing financial incentives that would support the Green Zone, SIEDC needs to work with policy makers to create an overall business environment that would incentivize the purchase of products made by green zone manufacturers. Such programs can include environmentally preferable purchasing to use the substantial concentrated purchasing power of City and perhaps coalitions of large businesses and institutions (e.g. universities) to provide market pull and formation for targeted sectors and activities. (This may be both politically and economically more feasible, as it directs money that would be spent anyway.) Policies can also be created to price the negative impacts from businesses not conforming to green principles by placing those costs on resources and activities used by those businesses. Recommendations SIEDC can utilize its existing position as a business leader and resource on Staten Island to own, organize, and distribute easy to understand information about what types of incentives are available to businesses within the Green Zone. Strengthening and leveraging relationships is at the foundation of this approach. We have outlined specific partnership strategies in the Partnerships section of this Task 3 Report. Case Study: A Tool to Establish Green Business Green America Green America uses a tool created by the Green Business Bureau (GBB) to help certify businesses as green based on best practices across industries and for specific industries. The GBB licenses this tool to municipalities and other organizations so that those organizations can then create their own certification programs. Green America offers the tool to their members upon signup and has added additional questions to the base 500 questions that GBB has created and weighed. Depending on the questions, there can be a pop up question that discusses the percentage of certain activities that are green (e.g., how much recycled paper they use). The standard questions developed by the GBB are organized in the following categories: Recommendation SIEDC should stay involved with the ESDC s Regional Economic Development Council to advance specific GZ strategies. Business Practice and Organization Break room and Bathroom Transportation and Outdoor spaces Copy and Printing Waste handling and management A number of questions are universal to all industries and then there are industry specific questions under those 5 categories. (e.g., how much recycled paper does your business buy? Does your dry cleaning business have a hanger recycling program?). The system is set up in a way that the manager of the tool can add questions and create new groups of questions 12
135 according to their specific market. In addition to the 500 base questions, GBB expressed that it is possible to incorporate best practices and questions used by other organizations that offer the tool. The green certification process begins by having a company fill out a questionnaire of about 120 questions. Once they complete the survey they are taken to a screen where they are shown their score. If they meet the threshold criteria, they can download a certificate that can be placed on their website. If the business does not meet the criteria for certification, below their score will be a list of green initiatives that the business can undertake to achieve the threshold criteria. When the business clicks on the initiative, there is a description of how to accomplish the task, along with a ranking of difficulty associated with implementing the recommendation and the potential impact it will have. 13
136 Inventory of Green Businesses In addition to creating the atmosphere for green practice and packages of incentives to assist existing businesses to enhance their facilities through green strategies, the goal of the SIEDC is to attract new business to the zone. Successful business attraction plans typically build upon the strengths and business networks already in place in an area. These networks represent the core moving parts upon which new activity may be built. These networks in addition to other key business inputs such as access to markets, raw materials, skilled workforce, and a competitive cost environment are the critical drivers upon which one can determine the kinds of companies that can be attracted into a business ecosystem. The available data and the input received from the companies interviewed suggest that Staten Island will have to work with the City and related agencies to find ways to make these business drivers support a truly successful business attraction policy for the Green Zone. However, an analysis of the data available and conversations with local businesses, suggests that the following target industries and business types appear to be reasonable targets for the SI Green Zone. Existing Company Base Ideally, a green economy is an extension of skills and networks already in place within a region. Repurposing and connecting businesses already in place to take part in a green economic ecosystem is a relatively straightforward proposition, especially in those cases where there is strong history of partnership among businesses and between the public and private sector. Communities where green networks and companies are not already in place start at a disadvantage, but can build this base and ecosystem over time with concerted effort and investment. The Bureau of Labor Statistics (BLS) has constructed a list of North American Industrial Classification Codes (NAICS) which covers industries and functions which tend to either participate in or support the green economy. A company classified in these codes might not necessarily be actively engaged in green activity now, but it has the skills and is in an activity which could likely participate if it wished. The companies already resident on Staten Island which fit this description include the following: Name Description Complimentary Businesses Types National Grid Energy Services Electric and Gas Utility Waste to Energy Services RPM Energy Solutions LLC Solex Energy Supply Heritage Labs Green Green Building The Mazzei Group Energy Auditing and Conservation Energy Management Systems Environmental Cleaning Products Green Building & Environmental Services Green Building & Environmental Services Contractors Specializing in energy efficient building improvements Companies producing hardware for energy systems Distributors of Green Building Materials Energy Efficient Building Materials and Products Air Masters Heating and Air HVAC Contractor Suppliers and Distributors of High 14
137 Name Description Complimentary Businesses Types Cond Efficiency HVAC Equipment and Materials Pratt Industries Paper Division Organic Recycling Inc Supino Scrap Iron & Metals Pratt Industries Mill Division Bo Tire Sales and Removal Village Recycling Inc QP Unlimited LLC Solid Waste Technologies Inc Faztec Industries Steven Thomas Heating and Plumbing Recycled Paper & Cardboard Recycling - Recycling Services Recycling - Recycling Services Recycling - Recycling Services Recycling - Recycling Services Recycling - Recycling Services Recycling - Recycling Services Recycling - Recycling Services Recycling, Materials & Ready Mix Renewable Energy Packaging Plants or High Paper Consumers (Newspaper Printers), Cardboard Box and Paper Distributing Companies Yard Waste Collectors and Transporters, Nurseries Demolition Companies, Contractors, Builders, Iron Workers Packaging Plants, Cardboard Box Distributing Companies Auto Mechanic, Truck and Taxi Repair Shops, Asphalt Manufacturers Manufacturers that use Recycled Materials Manufacturers that use Recycled Materials, Generators of waste paper, plastic, tin and aluminum. Manufacturers that use Recycled Materials Contractors Specializing in Using Recycled and Custom Blended Aggregates Fuel Efficient Plumbing Parts and Appliance Distributors Akeena Solar Inc Renewable Energy Solar Panel Manufacturers Donjon Recycling ATAK Trucking, Inc. Stallion Recycling Staten Island Recycling Millennium Recycling Corp Scrap Metal and Electronic Recycling Wholesale Building and Construction Materials Wholesale Scrap Materials Wholesale Scrap Materials Wholesale Scrap Materials Manufactures that use Recycled Metal Products, Businesses that Collect Metal or Electronics for Recycling Landscapers, Landscape Suppliers, Garden Centers, Contractors Commercial Contractors, Demolition Services, Manufacturers of Equipment Used to Transport Waste Manufacturers that use Recycled Materials Manufacturers that use Recycled Materials Please note that this list above does omit service providers such as law firms which may also service the green economy. 15
138 The presence of an existing industrial and economic base which may participate in green activities provides legitimacy to the prospect of bringing new green activity to the Island. A case may be made for current activities in working with recycled materials, renewable energy and related areas. Other green activities may follow over time, but will require the development of a support base. By researching potential incentive programs for Green Building, Green Practice and Green Land, it is hoped that the SIEDC will be able to build a stronger list of existing green businesses to build upon the strength of the existing business network. 16
139 Interview Green and Clean Businesses The data on the existing company base suggests that companies involved in materials processing, recycling, and even food production could be accommodated within the Green Zone. The team found and then interviewed several regional companies in order to corroborate and expand on this theory. While many of the interviews were conducted in confidence, the following is a summary of the key findings from those interviews. We approached over ten companies about interviews for this project and six were willing to speak with the study team. Each of the six companies interviewed noted some very basic difficulties in operating on Staten Island, and each also noted a lack of effective assistance from local government. This was also given as a potential reason for why companies were not willing to take the time to speak with our team. Regardless, the companies willing to speak with us provided considerable feedback on the operations, constraints, and opportunities on the Island, particularly in four major areas of concern: Market Access Labor and Operating Costs Regulatory Uncertainties Market Opportunities for Staten Island Businesses Please note the interview checklist used in the sessions is included in Appendix IV of this report. Market Access While Staten Island lies in the middle of tremendous population mass and consumer market, access to this market is complicated by the bridge system connecting State Island to the mainland. The Goethals, Verrazano Narrows, Outerbridge Crossing, and Bayonne Bridge all have significant weight limits and expensive tolls which act as significant barriers to commerce between Staten Island, the mainland, and the rest of New York City. Tolls for trucks start at $26 per axle (with EZPass, off-peak) on the Verrazano Narrows to $27 per axle on the Bayonne Bridge, Goethals Bridge, and Outerbridge Crossing and can go as high as $78 (with no EZPass) for trucks with 6+ axles. Several interviewees noted that they have adopted innovative means for addressing weight limit concerns and/or tolls, but that the resultant costs still impact the overall competitiveness of their offerings. The overall result of all of the above is that the companies within the sectors identified above tend to limit their offerings to within Staten Island or perhaps the City of New York and no further. The one exception was for food production (chocolate), which does serve clients across the country. At least one of the respondents noted that rail and water access are significant and underutilized. The SIEDC may wish to explore options for utilizing these in partnership with CSX and Norfolk Southern 9, the City of New York and the PANYNJ. 9 Envision Freight, National Cooperative Freight Research Program (NCFRP) website, 17
140 Labor and Operating Costs While each of the companies interviewed was more than satisfied with the quality of labor they are able to attract, they were each concerned with the cost of labor as it compares to their competitors, particularly those in New Jersey. Even though New Jersey is also a highly unionized environment, several of the companies stated their opinion that the predominance and influence of unions on Staten Island significantly contributes to the cost of operation. Companies also cited the costs of electricity as an elevated cost item on the Island and suggested that use of cogeneration, waste natural gas, or other similar energy sources would be welcome additions to the local economy. Regulatory Uncertainties The companies interviewed observed that they are often unable to predict the regulatory environment in which they will need to operate. New Jersey business regulation is perceived as less difficult to navigate, which is cited as one of the basic reasons that business has moved to NJ. The companies stated that the State and City of New York have traditionally presented administrative and policy barriers to some forms of development specific to Staten Island. Examples include wetlands, weight limits and tolls, and a lack of a stated preference for using local companies and materials. Finally, the City and State have been very reactive in attracting and retaining businesses. One company told of a specific instance where they had been within three days of moving from the Island and the City only interceded after notice of loss. The City and State should be aware that local companies are actively approached by other jurisdictions on a regular basis to move elsewhere. Opportunities Even with all of the obstacles noted above, each of the companies interviewed reiterated their plans to continue to operate and grow on Staten Island. Each noted the opportunity implicit in operating within the largest metropolitan area in the United States, with access to robust transportation infrastructure, and in a location which has land available to support growth. Each of the barriers above is resolvable if the will exists, resulting in significant economic development opportunities over the long term. If not, the Island needs to explore ways of maintaining economic sustainability in the face of these barriers. Recommendation SIEDC should continue work with its member businesses to provide green technical assistance and strategies to support business growth. 18
141 Industries and Specific Firms that Would Benefit from Green Zone Attraction of green activities and companies to Staten Island s Green Zone is subject to the larger market context of the needs of both business and the community. These needs define the demand side of the supply and demand equation which results in the answer of what can be placed within the corridor. It is helpful to examine the region at both the macro and micro level. Certainly, the real estate and demographic market dynamics within the corridor itself illustrate specific opportunities and constraints, but all activity within Staten Island is subject to an understanding of how the community is viewed by investors, companies, institutions, and others who would make real estate decision. The following SWOT analysis of the Staten Island Green Zone was compiled after meetings with various New York City agencies, the Green Zone steering committee, and was informed by interviews we conducted with businesses located within the Zone. The Green Zone possesses all of the following strengths which are critical to attracting each of the target industries noted in the subsequent pages. Marketing materials should reflect these strengths. Excellent access to major population centers in Northeastern US More environmentally sound alternatives to trucking (rail and barge) Available industrial space, Available land and real estate Strong transportation network and infrastructure (including rail and barge) Build on Staten Island s existing recycling and waste processing industry Build on Staten Island s existing supply of C&D materials Strengths Proximity to major consumer and industrial markets Excellent transportation network-rail, road, maritime Unencumbered industrial sites Some companies already participating in materials recycling Good access to workforce with business skills Opportunities Access to regional and global transportation network could be enhanced even further Effective marketing campaign could help erase perception issues Bring enhanced career opportunities and higher paying jobs Integrate with initiatives in other boroughs (e.g. Brooklyn Navy Yard, Sims Municipal Recycling Facility) Weaknesses Link/disunity with NYC Cost of access over regional road network Low percentage of population with college education Weight and other limitations on bridges High tax liability Perceptions (and reality) unionization has upon labor cost Permitting, planning, and regulatory process Threats Extended economic downturn Perceptions Lack of outreach to potential and existing companies Inability to address structural cost and access issues Inability to address regulatory framework 19
142 Initial Targets Each of the following targets may benefit from a location within the Staten Island Green Zone. Each - particularly those in the transportation and energy areas - may also help the Green Zone develop a critical mass of benefits to attract other "green" industries in areas not currently competitive on Staten Island. In addition, the sample companies listed in the tables fit the profile of the types of industries that could work on Staten Island and specifically in the Green Zone and have recently been locationally active 10. Immediate target activities are listed below. Freight Consolidation and Redistribution: Freight consolidation and redistribution services provided by a freight forwarder in which several smaller shipments are assembled and shipped together to avail of better freight rates and security of cargo. This can also be called an assembly service, cargo consolidation, or freight consolidation. Integrated Logistics Center (Freight Village): Integrated Logistics and Distribution, also known as Freight Villages appear to be uniquely aligned with the operations of the Port of NY and NJ and extremely complementary to the attributes inherent to the Green Zone. An integrated logistics center is a defined area within which all activities relating to transport, logistics and the distribution of goods, both for national and international transit, are carried out by various operators. Freight services include warehousing, distribution, intermodal terminal, customs, and freight forwarding. Waste to Energy: Waste-to-energy (WtE) is the process of creating energy in the form of gas, electricity or heat from a waste source. There are a number of new and emerging technologies that are able to produce energy from waste and other fuels without direct combustion. Many of these technologies have the potential to produce more electric power from the same amount of fuel than would be possible by direct combustion. Newer technologies include thermal such as Plasma arc gasification and non-thermal, such as anaerobic digestion. Construction & Demolition (C&D) Recycling: Construction and demolition (C&D) materials consist of the debris generated during the construction, renovation, and demolition of buildings, roads, and bridges. C&D materials often contain bulky, heavy materials, such as concrete, wood, metals, glass, and salvaged building components. Reducing and recycling C&D materials conserves landfill space, reduces the environmental impact of producing new materials, creates jobs, and can reduce overall building project expenses through avoided purchase/disposal costs. Customers who use recycled construction are eligible for Leadership in Energy and Environmental Design (LEED) certification from the U.S. Green Building Council. Manufacturing Using Recycled or Repurposed Materials: Instead of using virgin materials that have been mined or harvested from natural areas, recycled products are made from materials that have already been used once, and have been collected and processed to be used again as feedstocks in new products. Because of the benefits associated with reuse and recycling, many sustainable business opportunities and broad public support exist for small-scale manufacturers of recycled products. 10 Locationally active companies are actively looking for potential locations to either relocate to or open new facilities. 20
143 If these are proven to be successful, the Green Zone may also expand into at least two other key activities: Food Production and Processing Sustainable Building Materials Manufacturing Success in attracting these two latter targets will require improvements in: Transportation access and cost to the Green Zone/Staten Island Workforce training While our analysis shows that there are targets that we can focus on for business recruitment, it is important to note that success in attracting businesses to the Green Zone will require significant commitment to addressing existing barriers to entry and operation. We ve provided information pertaining to each initial target industry, specifically the current industry outlook; key requirements or value chain; specific role for Green Zone; the advantages Staten Island provides; the disadvantages or risks associated; as well as sample and target companies to reach out to. 21
144 Freight Consolidation and Redistribution Freight consolidation and redistribution services provided by a freight forwarder in which several smaller shipments are assembled and shipped together to avail of better freight rates and security of cargo. Can also be called assembly services, cargo consolidation, or freight consolidation and can include Third-Party logistics (3PL) firms. Current Industry Outlook Key Requirements or Value Chain Specific Role for the Staten Island Green Zone Staten Island Advantages Disadvantages and Risks Sample/Target Companies Growing movement in large urban areas to reduce truck volumes, improve traffic flows, improve environmental quality, create a more efficient and cost-effective freight delivery system Driven by higher operating costs and ever higher freight volumes leading to congestion and pollution Fuel cost spike in 2008 resulted in a trend towards a larger number of smaller-footprint facilities situated close to big cities offering short distances to product delivery. Increasing state and local legislation to find ways of reducing vehicle miles travelled (VMT) as well as carbon output Major market proximity Transportation network Large parcels of land Interconnected business activities Site suitability Provide consolidation and shipping services directly at the Green Zone Possible development of a Foreign Trade Zone (FTZ) to provide assembly, processing, and/or reconsolidation services before customs Provide a possible solution for shippers looking to share the toll and other burdens of shipping from/to Staten Island GATX site being considered for freight village by New York Metropolitan Transportation Council Large parcels of land Proximity to the largest East Coast Interstate highway access consuming area Water and railroad access Possibility to serve interstate/regional Proximity to marine terminals freight transshipment Poor local road access Permitting process Tolls and weight limits on bridges Includes freight forwarding and third-party logistics firms such as: Federal Express UPS Quick Transportation Solutions, Inc. (holding co for several 3PL firms) National Logistics Group Conway Freight 22
145 Integrated Logistics Center (ILC) or Freight Village Integrated Logistics and Distribution, also known as Freight Villages appear to be uniquely aligned with the operations of the Port of NY and NJ and extremely complementary to the attributes inherent to the Green Zone. An integrated logistics center is a defined area within which all activities relating to transport, logistics and the distribution of goods, both for national and international transit, are carried out by various operators Freight services include warehousing, distribution, intermodal terminal, customs, freight forwarding. Ancillary services include: restaurants, hotels, post offices, banking services, etc. Generally public-private partnership that is privately owned/managed. Current Industry Outlook Key Requirements or Value Chain Specific Role for the Staten Island Green Staten Island Advantages Disadvantages and Risks Sample / Target Companies Growing movement in large urban areas to reduce truck volumes, improve traffic flows, improve environmental quality, create a more efficient and cost-effective freight delivery system Driven by higher operating costs and ever higher freight volumes leading to congestion and pollution Major market proximity Multimodal access Large parcels of land Labor supply Site suitability Interconnected business activities Site of freight village As with above, possibility to include a foreign trade zone (FTZ) to draw international activities to the Island GATX site being considered for freight village by New York Metropolitan Transportation Council Access to an Integrated Logistics Center could aid development of other potential target industries including waste conversion, materials recycling, alternative energy generation and parts assembly, food production, green building materials Large parcels of land Proximity to the largest East Coast consuming area Road, water and railroad Possibility to serve interstate/regional freight access transshipment Proximity to marine terminals Poor local road access Potential environmental considerations of site New construction Permitting process NOTE: A freight village is not a company to be attracted, but a development to be fostered as a public/private partnership. Operators include railroads, freight and logistics developers, and third-party logistics providers (3PL s). Sample developments include: Rickenbacker Terminal (Columbus, OH) Front Royal (Virginia) Alliance Logistics Center (Fort Worth, TX) 23
146 Waste to Energy Waste-to-energy (WtE) is the process of creating energy in the form of gas, electricity or heat from a waste source. There are a number of new and emerging technologies that are able to produce energy from waste and other fuels without direct combustion. Many of these technologies have the potential to produce more electric power from the same amount of fuel than would be possible by direct combustion. Newer technologies include thermal such as plasma arc gasification and non-thermal, such as anaerobic digestion. Current Industry Outlook Key Requirements or Value Chain Specific Role for the Staten Island Green Zone Staten Island Advantages Trends driving the waste-to-energy market include energy security, rising fuel prices, pressure and regulations to reduce greenhouse gas emissions, new waste-to-energy technologies, demand for good paying energy jobs State-of-the City mandates: o Double the amount of residential waste diverted from landfills by 2017; o To become one of the first cities in the country to turn wastewater into renewable energy; o Explore the possibility of cleanly converting trash into renewable energy. Landfill space is becoming scarcer and costlier. NYC s waste transfer cost has climbed significantly since (@$77/ton 2009). Congress considering bill to provide 30% tax credit to qualifying waste-to-energy projects. According to a recent Columbia University study, if all US municipal solid wastes (MSW) were converted at a waste-to-energy facility, it would produce enough electricity to power 16 million households (15% of total US households). NYSERDA supportive of new technologies in renewable energy and WtE product development and project stimulus. Resistance to projects because there are cleaner renewable sources (wind, solar, fuel cell) and perceptions it will reduce recycling. Renewable sources and technologies can work in conjunction with waste-to-energy production. NYC is re-considering waste-to-energy options. Recently convened (12/6/11) policy forum Wasted Opportunity? Confronting NYC's Solid Waste Challenges, hosted by the New York League of Conservation Voters Education Fund suggests willingness to consider new solid waste disposal options. California has most waste-to-energy projects. Access to local source and steady supply of municipal solid waste (MSW). Receipt of waste, sorting of waste, conversion of waste, generation of energy, re-use of bi-products. Excellent access to major population centers in Northeastern US, via port and highway. Leverage connection to materials recycling and waste disposal infrastructure. Proximity to stream of NYC s tonnage of MSW, Participate in City of Innovation goals for recycling and clean energy. 24
147 Disadvantages and Risks Sample/Target Companies Continued resistance to WtE by various stakeholders. Concern over emissions from traditional WtE projects. Regulatory controls and approvals. Involvement of new technologies. Waste Conversion and Energy Technologies Production Gasification and BioMass Conversion Covanta Energy o Chinook Energy Enertech Environmental Inc o Ovivo Harvest Power o Siemens Energy Novo Energy o ZeroPoint Clean Tech (Buffalo, NY) Rentech Fuel Cell Waste Management o FuelCell Energy o GE Energy, Schenectady, NY o Plug Power, Latham, NY United Technologies (UTC Power)Solar o Conergy o Kyocera o Solyndra Wind o Enertech Wind o Gamesa o Vestas 25
148 Construction & Demolition (C&D) Recycling Construction and demolition (C&D) materials consist of the debris generated during the construction, renovation, and demolition of buildings, roads, and bridges. C&D materials often contain bulky, heavy materials, such as concrete, wood, metals, glass, and salvaged building components. Reducing and recycling C&D materials conserves landfill space, reduces the environmental impact of producing new materials, creates jobs, and can reduce overall building project expenses through avoided purchase/disposal costs. Customers who use recycled construction are eligible for Leadership in Energy and Environmental Design (LEED) certification from the U.S. Green Building Council. Current Industry Outlook Key Requirements or Value Chain Troubled economy has resulted in unsteady supply of C&D materials Recovery rates are increasing with capacity down. Processors are pulling additional commodities out to increase recovery rates The waste streams are becoming more difficult than what may have traditionally been processed as C&D. More difficult materials include carpet, mixed plastic and bulky waste Resurfacing and road work, more inner city demolition projects and landfill reclamation seem to be areas where there is activity Dominated by relatively small firms Labor, fuel and other energy, insurance, equipment acquisition, and equipment maintenance represent greatest costs Government regulations are changing and shaping the way material is processed, collected, or sold Steady supply of C&D materials Strong transportation infrastructure Proximity to major metropolitan area with large infrastructure demands Specific Role for the Staten Island Green Zone Staten Island Advantages Disadvantages and Risks Sample/Target Companies Build on Staten Island s existing C&D recycling capabilities Use this as a possible feedstock to manufacturers using recycled materials Excellent access to major population center which provide a steady supply of C&D materials as well as customers to buy the recycled materials Strongly affected by economic instability Many C&D recyclers in New York City Limits of existing NYC contracts Existing Local Companies Faztec Staten Island Recycling WWC Construction WITTE Marine Staton Companies Zanker Recycling Montecalvo Disposal Services 26
149 Manufacturing Using Recycled or Repurposed Materials Instead of using virgin materials that have been mined or harvested from natural areas, recycled products are made from materials that have already been used once, and have been collected and processed to be used again as feedstocks in new products. Because of the benefits associated with reuse and recycling, many sustainable business opportunities and broad public support exist for small-scale manufacturers of recycled products. Manufacturing with recycled materials typically requires much less energy than using virgin resources, because the materials have already been processed at least once. Recycling-based manufacturing can involve complex and expensive technology, but it can also be lowtech and labor intensive, providing a variety of training and employment opportunities to communities. Studies have shown recycling-based manufacturers provide a wide range of skilled and unskilled jobs at living wages. Communities and businesses looking for new routes to economic growth are recognizing that the waste they generate every day is a valuable economic resource. Instead of paying to have recyclable materials disposed of, or sending them to be recycled elsewhere, communities can keep the added value by providing the materials, labor, and markets that fuel local growth. Current Industry Outlook Key Requirements or Value Chain Specific Role for the Staten Island Green Zone Federal, state and local regulations are changing and shaping the way material is recycled for manufacturing. Governments are providing incentives to recycling manufacturers: California s Recycling Market Development Zone (RMDZ) program provides low interest loans, technical assistance, and free product marketing to businesses that use materials from the waste stream to manufacture their products and are located in a zone. Local government incentives may include relaxed building codes and zoning laws, streamlined local permit processes, reduced taxes and licensing, and increased and consistent secondary material feedstock supply. The cost of commodities continues to rise, making recycled materials more cost effective. Improvements in technology (such as state-of-the-art sorting machinery), single stream recycling, and supply chain logistics result in greater market efficiency. Waste disposal is an expensive part of doing business, and as landfill space diminishes, costs will continue to rise. The use or sale of recycled materials reduces disposal costs. Better public education initiatives are driving consumer demand for recycled content. Steady supply of quality pre and post-consumer waste materials Strong transportation infrastructure Proximity to major metropolitan area with large consumer demand Available land and real estate Small and Medium scale manufacturing and/or customization 27
150 Staten Island Advantages Disadvantages and Risks Sample/Target Companies Excellent access to major population center which provide a steady supply of waste materials as well as customers Land and real estate availability Strong transportation network and infrastructure Build on Staten Island s existing recycling and waste processing industry Quality of recycled feedstocks, sourcing of recycled feedstocks, consumer demand for recycled products Dependence on demand for commodities Continued government support for materials recycling Investment in new technologies which make materials recycling cost effective Sample Companies Existing Local Companies Forms and Surfaces Montecalvo Disposal Services Urban Woods WM Recycle America (subsidiary of Young Furniture Waste Management) Advanced Fixtures, Inc. General Mill Supply Processed Plastics Company Rosby Resource Recycling Maku Furnishings Richard S. Burns & Company Pallas Second Look Recycled Wall Covering United Plastic Recycling American Polymers Corporation Global Plastics Recycling Staton Companies Zanker Recycling 28
151 Longer-Term Targets Food Production and Processing Food production includes both the initial and final preparation of food and foodstuffs. This may include the initial gathering and processing of grains, fish, meats and the like. It may also include formulation, cooking and packaging of prepared foods. Over 19,000 New Yorkers work in over 900 food manufacturing firms and about 1/3 of products are exported outside metro area. NYC Food manufacturing is a $5B industry with good wages. Growth is in specialty foods. Current Industry Outlook Key Requirements or Value Chain Specific Role for the Staten Island Green Zone Staten Island Advantages Disadvantages and Risks The recession, national trends towards ready to eat meals, and attention to food sources and ingredients has all placed differing pressures on the national food pipeline. Both sourcing and nutritional issues have created an opportunity for fresh healthy food, which has in turn created a drive towards re-regionalization of food production near agricultural centers. The industry has been characterized by consolidation, outsourcing, and automation (driven by labor reductions, cost-containment, process efficiency, quality control and regulatory compliance). Food manufacturing is energy intensive: companies are turning to energy management projects such as energy audits, recycling/redirecting, negotiating with energy providers and seeking alternate energy sources. Regulatory changes relating to food safety continue. Raw material pricing is expected to continue its upward trajectory, as will transportation costs, making locally sourced and produced foods more economically viable. The greening of food continues, with packaging reduction initiatives, more ethical sourcing policies and the reduction of food miles. NYCEDC is making food manufacturing an economic development priority. Initiatives include capital access programs (through NYCEDC), tax breaks and tax exempt bond financing for capital investment (through New York City Industrial Development Agency), energy reduction programs, and availability of reasonably priced space at incubators (LIC and Harlem). Access to key ingredients, produce, and meats Strong transportation infrastructure Proximity to major consumer markets Available real estate Production and processing Regional and local distribution Excellent access to major population centers in Northeastern US More environmentally sound alternatives to trucking (rail and barge) Available industrial space Competition with other NYC areas: Brooklyn Navy Yard, Long Island City, Hunts Point, Harlem (La Marqueta) 29
152 Sample/Target Companies Sample Companies (Targets will share attributes of the following) Heinz Kraft Foods ConAgra Foods Sara Lee Existing Local Companies (for retention and/or expansion) Supreme Chocolatier (Staten Island); specialty chocolates Tom Cat Bakery (Long Island City); bakery Cumberland Packing Corp. (Brooklyn); processed sugar Streit Matzo (Manhattan); kosher foods H. Fox & Co (Brooklyn); flavored syrups Sarabeth s (Bronx); fruit preserved Twin Marquis (Brooklyn); Asian noodles, wrappers, dim sum 30
153 Sustainable Building Materials Manufacturing The concept of sustainable building incorporates a variety of strategies during the design, construction and operation of building projects. The use of green building materials and products represents one important strategy in the design of a building. Green building materials offer benefits to building owners and occupants: Reduced maintenance/replacement costs over the life of the building Energy conservation Improved occupant health and productivity Lower costs associated with changing space configurations Greater design flexibility Resource efficiency can be accomplished by using materials that meet the following criteria: Recycled Content: Products with identifiable recycled content Natural, plentiful or renewable: Materials harvested from sustainably managed sources and preferably have an independent certification Resource efficient manufacturing: Products manufactured with resource-efficient processes including reducing energy consumption, minimizing waste, and reducing greenhouse gases Locally available: Building materials, components, and systems found locally or regionally saving energy and resources in transportation Salvaged, refurbished, or remanufactured Reusable or recyclable: Select materials that can be easily dismantled and reused or recycled at the end of their useful life Recycled or recyclable packaging: Products enclosed in recycled content or recyclable packaging Durable: Materials that are longer lasting or are comparable to conventional products with long life expectancies Current Industry Outlook Key Requirements or Value Chain Sustainable building material manufacturing has had significant and stable growth occurring even during the recession. This trend is set to continue in the next five years, as tax incentives and demand for energy-efficient buildings stimulate demand. Recovery in construction activity will bolster overall growth. The industry is consolidating, as larger firms look to acquire smaller operators to increase scale and gain access to specific sustainable building material products and technology. The industry is comprised of a diverse set of firms that specialize in varying aspects of sustainable building material manufacturing. Increasing federal and state level regulations on the environment will continue to strengthen the industry. Transformation to cleaner technologies could bring basic manufacturing (and jobs) back to the US. Higher energy costs drive residential and commercial consumers to search for more energy efficient products. Partnership with government, R&D, and business to encourage new technologies Strong manufacturing base Proximity to major metropolitan area with large construction demands 31
154 Specific Role for the Staten Island Green Zone Staten Island Advantages Disadvantages and Risks Sample/Target Companies As industrial area that serves New York with industrial sites, Staten Island could host sustainable building materials manufacturing Excellent access to major population center with residential, commercial and infrastructure demand Available land and real estate Strong transportation network Affected by economic instability Staten Island s cost of doing business (tolls, taxes, permits and approvals, unions) Sample Target Companies Dunmore Corp. NanoSolar Tremco Venture Lighting Superior Walls TECHBUILT Systems, Inc. Arxx Building Products Formulated Solutions LLC Recommendations The next steps in identifying target industries is to find contact information for each of the potential companies, conduct outreach, and create tailored marketing materials for each. For example, if Logistics is an industry that SIEDC wants to pursue, reach out to the corporate real estate department of UPS, Fed Ex, and National Logistics Group, and then send them tailored information that highlights the advantages of locating within the Green Zone. Recommendation Develop marketing materials that are tailored to promote the Green Zone to specific target industries. 32
155 Green Zone Marketing Strategy The successful development of the SIEDC Green Zone requires a strategic approach to promoting the attributes and benefits associated with the zone. A marketing strategy is a multi- step process. Success requires consistent long-term market development and strategy implementation. The purpose of this marketing strategy is to provide the SIEDC with a framework for promoting the Green Zone today and in the coming months. Considerations The Green Zone has two primary target markets: Existing businesses within the Green Zone; Potential businesses looking to locate within the Green Zone. This is important as Green Zone marketing should serve as both a business retention and expansion as well as attraction strategy. Essentially, this marketing strategy should serve as the overall communications plan for the Green Zone. Clear, consistent messages will help build political, community, business, and market support. Goals Based upon the location assessment and the possible target markets identified, the following goals and objectives are recommended for the Green Zone marketing strategy: Clearly define the Green Zone and communicate it to the marketplace; Promote the strengths and attributes of the Green Zone and in doing so counter real or perceived market barriers; Effectively reach the target markets early in the site selection evaluation process. Key Messages In order to achieve the three objectives outlined for this marketing strategy, clear consistent communication with the marketplace is required. All communications must consider current key facts and situations and translate that information into meaningful promotional messages. The following strategy provides key messages that can be used today, while creating a framework for SIEDC to update and refine these messages as inputs change over time. Defining the SIEDC Green Zone Clearly defining the Green Zone is critical to communicating with the marketplace. The definition must answer two key questions: 1. What is the Green zone? and 2. Why should a company locate there? The Green Zone definition should meet these three criteria: The definition must be communicated in two sentences or less; The definition must differentiate the Zone from other locations in the region; 33
156 The message must compel the audience to explore the zone further. Key Points The Green Zone is a strategically located part of New York City, home to businesses that are green in their purpose or operations The Green Zone provides access and opportunities to companies practicing or participating in sustainable activities The Green Zone is open to companies seeking to become more sustainable The Green Zone is an established cluster of successful businesses actively participating in the green economy The Green Zone is a unique opportunity for companies seeking a competitive advantage through incentives and synergies. Green Zone Definition Staten Island s Green Zone is a unique business district offering programs and incentives to businesses employing sustainable practices in the production of goods and services. Businesses located within the Green Zone gain a competitive advantage through synergistic collaborations, cost saving technologies, access to subsidies, and innovative marketing while being centrally located within one of the largest consumer and industrial markets in the world. SI Green Zone A profitable environment 34
157 Communicating Strengths and Advantages Once the Green Zone has been defined, its strengths, attributes and benefits must be characterized. To effectively attract businesses, the Green Zone must be more than a geographic area. The Green Zone must offer businesses a series of advantages packaged appropriately and communicated to the market. SIEDC s current online promotion of the Howland Hook/North Shore Industrial Ombudsman Area (IOA) is a simple example of how resources can be packaged and communicated to the real estate market. A similar package of technical assistance, advocacy and resources should be created and made available to businesses interested in locating in the Green Zone. This package, coupled with the synergies achieved by co-locating green businesses, can effectively counteract the weaknesses in the Staten Island market. Market Strengths Proximity to major consumer and industrial markets Excellent transportation network-rail, road, maritime Large unencumbered industrial sites Potential synergies with and proximity to companies participating in green economy Good access to qualified workforce Green Zone Advantages Federal, state and local programs and incentives SIEDC Green Zone advocacy and resources Green practices assistance and certification programs. Marketing and business development assistance through SIEDC Green Zone featured business program. Market Weaknesses Link/disunity with NYC Cost of access over regional road network Low percentage of population with college education Weight and other limitations on bridges High tax liability Perceptions (and reality) unionization has upon labor cost Permitting, planning, and regulatory process The Green Zone Benefits Large readily available parcels of land Multi-modal access: rail, water, highway Close proximity to major consumer markets Established green economic base Access to public sector green code buying power Green Zone Certification NYC MOER Green Site Certification NYS DEC Green Building Tax Credit NYS Brownfield Incentives NYS Brownfield Green Redevelopment IRS Commercial Building Energy Improvement Credits Green Zone Relocation assistance Cost saving green practices Green Zone resources and assistance ConEd Energy Audits 35
158 Strategic Marketing Actions SIEDC should consider implementing a number of actions over the short and long-term to help build credibility and name recognition for the Green Zone. Like the key messages outlined above, some of these actions can be implemented today, while subsequent actions can be taken as inputs change over time. These strategic actions are all designed to achieve the marketing goals first outlined: 1. Clearly define the Green Zone and communicate it to the marketplace; 2. Promote the strengths and attributes of the Green Zone and in doing so counter perceived and real market barriers; 3. Effectively reach the target markets early in the site selection evaluation process. These strategic actions are designed to serve as a framework for the development of detailed marketing plans and supporting promotional budgets. Immediate The following are actions can be taken immediately. Goal(s) 1. Define & Build Credibility 1. Define & Build Credibility 1. Define & Build Credibility 2. Promote Advantages 1. Define & Build Credibility 2. Promote Advantages 2. Promote Advantages 3. Reach Target Markets Early in the Process 3. Reach Target Markets Early in the Process Actions Integrate SI Green Zone definition and key message into the existing SIEDC website. List existing businesses engaged in Green activities (see location assessment) on the website List Key Advantages on the existing website Establish a Green Zone Member designation for businesses located in the zone which support sustainable practices. Create a logo for Green Zone Membership Incorporate Member logo on existing website Produce and distribute lobby plaques to all Members Incorporate the SI Green Zone definition and Key Advantages into Green Zone focus in Opportunity Staten Island publication Incorporate the Key Advantages of the Green Zone in the March 2010 Green and Clean Expo This Expo would be an excellent opportunity to introduce the Green Zone Membership logo Incorporate the Key Advantages of the Green Zone on the existing SIEDC website page link to NYC EDC, NYS-ESDC List summary of available Green Zone properties on the existing SIEDC website page Ensure all available Green Zone properties are listed on New York First property website maintained by the State Incorporate the Key Advantages and Incentives of the Green Zone on the New York First property website 36
159 Short-Term The following strategic actions are short-term, to be enacted within one year. Establish a Green Zone Certification designation for businesses located in the zone which implement sustainable practices and achieve certification. Create a logo for Green Zone Certification 1. Define & Build Credibility Award Certification in public ceremony, including media coverage This should be an ongoing program to provide regular opportunities for media coverage Create a new Green Zone component for the SIEDC website 2. Promote Advantages Access to the Green Zone information must appear on SIEDC home page 3. Reach Target Markets Early in and link to NYC EDC, NYS ESDC the Process Content should follow outline provided in Website Marketing Plan found on subsequent pages 2. Promote Advantages 3. Reach Target Markets Early in the Process 2. Promote Advantages 3. Reach Target Markets Early in the Process Create a new Green Zone component for the SIEDC website Access to the Green Zone information must appear on SIEDC home page Content should follow outline provided in Website Marketing Plan found on subsequent pages Implement a public relations campaign that seeks opportunities to submit press releases to publications reaching the real estate, logistics, green economy, recycling and general business communities. Prepare press releases regarding Green Zone certification, Green Zone target clusters, available properties and other newsworthy information. Example publications include: Mid Atlantic Real Estate Journal New York Real Estate Journal Real Estate Weekly The Real Deal New York Times Logistics Management Magazine Logistics World Online The Green Economy Magazine Recycling Today Site Selection CORENET Site selection firms such as FTI including major accounting firms 37
160 Long Term (1+ years) The following are longer term strategies, to be enacted in one year or more. 2. Promote Advantages 3. Reach Target Markets Early in the Process 2. Promote Advantages 3. Reach Target Markets Early in the Process 3. Reach Target Markets Early in the Process Implement a broad promotional plan targeting developers, real estate professionals and end users within the NY, NJ, PA and CT region. Seek opportunities to submit editorial content to publications and websites directly reaching the real estate and business communities. Promote success stories whenever possible. Strategically select publications and websites directly reaching the real estate and business communities for advertising large and editorial submittals. As barriers to the freight consolidation and freight village markets are removed, expand advertising and promotional efforts to the third party logistics and freight distribution markets. Strategically select publications and websites directly reaching the third party logistics and freight distribution markets, such as Logistics Management Magazine and Logistics World Online. Implement programs that will reduce or remove competitive weaknesses, such as cost of access and permitting process. Such programs will help rank SI higher in the site selection process. 38
161 Website Marketing Plan A key component of SIEDC s marketing strategy for the Green Zone must be its web presence. The website should be used to promote the Green Zone and for direct marketing of available properties. The target audience is potential or existing businesses in the Green Zone. Ideally, the Green Zone would have its own web presence linked from but independent of the SIEDC. While the existing SIEDC website has robust content, the content is focused on attracting and maintaining members rather than promoting Staten Island or its business climate. A separate but linked website would allow the flexibility needed to focus on attracting businesses to the Green Zone. Furthermore, a separate Green Zone website could utilize search engine optimization techniques and ultimately achieve higher search engine ranking for both SIEDC and the Green Zone. This would increase web visibility and improve internet marketing effectiveness. It also important to link to NYC, NYS, New York Business Council, NYC Partnership and other prominent regional government and NGO websites The following is a strategy for developing and organizing web content in a manner that will effectively communicate the key messages and help reach target markets early in the site selection process. This content mapping can be achieved either through an independent website site address such as SIGreenZone.com or as additional pages through the current SIEDC website. Website Map Navigation SIEDC.org (assumed as the Home page in the following sequence) Home > Green Zone Home > Green Zone > Advantages Home > Green Zone > Advantages > Business Climate Home > Green Zone > Advantages > Good Company Home > Green Zone > Available Sites Content Recommendations The Green Zone should be a direct link from the SIEDC home page. The information is currently buried under programs and services, providing little marketing and search engine benefit. Green Zone definition Map of green zone area Featured Member call-out box with link to Good Company page Featured Site call-out box with link to Available Sites page Latest news headline with link to News page List of Green Zone Advantages General paragraph on business climate with live links Business Climate page and List of potential incentive programs and other resources Case study of a Green Zone business, why the Green Zone location is a benefit, cost savings, economic advantages, etc. General text on population and demographics Staten Island workforce specific data (skilled workforce, unemployment, education achievement, etc.) Economic data on metropolitan area consumer markets (purchasing in key sectors) Industry clusters (target markets) with link to Good Company page List and links to business resources and area information You re in Good Company in the Green Zone List of all Green Zone companies, with Certification Designations, links to company websites (a benefit of locating in GZ) Map of the Green Zone with available properties marked Rollover call-out with data on each available property 39
162 Home > Green Zone > Available Sites > Featured Site Home > Green Zone > News Home> Green Zone > Contact Contact information for each available property (a benefit of locating in GZ) Box highlighting the featured site with link to sub page Detailed information on the featured site Photos, map Available incentives Unique features and characteristics Contact for sale or lease Property related announcements available sites, new tenants, new owners Incentive announcements new incentives, grant opportunities, partnerships and programs Green Zone Certification announcements new certifications, award ceremonies Contact information for SIEDC Green Zone representative(s) 40
163 Partnership Opportunities Our research of best practices consistently showed that the most successful redevelopment zones were highly dependent upon a network of partners working together to implement shared goals. The process of connecting incentives to redevelopment opportunity is by its nature a collaborative process between public, not-for-profit and private entities. Additionally, the ambitious near-term and longer-term strategies that we will put forth for the Green Zone are ALL dependent upon the actions of others. It is clear that partnerships are key to success. The SIEDC has already formed a number of important partnerships in order to embark upon its Green Zone redevelopment effort. The SIEDC is in constant contact with local elected officials on Staten Island, the local utilities, real estate agencies and banking establishments. At the State level, the SIEDC is working with the State Department of State to garner funding to enter the BOA program in order to redevelop specific sites within the district. The partnerships extend to the federal level, partnering with the USEDA for study funds to structure their redevelopment game plan. Beyond the public realm, SIEDC must continue to extend its contact with the private sector, looking for opportunities to garner funding to support private development strategies. Finally, the SIEDC can be most instrumental as it exerts itself as the conduit to the private sector to entice new business to the Green Zone. Further partnerships at all levels private, local, City, State and Federal, will be needed to implement the Green Zone strategic plan. The following represent some o f the key partnerships that SIEDC should capitalize upon to foster in order to implement its Green Zone goals. We have organized these partnerships into three categories: Public partnerships Public-Private partnerships Private partnerships Identified below are both recommendations for new partners or already established relationships that can be leveraged into partnerships for the further development of the Green Zone. Staten Island By their frequently serving as the primary facilitator between the public and private sector on the island the SIEDC is well positioned to formally serve as the primary entity needed to effectively plan for and create economic development opportunities on Staten Island. Our interviews uncovered the concerns of a number of local businesses regarding their inability to do business on Staten Island and these businesses are therefore looking for support and solutions from those who can organize and advocate on their behalf. The SIEDC is clearly the organization they must turn to by virtue of its having the greatest clout to enact change to benefit local business. The Green and Clean EXPO is one exemplary instance of SIEDC s ability to facilitate the business community s organizing around specific solutions that will encourage business development on Staten Island. Through the Green and Clean EXPO, the SIEDC can structure a redevelopment agenda and garner immediate private business community support for strategic initiatives that would involve the participation and action of agencies and entities that could enact positive change. The strength of the voice of the local business community is a powerful force and is often the voice that leads to positive public sector action. The SIEDC is uniquely positioned to connect the interests of business with the local elected constituency thus bringing together the agendas of the public and private sector and focusing that energy on specific development 41
164 oriented actions that need to be implemented to support redevelopment on Staten Island. An ongoing conversation with the existing corporate base serves many goals. These include: Creating a better understanding of the actual benefits and drawbacks of the location from the business point of view; Providing a regular source of ideas for how to improve things in the area or what issues to stress when speaking with new prospective companies; Establishing an awareness of the cost, regulatory, operational, and other business issues which may be negatively impacting the area; Serving as an early warning system to identify companies who may be struggling or who may be considering leaving the area; Becoming the platform to effectively market the area to new types of companies based upon local business partnerships and needs that existing companies must meet, Serving as the organized voice to focus on specific strategic actions. Ideally, under SIEDC s stewardship these companies will act as an organized advocacy group during their normal course of business, further strengthening their binds with SIEDC while simultaneously advocating for the incentives, regulatory changes and partnerships that will improve the local business environment. Existing companies can and should be included in marketing and other messaging that the SIEDC develops to attract new companies. We have found that in many cases, one of the key attractions for new businesses is a strong and active current business environment from which to support new business activities. Next Steps Taking the partnership approach one step further, the SIEDC based on its experience and existing track record of encouraging redevelopment, is already well educated and can quickly become recognized as the primary agency on Staten Island that is expert in financing, public incentives, regulatory processes and all steps needed to prepare various sites for resale and redevelopment. As the primary local organization possessing the knowledge and depth of contacts needed to move sites through the evaluation and preparation process, local businesses will look to SIEDC for the technical support and Recommendation SIEDC should continue to expand its expertise in financing, public incentives, regulatory processes and steps needed to prepare various sites for resale and redevelopment. ongoing assistance they will need to successfully navigate the development landscape. As partner in this process it is incumbent on the SIEDC to capitalize on this extremely important service and look to bring additional staff on board, either through grants or through partnerships with private businesses in order to increase and enhance its technical capabilities to support redevelopment efforts. In doing so Real Estate brokers and companies looking to either develop their properties or simply increase their land values will recognize the benefits of the support SIEDC can offer them and will be receptive to supporting such work monetarily whether through a direct fee for services agreement or success fees depending on the individual project. Entities like SIEDC gain credibility in the private sector s eyes when services offered are tied to a fee structure which promises them direct results. 42
165 New York City There are a number of New York City agencies conducting planning on Staten Island. Two of the most active at present are the New York City Department of City Planning and the New York City Economic Development Corporation. These two agencies have partnered to author two very important planning documents that define the City s approach to development along the West Shore of Staten Island. While there is not universal agreement between the SIEDC and these agencies on exact measures to be undertaken along the West Shore, there is overwhelming commonalities in belief in the direction that should be taken on the West Shore of Staten Island, which presents an excellent opportunity for SIEDC and the local elected officials on Staten Island to find common goals to mutually support and work towards. All parties have publicly stated that there are no plans to promote the West Shore of Staten Island for residential use and the West Shore 2030 plan strongly supports the notion that the West Shore can effectively grow as a primarily industrial zone. The SIEDC should build upon these common goals in order to build support within these agencies for the directives SIEDC will put forth to promote redevelopment. The partnerships extend well beyond these two agencies, however. For example, the Mayor s Office of Environmental Remediation has been created to promote brownfield redevelopment throughout the City of New York and specifically to assist organizations such as SIEDC and private owners and developers who are seeking to redevelop brownfield lands to navigate the often arduous regulatory process, provide access to public seed funding and structure redevelopment strategies. The SIEDC sees the MOER as a partner in the development of the Green Zone. As the SIEDC develops both short-term and long-term strategies to improve the business climate, there are a number of agencies that will need to play a role in their implementation. New York City Economic Development Corporation (EDC) The EDC has engaged in dialogue with SIEDC specific to the West Shore of Staten Island. The EDC shares the goal of industrial and corporate redevelopment for the West Shore and has focused its efforts on unlocking the opportunities inherent to the West Shore to attract new business development. The EDC is actively pursuing sale and redevelopment of multiple sites on the West Shore and has engaged the SIEDC as its local broker to encourage sales. As part of our mission, we have developed a marketing strategy for SIEDC to enhance ability to target companies and effectively illustrate the benefits of this location. Employing this marketing strategy for these early action sites is a logical next step in the SIEDC EDC partnership. Building on any early success, it is our recommendation that the SIEDC look to partner with the EDC on future redevelopment plans for publicly-owned sites within the Green Zone, and, where possible, SIEDC should seek to take the lead on advertising, marketing and recruiting businesses to locate on these properties. More importantly, as the SIEDC looks to create the Green Zone, a dialogue to bring EDC in line with SIEDC goals and objectives for redevelopment will further strengthen the partnership. Effective planning for redevelopment of key public sites that can foster further redevelopment opportunity can be a critical component of any redevelopment strategy. While any sale is a benefit, many organizations have utilized choice public real estate sites as the cornerstone for larger redevelopment strategies. While most of the redevelopment that will take place within the Green Zone will take place on private property, the public sites that are suitable for redevelopment can be prepared to be shovel ready, thus enhancing their viability and value as potential development sites. The SIEDC and EDC should work together to determine any potential improvements that can be made to enhance the viability of City sites for resale and lay out a plan of action for making those improvements so that when the sites are 43
166 turned over, a new productive use is achieved that will catalyze additional business investment. Improvements could take the form of capital improvements, but often clearing regulatory and permitting hurdles, packaging incentives and removing risk barriers to redevelopment are similarly effective improvements that will help to attract new development. EDC performs many services. In addition to planning for economic development, EDC administers the Industrial Business Zone Relocation Credit, a tax credit for businesses who chose to relocate in one of the IBZ areas of the City. The SIEDC is already working with the EDC to structure co-terminus boundaries for the IBZ to match the Green Zone so that businesses can take advantage of this incentive. Depending on the specific strategies that SIEDC will wish to implement, specific departments within the agency will be important partners to work with. For example, if maritime support services are a concentration for some of the underdeveloped land within the GZ, the Maritime Department of the NYCEDC would be a potential partner. Next Steps The SIEDC and EDC should review the conditions of public sites that both parties consider ready for sale. This analysis should identify site specific challenges that would deter a future developer from purchasing the site. Through this process, the EDC-SIEDC partners should develop a checklist of improvements that would benefit resale and then determine which of these can provide the greatest benefit for the least amount of effort or financial input and prioritize a game plan for implementing these changes. For example, if a City property is a former brownfield, one action could be to work with the MOER to conduct Phase I evaluations for the site so that the site can be sold with specific knowledge of remediation that will need to be undertaken prior to development. The SIEDC should formulate an IBZ for the West Shore of Staten Island and coordinate that effort with an SMIA designation (see DCP below) if SIEDC feels that SMIA designation is beneficial to its redevelopment strategy. The New York City Department of City Planning (DCP) The New York City Department of City Planning has taken a lead role in two important areas. The Comprehensive Waterfront Plan for the City of New York and the West Shore 2020 Long Range Planning Vision. WAVES: Vision 2020: The New York City Comprehensive Waterfront Plan The Waterfront and Open Space division of the Department of City Planning has recently published its update of the 1992 waterfront plan for the 520 miles of waterfront that make up New York City. The award winning Vision 2020: New York City Comprehensive Waterfront Plan, otherwise known as WAVES, makes general recommendations for the West Shore of Staten Island to continue to support the area as a working waterfront to support maritime and industrial uses. The production of this report offers an opportunity to work the Department of City Planning to further refine its approach and support for industrial development along the West Shore waterfront. For example, in recognition of the planning that has been undertaken along the North Shore of Staten Island, the waterfront plan specifically calls out a large section of the industrial waterfront along the North Shore as a Significant Maritime and Industrial Area (SMIA). While the West Shore of Staten Island was not designated in this manner, the EDC and SIEDC have been in discussions to form an IBZ for this area, and with the exception of the North Shore SMIA, all other SMIA s in the City are contained within larger IBZ areas to promote redevelopment strategies. 44
167 Next Steps The SIEDC should determine whether an SMIA designation would support the economic development goals of the SIEDC for the West Shore of Staten Island. If so, the SIEDC should work with DCP to achieve this designation for the West Shore. This analysis should be coordinated with the SIEDC plans for implementing an IBZ along the West Shore. Working West Shore 2030 Plan DCP, in partnership with EDC, recently published the Working West Shore 2030 Creating Economic Opportunity, Improving Infrastructure and Managing Growth Plan for the West Shore of Staten Island. In general terms, the plan supports industrial growth along the West Shore of Staten Island and promotes some strategies to support that growth. The study supports maritime and port-related uses along the waterfront, which conforms to SIEDC Green Zone goals. The study also calls for the implementation of storm water management guidelines to facilitate industrial and commercial development while preserving and improving extensive natural areas which conforms to our goal of developing the West Shore into a bluebelt zone. DCP is also looking to increase access to the West Shore in recognition that the properties on the West Shore are isolated, which diminishes land value by complicating access and exposure. The SIEDC agrees that the road system accessing the West Shore limits access to key industrial communities and has proposed a near-term solution to improving access (see NYC DOT and NYS DOT partnerships below). Much of the development of the West Shore is pegged to new transit opportunities. While a specific West Shore Transit alternative is not defined in the study, the study provides recommendations and opportunity to capture value from new Transit along the West Shore. The SIEDC recognizes that a West Shore Transit system will be a significant economic benefit to West Shore development and is actively pursuing the next stage of study for new Transit. Next Steps Building off of the recommendations made by DCP for the Working West Shore, SIEDC should continue to pursue funding for West Shore Transit and pursue near-term opportunities to increase access to the West Shore. Mayor s Office of Environmental Remediation (MOER) The SIEDC is already working with MOER as an ambassador to local property owners to entice those owners to take advantage of the incentives and technical assistance that MOER can provide to assist in the redevelopment process. This is a difficult role for SIEDC to play, but one that is essential at the local level by an entity that owners can trust. Many of the sites along the West Shore are either on the waterfront, encumbered by fresh water wetlands or both. Therefore, many of these sites are heavily regulated by the New York State Department of Environmental Conservation (NYSDEC). Additionally, many also fall into the category of brownfields, adding a further arm of regulatory oversight by NYSDEC. NYSDEC is viewed primarily as a punitive operation and a roadblock to development, and we have learned through our interviews and outreach that there is a significant level of mistrust between owners along the West Shore and NYSDEC. Re-engaging these owners to reach out to OER for assistance will require the SIEDC in cooperation with the OER to mend fences in order to engage owners in a meaningful dialogue. The SIEDC and OER have already partnered on one property on Staten Island and should look to build from that success in order to draw greater benefit from the very valuable incentive programs available through OER. Next Steps 45
168 SIEDC should look to structure events and individual meetings between OER and owners in order to connect owners up to OER programs. SIEDC should then market these success stories in order to promote brownfield redevelopment to West Shore businesses. Mayor s Office of Long Term Planning and Sustainability (LTPS) The Mayor s Office of Long-Term Planning and Sustainability (LTPS) is largely responsible for the roll-out of PlaNYC, the blueprint for sustainable development for the City of New York. As the architect of the plan, LTPS has its pulse on a host of initiatives that have the potential to support Green Zone redevelopment opportunity. As an example, LTPS is the driver behind the proposal that the City of New York will be making to the Governor s Office to garner funds for the Cleaner Greener Communities Regional Sustainability Planning Grant which came out in the Fall of 2011 and calls for Recommendation SIEDC should continue to work with OER, connecting incentives to owners to catalyze brownfield redevelopment. each region to develop a sustainability plan. LTPS is moving forward on a number of initiatives that relate to economic development through sustainable approaches and the SIEDC should continue to stay in touch with LTPS to determine if there are any synergies between plans. LTPS will soon be putting forward an RFQ for consortiums to develop waste to energy conversation technologies within the boundaries of the City of New York. The SIEDC is currently looking to site new sustainable technologies within the Green Zone and the Green Zone contains the uses namely the Staten Island Waste Transfer Station and the NRG Power Plant that can provide the baseline infrastructure to house a power plant using this technology. Synergies of this nature could significantly jumpstart economic development in the Green Zone. Our research shows that a facility of this nature can also capture waste heat from energy conversion and channel that heat into energy for local industrial use, creating the spin-off incentive of low-cost heat provision for any business that would site itself within one-half mile of the plant. Next Steps SIEDC should meet with LTPS to discuss the upcoming RFQ on waste conversion technologies and the ongoing partnership with the Governor s Office to implement the Governor s Cleaner Greener NY program. New York City Department of Environmental Protection (DEP) The New York City Department of Environmental Protection (DEP) has built the Staten Island Bluebelt system as a way to improve flood control and surface water quality. The current system drains sixteen watersheds, mostly on the east and south shores of Staten Island. There are several sites that may be joined together to create another Bluebelt system along the west shore of Staten Island, within the parameters of the Green Zone study area. Working together with DEP to facilitate the creation of a potential Bluebelt system will be the best way to move this idea forward. The stormwater management strategy that will be presented in Task 4 will not be achievable without significant buy in, study, and consideration from DEP, DPR and NYSDEC (see below). 46
169 Next Steps SIEDC should form a stakeholder committee, including representation from affected agencies and local elected leaders to explore the feasibility of designating the Green Zone as a bluebelt district. New York City Parks Department (DPR) While one would not necessarily equate parks and economic development in the same sentence, but the Parks Department will actually ultimately play a very important role in the future development of the Staten Island Green Zone. DPR is the manager of the Fresh Kills Park a 2200 acre natural habitat on the former Fresh Kills Landfill that SIEDC purposely included within the Green Zone. The opportunity presented by Fresh Kills Park is significant. It is an internationally recognized reclamation project and therefore any implementation on the Park will gain immediate local, national and international interest. To the extent that a sustainable pilot project could be undertaken for Fresh Kills Park, it could bring significant immediate attention to the site and the district. We also recognize that due to the level of funding, the nature of the ongoing closure and the current plans for the park, that any project to install a sustainable pilot at Fresh Kills would not be a short-term initiative. However, there are many opportunities. Wind power, solar power and the re-use of the methane gas for a particular incentivized use within the district all would provide compelling storylines for the Green Zone. Additionally, should we be able to focus the NYC DEP on the establishment of a bluebelt designation for the district, the Parks Department would certainly be involved in the management of the lands set aside as parkland to handle stormwater runoff within the district. There is already a significant amount of land set aside for City use within the district, much of which corresponds to lands that would accommodate stormwater management facilities. Should SIEDC be able to move forward with bluebelt designation, SIEDC would need to work with DPR, The New York City Department of Environmental Protection (see above), and the New York State Department of Environmental Conservation to identify bluebelt corridors and the lands to be set aside for bluebelt, designated parkland and lands that could be repurposed for redevelopment of other use. Next Steps SIEDC should include representation from the Parks Department on its Bluebelt initiative. New York City Department of Transportation (DOT) and New York State Department of Transportation (NYSDOT) The SIEDC is interested in increasing access to the industrial West Shore of Staten Island and have proposed a very cost effective solution that will greatly enhance accessibility and control the flow of truck traffic within the zone. The solution proposed is to make Gulf Avenue, a stretch of the Route 440 service road, into a two-way street between Forest Avenue and Edward Curry Avenue. Access into the Wes Shore industrial zones north of Edward Curry Avenue is problematic, especially from the South and the Northeast. Coming from the South, a vehicle must travel past the zone to the North on the service road and then cross back along local streets to access the southbound service road, a circuitous and unmarked route. From the Northeast, a truck would have to know to get off of the Staten Island Expressway to get to the local service road to Route 440 as the first exit on Route 440 is south of this section of the Green Zone. Lack of access is a clear disincentive to siting a business in the northern section of the Green Zone. 47
170 Next Steps: Develop a plan of action for converting Gulf Avenue into two-way street for presentation to DOT and to NYSDOT. Since Gulf road is a service road to Route 440, both entities will need to review the proposal. The SIEDC should also consider approaching the EDC for support in its proposal as an economic argument in addition to an access argument will help to strengthen the rationale for making Gulf Avenue a two-way street. State and Regional Partnerships New York State Department of State (NYSDOS) The New York State Department of State (NYSDOS) runs the Brownfield Opportunity Areas (BOA) Program, designed to assist communities, foster redevelopment and return dormant and blighted land into productive and catalytic areas while restoring environmental quality. This program provides municipalities and community-based organizations with resources to address local brownfields providing area-wide brownfield redevelopment planning, access to expert environmental and economic analysis, and environmental site assessment for strategic redevelopment parcels. The SIEDC has already partnered with the NYSDOS and submitted a BOA grant Step 1/Step 2 application for a section of the Green Zone. Next Steps: SIEDC should continue to meet with the NYSDOS to update them on the progress being made on the Green Zone development in order to illustrate how that work feeds in to the overall BOA redevelopment goals of the NYS DOS. New York State Department of Environmental Conservation (DEC) A large hurdle in the redevelopment process in and around New York City, and especially in Staten Island, has been the permitting processes with various City and State agencies. Many of those businesses we asked have spent years getting the permits needed to build and do business on their property. Working together with the NYCDEP, SIEDC can propose the stormwater management strategy to NYSDEC as a way to cut down some time in the redevelopment process. Designation of a new Bluebelt area within the Green Zone could allow for the discussion of a blanket permit for the entire zone if certain criteria are met. Next Steps Coordinate a Bluebelt development proposal with DEP and local business owners to present to the NYS DEC for review and consideration. The goal of the Bluebelt designation is three-fold: it will reduce both public and private construction costs for stormwater management; it will determine properties that need to be designated for bluebelt and properties that can be freed-up for development; and it will enable the DEC to develop a blanket permitting strategy for the entire district that concentrates tidal Recommendation SIEDC should coordinate with DEP and local businesses to establish a Bluebelt designation. and freshwater wetland mitigations where they are most needed to preserve the most pristine areas of the district, while enabling private owners to move forward with development plans in keeping with the larger bluebelt strategy. Port Authority of New York and New Jersey (PANYNJ) The PANYNJ clearly plays a significant role with the future of the western shore of Staten Island with the imminent expansion of Howland Hook, to the north, the raising of the Goethals Bridge to facilitate 48
171 container ship movement through the Kill Van Kull and the upgrade and reconstruction of the Goethals Bridge. Howland Hook terminal represents an important industrial maritime economic anchor for Staten Island, one which SHOULD encourage satellite support services and spin-off business enterprise. It is the hope that an expanded Howland Hook will generate additional industrial use and if so, the West Shore of Staten Island should stand to benefit. However, there may be additional opportunity for PANYNJ to catalyze growth in the Green Zone. Our research points to a number of potential industrial sub-markets that could take advantage of the attributes provided by the Green Zone. One potential symbiotic industrial use would be a Freight Logistics Center. A freight logistics center on Staten Island could directly support Port activity. To that end, if PANYNJ were to designate the Green Zone as a foreign trade zone, it could directly attract companies looking to assemble products, which is a typical industrial spin-off from freight logistics facilities. With or without the hook of a freight logistics center, creating a foreign trade zone would be a further incentive for businesses to locate on Staten Island. Next Steps SIEDC has already commenced a dialogue with PANYNJ to identify the steps that would need to be taken to expand the current foreign trade zone established for the Port of NY and NJ. SIEDC should continue those discussions in order to determine the means to enact this initiative and to identify the value it can bring to PANYNJ and to the overall region. Federal U.S. Economic Development Administration Similar to the grant furnished by the US EDA for this study, this agency is in the business of supporting the types of projects that spur job creation. The SIEDC should look to the federal agencies for continued support on local initiatives that promote economic development. Private New York Investment Fund (NYIF) The importance of creating partnerships extends beyond local business, local elected leaders and agencies. Ultimately, SIEDC s ability to spur reinvestment along the West Shore will need to extend into the financing of the implementation of projects. There are a number of organizations looking to fund projects, and many are now concentrating on sustainable projects and sustainable companies. Right in New York City, there is the New York Investment Fund (NYIF), which partners with private businesses to develop in New York City. Working with the NYIF, the SIEDC will be able to test development concepts to see if there might be development and financing interest. As sites become available, SIEDC should make NYIF aware of the potential of each so that NYIF is aware of available land for potential siting of projects that it is looking to finance. Recommendations The SIEDC was established in the 1990s and has grown into an organization that can lead development strategies for Staten Island. It has the history and reputation to reach out and connect to local, City, State and Federal agencies and should leverage that reputation to take on an even larger leadership position in development on Staten Island. The Green Zone Consulting Services project will make a number of redevelopment recommendations and put forth a series of steps that the SIEDC will need to implement over both short and long-term 49
172 timeframes. Each of these initiatives will required continued dialogue with many of the partners listed above. We recommend that the SIEDC form a strategic committee that includes these agencies in order to structure teams that can assist and partner with SIEDC to implement its objectives. In the short-term, the Green Zone Technical Advisory Committee can help the SIEDC to analyze strategies and identify the role that the agency can play in helping to implement. In the longer-term, the advisory committee can help to create new initiatives that serve both the goals of the agency and the SIEDC in order to promote new development opportunities in the Green Zone. 50
173 I. Green Incentives Matrix
174 Existing Green Incentives Chart Eligible Entity Type of Incentive Eligible Activities Green Zone Incentive Type Professional Services Gov't R & D Supplier Purchaser Cleantech Business Only Loan Grant Technical Assistance Tax Deduction Tax Credit Capital Program Name Administrator Property Manufacturing Distribution Operations Marketing & Sales R & D Design Services Job Training Green Jobs Green Buildings Green Land Energy Audit Program Con Ed x x x x x x x x x x Con Edison Strategic Partnerships Con Ed x x x x x x Green Building Tax Credit Program DEC x x x x x x x x x x x US Department of Energy Loan Guarantees DOE x x x x x x x Environmental Investment Program ESDC X x x x x x Alternative Fuel Blender Excise Tax Credit IRS x x x x x x Alternative Fuel Excise Tax Credit IRS x x x x x x x Biodiesel Income Tax Credit IRS x x x x x x Biodiesel Mixture Excise Tax Credit IRS x x x x x x x Cellusocic Biofuel Producers Tax Credit IRS x x x x x x Energy Efficient Commercial Buildings Tax Deduction IRS x x x x x Investment Tax Credit IRS x x x x x x x x x x Qualified Alternative Fuel IRS x x x x x x x x Motor Vehicle Tax Credit Qualifying Advanced Energy Investment Tax Credit IRS x x x x x x x x x Renewable Electricity Production Tax Credit (PTC) IRS x x x x x x x x Small Agri-Biodiesel Producer IRS Tax Credit x x x x x x x Tax Deductions for Commercial Buildings IRS x x x x x x NYC Green Roof Tax Abatement NYC Building x x x x x x NYC Solar Property Tax Abatement NYC Building x x x x x x x New York City Investment Fund NYCIF x x x x x x x x x x x x Green Zones NYPA x x x x x x x
175 Eligible Entity Type of Incentive Eligible Activities Green Zone Incentive Type Professional Services Gov't R & D Supplier Purchaser Cleantech Business Only Loan Grant Technical Assistance Tax Deduction Tax Credit Capital Program Name Administrator Property Manufacturing Distribution Operations Marketing & Sales R & D Design Services Job Training Green Jobs Green Buildings Green Land Qualified Emerging Technology Companies NYS DOF x x x x x x x x x x x x x (QETC) Incentive Program Business Partners Commercial Lighting Program NYSERDA x x x x x x x Incentives Clean Energy Business Growth and Development NYSERDA x x x x x x x x x Existing Facilities: Combined Heat and Power Incentives Existing Facilities: Demand Response Incentive Existing Facilities: Electric Efficiency Incentive Existing Facilities: Industrial and Process Efficiency Incentive Existing Facilities: Pre- Qualified Incentives NYSERDA x x x x x x x x x x x x NYSERDA x x x x x x x x x x x NYSERDA x x x x x x x x x x x NYSERDA x x x x x x x x x NYSERDA x x x x x x x x x Flexible Technical Assistance NYSERDA x x x x x x x x x x x New Construction Program NYSERDA x x x x x x x x x x x x x x Renewable, Clean, and Energy Efficient Production NYSERDA x x x x x x x x Incentive Advanced Technology Vehicle Manufacturing Incentives US DOE x x x x x
176 Administrator Program Name Description Con Ed Con Ed DEC Energy Audit Program Con Edison Strategic Partnerships Green Building Tax Credit Program Provides low-cost, walk-through energy audits to small businesses and other non-residential facilities to help them make informed electrical decisions and identify improvements that yield electric savings. Certified customers of Con Edison with annual electric utility bills less than $75,000 are eligible. Makes grants to tax-exempt non-profit organizations that share the Con Edison s concern for preserving and protecting the environment through conservation and beautification projects as well as through educational and career-development programs. Con Edison awards grants for specific projects rather than for general operating support. Con Edison does not award grants for reducing debts or past operating deficits. A New York State tax credit available to owners and tenants of eligible buildings and tenant spaces which meet certain green standards that increase energy efficiency, improve indoor air quality and reduce the environmental impacts of large commercial and residential buildings. For period two (which allows tax credits to be received in years 2006 through 2014), there is a $2 million cap per credit component certificates in aggregate per building. DOE US Department of Energy Loan Guarantees Guarantees may cover up to 80% of costs for renewable energy and electric power transmission projects. ESDC Environmental Investment Program This program makes up to $1 million available to help businesses capture the economic benefits associated with pollution prevention, waste reduction, re-use, recycling and sustainable products and process technologies. IRS IRS IRS IRS IRS IRS IRS IRS Alternative Fuel Blender Excise Tax Credit Alternative Fuel Excise Tax Credit Biodiesel Income Tax Credit Biodiesel Mixture Excise Tax Credit Cellusocic Biofuel Producers Tax Credit Energy Efficient Commercial Buildings Tax Deduction Investment Tax Credit Qualified Alternative Fuel Motor Vehicle Tax Credit An alternative fuel blender that is registered with the Internal Revenue Service (IRS) may be eligible for a tax incentive on the sale or use of the alternative fuel blend (mixture) for use as a fuel in the blender's trade or business. The credit is in the amount of $0.50 per gallon of alternative fuel used to produce a mixture containing at least 0.1% gasoline, diesel, or kerosene. Qualified alternative fuels are: compressed natural gas (based on 121 cubic feet), liquefied natural gas, liquefied petroleum gas, P-Series fuel, liquid fuel derived from coal through the Fischer-Tropsch process, and compressed or liquefied gas derived from biomass. The incentive must first be taken as a credit against the blender's alternative fuel tax liability; any excess over this fuel tax liability may be claimed as a direct payment from the IRS. The tax credit is not allowed if an incentive for the same alternative fuel is also determined under the rules for the ethanol or biodiesel tax credits. A tax incentive is available for alternative fuel that is sold for use or used as a fuel to operate a motor vehicle. A tax credit in the amount of $0.50 per gallon is available for the following alternative fuels: compressed natural gas (based on 121 cubic feet), liquefied natural gas, liquefied petroleum gas, P-Series fuel, liquid fuel derived from coal through the Fischer-Tropsch process, and compressed or liquefied gas derived from biomass. For an entity to be eligible to claim the credit they must be liable for reporting and paying the federal excise tax on the sale or use of the fuel in a motor vehicle. Tax exempt entities such as state and local governments that dispense qualified fuel from an on-site fueling station for use in vehicles qualify for the incentive. Eligible entities must be registered with the Internal Revenue Service (IRS). The incentive must first be taken as a credit against the entity's alternative fuel tax liability; any excess over this fuel tax liability may be claimed as a direct payment from the IRS. A taxpayer that delivers pure, unblended biodiesel (B100) into the tank of a vehicle or uses B100 as an on-road fuel in their trade or business may be eligible for an incentive in the amount of $1.00 per gallon of biodiesel, agri-biodiesel, or renewable diesel. If the biodiesel was sold at retail, only the person that sold the fuel and placed it into the tank of the vehicle is eligible for the tax credit. The incentive is allowed as a credit against the taxpayer's income tax liability. A biodiesel blender that is registered with the Internal Revenue Service (IRS) may be eligible for a tax incentive in the amount of $1.00 per gallon of pure biodiesel, agribiodiesel, or renewable diesel blended with petroleum diesel to produce a mixture containing at least 0.1% diesel fuel. Only blenders that have produced and sold or used the qualified biodiesel mixture as a fuel in their trade or business are eligible for the tax credit. The incentive must first be taken as a credit against the blender's fuel tax liability; any excess over this tax liability may be claimed as a direct payment from the IRS. A cellulosic biofuel producer that is registered with the Internal Revenue Service (IRS) may be eligible for a tax incentive in the amount of up to $1.01 per gallon of cellulosic biofuel that is: sold and used by the purchaser in the purchaser's trade or business to produce a cellulosic biofuel mixture; sold and used by the purchaser as a fuel in a trade or business; sold at retail for use as a motor vehicle fuel; used by the producer in a trade or business to produce a cellulosic biofuel mixture; or used by the producer as a fuel in a trade or business A tax deduction of $1.80 per square foot is available to owners of newor existing buildingswho install (1) interior lighting, (2) building envelope, or (3) heating, cooling, ventilation, or hotwater systems that reduce the building s total energy and power cost by 50%or more in comparison to a building meeting minimum requirements set by ASHRAE Standard Credits are available for eligible systems placed in service on or before December 31, The credit is equal to 30% of expenditures for solar, fuel cells and small wind and 10% of expenditures for geothermal, microturbines and CHP. Credit is available towards the purchase of new, original equipment manufacturer vehicles or vehicles that have been re-powered by an aftermarket conversion company to operate on an alternative fuel (natural gas, liquefied petroleum gas, hydrogen, and fuel containing at least 85% methanol).
177 Administrator Program Name Description IRS IRS IRS Qualifying Advanced Energy Investment Tax Credit Renewable Electricity Production Tax Credit (PTC) Small Agri-Biodiesel Producer Tax Credit An investment tax credit is equal to 30% of the qualified investment required for an advanced energy project that establishes, re-equips or expands a manufacturing facility that produces any of the following: s Equipment and/or technologies used to produced energy from the sun, wind, geothermal or other renewable resources s Fuel cells, microturbines or energy-storage systems for use with electric or hybrid-electric motor vehicles s Equipment used to refine or blend renewable fuels s Equipment and/or technologies to produce energy-conservation technologies Qualified investments generally include personal tangible property that is depreciable and required for the production process. Any taxpayer receiving this credit may not also receive the Investment Tax Credit. A per-kilowatt-hour tax credit for electricity generated by qualified energy resources and sold by the taxpayer to an unrelated person during the taxable year. Credit is based on actual kwh production of various renewable energy technologies. An income tax credit of $0.10 per gallon of agri-biodiesel is available to qualified small producers. A small producer is one that produces up to 60 million gallons of agribiodiesel per year. The credit applies only to the first 15 million gallons of agri-biodiesel produced in a tax year. IRS NYC Building NYC Building NYCIF Tax Deductions for Commercial Buildings NYC Green Roof Tax Abatement NYC Solar Property Tax Abatement New York City Investment Fund A tax deduction of up to $1.80 per square foot is available to owners or designers of new or existing commercial buildings that save at least 50% of the heating and cooling energy of a building that meets ASHRAE Standard Partial deductions of up to $.60 per square foot can be taken for measures affecting any one of three building systems: the building envelope, lighting, or heating and cooling systems. These tax deductions are available for systems placed in service from January 1, 2006 through December 31, Offers building owners a property tax abatement equal to $4.50 / square foot up to $100,000 for green roof installations that cover at least 50% of a roof. Applications must be submitted by March 15th for a tax abatement to be applied to the current fiscal year s property taxes. Offers building owners a property tax abatement of up to $250,000 (or up to 35% of total installed costs), paid out equally over four years, for solar electric generating system installations on buildings. Provides equity or debt, structured to meet the needs of the project. The Fund has targeted five areas of investment: Cleantech; Health Care; Information Technology; Media & Communications; and Retail & Tourism. NYPA NYS DOF Green Zones Qualified Emerging Technology Companies (QETC) Incentive Program NYPA also partners with local governments and public universities to develop Green Zones in which traditional, polluting equipment is replaced with clean alternatives - both commercially available and new technologies. The program is targeted for parks, college campuses and other limited access areas. We work with our partners to identify appropriate equipment and provide technical assistance and co-funding to help with purchase and implementation. Participants are asked to provide data on the performance of the new vehicles and equipment and we calculate resulting emissions reductions and fuel savings. Designed to help qualified companies invest in their innovations. Awards are based on research and development expenses and related costs, as well as jobs created and employee training expenses. Investors in qualified companies can also receive a non-refundable credit of up to $300K per year. Eligible companies must have products or services that are classified as emerging technology, such as new media, communications, IT, engineering, advanced materials, biotech and electronics, and have annual product sales under $10M and gross revenue under $20M (in the previous tax year), 100 full-time employees or fewer with at least 75% based in New York and New York-based research and development spending totaling over 6% of net sales. NYSERDA Business Partners Commercial Lighting Program Incentives Provides up to $50,000 per Business Partner for effective, energy-efficient lighting projects. A project may be eligible if it is a space between 1,000 and 100,000 square feet and is either: 1) a lighting improvement project in a Commercial Space that meets the Program criteria; or 2) a design for a lighting project and its installation. NYSERDA NYSERDA Clean Energy Business Growth and Development Existing Facilities: Combined Heat and Power Incentives Provides renewable energy generation and energy efficiency companies with funding up to $200,000 to enable their expansion in New York State. Eligible companies must have commercial product ready or almost ready for commercialization. Performance-Based Combined Heat and Power incentives are offered to promote the installation of clean, efficient, and commercially available CHP Systems that provide summer on-peak demand reduction. Incentives are performance-based and correspond to the summer peak demand reduction (kw), energy generation (kwh), and fuel conversion efficiency (FCE) achieved by the CHP system on an annual basis over a two-year measurement and verification (M&V) period NYSERDA Existing Facilities: Demand Response Incentive Offers incentives to offset the cost of equipment that enables facilities to participate in Demand Response Programs. Common measures include: load shedding controls and automation equipment, installation of new generators, or modifications to existing generators or switchgear. Incentives and bonus capped at 75% of project cost. NYSERDA Existing Facilities: Electric Efficiency Incentive Offers performance-based electric incentives to customers or ESCOs who are working on energy efficiency projects that deliver verifiable annual electric energy savings. Incentives are capped at $2,000,000 per facility and while incentives are based upon the amount of energy saved in one year, the total incentive can not exceed 50% of project cost. Unless otherwise approved by NYSERDA, projects must qualify for an incentive of at least $10,000.
178 Administrator Program Name Description NYSERDA NYSERDA NYSERDA NYSERDA NYSERDA US DOE Existing Facilities: Industrial and Process Efficiency Incentive Existing Facilities: Pre-Qualified Incentives Flexible Technical Assistance New Construction Program Renewable, Clean, and Energy Efficient Production Incentive Advanced Technology Vehicle Manufacturing Incentives Provided to offset the costs of projects focused on increasing productivity, increasing process efficiency, reducing waste, and reducing electricity consumption per unit of production. Incentives are capped at $5,000,000 per process improvement project, or 50% of project cost and projects must qualify for an incentive of at least $50,000. Target industries include, but are not limited to: chemicals, forest products, printing and publishing, metals finishing, data centers, ceramics, automotive, and food processing. Provides incentives ($/unit) for pre-qualified energy-efficiency and conservation measures. Pre-Qualified incentives for gas efficiency measures are available for Con Edison firm rate gas customers and small commercial National Fuel Gas customers using less than 12,000 Mcf per year. Projects can receive up to $30,000. National Fuel Gas incentives are limited to a cap of $25,000. Pre-Qualified incentives are available for: Lighting, HVAC, Chillers, Motors, Variable Frequency Drives (VFDs), Natural Gas Equipment, Refrigeration, Commercial Kitchen Equipment and Washers, and Interval Meters. NYSERDA has contracted with engineering firms to offers companies a variety of energy-related technical assistance services. These services are provided on a costshared basis and include: engineering feasibility and technical assistance studies; detailed analyses of specific energy projects; process improvement studies; energy operations management; and sustainable design and green building assistance. Certified customers of Con Edison of New York are eligible. The New Construction Program (NCP) can provide assistance when incorporating energy-efficiency measures into the design, construction, and operation of new and substantially renovated buildings. These measures are designed to save energy through reduced electric demand, thereby lowering building operating costs. Technical Assistance is available to help evaluate energy-efficiency measures and provide guidance to your design team on incorporating new and emerging energy-efficient technologies into your building. Funding is available to offset the additional costs associated with the purchase and installation of approved equipment. Assistance also may be available for commissioning services and green building opportunities. Provides funding of up to $1,500,000 for renewable, clean, and energy-efficient product manufacturers to develop or expand a facility to produce eligible products. Eligible projects are located in the service territories of Rochester Gas & Electric Corporation, Consolidated Edison Company of New York, Inc., Central Hudson Gas and Electric Corporation, New York State Electric and Gas Corporation, National Grid Company, and Orange and Rockland Utilities, Inc. Eligible products include: (1) renewable or clean-energy products that produce or support the production of renewable or clean electricity; (2) energy-efficient end-use technologies that use electricity as a principal input; or (3) electric storage technologies for grid-connected applications. Products must be beyond the prototype stage and mature enough to warrant designing and building or expanding a commercial manufacturing facility. ATV and ATV componenets manufacturers may be eligible for direct loans for up to 30% of the cost of re-equipping, expanding, or establishing manufacturing facilities in the U.S. used to produce qualified ATVs or ATV components. Qualified ATVs are light-duty vehicles or ultra-efficient vehicles that meet specified federal emission standards and fuel economy requirements. Ultra-efficient vehicles are fully closed compartment vehicles, designed to carry at least two adult passengers, that achieve at least 75 miles per gallon while operating on gasoline or diesel fuel, as hybrid electric vehicles operating on gasoline or diesel fuel, or as fully electric vehicles. Qualified components must be designed for ATVs and installed for the purpose of meeting ATV performance requirements, as determined by the U.S. Department of Energy.
179 II. Brownfields Programs Matrix
180 BROWNFIELD INCENTIVES Eligible Entity Type of Incentive Eligible Activities Program Name Administrator Local Government Quasi Governmental Entity Not for profit Developer Pass Through to Owners / Developers Loan Grant Statement of Remediation (Liability Relief) Tax Credit CERCLA Indemnification Petroleum Source Assessment / Investigation Remedia-tion Develop-ment Insurance Planning Job Training Green Jobs Green Buildings Green Land Area Wide Planning Pilot Program EPA x x x No Yes Yes x EPA x x x F e d e r a l Assessment Grants EPA x x Yes x Yes x EPA x x x Revolving Loan Fund EPA x x Yes x Yes x EPA x x x Cleanup Grants EPA x x x No x Yes x EPA x x x Environmental Workforce Development and Job Training Grants Training Research and Technical Assistant Grants EPA x x x No x x EPA EPA x x Targeted Brownfield Assessments EPA x x x x Brownfield Tax Incentive IRS x x yes x EPA x x x x x Brownfield Economic Development Initiative HUD x x x x x HUD x x x x S t a t e L o c a l Brownfield Cleanup Program DEC x x x x DEC x x x x x x Environmental Restoration Program DEC x x x x x DEC x x x x Brownfield Opportunity Area Program DOS x x x x DEC x x x New York State Oil Spill Fund NYS OSC x x x x NYS OSC x x x New York City Brownfield Cleanup Program New York City Brownfield Incentive Grants OER x x x x x OER x x x OER x x x x OER x x x x x Environmental Technical Assistance OER x OER x x x x Brownfield WORKS! OER x x OER x x x x x Green Jobs Training Grant OER x x OER x x x x x Note NYS BCP Program is suspended
181 BROWNFIELD INCENTIVES Descriptions Program Name Administrator Description Area Wide Planning Pilot Program Assessment Grants EPA EPA EPA is piloting this area-wide planning approach to community brownfield challenges, which recognizes that revitalization of the area surrounding the brownfield site(s) is critical to the successful reuse of the property as assessment, cleanup, and redevelopment of an individual site. The area-wide planning approach will enhance EPA's core brownfields assistance programs by encouraging continued meaningful involvement in a locally-driven planning process that will result in a strategy for making brownfields site assessment, cleanup and/or redevelopment decisions for the future. The pilot program will help further community-based partnership efforts within underserved or economically disadvantaged neighborhoods by confronting local environmental and public health challenges related to brownfields, while creating a planning framework to advance economic development and job creation. Assessment grants provide funding for a grant recipient to inventory, characterize, assess, and conduct planning and community involvement related to brownfields sites. An eligible entity may apply for up to $200,000 to assess a site contaminated by hazardous substances, pollutants, or contaminants (including hazardous substances co-mingled with petroleum) and up to $200,000 to address a site contaminated by petroleum. Applicants may seek a waiver of the $200,00 limit and request up to $350,000 for a site contaminated by hazardous substances, pollutants, or contaminants and up to $350,000 to assess a site contaminated by petroleum. Such waivers must be based on the anticipated level of hazardous substances, pollutants, or contaminants (including hazardous substances co-mingled with petroleum) at a single site. A coalition of three or more eligible applicants can submit one grant proposal under the name of one of the coalition members for up to $ 1,000,000. The performance period for these grants is three years. Revolving Loan Fund EPA Revolving Loan Fund (RLF) grants provide funding for a grant recipient to capitalize a revolving loan fund and to provide subgrants to carry out cleanup activities at brownfield sites. Through these grants, EPA seeks to strengthen the marketplace and encourage stakeholders to leverage the resources needed to clean up and redevelop brownfields. When loans are repaid, the loan amount is returned into the fund and re-lent to other borrowers, providing an ongoing source of capital within a community. F e d e r a l Cleanup Grants Environmental Workforce Development and Job Training Grants EPA EPA Cleanup grants provide funding for a grant recipient to carry out cleanup activities at brownfield sites. An eligible entity may apply for up to $200,000 per site. Due to budget limitations, no entity can apply for funding cleanup activities at more than three sites. These funds may be used to address sites contaminated by petroleum and hazardous substances, pollutants, or contaminants (including hazardous substances co-mingled with petroleum). Cleanup grants require a 20 percent cost share, which may be in the form of a contribution of money, labor, material, or services, and must be for eligible and allowable costs (the match must equal 20 percent of the amount of funding provided by EPA and cannot include administrative costs). A cleanup grant applicant may request a waiver of the 20 percent cost share requirement based on hardship. An applicant must own the site for which it is requesting funding at time of application. The performance period for these grants is three years. Through an annual grant competition, Environmental Workforce Development and Job Training grant funds are provided to nonprofit organizations and other eligible entities to recruit, train, and place predominantly low-income and minority, unemployed and under-employed residents from solid and hazardous waste-impacted communities. Residents learn the skills needed to secure full-time, sustainable, employment in the environmental field, including a focus on assessment and cleanup activities. These grants help to create green jobs that reduce environmental contamination and build more sustainable futures for communities. Training Research and Technical Assistant Grants EPA Targeted Brownfield Assessments EPA EPA's Targeted Brownfields Assessment (TBA) program is designed to help states, tribes, and municipalities especially those without EPA Brownfields Assessment Pilots/Grants minimize the uncertainties of contamination often associated with brownfields. Targeted Brownfields Assessments supplement and work with other efforts under EPA's Brownfields Program to promote the cleanup and redevelopment of brownfields. EPA's TBA assistance is available through two sources: directly from EPA through EPA Regional Brownfields offices under Subtitle A of the law, and from state or tribal voluntary response program offices receiving funding under Subtitle C of the law. Brownfield Tax Incentive IRS The Brownfields Tax Incentive encourages the cleanup and reuse of brownfields. Under the Brownfields Tax Incentive, environmental cleanup costs are fully deductible in the year incurred, rather than capitalized and spread over time. Improvements in 2006 expanded the tax incentive to include petroleum cleanup.
182 Program Name Administrator Description S t a t e L o c a l Brownfield Economic Development Initiative HUD Brownfield Cleanup Program DEC Environmental Restoration Program Brownfield Opportunity Area Program New York State Oil Spill Fund New York City Brownfield Cleanup Program New York City Brownfield Incentive Grants Environmental Technical Assistance Brownfield WORKS! Green Jobs Training Grant DEC DOS NYS OSC OER OER OER OER OER The purpose of the BEDI program is to spur the return of brownfields to productive economic use through financial assistance to public entities in the redevelopment of brownfields, and enhance the security or improve the viability of a project financed with Section 108-guaranteed loan authority. Therefore BEDI grants must be used in conjunction with a new Section 108-guaranteed loan commitment. The goal of the Brownfield Cleanup Program (BCP) is to enhance private-sector cleanups of brownfields and to reduce development pressure on "greenfields". A brownfield site is real property, the redevelopment or reuse of which may be complicated by the presence or potential presence of a contaminant. Contaminants include hazardous waste and/or petroleum. he Environmental Restoration Program, the State provides grants to municipalities to reimburse up to 90 percent of on-site eligible costs and 100% of off-site eligible costs for site investigation and remediation activities. Once remediated, the property may then be reused for commercial, industrial, residential or public use. The Brownfield Opportunity Areas (BOA) Program provides grants and technical support to help municipalities and community organizations complete and implement brownfield redevelopment plans for their communities. BOA-funded projects may be reimbursed for up to 90 percent of the total eligible project costs. Our goal is to work in partnership with local communities and organizations to develop and realize a community vision for redevelopment and revitalization. This fund, more commonly known as the Oil Spill Fund (Fund), is responsible for the cleanup of oil spills, the protection of the environment and public health, and the reimbursement of costs related to oil spills. The Oil Spill Fund s accountability and oversight help to keep petroleum license fees low and to assure that irresponsible petroleum handlers and property owners bear financial responsibility for their spills. NYC will ensure that brownfield sites with light to moderate levels of contamination are cleaned up under governmental oversight utilizing remedies that are protective of human health and the environment. The benefits communities will receive as a result of environmental cleanup and brownfield redevelopment will include neighborhood revitalization, job creation, and an increase in local amenities. On successful completion of the NYC BCP, enrollees will obtain a Notice of Completion and liability limitation against future environmental claims on the property, which will provide lenders with assurances that these properties have been cleaned up under government oversight to a standard that is protective of human health and the environment. The NYC Brownfield Incentive Grant (BIG) Program provides an easy and flexible way to reduce the cost of Brownfield redevelopment in New York City. Grants assist brownfields throughout the development process, from the earliest stages of information gathering through environmental investigation and cleanup work. Grants are intended to make redevelopment on Brownfield sites more competitive with clean properties. To address this need, members of the Partnership that are environmental consultants are available to provide pro-bono counseling services. If a community requests such assistance, an environmental consultant in the Partnership with no conflict of interest on the specific project will be provided with a copy of the cleanup plan, will initiate a review and will reach out to the community. This process is intended to be confidential. The environmental consultant will provide timely document review and communication including a candid, impartial assessment and consultation on the cleanup plan. Member organizations of the Partnership provide these services free of charge and independent of New York City government. Employers can receive up to six months of wage subsidy by providing training and work to qualified workers who have 40-hour HAZWOPER and other environmental certifications through STRIVE, St. Nick s Alliance, Building Works, SoBRO, or Sustainable South Bronx. The subsidy reimburses you up to $12/hour plus % of fringe benefits. Enroll by spring to take full advantage of the six-month subsidy period. OER has created Brownfield WORKS!, which offers employers of qualified workers reimbursement of up to $12/hour and 8.9% for fringe benefits for 35 hours per week for three months. Experience and on-the-job training from environmental employers is vital to helping local communities develop skilled labor for cleanup of brownfields and other contaminated sites.
183 III. Business Attraction and Reverse Site Selection

184 Business Attraction and Reverse Site Selection Companies making expansion and relocation decisions typically go through a process similar to that shown on the next page. This process begins with the company listing their business opportunities, constraints and needs for the new facility, and then progresses through an evaluation of location options. This evaluation process continues to narrow the list of options until the company is prepared to negotiate with the last handful of communities and sites remaining on the list. Field Validation Planning and Strategy Initial Screening Location Screening Final Negotiations and Location Selection Defined Strategy and Evaluation Criteria Universe of Location Candidates Short-List of Location Candidates Cost Modeling Preferred and Alternate Location(s) Importantly, this process usually starts with a regional, national, or even international large list of options. At this point, metropolitan areas are the units of geography being evaluated, not towns or sites. Local economic development agencies are typically contacted at the completion of these first screening rounds. This then gives the opportunity to present specific sites and communities within the broader region. National Competition Coupling our knowledge of site selection trends, Staten Island (and the New York City MSA) would most likely compete with the following communities for relocation projects and new corporate investment: Local Competition Nassau, NY Rochester, NY Bergen and Passaic, NJ Camden, NJ

185 Newark, NJ Trenton NJ Edison, NJ Regional Competition Philadelphia, PA Pittsburgh, PA Reading, PA Allentown, PA Scranton, PA Bridgeport, CT Hartford, CT New Haven, CT Norwich, CT Springfield, MA Worcester, MA Portland, ME Analysis by Factor Following is an analysis of the region by each category type typically included in a location screening. The database of factors for each of the communities examined may be found in the Appendix. Similarly, weights have been assigned to each criterion based on real-world experience in site selection projects. These relative weights are also included in the Appendix. Population and Demographics Population dynamics give an overall indication of a community s health, or whether it is growing at a sustainable pace. Negative growth can indicate a failing economy or an obsolete community. Explosive growth can be a warning sign for strain on infrastructure or on community finances. New York City is a dynamic and robust demographic engine, and ranks fifth among the communities examined. Staten Island is among the highest growth of the boroughs within the City of New York. If measured on its own, the borough would tie for first in overall population growth and growth within the working age cohort. This is no immediate measure of success however as Reading and Allentown also rank at the top. Edison, New Jersey ranks third. General Labor Force Availability Given as a measure of Civilian Labor Force growth and an area s unemployment dynamics, this section measures the very general strength of the workforce as a whole, without regard for specific skills. Unemployment, the change in unemployment, and the overall growth of the civilian labor force are used as measures in this category. The City of New York as a whole ranks in the top third of the candidate locations, but had higher than average unemployment during the period Staten Island fared somewhat better in these areas and moreover had higher than average growth within the civilian work force over the period, causing it to tie for second overall (with Nassau County) if examined as a stand-alone location. Portland, Maine led this category.
186 Industry- and Occupation-Specific Employment This section contains information on the availability of workers within selected industries. Employment in Utilities, Construction, Manufacturing, and Professional/Technical/Scientific functions are analyzed as a percentage of overall employment indentifying critical masses of industry partners and workforce. This industrial base if found in combination also tends to indicate the ability to support innovation and sustainable entrepreneurial activity. New York City s employment base ranks the highest among its competitors showing slow but easily sustainable growth and projected growth in both total population and working age population. Staten Island presents a predicted growth rate of 4% for both working age and total population between 2010 and While this is significantly higher than its competitors (including NYC), this is an easily sustainable growth that will not tax the infrastructure of Staten Island. Staten Island's industrial employment base which echoes that of New York City in General - strong in Finance, Insurance, and Real Estate, Services, and Information Technology. Unfortunately, this does not reflect the needs of typical green industries, which requires production networks in addition to those above. Bergen and Edison counties in New Jersey have higher rankings in this area. Occupation-specific skills cannot be measured at the Borough level, but NYC as a whole has some strengths which may be highly useful to entrepreneurial green industry- particularly in material movement and business and technical fields. Here again, the region no longer has a large production base. Instead, areas such as Reading, Allentown, and Scranton, PA rank highest. Labor Force Cost Salaries and benefits often make up companies largest or second largest cost category overall. Hence, costs for specific occupations in each community show the relative cost of doing business for the assembled entity. Here again, salary data is not available at the borough level. New York City does not have the highest costs (Bridgeport, CT is the most expensive of the locations examined), but they are close. Scranton, Rochester, and Portland all perform very well in this category. Education The education levels of a community s population (from high school to professional school graduates) indicated both the capabilities of the workforce and can also be an indication of the regional school system as a quality of life measurement. An educated workforce can also help attract talented people to relocate to the region. The percentage of Staten Island's population that has at least a high school education (88%) exceeds that of New York City as a whole by 7% and ranks in the middle of all of the competitive locations. However, a lower percentage of the population has college education of 2 year, 4 year, and advanced degrees when compared to both New York City and to the competitive set. Transit and Infrastructure Acting both as a measure of traffic within the community (and therefore workforce attraction) as well as the ability to move goods and personnel into and out of the community, transit and infrastructure measures the availability of air and road capability and the capacity of that capability.
187 By a pure reckoning of the infrastructure, networks, and population base accessible from a point on the map, New York City and Staten Island in particular rank highest of all of the communities under consideration. The area achieves the highest score for the population within a 4-hour drive time, households within a 4 hour drive time, the median income of households within that drive time, and the number of interstate highways serving the area. However, it should be noted that the perception of tolls or the actual cost of entering and leaving Staten Island (especially for commercial vehicles) is a negative that the screening model is not designed to take into consideration. This information must be tempered with the information gained in the interviews regarding bridges and the associated tolls and weight limits. Tax Structure Tax structures can intentionally or otherwise be used as a regulatory tool to encourage or discourage corporate investments of various types. Property, income, and sales taxes all impact companies in different ways and should be examined on an institution by institution basis. New York State and City both impose significant tax burdens. The State/City sales tax of 8.25% is the highest of the communities examined. Likewise, the Tax Foundation rates New York 50th out of the 50 states with regards to business tax climate. 1 Massachusetts ranks highest among the competitive states in this measure. The relatively high toll cost also is a road tax which the screening model is not designed to consider. Climate and Natural Hazards Climate is both a quality of life indicator and can also be a measure of business interruption risk. Similarly, no location is without some form of natural hazard risk. Businesses will typically look to establish locations in such a way as to minimize their exposure to any one risk. The New York City area shares many of the same risks and climate benefits of the competitive set. Staten Island and New York suffer from snowfall though less so than many of the competitive New England locations. However, hurricane, tornado and seismic risk are all low for all locations. As such, it should be no surprise that Staten Island and the rest of the City neither lead nor lag the competitive set. Crime and Quality of Life Quality of life is a subjective measure and the criteria to measure the concept vary from individual to individual. However, such subjects as housing cost (as compared to prevailing wages), cost of living, crime, and health care system capacity carry universal appeal and can have direct business impact. New York City as a whole has long been and continues to be a world leader in areas such as culture, history and health care. Other criteria (notably property crime) have improved to the point of also leading the competitive set. Unfortunately, the area's cost of living and commute times still negatively impact overall livability. Different individuals will value these attributes differently and make their choices accordingly. 1 Tax Foundation, 2011 State Business Tax Climate Index, October 2010
188 Interpretation Companies making location decisions assemble the above information, shifting the importance of individual criteria or categories of criteria depending on the nature of the function or functions to be located. A cost-sensitive function such as assembly will tend to emphasize operating and labor costs. Similarly, technical functions will place more importance upon the availability of particular skills and educational attainment of the general population. An executive function will emphasize quality of life (used to measure the ability to recruit to the area) and air access into the region. Based on the company base already in the area and the stated goals of the SIEDC, we have tested two weighting profiles: That of a company performing manufacturing (such as would be seen in a green firm at full production) and a start-up firm emphasizing research and development. Manufacturing Based Company Manufacturing concerns will place particular emphasis on the availability of specific skills in the workplace and on the cost of labor and production. A typical weighting scheme on a scale of 100 is shown below. Category Weight Population and Demographics 2.5% Employment Levels 10.0% Industry-Specific Employment 12.5% Occupation-Specific Employment 15.0% Occupation-Specific Salaries 15.0% Education 12.5% Transportation and Market Access 15.0% Tax Regime 10.0% Climate and Natural Hazards 5.0% Crime and Quality of Life 2.5% TOTAL 100.0% In this case, the resulting top-5 shortlist is as follows: 1. Scranton 2. Edison 3. Worcester 4. Allentown 5. Reading New York City and Staten Island rank 16 th out of the 20 alternatives. The City and Island perform exceptionally well for market access and competitively for industry workforce. Salaries and education levels however are not competitive and impede the overall performance of the region. Hence, Staten
189 Island will need to either address education and salary costs or seek out company targets for whom access to markets is a stronger driver than any other consideration Start-Up Green Company Start ups within the green economy also place emphasis on skills bases associated with production, but will also place additional emphasis on the education system, transportation system (particularly air), and due to the need to recruit to the area quality of life. Labor costs play a somewhat smaller role. A representative weighting scheme is shown below. Category Weight Population and Demographics 2.5% Employment Levels 2.5% Industry-Specific Employment 7.5% Occupation-Specific Employment 15.0% Occupation-Specific Salaries 7.5% Education 20.0% Transportation and Market Access 15.0% Tax Regime 10.0% Climate and Natural Hazards 5.0% Crime and Quality of Life 15.0% TOTAL 100.0% This system results in the following top-5 ranking: 1. Edison 2. Nassau 3. Worcester 4. Hartford 5. Scranton New York City and Staten Island rank 10 th out of the 20 alternatives. As with before, the City and Island perform well for market access and for industry workforce, and these make a significant difference in attracting or nurturing these businesses. It is important to consider these advantages within the context of comments received from the interviews regarding tolls and overall costs of operating on the island. If the Island and Green Zone are successful in developing new businesses, they will need to develop the means for holding onto these businesses as they mature and their needs change. SIEDC should also build the means for working with business incubators throughout the City, such as that at the Brooklyn Navy yards. Based on the analysis above, the Green Zone may provide an appropriate option for small scale production once concepts and business plans are developed at other incubator sites.
190 Staten Island Economic Development Corporation May 10, 2012 Page i Task 4 Green Zone Strategies May 2012 Parsons Brinckerhoff CWS Consulting Vita Nuova CWS Consulting Group LLC
191 ii
192 Table of Contents INTRODUCTION... 4 REDEVELOPMENT CHALLENGES AND OPPORTUNITIES... 5 REDUCING INVESTMENT RISK... 5 WETLAND AND STORMWATER MANAGEMENT ISSUES... 6 CURB APPEAL... 6 SHORT-TERM ACTIONS AND MAJOR REDEVELOPMENT STRATEGIES... 7 SHORT-TERM ACTIONS... 8 BUILD UPON SIEDC POSITION AS TECHNICAL GREEN DEVELOPMENT RESOURCE... 8 BROWNFIELD REDEVELOPMENT STRATEGIES... 9 PROMOTE SPECIFIC LEGISLATION AND INCENTIVES FOR THE GREEN ZONE DEFINING PARK SPACE WITHIN THE GREEN ZONE LOCAL STREET AND INFRASTRUCTURE IMPROVEMENTS INCENTIVES WHICH DIFFER FROM AS-OF-RIGHT GREEN INCENTIVES IN NYC TAILORING CURRENT INCENTIVE PROGRAMS TO BENEFIT THE STATEN ISLAND GREEN ZONE GREEN ZONE MAJOR REDEVELOPMENT STRATEGIES REDEVELOPMENT OPPORTUNITY MAJOR REDEVELOPMENT STRATEGIES INTEGRATED FREIGHT LOGISTICS (FREIGHT VILLAGE) RENEWABLE ENERGY STRATEGY MATERIALS RECYCLING STRATEGY THERMAL ENERGY DISTRICT STRATEGY WEST SHORE BLUEBELT STRATEGY FUTURE DEVELOPMENT SCENARIO CONCLUSION iii

193 Introduction The Staten Island Economic Development Corporation (SIEDC) developed the Green Zone in order to establish the West Shore of Staten Island as a premier location for industrial business in the region. Recognizing that complementary existing business activities are fundamental to new business attraction, the goal is to structure a series of strategic actions to promote new development while launching a green program to gravitate existing businesses towards green practices in order to strengthen the brand of the zone. This final report synthesizes the big ideas that will help to launch new development activity within the Green Zone. In our experience and through our research of established redevelopment districts, the key to success is dedicated local leadership providing the impetus for local, State and Federal agencies to come together to make strategic improvements, organize the regulatory process and incentivize business development. Our recommendations take into account the importance of partnerships and set forth the next steps that the SIEDC should take to set the stage for redevelopment. The redevelopment strategies are derived from an analysis of the unique conditions of the zone, our review of relevant plans and projects, best practice research and company and agency interviews. The Green Zone contains multiple vacant and underdeveloped assemblages that, viewed as a whole, represent significant industrial redevelopment opportunity. With Figure 1: Developable Land at South Avenue more than 400 acres of developable land available, a number of major development sites can be assembled, ranging in size from a few acres to a few hundred acres. If improved and marketed as part of a district-wide branding strategy, the opportunity for meaningful development will grow significantly. SIEDC needs to identify a few key parcels that can be translated into early wins that will lead the way towards the larger investments that will follow. Our recommendations fall into two categories - short-term actions and big idea redevelopment strategies. For each, we will identify next steps and partners required to implement each strategic effort. The report also depicts a future potential property tax and labor analysis to illustrate long-term benefits of adaptive reuse of the redevelopable land that sits within the current Green Zone boundary. 4


194 Redevelopment Challenges and Opportunities The Green Zone has multiple selling points: centralized location within a large consumer region; access to rail, water and highway; large appropriately zoned assemblages; separation from non-conforming uses that would object to industrial activity; and, local agreement on future planning for redevelopment. Through our market analysis effort, multiple strategic industrial business types have been identified as particularly well suited for location on the West Shore of Staten Island. These include: Freight consolidation and distribution Integrated freight logistics Innovative waste strategies Construction and demolition recycling Manufacturing using recycled or repurposed materials Food production and processing * Sustainable building materials manufacturing * *These business types would require workforce training and modifications to the transportation cost structure. Figure 2: Virginia Inland Port - Freight Village While helpful in focusing our marketing efforts, identifying suitable targets is only the tip of the iceberg. In the battle to differentiate this industrial district from all of the competition in the City of New York and in the region, Staten Island faces significant challenges: high costs of operation; tolls to move product off island in either direction; wetland and stormwater management issues; multi-layered and often confusing regulations; limited local access and specific site encumbrances such as contamination issues. Reducing Investment Risk Businesses looking to relocate are rarely afforded the luxury of time and are always looking to reduce or avoid risk. It is a rare occurrence when a company is willing to locate to a site where they are unaware of either development footprint or timeline. In more simplified terms, businesses are looking for sites that are shovel ready. A series of actions are needed to prepare sites within the Green Zone to be attractive for redevelopment. Sites in New York are highly regulated. Industrial sites on the waterfront in wetland areas with potential brownfield conditions dominate the Green Zone. As the owners of these sites look to make improvements, regulatory review falls under multiple agencies and divisions of Figure 3: Environmental concerns can raise the risk to redevelopment multiple agencies, creating a daunting regulatory process, significant time commitment and undefined financial costs. Many owners do not have the capacity or wherewithal to enter into this lengthy and expensive process. Pushing these requirements off to a developer presents an untenable risk. The result 5


195 is that many sites that may be viable for new business development lay fallow, a condition detrimental to both business and regulatory interests. A better understanding of the path through the regulatory process and a partnership with regulators that balances economic opportunity with regulatory requirements at the district level will remove the uncertainty and risk associated with redevelopment. Wetland and Stormwater Management Issues Many Green Zone sites are encumbered by tidal and fresh water wetland issues. For individual sites, the uncertainty of the impact of wetlands on ultimate development footprint presents a significant redevelopment risk. At the same time, developers cannot be asked to assume this risk when entering into redevelopment plans. There is a significant opportunity to merge the desires of the regulatory agencies looking to preserve environmental systems within the zone and the agencies and businesses looking to promote redevelopment along the West Shore. By establishing a regulatory review process that is consistent throughout the district, we can reduce redevelopment risk, incentivize appropriately regulated growth, organize the district around an effective green strategy and reduce infrastructure costs. Curb Appeal Many of the sites, despite connectivity to rail, water and highway, are isolated, with access provided by circuitous routes via minor local arterials that are illequipped to the needs of industrial operations. Often set up as one-way streets, the entire district forces roundabout travel, making it difficult to market any sites along these arterials to the larger development community. Furthermore, as marketable redevelopment sites, they lack presence. The streets are poorly signed, include no sidewalks or striping, are often overgrown and subject to dumping and present a perception of dereliction and abandonment. By focusing on strategies to improve the public realm, focused on the street system, we can improve access to isolated sites; improve street Figure 4: Many sites in the Green Zone are encumbered by wetland issues Figure 5: Enhancing curb appeal is key to the marketing of the Green Zone appearance and street conditions to enhance curb appeal, a critical component of the marketing strategy. 6

196 Short-Term Actions and Major Redevelopment Strategies Successful recruitment of new businesses, especially the first new businesses that will lead to the attraction of others, can be enhanced through the development of specific incentives, permit approvals or capital improvement levers that motivate businesses to locate in Staten Island as opposed to other similar industrial areas in the region. Our strategic approach identifies new incentive opportunities that will help to attract that first new business to the Green Zone. Our recommendations can be classified into two categories, short-term actions and big idea redevelopment strategies. Our short-term actions can be undertaken with specific identified partners, involve minimal costs and can be accomplished in the timeframe of roughly one year. Our redevelopment strategies involve larger and more complex partnerships, multiple steps and a longer timeframe to implement, but can realize benefits in the nearterm as well, leading to ultimate implementation. Short-Term Actions Our short-term actions involve specific SIEDC actions, potential next steps in the planning process and the development of strategic partnerships with government agencies. Some of these strategies are reviews of recommendations put forth in prior sections of the study and some are already being undertaken by the SIEDC but are important to note as they fit in to the overall strategic plan for the Green Zone. Short-term actions include: Build upon SIEDC position as technical green development resource Focus on Brownfield Redevelopment strategies Promote specific legislation and incentives for the Green Zone Identify and implement local street improvements and re-routings Major Redevelopment Strategies All of our longer term redevelopment strategies still require immediate action, but will measure results along a longer timeframe involving multiple steps and more complex partnerships. All of these strategies are focused on specific redevelopment goals and are focused on our target industrial businesses developed through our market analysis. Our Green Zone redevelopment strategies include: West Shore Bluebelt Integrated freight logistics (freight village) Materials recycling Thermal energy district Renewable energy Figure 6: Kalundborg is the foremost example of an industrial ecology 7
197 Short-term Actions Build upon SIEDC position as technical green development resource Local businesses look to the SIEDC as an advocate for local business interests on Staten Island. As the key promoter for the business community, the SIEDC has launched a number of studies to promote actions designed to improve the business environment on Staten Island. Its most recent and ambitious effort has spearheaded a campaign to promote the West Shore of Staten Island as a Green Zone. SIEDC has taken steps within the business community and at the local, State and Federal level to define the zone and create opportunities for business development within the zone. SIEDC s connection to businesses within the zone provides a unique opportunity to promote incentives to businesses and lead the redevelopment effort. SIEDC has partnered with the federal government to study the Green Zone and develop a strategic redevelopment approach, with the State to promote zone-based legislation to create tax incentives and with the City to market a potential City-owned redevelopment site. The Green Zone study provides a structure for SIEDC to expand its role as a leader for the business community and the organization behind the implementation of the Green Zone. There are several short-term actions that the SIEDC can take to establish this capacity to support businesses. Dedicating a Green Zone staff person to champion the Green Zone effort SIEDC has acknowledged the importance of developing the Green Zone and has dedicated significant resources to DUTIES of GREEN ZONE MANAGER establishing the Green and Clean Expo and in reaching out - Connect businesses, developers, to the business community. The SIEDC should build upon and SIEDC to available incentives this significant base by dedicating a staff person to - Navigate the regulatory processes manage the next steps in the process, of which there are guiding redevelopment several. To promote Green Zone incentives, the SIEDC - Act as liaison between member must be able to connect businesses with the numerous businesses, elected officials, and incentives available to businesses, supporting businesses agency representatives in the often confusing and arduous process of applying for - Understand the opportunities for funds to implement green actions. As SIEDC steps into sustainable collaboration between this role, they will quickly be viewed as the technical businesses (by-product synergy or resource for local businesses looking to take advantage of energy opportunities) the ever expanding list of potential incentives available from the City, State and Federal government to assist businesses. A dedicated staff person can organize this effort and become proficient in the incentives in order to more capably assist the business community. Establish a web-based search engine for business incentives and programs While there are a number of potentially attractive incentives out there for Staten Island businesses to access, the path to understanding who is providing funding, where an incentive can help a company, who is qualified, and how to apply can be daunting and usually dissuades businesses from taking advantage of opportunity. A number of local development corporations have developed search engines to assist their business community on matching needs to incentives, finding appropriate incentive opportunities and accessing the specific information needed to apply for funds. A database of information and a set of simple search criteria can help tremendously in taking the mystery out of 8
198 incentive opportunities and will be a valuable tool to support SIEDC s role as technical resource to the business community. The value to the SIEDC is the use of the SIEDC website by local businesses on a regular basis. Once established, the search engine can help to promote the larger SIEDC goals of developing a Green Zone by highlighting green businesses, advertising businesses providing green products and skills to connect businesses together and promoting SIEDC events that support their Green Zone development. The SIEDC website will become the central information source for businesses looking to go green. In addition, the Green Zone Manager and SIEDC website will need to be helpful in assisting business owners with the programmatic strategies outlined in the Major Redevelopment Strategies below. This includes understanding energy efficiency opportunities and acting as a centralized technical resource for owners who don t understand energy. In addition, the materials recycling initiative needs a central champion. Next Steps: Research successful web-based search engine products Identify connection opportunity to current SIEDC website Research available incentives and organize for search engine Establish search engine tool See Major Redevelopment Strategies of this report for further details about energy efficiency and materials recycling Green Certification Process There are a number of entry points into green business strategies that SIEDC could identify for local businesses to reach green milestones that would signify credibility as a green business. We have outlined an approach through targeting incentives, identifying practice and improvements to building and land as a three-pronged way for businesses to be certified by SIEDC as Green Green Building, Green Business, and Green Land. By certifying businesses as green, SIEDC is building a brand for the district that will be a strong attractor for future business development while providing an additional avenue for business self-promotion. Next Steps: Develop certification levels through Green Land, Green Business and Green Building structure Identify existing businesses within district that qualify for certification levels Set up year one awards and certifications for green businesses Brownfield Redevelopment Strategies Partnership with Mayors Office or Environmental Remediation (MOER) The SIEDC has already recognized the opportunity to promote brownfield redevelopment as a key element of the Green Zone business attraction effort. The relationship fostered between SIEDC and the Mayor s Office on Environmental Remediation (MOER) is a critical partnership as SIEDC looks to find shovel ready sites for redevelopment. SIEDC is continually looking for owners to present to MOER, so that MOER can provide direct financial incentives for certain types of clean-up operations. The MOER can play a critical role in kick-starting brownfield assessments so that owners can finally obtain a clear picture of the necessary steps needed to establish their sites as clean and developable. It is likely that 9

199 many sites can proceed through the recently establish MOER regulatory approval process, as an alternative to working through the NYS DEC, a new opportunity that many current industrial site owners may not know is available. As the Staten Island ambassador for MOER, SIEDC can help to spread the word about MOER programs and move businesses into the pipeline for clean-up, pushing them closer to the point where they can entertain redevelopment. As the MOER expands its abilities, SIEDC should continue to promote MOER funding for Staten Island businesses. Next Steps: Figure 7: Rockefeller Group FTZ, Charlotte, North Carolina Continue recruitment of businesses into MOER incentive programs (SIEDC has been an effective leader in partnering with MOER to bring Staten Island business success stories to the program). Brownfield Opportunity Area Funding At the State level, SIEDC has also been active. The Brownfield Opportunity Area (BOA) program establishes a planning process for determining a brownfield redevelopment strategy. SIEDC has leveraged its research through their USEDA grant to form the baseline of data needed to qualify for New York State Department of State (NYS DOS) BOA funding for planning for brownfield redevelopment. This three step process will significantly help SIEDC to structure specific redevelopment strategies for sites within the Green Zone to enable them to move into redevelopment. The goals of SIEDC and NYS DOS are well matched, making the Green Zone an excellent candidate district for BOA funding. The BOA funding represents an important public investment that will catalyze industrial development within the Green Zone. Next Steps: Develop a Step 1 Pre-Nomination Application for BOA compliance (completed March 2012) Step 2 BOA for key brownfield district within Green Zone (application submitted in March 2012) Promote specific legislation and incentives for the Green Zone One of the best ways to attract businesses is to create incentives that are specifically targeted to a designated location. There are two short-term opportunities for the SIEDC to create zone based incentives for the Staten Island Green Zone. Green Economic Zones Act The Green Economic Zones Act, which is currently on the floor of the New York State legislature, is an important first opportunity to designate this site as a key development zone in the eyes of the State of New York that will help to attract businesses to the zone. The SIEDC should look to ways to connect its green certification program to the Economic Zones Act; promoting the connection between developing green initiatives and the ability to secure funding through this program should it pass through State 10
200 legislation. In its capacity as a representative of the businesses of Staten Island, the SIEDC should lobby on behalf of this legislation by illustrating its direct connection to a much larger strategic effort being made for the West Shore of Staten Island. The Act defines a green business as a business that operates within one of four strategic business practice areas: production; service and repair; research and development and/or the application and installation of green products. This definition provides a number of effective ways in which businesses can reposition themselves as green businesses and provides an opportunity for SIEDC to assist businesses in focusing on approaches to qualify for this incentive. The focus of the bill is on manufacturing and distribution companies, a sector that we have identified as having the specific set of needs that match the Green Zone attributes. Within those sectors, the act supports companies involved in greenhouse gas emission technologies, alternative energy development and assembly ranging from wind turbine production to clean fuel vehicles and replacement of appliances and products with more energy efficient parts and appliances. The bill also accounts for green research and development companies that focus on creative technologies that promote green research and development in practice areas ranging from water conservation and renewable energy to sustainable farming and landscaping. It is quite possible that companies who provide natural stormwater best management practices to conform to blue belt standards for siting within the Green Zone could be candidates to have a 30% tax reduction applied to the construction of their natural stormwater retention systems. The act even includes businesses that utilize green products in their construction, providing opportunities for companies that are not involved in green technologies as avenue to access the incentive while planning for more energy efficient buildings and appliances to enhance the long-term maintenance and operation costs for their companies. Next Steps: Understand the features and application requirement for the Ace in order to add this incentive to the SIEDC incentive toolkit and promote the opportunity to existing business and in packages to attract businesses to the Green Zone. Foreign Trade Zone Designation A strategic opportunity to promote the Green Zone as a specific location for redevelopment opportunity may lie with the Port Authority of New York and New Jersey (PANYNJ). The Port Authority has established special foreign trade zone designation for certain specific locations in New Jersey that support Port activities. Foreign trade zones (FTZs) were created to provide special customs procedures to U.S. plants engaged in international trade-related activities. Duty-free treatment is granted to items that are processed in FTZs and then re-exported, and duty payment is deferred on items until they are brought out of the FTZ for sale in the U.S. market. This helps to offset customs advantages available to overseas producers who compete with domestic industry and can be especially useful to businesses that import components in order to manufacture finished products for export. FTZ zones are particularly helpful when connected to port operations. 11
201 The FTZ process can be broken down into two distinct steps: step 1 is the application and step 2 is the activation. There are 6 different types of applications that can be made to the Foreign-Trade Zones Board, part of the U.S. Department of Commerce: New General Purpose Zone Major Boundary Modification New Subzone (Manufacturing/Distribution) Manufacturing Authority within a General Purpose Zone Manufacturing Authority Expansion Temporary or Interim Manufacturing Authority Often, communities are asked to perform a feasibility study as part of the application process (either creating a new FTZ or modifying an existing boundary) in which they weigh the resources required to market and operate an FTZ against the economic development an FTZ may be expected to generate. In the second step, the activation of the FTZ, the community applying for the FTZ status will coordinate with the local U.S. Bureau of Customs and Border Protection (CBP) office. At present, there is no accompanying FTZ on the New York side of the Hudson River even though the Port Authority maintains a critical port presence in Staten Island at Howland Hook container terminal. The West Shore of Staten Island could be particularly appealing to the Port Authority because of its connection to the region and to international imports through its unique water, rail and truck connectivity. For Staten Island, the ability to recruit companies that need to assemble products that include some imported components, the FTZ designation, coupled with rail and water access and large industrial assemblages would provide a competitive advantage to the West Shore of Staten Island as an attractor for companies involved in product assembly. This incentive ties into many of the specific industrial activities that we have targeted for the Green Zone, including the freight village concept and the materials assembly and recycling concept. As an example, the assembly of wind turbines for placement along the eastern seaboard involves multiple parts, some of which emanate from overseas. The assembly requires a large footprint, the need to be located along the coast and waterfront access. While there are likely multiple candidate sites for such a venture, the added benefit of not having to pay a tax on the parts that are used to assemble the turbine that come through the Port Authority could be the financial attraction that makes Staten Island a preferred location. The increase in jobs and new tax revenues from such an operation would far outweigh the import tax placed upon the parts and the ability to attract additional assembly companies would fit in with the significant amount of industrial space available along the West Shore of Staten Island, allowing for a new assembly center as opposed to a one-off isolated business siting. Not to mention the fact that since the business action is the construction of a green product, additional incentives, certification and branding of the Green Zone could all be integrated into the opportunity. 12

202 Next Steps: Continue the dialogue with PANYNJ started through this effort to determine the process for expanding the current Foreign Trade Zone (set up an exploratory meeting) Work with PANYNJ to determine how expansion of the Foreign Trade Zone designation would be in the mutual interest of both parties as the preliminary step towards the FTZ application Work with the PANYNJ to conduct a feasibility study for the expansion of the FTZ or a modification to the FTZ Seek to implement an expansion of the Foreign Trade Zone designation to correspond with the boundaries of the Staten Island Green Zone Defining Park Space within the Green Zone The coastline of the West Shore of Staten Island is criss-crossed by a number of estuary systems and tributaries. Many of these waterways lie in whole or in part within the jurisdiction of the City of New York and many are listed in the portfolio of the Parks Department. However, in terms of actual Park attractions, these locations are not on the radar of the general public. As we look to define the benefits of the Green Zone for new businesses, these park spaces should figure prominently in the marketing of the Green Zone. SIEDC can work in concert with the Parks Department to designate locations that fit into the wetland and stormwater Figure 9: Heron siting in Menomonee Park, Milwaukee Wisconsin system as pieces of a larger West Shore Bluebelt system proposed as one of the most important major initiatives in this study. These West Shore park areas could become havens for kayaking, bird watching and other passive forms of recreation. Having access to pristine parkland adjacent to working waterfront and manufacturing uses presents a unique dichotomy of natural and industrial, which can be branded to help attract businesses to locate in the Green Zone. Many of these park spaces already exist and more can be added to designate a linked passive park system along the West Shore. The SIEDC should work with the Parks Department to identify these spaces and incorporate them into their marketing materials for the Green Zone. Menomonee Valley, a model green industrial park with very similar wetland and natural feature conditions embraced the opportunity to integrate nature alongside industrial activity and this relationship is one of the hallmarks of the branding of this highly successful industrial park. Given the large number of sites that contain significant portions of open and undeveloped land, many of the green strategies that will likely be successful in the SIEDC Green Zone will be connected to landside site improvements. If we can connect those improvements to adjacent park spaces, the industrial spaces will more effectively blend in with the larger surrounding natural environment. The most effective way to integrate industrial space with parkland is to connect the two uses through shared benefit. The 13

203 creation of a West Shore Bluebelt would effectively create a need to designate parkland where natural stormwater management systems would need to be created, making those same park spaces directly valuable to adjacent industrial properties looking to have their stormwater captured through this natural feature. Establishing industrial parks set within a bucolic natural setting would be an added benefit. To make these park spaces valuable to all Staten Islanders, entrances to these park areas need to be connected to the West Shore street system. Amenities such as kayak launches, boardwalks and Figure 8: Saw Mill Creek Park Signage park signage will help users to orient themselves and will add to the enjoyment of this extensive open space system. Greater usage of the parks can only benefit the branding of the Green Zone. Old Place Creek and Saw Mill Creek represent two of the major tributary areas that are already protected by the Parks Department. While Old Place Creek remains difficult to access until the ultimate disposition of the GATX site, Saw Mill Creek is accessible from River Road and would be an excellent candidate site to pilot as a Green Zone park amenity. Local Street and Infrastructure Improvements The West Shore of Staten Island, partly because of its limited access and partly because of its heavy industrial history, remains a mystery to most Staten Island residents. The large industrial sites that could become redevelopment sites are tucked away behind overgrown fences on small winding roads that often dead-end into wetland areas or waterfront street ends. Local access is extremely limited. Many major industrial sites are set up along one-way roads. Access into the site via local streets is limited by a few overpasses over the West Shore Expressway. These connections tend to dump travelers out of the zone onto the local street system or into residential neighborhoods. Many components of basic infrastructure are lacking including storm and sanitary sewers, electrical and cable connections and gas connections to provide sufficient energy capacity for new developments. The street network is not conducive to industrial growth and represents a significant disincentive to businesses looking to locate into the Green Zone east of the West Shore Expressway. There are a number of steps that can be taken in the short-term to improve local access. Identifying Locations Lacking Sufficient Infrastructure Redevelopment typically necessitates connections to the infrastructure imbedded in the local street system. However, in the case of the Green Zone, many of the basic infrastructural necessities are lacking or linkages are incomplete, making simple redevelopment efforts complicated, adding expense and extending the design and construction timetables. The SIEDC should commission an inventory of the district to identify where basic infrastructure is lacking in order to set forth priorities for developing capital improvements and partnering capital improvements to reduce the difficulty and expense of making connections for individual developments at the time of development. The inventory should include storm, sanitary, gas, electric, and telephone and cable infrastructure. These improvements can then be scheduled to coincide with street improvements so that streets do not have to be reconstructed more than once. 14

204 Two-Way Designation for the West Shore Service Road The assemblages that lie to the north of the South Avenue Exit on the West Shore Expressway are isolated by the lack of effective local access into the site. All of the sites to the North of the South Avenue exit of the West Shore Expressway must be accessed locally from the north by Gulf Avenue. While using Gulf Avenue is a convenient route from the Goethals Bridge, the return trip is a circuitous route south to the South Avenue exit to return north. Making Gulf Avenue a two-way street between Edward Curry Boulevard and Forest Avenue would accomplish a number of goals. It would provide direct two-way access into the heart of the Green Zone. It would demark Edward Curry Boulevard as the Main Street in the northern section of the Green Zone. It would allow the frontages on Gulf Avenue, which includes a prime section of the GATX site, an adequate front door within the district that could be accessed both from the South and from the North. Figure 10: Ingress and egress routes to and from the Green Zone The illustration above shows the current ingress and egress route from the north to River Road, a cityowned assemblage within the Green Zone that is actively being marketed by SIEDC for industrial development. If a traveler is unaware of the ability to access the site from Gulf Avenue, then access into the site directly from the West Shore Expressway can only be achieved via the South Avenue exit and all 15

 and the New York City Department of Transportation (NYC DOT) to propose the establishment of the WSE")

205 of the frontages along Gulf Avenue would actually be inaccessible due to its one-way southbound designation. This effectively makes all of these northern sites accessible only by those that are familiar and knowledgeable of the larger local network and those that can find Gulf Avenue, whose entrance is more than one mile north by the Goethals Bridge. Next Steps: Convene a meeting with the New York State Department of Transportation (NYS DOT) and the New York City Department of Transportation (NYC DOT) to propose the establishment of the WSE Service Road between Forest Avenue and Edward Curry Boulevard as a two-way street. Figure 11: Many streets in the Green Zone are subject to flooding Green Infrastructure Pilot Programs The City of New York is rolling out a significant number of new street stormwater pilot projects that are both beautifying local neighborhoods while enhancing stormwater catchment and reducing impacts on combined sewage overflows (CSOs). These pilots are designed to build new street drainage strategies that will help move the regulatory agencies towards more standard complete street and stormwater management strategies throughout the City of New York. The streets within the Green Zone are ideal candidates for this program for a number of reasons. First, many of them are routinely flooded during storm events due to the large number of wetlands and tributaries surrounding a very low lying system. Second, many of these streets do not currently have sidewalks, trees or other amenities and infrastructure that would need to be installed for pilot programs so there is no retrofit required. Third, these streets are only lightly used making closures for retrofit easier and less impactful. Fourth, it would represent a unique set of conditions for stormwater management strategies and for establishing guidelines for best management practices within industrial neighborhoods. A fifth reason is that many of these sites lack current street drainage infrastructure and so are excellent candidates for stormwater Figure 8: Edward Curry Boulevard (left), Typical Green Zone street condition (right) 16

206 run-off reduction strategies that could reduce capital costs for future road infrastructure development. Sixth and perhaps most importantly, if strategically placed, would enhance the curb appeal for businesses located in the Green Zone. The only recently improved street within the Green Zone, Edward Curry Boulevard stands in stark contrast to the rest of the system. There are a number of candidate locations that require complete street redevelopment that could help to establish the Green Zone as a place to do business. The Green Infrastructure Pilot Program would be an excellent starting point towards a comprehensive streets redevelopment initiative in the Green Zone. Next Steps: Identify suitable locations to propose as green infrastructure pilot program candidate sites Convene a meeting with the (New York City Department of Design and Construction (NYC DDC), the NYC DOT and the New York City Department of Environmental Protection (NYC DEP) to determine suitability for the Green Zone as a pilot location for the pilot program Green Zone Gateway Signage Program While the Green Zone is designated as a clearly defined industrial district, primarily sited to the west of the West Shore Expressway, anyone traveling through this area would have no sense where this district starts and ends or whether there is a distinct and specific zone that they are traveling through. Businesses want to be seen and known. Designating signage at the entry points to the district will establish an address for every business within the Green Zone and put the Green Zone literally on the map. There are a number of key locations where signage can help to designate the boundaries of the district. Figure 9: Clearly demarcating entry points into the Green Zone will help put the district "on the map". At the northern end, Gulf Avenue is the only road that connects into the Green Zone west of Route 440 and represents the northern entry into the zone. The zone is actually split into two sub-districts, accessible via local roadways that cross over the West Shore Expressway into the district. There are 17
207 three key entry locations Edward Curry Boulevard, South Avenue and Victory Boulevard. Placing signage at these four locations would identify the gateway locations into the site. Once within the site, there are a number of poorly signed interior roadways, and a number of dead-end streets. The SIEDC should look into the possibility of marking the major businesses that reside along each street and develop a signage and wayfinding system for the industrial zone that identifies the participating businesses and brands the zone through identifiable signage. A similar exercise was conducted for the Staten Island Corporate Park with distinctive signage and street beautification helping to effectively delineate the zone. Next Steps: Develop Green Zone logo and signage design Meet with NYC DOT to determine NYC DOT regulations concerning gateway signage 18
208 Incentives which differ from as-of-right Green incentives in NYC The recent growth of green companies and green buildings has come about in part due to a series of programs at the federal, state and local level to incentivize businesses to modify operations and develop buildings in a more sustainable manner. Most of these incentives, which we listed and categorized into three classifications: green land, green business and green buildings in the Green Zone task 3 Report, take the form of low interest loans, small-scale grants and tax benefits. Through our research, we have also identified a number of incentives that are focused on a specific zone with special classifications and characteristics, such as the SIEDC Green Zone, which is geared towards sustainable industrial redevelopment strategies. These incentives include the expansion of Foreign Trade Zone # 48, development of a bluebelt district for the Green Zone and the State of New York Green Economic Zones Act. There are additional opportunities for SIEDC to partner with the City of New York and the State of New York to develop zone specific incentives to catalyze industrial growth in the Green Zone. The following are three possible additional incentives that SIEDC could consider implementing in order to diversify the types of specific Green Zone incentives available to its businesses. Staten Island Green Zone Green Research and Development (R+D) Incentive To effectively promote sustainable growth, SIEDC should be seeking out companies that are evolving to meet with changing industrial needs of the region, companies that are actively exploring new technologies and practices through research and development. There are companies currently housed within the Green Zone that are exploring new technologies of concrete and for materials manufacturing. The field of materials recycling is a rapidly expanding business with significant associated research and development. It is often the case that research and development activities are housed in separate locations from manufacturing and assembly, but that is not always the case and the SIEDC Green Zone could make a strong case for co-locating these operations, either as a small segment of operations, or as a testing facility for production that could be co-located or even ultimately constructed in an entirely different location. Research and development jobs tend to be higher paying and attract the type of talent that is looking for the amenities offered by a City such as New York City. Companies may see a Staten Island location as a strong candidate for research and development of industrial products. The goal should be to promote business in-house research and development capabilities, developing on-site testing facilities and the employment base to support R+D. R+D can be a part of many industrial practices. As an example, concrete mixing is an industrial practice and there is a need for concrete mixing on Staten Island to service the immediate region. However, as the concrete industry continues to evolve, companies are testing levels of recycled material content, pervious paving technologies and other methods to ensure the lifespan and performance of concrete. Those R+D efforts could be classified as green research and development and could be subject to a State or even a federal income tax credit for that portion of the business dedicated to R+D. Promoting opportunities to expand R+D can only lead to more effective companies and greater investment as companies grow. The R+D incentive could be zoned for the Green Zone as it conforms to the goals of the zone to promote green technologies. An incentive of this nature should be seen as beneficial both to existing businesses who are currently not receiving any tax deductions for their R+D operations and future businesses with R+D capabilities that could benefit from this specific tax incentive. 19
209 Staten Island Green Zone Urban Industrial Growth Boundary Designation The Green Zone can be defined as a series of industrial redevelopment footprints that can be carved out of a much larger boundary that includes significant wetlands and otherwise encumbered open land that will need to be preserved as open space. If the SIEDC could provide a value to companies that creatively reposition available land to optimize development footprint so as to preserve open space, businesses could be attracted to building on smaller footprints, reducing the potential friction with NYS DEC and other agencies on permitting issues. To incentivize businesses to build within these available footprints, the City of New York could establish the Green Zone as an Industrial Urban Growth Boundary, establishing guidelines for development practice that optimize land use and promote new technologies and approaches for industrial construction. Urban Growth Boundaries are not a new concept and are often structured in growth areas in order to control sprawl and promote greater density, especially in primarily residential zones where a greater density housing model could be implemented. The US EPA and other federal agencies have published guidebooks illustrating smart growth principles that could be adapted to an industrial urban growth strategy for the Staten Island Green Zone. By establishing the Green Zone as an industrial smart growth pilot, the Green Zone could provide a template for industrial smart growth strategies that could be replicated throughout the City and elsewhere in the region. The goal of Urban Industrial Growth Boundary would be to incentivize owners/developers to minimize their impact upon open space by optimizing their operations to build on the smallest footprint suitable for operations. While many industrial practices require significant single-story facilities for warehousing, distribution and assembly, technologies are creating ways for companies to develop industrial operations on smaller footprints. An excellent example of industrial technological that have reshaped industrial practice is in the storage and distribution of meat. Beef used to be handled as a single hung side of beef brought into lowceilinged refrigerated storage units. Since refrigeration is one of the most expensive elements of the industry, refrigeration units were appropriately sized low ceilinged coolers. Advancements in processing and packaging have revolutionized the industry as boxed beef has replaced hung beef as the preferred mode of shipping and the most successful companies are now moving beef through 36 foot high single story stacked coolers to maximize efficiencies. The industrial Urban Industrial Growth Boundary would be implemented through tax incentives, reduction of site development requirements and land use and FAR incentives for construction. The incentives would reduce the tax burden on undeveloped land for any business that could show efficiencies through design and construction practice. Changing FAR designations would potentially increase property values. Reducing development requirements (such as parking requirements), would reduce construction costs. A further benefit to SIEDC could come through coupling the Urban Industrial Growth boundary with transportation improvements that connect the Green Zone to the extensive Staten Island bus system. One of the critical tenets of Smart Growth development is the reduction on the reliance of the automobile. Currently, since there are no bus routes connecting through the Green Zone, any employee looking to work in the Green Zone must access their place of work via the automobile. This program could provide incentives to business owners to connect their employees to transportation alternatives which could be coupled to changes in the MTA bus routing to connect into the Green Zone. By establishing a direct program to incentive mass transit, SIEDC would be forging the foundation for promoting longer-term more infrastructure intensive mass transit measures such as the West Shore Light Rail connection. 20
210 Additional incentives that would help the Green Zone to establish more effective mass transportation alternatives could include: - Reduced parking requirements for business that are connected to mass transit and can illustrate a program to promote transit usage for its employees. - Tax reduction for creating impervious surfaces for parking areas on site (which would tie into the goals of the Bluebelt Program). - Zoning incentives to allow for additional FAR for businesses able to reduce their footprint from the allowable FAR requirements for M zones within the district. - Tax credits for employees using mass transit as a means to get to work. Staten Island Green Zone Industrial Improvement Zone Many regions around the country are developing strategies to pay for major infrastructure improvements and amenities by floating bonds to pay for improvements and paying bonds back through collecting tax revenues from businesses within specific zones that stand to benefit from those improvements. The structure of an Industrial Improvement Zone would establish a bonding authority that would generate bonds to fund major infrastructure improvements that exceed the ability of the local municipality to fund through traditional funding channels. The infrastructure improvements would in turn increase property values within a catchment area surrounding the improvement zone. As property values increase, a portion of all of the taxes from increased assessments would be dedicated to pay back the bonds. Once paid off, those taxes would accrue to the local municipality. In the case of the Staten Island Green Zone, the catchment area could be the industrial lands within the Green Zone and the appropriate infrastructure development opportunities could be: - Roadway improvements - Implementation of the Bluebelt system - Construction of the infrastructure to support new major developments (Energy, Freight Logistics) The Bonds can be issued if offset by a steady annual payback structure, which would come from the tax revenues from companies who are benefitting from the improvements. The additional taxes on the improved land would be dedicated specifically to paying back the bonds. To be clear, the businesses are not paying any additional taxes beyond the taxes that would pay for their improved property values, it would just be that the tax payments would be dedicated to paying off the bond as opposed to going to the City or the State. 21
211 Tailoring Current Incentive Programs to Benefit the Staten Island Green Zone To establish the Green Zone as a preferred destination for industrial development, the SIEDC is considering multiple interconnected strategies: physical improvements to zone infrastructure; improved access and visibility; targeting specific industries whose needs match district attributes; supporting legislation designed to establish specific zone incentives; and applying successful incentive programs in other parts of the country to the Green Zone. One additional strategy would be to review incentives already offered in New York City, and tailor those programs to be more effective in incentivizing Green Zone businesses. Many of the incentive programs offered in New York City take the form of an abatement or tax relief to incentivize new development. The SIEDC should review currently offered incentives to determine if they can be paired or altered to more effectively incentivize Green Zone businesses while simultaneously helping the City of New York create new jobs and increase its tax base through new development. Two of the more effective programs offered by New York City are the Industrial and Commercial Abatement Program (ICAP) and the Industrial Development Authority (IDA) incentive programs. There is opportunity for both programs to be modified to promote green construction methods. Some opportunities that could be realized include: Modifying the ICAP program to incorporate the NYC Green Roof Property Tax Abatement Program Expanding the NYC Green Roof Property Tax Abatement Program to Include alternative Green Roof Energy Reduction and Water Retention Strategies Developing a new IDA Program geared towards Green Industrial Development Strategies Connecting the Industrial and Commercial Abatement Program (ICAP) with NYC Green Roof Property Tax Abatement Program One of the most successful and widely utilized programs in New York City is the Industrial and Commercial Abatement Program (ICAP). The ICAP program, the most recent iteration of the longstanding Industrial and Commercial Incentive Program, is the largest incentive program in the City of New York. The program has been around since the 1970 s and was put in place to incentivize businesses to invest in growing in New York City as opposed to relocating outside of the City to meet their expansion needs. To that end, it has been both an effective means to recruit businesses into New York as well as an avenue for businesses to expand in New York. The program cost the City of New York more than $400 million in 2007 and in excess of $600 million in Adjustments have been made to the program periodically, including the most recent re-authorization of the program in The Industrial and Commercial Abatement Program (ICAP) reduces a portion of the increase in real property taxes due to new construction, modernization or rehabilitation of industrial buildings by providing tax abatements for qualified projects. Industrial and commercial properties that meet eligibility requirements can receive abatements on real property taxes for buildings and properties built, modernized, expanded, or otherwise physically improved. Currently, more than 600 properties on Staten Island take advantage of the ICAP program. One limitation of the program is that it cannot be combined with other tax abatement programs. 22
212 Since owners are precluded from combining ICAP with other abatement programs, the incentive to install a green roof as part of a new construction or renovation is significantly reduced. The City should look to combine these programs for industrial construction, as single story large footprint buildings are conducive to green roof technologies and would provide significant benefit to the business and to the City in reduced energy costs and reduced stormwater run-off. Program Benefit Calculations ICAP Program: the amount of the abatement received by a property owner is determined using the following formula: Abatement = (Real Estate Tax on the property after the project s completion) (115% of the predevelopment Real Estate tax.) The abatement is received over a period of up to twenty-five (25) years, depending on multiple factors including percentage of retail space within facility. Typically, for the first fifteen (15) years projects receive a 100% abatement, with a 10% annual reduction yearly for years The Green Roof Abatement program provides a one-year tax abatement of up to $100,000 at $4.50 per square foot. So if you had a 10,000 square foot green roof, and met all of the associated design criteria, you could qualify for a one year $45,000 property tax abatement. Current Eligibility requirements The ICAP program is an as-of-right program for any industrial building that meets the requirements of the program. Applicants must make an investment equal to at least 30% of the taxable assessed value of the property the year the building permit is issued or construction. The abatement can be increased for projects that invest over 40% to the project. Interested parties need to file a preliminary application either before the receipt of the first building permit or, if no permit is required, before the commencement of construction. A final application is then due within one year of the filing of the preliminary application, regardless of whether the project is finished. Additionally, once entered into the ICAP program, a property cannot be eligible for any other abatement programs offered by the City of New York. Currently there are no geographic limitations on Staten Island for real estate projects to take advantage of ICAP. However, the program requires that a minimum of 75% of the property s total net square footage is in use or immediately available for the assembly of goods or fabrication of raw materials. To be eligible for the Green Roof Tax Abatement program, you must dedicate at least 50% of the roof surface as a green roof, that green roof must comply with a detailed list of green roof specifications and the plans must be submitted by a registered architect. Proposed Modification/Enhancement The SIEDC is looking to promote the adoption of sustainable strategies in the Green Zone. Much of what SIEDC is envisioning is industrial use, including warehousing. Green roofs are effective sustainable construction methods for warehouses. The SIEDC should work with the NYC EDC and the Department of Buildings to structure a way for property owners to be able to apply to both ICAP and the Green Roof Abatement program. Partnering the two programs will encourage the construction of green roofs on 23
213 warehouses. Currently, businesses are forced to choose between the two programs and since the costs of the green roof can be built in to the 30% improvement, businesses will likely choose the ICAP program if they qualify. However, the likelihood of an owner putting up the additional up front capital monies to construct a green roof is minimal if they are not specifically incentivized with an abatement to defray some of those costs. There are a number of ways in which the two programs could be combined. The overall life of the abatements could be extended to twenty six years. Since the Green Roof abatement runs for a single year, the programs could be melded so that the green roof benefits are tied in to the first year of abatements with the 25 year abatement kicking in for ICAP starting in year two. If extending the timeframe proves untenable, the draw down on the ICAP could start in year sixteen with a nine year reduction to zero abatement. The SIEDC should work with the implementing agencies in the City of New York to construct a pilot program for industrial properties within the Green Zone, geared towards motivating warehouse construction that incorporates green roofs. If successful, the Green Zone pilot could then be expanded to other industrial zones or implemented as a citywide initiative. Costs and Benefits to the City of New York To understand the cost to the City of New York of combining the abatement programs together, we will assume a typical warehouse construction project. Assumptions: Property Acreage: 5 acres Property Buildable SF: 2 acres New Construction: 30,000 sf Green Roof Construction 20,000 sf Stories: 1 story Cost of Construction: $ 3 million Replacement: $1 million warehouse Land Assessed Value: $50,000 Building Assessed Value: ($50,000 for every $1 Million of value) Initial Tax $100,000 Post Completion Tax $200,000 New Jobs Created 25 Costs Scenario One: Abatement Calculation using ONLY ICAP: Abatement Basis = $200,000 (115% * 100,000) = 85,000 Total 25 year cost to City of New York = $1,742,500 nominal Scenario Two: Abatement Calculation using ONLY Green Roof Abatement Abatement Basis = ($4.50 X 20,000) = $90,000 Total One Year cost to City of New York = $90,000 24
214 Scenario Three: Front-ending a Green Roof Tax Abatement to ICAP Year One = $90,000 Years Two Twenty-Six = $1,742,500 Total Cost to City over 26 years = $1,832,500 Benefits The benefits that would be accrued by the City take the form of specific financial gains and indirect benefits that can be quantified. property taxes will begin to accrue the City after 15 years All additional taxes associated with new development The new facility results in 25 new jobs and associated tax benefits Green roof benefits include: reduced water impacts on CSO Reduced air-conditioning and energy usage reduced carbon footprint If the Green Roof abatement could be added on to the ICAP abatement for any property owner that develops a green roof as part of their addition or new construction, the City would realize the benefits of expanding their green roof program and the owners can structure their abatements to gain the maximum benefits of combining both programs. This marriage would not be double-counting the costs of improvements, but would set aside the costs of green roof construction and allocating those costs against the green roof abatement. The SIEDC Green Zone could be a location where this abatement option could be piloted to determine if the added incentive is sufficient to motivate industrial construction that would include some form or sustainable roof construction. Implementation Strategy Step 1: Conduct meetings with NYC Economic Development Corporation, Department of Buildings and Department of Finance to discuss how the programs can be tied together. Step 2: Reach out to local businesses and developers to gain support for this program Step 3: Advocate to the New York State Senate and Assembly the need to revise the statutes limiting the combination of the ICAP and Green Roof Tax Abatement 25
215 Expanding the New York City Green Roof Property Tax Abatement Program The New York City Green Roof Property Tax Abatement Program is a relatively new program offered through the Department of Buildings to promote the development of green roofs, which lower heat island effect and reduce stormwater run-off and can provide locally sourced energy from renewable resources. There are a number of restrictions to the program and modifications have been considered. For example, the program does not currently cover agricultural farms on roofs and there has been a push within the industry to change the restrictions to incorporate rooftop farms. The program could also be expanded to incorporate additional sustainable strategies for roof construction - blue roofs, solar arrays, etc. to see if abatement programs to encourage these uses could be included in a similar fashion to the green roof abatement program, effectively creating an extra added incentive for industrial businesses to incorporate sustainable strategies for rooftop construction. If expanded to diversify the opportunities for developing green technologies for rooftop construction, these abatements could be incorporated into ICAP or into a green warehouse IDA incentive program. Benefits The benefits that would be accrued by the City take the form of specific financial gains and indirect benefits that can be quantified. Reduced stormwater run-off on industrial properties Increased alternative energy production through private sector initiatives All additional taxes associated with new development (after one year abatement) Reduced air-conditioning and energy usage reduced carbon footprint Connectivity to other incentive programs By expanding the program to include additional sustainable rooftop technologies, the City is promoting improvements that are more suitable to specific developers depending upon site context. If stormwater management is a particularly important issue, the owner could opt for a blue roof. If the site is south facing and sunny, it might be most cost effective over the life-cycle of the business to concentrate on solar panels as opposed to a green roof. It might be most economical to combine technologies that could interface (solar panels on a greenhouse that is fed by water captured through a blue roof system. Perhaps the largest benefit to expanding the program is the increased ability to connect green sustainable roof construction practices to other benefit programs such as IDA and ICAP so that owners are motivated to build sustainable rooftop technologies into their construction project when using either of these programs. Implementation Strategy Step 1: Conduct meetings with NYC Economic Development Corporation, Department of Buildings and Department of Finance to discuss how Green Roof Tax Abatement program could be expanded to include additional sustainable technologies. Step 2: Identify the specific rooftop requirements for each proposed technology 26
216 New York City Industrial Development Agency Program (IDA) The mission of the New York City Industrial Development Agency (NYCIDA) is to encourage economic development throughout the five boroughs, and to assist in the retention of existing jobs, and the creation and attraction of new ones. The NYCIDA s programs have been administered by the New York City Economic Development Corporation since NYCIDA programs are discretionary and provide companies with access to triple tax-exempt bond financing and/or tax benefits to acquire or create capital assets, such as purchasing real estate, constructing or renovating facilities, and acquiring new equipment. All applicants must satisfy eligibility requirements and demonstrate a need for assistance. Benefit Calculation Currently NYCIDA offers two programs that can be used in the Green Zone: Industrial Incentive Program Land Taxes, Building Taxes, Sales Tax Exemption, Mortgage Recording Tax Waiver Manufacturing Facilities Bonding Program Land Taxes, Building Taxes, Sales Tax Exemption, Mortgage Recording Tax Waiver AND Triple Tax Exempt Bond Financing at a discounted rate Under both programs, the owner would be able to save Land Taxes in an amount of $500 multiplied by each full-time employee or part-time equivalent at time of application, for a period of 25 years. A phase-out of the benefit begins in year 22 and continues through year 25 at 20 percent each year. In year 26, land taxes increase to full amounts. Under both programs, Building Taxes may be stabilized at the pre-improvement assessed value for a period of 25 years. A phase-out of the benefit begins in year 22 and continues through year 25 at 20 percent each year. In year 26, building taxes return to full assessment amount. Under both programs, an owner may be eligible to receive a Sales Tax Exemption of on equipment and/or materials used to construct, renovate or equip the facility during construction. Under both programs, owners can receive a Mortgage Recording Tax Waiver relating to the project's financing, equal to 2.05 percent of the mortgage amount for mortgages of $500,000 or less, and 2.80 percent for mortgages greater than $500,000. If the owner is eligible to qualify for the Manufacturing Facilities Bonding Program ONLY, he/she can qualify for Triple Tax Exempt bond financing often at lower interest rates than traditional debt finance. Current Eligibility requirements Projects are selected based on their ability to expand the New York City Economy. Participants are required to identify the benefits they will bring to New York City and the failure to meet those objectives can lead to the city recapturing the incentives. For the Manufacturing Facilities Bonding program in particular, the purchases using the proceeds from the Bond Sale are limited by government regulations on how much can be spent on land and/or buildings, which is a determining factor in assessing whether this program will be beneficial. 27
217 Proposed Modification The basic IDA packages can be tailored to focus on a specific industry or use type to coordinate with City initiatives. A recent example of this would be the NYC Fresh Program (Food Retail Expansion to Support Health). The Mayor s office conducted a study that identified communities within the City of New York that could be classified as food deserts places where healthy food options more deficient or nonexistent. In an effort to make sure that every neighborhood in the City has access to fresh food, the City formed the FRESH initiative and then looked to provide financing to incentivize grocery stores to locate in areas where fresh food options are deficient. A series of criteria were developed: zones based upon the fresh food deficiency; size requirements a minimum of 6000 sf.; percentages of fresh food as part of total retail space square footage. For businesses that were eligible, a number of incentives were made available, including additional FAR for buildings that included a grocery, reduced parking requirements for grocery parking which enabled a smaller footprint to be dedicated to parking as part of the total construction, and as-of-right permitting in manufacturing zones. Using the FRESH program as a guide to thinking about an IDA effort tailored towards Green Infrastructure and Green industrial development, a structured place-based incentive program could be developed that could be restricted by industrial zone, IBZ or even exclusively to Green Zones as established in State legislation. The key would be to attach appropriate incentives that are productive to the development of industrial land that will motivate companies to build in the Green Zone AND to build green. For example, the FAR bonus is probably NOT a worthwhile incentive for the Green Zone as most developments are likely to fit within the given FAR and would tend to be one story industrial facilities. However, a wide range of possibilities could be envisioned. Some possible incentives that would be context sensitive to the Green Zone and to industrial usage include: Provide land tax abatement ($500) for any employee that has graduated from an accredited green job training program. The abatement would run for a period of 25 years. By connecting the job incentive to green training, the IDA benefits will leverage existing green training initiatives offered by the City and could result in the development of a training center in or connected to the Green Zone. The employer would benefit from the fact that he or she would have access to a pool of trained employees who have graduated from these programs and would save in labor training and time and cost associated with hiring labor. Prioritized access to brownfield environmental remediation funds offered through the MOER BIG program or other similar programs. MOER has been trying to gain a foothold in Staten Island, attempting to get Staten Island businesses to apply for their remediation funds. By connecting MOER to the IDA program for the Green Zone, they will build an immediate clientele which should help to further promote their programs. Reducing parking requirements for buildings that are making green improvements (we can tie the green improvements to the green land, green building, green business construct that we have developed for tracking the progress of owners within the Green Zone). Lot coverage ratio could be modified to allow for greater lot coverage, enabling a larger onestory building to be constructed on a plot of land. For example, if a property owner has a 50% lot coverage and a one FAR, but only needs to build a one story building, the maximum building footprint that could be achieved would be equal to 50% of the total lot. The program could 28
218 increase the lot coverage to.75, allowing for owners to construct on a larger footprint. This bonus could be tied to other green criteria such as the requirement to also construct a green roof on the roof to mitigate the fact that the larger footprint would increase impervious surface. The rationale behind lot coverage controls is partially based upon reducing impervious surface on property. However, by constructing a living roof on 75% of the build footprint, the impervious surface would actually be reduced over a 50% lot coverage building without a living roof. Costs and Benefits to the City of New York To understand the cost to the City of New York of implementing a modified IDA program geared towards the industrial Green Zone, we will assume a typical warehouse construction project. Assumptions: Property Acreage: 5 acres Property Buildable SF: 2 acres New Construction: 30,000 sf Green Roof Construction 20,000 sf Stories: 1 story Cost of New Construction: $ 3 million Replacement: $1 million warehouse Land Assessed Value: $50,000 Building Assessed Value: $50,000 (for every $1 Million of value) Initial Tax $100,000 Post Completion Tax $200,000 New Jobs Created 25 Mortgage 80% of construction and land value Costs Direct IDA Costs to the City: Annual building tax saving basis = (150,000 50,000) = 100,000 Total over 25 years $2,300,000 nominal dollars Mortgage recording tax saving = 80% * $2,000,000 * 2.8% = $44,800 Sales tax savings assuming half of the cost is for materials and supplies $3,000,000 * 50% * 8.875% = $131,125 Total costs to the City over 25 years = $2,475,923 in nominal dollars With additional benefits tailored to the project to the Staten Island Green Zone: Annual land tax saving basis= 500 * 25 = $10,000 (Assuming all 25 employees are appropriately trained) Total over 25 years $230,000 nominal dollars 29
219 Benefits The benefits that would be accrued by the City take the form of specific financial gains and indirect benefits that can be quantified. Land and building taxes will begin to accrue the City after 15 years All additional taxes associated with new development The new facility results in 25 new jobs and associated tax benefits Larger building footprints would result in larger tax assessments City would realize new green roof construction connected to new warehouse construction Increased access to additional green benefit programs Reduced air-conditioning and energy usage reduced carbon footprint Promotes OER remediation projects on Staten Island Next Steps Step 1: Conduct a roundtable with NYC EDC, representatives responsible for monitoring the IDA program, DCP and MOER to develop a uniform application and approval process that includes modified FAR, incorporation of Green Incentive programs and OER remediation financing Step 2: Identify the Staten Island Green Zone as a target area and identify the criteria for selection (aka industrial zone, special stormwater management district, IBZ zone boundary) to justify the creation of a boundary for the program similar to the rationale used in designating FRESH zones Step 3: Create one-page marketing guide covering the benefits 30

220 Green Zone Major Redevelopment Strategies Our short-term actions will have direct impact upon the marketability of the district and the effectiveness of the major redevelopment strategies. Successful progress of the short-term redevelopment actions will set the stage for the implementation of our major redevelopment strategies. Taken in sum, the major redevelopment strategies represent large-scale partnership efforts that will market the improved Green Zone to a specific targeted cluster of businesses in order to generate specific marketable industry nodes. The goal is to market specific combined incentive, investment and capital improvement strategies that will set into motion a chain of events to catalyze multiple users to focus on Staten Island as the best location to locate their businesses. All of our longer term redevelopment strategies still require immediate action, but will measure results along a longer Figure 10: Potential Redevelopment Scenarios 31

221 timeframe involving multiple steps and more complex partnerships. The size of the zone and ability to stage sections of the zone for multiple possible redevelopment futures allow us to consider these developments in parallel, casting a wide net in order to provide the greatest opportunity for redevelopment. Figure 12 illustrates the opportunity for siting multiple targeted industry clusters within the Green Zone district. These clusters are focused around specific site requirements, site size restrictions and site opportunities, but effectively, any of the major assemblages within the Green Zone could be candidate sites for any of our strategies given the right mix of incentives and site preparation work. The Green Zone assemblages are likely to come on line as development opportunity sites along distinct timeframes based upon specific site constraints. To optimize redevelopment opportunity, our strategic approach will be to keep multiple potential redevelopment opportunities in the mix as each of our critical assemblages is staged for redevelopment to ensure maximum redevelopment opportunity. For example, a materials recycling site may benefit from the low-cost heat generated through our district energy strategy and therefore might be well suited to locate within the ½ mile range of a district energy center, effectively combining two strategies to incentivize redevelopment. Figure 11: Potential Redevelopment Sites Redevelopment Opportunity The Staten Island Green Zone encompasses a significant portion of the West Shore of Staten Island. As part of the recommendations of this study, it is recommended that the Green Zone be expanded to include industrial assemblages to the South of Fresh Kills Park that provide the same opportunity for industrial growth as the current boundaries. While the district includes land lying to the east of the West Shore Expressway, land which includes commercially zoned development footprints, almost all of the major assemblages lie to the west of 32
222 the West Shore Expressway. Our redevelopment strategies concentrate on these assemblages. While there are a number of individual sites that are either vacant or stand as potential redevelopment sites, many of these can be assembled together, providing larger assemblages to more effectively market opportunity to larger investors and development interests. Within the current zone boundary, there are roughly ten such assemblages, conservatively representing more than four hundred acres of development opportunity. Some of the sites are currently vacant, while others have existing operations but could realize opportunity through redevelopment. We have labeled these assemblages as potential redevelopment sites. These assemblages can be further assembled or sub-developed as smaller lots, but taken in sum, represent a significant concentration of industrial property capable of siting a significant new industry type or a series of integrated industrial businesses. Similar to any business practice, industrial companies tend to congregate to achieve economies of scale. While New York City has lost most of its industry since the 1940s and more than two-thirds of its manufacturing jobs, a market for industrial development in New York City still exists. An industrial retention and growth strategy focused on industrial sectors that supply strategic industrial products to urban regions can revitalize the few remaining industrial zones in the City. Materials recycling and alternative energy production are two key growth areas that benefit from proximity to urban regions to access the supplies that generate their products and outputs. Increasingly, industrial companies are looking to site their businesses within urban settings where they can make use of the industrial byproducts of others, a strategy which also enters in to our redevelopment strategies for the district. There are fewer and fewer locations within the City that fit this need, and Staten Island represents one of the largest, one of the few with large tracts of vacant land and one of the few that is not threatened with alternative redevelopment pressures. Having sufficient space to site new industrial establishments that are connected through service or through provision of an industrial product to the urban environment places makes Staten Island uniquely positioned to provide the space for these business looking to service the New York metropolitan region. The Green Zone industrial areas west of the West Shore Expressway can be viewed as three distinct redevelopment subareas. The central zone, which is identified below, is Zone 1 and contains a number of assemblages fronting on some of the smaller local roads in the district. While there are some small industrial operations taking place, due to the significant isolation of the district, many of the sites are underutilized or vacant. With local roadway improvements, access into the Zone 1 can be significantly enhanced and the area could be considered for all of the proposed major redevelopment strategies. The most intriguing component to Zone 2 is the concentration of sites along Chelsea Road at the South Avenue exit. This mix of industrial and commercial uses represents almost 100 acres of land conducive to development and probably the two most promising early development candidates in the Vanbro site and the former Chocolate factory site, both with frontage onto Chelsea Road. Zone 2 lies to the south of Zone 1 and is not directly accessible through local streets west of the West Shore Expressway to zone one, making it a completely separate development zone. Access into Zone 2 must be made via the Victory Boulevard exit of the West Shore Expressway or via Victory Boulevard where it crosses the West Shore Expressway. Zone 2 is characterized by a wide range of uses including residential, commercial, small scale light manufacturing and distribution and heavy manufacturing. The zone is structured as a large loop, with all properties fronting on one of the four roads that connect the loop, all of which are one-way connectors creating a loop that starts and ends at Victory Boulevard. While the NRG electrical plant and the Pratt Industries recycling center are the 33
223 dominant uses, they operate in close proximity to Dana Motors Automobile dealership and a small enclave of residential and industrial sites on small footprints. The expansion of major industrial uses is better suited from a land use perspective within Zone 1 to the north, but partnering with the NRG site and Pratt Industries makes this zone particularly attractive for recycling and energy strategies. Zone 3, which is the GATX site, is separated out from Zone 1 because of the nature of the clean-up and short-term constraints to redevelopment. While this assemblage is the largest within the Green Zone, future redevelop will be a longer-term proposition. Portions of the GATX property maintain frontage along Gulf Avenue and lie to the east of the North Shore Railroad. If possible, this portion of the GATX property should be considered for more immediate reuse strategies tying into our development vision for Zone 1. This portion of the GATX site has been included in Zone 1 for that reason pending further analysis of GATX redevelopment plans. Major redevelopment strategies can be considered for all zones but will need to take into account the unique characteristics and development timelines for each. Figure 12: Potential Redevelopment sites in clusters or zones 34
224 Major Redevelopment Strategies This study has compiled a list of targeted industries that are most likely to take advantage of the specific attributes associated with the Green Zone, while focusing on business retention and growth strategies that will support the green economy. By comparing Green Zone attributes with regional industry needs, the study determined a number of potential target industries including waste conversion, materials recycling, alternative energy generation and parts assembly, food production, green building materials and integrated logistics and distribution. The following strategies detail five big ideas that could jumpstart major industrial redevelopment in the Staten Island Green Zone. Integrated Freight Logistics (Freight Village) Renewable Energy Materials Recycling Thermal Energy District West Shore Bluebelt 35
225 Integrated Freight Logistics (Freight Village) Integrated logistics and distribution facilities, also known as Freight Villages, appear to be uniquely aligned with the operations of the Port of New York and New Jersey and extremely complementary to the attributes inherent to the Green Zone. Integrated Freight Logistics Centers or Freight Villages are intermodal terminals that center a diversity of assembly and manufacturing uses that benefit from the siting of the intermodal operation. Freight Villages are a form of intermodal operation that integrates distribution and warehousing with manufacturing and assembly, incorporating smartgrowth principles by aggregating multiple links in the supply chain into a single district to reduce overall transportation costs associated with product assembly and supply. Traditionally, freight villages have been sited in open land where new facilities can be built outside of congested urban locations. These inland ports have tended to create their own new congestion problems and have extended the transportation costs associated with the supply chain. While free movement and access are important, there may be opportunities to consider more urban locations with ready access into the local marketplace and direct connections to local port operations. The Green Zone has access to rail, water and highway, the ability to assemble upwards of 400 acres of suitable industrial land and proximity to both port operations and to the consumer market, making the Green Zone a uniquely suitable candidate for a freight village. As the Goethals and Bayonne Bridges get rebuilt, truck accessibility will be further enhanced, especially if a dedicated truck ramp is incorporated into the future Goethals reconstruction. The widening of the Staten Island Expressway will also ease congestion along the critical I-278 link between Staten Island and New Jersey. Ease of access for trucks will be an important determination for the siting of a freight village. The interests of local, State and regional policy makers could be aligned if new industrial development can be established that supports port expansion needs, provides a means to aggregate trucking operations and realize efficiencies within the New York City roadway system, while bringing new jobs and new tax ratable into Staten Island. Case Studies There are a number of examples of similar centers that have catalyzed new economic growth while providing a much needed distribution center for the local community. Two notable examples include Front Royal, Virginia and Rickenbacker, Ohio. These facilities have been located strategically within distribution corridors in the Northeast and the Midwest precisely because they offer some of the same attributes as Staten Island. Both have created job opportunities, new business development especially manufacturing, and increased local tax base. 36
226 Benefits The benefits of such a facility are numerous. For the Port Authority of New York and New Jersey (PANYNJ), the opportunity to localize the logistics operations for local, regional and national distribution of goods could justify a facility of this nature proximate to the port. For Staten Island, the opportunity to attract additional manufacturing and logistics businesses to the Green Zone will create new job growth and increase the local tax base. For the City of New York, the opportunity to create a point of entry for goods destined for New York City, to be able to organize that distribution chain and optimize goods distribution through information technology in order to reduce total miles traveled and optimize truck loading would be a significant means to reducing the carbon footprint of the City. This notion could be further enhanced with a fleet of electric or bio-diesel vehicles providing the final leg of the distribution link to the consumer within the City. By aggregating this operation at a key point of entry into the City, carbon reduction is achieved while creating an economic and tax opportunity within the City. Siting Requirements - Sufficient acreage (100 acres plus space for spin-off business) - Easy truck access rail, barge access - Appropriate land use and zoning - Distribution market (port, urban center) - Competitive shipping rates Implementation Strategy Identifying a suitable site A freight village will evolve over time as companies site their operations on available sites surrounding and interfacing with the terminal operation. An effective freight village will take the necessary steps to ensure that sufficient growth can be accommodated to build a sufficient critical mass on properties surrounding the terminal to make the venture effective. The West Shore of Staten Island has a larger assemblage of appropriately zoned industrial properties sufficiently separated from residential activities to warrant the creation of a freight terminal that could support the type of ancillary surrounding private expansion that would warrant the capital costs of the terminal facility. Coordinating with Port Expansion Needs The Port Authority of NY and NJ looks to redistribute its holdings in order to prepare sufficient space to accommodate the off-loading of Post Panamax vessels destined for the port by the end of the decade. A number of current distribution and warehousing operations that operate on port property will need to be relocated off-site to clear sufficient space for container operations. These warehousing and distribution uses become excellent candidates for the freight village location, taking products that are traveling across country by truck or rail for export that need to be aggregates and redistributed for 37
227 export at the port. These warehousing operations can be combined into the freight village concept to provide in initial tenants to support the construction of the new warehousing and distribution facilities. The added feature of rail access into the freight village area, coupled with the ability to export products from the Howland Hook facility on Staten Island, present a unique opportunity to develop a system where products can be moved across country by rail where they can be stored and then re-distributed locally for export. Incentive Packages A freight village will have significant regional economic impact. Multiple constituencies will potentially vie with the Green Zone to attract such a major capital investment. While incentives alone will not produce a freight village, an effective package of incentives can help to differentiate a single site amongst multiple candidate locations in a region. There are three key incentives that could play a role in attracting a freight village terminal. The State Green Zone legislation providing a one-time tax deduction for a green business could provide a significant tax savings as a site gets developed. The incorporation of an expanded foreign trade zone could provide a significant incentive for business looking to partner with the terminal to assemble products that have been brought in to the Port of NY and NJ. Finally, the development of a Blue Belt district could provide the basis for compliance with the State Green Zone tax incentive and could significantly reduce capital costs for stormwater construction and potentially provide a public capital commitment for roadway improvements to support the attraction of freight operations. This combination of unique incentives could be a difference-maker in attracting a freight village to Staten Island. The SIEDC is also looking to promote alternative energy strategies within the Green Zone and may be able to couple this initiative with energy incentives. The possibility of connecting a new facility with lowcost energy or on-site energy generation strategies could provide further incentive. Next Steps: Meet with PANYNJ to determine if current warehousing and distribution operations will be relocated to accommodate port expansion Meet with PANYNJ to establish opportunity for FTZ (see *.*) Meet with GATX property owners to determine current usage and timeframe for redevelopment Determine possible freight village site locations given available assemblages and develop marketing strategy to promote freight village concept Meet with appropriate parties to initiate Blue Belt discussions (see *.* below) 38
228 Renewable Energy Strategy Renewable energy policy in the Green Zone will focus on energy efficiency, solar photovoltaic and solar thermal installations, wind energy assembly, and complementing smart grid technologies. Energy efficiency has been called the first fuel by the chairman of the Federal Energy Regulatory Commission. This is because it is most profitable to focus on energy efficiency before undertaking other energy projects. Solar photovoltaic and solar thermal produce electricity and heat without the ongoing expense of fossil fuel inputs. Both technologies are largely without moving parts or combustion which makes both safe and easy to maintain. The elimination of fossil fuels in production removes the significant risk of price fluctuations. In addition, these energy sources will improve local air pollution conditions over more tradition fossil fuel based energy technologies. Solar installations provide construction jobs for electricians, roofers, and pipe fitters on Staten Island. Properly designed photovoltaic installations can reduce solar heat gain through the roof of a building, reducing air conditioning loads. Solar systems are particularly conducive to warehousing and distribution facilities with large single story roof space. Solar systems are modular and can be removed or resold if economic conditions change. Solar can be built on brownfield land or on building roofs. Wind energy assembly is a future growth industry for Staten Island. Currently, many states and developers are working on permitting for offshore wind farms. These farms will need on-shore support structures for both initial construction and for ongoing maintenance and repair. The Green Zone has a strong potential value due to the multiple potential bulkhead connections for ships and barges along the Arthur Kill. The shipping, repair, and assembly jobs associated with this industry make it a strong candidate to bring to the Green Zone. Smart Grid technologies refer to a suite of two way communication tools that actively sense and monitor the status of the electric power grid. Smart grid technologies are needed to help Con Edison manage the electric grid more effectively. Additional solar photovoltaic and off shore wind power are intermittent sources of power and will require new procedures by Con Edison s grid operators to ensure reliable operation. Therefore, utilities, including Con Edison, are investing heavily in new technologies which help manage these loads. Recently, five of Con Edison s engineers won awards for their innovation. The Green Zone can be a hub for that innovation. Siting Requirements Energy efficiency can be implemented at every existing building and will be integrated into future building and process design Train SIEDC Green Zone Manager to understand energy efficiency incentives and opportunities Photovoltaic power and solar thermal collection can be mounted on existing roofs Fresh Kills Park land can be used for solar or wind production (current RFP b Wind turbine assembly and maintenance center requires private shipping docks with access to navigable water 39

229 Case Studies SIEDC will be encouraging building and land owners in the Green Zone to install solar on their properties. This can be achieved through a Power Purchase Agreement (PPA). The PPA is a financial agreement between a solar developer and a property owner. The developer owns the solar panels and leases the space from the property owner. The property owner agrees to purchase all of the power production from the panels at a flat rate. The flat rate is usually higher than current market rates for power, but is guaranteed to stay the same for the life of the PPA, usually 20 years. This is a hedge against rising electric power prices for the owner. One of the most active groups working to make solar energy more cost effective is the NYC Solar America City Partnership. Below is a description of the organization from their website. New York City was designated a Solar America City in June 2007 under the U.S. Department of Energy s Solar America City Initiative. The NYC Solar America City Partnership, led by Sustainable CUNY, is comprised of the City University of New York, the New York City Economic Development Corporation and the Mayor s Office of Long-term Planning and Sustainability. The Partnership has been working together with key stakeholders such as Con Edison, the Department of Buildings, the New York Power Authority and NYSERDA to support large-scale solar energy market growth in NYC. The Solar America City Partnership recently developed a website to show solar power in NYC. It is also a tool for owners to get an idea of how much solar can be installed on their property. The solar map shows that there are currently two commercial solar installations in the Green Zone already 1. Figure 13: NYC Solar Map interface 1 NYC Solar Map: 40
230 The Solar America City Partnership recently won a Sunshot grant from the DOE. This grant is designed to help aggressively reduce the price for solar energy in NYC. The first phase is focused on reducing the approval process from ~1 year to 100 days. Implementation Strategies The SIEDC can use its position as a leader among local businesses to help reduce the energy bills of individual businesses in the area. An individual, hired/trained by SIEDC, can help local businesses analyze energy bills and suggest strategies for reducing them. This reduces the burden on each business to have their own energy expert on staff. Many energy savings opportunities are missed because a lack of technical expertise in this field among small businesses. The SIEDC will be encouraging building and land owners in the Green Zone to install solar on their properties. This can be achieved through a Power Purchase Agreement (PPA). The PPA is a financial agreement between a solar developer and a property owner. The developer owns the solar panels and leases the space from the property owner. The property owner agrees to purchase all of the power production from the panels at a flat rate. The flat rate is usually higher than current market rates for power, but is guaranteed to stay the same for the life of the PPA, usually 20 years. This is a hedge against rising electric power prices for the owner. The SIEDC business partners can begin to attract solar photovoltaic developers to the area by looking for PPA s as described above. Each building owner needs to sign a PPA to lease their rooftop spaces. In addition, solar developers are already responding to an RFP from NYC Economic Development Corporation (EDC) and Department of Environmental Protection (DEP). The SIEDC is looking for long term partners to bring the wind energy business to Staten Island. A foreign wind turbine manufacturer, such as Siemens, Vestas, or Gamesa, will be interested in setting up an assembly and maintenance facility in the next few years. The SIEDC is also looking for long term partners to work on smart grid projects in the area. SIEDC member, Con Edison, is already working on improving reliability, resiliency, and costs of the grid through smart grid technologies. Additional partners will include universities, NYPA, NYSERDA, and more. The SIEDC sees the Green Zone s future growth as an opportunity to build new innovative microgrids and other technologies that will help improve electrical system reliability and environmental performance. Next Steps: The SIEDC Green Zone Manager should understand all free and low cost energy analysis apps that are currently available, this includes Energy Star Portfolio Manager, and social apps like OPower Identify SIEDC business owners who are ready to install solar photovoltaic or solar thermal on rooftops Set up a discussion with Con Edison to get local utility support for these strategies and promote smart grid companies to the area Discuss Con Ed customer data formatting and the Green Button Initiative to help lower the cost of energy analysis for small business owners. Promote the Fresh Kills Park renewable energy project as a Green Zone attraction Begin searching for wind turbine manufacturers and actively promote the Green Zone as a place for wind assembly and maintenance 41

231 Materials Recycling Strategy The City of New York is a leader in the development of sustainable solutions for urban areas. One of the key focus areas for the City of New York is in the area of waste reduction. Its Seminole report, PlaNYC 2030, set forth an ambitious goal of reducing landfill rates by 75%. In a City the size of New York, with a municipal waste stream of more than 36,000 tons of waste daily, a 75% reduction in landfill rates will need to be met through significant new technological advancements in waste technologies. Waste that is no longer landfilled can be reused, recycled, or converted into energy. Businesses are increasingly searching for ways to reduce their costs related to purchase of natural resources and disposal costs of waste. Several green strategies can be employed by local businesses including: redesign of products to use less energy, materials, and waste; design products with recovered material and remanufacture waste products (like Pratt Industries) Shift virgin material use from slow growing materials to rapidly renewable resources, like bamboo Improve capture and biological wastes for re-use in re-building the Staten Island environment; this can be through composting or stormwater management Figure 14: Zero Waste Alliance - Improved Material Flows As we look for ways to reuse waste, the growth in recycled material technologies will expand significantly. The opportunity to aggregate materials and then refashion them into new products provides excellent opportunities to site multiple large-scale materials sorting and handling facilities, as well as facilities that manufacture new products using recycled materials. These types of facilities could take the form of heavy manufacturing, such as concrete and asphalt recycling, or could take the form of light manufacturing facilities where recycled product is introduced into an assembly or manufacturing operation. Recently the City Council passed Local Law 71 of 2011 that mandates DOT to purchase asphalt with minimum of 30% recycled content, increasing demand for these products. Local manufacturing practices can build upon these targets and mandates to develop locally based industrial recycling operations to support sustainable urban infrastructure construction projects. 42
 or industrial ecology. Put in other terms by the U. S.")
232 If carefully planned, multiple facilities could be introduced that feed off of each other, taking the byproducts of one manufacturing operation and integrating them into the finished products of another. This type of manufacturing integration is termed by-product synergy (BPS) or industrial ecology. Put in other terms by the U. S. Business Council for Sustainable Development (US BCSD), BPS is the matching of under-valued waste or by-product streams from one facility with potential users at another facility to create new revenues or savings with potential social and environmental benefits. Another way to close the loop for a business is to take back products from consumers at the end of its useful life and reuse parts. There is a voluntary certification for products that are able to successfully do this work. The certification is called Cradle to Cradle (C2C). Companies that produce C2C products will be interested in becoming a part of the SIEDC Green Zone. 2 Benefits Waste is often a large cost for manufacturing facilities and construction projects. Often this cost is viewed as a necessary evil that should be minimized, while doing the right thing will cause these fees to rise. However, by-product synergy has shown that many common waste products can be sold to other businesses and reused in their processes, but it is not easy to find these interactions. Low cost online data management has improved the viability of sharing the proper information to create a value stream out of waste. Secondary benefits include elimination of regulatory issues and innovations in manufacturing. Case Studies Kalundborg is a leading international example of a purposely planned industrial park that produces far less waste than businesses in NYC. Additional businesses have been added to close the loop of several processes. Houston By-Product Synergy 3 network this is a network of businesses who understand that sharing knowledge about waste products can improve costs, resource use, and emissions. One company even found synergies between two of its own plants that it did not previously know about, creating Figure 15: Kalundborg Industrial Ecosystem a win-win by reducing costs of removing waste while lowering the cost of purchasing raw materials. See below for examples
233 A cement manufacturer uses the slag from a neighboring steel mill in its production process, resulting in a 10% increase in production output and a 30-40% decrease in nitrogen oxide emissions. A major US chemical company identifies synergies between six of its own plants with an estimated annual cost savings of $15 million and total annual energy savings of 900 billion BTU. A fiberglass manufacturer connects with a firm that will use its 500 tons/year of off-spec material as well as discovering soy polymers and chicken feathers as more benign and less expensive raw materials. A brick manufacturer uses incinerated cow bone ash from meat processing plants, industrial ash, and water treatment residue to create a new product line of recycled eco-bricks, diverting 16,000 tons of waste from landfills each year. Implementation Strategies SIEDC will catalyze resource recovery and reuse by starting a by-product synergy network within the Green Zone. This may require a full time manager at SIEDC or alternate form of management. However, local businesses will pay for the services when the network is up and running due to the large benefits they will get out of it. The USBCSD describes the following as keys to success: Diversity: Participants represent a wide variety of industries and organizations, thereby broadening the markets in which participants can find opportunities. Communication: BPS provides a safe forum to share ideas without fear of legal, regulatory or other threats. The process stimulates thinking beyond fence lines. Partnerships: By leveraging technical consultants, regulatory agencies, research organizations and funding sources to assist participants, barriers to implementing the synergies are greatly reduced. Quantifiable Benefits: All BPS programs carefully track associated environmental, economic and social benefits. This provides current and prospective participants, as well as funders and other interested parties, with a continuing incentive to maintain and expand the program. Next Steps: Bring in United States Business Council for Sustainable Development for a discussion about byproduct synergy with key SIEDC members Pratt Industries and others Lure businesses to the Green Zone that produce certified Cradle to Cradle products or remanufacture abundant waste products, such as construction waste Train SIEDC staff member in by-product synergy opportunities 44
234 Thermal Energy District Strategy The Green Zone offers a perfect opportunity to build a new thermal energy district from the ground up. A new thermal energy district will help meet the needs of a growing industrial Green Zone in the most environmentally friendly ways possible. The new system will provide reliable and low cost thermal energy and electric for industrial customers. New York City already contains the largest district thermal energy system in the country, the Con Edison Steam system. This system was built in the late 1800s in order to help meet electric and heating needs of a growing city. The system has grown to 105 miles of underground steam piping, 1,800 customers (buildings), and five large steam plants. The thermal energy district requires an upfront investment in order to build a power plant that can service the types of loads present in an industrial district. This power plant may be modular in nature in order to meet the needs of a growing green industrial zone surrounding the power plant. Benefits Creating a thermal energy district is not easy and requires the cooperation of local utility companies, government regulators, and others. However, industrial companies will reap the benefits immediately. New industrial companies who are interested in building a new manufacturing plant will not need to invest in boilers or personnel to run them. The reliability of a centralized plant is significantly better with less redundancy. There are significant cost benefits to a district energy system. The central power plant only needs a small specialized staff of operators. The power plant can make money both from selling power into the Con Ed grid and from selling thermal energy to customers. Both electricity and thermal energy are made at a very high efficiency, due to cogeneration technologies, and will provide a competitive rate for both. Individual manufacturing facilities do not need to invest in boiler, chimneys, and other expensive hardware. The central power plant can procure fuels at a large volume discount and can be more flexible in its choices of fuel than individual building owners or industrial customers. Therefore, the thermal cogeneration plant can be fueled by natural gas, fuel oil, landfill gas, biomass, anaerobic digester gas, or municipal solid waste gas (from gasification). In addition, wind or solar can be integrated into the electric microgrid in the area. Siting Requirements Central power plant with underground piping to surrounding customers New industrial development will cluster around the central power plant Case Studies District Energy St. Paul provides heating and cooling services to downtown Saint Paul, Minnesota. This energy district uses wood chips (biomass), natural gas, oil or low-sulfur coal to fuel its district heating and cooling systems. With the 2003 startup of an adjacent wood-fired combined heat and power plant managed by an affiliate, Ever-Green Energy, District Energy has reduced its reliance on coal and oil by 70 percent. Using a renewable fuel source produces significant environmental benefits and helps the community solve a local tree disposal problem. District Energy customers benefit from reduced costs, a 45
235 unique renewable fuel source, and the knowledge that they are using an environmentally sustainable source of "green energy" to heat and cool their buildings. Largest hot water system in the country More than 187 buildings and 30 million SF 25 MW of electric cogeneration with 65 MW of thermal production Fuels include wood residue, natural gas, coal, and fuel oil Implementation Strategies The SIEDC will be coordinating its efforts on the thermal energy strategy with the Bluebelt strategy and stormwater permitting efforts. This will cluster new industrial developments into different zones. The SIEDC will have to consider whether the businesses in each cluster can benefit from a thermal district energy strategy. Next Steps: Identify business owners in the Green Zone with large thermal needs Commission a study of thermal energy needs across business owners in the Green Zone Coordinate future development with Blue Belts and stormwater permitting efforts 46


236 West Shore Bluebelt Strategy While the above previously mentioned redevelopment strategies focus on specific target green industrial markets, our final recommendation is a district-wide strategy that should universally benefit all sites within the Green Zone while helping to market the entire zone as a green district. The West Shore Bluebelt Strategy seeks to develop a universal set of natural stormwater management development guidelines that define acceptable stormwater management practice within the zone. Once implemented, the West Shore Bluebelt will optimize use of the significant wetland and tidal infrastructure within the zone, define specific development opportunity and connect the stormwater management regulatory requirements for sites to the bluebelt design guidelines. Most importantly, development and preservation footprints will be established, removing the uncertainty for future development and creating a specific path towards regulatory compliance that could be adopted by owner or future developer. The West Shore of Staten Island is a low lying land area criss-crossed by multiple tributaries and environmentally sensitive wetland areas. These ecologically significant areas are juxtaposed against a number of large-scale industrial operations, often pitting a major industrial development up against a sensitive wetland. Historically, the relationship between these two uses has been in a constant state of friction with the goals of business and economic interests fighting against preservation interests. This negotiation is played out on a site by site basis, at great pains to the business owners and significant administrative costs to the responsible regulatory Figure 21: River Road potential development site agencies. A district-wide strategy would benefit all parties and ultimately improve the marketability and economic opportunity of the West Shore of Staten Island. Benefits Figure 20: There is significant wetland and tidal infrastructure in the Green Zone Defining the area as a Bluebelt will focus the attention of the regulatory agencies on the area and create an opportunity for agencies and the business community to work together to establish an effective district-wide strategy that will benefit environmental goals while enhancing economic opportunity. By then establishing the ecological locations as park areas and creating increased opportunity for access, a third critical value of community benefit will also be achieved through this process. 47
237 Implementation Strategy The bluebelt concept was started on Staten Island and represents a highly successful twenty year development strategy that optimizes public investment through land preservation and natural stormwater detention to replace very expensive grey infrastructure capital investments. While not widely publicized, this massive undertaking has helped to shape a long-term growth strategy for the southern portions of Staten Island that will ultimately increased amenities, preserve open space and increase real estate values in areas connected to the bluebelt systems. Staten Island boasts five bluebelt districts established through a partnership between NYC DCP, NYC Parks Department, NYC DEP and NYC DCAS. The program has caught the attention of the current administration which is looking to launch additional bluebelt systems in Staten Island and portions of Queens where conditions are conducive for such development. The West Shore of Staten Island contains all of the conditions that would warrant the establishment of a blue belt system: multiple connections to tributaries to the Arthur Kill, multiple sites with portions of the property accorded wetland status, large sections of land already under City ownership, multiple designated natural areas and very little current stormwater infrastructure in place. It is likely that the West Shore has gone unnoticed as a blue belt candidate largely because of the associated land uses and industrial nature of the area. However, given the SIEDC approach to Green Zone designation, the challenge of integrating natural stormwater technologies with industrial operations is one that the City of New York should take on as a model of urban stormwater management practice. Next Steps: Establish a Bluebelt Implementation Committee involving the key agency and business representation: o NYS DEC; NYS ESDC; NYC DEP; NYS EDC; NYC DCP; NYC Parks Dept; NYC Mayors Office of LT Planning and Sustainability; SIEDC Businesses in Green Zone (DiFazio, Nicotra, Vanbro, etc.) Research technology for integrating natural storm water management with industrial practice 48

238 Figure 16: Potential West Shore Bluebelt Area 49
239 Future Development Scenario Ultimately, the goal for this study is to lay out an approach and a series of steps that will lead to strategic redevelopment projects for the Green Zone. Redevelopment will result in new jobs and tax revenues for the City of New York. Looking at the district as a whole, as we project development buildout, we can postulate potential benefits through the calculation of new employment opportunities and tax ratables. Recognizing that future development will come in stages over many years as new sites come on line for redevelopment, we have projected a range of development futures to accommodate multiple redevelopment scenarios. For the purposes of this analysis, we have aggregated our development sites into eleven development parcels. It is important to note that this assessment has not taken into account every buildable parcel, but has focused on a large subset of the major potentially developable sites within the district. The total development footprint within the zone may therefore be larger than the identified footprint for this analysis. These sites range in size from two acres to more than 100 acres, based upon physical characteristics, the availability of vacant land and redevelopment potential. Once assembled, we then researched these assemblages to understand any known wetland constraints in order to develop a conservative estimate of buildable acreage within each assemblage. From this exercise, we were able to identify a very conservative estimate of 400 acres of buildable land within the Green Zone. To organize our calculations, we developed four use typologies emblematic of the redevelopment activity targeted for the zone. These four typologies were then matched to our eleven development assemblages. While we identify use typologies, our analysis represents a global depiction of the area and does not divulge specific development options for specific sites, which was not necessary or appropriate for this exercise. Our four typologies can be classified as follows: 1) Materials Recycling - Heavy Industry primarily on open land 2) Heavy Industry in factory setting 3) Light Industry distribution warehousing 4) Office 50
240 These typologies capture a range of potential uses and building footprints. For the purposes of this analysis, we have identified an average set of characteristics for each typology. While some sites could Type Description Site Requirements Application to Zoning Materials Recycling Materials recycling includes the Truck access M3-1 FAR of 2.0 reprocessing of bulky, heavy materials, Rail or water access (possibility of such as concrete, wood, metals, glass, Large site 87,120 sf) and salvaged building components. (possibility of Reducing and recycling C&D materials 87,120 sf) conserves landfill space, reduces the environmental impact of producing new materials, creates jobs, and can reduce overall building project expenses through avoided purchase/disposal costs. Manufacturing Distribution/ Warehousing Manufacturing opportunities for Staten Island include a wide variety of smallscale production and assembly types. These benefit from direct access to the major consumption areas of the Northeast without suffering corresponding cost penalties. Examples include specialty metals, food production, and small-scale prototyping Freight consolidation and redistribution services provided by a freight forwarder in which several smaller shipments are assembled and shipped together to avail of better freight rates and security of cargo. Also called assembly service, cargo consolidation, or freight consolidation. Not adjacent to residential or community uses Truck access Rail access desirable Specific size generally 10,000sf or greater Not adjacent to residential or community uses Truck access Rail access desirable Specific size generally 1 acre and higher M1-1 - FAR of 1.0 M2-1 - FAR of 2.0 M3-1 - FAR of 2.0 M1-1 - FAR of 1.0 M2-1 - FAR of 2.0 M3-1 - FAR of 2.0 Resulting Investment Per Acre Land**: M3-1: $0.6 m Facility & Equipment: $ m Total Investment: M3-1: $ m Headcount: Highly variable Per Acre Land**: $0.6m $1.1m Facility: $ per sf* Equipment: $20-30 per sf Total Investment: $ m Headcount: 1 employee per 1,000 sf Per Acre Land**: $0.6m - $1.1m Facility: $ per sf* Equipment: $10-20 per sf Total Investment:$6.1m 12.3m Headcount: 1 employee per 1,000 sf Office 4-Story office building to house operations of various types Good access to commuter workforce Access to support services (eating and dining as well as hotel and airport for some uses) also desirable C4-3 FAR of 3.4 (possibility of M1-1 - FAR of 1.0 Per Acre Land**: $0.5m $0.95m Facility: $ per sf* Equipment: not significant Total Investment: $9m - $18m Headcount: 3-4 employees per 1,000 sf be conducive to multiple potential typologies given location, size, zoning and targeted redevelopment strategies, others are more clearly marketable for a specific typology. Where applicable, more than one typology was analyzed at multiple development assemblages, providing a range of potential build-out options. We defined this range of potential redevelopments into three scenarios and organized them based upon intensity of employment, with scenario one having the greatest new employment and scenario three having the least. For each typology, we used conservative redevelopment estimates, both in terms of total footprint that would be developed and in the total number of new jobs that would be created through the new use. For example, if a site was deemed suitable for office space with an FAR of 3.4, we chose not to exceed 60% lot coverage for the site and chose not to exceed a 3 story building typology. While this would be a significant new development for the area, and in keeping with similar office developments on Staten Island, it falls short of the maximum FAR allowable. We chose this approach in order to avoid detractors challenging the level of projected build-out as being overambitious. Should redevelopment exceed these conservative estimates, greater employment and tax ratables would result. The assumptions for each typology are list in figure 21. *All construction cost data obtained from RS Means Square Foot Estimator 51 Figure 17: Development Typologies

241 To develop our three build-out scenarios, we applied typologies to our eleven assemblages based upon the characteristics and location of each site. Certain sites remain static under each scenario, offering only a single use typology, while other sites warranted a range of use intensities. For example, for assemblage #8 (the former chocolate factory site), we anticipated three possible build-out scenarios office, distribution, manufacturing. Given these typologies, we matched the uses to scenarios based upon total employment counts for each use, the most intensive being office use in scenario one and the least intensive being manufacturing in scenario three. For each site, based upon use, we were able to derive an employee headcount, an assessed value for land and improvements and an annual property tax level based upon build-out. We then summed these totals for each to calculate totals for all sites 4. All future property tax rates were based upon current tax rates for the properties identified, supplied by the SIEDC. We developed our calculations by assessing current market value and a maximum buildable sf for the facility which was based upon conservative estimate of developable lot area and conservative estimates of lot coverage within the buildable footprint. We then calculated the costs of construction, equipment and other improvements based upon the typology to determine a new assessed value for the property with the new development. From that a new annual total property tax could be derived using current property tax calculation methods. We obtained a headcount by using typical headcounts per one thousand square feet of space, depending upon use and for one acre of space for the heavy manufacturing uses. Labor can vary widely depending upon specific use, so we attempted to use reasonable labor figures based upon industry standards. A depiction of the calculations for scenario one is listed in Figure 24. Figure 18: Scenario One Calculation Table We then calculated an assessed value, headcount and property tax for each assemblage and plugged these projections into three build-out scenarios that corresponded to the reasonable range of uses that could be realized at the eleven sites. The sum total new employment that could reasonably be realized through full build-out of the district ranges between 1200 and 5600 new jobs. The wide range can be attributed to the significant difference in employee totals for office uses as opposed to manufacturing or 4 The assumptions that underpin the labor numbers and property tax ratable for each typology are included in Appendix A to this Task 4 Report. 52

242 distribution. The total annual property tax realized ranges between $3.65 and $4.08 million, depending again upon the type of facilities built under each scenario. The following is a summation of the calculations for each site and a summation for each scenario: Figure 19: Scenario Summary Tables NEW JOBS CREATED = NEW ANNUAL PROPERTY TAX REVENUE = $3,800,000 - $4,080,000 Costs and Benefits Associated with Green Zone Build-out Based upon this order-of-magnitude and conservative projection, there is potential for redevelopment within the Green Zone and significant benefit that would result. It represents the only location in New York City with more than 400 acres of unencumbered developable land separated from residential growth pressures and appropriately zoned for manufacturing use. With a few strategic redevelopment projects to lead the way, the Green Zone could be witness to a transformative wave of industrial redevelopment that provides significant job growth and new tax ratable for New York City. Our action plan is to have SIEDC package numerous incentives to entice entrepreneurial businesses to locate on Staten Island in the Green Zone. In a challenging development market with properties that require improvements so that they can become shovel ready, added incentives at the local and State level will be critical to catalyzing redevelopment. These incentives would be in the form of tax relief through specialized programs being offered at the local, State and Federal level. Specific industrial incentives and programs offered by the city include the Industrial and Commercial Abatement Program (ICAP), Energy Cost Savings Program (ECSP), Commercial Expansion Program (CEP), Relocation and Employment Assistance Program (REAP), and Industrial Development Agency (IDA). The SIEDC staff is trained in locating specific incentives that fulfill the needs of property owners; in addition to the incentives, the SIEDC also works closely with SBS to help owners in the areas of navigating government, recruitment, training, and financing. As these incentives are structured into specific redevelopment proposals that SIEDC can help to shepherd into specific Green Zone sites, there will be 53
243 some loss of tax revenues to the City as developers take advantage of these programs, however that tax revenue loss will be more than made up by the additional tax revenues realized through development as each of these parcels comes on line. In addition to these general incentives that in the SIEDC tool box, constructing zone specific incentives can significantly enhance the attractiveness of a Green Zone location over other regional siting alternatives. At the State level, we have focused on the legislation to develop the Green Economic Zones Act, which will apply thirty percent credit of any business or investment capital spent by a qualifying business within the Green Zone. While the State would reduce its tax increase during the one year in which the capital investment takes place, the additional 70% would accrue and the State would realize the long-term tax benefits associated with the business improvement. At the local level, we suggest the implementation of an Industrial Business Zone concurrent with the area of the Green Zone. This Industrial Business Zone will further incentivize businesses to relocate to the Green Zone through the Industrial Business Relocation Tax Credit. This Relocation Tax Credit is a one-time tax credit of $1,000 per relocated employee, up to $100,000 available to industrial and manufacturing firms relocating to or within the IBZ. In sum, the benefits associated with applying tax credits both for tax credits and as part of employment programs to incentivize new business development both at the local and State level will result in much greater long-term tax stability on Staten Island through the creation of long-term manufacturing and distribution operations and significant increase in the job base on Staten Island. The SIEDC should investigate additional partnerships to promote the hiring of Staten Island residents as these businesses come on line, but the increase of 1200 to 5000 new jobs and $3.8 to $4.2 million in annual property tax revenues would represent a very positive result to justify the incentive programs under consideration at the State and local level for the Green Zone. Conclusion The SIEDC Green Zone should aim to be the premier industrial destination for industrial businesses looking to establish a presence in New York City. To achieve this ambitious goal, the SIEDC will need to develop critical partnerships, expand and enhance the marketing and branding for the zone, garner additional public funding, and make a number of critical short-term and long-term improvements to the business environment. Through these efforts, the Green Zone should be able to more effectively attract new industrial businesses while at the same time strengthening the business environment for existing companies located within the zone. If SIEDC is successful in recruiting new businesses, the district could see significant long-term growth due to the significant size of the area and the number of large parcels that have opportunity for redevelopment. However, success is highly dependent upon the leadership of the SIEDC, as many of the critical steps that need to be taken will not proceed without committed local leadership. Through a series of next steps, SIEDC can build upon the momentum established by SIEDC through its green and clean expo, its work with USEDA, and its partnerships with New York City agencies like the Mayor s Office of Environmental Remediation and the New York City Economic Development Corporation. These actions will result in a new positive business image for the Green Zone, infrastructure improvements within the zone, a favorable regulatory framework for doing business, and new incentive and financing programs to attract businesses. The following list represents ten important next steps to be taken by the SIEDC to continue on the path towards Green Zone establishment and business recruitment for the Green Zone. This list is not inclusive 54

244 of all recommendations put forth for the project, but establishes the key tasks that SIEDC should be taking over the course of the next year to push the Green Zone effort forward. In addition to these ten tasks, SIEDC should look to its private and public partners to garner additional funding to support its efforts. One source that SIEDC had already identified is the BOA program (see action 6 in table below), but beyond that potential source of planning revenues, the SIEDC should look to other programs, agencies and not-for-profit foundations to secure revenues to implement next steps. Figure 20: Top Ten Actions to Promote the GZ 55
WE LIVE WHERE YOU LIVE. REW.CA. WELCOME TO Advertising for Agents and Brokers
 WE LIVE WHERE YOU LIVE. REW.CA WELCOME TO Advertising for Agents and Brokers HAVE YOUR LISTINGS SEEN BY OVER 1 MILLION VISITORS EACH MONTH Get noticed by advertising on REW.ca and zh.rew.ca. Thanks to
allegiance solutions radio traffic & billing our partners Some of the world's most respected nonprofits trust Allegiance Solutions CUSTOMERS LOGOS
 Client login NEWS & EVENTS CONTACT Lorem ipsum dolor sit amet, consectetur adipiscing elit Lorem ipsum dolor sit amet, consectetur adipiscing elit, sed do eiusmod tempor incididunt ut labore et dolore
PMA Sales and Marketing Summit Improving Sales Performance with the Right Data and Process. Presented By: Robert Kimmel September 27, 2017
 PMA Sales and Marketing Summit Improving Sales Performance with the Right Data and Process Presented By: Robert Kimmel September 27, 2017 0 Trusted Advisor to the Manufacturing Industry Established to
onsumer Guide Sponsor the Editorial pages page 5-6 The BBB s Business Directory page 3 How to submit your ad! page 2
 C Spring BETTER BUSINESS BUREAU S onsumer Guide TO TRUSTED BUSINESSES & Summer 2012 Find out how the Spring/Summer Sales kit works page 1-2 Supported by the Calgary Herald Website and Newspaper Be in our
free menu Slimming World the makeover guide When you join before 9th January 2016 Logo Full colour Single colour black Special offers
 Logo the Please always use the logo as shown, complete the strapline know you re amazing. To ensure that colours are consistent the following 4-colour breakdown should be adhered to. C 0 M 100 Y 75 K 0
Principals and Practice of Cryptocurrencies
 Principals and Practice of Cryptocurrencies Cornell CS 5437, Spring 2016 Introduction Principals and Practice of Cryptocurrencies Probability Distributed systems Game theory Cryptography Design choices
Innovation Scorecard Sample Report
 Innovation Scorecard Sample Report Agile Leaders Effective Teams Real Results Chicago Washington DC 877-505-2258 support@truebridgepartners.com Copyright 2015 Truebridge Partners All Rights Reserved. Innovation
DES MOINES PUBLIC SCHOOLS BRAND & GRAPHICS GUIDELINES. Identity and Style Manual for Des Moines Public Schools. Think. Learn. Grow.
 DES MOINES PUBLIC SCHOOLS BRAND & GRAPHICS GUIDELINES Identity and Style Manual for Des Moines Public Schools Think. Learn. Grow. www.dmschools.org facebook.com/dmschools TABLE OF CONTENTS 05 Welcome 07
» DESTINATIONSMAGAZINE.COM
 MEDIA KIT 2018 DESTINATIONS MAGAZINE 2018» DESTINATIONSMAGAZINE.COM » OUR BRAND «A platform for those consumed by wanderlust. DESTINATIONS MAGAZINE 2018» DESTINATIONSMAGAZINE.COM OUR BRAND Destinations
HEADER JANUARY 25-28, 2018 COLORADO CONVENTION CENTER DENVER, CO HEADER
 HEADER HEADER Lorem ipsum dolor sit amet, consectetur T Hadipisicing E W Helit, O sed L E do eiusmod M O U tempor N T Aincididunt I N ut labore et dolore magna aliqua. Ut enim ad minim veniam, quis nostrud
Associated Students of Whitworth University
 Associated Students of Whitworth University Brand Guidelines October 16, 2017 Associated Students of Whitworth University BRAND GUIDELINES ASSOCIATED STUDENTS OF WHITWORTH UNIVERSITY 2 Contents Cover 1
LAND USE POLICIES BY COMMUNITY DESIGNATION
 137 2040 138 Land Use Policies by Community Designation As discussed earlier in Thrive MSP 2040, the Council assigns a community designation to each city and township. This designation indicates the overall
Value Statement Builder best practices
 Value Statement Builder best practices Effectively expressing how you provide value is essential to establishing a foundation of trust and transparency in client relationships. One of the best opportunities
PORT OF VANCOUVER USA Strategic Plan
 PORT OF VANCOUVER USA Strategic Plan 2016-2025 Revised December 2015 Port of Vancouver USA - Strategic Plan 2025 - Page 1 INTRODUCTION Port of Vancouver USA is an economic engine for the Southwest Washington
INDUSTRIAL OEM / AFTERMARKET 2018 MEDIA KIT PRACTICAL MACHINERY, EQUIPMENT AND PLANT MAINTENANCE INFORMATION LINEAR MOTION BEARINGS BELTS & CHAINS
 MAINTENANCE, REPAIR AND OPERATIONS OIL & LUBE HYDRAULICS GEARS LINEAR MOTION BEARINGS BELTS & CHAINS POWER TRANSMISSION PNEUMATICS MOTORS PRACTICAL MACHINERY, EQUIPMENT AND PLANT MAINTENANCE INFORMATION
LUNDY S LANE COMMUNITY IMPROVEMENT PLAN STUDY
 PUBLIC INFORMATION MEETING # October, 0 LUNDY S LANE COMMUNITY IMPROVEMENT PLAN STUDY AGENDA :00 to :0pm: Open House :0 to :pm: Presentation : to :00pm: Individual paced workshop with the Study Team PUBLIC
SMART RENEWABLE HUBS FOR FLEXIBLE GENERATION SOLAR GRID STABILITY
 SMART RENEWABLE HUBS FOR FLEXIBLE GENERATION SOLAR GRID STABILITY D9.1 PROJECT VISUAL IDENTITY GUIDELINES The project has received funding from the European Union s Horizon 2020 research and innovation
Mike Fusello. concepts creative direction art direction copywriting
 Mike Fusello concepts creative direction art direction copywriting www.gomonk.com mikefusellocreative@gmail.com 415 541-5680 samples this is a quick sampler of my creative work a lot more can be found
Retail Loss Prevention You Can Trust.
 Business Pro- Retail Loss Prevention You Can Trust. RETAIL RISK SPECIALISTS OUR MISSION We strive to provide the best possible security service to our clients. 2 We Do It Right Even When No One Is Looking!
Brownfield Redevelopment: Dorr-Smead Brownfields, Toledo, Ohio
 Brownfield Redevelopment: Dorr-Smead Brownfields, Toledo, Ohio Description Toledo has had a strong industrial base for the past century. During the first four decades of the twentieth century, the city
ANNA COWIE BFA. Art Director / Designer
 ANNA COWIE BFA Art Director / Designer ANNA COWIE BFA I am a Creative/ Art Director/ conceptual designer with hands on illustration skills and a strategic thinking cap. I use a computer like a pencil.
URBAN CENTER COMMUNITY ROLE COUNCIL ROLE ALL COMMUNITIES URBAN CENTER
 Orderly and Efficient Land Use Align land use, development patterns, and infrastructure to make the best use of public and private investment. Plan for forecasted population and household growth at average
Vero Beach Vision Plan
 Vero Beach Vision Plan City of Vero Beach, Florida Prepared in cooperation with: The Vero Beach Vision Team and The Citizens of Vero Beach Prepared by: Gould Evans Associates 4041 Mill Street Kansas City,
Port NOLA Forward: Strategic Master Plan FAQs
 Port NOLA Forward: Strategic Master Plan FAQs Master Plan Overall 1. What is included in the Strategic Master Plan? The Strategic Master Plan outlines a vision and provides a broad roadmap to capture market
Your Bright Future: Municipal Development Plan
 Your Bright Future: Municipal Development Plan 2010-2020 Executive Summary OVERVIEW Municipalities face many challenges and opportunities. Central to a municipality s ability to provide a high standard
RURAL RESIDENTIAL COMMUNITY ROLE COUNCIL ROLE RURAL RESIDENTIAL ALL COMMUNITIES
 Orderly and Efficient Land Use Align land use, development patterns, and infrastructure to make the best use of public and private investment. Discourage future development of rural residential patterns
Unlimited Possibilities. Town of Volney Fulton, New York
 Unlimited Possibilities Town of Volney Fulton, New York Riverview Business Pa Riverview Business Park is the former Miller Brewing plant and offers a unique opportunity to leverage its existing infrastructure
Making the Land Use- Sustainability-Economic Development Connection: Policies and Projects
 March 14, 2013 Making the Land Use- Sustainability-Economic Development Connection: Policies and Projects Paul Beyer, New York State Department of State Chris Carrick, CNY Regional Planning and Development
Cross-sector Collaboration and Urban Revitalization in Buffalo, NY TEACHING NOTE
 Cross-sector Collaboration and Urban Revitalization in Buffalo, NY TEACHING NOTE Case Synopsis This case study uses Buffalo, New York as an example of a prototypical mid-size city attempting to recover
Brand Seal Guidelines for brand marketers HOW TO USE THE INFORMA ENGAGE SEAL
 Brand Seal Guidelines for brand marketers HOW TO USE THE INFORMA ENGAGE SEAL Updated September 2017 Introducing the new Informa Engage. Informa Engage is a new marketing services business from Informa,
THE REGION S PLAN POLICY FRAMEWORK. August 2015
 THE REGION S PLAN POLICY FRAMEWORK August 2015 2 What is The Policy Framework? Cover photo credit: Sinan Sinharoy for Atlanta BeltLine, Inc. Atlanta is one of the world s most dynamic metropolitan areas,
A: COMMUNITY PARTICIPATION
 APPENDICES A: COMMUNITY PARTICIPATION Community Participation Plan Town of Tonawanda Step 1 Pre nomination Study Brownfield Opportunity Area Program NYS DOS Contract C303856 Town of Tonawanda Community
EJ Industrial Spine BOA Nomination Study
 A. Selecting Priority Sites Section V. Redevelopment of Priority Sites Section IV of this Nomination Study presents a summary of the analyses of the Study Area and market conditions affecting the E-J BOA
Industrial Market Analysis and Land Use Strategy
 Industrial Market Analysis and Land Use Strategy Advisory Committee #4 May 21, 2009 Presented by: Economics Research Associates Interface Studio, LLC ICIC DMJM Harris CH Planning DRAFT - For Discussion
Tax Increment Finance: An Emerging Community Revitalization Tool
 Tax Increment Finance: An Emerging Community Revitalization Tool May 3, 2007 St. Louis, MO About CDFA National non-profit dedicated to the advancement of the development finance industry Founded in 1982
Chapter One The Anacostia Trails Heritage Area
 Chapter One The Anacostia Trails Heritage Area INTRODUCTION This management plan describes the heritage tourism program for a special area of northern Prince George s County known as the Anacostia Trails
The Port of New York and New Jersey. The Environment
 The Environment The An Important Environment Resource for Our Region As the premier cargo center on the eastern seaboard, the Port of New York and New Jersey connects our region to both the international
The Great Lakes St. Lawrence Seaway System
 The Great Lakes St. Lawrence Seaway System Vince D Amico, Manager, Market Development The St. Lawrence Seaway Management Corporation CANADIAN INTERNATIONAL FREIGHT FORWARDERS ASSOCIATION January 22, 2016
A Catalyst for Transforming Distressed Properties into Community Assets
 A Catalyst for Transforming Distressed Properties into Community Assets STRATEGIC PLAN MAY 2016 Vision into action that is the promise and the power of a strong, collaborative Omaha Municipal Land Bank
Introduction: Jason Giffen, Assistant Vice President, Planning and Green Port
 Introduction: Jason Giffen, Assistant Vice President, Planning and Green Port Today I want to talk about how the Port of San Diego is preparing for it s future through planning, implementation, and exploration.
Allegheny County Conservation District Your Conservation Solution Center. Strategic Plan
 Allegheny County Conservation District Your Conservation Solution Center Strategic Plan 2015-2017 Finding the Way Historical Perspective In 1945, Pennsylvania's first districts were formed under the authority
Section 9 Implementation
 Section 9 Implementation 9 Section 9: Implementation 9.1 Overview The primary role of Your Bright Future is to provide a community sustainability based framework to direct the future growth and development
City of Milwaukee. Milwaukee s blue revolution. By Matthew Howard
 City of Milwaukee Milwaukee s blue revolution By Matthew Howard This case study originally appeared in Cities for the future: Innovative and principles-based approaches to urban equity, sustainability
MSD Integrated Watershed Management Planning Approach to Achieve Sustainable Communities
 MSD Integrated Watershed Management Planning Approach to Achieve Sustainable Communities MaryLynn Lodor MSD of Greater Cincinnati Sharon Jean-Baptiste CH2M HILL April 4, 2013 Overview MSD s Environmental
PROPERTY OVERVIEW HEAVY INDUSTRIAL LIGHT INDUSTRIAL TRANSPORTATION AMENITIES LOCATION WHERE BUSINESS HAPPENS
 HEAVY INDUSTRIAL LIGHT INDUSTRIAL TRANSPORTATION AMENITIES LOCATION PROPERTY OVERVIEW WHERE BUSINESS HAPPENS WELCOME COLUMBIA BUSINESS CENTER Columbia Business Center (CBC) is the premier industrial business
The Port of Alpena: A Community Asset Inventory. Marc Coburn, Tatsuya Fukushige, Evan Gross, Corey Jackson, Mark Jones, and Elizabeth Masserang
 + The Port of Alpena: A Community Asset Inventory Marc Coburn, Tatsuya Fukushige, Evan Gross, Corey Jackson, Mark Jones, and Elizabeth Masserang + Introductions: Our Client Northeastern Michigan Council
FATHERS FOR EQUAL RIGHTS WEEKLY SINGLE FATHERS AND PARENTS (SEEKING EDUCATION AND SUPPORT) EVERY WEEK MEDIA KIT. The National Fathers Resource Center
 EVERY WEEK MEDIA KIT. The National Fathers Resource Center") REACH4,000 FATHERS FOR EQUAL RIGHTS WEEKLY MEDIA KIT SINGLE FATHERS AND PARENTS (SEEKING EDUCATION AND SUPPORT) EVERY WEEK The National Fathers Resource Center MANY WAYS TO DELIVER YOUR MESSAGE A TO THIS
REACH4,000 FATHERS FOR EQUAL RIGHTS WEEKLY MEDIA KIT SINGLE FATHERS AND PARENTS (SEEKING EDUCATION AND SUPPORT) EVERY WEEK The National Fathers Resource Center MANY WAYS TO DELIVER YOUR MESSAGE A TO THIS
Niagara s Transportation Strategy 1. Introduction:
 Niagara s Transportation Strategy May 8, 2002 Niagara s Transportation Strategy 1. Introduction: Transportation is of pivotal importance in the development of Niagara. This, Niagara s first comprehensive
ARTICLE II THE GENERAL PLAN
 ARTICLE II THE GENERAL PLAN CHAPTER 4 ECONOMIC DEVELOPMENT A. INTRODUCTION The economy of Washington County has changed dramatically from its creation in 1776. Rural areas of the County maintain its connection
THE IGLTA enewsletter LGBT TOURISM INDUSTRY PROFESSIONALS EVERY WEEK MEDIA KIT. International Gay & Lesbian Travel Association
 REACH3,000 THE IGLTA enewsletter MEDIA KIT LGBT TOURISM INDUSTRY PROFESSIONALS EVERY WEEK International Gay & Lesbian Travel Association A MANY WAYS TO DELIVER YOUR MESSAGE B TO THIS MARKET C F ADVERTISING
published WeeKly every WeDNesDay ONliNe/sOcial Daily
 EVERYTHING EAST END Media Kit 2018 published WeeKly every WeDNesDay ONliNe/sOcial Daily TeL FaX 631-324-2544 74 montauk HWy, STe 16 east HamPToN, Ny 11937 INdyeaSTeNd.Com ads@indyeastend.com member The
Chapter 4: Transportation and Land Use
 Chapter 4: Transportation and Land Use Transportation and land use together make possible the wide range of destination opportunities in the region. Transportation provides the connections, and, in turn,
Managing Growth and Development
 Managing Growth and Development This technical document is part of a series of draft discussion papers created by Municipal Affairs staff and stakeholders to prepare for the Municipal Government Act Review.
Sustainability. Sustainability Principles. 1. Framework. Spokane Transit s definition of Sustainability is:
 Sustainability Spokane Transit s definition of Sustainability is: Sustainability at Spokane Transit is about providing services in ways that optimize our ability to meet the needs of present and future
THE ASSOCIATION AGENDA CANADIAN ASSOCIATION EXECUTIVES MEDIA KIT BI-WEEKLY
 REACH7,500 THE ASSOCIATION AGENDA MEDIA KIT CANADIAN ASSOCIATION EXECUTIVES BI-WEEKLY MANY WAYS TO DELIVER YOUR MESSAGE TO THIS MARKET A C B ADVERTISING OPTIONS A LEADERBOARD The leaderboard gives your
CHAPTER 6: ECONOMIC DEVELOPMENT INTRODUCTION CHAPTER 6: ECONOMIC DEVELOPMENT 6-1
 CHAPTER 6: ECONOMIC DEVELOPMENT INTRODUCTION The purpose of this chapter is to identify strategies to increase commercial and industrial development in the City of Dayton. There are currently few commercial
Guelph Innovation District
 Guelph Innovation District Community Meeting, June 18, 2009 1 Welcome Meeting Purpose: Present City & Provincial work that is completed or underway Discuss how recent initiatives/studies will influence
Innovative Improvement Driven Foundation for Denver s Transit Expansion Program
 Innovative Improvement Driven Foundation for Denver s Transit Expansion Program Timothy Stokes, PE Delcan Corp. Denver, CO INTRODUCTION The Denver Regional Transportation District (RTD) has embraced managerial
Infrastructure Financing Programs (DIF)
") Infrastructure Financing Programs (DIF) Massachusetts Municipal Association January 24, 2015 Infrastructure Needs in Massachusetts* Approximately 10% of bridges are classified as Structurally Deficient
Infrastructure Financing Programs (DIF) Massachusetts Municipal Association January 24, 2015 Infrastructure Needs in Massachusetts* Approximately 10% of bridges are classified as Structurally Deficient
LEGISLATIVE AGENDA. North Myrtle Beach Chamber of Commerce Local Legislative Agenda PUBLIC POLICY COUNCIL GOAL:
 North Myrtle Beach Chamber of Commerce Local Legislative Agenda 2014-2015 LEGISLATIVE AGENDA PUBLIC POLICY COUNCIL GOAL: Our commitment is to be recognized as the business voice in the legislative process,
RIVER ACCESS STRATEGY GUIDING PRINCIPLES & STRATEGIES
 RIVER ACCESS STRATEGY GUIDING PRINCIPLES & STRATEGIES SEPTEMBER 2015 RIVER ACCESS STRATEGY GUILDING PRINCIPLES & STRATEGIES TABLE OF CONTENTS Executive Summary... 3 The Need for a Strategy... 4 What the
Leader s foreword. to help ensure that we can support businesses in every way possible, helping them to grow and generate employment.
 Economic Prospectus Leader s foreword 03 Welcome to the revised Sandwell Economic Prospectus which sets out the direction we want for the local economy over the next few years. Centrica Plc, Oldbury. Photo
downtown business association Investigating the Impact of The City Centre Airport Redevelopment on Downtown Edmonton Executive Summary
 downtown business association Investigating the Impact of The City Centre Airport Redevelopment on Downtown Edmonton Executive Summary Prepared by: Dennis Bridges August 1, 2011 Executive Summary Introduction
OVERVIEW CAPACITY & CONDITION
 OVERVIEW Over 18,000 sites and an associated 22 million acres of land are related to the primary hazardous waste programs that comprise much of the nation s hazardous waste infrastructure, and more than
2.9 PLANNING ISSUES SUSTAINABILITY AND ENERGY
 2.9 PLANNING ISSUES SUSTAINABILITY AND ENERGY Objectives: 1. To create an enduring future that promotes quality of life, financial prosperity and innovative ideas and technologies while respecting and
20/20 Direction P e n n s y l v a n i a D e p a r t m e n t o f T r a n s p o r t a t i o n
 20/20 Direction P e n n s y l v a n i a D e p a r t m e n t o f T r a n s p o r t a t i o n Challenged to be Part of the Solution We at PennDOT are committed to providing Pennsylvanians and visitors to
EXECUTIVE SUMMARY 2.0. Meadowlands Vision 2040 A Roadmap to Economic Success. The Greater Meadowlands Region. Priority Actions, Goals & Objectives
 2.0 Meadowlands Vision 2040 A Roadmap to Economic Success EXECUTIVE SUMMARY Priority Actions, Goals & Objectives The Meadowlands Regional Chamber (MRC), an economic development advocate for over 40 years,
Northern Intermodal Transit Facility WHAT IS AN INTERMODAL TRANSIT FACILITY?
 WHAT IS AN INTERMODAL TRANSIT FACILITY? An intermodal transit facility gathers many modes of transportation together and is strategically located to increase destination alternatives. Intermodal facilities
FREIGHT CORRIDORS AND GATEWAYS: DEVELOPMENT APPROACH AND EVALUATION CRITERIA COMPARISON IN NORTH AMERICA AND THE EUROPEAN UNION
 FREIGHT CORRIDORS AND GATEWAYS: DEVELOPMENT APPROACH AND EVALUATION CRITERIA COMPARISON IN NORTH AMERICA AND THE EUROPEAN UNION Juan Carlos Texas A&M Transportation Institute Introduction International
Attachment A: TransformTO Short-term Strategies
 Attachment A: Short-term Strategies PE15.1 Attachment A 1. Supporting energy efficiency in buildings Expand current programs to reduce energy use in houses, multi- residential and other buildings. This
LEADERSHIP OPPORTUNITY EXECUTIVE DIRECTOR
 LEADERSHIP OPPORTUNITY EXECUTIVE DIRECTOR ABOUT US Wildlands Restoration Volunteers (WRV) is a Colorado nonprofit 501(c)(3) dedicated to healing the land, strengthening our communities, and building great
VILLAGE OF PORT CHESTER
 VILLAGE OF PORT CHESTER REQUEST FOR QUALIFICATIONS DOWNTOWN MASTER DEVELOPER RFQ #2017-01 Destination Port Chester: Celebrating 150 Years July 14, 2017 VILLAGE OF PORT CHESTER DOWNTOWN MASTER DEVELOPER
General Plan. Energy Element. Adopted February 15, 1979 Amended November 9, 2011 Amended September 26, 2017
 General Plan Energy Element Adopted February 15, 1979 Amended November 9, 2011 County of Sacramento Office of Planning and Environmental Review This page blank. Table of Contents POLICY AND ACTION PROGRAM...
TAX INCREMENT FINANCING Ten (10) Year Status Report
 Year Status Report") TAX INCREMENT FINANCING Ten (10) Year Status Report 2000-2011 LAKE CALUMET INDUSTRIAL Redevelopment Project Area Designated December 13, 2000 September 18, 2013 Pursuant to 65 ILCS 5/11-74.4-5 Prepared
TAX INCREMENT FINANCING Ten (10) Year Status Report 2000-2011 LAKE CALUMET INDUSTRIAL Redevelopment Project Area Designated December 13, 2000 September 18, 2013 Pursuant to 65 ILCS 5/11-74.4-5 Prepared
2017 Greater Durham Chamber of Commerce City Council Candidate Questionnaire. Have you held an elected position before? If so, please describe.
 2017 Greater Durham Chamber of Commerce City Council Candidate Questionnaire Candidate's Full Name Shelia Ann Huggins Your current occupation Attorney Have you held an elected position before? If so, please
URBAN RENEWAL PRIMER. The following are answers to frequently asked questions about urban renewal.
 URBAN RENEWAL PRIMER Urban renewal is a state-sanctioned program designed to help communities improve and redevelop areas that are physically deteriorated, unsafe, or poorly planned. The Portland Development
Grand Calumet. River Revitalized
 The Grand Calumet River Revitalized Imagine a Grand Calumet River safe for people, fish, birds and wildlife to utilize and enjoy. With the latest clean up efforts, performed under the Great Lakes Restoration
5.5 NAVIGABLE WATERWAYS AND COASTAL ZONE
 5.5 NAVIGABLE WATERWAYS AND COASTAL ZONE This section discusses the effect of the Proposed Action on navigable waterways, and the Proposed Action s consistency with coastal zone policies. 5.5.1 Navigable
Request for Proposals Redevelopment of the White Street Municipal Parking Lot
 Request for Proposals Redevelopment of the White Street Municipal Parking Lot Block 31, Lot 2.01 Borough of Red Bank Monmouth County New Jersey Submission Deadline: Tuesday, April 26, 2017, 10:00 a.m.
Olds College Sustainability Strategic Plan
 Olds College Sustainability Strategic Plan 2016-2020 TABLE OF CONTENTS SUSTAINABILITY OFFICE ENGAGEMENT STRATEGY Engagement Principles - post plan implementation Consultation Processes VISION STRATEGIES
ARKANSAS DEPARTMENT OF PARKS AND TOURISM FY 2018 FY 2019 STRATEGIC PLAN
 ARKANSAS DEPARTMENT OF PARKS AND TOURISM FY 2018 FY 2019 STRATEGIC PLAN MISSION: To enhance the quality of life in Arkansas by promoting, protecting, interpreting, and managing the state s natural, historical
Memorandum. FROM: Jim Ortbal Rosalynn Hughey Barry Ng TO: HONORABLE MAYOR, CITY COUNCIL. DATE: June 16, 2017
 CITY OF SANjOSE CAPITAL OF SILICON VALLEY TO: HONORABLE MAYOR, CITY COUNCIL SUBJECT: TRANSPORTATION POLICY UPDATE REQUIRED BY STATE LAW - LOS TO VMT Memorandum FROM: Jim Ortbal Rosalynn Hughey Barry Ng
Category: 3 Meeting the Challenge of a Difficult Job GC Contractor: The Beck Group Project Name: The Royal Gorge Bridge and Park Visitor Center
 Category: 3 Meeting the Challenge of a Difficult Job GC Contractor: The Beck Group Project Name: The Royal Gorge Bridge and Park Visitor Center The 10-mile-long Royal Gorge is narrow, steep and one of
Oakland Global News, December 2013
 Page 1 of 8 Brought to you by the Oakland Global Trade & Logistics Center and California Capital & Investment Group OAKLAND GLOBAL NEWS Monthly Updates on the Oakland Global Trade & Logistics Center Project
Prepared for: Broome County Department of Planning and Economic Development Allee King Rosen & Fleming, Inc.
 LAND USE CONSIDERATIONS FOR THE BROOME COUNTY PLAN FOR SUSTAINABLE ECONOMIC DEVELOPMENT Recommendations by the Broome County Environmental Management Council Adopted April 16, 2002 Prepared for: Broome
TIF FINANCING: Variations on the Theme
 TIF FINANCING: Variations on the Theme Presented by David A. Rogers, Esq. Bricker & Eckler LLP, Columbus, OH 614.227.2367 drogers@bricker.com OUTLINE TIF AND TIF-LIKE STRUCTURES Case Study:Easton Town
The Vermont Climate Economy Initiative Ideas to Advance Vermont s Climate Economy
 The Vermont Climate Economy Initiative Ideas to Advance Vermont s Climate Economy Ideas for action shared by over 125 participants in 3 Climate Economy Forums held in Rutland (August 26, 2015), Brattleboro
Town of Alabama Agricultural and Farmland Protection Plan
 SECTION I INTRODUCTION The Town of Alabama has a rich agricultural heritage, and farming is the Town s primary economic activity. The Town s Comprehensive Plan, prepared jointly with the Town and Village
Energy Trust of Oregon Strategic Plan
 Energy Trust of Oregon 2015-2019 Strategic Plan October 1, 2014 Introduction Who We Are Energy Trust of Oregon is an independent nonprofit organization dedicated to helping 1.5 million customers of four
Erie County, New York FARMS FOR THE FUTURE. Executive Summary. An Agricultural and Farmland Preservation and Protection Strategy
 Erie County, New York FARMS FOR THE FUTURE Executive Summary An Agricultural and Farmland Preservation and Protection Strategy Prepared by Erie County Department of Environment and Planning In cooperation
South Santa Fe Drive Corridor Redevelopment Plan (An Urban Renewal Plan)
") South Santa Fe Drive Corridor Redevelopment Plan (An Urban Renewal Plan) City of Sheridan Colorado December 2003 UrbanPlan.inc boulder estes park TABLE OF CONTENTS Preface...3 Urban Renewal Area Boundaries...3
South Santa Fe Drive Corridor Redevelopment Plan (An Urban Renewal Plan) City of Sheridan Colorado December 2003 UrbanPlan.inc boulder estes park TABLE OF CONTENTS Preface...3 Urban Renewal Area Boundaries...3
REUSE OF DREDGED SEDIMENTS
 REUSE OF DREDGED SEDIMENTS Lake Erie Waterkeeper Conference W.W. Knight Nature Preserve, Perrysburg, Ohio Friday, March 18, 2016 John H. Hull, P.E., BCEE Hull & Associates, Inc. SEDIMENT ENTERING LAKE
Syracuse General Redevelopment Plan Study Areas #1-3
 2010 Syracuse General Redevelopment Plan Study Areas #1-3 JEO Consulting Group, Inc. SYRACUSE GENERAL REDEVELOPMENT PLAN STUDY AREAS 1-3 Introduction/Background INTRODUCTION The Syracuse General Redevelopment
GOAL AREA: Economy & Jobs
 Introduction GOAL AREA: Economy & Jobs Create equitably shared prosperity and access to quality jobs The 6 objectives of STAR s Economy & Jobs Goal Area work together to promote equitably shared prosperity
Port of New Bedford. AAPA Commissioners Seminar May 17, 2011 Prosperity through Economic Development Opportunities
 Port of New Bedford AAPA Commissioners Seminar May 17, 2011 Prosperity through Economic Development Opportunities Port of New Bedford, Massachusetts Niche Port You are here Connected to Global Markets
Chapter 2 - Economic Development
 Chapter 2 - Economic Development Discussion Kitsap County is an integral part of the Central Puget Sound Regional Economy (Region), one of the most diverse, innovative, and competitive regional economies
Locality Partnership Kilwinning
 Locality Partnership Kilwinning You are requested to attend the Kilwinning Locality Partnership on meeting at 6:30pm on Monday 12 September 2016 in Kilwinning Academy. Yours faithfully Business Councillor
GRAND JUNCTION STRATEGIC PLAN
 GRAND JUNCTION STRATEGIC PLAN PC: James Alsop PC: GJVCB A ugust 2017 Introduction The central purpose in this undertaking was to provide the City of Grand Junction with a tool that can be used during the
Odessa American. since 1941, today a multi-platform powerhouse
 Odessa American Peria Basi s ost ioi edia rads i prit since 1941, today a multi-platform powerhouse PROUDLY SERVING THE PERMIAN BASIN FOR OVER 75 YEARS Our Philosophy Success through Partnership - The