BENGALLA Mining Company. Groundwater Impact Assessment
|
|
|
- Osborn Harmon
- 5 years ago
- Views:
Transcription


1 BENGALLA Mining Company Groundwater Impact Assessment


2 Australasian Groundwater & Environmental Consultants Pty Ltd REPORT on CONTINUATION OF BENGALLA MINE GROUNDWATER IMPACT ASSESSMENT prepared for HANSEN BAILEY PTY LTD Project No. G1505 June 2013 ABN:
3 Australasian Groundwater & Environmental Consultants Pty Ltd REPORT on CONTINUATION OF BENGALLA MINE GROUNDWATER IMPACT ASSESSMENT prepared for HANSEN BAILEY PTY LTD Project No. G1505 June 2013 Level 2 / 15 Mallon Street Bowen Hills Qld 4006 Ph (+617) Fax (+617) brisbane@ageconsultants.com.au Web: A.B.N
4 EXECUTIVE SUMMARY, on behalf of Bengalla Mining Company, commissioned Australasian Groundwater and Environmental Consultants to undertake a for the Project (the Project). This assessment will form part of the Environmental Impact Statement supporting an application for Development Consent under Part 4, Division 4.1 of the Environmental Planning and Assessment Act The Project involves the continuation of mining at a rate of up to 15 Mtpa run of mine coal for 24 years. The Project will enable the extraction of an additional 316 Mt of ROM coal from the Permian Whittingham Coal Measures. Bengalla Mine is located approximately 4 kilometres west of Muswellbrook and 130 km north-west of Newcastle in the Upper Hunter Valley, New South Wales. Bengalla Mine commenced operations in 1999, and has progressed about 1.8 km down the westerly dipping coal measures. Regionally the stratigraphic sequence comprises two distinct units, namely thin Quaternary alluvial deposits and a low permeability Permian coal seam sequence. The Permian Whittingham Coal Measures contain overburden and interburden consisting of lithic sandstone, interbedded with siltstone, tuffaceous claystone and mudstone. The Permian sediments are unconformably overlain by thin Quaternary alluvial deposits along the alignment of the Hunter River located to the south of the Project. The Permian Whittingham Coal Measures are not a significant aquifer. While some coal seams may locally show a moderate permeability, the dominant interburden sections are of very low hydraulic conductivity. The very limited volumes of groundwater that have been experienced in the current open cut pits at Bengalla are evidence of this. The groundwater system has only one significant aquifer system, which are the sand and gravel zones within alluvium along the Hunter River. The Quaternary alluvium is connected to the Hunter River, which appears to act as both a recharge and discharge zone depending on the water levels in the river. The alluvium supports groundwater dependent ecosystems in the form of stygofauna species and fragmented occurrences of Red Gum Woodland Red Gums along the Hunter River. Bengalla Mining Company has been gradually expanding a network of bores for monitoring groundwater levels and quality since The mine monitors groundwater levels and/or water quality at a total of 45 bore sites installed in either the alluvium or Permian coal measures. The monitoring has recorded cyclic fluctuations in groundwater levels in the alluvial aquifer in response to rainfall, and no significant regional impact is evident due to mining. Mining has depressurised the coal seams in a narrow zone locally around the mining area, and reversed hydraulic gradients with flow of groundwater from the alluvium into the underlying Permian coal measures. Despite the reduced flow of water to the alluvium locally around the mining area the diffuse rainfall recharge over the flood plains appears to be sufficient to maintain groundwater levels, which is why no significant fall in groundwater levels has been observed in the alluvium. Bengalla Mining Company is currently mining the area referred to as the Wantana extension area, which is in close proximity to the Hunter River alluvium. The distance from the edge of the alluvium to the pit crest is 150 m or more. The Project will result in mining away from the Wantana extension and progressively further away from the edge of the Hunter River alluvium. At the Year 21 mine plan, the highwall will be approximately 1.5km from the alluvial aquifer. There are considerable resources present beyond the 21 year mining limit and in the future, BMC may (depending upon market factors) seek the relevant approvals for the extraction of further coal resources. i
5 A numerical groundwater flow model simulated the impact of the continuation of mining Project on the groundwater regime. The model was based on a previous FEFLOW model constructed for the existing Bengalla Mine to incorporate the Wantana extension. The previous model was found to be over-predicting the extent of depressurisation compared to observations, so the hydraulic conductivity was reduced in the recalibrated model. The model was recalibrated using extensive groundwater monitoring data to obtain the best match to steady state and transient water level measurements collected in bores and wells. After calibration, the modelling assessed the impact of the Project on groundwater levels and the transfer of groundwater between the Permian and the alluvial groundwater systems. The modelling indicated groundwater seepage from basement Permian coal measures into the open cut mine will peak early in the Project life at about 1 ML/day, and then slowly reduce over the Project life as the mine moves further away from the alluvial aquifer, and up into more elevated land where the unsaturated zone thickens. Evaporation of groundwater that seeps from the coal seams at the pit face will be significant, and is likely to mean that there will be no visible seepage into the pit in the latter years of the Project life, i.e. the pit will be dry. The rate of seepage to the mine is slightly higher than predicted by earlier models due to the changes to the water bearing strata hydraulic properties adopted during the recalibration. BMC currently have a 125 ML water licence (20BL169798) under the Water Act 1912 to account for groundwater seepage into the pit from the basement rocks (excluded from the Water Sharing Plan for the Hunter Unregulated and Alluvial Water Sources 2009 NSW). This license is sufficient to authorise the average seepage take to the open cut pits which is 110 ML/year, but does not cover the peak period when seepage reaches 365 ML/year. BMC will change the conditions of the licence to authorise extraction of a maximum of 365 ML/year. The model predicts mining will continue to depressurise and lower groundwater levels in the Permian basement sequence, but this will not result in drawdown extending a significant distance into the alluvial aquifer with drawdown being less than 1m. The depressurisation of the Permian sequence will reduce the groundwater discharge rates into the Hunter River alluvium by a peak of 0.63 ML/day at the beginning of the Project, reducing to 0.25 ML/day as the project moves away from the flood plain. The maximum annual reduction in flow to the alluvium is predicted to be 220 ML/year, which occurs in Year 1 of the Project. The groundwater flow to the alluvium decreases over the Project life with an average reduction of 112 ML/year. This reduction in transfer from the basement to the alluvium will not result in any significant drawdown at any private registered bores. BMC will transfer additional share component to its existing water access licence for the Hunter River alluvium, which authorises projected take of water from the Hunter River Alluvial Water Source due to mining to increase total share component to 220 units. The additional share component will be transferred from other water access licences which are already held by BMC. These licenses will ensure the Project holds sufficient share component and water allocation to account for the take of water from the adjacent water sources at all times, and complies with the requirements of the Aquifer Interference Policy. A sensitivity analysis indicated the river and alluvial aquifer acted as a controlling boundary condition, with the 1m drawdown contour remaining along the edge of the alluvium when model parameters were varied. The limited drawdown predicted means only one private groundwater bore is known to be present within the predicted zone of depressurisation. The drawdown at this bore is predicted to be a maximum of 2 m, which is within the minimal impact considerations outlined in the Aquifer Interference Policy. Stygofauna and groundwater dependent vegetation are also not expected to be impacted by the limited drawdown. ii
6 Should the mine close after completing the additional proposed mining, dewatering of the pit will cease and a lake will form in the final void. The void lake level will recover relatively rapidly over the first 50 years, followed by a slowing in recovery as the hydraulic gradients to the pit void decrease. A maximum pit lake level in the order of RL 30 m is predicted. The groundwater model and a separate model for the surface water study indicated that the water level in the final void will stabilise well below the crest of the pit, and therefore spillage of water into the environment will not occur. The final void will act as a sink for groundwater, and this will prevent any poor quality water that develops within the pit from migrating into the surrounding groundwater system. Post mining the evaporative losses from the pit lake will result in a constant flux of groundwater into the final void. This will result in a permanent zone of depressurisation around the pit final void in the Permian, which will reduce the rate of groundwater flow from the Permian to the Hunter River alluvium. The flux to the alluvium was calculated to be reduced by a maximum of 0.6 ML/day (220 ML/year) at 1000 years. This loss is equivalent to the rate estimated for the mining phase, and will be accounted for by Water Access Licenses being surrendered at closure of the mine. A geochemical study found that all overburden material, apart from the Archerfield Sandstone located above the Wynn seam, has negligible sulfur content, excess acid neutralising capacity, and is classified as non-acid forming. The Project will continue to bury potentially acid forming overburden and coal reject materials in the overburden in the backfilled open cut. The Permian groundwater quality is typically brackish and in the range of 4,000 µs/cm to 8,000 µs/cm. This is similar to the salinity generated by the oxidised coal rejects. Post mining a lake will form in the final void that will act as a sink in the groundwater system and will prevent flow of brackish to saline water in the final void lake from entering the Hunter River alluvium. A peer review of the study was undertaken by Dr Frans alf from alf and Associates Pty Ltd in accordance with the Australian Groundwater Modelling Guidelines. Several stages of review were undertaken over the course of the Project including development of the conceptual model, modelling and reporting. The peer review concluded that the groundwater model was fit for assessing the impacts of the Project on the groundwater regime. The model calibration and the impacts predicted by the model were considered to be reasonable. Bengalla Mining Company will update the existing Water Management Plan including appropriate management and mitigation measures identified for the Project in consultation with relevant regulators. iii
7 TABLE OF CONTENTS Page No. 1.0 INTRODUCTION PROJECT DESCRIPTION SCOPE OF WOR New South Wales Government Requirements Project Scope LEGISLATION, POLICY AND GUIDELINES Water Act Water Management Act Water Sharing Plans Hunter Regulated River Water Sharing Plan Hunter Unregulated and Alluvial Water Sources Water Sharing Plan State Groundwater Policy Groundwater Quality Protection Policy Groundwater Dependent Ecosystems Policy Groundwater Quantity Protection Policy NSW Aquifer Interference Policy Aquifer Risk Categories Buffer Zone Guidelines REGIONAL SETTING Project Location Climate Topography and Drainage Land Uses GEOLOGY Stratigraphy Structures HYDROGEOLOGICAL REGIME Previous Hydrogeological Studies Groundwater Monitoring Program Monitoring Bore Network Groundwater Quality Quaternary Alluvium Distribution Groundwater Levels and Water Table Surface Yield and Usage Hydraulic Parameters Recharge and Groundwater Flow iv
8 TABLE OF CONTENTS (Continued) Page No Groundwater Quality and Beneficial Use Groundwater Dependent Ecosystems Shallow Permian Bedrock Permian Coal Measures Distribution Groundwater Levels Yield and Usage Hydraulic Parameters Recharge and Groundwater Flow Groundwater Quality and Beneficial Use Mining Operations Conceptualisation of Groundwater Regime PROPOSED PROJECT DEVELOPMENT NUMERICAL GROUNDWATER MODEL Modelling Objectives and Summary Model Software Model Settings Model Geometry and Model Extents Model Boundary Conditions Layers Recharge and Evapotranspiration Model Hydraulic Parameters MODEL CALIBRATION Calibration Targets Calibration Method Calibration Results Steady State Results Model Budget Transient Results Model Calibration Summary PREDICTIVE SIMULATIONS Modelling Strategy Model Setup Simulation of Project Pit Dewatering Simulated Drawdown v
9 TABLE OF CONTENTS (Continued) Page No Project Pit Seepage Impact on Alluvial Aquifers and Watercourses Impact on Groundwater Users Impact on Groundwater Dependent Ecosystems Groundwater Recovery Spoil and Final Void Water Quality SENSITIVITY AND UNCERTAINTY Sensitivity Analysis Project Pit Seepage Groundwater Flow to the Hunter River Alluvium Drawdowns at the End of Mining Model Confidence Level Classification Model Limitations SUMMARY AND CONCLUSIONS Project Impacts Compliance with NSW Government Policy GROUNDWATER MANAGEMENT AND MONITORING Water Management Plan REFERENCES GLOSSARY LIST OF TABLES Table 1: DEPARTMENT OF PLANNING AND INFRASTRUCTURE REQUIREMENTS... 5 Table 2: NSW OFFICE OF WATER REQUIREMENTS... 6 Table 3: SUMMARY MINIMAL IMPACT CONSIDERATIONS AQUIFER INTERFERENCE POLICY Table 4: COAL SEAMS WITHIN THE PROJECT BOUNDARY Table 5: SUMMARY OF MONITORING BORE INSTALLATIONS Table 6: VWP DETAILS Table 7: REGISTERED BORES ON NOW DATABASE WITHIN ALLUVIUM 5 M FROM BENGALLA Table 8: REGISTERED BORES ON NOW DATABASE WITHIN PERMIAN SURROUNDING BENGALLA Table 9: SUMMARY OF COAL SEAM HYDRAULIC PARAMETERS Table 10: SUMMARY OF GROUNDWATER MODEL LAYERS Table 11: STEADY STATE CALIBRATED GROUNDWATER MONITORING BORES vi
10 LIST OF TABLES (Continued) Table 12: TRANSIENT GROUNDWATER MONITORING BORES Table 13: SUMMARY OF GROUNDWATER MODEL PARAMETERS Table 14: STATISTICAL SUMMARY OF CALIBRATION STEADY-STATE Table 15: OBSERVED AND MODELLED GROUNDWATER LEVELS Table 16: MODEL STEADY STATE WATER BUDGET Table 17: TRANSIENT MODEL CALIBRATION STATISTICS Table 18: SENSITIVITY ANALYSIS MODEL RUN SETUP AND RESULTS LIST OF FIGURES Figure 2.1: Project location... 3 Figure 2.2: Conceptual project layout... 4 Figure 4.1: Locality Map for the Hunter Regulated River Water Sharing Plan Figure 4.2: Water Sharing Plan for the Hunter Unregulated and Alluvial Water Sources (Source NOW, 2011) Figure 4.3: Buffer Zone Requirement for Open Cut Mining Operations Next to Rivers / Alluvium. 20 Figure 5.1: Existing mines and modelling area Figure 5.2: Cumulative Rainfall Departure Jerrys Plains (Station No ) Figure 5.3: Overview of the Vicinity of the Project Area (Landsat 7 satellite imagery) Figure 6.1: Geology Figure 6.2: Indicative Stratigraphic Column (seams mined at Bengalla highlighted) Figure 6.3: Dyke Intruding Coal Seam at Bengalla Figure 7.1: Registered and Monitoring Bores Figure 7.2: Registered Bores Figure 7.3: Monitoring Bores Figure 7.4: Cumulative Rainfall Departure, 1995 to 2012 Jerrys Plains (Station ) Figure 7.5: Hydrographs of Alluvial Bores Wantana Extension Area Figure 7.6: Hydrographs of Regional Hunter River Alluvial Bores Figure 7.7: Hydrographs of Regional Alluvial Bores from North (BG5) to South (BG3) Figure 7.8: Hydrographs of Regional Alluvial Bores (BG1, 3, 5) Figure 7.9: Alluvium Water Table June/July Figure 7.10: Landownership and registered water bores Figure 7.11: Electrical Conductivity vs Time Hunter River Alluvium Figure 7.12: Electrical Conductivity vs Time Hunter River Alluvium (Wantana Extension) Figure 7.13: Hydrographs of Coal Seam / Interburden Bores Wantana Extension Area Figure 7.14: Hydrographs of Regional Overburden / Interburden Monitoring Bores Figure 7.15: Hydrographs of Alluvium and Interburden WAN4 (left) and WAN5 (right) Figure 7.16: Hydrographs of Alluvium and Coal Seam WAN6 (left) and WAN7 (right) Figure 7.17: Hydrographs of Alluvium and Coal Seam WAN8 (left) and WAN9 (right) Figure 7.18: Hydrographs of Alluvium and Coal Seam WAN Figure 7.19: Hydrographs of coal seams WAN Figure 7.20: Hydrographs of pore pressures heads as potentiometric levels BE Figure 7.21: Hydrographs of pore pressures heads as potentiometric levels BE Figure 7.22: Hydrographs of pore pressures heads as potentiometric levels BE Figure 7.23: Shallow Permian groundwater levels June Figure 7.24: Deep Permian groundwater levels - June Figure 7.25: Coal Seam Hydraulic Conductivity vs Depth (Mackie 2009) Figure 7.26: Interpolated Groundwater Levels Pre-mining Figure 7.27: Electrical Conductivity Trends Coal Seam Aquifers (Wantana Area) Figure 7.28: Electrical Conductivity Trends Coal Measures (Regional) Figure 7.29: Conceptual Model - Vicinity of the Project vii
11 LIST OF FIGURES (Continued) Figure 8.1: Proposed progression of dragline strips Figure 9.1: Three Dimensional Model Geometry Figure 9.2: Model area and finite element mesh Figure 9.3: 3D Model Geometry (Layer 8 omitted) Figure 9.4: Long Sections - Hydraulic Conductivity Figure 9.5: Layer 3 - Warkworth Coal Seams and interburden floor Elevation and Hydraulic Conductivity Figure 9.6: Layer 4 - Coal measures from Mount Arthur Seam to Vaux Seam Floor Elevation and Hydraulic Conductivity Figure 9.7: Layer 5 - Coal measures down to the Edderton Seam - Floor Elevation and Hydraulic Conductivity Figure 10.1: Steady state observed vs modelled scatter plot Figure 10.2: Contoured Simulated Pre-Mining Potentiometric Levels Figure 11.1: Simulated drawdown during Project operation Year Figure 11.2: Simulated drawdown during Project operation Year Figure 11.3: Simulated drawdown during Project operation Year Figure 11.4: Simulated drawdown during Project operation Year Figure 11.5: Simulated drawdown during Project operation Year Figure 11.6: Simulated Seepage Rate to Project Open Cut Figure 11.7: Velocity Vectors Mine Year Figure 11.8: Velocity Vectors Mine Year Figure 11.9: Velocity Vectors Mine Year Figure 11.10: Velocity Vectors Mine Year Figure 11.11: Velocity Vectors Mine Year Figure 11.12: Change in groundwater discharge & infiltration rates from Hunter River alluvium 104 Figure 11.13: Groundwater users, land ownership and drawdown Figure 11.14: Final pit void and backfilled pit overburden emplacement areas Figure 11.15: Rise of water table in final pit void Figure 11.16: Velocity Vectors Recovery 100 Years Figure 12.1: Seepage to pit for various sensitivity scenarios Figure 12.2: Flow to the Hunter River alluvium for various sensitivity scenarios Figure 12.3: Sensitivity of Drawdown at the End of Mining ATTACHMENTS - APPENDICES APPENDIX A Observed Versus Predicted Groundwater Levels APPENDIX B Third Party Review Report viii
 is located approximately 4 kilometres (km) west of Muswellbrook and 130 km north-west of Newcastle in the Upper Hunter Valley, New South Wales (NSW). Figure 2.")
12 JST/DMc:tl/ae(Bengalla) Project No. G1505 June 2013 REPORT ON CONTINUATION OF BENGALLA MINE GROUNDWATER IMPACT ASSESSMENT 1.0 INTRODUCTION Bengalla Mine (Bengalla) is located approximately 4 kilometres (km) west of Muswellbrook and 130 km north-west of Newcastle in the Upper Hunter Valley, New South Wales (NSW). Figure 2.1 shows the location of the Project. Bengalla was originally approved to operate for a 21-year period from 1996 and to produce up to 8.7 Mtpa of ROM coal. Bengalla was officially opened in Strip mining is employed using dragline, truck and shovel mining methods. Mining targets the Permian Whittingham Coal Measures of the Hunter Coalfield with the Warkworth and Edderton Seams currently being mined. The 1996 EIS acknowledged that significant coal reserves continued west beyond the 21 year mining extent and stated ʻthe coal reserves continue to the west of the limit of excavation, and beyond the edge of the Authorisation area. It is anticipated that these reserves will be mined by open cut methods in the future, subject to appropriate approvalsʼ. Since 1996, there have been four approved modifications for ongoing operations at Bengalla. The current Project will largely rely upon constructed mine site infrastructure including (but not limited to) the Coal Handling and Preparation Plant (CHPP), rail loop/load out facility and workshop / administrative buildings. BMC is now seeking a new Development Consent under Division 4.1 of Part 4 of the Environmental Planning & Assessment Act 1979 (EP&A Act) to continue mining west of its current operations for a 24 year period at a rate of up to 15 Million tonnes per annum (Mtpa) of Run of Mine (ROM) coal (the Project). BMC has commissioned Environmental Consultants Pty Ltd () to prepare an Environmental Impact Statement (EIS) for the Project. engaged Australasian Groundwater and Environmental Consultants Pty Ltd (AGE) to assess the impact of the proposed mining on the groundwater regime on behalf of their client, BMC. This report presents the results of the groundwater impact assessment and forms part of the EIS. 1
13 2.0 PROJECT DESCRIPTION The Project involves the continuation of mining at a rate of up to 15 Mtpa ROM coal for 24 years. The Project will enable the extraction of an additional 316 Mt of ROM coal from the Whittingham Coal Measures. The Project generally consists of the following characteristics: Open cut mining at a rate of up to 15 Mtpa ROM coal for 24 years continuing to utilise a dragline and truck and excavator fleet; Extending mining to the west of current operations - an out of pit Overburden Emplacement Area (OEA) to the west of Dry Creek which may be utilised for excess spoil material until it is intercepted by mining; Processing, handling and transportation of coal via the CHPP to be upgraded, and rail loop for export and domestic sale; An additional CHPP stockpile and ROM coal stockpile; Continued use, extension and upgrades to existing infrastructure; The construction of a radio tower; Relocation of the Explosives Magazine and Reload Facility; Relocation of a section of Bengalla Link Road near the existing mine access road to enable coal extraction; The diversion of Dry Creek via dams and pipe work with a later permanent re-alignment of Dry Creek through rehabilitation areas when emplacement areas are suitably advanced; Relocation of water storage infrastructure as mining progresses through existing dams (including the Staged Discharge Dam); The construction of raw water dams and a clean water dam; A workforce of approximately 900 full time equivalent personnel at peak production; and Supporting power and water reticulation infrastructure, other ancillary facilities, infrastructure including roads, co-disposal and temporary in pit coal reject emplacement along with earth handling facilities, which enable construction activities. Figure 2.2 shows the conceptual Project layout. 2


14 3


15 4
16 3.0 SCOPE OF WOR The following sections outline the requirements of both the New South Wales and Federal Governments for inclusion in the water assessments for the Project. 3.1 New South Wales Government Requirements The Director-General of the Department of Planning and Infrastructure (DPI) issued Director- Generalʼs Requirements (DGRs) for the Project under Part 2 of Schedule 2 of the Environmental Planning and Assessment Regulation Table 1 presents the DGRs relating to water resources and the sections that address these requirements. Table 1: DEPARTMENT OF PLANNING AND INFRASTRUCTURE REQUIREMENTS Addressed in Water Resources Section detailed assessment of potential impacts on the quality and quantity of existing surface and groundwater resources, including: o detailed modelling of potential groundwater impacts including any potential impacts on the alluvial aquifers of the Hunter River and 7.3.1, 11.0 confirmation of the physical extent of the river's alluvium; o impacts on affected licensed water users and basic landholder rights; 11.5 o impacts on riparian, ecological, geo-morphological and hydrological values of watercourses, including environmental flows; o details and staging for the proposed Dry Creek re-diversion; and; o a flood assessment including identification of any necessary flood impact mitigation measures; a detailed site water balance, including a description of site water demands, water disposal methods (inclusive of volume and frequency of any water discharges), water supply infrastructure and water storage structures; an assessment of proposed water discharge quantities and quality/ies against receiving water quality and flow objectives; assessment of impacts of salinity from mining operations on groundwater and surface water resources, including disposal and management of coal rejects and modified hydrogeology, a salinity budget and the evaluation of salt migration to surface, near surface and groundwater sources; identification of any licensing requirements or other approvals under the Water Act 1912 and/or Water Management Act 2000; demonstration that water for the construction and operation of the development can be obtained from an appropriately authorised and reliable supply in accordance with the operating rules of any relevant Water Sharing Plan (WSP); Surface Water Impact Assessment Surface Water Impact Assessment Surface Water Impact Assessment Surface Water Impact Assessment Surface Water Impact Assessment 11.8 and Surface Water Impact Assessment 4.1, 0, 11.3 surface water report 5
17 Table 1: DEPARTMENT OF PLANNING AND INFRASTRUCTURE REQUIREMENTS Water Resources a description of the measures proposed to ensure the development can operate in accordance with the requirements of any relevant WSP or water source embargo; a detailed description of the proposed water management system (including sewage), water monitoring program and other measures to mitigate surface and groundwater impacts; and compliance with the Hunter River Salinity Trading Scheme; Addressed in Section Surface Water Impact Assessment Surface Water Impact Assessment and 14.0 Surface Water Impact Assessment Table 2 presents the New South Wales Office of Water (NOW) requirements for the groundwater assessment and the sections that address these requirements. Table 2: NSW OFFICE OF WATER REQUIREMENTS Requirement Water licenses to take groundwater The EIS must identify all current and proposed groundwater extraction including details of the purpose and expected annual extraction volumes of all proposed groundwater extraction. Water supply works to take groundwater For all water supply works which are proposed to be used for the purpose of taking water from a groundwater source (such as water bores for the purposes of investigation, testing, extraction, dewatering and monitoring), the EIS must provide details regarding purpose, location, construction and expected annual extraction volumes of all such works. The EIS must detail the extent to which the proposed development is consistent with the approval requirements for water supply works prescribed in section 97 of the WMA. Aquifer interference activities which intercept groundwater For all proposed aquifer interference activities which may intercept groundwater (including activities which involve the penetration of an aquifer (such as excavation), the interference with water in an aquifer, and the taking of water from an aquifer in the course of carrying out mining), the EA must provide details regarding purpose, location, construction and expected annual extraction volumes. The EA must also detail the extent to which the proposed project is consistent with the water management principles of the aquifer interference activities prescribed in section 5(8) of the Water Management Act Groundwater source protection The EIS must include an assessment of the impact of the proposed development on groundwater sources and provide the following: identification of all groundwater sources which will be intersected or connected; Addressed in Section 11.0 Not applicable dewatering bores not required , 7.4 & 7.5 6
18 Table 2: NSW OFFICE OF WATER REQUIREMENTS Requirement Baseline monitoring of groundwater quality and quantity for all aquifers within and adjacent to the proposed development site (minimum monthly data collected over a minimum time period of two years); Description of flow directions and rates, physical and chemical characteristics, and highest predicted groundwater table for all aquifers within and adjacent to the proposed development site); Extent of alluvium within the proposed development site and details on the connectivity of the aquifers to the water courses within the proposed project area and adjacent catchments; Details of any potential works likely to result in pollutants infiltrating into the groundwater; Details of proposed methods of waste water disposal and approval from the relevant authority; Assessment of salinity in catchments downstream of the proposed development; Addressed in Section 7.2, 7.3.2, 7.3.6, 7.5.2, , 7.4, , Surface Water Impact Assessment Surface Water Impact Assessment Potential for salt water intrusion; n/a Identification of any groundwater source or aquifer that may be sterilised n/a as a consequence of the proposed development; Detailed description of existing groundwater users within the area, and 7.3.3, detailed assessment of any potential impacts on existing users; Details of critical thresholds for negligible impacts to groundwater 11.4, 11.5, sources; 11.6 Detailed description of any measures to be incorporated into the proposal to avoid or minimise long-term actual and potential environmental 14.0 impacts, particularly in respect of groundwater pollution; Details of ongoing monitoring programs for groundwater quality and quantity (minimum monthly data); Contingency strategies to remediate, reduce or manage potential impacts, in particular: o reporting procedures for ongoing monitoring programs, including mechanism for transfer of information to Office of Water; o identification of any nominal thresholds as to the level of impact beyond which remedial measures or contingency strategies would be initiated; o detailed description of the remedial measures or contingency strategies proposed; and o any funding assurances covering the anticipated post development maintenance cost, for example, ongoing groundwater monitoring. Details of the predicted impacts of the final landform on the groundwater regime, and Details of the extent to which the proposed development is consistent with The NSW State Groundwater Policy Framework Document (1997), The NSW Groundwater Quality Protection Policy (1998), and the Guidelines for Groundwater Protection in Australia (1995)
19 Table 2: NSW OFFICE OF WATER REQUIREMENTS Requirement Groundwater dependent ecosystems GDEs rely on groundwater for their species composition and their natural ecological processes. Examples of ecosystems, which depend on groundwater, are wetlands, terrestrial vegetation such as red gum forests, ecosystems in streams fed by groundwater (gaining streams), limestone cave systems, springs, and hanging valleys and swamps. The EIS should provide the following: Addressed in Section Ecological Impact Assessment and Stygofauna Impact Assessment Identification of the potential GDEs within and adjacent to the proposed as above development site; Details of current GDEs condition based on minimum monthly data as above collected over a minimum time period of two years; Details of groundwater quality and quantity requirements for all GDEs based on minimum fortnightly data collected over a minimum time period as above of two years; Details of flora and fauna assessment for all GDEs, including both terrestrial and aquatic (stygofauna, macroinvertebrate and macrophyte) as above diversity and abundance assessments; Detailed assessment of any potential impacts on GDEs; as above Critical thresholds for negligible impacts; as above Detailed description of any measures to be incorporated into the proposal to avoid or minimise adverse impacts on GDEs, including measures to: o maintain natural patterns of groundwater flow; o avoid disrupting groundwater levels that are critical for ecosystems; o avoid pollution or causing adverse changes to groundwater quality; and o rehabilitate degraded groundwater systems where practical. Details of ongoing monitoring and protection programs for potential offset areas Contingency strategies to remediate, reduce or manage potential impacts, in particular: o reporting procedures for ongoing monitoring programs, including mechanism for transfer of information to Office of Water; o identification of any nominal thresholds as to the level of impact beyond which remedial measures or contingency strategies would be initiated; o detailed description of the remedial measures or contingency strategies proposed; and; o any funding assurances covering the anticipated post development maintenance cost, for example, ongoing groundwater monitoring. o Details to the extent to which the proposal is consistent with the NSW State Groundwater Dependent Ecosystems Policy (2002) Notes n/a - not applicable as above as above as above as above as above as above as above as above as above as above as above as above 8
20 3.2 Project Scope The objective of the groundwater study was to assess the impact of continuing mining on the hydrogeological regime in terms of the relevant environmental assessment requirements of the Director-General of the Department of Infrastructure and Planning and to meet the applicable government requirements. To achieve this objective, the scope of work included: Review of previous hydrogeological studies in the Project area and surrounds; Review of groundwater monitoring data before mining commenced and impacts over the mining period; Assessment of groundwater behaviour resulting from the Project, including modelling; o the cumulative changes in groundwater conditions due to the Project and existing and proposed mining projects; o behaviour of groundwater at each identified privately owned licensed bore surrounding the Project area; o the level of impact at GDEs; o post-mine groundwater conditions; Develop groundwater management strategies; Identify any groundwater impact mitigation measures necessary for the Project; and Identify revisions to the existing groundwater management program. 9
21 4.0 LEGISLATION, POLICY AND GUIDELINES The following section outlines NSW State Government legislation, policy and guidelines with respect to groundwater that must be addressed in the assessment and operation of mining proposals. 4.1 Water Act 1912 The unrepealed parts of the Water Act 1912 (Water Act), (essentially Parts 2 and 5) govern the issue of water licences for water sources including rivers, lakes and groundwater aquifers in NSW. The unrepealed parts of the Water Act are progressively being replaced by the Water Management Act 2000, but some provisions of the Water Act are still in force where water sharing plans are not in place. This is the case in the bedrock outcrop area where the Project is located. 4.2 Water Management Act 2000 The objectives of the Water Management Act 2000 include the sustainable and integrated management of the Stateʼs water for the benefit of both present and future generations. The Water Management Act 2000 provides clear arrangements for controlling land based activities that affect the quality and quantity of the Stateʼs water resources. It provides relevantly for three types of approvals: Management works approvals: o o water supply work approval; drainable work approval; and o flood work approval (Section 90 Water Management Act 2000) Water use approval which authorises the use of water at a specified location for a particular purpose, for up to 10 years (Section 89 Water Management Act 2000); Activity approvals comprising: o controlled activity approval; and o aquifer interference activity approval which authorises the holder to conduct activities that affect an aquifer such as approval for activities that intersect groundwater, other than water supply bores and may be issued for up to 10 years (Section 91 Water Management Act 2000). The provisions relating to aquifer interface activity approvals have not yet been commenced under the Water Management Act However relevantly to the Project, the Aquifer Inference Policy has been released and the principles within that policy are being assessed against the Project. The Water Management Act 2000 requires that the activities avoid or minimise their impact on the water resource and land degradation, and where possible the land must be rehabilitated (see the Water Management Principles set out in Section 5 of the Water Management Act 2000). 10
22 Section 5(8) of the Water Management Act 2000 outlines the principles in relation to the aquifer interference activities and states in relation to aquifer interference activities: a) the carrying out of aquifer interference activities must avoid or minimise land degradation, including soil erosion, compaction, geomorphic instability, contamination, acidity, waterlogging, decline of native vegetation or, where appropriate, salinity and, where possible, land must be rehabilitated, and b) the impacts of the carrying out of aquifer interference activities on other water users must be avoided or minimised. The Water Management Act 2000 also imposes licensing requirements for water sources that are subject to a water sharing plan. Two water sharing plans have commenced for the Hunter River and groundwater sources that surround the Project. Water access licences and approvals to take and use water are granted according to the Water Management Act Water Sharing Plans Hunter Regulated River Water Sharing Plan The Hunter Regulated River Water Sharing Plan 2003 (HRRWSP) commenced on 1st July 2004 and applies for a period of 10 years to 30 June It is a legal document made under the WM Act. The HRRWSP contains rules for how water is shared between the environment and water users and different categories of licences. The Hunter River water source is located in the central eastern area of NSW and drains an area of some 17,500 km 2. The Hunter River originates in the Mount Royal Range north-east of Scone and travels approximately 450 km to where it enters the ocean at Newcastle. The river is regulated from Glenbawn Dam to Maitland, a distance of about 250 km. Glennies Creek is regulated by Glennies Creek Dam, which also provides water to the lower reaches of the Hunter River. The area to which the WSP applies is shown on Figure 4.1. The HRRWSP applies to rivers (and associated alluvial sediments) regulated by Glenbawn and Glennies Creek Dams. The water source is divided into three management zones. These are: The Hunter River from Glenbawn Dam to its junction with Glennies Creek; The Hunter River downstream of its junction with Glennies Creek; and Glennies Creek downstream of Glennies Creek Dam. The Project is located within the first Hunter River management zone listed above; this being the Hunter River from Glenbawn Dam to its junction with Glennies Creek. The vision for the HRRWSP is to achieve a healthy diverse and productive water source and sustainable management for the community, environment, towns, agriculture and industry. The HRRWSP also recognises the significance of water to the Aboriginal community. 11
 The WM Act requires that the sharing of water must protect the water source and its dependent ecosystems and that")
23 Figure 4.1: Locality Map for the Hunter Regulated River Water Sharing Plan (Source NOW, 2011) The WM Act requires that the sharing of water must protect the water source and its dependent ecosystems and that water sharing plans establish specific environmental water rules. The environmental water rules are designed to: Reserve all water volume above a specified limit for the environment; Ensure that flows in the river do not drop below a prescribed minimum flow rate; Provide water in Glenbawn and Glennies Creek Dams that can be used for water quality and other environmental management purposes; and Preserve a portion of natural flows during periods when supplementary water access licences are permitted to extract water. The HRRWSP provides for domestic and stock rights and native title rights both forms of basic landholder rights, which allow some extraction of water from the river without an access licence. All water extraction, other than basic landholder rights extractions, must be authorised by an access licence Hunter Unregulated and Alluvial Water Sources Water Sharing Plan The Hunter Unregulated and Alluvial Water Sources Water Sharing Plan (HURAWSP) commenced on 1 August 2009 and applies for a period of 10 years to 31 July It is a legal document made under the WM Act. Figure 4.2 displays the area to which the HURAWSP applies. 12
 Water sharing plans for unregulated rivers and groundwater systems (such as the HURAWSP) have been")
24 Figure 4.2: Water Sharing Plan for the Hunter Unregulated and Alluvial Water Sources (Source NOW, 2011) Water sharing plans for unregulated rivers and groundwater systems (such as the HURAWSP) have been completed using a macro or broader scale river catchment or aquifer system approach. Unregulated rivers are those which rely only on natural flow and are not regulated by releases from upstream dams. Dry Creek is the closest unregulated stream to the immediate west of the active mining area. Dry creek is a small ephemeral drainage line incised in the Permian hill area that does not have associated mapped alluvium, due to the slope of the creek bed which is well above the water table. Dry Creek forms a ʻloosing system and is not considered to have any significant interaction with the groundwater system. Sandy Creek is a more significant drainage line located about 7 km west of the current mining area. The HURAWSP set rules for sharing water between the environment and water users and clearly defines shares in available water for licence holders, enabling better water trading opportunities. Water sharing plans support the long-term health of rivers and aquifers by making water available specifically for the environment. With respect to groundwater, macro water sharing plans for unregulated rivers may include rules that recognise that some alluvial aquifers are highly connected to their parent streams and in these circumstances, the goal of water sharing rules is to manage the surface water and highly connected groundwater as one resource. A long-term average annual extraction limit referred to as the Extraction Management Unit (EMU) applies across an entire catchment area. The limit is a longer-term management tool against which total extraction will be monitored and managed over the 10-year life of the plan. The rules in the plan that determine when licence holders can and cannot pump on a daily basis are more specific. Basic landholder rights (i.e. extraction of a reasonable use volume of surface or 13
25 Project No. G1505 (Bengalla Continuation) groundwater for stock or domestic supply) do not require a water access licence. However, water access licences are required for mining activities where these activities intercept an unregulated river or connected aquifer water. The HURAWSP includes alluvial sediments not covered by the Hunter Regulated River Water Sharing Plan. 4.4 State Groundwater Policy The NSW State Government Groundwater Policy Framework Document (1997) was adopted in 1997 for the purpose of providing a framework for the management of the Stateʼs groundwater resources to sustain their environmental, social and economic uses. The policy has three parts, namely the: NSW Government (1998a) Groundwater Quality Protection Policy, adopted in December 1998; NSW Government (2002) State Groundwater Dependent Ecosystems Policy, adopted in 2002; and NSW Government (undated) Groundwater Quantity Management Policy advice Groundwater Quality Protection Policy The NSW Groundwater Quality Protection Policy (1998), states that the objectives of the policy will be achieved by applying the management principles listed below. All groundwater systems should be managed such that their most sensitive identified beneficial use (or environmental value) is maintained. Town water supplies should be afforded special protection against contamination. Groundwater pollution should be prevented so that future remediation is not required. For new developments, the scale and scope of work required to demonstrate adequate groundwater protection shall be commensurate with the risk the development poses to a groundwater system and the value of the groundwater resource. A groundwater pumper shall bear the responsibility for environmental damage or degradation caused by using groundwaters that are incompatible with soil, vegetation and receiving waters. Groundwater dependent ecosystems will be afforded protection. Groundwater quality protection should be integrated with the management of groundwater quality. The cumulative impacts of developments on groundwater quality should be recognised by all those who manage, use, or impact on the resource. Where possible and practical, environmentally degraded areas should be rehabilitated and their ecosystem support functions restored. 14
26 Project No. G1505 (Bengalla Continuation) Groundwater Dependent Ecosystems Policy The NSW Groundwater Dependent Ecosystems Policy is specifically designed to protect valuable ecosystems which rely on groundwater for survival so that, wherever possible, the ecological processes and biodiversity of these dependent ecosystems are maintained or restored for the benefit of present and future generations. The policy defines GDEs as communities of plants, animals and other organisms whose extent and life processes are dependent on groundwater. Five management principles establish a framework by which groundwater is managed in ways that ensure, whenever possible, that ecological processes in dependent ecosystems are maintained or restored. The principles are: GDEs can have important values. Threats should be identified and action taken to protect them; Groundwater extractions should be managed within the sustainable yield of aquifers; Priority should be given to GDEs, such that sufficient groundwater is available at all times to meet their needs; Where scientific knowledge is lacking, the precautionary principle should be applied to protect GDEs; and Planning, approval and management of developments should aim to minimise adverse effects on groundwater by maintaining natural patterns, not polluting or causing changes to groundwater quality and rehabilitating degraded groundwater ecosystems where necessary Groundwater Quantity Protection Policy The objectives of managing groundwater quantity in NSW are: To achieve the efficient, equitable and sustainable use of the Stateʼs groundwater; To prevent, halt and reverse degradation of the Stateʼs groundwater and their dependent ecosystems; To provide opportunities for development which generate the most cultural, social and economic benefits to the community, region, state and nation, within the context of environmental sustainability; and To involve the community in the management of groundwater resources NSW Aquifer Interference Policy The Aquifer Interference Policy forms the basis for assessment of aquifer interference activities under the EPA Act. It clarifies the need to hold water access licences or Water licences (as the case may be) under the WM Act and Water Act and establishes consideration in assessing whether ʻminimal impactʼ occurs. 15
27 Project No. G1505 (Bengalla Continuation) The assessment criteria in the AI Policy are required to be addressed in the EIS because the DGRs require assessment of the Strategic Regional Land Use Policy which assessment criteria include assessment of the criteria in the AI Policy. The WM Act defines an aquifer interference activity as that which involves any of the following: penetration of an aquifer; interference with water in an aquifer; obstruction of the flow of water in an aquifer; taking of water from an aquifer in the course of carrying out mining or any other activity prescribed by the regulations; and disposal of water taken from an aquifer in the course of carrying out mining or any other activity prescribed by the regulations. Examples of aquifer interference activities (NOW 2012b) include mining, coal seam gas extraction, injection of water, and commercial, industrial, agricultural and residential activities that intercept the water table or interfere with aquifers. According to the WM Act, an aquifer is defined as a geological structure or formation, or an artificial landfill, that is permeated with water or is capable of being permeated with water. This is at odds with the commonly used definition, which refers to an aquifer as a groundwater system that is sufficiently permeable to yield productive volumes of groundwater. The definition of aquifer provided by the WM Act is more consistent with the term groundwater system, which refers to any type of saturated geological formation that can yield low to high volumes of water. The Policy states that all water taken by aquifer interference activities, regardless of quality, needs to be accounted for within the extraction limits defined by the water sharing plans. A water licence is required under the WM Act (unless an exemption applies or water is being taken under a basic landholder right) where any act by a person carrying out an aquifer interference activity causes: the removal of water from a water source; or the movement of water from one part of an aquifer to another part of an aquifer; or the movement of water from one water source to another water source, such as: o from an aquifer to an adjacent aquifer; or o from an aquifer to a river/lake; or o from a river/lake to an aquifer. The Aquifer Interference Policy requires assessment of the likely volume of water taken from a water source(s) as a result of an aquifer interference activity. These predictions need to occur prior to project approval. After project approval and during operations these volumes need to be measured and reported in annual environmental management reports (AEMR). The water access licence must hold sufficient share component and water allocation to account for the take of water from the relevant water source at all times. The AI Policy states that a water licence is required for the aquifer interference activity regardless of whether water is taken directly for consumptive use or incidentally. Activities may induce flow from adjacent groundwater sources or connected surface water. Flows induced from other water 16
28 Project No. G1505 (Bengalla Continuation) sources also constitute take of water. In all cases, separate access licences are required to account for the take from all individual water sources. In water sources where water sharing plans do not yet apply, an aquifer interference activity that takes groundwater is required to hold a water licence under the Water Act It is possible for the Water Act 1912 to apply in a groundwater source and the WM Act to apply in a connected surface water source or vice versa. Where this occurs and the aquifer interference activity is taking water from both water sources then licences will be required under each Act. In addition to the volumetric water licensing considerations, the following information needs to be considered to enable assessment and approval of the activity: establishment of baseline groundwater conditions including groundwater depth, quality and flow based on sampling of all existing bores in the area; a strategy for complying with any water access rules applying to relevant categories of water access licences, as specified in relevant water sharing plans; details of potential water level, quality or pressure drawdown impacts on nearby water users who are exercising their right to take water under a basic landholder right; details of potential water level, quality or pressure drawdown impacts on nearby licensed water users in connected groundwater and surface water sources; details of potential water level, quality or pressure drawdown impacts on groundwater dependent ecosystems; details of potential for increased saline or contaminated water inflows to aquifers and highly connected river systems; details of the potential to cause or enhance hydraulic connection between aquifers; details of the potential for river bank instability, or highwall instability or failure to occur. In particular, the Policy describes minimal impact considerations for aquifer interference activities based upon whether the water source is highly productive or less productive and whether the water source is alluvial or porous / fractured rock in nature. In general, the policy applies a predicted 2 m drawdown maximum limit at existing groundwater users. The NOWs assessment of impacts and subsequent advice and proposed conditions of approval for a project is based on an account for, mitigate, avoid/ prevent, and remediate approach. NOWs methodology is based on a risk management approach to assessing the potential impacts of aquifer interference activities, where the level of detail required to be provided by the proponent is proportional to a combination of the likelihood of impacts occurring on water sources, users and dependent ecosystems and the potential consequences of these impacts. The AI Policy divides groundwater sources into highly productive and less productive. Highly productive groundwater is defined by the AI Policy as a groundwater source that is declared in the Regulations and will be based on the following criteria: a) has total dissolved solids of less than 1,500 mg/l, and b) contains water supply works that can yield water at a rate greater than 5 L/sec. Highly productive groundwater sources are further grouped by geology into alluvial, coastal sands, porous rock, and fractured rock. Less productive groundwater includes aquifers that cannot be defined as highly productive according the yield and water quality criteria. 17
29 Project No. G1505 (Bengalla Continuation) The Hunter River alluvium adjacent to the Project has been assessed and determined to satisfy the highly productive criteria, while the Permian coal measures are less productive porous rock. The aquifer interference policy defines the following Minimal Impact Considerations for highly productive and less productive groundwater. Table 3 summaries the Minimal Impact Considerations for the highly productive Hunter River alluvium, and the less productive Permian coal measures. If these considerations are not met the Project needs to demonstrate to the Ministerʼs satisfaction that the impact will be sustainable, or that make good agreements are in place. The following sections outline the Projectʼs compliance with the Minimal Impact Considerations : Water Table - Sections 11.2, 11.4, 11.5, 11.6 and 11.8; Water Pressure - Sections 11.2, 11.5, 11.6 and 11.8; and Water Quality - Section Aquifer Risk Categories In mid-1997, the NSW Government announced a series of water reforms which included an assessment of the Stateʼs groundwater systems in terms of risk of over extraction and/or contamination. Water bearing formations at high risk were to have priority management attention with groundwater management plans started immediately. Those at medium risk were to have plans prepared over a five-year period. Those in the low risk category were to be regularly reviewed and steps taken to prevent them from becoming stressed. The ultimate aim of the reforms was to achieve clean and healthy groundwater systems (and rivers) and productive use of water by providing: Better balance in sharing water between the environment and water users; Better clarity of access and use rights for water; and A water transfer market that will facilitate reallocation of water to its highest valued use. The NSW Government Aquifer Risk Assessment Report (1998b) used a number of criteria to classify risks to various significant groundwater resources across the State. It classified the regulated reaches of the Hunter Valley Alluvium as a ʻHigh Risk Aquiferʼ, the Hunter Miscellaneous Tributaries Alluvium as ʻMedium Risk Aquifersʼ, and the Hunter Coal-Associated Fractured Rocks as ʻLow Risk Aquifersʼ. The classification process was designed as a rapid desktop assessment of the (then) current and potential future stress of groundwater systems. The reported findings were designed to aid resource planning and prioritisation of action for aquifers across NSW. 4.6 Buffer Zone Guidelines Guidelines were prepared for the Hunter Region in April 2005, by the Department of Infrastructure, Planning and Natural Resources (DIPNR 2005) (now the Department of Planning and Infrastructure) to assist the coal mining industry in managing risks when mining close to streams using either longwall or open cut mining methods. The guidelines relate to the classification of the stream that may be impacted by mining. 18
30 Table 3: SUMMARY MINIMAL IMPACT CONSIDERATIONS AQUIFER INTERFERENCE POLICY Category 1. Water Table Water Pressure Water Quality Highly productive alluvium Hunter River Alluvium Less productive porous rock Permian Coal Measures 1. Less than or equal to a 10% cumulative variation in the water table, allowing for typical climatic post-water sharing plan variations, 40 m from any: (a) high priority groundwater dependent ecosystem; or (b) high priority culturally significant site; listed in the schedule of the relevant water sharing plan; or A maximum of a 2 m decline cumulatively at any water supply work. 1. A cumulative pressure head decline of not more than 40% of the post-water sharing plan pressure head above the base of the water source to a maximum of a 2 m decline, at any water supply work. A cumulative pressure head decline of not more than a 2m decline, at any water supply work. 1. (a) Any change in the groundwater quality should not lower the beneficial use category of the groundwater source beyond 40 m from the activity; and (b) No increase of more than 1% per activity in long-term average salinity in a highly connected surface water source at the nearest point to the activity. Redesign of a highly connected(3) surface water source that is defined as a reliable water supply (4) is not an appropriate mitigation measure to meet considerations 1.(a) and 1.(b) above. (c) No mining activity to be below the natural ground surface within 200 m laterally from the top of high bank or 100 m vertically beneath (or the three dimensional extent of the alluvial water source - whichever is the lesser distance) of a highly connected surface water source that is defined as a reliable water supply. (d) Not more than 10% cumulatively of the three dimensional extent of the alluvial material in this water source to be excavated by mining activities beyond 200 m laterally from the top of high bank and 100 m vertically beneath a highly connected surface water source that is defined as a reliable water supply Any change in the groundwater quality should not lower the beneficial use category of the groundwater source beyond 40 m from the activity. 19
31 The guidelines provide a range of assessment and management criteria for each stream classification. This range is developed on the basis of: A checklist for minor stream systems (Schedule 1) with monitoring and remediation procedures to minimise the extent of damage which occurs to them; A notification system for significant stream systems (Schedule 2) to the department, so that an agreed monitoring and management regime can be developed for the stream system involved; and A precautionary stance for primary rivers (Schedule 3), subject to environmental assessment which can demonstrate that the impact on those rivers and associated alluvial groundwaters can be minimised. Based on the management guidelines, the Hunter River system is classified as a Schedule 3 stream/river. The guideline document indicates that the NOW is adopting a precautionary approach to mining in the vicinity of Schedule 3 streams and associated alluvial groundwater, involving a buffer between the mining area and the stream. The guideline states that the buffer provides a front line protection for surface and groundwater quality and managing connectivity. The management guideline requires a buffer of 150 m between an open cut mining area and the stream and its related alluvium, as shown on Figure 4.3. The guideline states that this buffer should be used except where detailed assessment, developed to the department standard, indicates minimal likely impact on stream flow, stability or water quality in surface or groundwaters will occur. The management guidelines indicate that mining would not be allowed to impact the groundwater or surface waters of the Hunter River and that a buffer would be required between open cut mines and the alluvium. Based on the April 2005 guideline and Schedule 3 stream classification for the Hunter River, it is assessed that open cut mining will not be permitted within the Hunter River alluvial plain. Figure 2.2 illustrates that the Project will not encroach within 150 m of the Hunter River alluvial plain. Figure 4.3: Buffer Zone Requirement for Open Cut Mining Operations Next to Rivers / Alluvium Source: DIPNR Hunter Region,
32 5.0 REGIONAL SETTING 5.1 Project Location Bengalla is located south of Wybong Road, east of Roxburgh Road, north of the Hunter River and west of Muswellbrook. The Project Boundary covers an area of approximately 2,340 ha. Bengalla is in close proximity to a number of existing and proposed coal mines as shown on Figure 5.1. The existing Mt Arthur Coal Mine (MAC) is located on the southern side of the Hunter River. Currently approval is being sought for an Extension to the MAC open pit. Drayton Mine is located adjacent to the MAC operations to the east. Currently approval is being sought for the Drayton South mine located to the south of the MAC operations. The Dartbrook Underground Mine is located to the far north of Bengalla however is currently in a care and maintenance. Located immediately north of Bengalla is Coal & Alliedʼs approved Mount Pleasant Project. The Mount Pleasant Project physically commenced in 2004 with the construction of Environmental Dam 1; however, no additional construction or coal mining has occurred. The Xstrata Mangoola Coal Mine to the west of Bengalla commenced mining operations in late Climate The climate of the region is temperate and characterised by hot summers and mild dry winters. Climate monitoring data collected by the Bureau of Meteorology (BoM) 1 is available for Jerrys Plains (Station No ) located about 9 km to the south-east of Project, and Scone (Station No ) which is about 40 km north of the Project. Mean monthly temperatures and rainfall are available from the Jerrys Plains Station for the period 1884 to The closest weather station to the Project recording evaporation is located at the township of Scone. The mean maximum temperatures at Jerrys Plains range from 31.7 C in January to 17.4 C in July. Mean minimum temperatures range from 17.1 C in January and February to 3.8 C in July. Heat waves can occur between October and March and frosts between May and August. The average annual rainfall at Jerrys Plains is millimetres (mm), of which the majority falls in the warmer months of the year (November to February), with January being the wettest month (77 mm). Mean daily pan evaporation in the summer season reaches 7.1 mm in December and January, and 1.6 mm in June. Average daily evaporation of 4.4 mm/day (1606 mm/year) exceeds mean rainfall throughout the year, the highest moisture deficit occurring during summer


33 22
34 In order to place recent rainfall years into a historical context the Cumulative Rainfall Departure (CRD), which is a summation of the monthly departures of rainfall from the long-term average monthly rainfall, was calculated as follows: CRDn = CRDn-1 + (Rn Rav) Where: CRDn = CRD for a given month CRDn-1 = CRD for a preceding month Rav = long-term average rainfall for a given month Rn = actual rainfall for given month The average monthly rainfall used to produce the CRD graph shown on Figure 5.2 was obtained from the BoM, Jerrys Plains Station. Figure 5.2: Cumulative Rainfall Departure Jerrys Plains (Station No ) A positive slope in the CRD plot indicates periods of above average rainfall, whilst a negative slope indicates periods when rainfall is below average. The CRD indicates that the area has been generally experiencing above average rainfall since Topography and Drainage The topography within the Project Boundary consists generally of low and undulating hills that decline towards the Hunter River floodplain in the south. The topographic elevation varies from about RL 135 m at the Hunter River flood plain, to about RL 225m at the highest areas at the northern part of Bengalla. The mining area for the Project is split into two areas of high ground by an ephemeral gully known as Dry Creek that runs in a general north south orientation through the central part of the Project Boundary. 23

35 Figure 5.1 shows the locations of water courses surrounding the Project which are: Hunter River which is located adjacent to of the Project Boundary and flows in a north-east to south-westerly direction; Dry creek, an ephemeral tributary of the Hunter River running through the Project area that will be diverted and reinstated as part of the Project; Rosebrook Creek located about 1 km to 2 km to the east of the Project Boundary; Dartbrook Creek to the north which flows in a north-south direction parallel to the Hunter River; Sandy Creek (northern Sandy Creek) also located to the north and flows west-east; and Sandy Creek (western Sandy Creek) located 4 km west of the Project area and flows in north-south direction towards the Hunter River. South of the Hunter River, the main tributaries are Ramrod Creek, Whites Creek, and Quarry Creek. Saddlers Creek is located 8 km south of the Hunter River. All the creeks are ephemeral except the Hunter River that has the flow maintained by releases from the upstream Glenbawn Dam. Several water storage dams have also been constructed within the Project area to manage both clean and mine water at Bengalla. Figure 5.3 below provides an overview of the regional setting. Figure 5.3: Overview of the Vicinity of the Project Area (Landsat 7 satellite imagery) 5.4 Land Uses The hilly areas surrounding Bengalla are mainly used for cattle grazing while the rich alluvial floodplain of the Hunter River to the south and east of the Project Boundary, support a variety of agricultural land uses including dairy and beef cattle grazing on improved pastures, fodder cropping, horse breeding and training and viticulture. Coal mining is also an important land-use, being the largest land owner in the vicinity of the Project. 24
36 6.0 GEOLOGY 6.1 Stratigraphy The stratigraphic sequence across the site comprises three distinct units, namely a Permian coal seam sequence, overburden and interburden consisting of lithic sandstone, interbedded with siltstone, tuffaceous claystone and mudstone and thin alluvial cover. The Permian sediments are unconformably overlain by thin Quaternary alluvial deposits. The Quaternary alluvial deposits consist of sand and gravel along the creek valleys within the Project Boundary, and in the alluvial floodplain of the Hunter River to the south and east. Figure 6.1 shows the surface geology in the vicinity of the Project. The Permian rocks form a regular layered sedimentary sequence consisting of the Whittingham Coal Measures that contain the economic coal seams and underlie the whole of the Project Boundary to a depth of about 500 m. Figure 6.2 shows the indicative stratigraphy of the Project Boundary. The Project will mine coal seams within the Jerrys Plains and Vane Subgroups, which are part of the Whittingham Coal Measures. The Warkworth Seam to the Edderton Seam are currently mined by the approved operations at Bengalla and will continue to be mined as part of the Project. Table 4 summarises the average seams and interburden thicknesses occurring in the Project area. The thickness of the seams and interburden is based on information received from BMC while the information for the lower seams is taken from AGE (2006). The total thickness of the coal measures and interburden is approximately 150 m. Table 4: COAL SEAMS WITHIN THE PROJECT BOUNDARY Seam Name Average Thickness (m) Average Thickness of Interburden to Underlying Seam (m) Project Coal Seams Warkworth Upper 0.5 <0.1 Warkworth Lower Mount Arthur Unnamed < Piercefield Vaux Broonie Bayswater Wynn <1.0 5 Unnamed Edderton Clanricard Bengalla Edinglassie Ramrod Creek
37 26
38 Figure 6.2: Indicative Stratigraphic Column (seams mined at Bengalla highlighted) 27


39 6.2 Structures The Project is located to the west of the Muswellbrook Anticline where the mined seams outcrop. The Whittingham Coal Measures are generally gently dipping at about 5 to the west. All coal seams subcrop beneath the Quaternary deposits of the Hunter River south of the Project Boundary. The north-south striking Mount Ogilvie Fault forms a structural boundary of the Project to the west. Minor faults with an approximate east-west strike and dykes running in a north-south direction are present in the Project Boundary. Figure 6.3 shows a dyke within a coal seam in the Bengalla pit wall while Figure 6.1 shows the orientation of the main structural features in the Project area. Figure 6.3: Dyke Intruding Coal Seam at Bengalla 28
40 7.0 HYDROGEOLOGICAL REGIME 7.1 Previous Hydrogeological Studies Groundwater studies in the region commenced in the late 1970s primarily for development of the adjacent MAC. Australian Groundwater Consultants Pty Ltd (AGC,1979) investigated the area for the Electricity Commission of NSW. The investigation included undertaking: Packer testing at 10.5 m intervals up to 216 m deep; Three falling head tests to obtain comparative hydraulic conductivity data; and Two airlift/recovery type hydraulic tests. The objective of the investigation was to obtain data on the hydraulic characteristics of the stratigraphic profile to assess groundwater inflow to a 2 km long, shallow, strip mining operation at the neighbouring MAC. The seams of interest were the Vaux, Bayswater, Edinglassie and Ramrod Creek coal seams, of which the upper two are mined at Bengalla. In August 1980, AGC investigated the Whittingham Coal Measures and the Hunter River alluvium for the MAC Coal Project, south of Hunter River and Bengalla. Laurie Montgomerie and Pettit Pty Ltd (LM&P) undertook a groundwater investigation for the same project in 1982 publishing long term pumping test data. Mackie Martin & Associates (MMA) undertook a groundwater study for Bengalla in January 1993 as part of an EIS prepared by HLA-Envirosciences Pty Limited (1993). The study included a review of existing information, field investigations, groundwater monitoring, sampling and analysis, and the development of a groundwater model, to assess the impact of open cut strip mining on the groundwater regime. In 2000, Mackie Environmental Research (MER) conducted water management studies for the Dartbrook and MAC Mines and assessed the impact of the mines on the groundwater system. Additionally AGE completed a hydrogeological impact assessment on the South Pit Extension Project for MAC in 2006, which included the cumulative impact with MAC and an analysis of the potential impacts on the Saddlers Creek colluvium. MAC operates within the Whittingham Coal Measures as does Bengalla, thus useful data can be obtained from this study regarding issues such as groundwater recharge estimates, interburden and coal seam permeability and regional structural settings. AGE (2007) undertook a groundwater study to assess the impact of extending mining into the Wantana area as part of an application to modify the Bengalla development consent. The assessment included a FEFLOW three-dimensional, transient, groundwater flow model of the study area to simulate the impact of the Project on the groundwater regime. The calibrated model simulated Bengalla/Wantana Pit inflows rates, drawdown effects in both the Permian groundwater system and Hunter River alluvial aquifer, changes in flows from the Hunter River alluvium and recovery of water levels in the final void level. Predicted pit inflows ranged from 0.43 ML/day in 2007 to 0.32 ML/day in 2017, with a peak of 0.58 ML/day in Additional inflows to the Wantana Extension did not exceed 0.13 ML/day. The study noted that groundwater flow to the Hunter River alluvium are reduced by 0.5 ML/day during 2012 and increased to a 0.6 ML/day reduction in Final pit lake recovery modelling simulated a final steady pit lake level about 62m AHD, with this final steady level reached after more than 200 years. The final void was noted to act in the long term as a sink from the local groundwater environment. 29
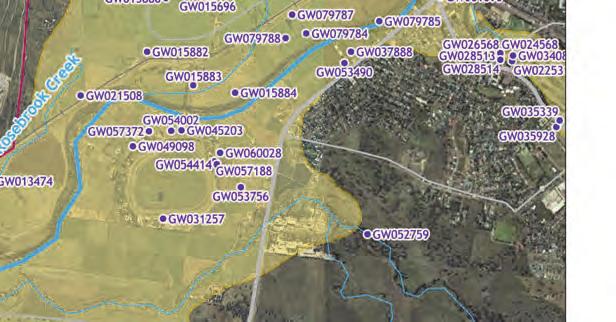
41 AGE (2010) included a groundwater impact assessment as part of the Bengalla Development Consent Modification to assess the effects from accelerated mining operations in the Wantana Extension area, extension of the existing OEA and relocation of the already approved OEA. This scope of works included stratigraphic drilling, monitoring bore construction and 2D modelling using SEEPW and water quality analysis. 7.2 Groundwater Monitoring Program Monitoring Bore Network BMC began establishing a network of bores for monitoring groundwater levels and quality in 1992, and has slowly expanded the network over time. Table 5 summarises the monitoring bore network. Figure 7.1 shows the monitoring bores and private bores on a regional scale. Figure 7.2 and Figure 7.3 show the registered water bores and monitoring bores in proximity to the Project. Table 5: SUMMARY OF MONITORING BORE INSTALLATIONS Bore ID Easting 1 Northing 1 Level Ground (RL m) Top of Casing (RL m) Stickup (m) Screen (mbgl) Geology 18298* Alluvium BG Alluvium BG Alluvium BG Alluvium 19116* Alluvium 42927* Alluvium 47277* Alluvium SMB Alluvium SMB Alluvium B Shallow Permian A10* Shallow Permian A5* Shallow Permian BG45* Shallow Permian E12* Shallow Permian 46737* Shallow Permian 64092* Shallow Permian Rep I Vaux Seam 53007* Deep Permian Deep Permian Deep Permian Deep Permian Deep Permian BE1* Permian Sandstone BE2* Permian Sandstone BE3* Permian Sandstone Nested Monitoring Bores WAN1A Wynn Seam WAN1B Edderton Seam WAN2A Vaux Seam WAN2B Wynn Seam WAN2C Edderton Seam 30
42 Table 5: SUMMARY OF MONITORING BORE INSTALLATIONS Bore ID Easting 1 Northing 1 Level Ground (RL m) Top of Casing (RL m) Stickup (m) Screen (mbgl) Geology WAN Deep Permian WAN4A Alluvium WAN4B Deep Permian WAN5A Alluvium WAN5B Deep Permian WAN6A Alluvium WAN6B Edderton Seam WAN7A Alluvium WAN7B Edinglassie Seam WAN8A Alluvium WAN8B Wynn Seam WAN9A Alluvium WAN9B Wynn Seam WAN10A Alluvium WAN10B Vaux Seam Notes: 1. co-ordinates: MGA 1994, Zone REP I7 replacement for I7 which will be mined out 3. mbgl metres below ground level * new survey coordinates as part of this study. Open cut mining during the Project will progress over time in a westerly direction away from the alluvial sediments of the Hunter River floodplain. The expected impact will be depressurisation of the coal seams primarily to the west but also to the north and south. During the early stages of the EIS development, AGE identified the existing monitoring network as lacking bores in the western area of the Project Boundary, and recommended sites for three vibrating wire piezometers (VWP) to be installed. ACE 2 drilling installed three monitoring bores at sites BE1, BE2 and BE3 shown on Figure 7.3 in December The objective of the new bores was to provide sites that will monitor the rate and extent of depressurization of the coal seams; and the overlying weathered and fractured rock. Table 6 summarises the construction details for the VWPs. Table 6: VWP DETAILS Bore ID Licence Number Easting Northing Target Seam Sensor Depth (mbgl) BE1 20BL Warkworth/Mt Arthur 120 Edderton Seam BE2 20BL Warkworth/Mt Arthur 97.8 Edderton Seam BE3 20BL Warkworth/Mt Arthur 80.6 Edderton Seam Note: co-ordinate projection: MGA 1994 Zone 56, mbgl metres below ground level 2 ACE drilling stands for Aqua Coal Exploration Drilling. 31


43 32


44 33


45 34
46 7.2.2 Groundwater Quality BMC collects routine groundwater samples at Bengalla and conducts analyses for: Electrical Conductivity (EC); Total Dissolved Solids (TDS); ph; Sulphate; and trace elements (Al, As, Be, B, Cd, Cr, Co, Cu, F, Fe, Pb, Li, Hg, Mo, Ni, Se, V, Zn). EC, TDS and ph have been monitored in the Wantana Extension bores WAN1, 2, 3, 4, 5, 6 and 7 to the south of the mine since September 2005, and in the more regional bores since Monitoring of EC, TDS and ph in bores SMB1 and SMB2 commenced in June 2010, immediately after construction of the bores. Sulphate and trace elements have been monitored in Wantana Extension bores WAN8, 9 and 10 since May 2009, immediately after construction of the bores, and in all Wantana Extension bores from August Monitoring of sulphate and metals commenced in 11 of the regional monitoring bores in 2003, and in the remaining eight regional monitoring bores in August Monitoring of the new monitoring bores BE1, BE2 and BE3 commenced in June Concentrations of major cations and anions have not been analysed in the samples with the exception of sulphate. 7.3 Quaternary Alluvium Distribution Deposits of unconsolidated silts, sand and minor fine gravels of mixed colluvial-alluvial origin occur within the vicinity of the project in the valleys of the creeks and gullies including Dry Creek. These deposits are quite thin and of limited aerial extent, and hence do not have significant groundwater storage capacity and therefore cannot be considered to be classed as an aquifer. They may contain temporary perched groundwater systems infiltrated from slope runoff following heavy rainfall. Discharge of this groundwater from the alluvium maintains a baseflow in the creeks and gullies following rainfall. The alluvium drains quite quickly and discharge/baseflow to the creeks is short lived. In contrast, the alluvial deposits of the Hunter River to the south of the Project Boundary are a significant source of groundwater. The typical stratigraphic profile is comprised of a silty/clayey upper unit overlying clean sands and gravel aquifer at the base. Numerous monitoring bores have been installed in the alluvium in the area of the Wantana Extension including four stratigraphic boreholes drilled by AGE (2010). These bores intersected 5 m of silty clay overlying gravel and sand. The gravels and sand vary from clean to silty and clayey and extend to a maximum depth of about 20 m below the floodplain where they unconformably rest on Permian mudstone. The sand and gravel layer has a maximum thickness of about 15 m. The borehole logs indicate that that within and near the Project Boundary, the alluvium is up to 14 m thick and the basal gravel varies between about 2.5 m and 4 m in thickness. The material overlying the basal sand consists predominantly of silt with minor clay. Water bearing sand lenses occur within the silt. The saturated thickness of the alluvium ranges from about 2 m to 10 m. 35
47 On the southern side of the Hunter River, MAC have also found a similar stratigraphic sequence of low permeability silts/clays overlying sands and gravels that form the main a productive aquifer. Monitoring bores and mapping for the Wantana Extension and Water Management Plan were used to define the edge of the alluvium. The alluvial deposits thin to the north towards the margin of the alluvium as the surface of the Permian basement rises and outcrops. The limit of the alluvium is well defined by the 1:100,000 scale geological map for Singleton, and as the proposed mine will continue to the west and move away from the alluvial aquifer no further mapping of the limit of the alluvium was undertaken for the current EIS Groundwater Levels and Water Table Surface Figure 7.4 shows the section of the CRD graph from 1995 to 2012, which is the period of monitoring at Bengalla. Figure 7.4: Cumulative Rainfall Departure, 1995 to 2012 Jerrys Plains (Station ) Figure 7.4 indicates that there was an extended dry period from July 2001 until July 2007 and that since then, rainfall has generally been above average. Groundwater levels respond to rainfall and the fluctuations recorded in the monitoring bores would be expected to have some correlation with the CRD. Poor correlation between groundwater levels and the CRD may indicate water being extracted, or added to the groundwater system from sources other than rainfall, or a poor response to rainfall recharge. 36
48 Figure 7.5 to Figure 7.8 present hydrographs for the bores monitoring the Hunter River alluvium. Figure 7.1 shows the locations of the bores. The bores were grouped as follows: Those to the immediate south of the southern end-wall of the current mine, referred to herein-after as the Wantana Extension bores (prefixed with WAN); and Those bores located in the alluvium at a greater distance from the mine and which are unlikely to be impacted by mining, referred to as the regional Hunter River alluvial bores. The data is considered to be of a high quality as all the bores have been surveyed and the water bearing zones in which the bores are constructed are known. Figure 7.5: Hydrographs of Alluvial Bores Wantana Extension Area Wantana Extension Bores Bores in the alluvium typically have recorded a general trend of rising groundwater levels since Alluvial groundwater levels are correlated with the CRD. The exception has been WAN8A that has recorded water levels with significant fluctuations and an overall declining trend since The reason for the fluctuating water levels in WAN8A could potentially be that it is close to the pit area and / or related to pumping from irrigation bores in area. The hydrographs also include the water level in the Hunter River recorded at Muswellbrook Bridge where the zero gauge elevation is RL m. The Hunter River level was calculated as a threemonth moving average and then reduced by 10m to enable comparison of river levels with groundwater levels. The data suggests that during periods of low rainfall, surface water flows in the Hunter River recharge the adjacent alluvium. There is strong correlation between river levels and water levels in the alluvium. River flow is maintained during the dry season by consistent releases from Glenbawn Dam and flow from the river back into the alluvium appears to be influencing groundwater levels in the alluvium. 37
49 Figure 7.6 to Figure 7.8 below present hydrographs for the bores located in the alluvium at a greater distance from Bengalla. Figure 7.6: Hydrographs of Regional Hunter River Alluvial Bores Figure 7.7: Hydrographs of Regional Alluvial Bores from North (BG5) to South (BG3) 38
50 Figure 7.8: Hydrographs of Regional Alluvial Bores (BG1, 3, 5) Regional Hunter River Alluvial Bores Figure 7.7 shows alluvial groundwater levels in bores upstream of Bengalla (BG5), in the central area close to the southern end-wall of Bengalla (BG1), and downstream of Bengalla (BG3), compared to the CRD. The water levels show little fluctuation from January 1999 to December 2011, with the exception of BG1 which fluctuates by up to 2.5 m. The hydrographs indicate an alluvial water table gradient of 0.001, from RL132.2 m (BG5) to RL126.2 m (BG3), that is, 6.0 m over a distance of about 5.5 km. The hydrographs show limited fluctuation and correlation with the CRD. Figure 7.8 shows the six month moving average of the Hunter River level, and exhibits a broad correlation with river level, particularly for monitoring bore BG1 which is in the Wantana Extension area. Of interest is the decline in alluvial groundwater levels from about November 2008 until March 2010 which correlates well with a declining river level, thus providing strong evidence that recharge of the alluvium is dependent to a significant extent on the level of the Hunter River. It appears the Hunter River alluvium is recharged by both direct rainfall and by the Hunter River, and that the Hunter River water level has a stabilising effect on groundwater levels. Figure 7.9 shows the water table surface within the Hunter River alluvium interpolated from water level measurements in June and July Figure 7.9 also indicates a groundwater flow is similar to the Hunter River, downstream and to the south-west with a hydraulic gradient of 0.001, or about 1.1m per km. Groundwater levels closer to the Wantana Extension do not follow this regional trend, but show a gradient towards the mine, suggesting that alluvial groundwater levels within a narrow zone adjacent to the Wantana Extension are impacted by depressurisation of the underlying Permian due to mining. However, it should be noted this conclusion has been reached based on water level measurements from a range of bores, including WAN8A and WAN9A, where the reasons for their water level response is not clear. Drilling of new bores at these sites has been recommended to confirm the observed trend adjacent to the mine. Despite the limitations in the data, it is evident that downstream flow through the alluvial aquifer is being maintained, despite the close proximity of the mining to the alluvial aquifer. The modelling also indicated downstream flow would be maintained during mining. 39


51 40
52 7.3.3 Yield and Usage Figure 7.1 shows the location of all water bores registered with NOW. Table 7 summarises the details of all bores located within the Hunter River alluvial plain within 5 km of Bengalla. Table 7: REGISTERED BORES ON NOW DATABASE WITHIN ALLUVIUM 5 M FROM BENGALLA Work No Easting Northing Date Type Work Status Land Owner Depth (m) Salinity GW ,989 6,422,513 Bore (Unknown) MAC 10 GW ,127 6,423, Well Supply Obtained Private ppm GW ,336 6,423, Well (Unknown) Private 11.2 Good GW ,465 6,423, Well Supply Obtained Private 8 (Unknown) GW ,492 6,423, Well (Unknown) Private ppm GW ,651 6,423, Well Supply Obtained MAC ppm GW ,815 6,422,117 Bore SWL Man obs - 6 to 12 mths MAC 13.8 GW ,056 6,422, Well Supply Obtained MAC 11.6 (Unknown) GW ,578 6,422,598 Well Abandoned - Backfilled Private 14.9 (Unknown) GW ,391 6,423, Well Supply Obtained MAC 9.1 (Unknown) GW ,895 6,424, Well (Unknown) BMC 10 (Unknown) GW ,964 6,424, Well (Unknown) BMC ppm GW ,459 6,425, Well (Unknown) BMC 11.9 Good GW ,573 6,423, Well Abandoned - Collapsed MAC (Unknown) GW ,881 6,425, Well Supply Obtained BMC 9.8 (Unknown) GW ,341 6,426, Well (Unknown) BMC 11.3 (Unknown) GW ,060 6,427, Well (Unknown) BMC 12.5 Fresh GW ,141 6,428, Well (Unknown) BMC 11.3 (Unknown) GW ,186 6,428, Well (Unknown) BMC 9.1 (Unknown) GW ,420 6,428, Well (Unknown) MTP 12.5 (Unknown) GW ,487 6,426, Well Supply Obtained BMC 10.7 (Unknown) GW ,508 6,428, Well Supply Obtained BMC 13.4 (Unknown) GW ,554 6,428, Well (Unknown) MTP 12.2 (Unknown) GW ,603 6,427, Well Supply Obtained MTP 9.1 Good Stock GW ,616 6,426, Well (Unknown) BMC 11 (Unknown) GW ,649 6,429, Well Supply Obtained MTP ppm GW ,649 6,429, Well (Unknown) MTP 13.5 (Unknown) GW ,734 6,426,143 Well (Unknown) MTP (Unknown) GW ,714 6,428, Well (Unknown) Private 12.7 GW ,740 6,428,485 Well Collapsed Bore MTP 15.2 Good GW ,740 6,428, Well Supply Obtained MTP 14.3 (Unknown) 41
53 Table 7: REGISTERED BORES ON NOW DATABASE WITHIN ALLUVIUM 5 M FROM BENGALLA Work No Easting Northing Date Type Work Status Land Owner Depth (m) Salinity GW ,751 6,427, Well (Unknown) MTP 11 Good GW ,799 6,426, Well (Unknown) Private 6.5 (Unknown) GW ,817 6,428, Well Supply Obtained BMC 14 (Unknown) GW ,877 6,426, Well (Unknown) Private 5 (Unknown) GW ,974 6,427, Well Supply Obtained Private 9.1 Good GW ,091 6,427, Well (Unknown) MTP 11.6 Good GW ,144 6,426,613 Well Abandoned - Backfilled BMC 3.7 (Unknown) GW ,129 6,428, Well (Unknown) Private 10.7 (Unknown) GW ,171 6,426,583 Bore (Unknown) MTP 6 (Unknown) GW ,147 6,429, Well (Unknown) Private 14.1 (Unknown) GW ,195 6,426,676 Well (Unknown) Private 3 (Unknown) GW ,316 6,427, Well (Unknown) Private 11 Good GW ,357 6,426, Well (Unknown) Private 9.8 (Unknown) GW ,428 6,428, Well (Unknown) MTP 11 Good GW ,448 6,429,119 Bore (Unknown) MTP 9.5 Excellent GW ,493 6,428, Well (Unknown) MTP 13.4 (Unknown) GW ,566 6,429, Well (Unknown) MTP 11.9 (Unknown) GW ,726 6,427, Bore Needs Reconditioning BMC 14 GW ,770 6,428, Bore Supply Obtained BMC 15.6 Fair GW ,778 6,427, Bore SWL Man obs - 6 to 12 mths BMC 12.5 GW ,874 6,428, Bore Needs Reconditioning BMC 12 GW ,894 6,427, Bore Supply Obtained BMC 13.8 GW ,940 6,429, Bore (Unknown) Private GW ,947 6,429,649 Bore Supply Obtained MTP 53.2 GW ,964 6,428, Well (Unknown) MTP ppm GW ,003 6,429, Bore (Unknown) Private 23.8 GW ,034 6,429, Bore (Unknown) Private 12.2 (Unknown) GW ,070 6,428, Well Abandoned - Backfilled MTP 7 (Unknown) GW ,201 6,427, Well (Unknown) Private 6.7 (Unknown) GW ,222 6,428, Bore Abandoned Bore Private 12 GW ,215 6,429, Bore (Unknown) BMC 12.1 (Unknown) GW ,252 6,427, Well (Unknown) Private 11.5 (Unknown) GW ,314 6,429,625 Well (Unknown) MTP 12 (Unknown) GW ,369 6,428, Bore Needs Reconditioning BMC 13 GW ,482 6,427, Bore (Unknown) MTP 13.2 GW ,475 6,429,474 Well (Unknown) BMC 14 (Unknown) 42
54 Table 7: REGISTERED BORES ON NOW DATABASE WITHIN ALLUVIUM 5 M FROM BENGALLA Work No Easting Northing Date Type Work Status Land Owner Depth (m) Salinity GW ,554 6,429, Well Collapsed Bore Private (Unknown) GW ,652 6,428, Bore (Unknown) BMC 11.2 GW ,737 6,429, Well Supply Obtained Private 12.2 (Unknown) GW ,800 6,429, Bore (Unknown) Private 19 Good GW ,946 6,429, Bore (Unknown) Unknown 12.8 Hard GW ,949 6,429,330 Well (Unknown) Private 12.4 (Unknown) GW ,976 6,427, Bore (Unknown) Unknown ppm GW ,025 6,429, Bore (Unknown) Unknown 12.5 Hard GW ,232 6,429, Well Supply Obtained Unknown 15.2 (Unknown) Notes: coordindates MGA94 Zone 56 There are a total of 76 bores on the NOW database within the Hunter River alluvial plain that are located within 5 km of Bengalla. The majority are shallow wells (54) with a smaller number of bores (22). Most of the bores/wells (71) are less than 20 m deep, with an average depth of 11.5 m. This highlights the thin nature of the alluvium. The status of most of the bores is unknown, but at least ten are not in use. BMC land ownership extends from the proposed mining area, about 2 km to the south and east, 3 km to the west and generally less than 0.5 km to the north. To the south, the land ownership extends to the edge of the Hunter River. Figure 7.10 shows the landownership and registered water bores. Figure 7.10 indicates that the majority of the registered water bores are located on land owned by BMC, or by the adjacent MTP 3 or MAC Projects. Only a small number of bores are located on private land and these are relatively distant from the proposed mining area. Yields of bores in the Hunter River alluvium are generally relatively low due to the thin saturated thickness of the alluvium, with the higher yielding bores being those with the greatest saturated thickness. MER (2000) undertook test pumping on the five monitoring bores at rates of around 0.25 L/s, the drawdown in individual bores varied between 0.01 m and 0.97 m. Yield data on the NOW database is limited to seven bores which recorded yields between 0.1 L/s and 7 L/s. 3 Mount Pleasant Project 43


55 44
56 7.3.4 Hydraulic Parameters Pumping tests carried out during the EIS by MMA (1993) indicated a transmissivity in the range of 100 m 2 /day to 700 m 2 /day. Assuming a saturated thickness of 10m, this equates to a hydraulic conductivity ranging from 10 m/day to 70 m/day. Pumping tests on bores GW16, 17, 21, 24 and 25 by MER (2000) indicate that the basal gravel has a moderate to high hydraulic conductivity in the range 5-40 m/day with a median value of 8.2 m/day. Values determined at other locations in the area range from 2 m/day to more than 60 m/day. The available data indicates a generally high but spatially variable distribution of hydraulic conductivity in the alluvium Recharge and Groundwater Flow Recharge to the alluvium occurs by direct infiltration of rainfall, and runoff from elevated bedrock subcrop areas. The groundwater that occurs in the thin, locally limited alluvial deposits within the Project Boundary is probably perched above the main water table, and is short lived, draining relatively rapidly into the creeks and gullies. Apart from infiltration of rainfall and runoff from higher areas, the alluvium along the Hunter River is likely recharged during very dry periods from flow in the Hunter River, which is maintained by release of water from Glenbawn Dam. Upward leakage from the underlying coal measures also adds to recharge of the Hunter River alluvium and to the base flow of the creeks. Section also discusses vertical gradients in the Permian geological units. MER (2000) states that measurements of groundwater levels in the alluvium indicate a shallow hydraulic gradient towards the Hunter River, contiguous with the regional hydraulic gradient. That is, the hydraulic gradient in the alluvium appears to be similar with that of the coal seams and the overall gradient in the study area Groundwater Quality and Beneficial Use BMC regularly monitors groundwater quality in a subset of bores installed in the Hunter River alluvium. Bores BG1, BG3, BG5, 18298, 19116, and have been monitored since the late 1990s. The Wantana extension bores have been monitored since Figure 7.11 and Figure 7.12 present the electrical conductivity (EC) data over time, which is an indicator of the trends in salinity. 45
57 Figure 7.11: Electrical Conductivity vs Time Hunter River Alluvium Figure 7.12: Electrical Conductivity vs Time Hunter River Alluvium (Wantana Extension) Figure 7.11 indicates the groundwater within the Hunter River alluvium typically has an EC less than 1,500 µs/cm and is therefore fresh to slightly brackish in quality. A general reduction in salinity since the commencement of monitoring in 1999 is evident in the dataset. This may relate to increased rainfall since 2007 and recharge from the Glenbawn Dam. This trend is not evident in the bores installed for the Wantana extension which recorded large increases in EC in three bores from Bores WAN4A, 5A and 8A show a gradual increasing EC from 2007 until 2009 with a steep increase in June-August 2009, and in August 2009 a peak 46
58 level of 4,170 µs/cm, at which time values started to stabilise or decrease. WAN5A appears to have stabilised on an elevated EC of about 5,600 µs/cm, whereas EC concentrations in WAN4A and WAN8A are generally declining since having reached peak levels. The reason for the significant increases in EC in WAN4A, 5A and 8A is not clear, particularly given that both WAN10A and bore 19116, which lie within the triangle containing these three bores, have a low EC of 977 µs/cm and 1,150 µs/cm respectively in December There is no evidence of a trend in water quality from the mine towards the Hunter River. However, it should be noted that WAN8A has very slow groundwater level recovery rate, and after purging sampling was sometimes not possible. This bore may be installed in low permeability sediments not representative of surrounding material, and could explain the very high EC readings. It is also possible that salt in the profile above the screen that accumulated during drought evapotranspiration was remobilised by improved rainfall and flushed into the screen zone. The salinity of the alluvial groundwater varies spatially and can be too brackish for irrigation, but is consistently suitable for stockwatering. The main beneficial use category is therefore considered to be for stockwatering Groundwater Dependent Ecosystems EcoLogical Australia (2013) sampled thirteen bores for the presence of stygofauna in July 2012 and then again in September Eight samples were collected from the Hunter River alluvium, and five were collected from the Permian strata. Seven of the sampled bores contained stygofauna, with the only non-alluvial bore being BG45. Six stygofauna taxa were collected with Cyclopoid crustaceans being the most numerous and frequently encountered taxa. Other taxa were Notobathynella sp. 1, Bathynella sp. 1, Chillagoe sp. 1, Ostracoda, and Oligochaeta, although not all taxa were identified to species. Based on existing knowledge of Hunter Valley stygofauna, it is unlikely that there are any species endemic to the area impacted by drawdown and depressurisation. Cumberland Ecology (2013) determined that the floodplain and creek-line communities dominated by such canopy species as Eucalyptus tereticornis (Forest Red Gum) or Angophora floribunda (Rough-barked Apple) are likely to have some root access to deep water tables and may have some dependence on groundwater. Thus, the riparian community Hunter Floodplain Red Gum Woodland is considered to be a GDE that may rely on groundwater resources during periods of drought or low rainfall. The floodplain areas to the south of the Study Area would have historically supported GDEs, namely floodplain vegetation such as Hunter Floodplain Red Gum Woodland. This floodplain area is now largely dominated by exotic pasture maintained for dairy farming, except along the Hunter River, where fragmented occurrences of Hunter Floodplain Red Gum Woodland have been retained. Section 11.6 discusses the predicted impacts of the Project on GDEs. 7.4 Shallow Permian Bedrock The shallow bedrock water bearing zone comprises surficial soils and weathered bedrock. The depth of the water bearing zone is likely to be variable and depends on the depth of weathering; and the extent and frequency of permeable fracture systems. The transition of the mixed colluvial-alluvial type deposits to underlying weathered coal measures is often difficult to define in areas where coarse clastics occur and the depth of weathering is significant. It is possible that there are zones of perched water at the interface between soils and bedrock, and zones of locally increased permeability caused by weathering or structures. 47
59 7.5 Permian Coal Measures The Permian strata may be categorised into the following hydrogeological units: hydrogeologically tight and hence very low yielding to essentially dry sandstone and lesser siltstone that comprise the majority of the Permian interburden/overburden; and low to moderately permeable coal seams which are the prime water bearing strata within the Permian sequence Distribution As discussed the Permian deposits occur across the whole of the Project area as a regular layered sedimentary sequence. The coal measures are generally gently dipping at about 5 degrees to the west. All coal seams subcrop in the western area of the mine and strike roughly north-south Groundwater Levels BMC has installed a network of monitoring bores within the Permian sequence, primarily targeting the coal seams. Figure 7.13 shows hydrographs for Permian bores in the Wantana extension area. Figure 7.1 shows the locations of the bores. Figure 7.13: Hydrographs of Coal Seam / Interburden Bores Wantana Extension Area The hydrographs indicate that the deepest coal seam monitored, the Edinglassie seam (bore WAN7B), generally has a potentiometric level of RL m. The Edinglassie seam is not 48
60 being mined at Bengalla. The potentiometric level of the Edinglassie seam was at RL 129.1m in December This is considered representative of the pre-mining potentiometric surface of the coal seams in the area of the Bengalla. The seams that are mined, with the Edderton Seam being the deepest, have been depressurized to a varying extent, depending on their stratigraphic position and the proximity of the monitoring bore to the end-wall of the pit. As would be expected, the greatest depressurization from an assumed pre-mining water level of RL m has been recorded in those bores closest to the mine. Examples are: Bore REPI7 Vaux Seam RL m Bore WAN2 Wynn Seam RL m, Edderton Seam RL m Bore WAN1 Wynn Seam RL m, Edderton Seam RL m The hydrographs indicate that following initial depressurization the potentiometric levels have remained relatively stable, that is depressurization of the seams has reached a quasi-steady state. Figure 7.14 shows the hydrographs of interburden and overburden (bedrock) monitoring bores to the north-east (up-dip) of Bengalla, between it and the Hunter River alluvium. Figure 7.14: Hydrographs of Regional Overburden / Interburden Monitoring Bores The bores in this area are unlikely to have been impacted by mining and the hydrographs indicate a potentiometric level of between RL m and RL m, which compares to an alluvial water level in the same area of RL m (BG5). This confirms that in general under pre-mining conditions, there is a potential for discharge from the Permian coal seams to the base of alluvium where they subcrop beneath the alluvium. To the west (down-dip) of Bengalla and away from the river, the potentiometric level of the coal seam and interburden is at RL m (bore E12). This also indicates a gradient from the hilly 49
61 areas north of the Hunter River towards the alluvium. A declining trend is evident in bore EL12, and given the proximity to the highwall, drainage of groundwater to the Bengalla is the likely cause. Nested monitoring bores, generally one in the alluvium and the second in a coal seam below the base of the alluvium, have been installed in the Wantana Extension area to the south of Bengalla, where it is expected that the greatest impact from coal seam depressurisation will occur. Groundwater levels in the interburden and coal seams and the overlying alluvium have been monitored in WAN4, 5, 6 and 7 since June Monitoring at WAN 8, 9 and 10 commenced in Figure 7.15 to Figure 7.18 show the hydrographs. Figure 7.15: Hydrographs of Alluvium and Interburden WAN4 (left) and WAN5 (right) Figure 7.16: Hydrographs of Alluvium and Coal Seam WAN6 (left) and WAN7 (right) 50
62 Figure 7.17: Hydrographs of Alluvium and Coal Seam WAN8 (left) and WAN9 (right) Figure 7.18: Hydrographs of Alluvium and Coal Seam WAN10 The hydrographs indicate that the potentiometric level of the interburden at WAN4 is about 2 m The hydrographs indicate that the potentiometric level of the interburden at WAN4 is about 2 m below the alluvial water table level. This is probably indicative of WAN4 being closer to the Bengalla pit and the interburden being depressurised. The hydrographs of the nested bores at WAN7 indicate that the potentiometric level of the deep Edinglassie Seam, which is not mined at Bengalla and hence has not been impacted, is about 2 m higher than that of the alluvial water table. Figure 7.17 and Figure 7.18 show hydrographs of the nested monitoring bores (WAN8, 9 and 10) installed in March They have recorded a water level of between RL m and RL m in the alluvium, and a potentiometric level in the underlying coal seams of between RL m and RL m. This is a head differential of up to 9.3 m as a result of mining induced depressurization of the coal seams, indicating potential for alluvial groundwater to leak to the coal seams and eventually towards Bengalla. It should be noted that WAN9 has been dry for most of the period of record indicating that no leakage of alluvial groundwater has actually occurred at this point. Similarly, Figure 7.19 shows the hydrographs of three coal seams monitored at WAN2. They indicate an increasing level of depressurisation with the depth of the coal seam as would be expected. The shallowest (Vaux Seam) is depressurised the least, whereas the deepest (Edderton 51
63 Seam) shows the highest level of depressurisation to about RL100m from the estimated premining level of about RL128 m. Figure 7.20 to Figure 7.22 present the pore pressure records for the new VWPs installed in the coal seams in the western area of the Project Boundary. The VWPs have measured a significant difference in the pore pressure between the coal seams. The pore pressure in the shallow Mt Arthur Seam (MA2) is about 10 m to 20 m higher than the deeper Edderton Seam (ED1). The potential for this difference to be related to depressurisation is uncertain as the monitoring record is relatively short. The Mt Arthur Seam in BE2 appears to respond slowly to recharge over the summer wet season period. Figure 7.23 and Figure 7.24 show the interpolated potentiometric surface for the shallow Permian (Wynn and Vaux seams and interburden) and deeper Permian (Edderton and Edinglassie seams and interburden) respectively. The depressurisation of the coal seams and the hydraulic gradient towards the mine is clearly evident in the water level measurements. It is interesting to note that the recorded depressurisation does not appear to be resulting in significant drawdown in the alluvial aquifer, except in close proximity to the edge of the Wantana Extension. Figure 7.19: Hydrographs of coal seams WAN2 52
64 Figure 7.20: Hydrographs of pore pressures heads as potentiometric levels BE1 Figure 7.21: Hydrographs of pore pressures heads as potentiometric levels BE2 53
65 Figure 7.22: Hydrographs of pore pressures heads as potentiometric levels BE3 54


66 55


67 56
BENGALLA Mining Company. Contamination Assessment
 BENGALLA Mining Company U Contamination Assessment U CONTINUATION OF BENGALLA MINE PRELIMINARY CONTAMINATION ASSESSMENT Prepared by: HANSEN BAILEY 6 / 127 129 John Street SINGLETON NSW 2330 July 2013 For:
Advice to decision maker on coal mining project
 . Advice to decision maker on coal mining project IESC 2015-063: West Muswellbrook Project New Development Requesting agency The New South Wales Mining and Petroleum Gateway Panel Date of request 27 January
ATTACHMENT 5 AQUIFER INTERFERENCE POLICY AND WATER LICENSING ADDENDUM
 ATTACHMENT 5 AQUIFER INTERFERENCE POLICY AND WATER LICENSING ADDENDUM COWAL GOLD MINE EXTENSION MODIFICATION TABLE OF CONTENTS A5 AQUIFER INTERFERENCE POLICY CONSIDERATIONS AND WATER LICENSING ADDENDUM
Groundwater Impact Assessment
 Australian Groundwater and Environmental Consultants Pty Ltd K Continuation of Bengalla Mine 61 K Australian Groundwater and Environmental Consultants Pty Ltd 7.5.6 Groundwater Quality and Beneficial Use
(No. of pages excluding this page = 10)
") SPECIALIST CONSULTANT STUDIES 3-65 BIG ISLAND MINING PTY LTD (No. of pages excluding this page = 10) Ltd BIG ISLAND MINING PTY LTD 3-66 SPECIALIST CONSULTANT STUDIES This page has intentionally been left
SPECIALIST CONSULTANT STUDIES 3-65 BIG ISLAND MINING PTY LTD (No. of pages excluding this page = 10) Ltd BIG ISLAND MINING PTY LTD 3-66 SPECIALIST CONSULTANT STUDIES This page has intentionally been left
ATTACHMENT 2. Aquifer Interference Policy Considerations and Water Licensing COWAL GOLD OPERATIONS MINE LIFE MODIFICATION
 ATTACHMENT 2 Aquifer Interference Policy Considerations and Water Licensing COWAL GOLD OPERATIONS MINE LIFE MODIFICATION Environmental Assessment 2016 TABLE OF CONTENTS A2 AQUIFER INTERFERENCE POLICY CONSIDERATIONS
United Wambo Open-Cut Coal Mine Project Groundwater Impact Assessment
 Australasian Groundwater and Environmental Consultants Pty Ltd (AGE) Report on United Wambo Open-Cut Coal Mine Project Groundwater Impact Assessment Prepared for Umwelt Australia Pty Ltd Project No. G1733
in brief corrs Policy What it means for developments in april 2012
 corrs in brief april 2012 Delivery of the Strategic Regional Land Use Policy What it means for developments in regional areas The NSW Government has recently released a number of draft plans, policies
Hunter Valley Operations South
 Hunter Valley Operations South This booklet outlines a modification proposal being prepared for Coal & Allied s Hunter Valley Operations (HVO) South mining activities. In this booklet you will find an
WAMBO COAL PTY LTD ENVIRONMENTAL ASSESSMENT. ATTACHMENT 2 Relevant Environmental Planning Instruments and Government Policies
 WAMBO COAL PTY LTD NORTH WAMBO UNDERGROUND MINE LONGWALL 10A MODIFICATION ENVIRONMENTAL ASSESSMENT ATTACHMENT 2 Relevant Environmental Planning Instruments and Government Policies A2 PLANNING FRAMEWORK
DEVELOPMENT CONSENT MODIFICATION Statement of Environmental Effects
 BENGALLA MINE DEVELOPMENT CONSENT MODIFICATION for Bengalla Mining Company Pty Limited August 2015 BENGALLA MINE DEVELOPMENT CONSENT MODIFICATION STATEMENT OF ENVIRONMENTAL EFFECTS Prepared by: HANSEN
Drayton Management System Standard. Final Void Management Plan
 Anglo Coal (Drayton Management) Pty Ltd Policies and Procedures Final Void Plan Drayton Management System Standard Final Void Management Plan Author: Name Pam Simpson Title Environment Coordinator Signature
Environmental Assessment Chapter 8 Surface Water
 Environmental Assessment Chapter 8 Surface Water 8.2.7 Rainfall and Evaporation Based on recorded data for the area of interest, the mean annual rainfall is about 700mm, with maximum monthly rainfalls
Moolarben Coal Complex UG1 Optimisation Modification. Environmental Assessment APPENDIX F SURFACE WATER ASSESSMENT REVIEW
 Moolarben Coal Complex UG1 Optimisation Modification Environmental Assessment APPENDIX F SURFACE WATER ASSESSMENT REVIEW Moolarben Coal Complex UG1 Optimisation Modification Surface Water Assessment Review
TABLE OF CONTENTS LIST OF FIGURES. Mt Arthur Coal Open Cut Modification Environmental Assessment
 Executive Summary TABLE OF CONTENTS ES1 BACKGROUND ES-1 ES2 EXISTING OPERATIONS ES-1 ES3 MODIFICATION OVERVIEW ES-1 ES4 CONSULTATION ES-1 ES5 COMMUNITY INITIATIVES AND INVOLVEMENT ES-3 ES6 ENVIRONMENTAL
Spur Hill Underground Coking Coal Project. Groundwater Assessment for Gateway Application. Tuesday 16 June 2015
 Spur Hill Underground Coking Coal Project Groundwater Assessment for Gateway Application Tuesday 16 June 2015 HydroSimulations 2 Track record in groundwater assessment and modelling for water resources,
Chapter 2: Aquifers and groundwater
 Chapter 2: Aquifers and groundwater Groundwater movement through aquifers is driven by differences in groundwater levels or pressure and is controlled by how porous the material is that it passes through.
Appendix J: IESC Advice and Response Checklist
 Appendix J: IESC Advice and Response Checklist Description of the Proposal Description of the Proposal Groundwater Context and Conceptualisation A regional overview of the proposed Project area including
Anglesea Mine Hydrology and Hydrogeotechnical Study
 Anglesea Mine Hydrology and Hydrogeotechnical Study Introduction Alcoa s Anglesea mine is located at Anglesea, in south western Victoria, approximately 35 kilometres from Geelong. The Anglesea Mine supplied
Development Approval 211/93 (as modified) Schedule Condition Commitment Audit Finding
 Schedule Condition Commitment Audit Finding") Independent Environmental Audit Bengalla Mine Development Approval 211/93 (as modified) Schedule Condition Commitment Audit Finding 3 1 The Applicant shall ensure that the noise generated by the development
Independent Environmental Audit Bengalla Mine Development Approval 211/93 (as modified) Schedule Condition Commitment Audit Finding 3 1 The Applicant shall ensure that the noise generated by the development
Drayton Management System Standard. Water Management Plan
 Anglo Coal (Drayton Management) Pty Ltd Policies and Procedures Site Water Management Plan Drayton Management System Standard Water Management Plan Author: Name Pam Simpson Title Environment Coordinator
Papua New Guinea LNG Project. Environmental and Social Management Plan Appendix 11: Reinstatement Management Plan PGGP-EH-SPENV
 Esso Highlands Limited Papua New Guinea LNG Project Environmental and Social Management Plan Appendix 11: PGGP-EH-SPENV-000018-013 LNG Project Page 2 of 13 CONTENTS 1.0 Objectives... 3 2.0 Legal and Other
TABLE OF CONTENTS. Atlas-Campaspe Mineral Sands Project Environmental Impact Statement
 TABLE OF CONTENTS 1 INTRODUCTION 1-1 1.1 PROJECT OVERVIEW 1-1 1.1.1 Purpose of this Report 1-1 1.1.2 Project Summary 1-1 1.1.3 Land Tenure, Development Application Area, Tenements and Zoning 1-7 1.1.4
8 Geology, Hydrology & Hydrogeology
 Inverneill Wind Farm Scoping Report Page 42 8 Geology, Hydrology & Hydrogeology 8.1 Introduction The EIA will consider the potential issues arising from the construction, operation and decommissioning
ENVIRONMENTAL MANAGEMENT STRATEGY (EMS)
") Established 1907 ENVIRONMENTAL MANAGEMENT STRATEGY (EMS) APPROVED BY MSC DATE: JUNE 2017 Version 1 2 3 Date February 2005 December 2010 December 2015 Section Modified All All All 4 June 2017 All Reason
Established 1907 ENVIRONMENTAL MANAGEMENT STRATEGY (EMS) APPROVED BY MSC DATE: JUNE 2017 Version 1 2 3 Date February 2005 December 2010 December 2015 Section Modified All All All 4 June 2017 All Reason
E2. Water quantity, allocation and use
 E2. Water quantity, allocation and use E2.1. Introduction E2 Water quantity, allocation and use Demand for water already equals or exceeds availability in some surface waterbodies and aquifers. Future
EIS TABLE OF CONTENTS
 EIS TABLE OF CONTENTS GLOSSARY OF TERMS... GL-1 Glossary and Abbreviations... GL-1 Units... GL-14 EXECUTIVE SUMMARY... ES-1 INTRODUCTION... ES-1 PROJECT PROPONENTS... ES-1 LOCATION... ES-1 PROJECT DESCRIPTION...
Fortescue Metals Group Ltd. Peer review and model appraisal. Hydrogeological Assessment for the. Cloudbreak Water Management Scheme
 Fortescue Metals Group Ltd Peer review and model appraisal Hydrogeological Assessment for the Cloudbreak Water Management Scheme 14 th October 2010 HydroConcept Pty Ltd ABN: 42 143 302 201 PO Box 4231,
DOORNVALLEI EXT 5 & 6
 DOORNVALLEI EXT 5 & 6 Proposed township establishment on portion 107 the farm Doornkloof 391 JR Sewer Pipe Crossings - Sesmylspruit Construction Method Statement April 2016 Revision 3 PREPARED FOR: PREPARED
Environmental Impact Statement. Avoca Tank Project
 ABN 88 100 095 494 Environmental Impact Statement for the Avoca Tank Project Prepared by: R.W. CORKERY & CO. PTY. LIMITED July 2014 This page has intentionally been left blank ABN 88 100 095 494 Environmental
For personal use only
 Initial JORC Reserves Estimate for Bluff Project HIGHLIGHTS Initial JORC Reserves Estimate of 11 Mt mineable for Bluff Project In-fill drilling program completed to support further Resources and Reserves
WATER MANAGEMENT PLAN (WMP)
") Established 1907 WATER MANAGEMENT PLAN (WMP) APPROVED BY MSC DATE: OCTOBER 2018 Version Date Section Modified 1 February 2005 All 2 December 2010 All Reason for Modification Original Management Plan 5
Established 1907 WATER MANAGEMENT PLAN (WMP) APPROVED BY MSC DATE: OCTOBER 2018 Version Date Section Modified 1 February 2005 All 2 December 2010 All Reason for Modification Original Management Plan 5
WATER MANAGEMENT PLAN (WMP)
") Established 1907 WATER MANAGEMENT PLAN (WMP) APPROVED BY MSC DATE: MARCH 2018 Version Date Section Modified 1 February 2005 All 2 December 2010 All Reason for Modification Original Management Plan 5 Yearly
Established 1907 WATER MANAGEMENT PLAN (WMP) APPROVED BY MSC DATE: MARCH 2018 Version Date Section Modified 1 February 2005 All 2 December 2010 All Reason for Modification Original Management Plan 5 Yearly
BEST PRACTICE GUIDELINE G1 STORMWATER MANAGEMENT
 BEST PRACTICE GUIDELINE G1 STORMWATER MANAGEMENT William Pulles Structure of BPG G1 Chapter 1 Introduction to guideline Chapter 2 - The principles and objectives to be incorporated in the storm water management
Water Sharing Plan for the Central Coast Unregulated Water Sources Amendment Order 2016
 New South Wales Water Sharing Plan for the Central Coast Unregulated Water Sources Amendment Order 2016 under the Water Management Act 2000 I, Niall Blair, the Minister for Lands and Water, in pursuance
Newstan Colliery S75W Modification Project Briefing Paper
 2 Table of Contents 1 INTRODUCTION...5 2 EXISTING DEVELOPMENT APPROVALS...6 2.1 CONSENTS, LEASES AND LICENSES...7 3 THE PROJECT...8 3.1 MINING METHOD...11 3.2 MINING AND PLANT EQUIPMENT...12 3.3 MINE INFRASTRUCTURE
HUNTER VALLEY OPERATIONS WATER MANAGEMENT PLAN. Prepared by Rio Tinto Coal Australia 4 May 2016
 HUNTER VALLEY OPERATIONS WATER MANAGEMENT PLAN Prepared by Coal Australia 4 May 2016 WATER MANAGEMENT PLAN Final report Prepared for Prepared by Position Coal Australia Chris New Environmental Specialist
Report by the Mining & Petroleum Gateway Panel to accompany a Conditional Gateway Certificate for the West Muswellbrook Project
 Report by the Mining & Petroleum Gateway Panel to accompany a Conditional Gateway Certificate for the West Muswellbrook Project May 2015 1 Report by the Mining & Petroleum Gateway Panel to accompany a
Bengalla Mining Company Pty Limited. Particulate Matter Control Best Practice Implementation Monitoring Programs
 Bengalla Mining Company Pty Limited Particulate Matter Control Best Practice Implementation Monitoring Programs U3. Wheel Generated Dust U4. Disturbing and Handling Overburden Under Adverse Weather Conditions
BOGGABRI COAL PROJECT MODIFICATION ENVIRONMENTAL ASSESSMENT
 BOGGABRI COAL PROJECT MODIFICATION ENVIRONMENTAL ASSESSMENT PREPARED FOR BOGGABRI COAL PTY LIMITED JULY 2013 Project No. WHC-12-08 Document No. 00532603.doc TABLE OF CONTENTS EXECUTIVE SUMMARY ES-1 1 INTRODUCTION
Clyde Street Remediation Project The Project Location
 The Project Location The Project Site Who is Jemena? Jemena is an Australian infrastructure company that builds, owns and manages a combination of major electricity, gas and water assets in Australia.
Appendix D Flood Assessment
 Appendix D Flood Assessment Mount Pleasant Operation Rail Modification Flood Assessment MACH Energy Australia Pty Ltd 0744-09-B3, 19 December 2017 Report Title Client Report Number Mount Pleasant Operation
Arrow Energy EIS GROUNDWATER IMPACT ASSESSMENT. April 2012
 Arrow Energy SURAT GAS PROJECT EIS GROUNDWATER IMPACT ASSESSMENT Jeroen van Dillewijn April 2012 FIRST A REFRESHER... Groundwater occurs in pores and fractures in rock and soil. Aquifers are layers that
SUBMISSION. NSW Department of Primary Industries - Water Draft Water Sharing Plan for the North Coast Fractured and Porous Rock Groundwater Sources
 SUBMISSION NSW Department of Primary Industries - Water Draft Water Sharing Plan for the North Coast Fractured and Porous Rock Groundwater Sources March 2016 0 NSW Minerals Council PO Box H367 Australia
BENGALLA Mining Company. Bengalla Mine. September Environmental Management Strategy
 BENGALLA Mining Company September 2017 Environmental Management Strategy Bengalla Mining Company Pty Limited Environmental Management Strategy Revision Date Date Approved Submitted 0 31/01/13-1 27/01/16
11 HYDROLOGY, HYDROGEOLOGY AND DRAINAGE
 11 HYDROLOGY, HYDROGEOLOGY AND DRAINAGE 11.1 introduction 11.1.1 The objective of this section and the statements presented is to assess the existing hydrological and hydrogeological conditions to understand
H28. Special Purpose Quarry Zone
 H28. Special Purpose Quarry Zone H28.1. Zone description Mineral resources are important to Auckland s economy and development. The Special Purpose Quarry Zone provides for significant mineral extraction
ATTACHMENT 2 COMMUNITY INFORMATION
 ATTACHMENT 2 COMMUNITY INFORMATION Wilpinjong Coal Wilpinjong s 75W modification November, 2012 The Wilpinjong Coal Mine is located in the developing western coalfields of NSW and produces a high quality
Environmental Risk Analysis
 Appendix 10 11 12 13 14 15 16 17 18 191 Groundwater Controlled UHSA Air Agricultural Historic EIS Preliminary Environmental Blasting Quality Surface Secretary s Noise Statement Aboriginal Economic Action
POLLUTION INCIDENT RESPONSE MANAGEMENT PLAN (PIRMP)
") Established 1907 POLLUTION INCIDENT RESPONSE MANAGEMENT PLAN (PIRMP) DATE: JULY 2018 Version Date Section Modified 1 July 2018 All Reason for Modification Original Management Plan Review Team MCC Environmental,
Established 1907 POLLUTION INCIDENT RESPONSE MANAGEMENT PLAN (PIRMP) DATE: JULY 2018 Version Date Section Modified 1 July 2018 All Reason for Modification Original Management Plan Review Team MCC Environmental,
BLAST MANAGEMENT STRATEGY
 BLAST MANAGEMENT STRATEGY For Boggabri Tarrawonga Maules Creek Complex J U L Y 2 0 1 4 Idemitsu Australia Resources Boggabri Coal Pty Ltd Whitehaven Coal Pty Ltd Tarrawonga Coal Pty Ltd, Maules Creek Coal
MAC-ENC-PRO-063 SURFACE AND GROUND WATER RESPONSE PLAN
 MAC-ENC-PRO-063 SURFACE AND GROUND WATER RESPONSE PLAN Document Owner Michael Gale, Superintendent Environment Analysis and Improvement Document Approver Sarah Withell, Head of Health, Safety and Environment
SUBMISSION NUMBER 13 SUNWATER BYERWEN COAL PTY LTD BYERWEN COAL PROJECT
 SUBMISSION NUMBER 13 SUNWATER BYERWEN COAL PTY LTD BYERWEN COAL PROJECT AIEIS for the 13. SUBMISSION NUMBER 13 SUNWATER 13.1 Issue Number 13.1 Section 3.2 of the Byerwen Coal project Terms of Reference
Managed Aquifer Recharge (MAR) Practical Techniques for the Caribbean
 Practical Techniques for the Caribbean") Managed Aquifer Recharge (MAR) Practical Techniques for the Caribbean Scope of Presentation What is MAR? Antigua and Barbuda water resources issues Why promote MAR? MAR: Techniques MAR: Design criteria
Managed Aquifer Recharge (MAR) Practical Techniques for the Caribbean Scope of Presentation What is MAR? Antigua and Barbuda water resources issues Why promote MAR? MAR: Techniques MAR: Design criteria
Evaluation of Void Water intercepted by Werris Creek Coal Mine Operations
 Evaluation of Void Water intercepted by Werris Creek Coal Mine Operations Prepared for: Werris Creek Coal Pty Ltd Prepared by: Australia Pty Ltd Date: 10 April 2014 Project Number: 10 April 2014 Prepared
Development Consent Modification 4 Response to Submissions
 BENGALLA MINE Development Consent Modification 4 to Submissions for Bengalla Mining Company Pty Ltd May 2018 BENGALLA MINE DEVELOPMENT CONSENT MODIFICATION 4 RESPONSE TO SUBMISSIONS Prepared by: 6/127-129
General Groundwater Concepts
 General Groundwater Concepts Hydrologic Cycle All water on the surface of the earth and underground are part of the hydrologic cycle (Figure 1), driven by natural processes that constantly transform water
2.9 SURFACE WATER DIVERSION. Horse Creek Diversion
 Figure 5.17 TDP Dimensions 2.9 SURFACE WATER DIVERSION Horse Creek, an ephemeral tributary of the Dawson River, passes centrally through MLA 50254 and to the east of MLAs 50271 and 50270. Horse Creek has
Innovative design and solutions for mine water management on an alluvial floodplain
 Water Resources Management IV 43 Innovative design and solutions for mine water management on an alluvial floodplain B. Tite 1 & T. Reedman 2 1 Water Section, PB, Australia 2 Environment and Communications
Development Consent Conditions
 Revision D 31 October 2008 Page J-1 Table 22 Development Consent s Development Consent s 3.9 The Applicant shall design underground mining operations to ensure no direct hydraulic connection between the
ENVIRONMENT ACT TERMS OF REFERENCE NOVA SCOTIA DEPARTMENT OF TRANSPORTATION AND PUBLIC WORKS. Beaver Bank Bypass
 ENVIRONMENT ACT TERMS OF REFERENCE NOVA SCOTIA DEPARTMENT OF TRANSPORTATION AND PUBLIC WORKS Beaver Bank Bypass Highway 101 to the Beaver Bank Road Halifax County, NS NOVA SCOTIA DEPARTMENT OF THE ENVIRONMENT
COAL AND COAL SEAM GAS REGULATION
 COAL AND COAL SEAM GAS REGULATION The Australian Government protects water resources from the impacts of coal and coal seam gas development through the water trigger provisions of the Environment Protection
BMA Broadmeadow Mine - EHP EA amendment application (Pre-lodgement meeting) Wednesday 22 April, 2015
 Wednesday 22 April, 2015") BMA Broadmeadow Mine - EHP EA amendment application (Pre-lodgement meeting) Wednesday 22 April, 2015 Broadmeadow Mine 2 BRM Subsidence Management Plan SMP Purpose SMP is the document that outlines the
BMA Broadmeadow Mine - EHP EA amendment application (Pre-lodgement meeting) Wednesday 22 April, 2015 Broadmeadow Mine 2 BRM Subsidence Management Plan SMP Purpose SMP is the document that outlines the
APPENDIX. Addendum - Peer Review of the Maules Creek Coal Project Groundwater Impact Assessment
 APPENDIX Addendum - Peer Review of the aules Creek Coal Project HERITAGE COPUTING REPORT PEER REVIEW OF THE AULES CREEK COAL PROJECT GROUNDWATER IPACT ASSESSENT FOR ASTON RESOURCES LIITED By Dr N. P. errick
EMM. Mount Pleasant Project Construction Water Management Plan. Planning + Environment + Acoustics
 EMM EMGA Mitchell McLennan Mount Pleasant Project Construction Water Management Plan Prepared for Coal & Allied Operations Pty Limited 23 July 2012 Planning + Environment + Acoustics This page has been
Appendix J Socio-Economic Assessment
 Appendix J Socio-Economic Assessment MT ARTHUR COAL OPEN CUT MODIFICATION SOCIO-ECONOMIC ASSESSMENT PREPARED BY GILLESPIE ECONOMICS October 2012 HVE-11-01 DOC. ID: 482858 TABLE OF CONTENTS Section Page
Landscapes & Industries
 K N O W L E D G E Landscapes & Industries Groundwater Flow Systems Framework ESSENTIAL TOOLS FOR PLANNING SALINITY MANAGEMENT Summary Report Glen Walker, Mat Gilfedder, Ray Evans, Phil Dyson & Mirko Stauffacher
Movement and Storage of Groundwater The Hydrosphere
 Movement and Storage of Groundwater The Hydrosphere The water on and in Earth s crust makes up the hydrosphere. About 97 percent of the hydrosphere is contained in the oceans. The water contained by landmasses
E7. Taking, using, damming and diversion of water and drilling
 E7. Taking, using, damming and diversion of water and drilling E7.1. Introduction Taking, using, damming and diversion of surface water and groundwater provisions in this plan apply in accordance with
APPENDIX. Groundwater Impact Assessment
 APPENDIX M M M Australasian Groundwater & Environmental Consultants Pty Ltd REPORT on MAULES CREEK COAL PROJECT GROUNDWATER IMPACT ASSESSMENT Prepared for ASTON RESOURCES LIMITED Project No. G1508 June
Appendix X.6 Queensland Government CSG Water Management Policy
 Appendix X.6 Queensland Government CSG Water Management Policy Coal Seam Gas Water Management Policy June 2010 Tomorrow s Queensland: strong, green, smart, healthy and fair Purpose The purpose of this
Temporary Watercourse Crossing: Fords
 Temporary Watercourse Crossing: Fords DRAINAGE CONTROL TECHNIQUE Low Gradient Velocity Control Short Term Steep Gradient Channel Lining Medium-Long Term Outlet Control Soil Treatment Permanent [1] [1]
Technical Rules - March 2017
 Ministry of the Environment and Climate Change Source Protection Programs Branch Technical Rules - March 2017 Amended on: December 2008 (administrative amendments) November 2009 (EBR Posting Number EBR
San Mateo Plain Groundwater Basin Assessment Stakeholder Workshop #8 17 APRIL 2018
 San Mateo Plain Groundwater Basin Assessment Stakeholder Workshop #8 17 APRIL 2018 PRESENTATION OVERVIEW Introductions Project Overview Summary of Analysis Supporting Model Development Model Development
Stratford Extension Project Technical Overview
 Stratford Extension Project Technical Overview November 2012 Yancoal Australia Limited Level 11, 68 York Street Sydney NSW 2000 Stratford Coal Pty Ltd 3364 The Bucketts Way Stratford NSW 2422 PO Box 168
Application for Subsidence Management Approval. Subsidence Management Plan ANNEX D. Bettys Creek Subsidence Management Plan
 Application for Subsidence Management Approval Subsidence Management Plan ANNEX D Bettys Creek Subsidence Management Plan Subsidence Management Plan Bettys Creek Glennies Creek Longwall Panels 10 to 17
Environmental Impact Assessment of Lake Menindee Shallow Aquifer Test Bores
 Environmental Impact Assessment of Lake Menindee Shallow Aquifer Test Bores October 2015 Environmental Impact Assessment of Lake Menindee Shallow Aquifer Test Bores WaterNSW on behalf of the NSW Government
8.0 - WATER MANAGEMENT STRATEGY
 8. - WATER MANAGEMENT STRATEGY 8.1 POTENTIAL IMPACTS The project has the potential to adversely affect water quality and flow frequency in the downstream receiving waters of Horse Creek. Such adverse impacts
14. ENVIRON MEN TA L I MPAC T ASSE S SMEN T - INTE GR ATIN G FACTOR - OF FSE TS
 14. ENVIRON MEN TA L I MPAC T ASSE S SMEN T - INTE GR ATIN G FACTOR - OF FSE TS The EPA s objective for offsets is to counterbalance any significant residual environmental impacts or uncertainty through
BLOCKING AND FILLING SURFACE DRAINAGE DITCHES
 MINNESOTA WETLAND RESTORATION GUIDE BLOCKING AND FILLING SURFACE DRAINAGE DITCHES TECHNICAL GUIDANCE DOCUMENT Document No.: WRG 4A-1 Publication Date: 10/14/2015 Table of Contents Introduction Application
Perched Water Table Mounding Between Subsoil Drains in Sand
 Perched Water Table Mounding Between Subsoil Drains in Sand Jim Davies (PhD, FIEAust, Member IPWEA, SIA WA Member) Alex Rogers (BE(Env), MIEAust) Gregorio Serafini (BE(Env)) JDA Consultant Hydrologists
ASHTON LONGWALL 103 MID PANEL REPORT
 Ashton Longwall 13 ASHTON LONGWALL 13 MID PANEL REPORT 1 INTRODUCTION This report has been prepared by Ashton Coal Operations Pty Ltd (ACOL) with the assistance of an independent groundwater consultant,
WAR Wairarapa Aggregates Ltd
 WAR080518 Wairarapa Aggregates Ltd Supplementary report to Hearing Panel Deirdre Ross 1. Purpose of report The purpose of this report is to provide comments on the briefs of evidence provided by the applicant
GUIDE TO THE DEVELOPMENT OF A MINING AND RECLAMATION PLAN IN NEW BRUNSWICK
 PROVINCE OF NEW BRUNSWICK DEPARTMENT OF ENERGY AND RESOURCE DEVELOPMENT Minerals and Petroleum Development Branch GUIDE TO THE DEVELOPMENT OF A MINING AND RECLAMATION PLAN IN NEW BRUNSWICK Guide to the
13 Land Use Activities and Indigenous Biological Diversity
 13 Land Use Activities and Indigenous Biological Diversity 13.1 Land Use Activities 13.1.1 Objectives Objective 13-1: Accelerated erosion* - regulation of vegetation clearance*, land disturbance*, forestry*
Mid-Loddon Groundwater Management Area Local Management Rules
 Mid-Loddon Groundwater Management Area Local Management Rules Annual Report 2011 Document Number: 3248830 Table of Contents 1 INTRODUCTION... 1 1.1 LOCAL MANAGEMENT RULES... 1 1.2 GROUNDWATER MANAGEMENT
EXTRACT. MONITOR. CONTROL.
 GUIDANCE OF ABSTRACTION AND DISCHARGE PERMITS FOR OPERATIONS When considering any potential dewatering requirement, it is necessary to consider the following questions: Are we allowed to abstract groundwater,
In-Pit Tailing Storage Facility Management Plan
 J.1 In-Pit Tailing Storage Facility Management Plan IN-PIT TAILINGS STORAGE FACILITY MANAGEMENT PLAN New Acland Coal Mine Stage 3 Project JANUARY 2014 Contents 1. Introduction 2 1.1. Overview 2 1.2. Purpose
1 Introduction 1-1. Project Need and Objectives
 Introduction 1 CONTENTS 1 Introduction 1-1 1.1 1.1 Introduction Introduction 1-1 1-1 1.2 1.2 Project Overview Project Overview 1-1 1-1 1.3 1.3 Project Site Project Site 1-1 1-1 1.4 1.4 The Proponent The
GROUND WATER. Practice Note # water. sensitive. urban. design \ \ \ \ \ \ \ \ \ \ \ \ \ \ \ \ \ \ \ \ \ \ \ \ \ \ \ \
 2013 water. sensitive. urban. design \ \ \ \ \ \ \ \ \ \ \ \ \ \ \ \ \ \ \ \ \ \ \ \ \ \ \ \ Practice Note #8 GROUND Water Smart design is the effective planning, design and building of homes, subdivisions,
3 Objectives 3 Ob jec tives
 3 Objectives 3 Objectives 3 Objectives 3 Objectives contents Objective number Page 3.1 Ki uta ki tai: mountains to the sea O1-O5 37 3.2 Beneficial use and development O6-O13 38 3.3 Māori relationships
Muskeg River Mine Dedicated Disposal Area (DDA) Plan for In-pit Cell 1
 Plan for In-pit Cell 1") Muskeg River Mine Dedicated Disposal Area (DDA) Plan for In-pit Cell 1 Updated: November 2010 Directive 74 Appendix C Requirement Approval: 8512D Submitted to SHELL CANADA ENERGY MRM DDA PLAN-UPDATE NOV
Muskeg River Mine Dedicated Disposal Area (DDA) Plan for In-pit Cell 1 Updated: November 2010 Directive 74 Appendix C Requirement Approval: 8512D Submitted to SHELL CANADA ENERGY MRM DDA PLAN-UPDATE NOV
Water Sharing Plan for the Upper Namoi and Lower Namoi Regulated River Water Sources 2016
 New South Wales Water Sharing Plan for the Upper Namoi and Lower Namoi Regulated River Water Sources 2016 under the Water Management Act 2000 I, Niall Blair, the Minister for Primary Industries, Minister
Petra Diamonds (Finsch) Storm Water Management Plan Update. Project No: PET-FIN Shangoni Management Services (Pty) Ltd
 Storm Water Management Plan Update. Project No: PET-FIN Shangoni Management Services (Pty) Ltd") Petra Diamonds (Finsch) Storm Water Management Plan Update Project No: PET-FIN-13-08-06 STORM WATER MANAGEMENT PLAN UPDATE Petra Diamonds (Finsch) Storm Water Management Plan Update Project No: PET-FIN-13-08-06
Petra Diamonds (Finsch) Storm Water Management Plan Update Project No: PET-FIN-13-08-06 STORM WATER MANAGEMENT PLAN UPDATE Petra Diamonds (Finsch) Storm Water Management Plan Update Project No: PET-FIN-13-08-06
TORO ENERGY LAKE MAITLAND DEWATERING AND WATER BALANCE REVIEW
 DATE 9 June 2015 PROJECT No. TO John Baines Toro Energy Ltd CC FROM Greg Hookey, Geneviève Marchand EMAIL ghookeyr@golder.com.au TORO ENERGY LAKE MAITLAND DEWATERING AND WATER BALANCE REVIEW 1.0 INTRODUCTION
Honeysuckle Reservoir decommissioning
 Honeysuckle Reservoir decommissioning Christopher Dwyer Earth Tech, PO Box 165 Wangaratta, 3676. Web: www.earthtech.com.au, Email: chris.dwyer@earthtech.com.au Abstract Often significant investment is
Technical Rules: Assessment Report. Clean Water Act, 2006
 Technical Rules: Assessment Report Clean Water Act, 2006 November 20, 2008 Amended on: December 12, 2008 (administrative amendments) November 16, 2009 (EBR Posting Number EBRO10-7573) Clean Water Act,
Environmental Assessment
 Tarrawonga Coal Project Environmental Assessment APPENDIX R CONCEPT DESIGN FOR LOW PERMEABILITY BARRIER AND PERMANENT GOONBRI CREEK ALIGNMENT Tarrawonga Coal Pty Ltd TARRAWONGA COAL PTY LTD TARRAWONGA
Rolleston Coal Expansion Project
 Rolleston Coal Expansion Project ÎÑÔÔÛÍÌÑÒ ÑÐÛÒ ÝËÌ ENVIRONMENTAL IMPACT STATEMENT SUMMARY BOOKLET APRIL 2014 Contents Expansion project 2 Development 3-8 of the project Public roads 9 Transport 9 Surface
Edithvale and Bonbeach Level Crossing Removal Project
 Edithvale and Bonbeach Level Crossing Removal Project Passive subsurface horizontal drain Peer Review Kim Chan Work undertaken and general comments Scope of my review in relation to the Edithvale project: