Engenharia e Tecnologia Espaciais ETE Engenharia e Gerenciamento de Sistemas Espaciais
|
|
|
- Hugh Bond
- 6 years ago
- Views:
Transcription


1 Engenharia e Tecnologia Espaciais ETE Engenharia e Gerenciamento de Sistemas Espaciais SITEMA DE GESTÃO DA QUALIDADE SEIS SIGMA
 Controle Estatístico de Processos (cont.")
2 SUMÁRIO Introdução ao Sistema de Gestão da Qualidade SEIS SIGMA (6σ) Controle Estatístico de Processos (cont.) 14/12/2009 2
3 WHAT IS STATISTICAL QUALITY CONTROL? Statistical quality control (SQC) is the term used to describe the set of statistical tools used by quality professionals. Statistical quality control can be divided into three broad categories: 14/12/2009 3
4 1. Descriptive statistics are used to describe quality characteristics and relationships. Included are statistics such as the mean, standard deviation, the range, and a measure of the distribution of data. 2. Statistical process control (SPC) involves inspecting a random sample of the output from a process and deciding whether the process is producing products with characteristics that fall within a predetermined range. SPC answers the question of whether the process is functioning properly or not. 3. Acceptance sampling is the process of randomly inspecting a sample of goods and deciding whether to accept the entire lot based on the results. Acceptance sampling determines whether a batch of goods should be accepted or rejected. 14/12/2009 4
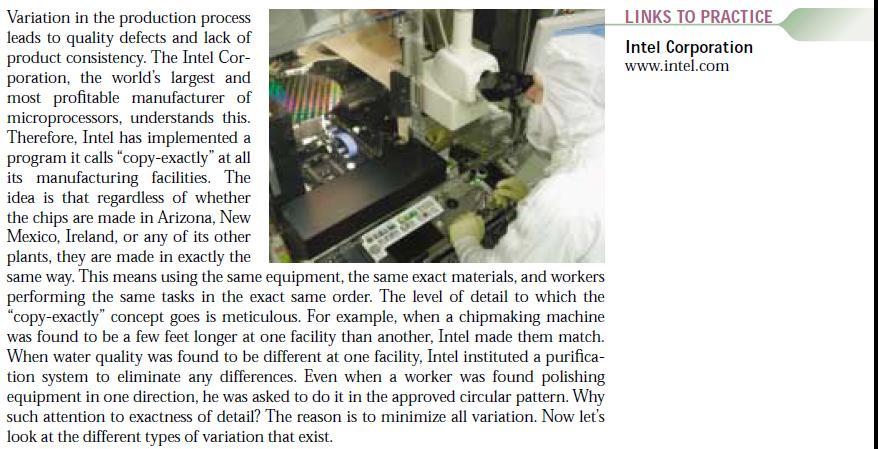
5 All three of these statistical quality control categories are helpful in measuring and evaluating the quality of products or services. Statistical process control (SPC) tools are used most frequently to identify quality problems during the production process. Variation in the production process leads to quality defects and lack of product consistency. 14/12/2009 5
6 14/12/2009 6
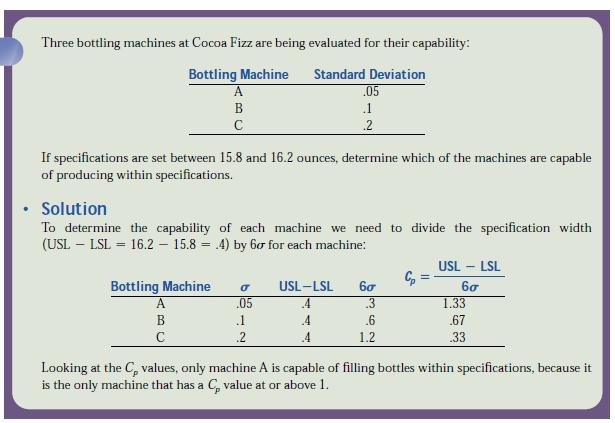
7 SOURCES OF VARIATION: COMMON AND ASSIGNABLE CAUSES Common causes of variation are due to random causes that we cannot identify. These types of variation are unavoidable and lead to slight differences in processing. These are called common, or random, causes of variation. An important task in quality control is to find out the range of natural random variation in a process. For example, if the average bottle of a soft drink called Cocoa Fizz contains 16 ounces of liquid, we may determine that the amount of natural variation is between 15.8 and 16.2 ounces. If this were the case, we would monitor the production process to make sure that the amount stays within this range. If production goes out of this range bottles are found to contain on average 15.6 ounces this would lead us to believe that there is a problem with the process because the variation is greater than the natural random variation. 14/12/2009 7
8 The second type of variation that can be observed involves variations where the causes can be precisely identified and eliminated. These are called assignable causes of variation. Examples of this type of variation are poor quality in raw materials, an employee who needs more training, or a machine in need of repair. In each of these examples the problem can be identified and corrected. Also, if the problem is allowed to persist, it will continue to create a problem in the quality of the product. In the example of the soft drink bottling operation, bottles filled with 15.6 ounces of liquid would signal a problem. The machine may need to be readjusted. This would be an assignable cause of variation. We can assign the variation to a particular cause (machine needs to be readjusted) and we can correct the problem (readjust the machine). 14/12/2009 8
9 DESCRIPTIVE STATISTICS Descriptive statistics can be helpful in describing certain characteristics of a product and a process. The most important descriptive statistics are measures of central tendency such as the mean, measures of variability such as the standard deviation and range, and measures of the distribution of data. We first review these descriptive statistics and then see how we can measure their changes. 14/12/2009 9
10 The Mean To compute the mean we simply sum all the observations and divide by the total number of observations. The equation for computing the mean is 14/12/
11 The Range and Standard Deviation There are two measures that can be used to determine the amount of variation in the data. The first measure is the range, which is the difference between the largest and smallest observations. Another measure of variation is the standard deviation. The equation for computing the standard deviation is 14/12/

12 Small values of the range and standard deviation mean that the observations are closely clustered around the mean. Large values of the range and standard deviation mean that the observations are spread out around the mean. 14/12/
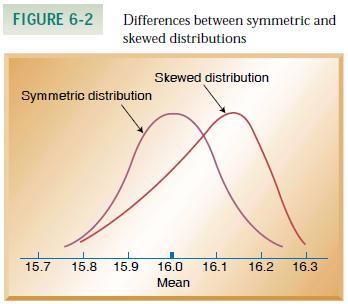
13 Distribution of Data A third descriptive statistic used to measure quality characteristics is the shape of the distribution of the observed data. When a distribution is symmetric, there are the same number of observations below and above the mean. This is what we commonly find when only normal variation is present in the data. When a disproportionate number of observations are either above or below the mean, we say that the data has a skewed distribution. 14/12/
14 14/12/
15 STATISTICAL PROCESS CONTROL METHODS Statistical process control methods extend the use of descriptive statistics to monitor the quality of the product and process. There are common and assignable causes of variation in the production of every product. Using statistical process control we want to determine the amount of variation that is common or normal. Then we monitor the production process to make sure production stays within this normal range. That is, we want to make sure the process is in a state of control. The most commonly used tool for monitoring the production process is a control chart. Different types of control charts are used to monitor different aspects of the production process. In this section we will learn how to develop and use control charts. 14/12/
16 Developing Control Charts A control chart (also called process chart or quality control chart) is a graph that shows whether a sample of data falls within the common or normal range of variation. A control chart has upper and lower control limits that separate common from assignable causes of variation. The common range of variation is defined by the use of control chart limits. We say that a process is out of control when a plot of data reveals that one or more samples fall outside the control limits. 14/12/
 is the maximum acceptable variation from the mean for a process that is in a state of control.")
17 The centerline (CL) of the control chart is the mean, or average, of the quality characteristic that is being measured. The upper control limit (UCL) is the maximum acceptable variation from the mean for a process that is in a state of control. Similarly, the lower control limit (LCL) is the minimum acceptable variation from the mean for a process that is in a state of control. 14/12/
18 The upper and lower control limits on a control chart are usually set at +-3 standard deviations from the mean. If we assume that the data exhibit a normal distribution, these control limits will capture percent of the normal variation. Control limits can be set at +-2 standard deviations from the mean. In that case, control limits would capture percent of the values. 14/12/

19 Looking at Figure 6-4, we can conclude that observations that fall outside the set range represent assignable causes of variation. However, there is a small probability that a value that falls outside the limits is still due to normal variation. This is called Type I error, with the error being the chance of concluding that there are assignable causes of variation when only normal variation exists. 14/12/
20 Another name for this is alpha risk (_), where alpha refers to the sum of the probabilities in both tails of the distribution that falls outside the confidence limits. The chance of this happening is given by the percentage or probability represented by the shaded areas of Figure 6-5. For limits of +-3 standard deviations from the mean, the probability of a Type I error is.26% (100% %), whereas for limits of +-2 standard deviations it is 4.56% (100% %). 14/12/
21 Types of Control Charts Control charts are one of the most commonly used tools in statistical process control. They can be used to measure any characteristic of a product, such as the weight of a cereal box, the number of chocolates in a box, or the volume of bottled water. The different characteristics that can be measured by control charts can be divided into two groups: variables and attributes. A control chart for variables is used to monitor characteristics that can be measured and have a continuum of values, such as height, weight, or volume. A control chart for attributes, on the other hand, is used to monitor characteristics that have discrete values and can be counted. Often they can be evaluated with a simple yes or no decision. Examples include color, taste, or smell. 14/12/
22 CONTROL CHARTS FOR VARIABLES Two of the most commonly used control charts for variables monitor both the central tendency of the data (the mean) and the variability of the data (either the standard deviation or the range). Note that each chart monitors a different type of information. When observed values go outside the control limits, the process is assumed not to be in control. Production is stopped, and employees attempt to identify the cause of the problem and correct it. 14/12/
23 Mean (x-bar) Charts A mean control chart is often referred to as an x-bar chart. It is used to monitor changes in the mean of a process. To construct a mean chart we first need to construct the center line of the chart. To do this we take multiple samples and compute their means. Usually these samples are small, with about four or five observations. Each sample has its own mean. The center line of the chart is then computed as the mean of all N sample means, where N is the number of samples: N N 14/12/

24 To construct the upper and lower control limits of the chart, we use the following formulas: 14/12/
25 Range (R) Charts Range (R) charts are another type of control chart for variables. Whereas x-bar charts measure shift in the central tendency of the process, range charts monitor the dispersion or variability of the process. The method for developing and using R-charts is the same as that for x-bar charts. The center line of the control chart is the average range, and the upper and lower control limits are computed as follows: where values for D4 and D3 are obtained from the Table. 14/12/
26 Using Mean and Range Charts Together You can see that mean and range charts are used to monitor different variables. The mean or x-bar chart measures the central tendency of the process, whereas the range chart measures the dispersion or variance of the process. Since both variables are important, it makes sense to monitor a process using both mean and range charts. 14/12/

27 14/12/
28 CONTROL CHARTS FOR ATTRIBUTES Control charts for attributes are used to measure quality characteristics that are counted rather than measured. Two of the most common types of control charts for attributes are p-charts and c-charts. P-charts are used to measure the proportion of items in a sample that are defective. Examples are the proportion of broken cookies in a batch and the proportion of cars produced with a misaligned fender. P-charts are appropriate when both the number of defectives measured and the size of the total sample can be counted. A proportion can then be computed and used as the statistic of measurement. 14/12/
29 C-charts count the actual number of defects. For example, we can count the number of complaints from customers in a month, the number of bacteria on a Petri dish, or the number of barnacles on the bottom of a boat. However, we cannot compute the proportion of complaints from customers, the proportion of bacteria on a Petri dish, or the proportion of barnacles on the bottom of a boat. 14/12/
30 P-Charts The center line is computed as the average proportion defective in the population. This is obtained by taking a number of samples of observations at random and computing the average value of p across all samples. To construct the upper and lower control limits for a p-chart, we use the following formulas: As with the other charts, z is selected to be either 2 or 3 standard deviations, depending on the amount of data we wish to capture in our control limits. 14/12/
31 Usually, however, they are set at 3. The sample standard deviation is computed as follows: where n is the sample size. 14/12/
32 C-CHARTS C-charts are used to monitor the number of defects per unit. Examples are the number of returned meals in a restaurant, the number of trucks that exceed their weight limit in a month, the number of discolorations on a square foot of carpet, and the number of bacteria in a milliliter of water. Note that the types of units of measurement we are considering are a period of time, a surface area, or a volume of liquid. The average number of defects, is the center line of the control chart. The upper and lower control limits are computed as follows: 14/12/
33 PROCESS CAPABILITY So far we have discussed ways of monitoring the production process to ensure that it is in a state of control and that there are no assignable causes of variation. A critical aspect of statistical quality control is evaluating the ability of a production process to meet or exceed preset specifications. This is called process capability. To be capable of producing an acceptable product, the process variation cannot exceed the preset specifications. Process capability thus involves evaluating process variability relative to preset product specifications in order to determine whether the process is capable of producing an acceptable product. In this section we will learn how to measure process capability. 14/12/
34 Measuring Process Capability Simply setting up control charts to monitor whether a process is in control does not guarantee process capability. To produce an acceptable product, the process must be capable and in control before production begins. Let s say that the specification for the acceptable volume of liquid is preset at 16 ounces +-.2 ounces, which is 15.8 and 16.2 ounces. 14/12/
35 14/12/
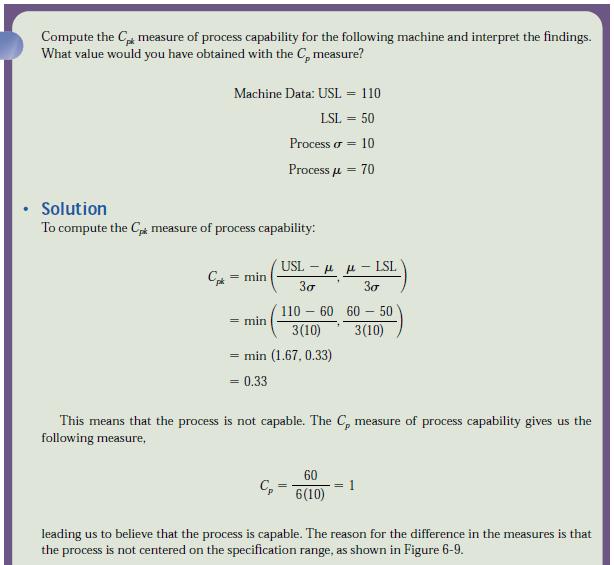
36 Process capability is measured by the process capability index, Cp, which is computed as the ratio of the specification width to the width of the process variability: 14/12/
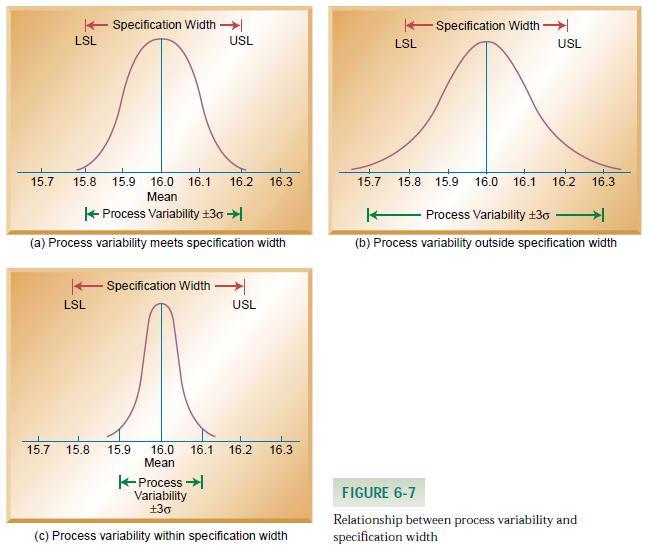
37 There are three possible ranges of values for Cp that also help us interpret its value: Cp = 1: A value of Cp equal to 1 means that the process variability just meets specifications, as in Figure 6-7(a). We would then say that the process is minimally capable. Cp < 1: A value of Cp below 1 means that the process variability is outside the range of specification, as in Figure 6-7(b). This means that the process is not capable of producing within specification and the process must be improved. Cp > 1: A value of Cp above 1 means that the process variability is tighter than specifications and the process exceeds minimal capability, as in Figure 6-7(c). 14/12/
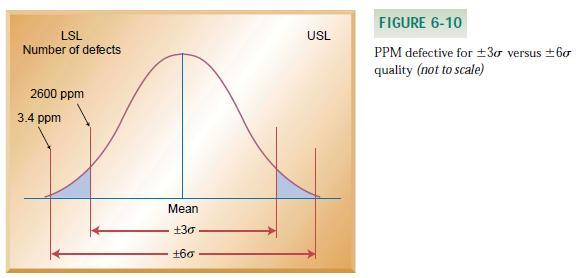
38 A Cp value of 1 means that percent of the products produced will fall within the specification limits. This also means that.26 percent (100% %) of the products will not be acceptable. Although this percentage sounds very small, when we think of it in terms of parts per million (ppm) we can see that it can still result in a lot of defects. The number.26 percent corresponds to 2600 parts per million (ppm) defective ( ,000,000). That number can seem very high if we think of it in terms of 2600 wrong prescriptions out of a million, or 2600 incorrect medical procedures out of a million, or even 2600 malfunctioning aircraft out of a million. You can see that this number of defects is still high. The way to reduce the ppm defective is to increase process capability. 14/12/
39 14/12/
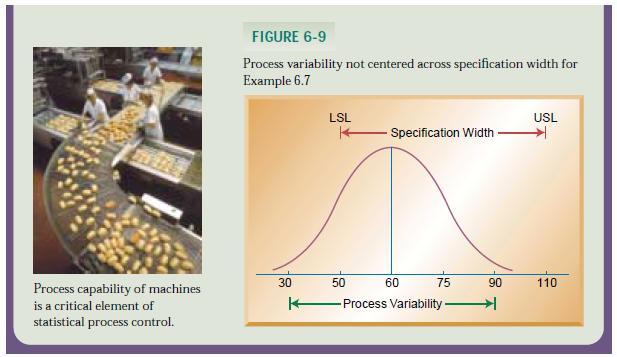
40 Cp is valuable in measuring process capability. However, it has one shortcoming: it assumes that process variability is centered on the specification range. Unfortunately, this is not always the case. 14/12/
41 The Cp value of 1.00 leads us to conclude that the process is capable. However, from the graph you can see that the process is not centered on the specification range, and is producing out-ofspec products. Using only the Cp measure would lead to an incorrect conclusion in this case. Because of this, another measure for process capability is used more frequently: 14/12/
42 Computing Cpk gives us a different answer and leads us to a different conclusion: The computed Cpk value is less than 1, revealing that the process is not capable. 14/12/
43 14/12/
44 14/12/
45 Six Sigma Quality The term Six Sigma was coined by the Motorola Corporation in the 1980s to describe the high level of quality the company was striving to achieve. Sigma (σ) stands for the number of standard deviations of the process. Recall that +-3 sigma (σ) means that 2600 ppm are defective. The level of defects associated with Six Sigma is approximately 3.4 ppm. Figure 6-10 shows a process distribution with quality levels of +-3 sigma (σ) and +-6 sigma (σ). You can see the difference in the number of defects produced. 14/12/
46 14/12/
47 14/12/
48 14/12/
49 ACCEPTANCE SAMPLING Acceptance sampling, the third branch of statistical quality control, refers to the process of randomly inspecting a certain number of items from a lot or batch in order to decide whether to accept or reject the entire batch. What makes acceptance sampling different from statistical process control is that acceptance sampling is performance either before or after the process, rather than during the process. Acceptance sampling before the process involves sampling materials received from a supplier, such as randomly inspecting crates of fruit that will be used in a restaurant, boxes of glass dishes that will be sold in a department store, or metal castings that will be used in a machine shop. Sampling after the process involves sampling finished items that are to be shipped either to a customer or to a distribution center. Examples include randomly testing a certain number of computers from a batch to make sure they meet operational requirements, and randomly inspecting snowboards to make sure that they are not defective. 14/12/

50 14/12/
Notes for Production and Operations Management- I
 Notes for Production and Operations Management- I Factors affecting Process Design Decisions Nature of product/service demand Degree of vertical integration Production Flexibility Degree of automation
Online Student Guide Types of Control Charts
 Online Student Guide Types of Control Charts OpusWorks 2016, All Rights Reserved 1 Table of Contents LEARNING OBJECTIVES... 4 INTRODUCTION... 4 DETECTION VS. PREVENTION... 5 CONTROL CHART UTILIZATION...
Chapter 9A. Process Capability & SPC
 1 Chapter 9A Process Capability & SPC 2 OBJECTIVES Process Variation Process Capability Process Control Procedures Variable data Attribute data Acceptance Sampling Operating Characteristic Curve 3 Basic
Statistics Quality: Control - Statistical Process Control and Using Control Charts
 Statistics Quality: Control - Statistical Process Control and Using Control Charts Processes Processing an application for admission to a university and deciding whether or not to admit the student. Reviewing
many quality problems remain invisible to consumers
 Quality Management 1. Define Quality and TQM. 2. What are the ISO standards and why are they important? 3. What is Six Sigma? 4. Explain how benchmarking is used? 5. What are quality robust products and
SPECIAL CONTROL CHARTS
 INDUSTIAL ENGINEEING APPLICATIONS AND PACTICES: USES ENCYCLOPEDIA SPECIAL CONTOL CHATS A. Sermet Anagun, PhD STATEMENT OF THE POBLEM Statistical Process Control (SPC) is a powerful collection of problem-solving
Sample Mean Range
 Lesson 14 Statistical Process Control Homework Solved Problem #2: see textbook Solved Problem #4: see textbook Solved Problem #5: see textbook Solved Problem #6: see textbook (manual problem) #1: Checkout
Application of statistical tools and techniques in Quality Management
 Application of statistical tools and techniques in Quality Management Asst. Professor Dr Predrag Djordjevic University of Belgrade, Technical Faculty in Bor, Serbia QUALITY IN SOCIETY The concept was known
INDUSTRIAL ENGINEERING
 1 P a g e AND OPERATION RESEARCH 1 BREAK EVEN ANALYSIS Introduction 5 Costs involved in production 5 Assumptions 5 Break- Even Point 6 Plotting Break even chart 7 Margin of safety 9 Effect of parameters
Quality Management (PQM01) Chapter 04 - Quality Control
 Chapter 04 - Quality Control") Quality Management (PQM01) Chapter 04 - Quality Control Slide 1 Slide 2 Involves monitoring specific project results to determine if they comply with relevant quality standards, and identifying ways to
Quality Management (PQM01) Chapter 04 - Quality Control Slide 1 Slide 2 Involves monitoring specific project results to determine if they comply with relevant quality standards, and identifying ways to
Cpk. X _ LSL 3s 3s USL _ X. Cpk = Min [ Specification Width Process Spread LSL USL
 Cpk A Guide to Using a Process Capability Index Cpk = Min [ USL _ X, X _ LSL ] 3s 3s Specification Width Process Spread LSL X USL The following information is provided by the Technology Issues Committee
Address for Correspondence
 Research Paper OPTIMIZATION OF CRITICAL TO QUALITY PARAMETERS OF VERTICAL SPINDLE SURFACE GRINDER 1 Maheshkumar A. Sutar, 2 Anil R. Acharya Address for Correspondence 1 Student, 2 Professor, Government
LO1: Understand how inspection and testing methods and processes improve quality control
 Unit 19: Inspection and testing LO1: Understand how inspection and testing methods and processes improve quality control SPC moving range charts Instructions and answers for teachers These instructions
GETTING READY FOR DATA COLLECTION
 3 Chapter 7 Data Collection and Descriptive Statistics CHAPTER OBJECTIVES - STUDENTS SHOULD BE ABLE TO: Explain the steps in the data collection process. Construct a data collection form and code data
Midterm Review Summer 2009 Chapters 1 7 Stat 111
 Midterm Review Summer 2009 Chapters 1 7 Stat 111 Name FORM A Directions: Read each question carefully and answer as clearly as possible. 1. A book store wants to estimate the proportion of its customers
Developing and implementing statistical process control tools in a Jordanian company. R.H. Fouad* and Salman D. Al-Shobaki
 Int. J. Manufacturing Technology and Management, Vol. 17, No. 4, 2009 337 Developing and implementing statistical process control tools in a Jordanian company R.H. Fouad* and Salman D. Al-Shobaki Department
Testing Hypotheses. (Exercises)
") Chapter III Testing Hypotheses (Exercises) 3. 1. A tire manufacturer claims that his tires will last no less than an average of 50000 km before they need to be replaced. A consumer group wishes to challenge
Chapter III Testing Hypotheses (Exercises) 3. 1. A tire manufacturer claims that his tires will last no less than an average of 50000 km before they need to be replaced. A consumer group wishes to challenge
Chapter 7: Sampling Distributions
 Chapter 7: Sampling Distributions Section 7.3 The Practice of Statistics, 4 th edition For AP* STARNES, YATES, MOORE Chapter 7 Sampling Distributions 7.1 What is a Sampling Distribution? 7.2 Sample Proportions
Daniel Y. Peng, Ph.D.
 Using Control Charts to Evaluate Process Variability Daniel Y. Peng, Ph.D. Quality Assessment Lead Office of Process and Facility (OPF) OPQ/CDER/FDA PQRI 205 Annual Meeting North Bethesda, Maryland October
Big Data and Statistical Process Control. By Marc Schaeffers
 Big Data and Statistical Process Control By Marc Schaeffers Big Data and Statistical Process Control INTRODUCTION Companies have been applying statistical process control (SPC) techniques since 1935. SPC
CHAPTER 13: OPERATIONS MANAGEMENT Multiple Choice Questions
 CHAPTER 13: OPERATIONS MANAGEMENT Multiple Choice Questions 1. Michelle Jackson and other operations managers realized that will be needed to reduce bottlenecks and increase operational efficiency at BNSF
CHAPTER 8 T Tests. A number of t tests are available, including: The One-Sample T Test The Paired-Samples Test The Independent-Samples T Test
 CHAPTER 8 T Tests A number of t tests are available, including: The One-Sample T Test The Paired-Samples Test The Independent-Samples T Test 8.1. One-Sample T Test The One-Sample T Test procedure: Tests
CHAPTER 5: DISCRETE PROBABILITY DISTRIBUTIONS
 Discrete Probability Distributions 5-1 CHAPTER 5: DISCRETE PROBABILITY DISTRIBUTIONS 1. Thirty-six of the staff of 80 teachers at a local intermediate school are certified in Cardio- Pulmonary Resuscitation
Measurement Systems Analysis
 Measurement Systems Analysis Components and Acceptance Criteria Rev: 11/06/2012 Purpose To understand key concepts of measurement systems analysis To understand potential sources of measurement error and
NHS Improvement An Overview of Statistical Process Control (SPC) October 2011
 October 2011") NHS Improvement An Overview of Statistical Process Control (SPC) October 2011 Statistical Process Control Charts (X, Moving R Charts) What is Statistical Process Control (SPC)? We all know that measurement
NHS Improvement An Overview of Statistical Process Control (SPC) October 2011 Statistical Process Control Charts (X, Moving R Charts) What is Statistical Process Control (SPC)? We all know that measurement
PRINTABLE VERSION. Quiz 11
 You scored 100 out of 100 Question 1 PRINTABLE VERSION Quiz 11 As the length of the confidence interval for the population mean decreases, the degree of confidence in the interval's actually containing
Unit3: Foundationsforinference. 1. Variability in estimates and CLT. Sta Fall Lab attendance & lateness Peer evaluations
 Announcements Unit3: Foundationsforinference 1. Variability in estimates and CLT Sta 101 - Fall 2015 Duke University, Department of Statistical Science Lab attendance & lateness Peer evaluations Dr. Monod
Control Charts for Customer Satisfaction Surveys
 Control Charts for Customer Satisfaction Surveys Robert Kushler Department of Mathematics and Statistics, Oakland University Gary Radka RDA Group ABSTRACT Periodic customer satisfaction surveys are used
Lab Discrete Distributions
 4.2.1 Lab 8 Lab Discrete Distributions Name: Learning Objectives: Find probabilities with a table. Find binomial probabilities. Find the Mean, Variance and Standard Deviation of a Binomial Distribution.
For Questions 1 to 6, refer to the following information
 For Questions 1 to 6, refer to the following information The Box-and-Whisker plots show the results of the quiz and test for QMS102 in Fall2010 Question 1. Calculate the mode for the quiz result of QMS102
Computer Science and Software Engineering University of Wisconsin - Platteville 3. Statistical Process Control
 Computer Science and Software Engineering University of Wisconsin - Platteville 3. Statistical Process Control Yan Shi SE 3730 / CS 5730 Lecture Notes Outline About Deming and Statistical Process Control
Welcome to the course, Evaluating the Measurement System. The Measurement System is all the elements that make up the use of a particular gage.
 Welcome to the course, Evaluating the Measurement System. The Measurement System is all the elements that make up the use of a particular gage. Parts, people, the environment, and the gage itself are all
Managing Quality in Pharmaceutical Industry Using Six Sigma. Edited by Mahmoud Farouk Moussa TQM, CSSBB, MBA
 Managing Quality in Pharmaceutical Industry Using Six Sigma Edited by Mahmoud Farouk Moussa TQM, CSSBB, MBA Outlines Pharmaceutical Manufacturing Process and Drug Product Quality. Process Excellence Approach
Assignment 10 (Solution) Six Sigma in Supply Chain, Taguchi Method and Robust Design
 Six Sigma in Supply Chain, Taguchi Method and Robust Design") Assignment 10 (Solution) Six Sigma in Supply Chain, Taguchi Method and Robust Design Dr. Jitesh J. Thakkar Department of Industrial and Systems Engineering Indian Institute of Technology Kharagpur Instruction
Assignment 10 (Solution) Six Sigma in Supply Chain, Taguchi Method and Robust Design Dr. Jitesh J. Thakkar Department of Industrial and Systems Engineering Indian Institute of Technology Kharagpur Instruction
CHAPTER 2: Descriptive Statistics: Tabular and Graphical Methods Essentials of Business Statistics, 4th Edition Page 1 of 127
 2 CHAPTER 2: Descriptive Statistics: Tabular and Graphical Methods 34 Essentials of Business Statistics, 4th Edition Page 1 of 127 2.1 Learning Objectives When you have mastered the material in this chapter,
POLLUTANTS: HOW MUCH TOTAL OR HOW MUCH PER UNIT OF WATER?
 POLLUTANTS: HOW MUCH TOTAL OR HOW MUCH PER UNIT OF WATER? 9-12 OBJECTIVES The student will do the following: 1. Define the concept of concentration as different from an expression of total amount. 2. Explain
Quality Control Charts
 Quality Control Charts General Purpose In all production processes, we need to monitor the extent to which our products meet specifications. In the most general terms, there are two "enemies" of product
AP Statistics - Chapter 6,7 Quiz
 Name: Class: _ Date: _ AP Statistics - Chapter 6,7 Quiz Short Answer Scenario 6-1 The probability distribution below is for the random variable X = number of mice caught in traps during a single night
AS9100. Background - What is ISO?
 Contents Background - What is ISO? Background ISO Process Oriented Implementing QMS Transparency What s New The International Organization for Standards (ISO) is a network of the national standards institutes
A Practical Guide to Selecting the Right Control Chart
 A Practical Guide to Selecting the Right Control Chart InfinityQS International, Inc. 12601 Fair Lakes Circle Suite 250 Fairfax, VA 22033 www.infinityqs.com Introduction Control charts were invented in
Chapter 8 Producing Quality Goods and Services
 Chapter 8 Producing Quality Goods and Services 1 Explain the nature of production. 2 Outline how the conversion process transforms raw materials, labor, and other resources into finished products or services.
Chapter 7 -Control Charts for Variables. Lecturer : Asst. Prof. Dr. Emine ATASOYLU
 Chapter 7 -Control Charts for Variables Lecturer : Asst. Prof. Dr. Emine ATASOYLU Control Charts for Variables Chapter 6 Introduced the fundamentals of control charts. Chapter 7: details of control charts
Supplier Quality Manual
 Supplier Quality Manual Document No. F-PM010 Rev 3 Owner Supplier Quality Page 1 OF 11 TABLE OF CONTENTS 1.0 Purpose 3 2.0 Scope... 3 3.0 Quality System Requirements... 3 4.0 Approved Supplier List (ASL).
Monitor and Recording Method: ProAct web based monitor, record and alert system by AgriService.
 CIP WASH SYSTEMS Reference: Keep the Clean Clean, CL-24 to CL-29 Monitor and Recording Method: ProAct web based monitor, record and alert system by AgriService. Risk Reduction: We and the technicians are
Case Study of Process Variation in a Steel Tube Manufacturing Industry
 IJSD - International Journal for Scientific esearch & Development Vol. 3, Issue 04, 2015 ISSN (online): 2321-0613 Case Study of Process Variation in a Steel Tube Manufacturing Industry Gajendra Patidar
Applying ISO 9001 to making cookies
 Applying ISO 9001 to making cookies How does ISO 9001:2015 apply to a business? Let s say you make cookies First, the standard doesn t consider the actual quality of the cookie, you and your customers
Quality Assurance Programme - raw meat for further processing plants supplying a fast food chain
 Quality Assurance Programme - raw meat for further processing plants supplying a fast food chain F. EHINGER Röntgenstr. 5, 89312 Günzburg, Germany ehingerf@esca-foodsolutions.de Keywords: quality; meat
UPPLIER ANUAL. Issued: 01 Aug 13
 UPPLIER ANUAL Issued: 01 Aug 13 Table of Contents Our Company 3 Our Vision 3 Scope and Purpose 4 Responsibilities 4 General Expectations and Requirements 5 Supplier Quality Management System 6 Supplier
CHAPTER 4 FAILURE MODE AND EFFECTS ANALYSIS (FMEA) CASE STUDY
 CASE STUDY") 55 CHAPTER 4 FAILURE MODE AND EFFECTS ANALYSIS (FMEA) CASE STUDY FMEA is a proactive analysis tool, allowing engineers to anticipate failure modes even before they happen, or even before a new product
55 CHAPTER 4 FAILURE MODE AND EFFECTS ANALYSIS (FMEA) CASE STUDY FMEA is a proactive analysis tool, allowing engineers to anticipate failure modes even before they happen, or even before a new product
Type III is most commonly used Paste. Finer pitch devices generally require finer metal particle sizes
 Benefits of SPI Use Powder Particle Size Effects of Changes in Particle Size Distribution Type III is most commonly used Paste. Finer pitch devices generally require finer metal particle sizes Disadvantages
A is used to answer questions about the quantity of what is being measured. A quantitative variable is comprised of numeric values.
 Stats: Modeling the World Chapter 2 Chapter 2: Data What are data? In order to determine the context of data, consider the W s Who What (and in what units) When Where Why How There are two major ways to
THE INTERNATIONAL UNIVERSITY (IU) Department of Industrial System Engineering
 Department of Industrial System Engineering") MIDTERM EXAMINATION Head of Department of Industrial & Systems Engineering QUALITY MANAGEMENT Duration: 120 minutes Lecturer: Student ID: Date: Mar. 21, 2013 Name: Assoc Prof. Ho Thanh Phong Luu Van Thanh
MIDTERM EXAMINATION Head of Department of Industrial & Systems Engineering QUALITY MANAGEMENT Duration: 120 minutes Lecturer: Student ID: Date: Mar. 21, 2013 Name: Assoc Prof. Ho Thanh Phong Luu Van Thanh
Copyright 2000 Society of Manufacturing Engineers MANUFACTURING INSIGHTS. An Introduction to Lean Manufacturing
 MANUFACTURING INSIGHTS An Introduction to Lean Manufacturing WARNING federal law provides severe civil and criminal penalties for the unauthorized reproduction, distribution or exhibition of copyrighted
To provide a framework and tools for planning, doing, checking and acting upon audits
 Document Name: Prepared by: Quality & Risk Unit Description Audit Process The purpose of this policy is to develop and sustain a culture of best practice in audit through the use of a common framework
Information and Practice Leaflet
 Information and Practice Leaflet Verbal and Numerical Reasoning Tests Why are tests used? Ability or aptitude tests are increasingly being used in the world of work to assess the key skills relevant to
The Dummy s Guide to Data Analysis Using SPSS
 The Dummy s Guide to Data Analysis Using SPSS Univariate Statistics Scripps College Amy Gamble April, 2001 Amy Gamble 4/30/01 All Rights Rerserved Table of Contents PAGE Creating a Data File...3 1. Creating
Overview of Statistics used in QbD Throughout the Product Lifecycle
 Overview of Statistics used in QbD Throughout the Product Lifecycle August 2014 The Windshire Group, LLC Comprehensive CMC Consulting Presentation format and purpose Method name What it is used for and/or
Experimental Design Day 2
 Experimental Design Day 2 Experiment Graphics Exploratory Data Analysis Final analytic approach Experiments with a Single Factor Example: Determine the effects of temperature on process yields Case I:
Statistical Measurement System Analysis of Ruston TA1750 Gas Turbine 1st Stage Nozzle
 Statistical Measurement System Analysis of Ruston TA1750 Gas Turbine 1st Stage Nozzle R.SHOJAEI, M.SOHRABI, M.A.AMJADI Research centre on manufacturing and production Mavadkaran Engineering Co. (MAPNA
Tech 149: Unit 4 Lecture. Network Systems, Quality Systems, Manufacturing Planning, Control and Scheduling in CIM Environment
 Tech 149: Unit 4 Lecture Network Systems, Quality Systems, Manufacturing Planning, Control and Scheduling in CIM Environment Network Systems in CIM For Connectivity and Communications in: CAD/CAM, CAE,
Accounting Information Systems, 12e (Romney/Steinbart) Chapter 14 The Production Cycle
 Chapter 14 The Production Cycle") Accounting Information Systems, 12e (Romney/Steinbart) Chapter 14 The Production Cycle 1) The AIS compiles and feeds information among the business cycles. What is the relationship between the revenue
Accounting Information Systems, 12e (Romney/Steinbart) Chapter 14 The Production Cycle 1) The AIS compiles and feeds information among the business cycles. What is the relationship between the revenue
- Rev 4 Date
 Product Safety Management Manual - Rev 4 Date 10.05.2013 - Revision Index Revision no Change description Date 0 Initial release 30.12.2008 1 Part identification guidelines for traceability 25.07.2009 included
8. Researchers from a tire manufacturer want to conduct an experiment to compare tread wear of a new type of tires with the old design.
 AP Stats Review HW #7 MULTIPLE CHOICE. 1. The parallel boxplots below represent the amount of money collected (in dollars) in a 1-day fundraiser from each of 16 boys and 16 girls in a certain neighborhood
Descriptive Statistics Tutorial
 Descriptive Statistics Tutorial Measures of central tendency Mean, Median, and Mode Statistics is an important aspect of most fields of science and toxicology is certainly no exception. The rationale behind
Introduction. Project Scheduling. Morgan State University ARCH 738: REAL ESTATE PROJECT MANAGEMENT. Jason E. Charalambides, PhD, M.
 Project Scheduling ARCH 738: REAL ESTATE PROJECT MANAGEMENT Morgan State University Jason E. Charalambides, PhD, M.ASCE, AIA, ENV_SP (This material has been prepared for educational purposes) Introduction
Examining the New SQF Quality Code: How to Comply by the January Deadline
 Examining the New SQF Quality Code: How to Comply by the January Deadline Frank Schreurs, Regional Representative, Safe Quality Food Institute Jeff Chilton, VP of Professional Services, Alchemy Systems
Six Sigma Dictionary
 Six Sigma Dictionary # 4M / 5M / 6M Framework for root cause brainstorming. Categorizes root causes by: Man, Methods, Machines, Material, (5M) Mother Nature and (6M) Measurement System Impact 8D Process
THE LEAD PROFILE AND OTHER NON-PARAMETRIC TOOLS TO EVALUATE SURVEY SERIES AS LEADING INDICATORS
 THE LEAD PROFILE AND OTHER NON-PARAMETRIC TOOLS TO EVALUATE SURVEY SERIES AS LEADING INDICATORS Anirvan Banerji New York 24th CIRET Conference Wellington, New Zealand March 17-20, 1999 Geoffrey H. Moore,
Monitoring of the Production Process in Mass Production of Dimensionally Accurate Products
 Monitoring of the Production Process in Mass Production of Dimensionally Accurate Products Jozef Dobránsky 1, Juraj Ružbarský 1, Dušan Manduľák 2, Eva Vojnová 2 1 Technical University of Košice, Faculty
PRACTICE PROBLEM SET Topic 1: Basic Process Analysis
 The Wharton School Quarter II The University of Pennsylvania Fall 1999 PRACTICE PROBLEM SET Topic 1: Basic Process Analysis Problem 1: Consider the following three-step production process: Raw Material
helps balance supply and demand for recreation with other resources, and enables us to provide what people want.
 Part I Designing A Sampling Plan Part 3 of 9 Importance of Estimating Recreation Use The USDA Forest Service is the largest provider of public outdoor recreation in the United States. The objective of
August 24, Jean-Philippe Mathevet IAQG Performance Stream Leader SAFRAN Paris, France. Re: 2014 Supplier Performance Data Summary
 Page 1 of 27 August 24, 2105 Jean-Philippe Mathevet IAQG Performance Stream Leader SAFRAN Paris, France Re: 2014 Supplier Performance Data Summary Dear Jean-Philippe: The following report is a summary
Teacher's Guide. Lesson Four. Shopping Wisely 04/09
 Teacher's Guide $ Lesson Four Shopping Wisely 04/09 shopping wisely websites websites for shopping wisely The internet is probably the most extensive and dynamic source of information in our society. The
AP Stats ~ Lesson 8A: Confidence Intervals OBJECTIVES:
 AP Stats ~ Lesson 8A: Confidence Intervals OBJECTIVES: DETERMINE the point estimate and margin of error from a confidence interval. INTERPRET a confidence interval in context. INTERPRET a confidence level
For Demonstrations: Automatic Data Collection So Simple The Graphs Just Appear
 For Demonstrations: 800.875.4243 S P C S O F T W A R E S I N C E 1 9 8 3 Automatic Data Collection So Simple The Graphs Just Appear D A T A C O L L E C T I O N / A N A L Y S I S S O F T W A R E QC-CALC
Elior review dishes up savings
 Resource efficiencies in facilities management Elior review dishes up savings Elior s catering operation at the MOD s Bovington site was achieving impressively low levels of production food waste, but
Quality Manual ISO 9001:2000
 Quality Manual ISO 9001:2000 Page 2 of 23 TABLE OF CONTENTS COVER PAGE...1 TABLE OF CONTENTS...2 SIGNATURES...3 QUALITY POLICY...4 INTRODUCTION...5 CORPORATE PROFILE...9 4.O QUALITY MANAGEMENT SYSTEM...10
KAN GUIDE ON MEASUREMENT ASSURANCE
 KAN-G-06 KAN GUIDE ON MEASUREMENT ASSURANCE Issue Number : 3 April 2016 Komite Akreditasi Nasional National Accreditation Body of Indonesia Gedung I BPPT, Lt. 14 Jl. MH Thamrin No. 8, Kebon Sirih, Jakarta
Agilent Technologies
 Η Supplier Performance Agilent Technologies Supplier Performance Technology Quality Responsiveness Delivery Cost Environment Agilent Restricted 2000 TABLE OF CONTENTS Introduction... 3 Technology... 4
PRESENTING DATA ATM 16% Automated or live telephone 2% Drive-through service at branch 17% In person at branch 41% Internet 24% Banking Preference
 Presenting data 1 2 PRESENTING DATA The information that is collected must be presented effectively for statistical inference. Categorical and numerical data can be presented efficiently using charts and
Unit QUAN Session 6. Introduction to Acceptance Sampling
 Unit QUAN Session 6 Introduction to Acceptance Sampling MSc Strategic Quality Management Quantitative methods - Unit QUAN INTRODUCTION TO ACCEPTANCE SAMPLING Aims of Session To introduce the basic statistical
Describing DSTs Analytics techniques
 Describing DSTs Analytics techniques This document presents more detailed notes on the DST process and Analytics techniques 23/03/2015 1 SEAMS Copyright The contents of this document are subject to copyright
Acceptance Sampling Using Statgraphics Centurion. Presented by Dr. Neil W. Polhemus
 Acceptance Sampling Using Statgraphics Centurion Presented by Dr. Neil W. Polhemus Acceptance Sampling Given a lot or batch containing N items, a decision to accept or reject the lot is made based on statistical
9. Verification, Validation, Testing
 9. Verification, Validation, Testing (a) Basic Notions (b) Dynamic testing. (c) Static analysis. (d) Modelling. (e) Environmental Simulation. (f) Test Strategies. (g) Tool support. (h) Independent Verification
Which 750" ml bottle of coke would you pick?
 Which 750" ml bottle of coke would you pick? You have recognized the variability of the 750" ml coke pop bottle process! What are the sources of the variability? Which process is the more variable? You
Process Mapping. You cannot improve a process until everyone agrees on what the process is.
 Process Mapping You cannot improve a process until everyone agrees on what the process is. 1 Topics I. What is a Process Map? II. III. IV. Types of Process Maps A. Process Flow Chart B. SIPOC Diagram C.
Direct Store Delivery for Consumer Products Companies
 SAP Direct Store Delivery Direct Store Delivery for Consumer Products Companies Direct store delivery, often referred to as DSD, is a sales and distribution model that integrates territory and account
Why Learn Statistics?
 Why Learn Statistics? So you are able to make better sense of the ubiquitous use of numbers: Business memos Business research Technical reports Technical journals Newspaper articles Magazine articles Basic
Chapter 14. Waiting Lines and Queuing Theory Models
 Chapter 4 Waiting Lines and Queuing Theory Models To accompany Quantitative Analysis for Management, Tenth Edition, by Render, Stair, and Hanna Power Point slides created by Jeff Heyl 2008 Prentice-Hall,
Skills we've learned
 8 2 Data Gathering Skills we've learned Use the data set for 1 and 3 6:{9, 4, 7, 8, 5, 8, 24, 5} 1. Find the mean, median, and mode. 2. Make a box and whisker plot of the data and find the interquartile
Investigating Out of Trend Results (OOT s) Dr. Pradeep Nagalkar Head Quality Control (Bio. & Chem.) Haffkine Bio-Pharma. Corp. Ltd.
 Dr. Pradeep Nagalkar Head Quality Control (Bio. & Chem.) Haffkine Bio-Pharma. Corp. Ltd.") Dr. Pradeep Nagalkar Head Quality Control (Bio. & Chem.) Haffkine Bio-Pharma. Corp. Ltd., Mumbai - We will be discussing - 1. What is OOT & OOS. - 2. Examples of OOT & OOS. - 3. Regulatory issues - 4.
Dr. Pradeep Nagalkar Head Quality Control (Bio. & Chem.) Haffkine Bio-Pharma. Corp. Ltd., Mumbai - We will be discussing - 1. What is OOT & OOS. - 2. Examples of OOT & OOS. - 3. Regulatory issues - 4.
Student Activities. Lesson Four. Shopping Wisely 04/09
 Student Activities $ Lesson Four Shopping Wisely 04/09 comparing choices Compare your choices for buying soft drinks and clothing items using the charts below. Soft Drink One Can vending machine brand
PLANNING AND CONTROL FOR A WARRANTY SERVICE FACILITY
 Proceedings of the 2 Winter Simulation Conference M. E. Kuhl, N. M. Steiger, F. B. Armstrong, and J. A. Joines, eds. PLANNING AND CONTROL FOR A WARRANTY SERVICE FACILITY Amir Messih Eaton Corporation Power
RESEARCH PAPERS FACULTY OF MATERIALS SCIENCE AND TECHNOLOGY IN TRNAVA SLOVAK UNIVERSITY OF TECHNOLOGY IN BRATISLAVA
 RESEARCH PAPERS FACULTY OF MATERIALS SCIENCE AND TECHNOLOGY IN TRNAVA SLOVAK UNIVERSITY OF TECHNOLOGY IN BRATISLAVA 202 Special Number THE STATISTICAL REGULATION OF THE TURNING PROCESS Katarína LESTYÁNSZKA
Process Control Optimization Manual
 Process Control Optimization Manual Skyworks Solutions, Inc. 20 Sylvan Road Woburn, MA 01801 Tel: 781-376-3000 Page 1 of 30 Skyworks SQ03-0360 Rev 5 Table of Contents 1 Purpose and Scope... 4 1.1 Purpose...
PROCESS COSTING FIRST-IN FIRST-OUT METHOD
 PROCESS COSTING FIRST-IN FIRST-OUT METHOD Key Terms and Concepts to Know Differences between Job-Order Costing and Processing Costing Process costing is used when a single product is made on a continuous
Use and interpretation of statistical quality control charts
 International Journal for Quality in Health Care 1998; Volume 10, Number I: pp. 69-73 Methodology matters VIII 'Methodology Matters' is a series of intermittently appearing articles on methodology. Suggestions
Overcosting and Undercosting (Example 1 at the end of these notes)
") Chapter 5 Activity-Based Costing Overcosting and Undercosting (Example 1 at the end of these notes) Distortions from inaccurate costing Activities/Resources/Cost Drivers Steps in ABC Identify resources
Chapter 5 Activity-Based Costing Overcosting and Undercosting (Example 1 at the end of these notes) Distortions from inaccurate costing Activities/Resources/Cost Drivers Steps in ABC Identify resources
More-Advanced Statistical Sampling Concepts for Tests of Controls and Tests of Balances
 APPENDIX 10B More-Advanced Statistical Sampling Concepts for Tests of Controls and Tests of Balances Appendix 10B contains more mathematical and statistical details related to the test of controls sampling
Business Intelligence, 4e (Sharda/Delen/Turban) Chapter 2 Descriptive Analytics I: Nature of Data, Statistical Modeling, and Visualization
 Chapter 2 Descriptive Analytics I: Nature of Data, Statistical Modeling, and Visualization") Business Intelligence, 4e (Sharda/Delen/Turban) Chapter 2 Descriptive Analytics I: Nature of Data, Statistical Modeling, and Visualization 1) One of SiriusXM's challenges was tracking potential customers
Business Intelligence, 4e (Sharda/Delen/Turban) Chapter 2 Descriptive Analytics I: Nature of Data, Statistical Modeling, and Visualization 1) One of SiriusXM's challenges was tracking potential customers