Chapter 9A. Process Capability & SPC
|
|
|
- Arline Floyd
- 6 years ago
- Views:
Transcription
1 1 Chapter 9A Process Capability & SPC
2 2 OBJECTIVES Process Variation Process Capability Process Control Procedures Variable data Attribute data Acceptance Sampling Operating Characteristic Curve
3 3 Basic Forms of Variation Assignable variation is caused by factors that can be clearly identified and possibly managed Example: A poorly trained employee that creates variation in finished product output. Common variation is inherent in the production process Example: A molding process that always leaves burrs or flaws on a molded item.
4 Taguchi s View of Variation 4 Traditional view is that quality within the LS and US is good and that the cost of quality outside this range is constant, where Taguchi views costs as increasing as variability increases, so seek to achieve zero defects and that will truly minimize quality costs. High High Incremental Cost of Variability Incremental Cost of Variability Zero Zero Lower Spec Target Spec Upper Spec Lower Spec Target Spec Upper Spec Traditional View Taguchi s View
5 Process Capability 5 Process limits Specification limits How do the limits relate to one another?
6 6 Process Capability Index, C pk Capability Index shows how well parts being produced fit into design limit specifications. C pk = min X LTL UTL - X or 3 3 As a production process produces items small shifts in equipment or systems can cause differences in production performance from differing samples. Shifts in Process Mean
7 Process Capability A Standard Measure of How Good a Process Is. 7 A simple ratio: Specification Width Actual Process Width Generally, the bigger the better.
8 8 Process Capability C pk Min X LTL UTL X ; 3 3 This is a one-sided Capability Index Concentration on the side which is closest to the specification - closest to being bad
9 Coffee Bean Bag Example 9 Ron Valdez Café roasts and nationally distributes 16 ounce bags of coffee beans. The Omaha World Herald has just published an article that claims that the bags frequently have less than 15 ounces of coffee beans in out 16 ounce bags. Let s assume that the government says that we must be within ± 5 percent of the weight advertised on the bag. Upper Tolerance Limit = (16) = 16.8 ounces Lower Tolerance Limit = 16.05(16) = 15.2 ounces We go out and buy 1,000 bags of coffee beans and find that they weight an average of ounces with a standard deviation of.347 ounces.
10 Cereal Box Process Capability 10 Specification or Tolerance Limits Upper Spec = 16.8 oz Lower Spec = 15.2 oz Observed Weight Mean = oz Std Dev =.347 oz C pk X Min LTL UTL X ; Min ; 3(.347) 3(.347) C pk Min.867;.670 C pk C pk.670

11 11 What does a C pk of.670 mean? An index that shows how well the units being produced fit within the specification limits. This is a process that will produce a relatively high number of defects. Many companies look for a C pk of 1.3 or better 6-Sigma company wants 2.0! Cpk < 1 The process is not capable Cpk = 1 The process is just capable Cpk > 1 The process is capable C pk DPMO , , ,540 LTL UTL
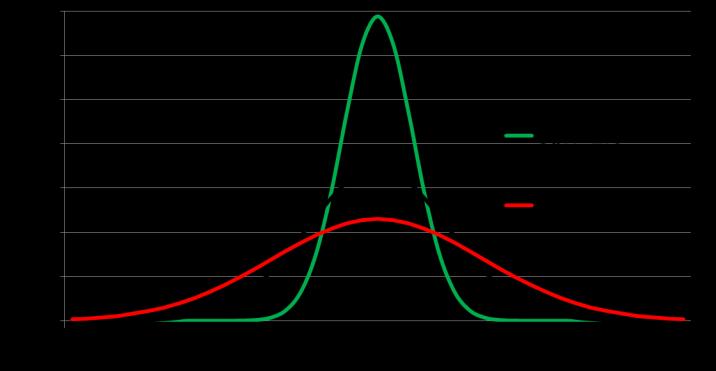

12 12 Cpx comparison =.116 =.347 LTL UTL
13 Types of Statistical Sampling 13 Attribute (Go or no-go information) Defectives refers to the acceptability of product across a range of characteristics. Defects refers to the number of defects per unit which may be higher than the number of defectives. p-chart application
14 Types of Statistical Sampling 14 Variable (Continuous) Usually measured by the mean and the standard deviation. X-bar and R chart applications
15 Statistical Process Control (SPC) Charts Normal Behavior UCL LCL 15 UCL Samples over time Possible problem, investigate LCL UCL Samples over time Possible problem, investigate LCL Samples over time
16 16 Control Limits are based on the Normal Curve x m z Standard deviation units or z units.
17 Control Limits 17 We establish the Upper Control Limits (UCL) and the Lower Control Limits (LCL) with plus or minus 3 standard deviations from some x-bar or mean value. Based on this we can expect 99.7% of our sample observations to fall within these limits. LCL 99.7% UCL x


18 18 Define the problem CTQ Critical to Quality The number of chocolate chips in each cookie. Define a consistent way to count the chocolate chip.
19 Sample Sample Information Cookie Range Defective n= = R = = R= 19
20 Statistical Process Control Formulas: Attribute Measurements (p-chart) binomial based 20 Sample size: n Proportion defective p = Total Number of defective units from all samples Number of samples Sample size(n) Standard error s p = p (1- p) n Compute control limits: UCL = p + z LCL = p - z s s p p
21 21 Example of Constructing a p-chart: Calculate the average of the sample proportions p = = Calculate the standard deviation of the sample proportion s p = p (1- n p) = (1- ) =
22 Calculate the control limits Constructing a p-chart 22 UCL = p + z sp p + 3 s p P LCL = p - z s p = p - 3 s p
23 Calculate the control limits LCL = x - A 2 R Constructing a Xbar chart 23 UCL = x + A 2 R x
24 Calculate the control limits Constructing an R chart 24 UCL = D 4 R R LCL = D 3 R
25 25 Basic Forms of Statistical Sampling for Quality Control Acceptance Sampling is sampling to accept or reject the immediate lot of product at hand Statistical Process Control is sampling to determine if the process is within acceptable limits

26 Acceptance Sampling 26 Purposes Determine quality level Ensure quality is within predetermined level Advantages Economy Less handling damage Fewer inspectors Upgrading of the inspection job Applicability to destructive testing Entire lot rejection (motivation for improvement)
27 Acceptance Sampling (Continued) 27 Disadvantages Risks of accepting bad lots and rejecting good lots Added planning and documentation Sample provides less information than 100-percent inspection
28 Acceptance Sampling: Single Sampling Plan 28 A simple goal Determine (1) how many units, n, to sample from a lot, and (2) the maximum number of defective items, c, that can be found in the sample before the lot is rejected
29 Risk 29 Acceptable Quality Level (AQL) Maximum acceptable percentage of defectives defined by producer. The a (Producer s risk) is the probability of rejecting a good lot Lot Tolerance Percent Defective (LTPD) Percentage of defectives that defines consumer s rejection point. The (Consumer s risk) is the probability of accepting a bad lot
30 Probability of acceptance Operating Characteristic Curve 30 The OCC brings the concepts of producer s risk, consumer s risk, sample size, and maximum defects allowed together a =.05 (producer s risk) n = c = =.10 (consumer s risk) AQL LTPD Acceptable Quality Level Lot Tolerance Percent defective The shape or slope of the curve is dependent on a particular combination of the four parameters

31 31 Acceptance Sampling Problem Well Equipped Traveler, a manufacturer of designer travel accessories, provides Passport/ID pouches to Saks Inc. and its subsidiaries: Saks Fifth Avenue, Herberger's, Younkers, Parisian, Carson Pirie Scott, Boston Store, Bergner s, Loveman's, Parks-Belk, and Brody's. Well Equipped Traveler has set an Acceptable Quality Level of 1% and accepts a 5% risk of lots being rejecting at or below this level. Saks Inc. considers lots with 3% defectives to be unacceptable and will assume a 10% risk of accepting a defective lot. Develop a sampling plan for Saks Inc. and determine a rule for the receiving inspection personnel to follow.


32 32 Example: Step 1. What is given and what is not? In this problem, Acceptable Quality Level, AQL = 0.01 Tolerance Percent Defective, LTPD = 0.03 Producer s risk, a = 0.05 Consumer s risk, = 0.10 To determine your sampling plan you need: c (the critical number of defects) and, n (the sample size).
33 33 Example: Step 2. Determine c First divide LTPD by AQL. LTPD AQL Then find the value for c by selecting the value in the appropriate table n AQL column that is equal to or just greater than the ratio above. Sample Plan table for a 0.05, 0.10 c LTPD/AQL n AQL c LTPD/AQL n AQL
34 Example: Step 3. Determine Sample Size 34 Now given the information below, compute the sample size in units to generate your sampling plan c 6, from Table n AQL 3.286, from Table AQL.01, given in problem n AQL / AQL / (always round up) Sampling Plan: Take a random sample of 329 units from a lot. Reject the lot if more than 6 units are defective.
Chapter 9A. Process Capability & SPC
 1 Chapter 9A Process Capability & SPC 2 OBJECTIVES Process Variation Process Capability Process Control Procedures Variable data Attribute data Acceptance Sampling Operating Characteristic Curve 3 Basic
Chapter 6 - Statistical Quality Control
 Chapter 6 - Statistical Quality Control Operations Management by R. Dan Reid & Nada R. Sanders 3rd Edition PowerPoint Presentation by R.B. Clough UNH M. E. Henrie - UAA Learning Objectives Describe Categories
Sources of Variation in Manufacturing and Service Processes
 COURSE: Quality and Assessment TOPIC: INSTRUCTOR: CENTER OF MANUFACTURING EXCELLENCE Sources of Variation in Manufacturing and Service Processes There is a clear difference between Manufacturing companies
Quality Control and Reliability Inspection and Sampling
 Quality Control and Reliability Inspection and Sampling Prepared by Dr. M. S. Memon Dept. of Industrial Engineering & Management Mehran UET, Jamshoro, Sindh, Pakistan 1 Chapter Objectives Introduction
Quality Management. It costs a lot to produce a bad product. Norman Augustine
 Quality Management It costs a lot to produce a bad product. Norman Augustine Cost of quality 1. Prevention costs 2. Appraisal costs 3. Internal failure costs 4. External failure costs 5. Opportunity costs
Engenharia e Tecnologia Espaciais ETE Engenharia e Gerenciamento de Sistemas Espaciais
 Engenharia e Tecnologia Espaciais ETE Engenharia e Gerenciamento de Sistemas Espaciais SITEMA DE GESTÃO DA QUALIDADE SEIS SIGMA 14.12.2009 SUMÁRIO Introdução ao Sistema de Gestão da Qualidade SEIS SIGMA
Statistics and Pharmaceutical Quality
 Statistics and Pharmaceutical Quality Karthik Iyer (CQE, CSSBB) Senior Policy Advisor CDER/OC/OMPQ January 24 th, 2014 IFPAC * This presentation reflects the views of the author and should not be construed
3. ACCEPTANCE SAMPLING
 3. ACCEPTANCE SAMPLING 3.1 Introduction Acceptance sampling is the process of evaluating a portion of the product/material in a lot for the purpose of accepting or rejecting the lot as either confirming
IMPROVE. Chapter 3-2. Acceptance Sampling Institute of Industrial Engineers 3-2-1
 Chapter 3-2 Acceptance Sampling 2011 Institute of Industrial Engineers 3-2-1 Acceptance Sampling Inspection: Process of comparing actual measurable characteristics with predetermined standard characteristics.
Acceptance Sampling Using Statgraphics Centurion. Presented by Dr. Neil W. Polhemus
 Acceptance Sampling Using Statgraphics Centurion Presented by Dr. Neil W. Polhemus Acceptance Sampling Given a lot or batch containing N items, a decision to accept or reject the lot is made based on statistical
many quality problems remain invisible to consumers
 Quality Management 1. Define Quality and TQM. 2. What are the ISO standards and why are they important? 3. What is Six Sigma? 4. Explain how benchmarking is used? 5. What are quality robust products and
Quality Assurance. Chapter 42
 Quality (Part 8) Quality Assurance Chapter 42 Quality Definitions Quality is defined as those products and/or service features that meet or exceed customer expectations Quality Assurance (QA) is proactive
Quality Management (PQM01) Chapter 04 - Quality Control
 Chapter 04 - Quality Control") Quality Management (PQM01) Chapter 04 - Quality Control Slide 1 Slide 2 Involves monitoring specific project results to determine if they comply with relevant quality standards, and identifying ways to
Quality Management (PQM01) Chapter 04 - Quality Control Slide 1 Slide 2 Involves monitoring specific project results to determine if they comply with relevant quality standards, and identifying ways to
Acceptance sampling is an inspection procedure used to
 SUPPLEMENT Acceptance Sampling Plans I LEARNING GOALS After reading this supplement, you should be able to: 1. Distinguish between singlesampling, double-sampling, and sequential-sampling plans and describe
Quality Control. Chapter 9- Lot-by-Lot Acceptance Sampling By Attributes. PowerPoint presentation to accompany Besterfield Quality Control, 8e
 Quality Control Chapter 9- Lot-by-Lot Acceptance Sampling By Attributes PowerPoint presentation to accompany Besterfield Quality Control, 8e PowerPoints created by Rosida Coowar Outline Fundamental Aspects
Statistical Process Control Seminar at Jireh Semiconductor. Topic Agenda
 Statistical Process Control Seminar at Jireh Semiconductor Instructor: John Breckline January 24, 2018 In association with BW (Ben) Marguglio, LLC 845-265-0123 Topic Agenda 2 SPC / Stats Review Critical
IE 301 Industrial Engineering laboratory LAB No.5: The seven QC tools and Acceptance sampling Instructor: Assisant.Prof. Parichat Chuenwatanakul Lab
 IE 301 Industrial Engineering laboratory LAB No.5: The seven QC tools and Acceptance sampling Instructor: Assisant.Prof. Parichat Chuenwatanakul Lab objectives: To practice using the seven QC tools to
Unit QUAN Session 6. Introduction to Acceptance Sampling
 Unit QUAN Session 6 Introduction to Acceptance Sampling MSc Strategic Quality Management Quantitative methods - Unit QUAN INTRODUCTION TO ACCEPTANCE SAMPLING Aims of Session To introduce the basic statistical
Discussion Topics. Some process engineering considerations
 Discussion Topics Definition of verification Introduction of ICMSF sampling terms Purposes of microbiological testing Maximizing the value of verification data Some process engineering considerations Definition:
Serious About Samples
 FEATURE SAMPLING Serious About Samples Understanding different approaches for process monitoring and when to use them by Manuel E. Peña-Rodríguez Sampling is one of the most-used methods in quality systems
Process Performance and Quality Chapter 6
 Process Performance and Quality Chapter 6 How Process Performance and Quality fits the Operations Management Philosophy Operations As a Competitive Weapon Operations Strategy Project Management Process
Process Performance and Quality
 Process Performance and Quality How Process Performance and Quality fits the Operations Management Philosophy Chapter 6 Operations As a Competitive Weapon Operations Strategy Project Management Process
Chapter 03 Control Charts. Process Variations and Quality
 University of Hail College of Engineering QEM 511 - Total Quality Management Chapter 03 Control Charts Prof. Mohamed Aichouni Lectures notes adapted from: PowerPoint presentation to accompany Besterfield,
Acceptance Sampling. CD Tutorial. Tutorial Outline
 Acceptance Sampling CD Tutorial 2 Tutorial Outline SAMLING LANS Single Sampling Double Sampling Sequential Sampling OERATING CHARACTERISTIC (OC) CURVES RODUCER S AND CONSUMER S RISK AVERAGE OUTGOING QUALITY
QUALITY CONTROL CHAPTER OUTLINE
 6 QUALITY CONTROL CHAPTER OUTLINE 6.1 Introduction 6.2 Quality 6.3 Control 6.4 Inspection 6.5 Quality Control 6.6 Statistical Process Control 6.7 Quality Circles 6.8 Total Quality Management (TQM) 6.9
İŞL 343 Üretim İşlemler Yönetimi Bahar Dönemi. Chapters 9-10 Management and Control of Quality. Melike Meterelliyoz Kuyzu
 İŞL 343 Üretim İşlemler Yönetimi 2010-2011 Bahar Dönemi Chapters 9-10 Management and Control of Quality Melike Meterelliyoz Kuyzu What is quality? Quality does not mean goodness is the ability of a product
Notes for Production and Operations Management- I
 Notes for Production and Operations Management- I Factors affecting Process Design Decisions Nature of product/service demand Degree of vertical integration Production Flexibility Degree of automation
Tools for Any Production to Control Quality of Product
 Tools for Any Production to Control Quality of Product Dr. S. Qaim Akbar Department of Statistics Shia P.G. College, Lucknow University, Lucknow, India-226020. Abstract The Statistical quality control
Understanding Variation and Statistical Process Control: Variation and Process Capability Calculations
 Understanding Variation and Statistical Process Control: Variation and Process Capability Calculations www.nano4me.org 2017 The Pennsylvania State University Process Capability Calculations 1 Outline Variation
Introduction to Control Charts
 Introduction to Control Charts Highlights Control charts can help you prevent defects before they happen. The control chart tells you how the process is behaving over time. It's the process talking to
Delivering Engineered Solutions
 Quality Terms Term Description Accept / Reject Criteria This refers to the measurement and decision of whether or not the quality and performance of a product or service is acceptable. These criteria can
❹ Select a single-sampling plan with a given acceptable. ❺ Compute the average outgoing quality for a singlesampling
 Supplement G Acceptance Sampling Plans Acceptance sampling is an inspection procedure used to determine whether to accept or reject a specific quantity of material. As more firms initiate total quality
No. of Printed Pages : 7 POST GRADUATE DIPLOMA IN APPLIED STATISTICS (PGDAST) Term-End Examination June, 2016 MSTE-001 : INDUSTRIAL STATISTICS I
 Term-End Examination June, 2016 MSTE-001 : INDUSTRIAL STATISTICS I") No. of Printed Pages : 7 POST GRADUATE DIPLOMA IN APPLIED STATISTICS (PGDAST) Term-End Examination June, 2016 MSTE-001 : INDUSTRIAL STATISTICS I I MSTE-001 I Time : 3 hours Maximum Marks : 50 Note : (i)
No. of Printed Pages : 7 POST GRADUATE DIPLOMA IN APPLIED STATISTICS (PGDAST) Term-End Examination June, 2016 MSTE-001 : INDUSTRIAL STATISTICS I I MSTE-001 I Time : 3 hours Maximum Marks : 50 Note : (i)
Design of Economic Optimal Double Sampling Design with Zero Acceptance Numbers
 Journal of Quality Engineering and Production Optimization Vol. 1, No., PP. 45-56, July Dec. 015 Design of Economic Optimal Double Sampling Design with Zero Acceptance Numbers Mohammad Saber FallahNezhad
Daniel Y. Peng, Ph.D.
 Using Process Capability to Enhance Product Quality Daniel Y. Peng, Ph.D. Senior Product Quality Reviewer Office of Process and Facility (OPF) OPQ/CDER/FDA IFPAC 2015 Annual Meeting Arlington, Virginia
Applying Statistical Techniques to implement High Maturity Practices At North Shore Technologies (NST) Anand Bhatnagar December 2015
 Anand Bhatnagar December 2015") Applying Statistical Techniques to implement High Maturity Practices At North Shore Technologies (NST) Anand Bhatnagar December 2015 For our audience some Key Features Say Yes when you understand Say No
Applying Statistical Techniques to implement High Maturity Practices At North Shore Technologies (NST) Anand Bhatnagar December 2015 For our audience some Key Features Say Yes when you understand Say No
Assignment 5 (Solution) Measurement System Analysis and OC curve
 Measurement System Analysis and OC curve") Assignment 5 (Solution) Measurement System Analysis and OC curve Dr. Jitesh J. Thakkar Department of Industrial and Systems Engineering Indian Institute of Technology Kharagpur Dr. Jitesh J. Thakkar, IIT
Assignment 5 (Solution) Measurement System Analysis and OC curve Dr. Jitesh J. Thakkar Department of Industrial and Systems Engineering Indian Institute of Technology Kharagpur Dr. Jitesh J. Thakkar, IIT
SQR-009 QUALITY ASSURANCE ACCEPTANCE SAMPLING REQUIREMENTS FOR SUPPLIERS
 SQR-009 QUALITY ASSURANCE ACCEPTANCE SAMPLING REQUIREMENTS FOR SUPPLIERS Revision: A VOUGHT SUPPLIER QUALITY REQUIREMENTS SQR-009 Table of Contents Section Page Revision Record 3 Introduction 4 General
Application of statistical tools and techniques in Quality Management
 Application of statistical tools and techniques in Quality Management Asst. Professor Dr Predrag Djordjevic University of Belgrade, Technical Faculty in Bor, Serbia QUALITY IN SOCIETY The concept was known
Lesson 14 Statistical Process Control
 Lesson 14 Statistical Process Control purpose is to assure that processes are performing in an acceptable manner Out of Control Center 0 1 3 4 5 6 7 8 9 10 11 1 13 14 15 Sample number 14-1 Inspection Before/After
Session XVII. Sampling Statistical Aspects
 Session XVII Sampling Statistical Aspects Outline Fundamental Aspects Statistical Aspects Sampling Plan Design Sampling Plan System Statistical Aspects The Operating Characteristic Curve (OCC): Measures
Lecture Notes on Statistical Quality Control
 STATISTICAL QUALITY CONTROL: The field of statistical quality control can be broadly defined as those statistical and engineering methods that are used in measuring, monitoring, controlling, and improving
Quality Engineering. Dr. John W. Sutherland
 Quality Engineering Dr. John W. Sutherland Contact Details Instructor:Professor John W. Sutherland Office: 803 ME-EM Bldg. Phone: 906-487-3395 Fax: 906-487-2822 email: jwsuther@mtu.edu web: http://www.me.mtu.edu/~jwsuther
Daniel Y. Peng, Ph.D.
 Using Control Charts to Evaluate Process Variability Daniel Y. Peng, Ph.D. Quality Assessment Lead Office of Process and Facility (OPF) OPQ/CDER/FDA PQRI 205 Annual Meeting North Bethesda, Maryland October
Statistical Thinking Session 2 of 4 10:15 to Noon
 Statistical Thinking Session 2 of 4 10:15 to Noon ACCEPTANCE SAMPLING 2014 ConteSolutions Acceptance Sampling Notebook pages 31 to 40 SAMPLING CONCEPTS BY JOHN A. CONTE, P.E. The ASQ CQE BoK IV Product
Quality Control. Dr. Richard Jerz rjerz.com
 Quality Control Dr. Richard Jerz 1 Specifying Quality Tolerances Fits Applies to manufacturing Applies to service, too 2 Purpose of Tolerances Impossible to make all parts to exact dimension Interchangeability
Sample Mean Range
 Lesson 14 Statistical Process Control Homework Solved Problem #2: see textbook Solved Problem #4: see textbook Solved Problem #5: see textbook Solved Problem #6: see textbook (manual problem) #1: Checkout
Capability on Aggregate Processes
 Capability on Aggregate Processes CVJ Systems AWD Systems Trans Axle Solutions edrive Systems The Problem Fixture 1 Fixture 2 Horizontal Mach With one machine and a couple of fixtures, it s a pretty easy
Best Practices for OINDP Pharmaceutical Development Programs Leachables and Extractables. VIII. Quality Control and Specification Setting
 Best Practices for OINDP Pharmaceutical Development Programs Leachables and Extractables VIII. Quality Control and Specification Setting PQRI Leachables & Extractables Working Group PQRI Training Course
Online Student Guide Types of Control Charts
 Online Student Guide Types of Control Charts OpusWorks 2016, All Rights Reserved 1 Table of Contents LEARNING OBJECTIVES... 4 INTRODUCTION... 4 DETECTION VS. PREVENTION... 5 CONTROL CHART UTILIZATION...
Ohio Child and Adult Care Food Program ANNUAL INVENTORY REQUIREMENTS
 Ohio Child and Adult Care Food Program ANNUAL INVENTORY REQUIREMENTS CACFP sponsors, who prepare any meals or snacks, are required to only record an ANNUAL INVENTORY and determine its monetary value. Sponsors
Statistics Quality: Control - Statistical Process Control and Using Control Charts
 Statistics Quality: Control - Statistical Process Control and Using Control Charts Processes Processing an application for admission to a university and deciding whether or not to admit the student. Reviewing
INDUSTRIAL ENGINEERING
 1 P a g e AND OPERATION RESEARCH 1 BREAK EVEN ANALYSIS Introduction 5 Costs involved in production 5 Assumptions 5 Break- Even Point 6 Plotting Break even chart 7 Margin of safety 9 Effect of parameters
QUICK & DIRTY GRR PROCEDURE TO RANK TEST METHOD VARIABILITY
 QUICK & DIRTY GRR PROCEDURE TO RANK TEST METHOD VARIABILITY Mike Mercer, Quality Engineering Specialist, 3M, St. Paul, MN Steve Cox, Lean Six Sigma Coach, 3M, St. Paul, MN Introduction One of the first
AQM Guideline Myanmar
 AQM Guideline Myanmar Procedure 1 History of revisions Date Scope of revision Page 3.1 8/11/2017 Creation whole 3.2 8/12/2017 AQM application form with survey 12 3.3 11/04/2018 AQM address 4 2 Summary...
1.20 Testing involves Using many products with same design to perform life tests to see how the design performs on average over a span of time.
 HW # 1 Solution 1.1The quality control before the 1980 s was characterized by: The need to keep parts from reaching the customer, mostly through the use of mass inspection techniques. Employing the QC
MSTE-001 : INDUSTRIAL STATISTICS I
 No. of Printed Pages : 7 POST GRADUATE DIPLOMA IN APPLIED STATISTICS (PGDAST) Term-End Examination December, 2017 riper? 1_ MSTE-001 : INDUSTRIAL STATISTICS I I MSTE-001 I Time : 3 hours Maximum Marks
Chapter 4 Exercise Solutions
 Several exercises in this chapter differ from those in the 4 th edition. An * following the exercise number indicates that the description has changed. New exercises are denoted with an. A second exercise
Workshop 5. Managing Quality. Kate Hughes & John Whiteley
 Workshop 5 Managing Quality Kate Hughes & John Whiteley 8-2 The various definitions of quality The transcendent approach views quality as synonymous with innate excellence. The manufacturing-based approach
Practical Applications of Statistical Methods Under 2011 FDA Process Validation Guidance
 Practical Applications of Statistical Methods Under 2011 FDA Process Validation Guidance Abe Germansderfer Associate Director, Quality Control Gilead Sciences 2011 Process Validation Guidance In January
Student Activities. Lesson Four. Shopping Wisely 04/09
 Student Activities $ Lesson Four Shopping Wisely 04/09 comparing choices Compare your choices for buying soft drinks and clothing items using the charts below. Soft Drink One Can vending machine brand
Ch.8 Quality Management.
 Part 1 : System Management. Ch.8 Quality Management. Edited by Dr. Seung Hyun Lee (Ph.D., CPL) IEMS Research Center, E-mail : lkangsan@iems.co.kr - 1 - Definition of Quality. [APICS Dictionary] Fitness
Managing Quality in Pharmaceutical Industry Using Six Sigma. Edited by Mahmoud Farouk Moussa TQM, CSSBB, MBA
 Managing Quality in Pharmaceutical Industry Using Six Sigma Edited by Mahmoud Farouk Moussa TQM, CSSBB, MBA Outlines Pharmaceutical Manufacturing Process and Drug Product Quality. Process Excellence Approach
Process Control Optimization Manual
 Process Control Optimization Manual Skyworks Solutions, Inc. 20 Sylvan Road Woburn, MA 01801 Tel: 781-376-3000 Page 1 of 30 Skyworks SQ03-0360 Rev 5 Table of Contents 1 Purpose and Scope... 4 1.1 Purpose...
Applying ISO 9001 to making cookies
 Applying ISO 9001 to making cookies How does ISO 9001:2015 apply to a business? Let s say you make cookies First, the standard doesn t consider the actual quality of the cookie, you and your customers
Checking data for outliers: Few data points, tolerance tables. 7 th Seminar on Statistics in Seed testing. Gregoire, Laffont, Remund
 Checking data for outliers: Few data points, tolerance tables 7 th Seminar on Statistics in Seed testing Gregoire, Laffont, Remund Overview Check a large number of data Routine high throughput Methodological
Assignment 5: Statistical Process Controls. Laura M Williams, RN, CLNC, MSN. IET603: Statistical Quality Assurance in Science and Technology
 Running head: WILLIAMS ASSIGNMENT Assignment : Statistical Process Controls, RN, CLNC, MSN IET60: Statistical Quality Assurance in Science and Technology Morehead State University Dr. Ahmad Zargari 8 March
Developing Control Charts in a Manufacturing Industry and Improvement of Quality Using PDCA Cycle
 International Conference on Mechanical, Industrial and Materials Engineering 07 (ICMIME07) 8-0 December, 07, RUET, Rajshahi, Bangladesh. Paper ID: IE-64 Developing Control Charts in a Manufacturing Industry
Data collection system and online variable control chart for diameter measurement
 Data collection system and online variable control chart for diameter measurement Mohammad Iqbal and Nur Zulaikhah Nadzri Universiti Kuala Lumpur Campus UniKL_MFI, Section 14, Jalan Teras Jernang, Bandar
Statistical Questions from CPV Monitoring of Bioreactor Data
 Statistical Questions from CPV Monitoring of Bioreactor Data Craig Bernier Principal Statistician Design to Value and Quality Engineering Janssen Pharmaceutical Companies of Johnson and Johnson Individual
INTI COLLEGE MALAYSIA DIPLOMA IN ENGINEERING PROGRAMME EGR 286 : PRODUCTION PLANNING & CONTROL FINAL EXAMINATIION : AUGUST 2002 SESSION
 EGR286 (F) / Page 1 of 5 INTI COLLEGE MALAYSIA DIPLOMA IN ENGINEERING PROGRAMME EGR 286 : PRODUCTION PLANNING & CONTROL FINAL EXAMINATIION : AUGUST 2002 SESSION This paper consists of SEVEN (7) questions.
Lean Six Sigma Green Belt Supplement
 Problem Solving and Process Improvement Tools and Techniques Guide Book Lean Six Sigma Green Belt Supplement Max Zornada, University of Adelaide Executive Education 7 th Floor, 10 Pultney Street, Adelaide,
Madhya Pradesh Bhoj (Open) University, Bhopal BBA-Third year
 University, Bhopal BBA-Third year") Subject: I- Corporate Legal Framework Maximum Marks: 30 What do you mean by winding up of a company? Explain the methods of winding up of company. What do you mean by crossing of cheque explain the types
Subject: I- Corporate Legal Framework Maximum Marks: 30 What do you mean by winding up of a company? Explain the methods of winding up of company. What do you mean by crossing of cheque explain the types
Lot Sampling in ERP Solutions Total Quality Control Management (TQCM) In Dynamics 365 for Operations
 In Dynamics 365 for Operations") Lot Sampling in ERP Solutions Total Quality Control Management (TQCM) In Dynamics 365 for Operations Introduction Lot Sampling in manufacturing is often referred to as Lot Quality Assurance Sampling (LQAS),
Lot Sampling in ERP Solutions Total Quality Control Management (TQCM) In Dynamics 365 for Operations Introduction Lot Sampling in manufacturing is often referred to as Lot Quality Assurance Sampling (LQAS),
Quality Assurance Acceptance Sampling Requirements for Suppliers SQR 009. Revision Date: 02 December Approved. Frank Mariot
 Quality Assurance Acceptance Sampling Requirements for Suppliers SQR 009 Revision Date: 02 December 2016 Approved Frank Mariot Supply Chain Quality Manager Suppliers may view this document via the Internet
GEN-INT-13 B Quality KPIs on the Shop Floor
 GEN-INT-13 B Quality KPIs on the Shop Floor Eddie Cruz, Johnson & Johnson Chris Monchinski, Automated Control Concepts 13 October 2014 2014 - Automated Control Concepts, Inc. 1 Today s Agenda Introductions
The materials required over the next two modules include:
 Meet with the Math Instructor and verify that the statistics modules have been completed and that students will be again reviewing these kinds of data over the next two quality modules. The Math Instructor
Quality Management. Six Sigma Quality An introduction. All Rights Reserved, Indian Institute of Management Bangalore
 Quality Management Six Sigma Quality An introduction Six Sigma Quality An introduction Generally six sigma quality points to very high quality levels that defects are a rarity in operations It also points
Chapter 1. Introduction
 Chapter 1 Introduction INTRODUCTION 1.1 Introduction Statistics and statisticians can throw more light on an issue than a committee. of experts for making decisions on real life problems. Professor C.
This regulation applies to prepackages which contains products which will be sold in constant nominal quantities which
 Chapter 1 Introductory provisions 1. Scope This regulation prescribes rules for use of the e-mark as mentioned in annex 3 for labelling of prepackages, and requirements to the net content of prepackages
LUXURY RETAILERS. Neal Sangani & Dina Model
 LUXURY RETAILERS Neal Sangani & Dina Model Agenda Investment Thesis Luxury Retail Nordstrom (JWN) Saks (SKS) Q&A How We Outperformed The Sky Is Not Falling Trailing earnings yields of 8% to 12% across
UNIT-4 ====================================================================== UNIVERSITY SYLLABUS
 UNIT-4 ====================================================================== UNIVERSITY SYLLABUS Quality Control: Meaning, process control, SQC control charts, single, double and sequential sampling,
Measure Phase Measurement System Analysis
 Measure Phase Measurement System Analysis Measurement System Analysis Welcome to Measure Process Discovery Six Sigma Statistics Measurement System Analysis Basics of MSA Variables MSA Attribute MSA Process
Module 4 Self Study Review of Reliability, Software Quality and Six Sigma
 True/False/Multiple choice/write-in Answers 1. One operational definition of reliability is the probability that a product or system will function on any given trial. 2. If a system is composed of two
Chapter 8: Estimating with Confidence. Section 8.2 Estimating a Population Proportion
 Chapter 8: Estimating with Confidence Section 8.2 Activity: The Beads Your teacher has a container full of different colored beads. Your goal is to estimate the actual proportion of red beads in the container.
Quality Control Charts
 Quality Control Charts General Purpose In all production processes, we need to monitor the extent to which our products meet specifications. In the most general terms, there are two "enemies" of product
Big Data and Statistical Process Control. By Marc Schaeffers
 Big Data and Statistical Process Control By Marc Schaeffers Big Data and Statistical Process Control INTRODUCTION Companies have been applying statistical process control (SPC) techniques since 1935. SPC
Supplier Quality Requirements
 Supplier Quality Requirements QAQ-82-001 Rev. 2 November 28, 2006 118 East Columbia River Way Bingen, Washington 98605 509-493-8600 1. Purpose and Scope Insitu is committed to building strong supplier
Welcome to the course, Evaluating the Measurement System. The Measurement System is all the elements that make up the use of a particular gage.
 Welcome to the course, Evaluating the Measurement System. The Measurement System is all the elements that make up the use of a particular gage. Parts, people, the environment, and the gage itself are all
LO1: Understand how inspection and testing methods and processes improve quality control
 Unit 19: Inspection and testing LO1: Understand how inspection and testing methods and processes improve quality control SPC moving range charts Instructions and answers for teachers These instructions
Consider the view from an airplane. When the airplane is at an elevation of
 C ONTROL CHARTS AND PROCESS CAPABLTY 30,000-Foot-Level Performance Metric Reporting UNDERSTANDNG AND MPROVNG PROCESSES FROM A BRD S-EYE VEWPONT By Forrest W. Breyfogle, Smarter Solutions nc. Consider the
Assignment Question Paper II
 Paper I- Corporate Legal Framework What do you mean by winding up of a company? Explain the methods of winding up of company. What do you mean by crossing of cheque explain the types of crossing of cheque.
Measurement Systems Analysis
 Measurement Systems Analysis Components and Acceptance Criteria Rev: 11/06/2012 Purpose To understand key concepts of measurement systems analysis To understand potential sources of measurement error and
Cork Regional Technical College
 Cork Regional Technical College Bachelor of Engineering in Chemical and Process Engineering - Stage 4 Summer 1996 CE 4.8 - DECISION ANALYSIS AND OPERATIONS RESEARCH (Time: 3 Hours) Answer FOUR Questions.
NCWM Form 15: Verifying the Net Quantity of Contents of Multiunit and Variety Packages
 NCWM Form 15: Verifying the Net Quantity of Contents of Multiunit and Variety Packages This proposal is to add test procedures for multiunit and variety packages in NIST Handbook 133 Checking the Net Contents
Economic Design of X-bar Chart Using Genetic Algorithm. Master of Technology in Mechanical Engineering. Abhijit Roy 212ME2299
 Economic Design of X-bar Chart Using Genetic Algorithm A THESIS SUBMITTED IN PARTIAL FULFILLMENT OF THE REQUIREMENT FOR THE DEGREE OF Master of Technology in Mechanical Engineering by Abhijit Roy 212ME2299
Sampling. Roger Kissling New Zealand
 Sampling Roger Kissling New Zealand 1 Agenda Basic Definitions Motivating Example Statistical Approach to Sampling Demonstration of Tool Comments on ISO Standards Measurement Error Principles: Create awareness
Manufacturing Supplier Requirements Manual
 Page: 1 of 15 TABLE OF CONTENTS SECTION TITLE PAGE... Table of Contents... 2... Log of Revisions... 3... List of Effective Pages... 3 1.0...Cost of Poor Quality... 4 2.0... Process Control... 4 3.0...
The Importance of Understanding Type I and Type II Error in Statistical Process Control Charts. Part 1: Focus on Type 1 Error
 The Importance of Understanding Type I and Type II Error in Statistical Process Control Charts Part 1: Focus on Type 1 Error Phillip R. Rosenkrantz, Ed.D., P.E. California State Polytechnic University
Upper Canopy module Fixed Area Plot Summary and beyond!
 Upper Canopy module Fixed Area Plot Summary and beyond! Eight standard steps to process live upper canopy (tree) inventory data: 0. Complete your data by calculating heights for trees w/ height data 1.