20. Security Classification (of this page) Unclassified
|
|
|
- Alaina Rogers
- 5 years ago
- Views:
Transcription
1 Technical Report Documentation Page 1. Report No. FHWA/TX-09/ Government Accession No. 3. Recipient's Catalog No. 4. Title and Subtitle SERVICEABLE PAVEMENT MARKING RETROREFLECTIVITY LEVELS: TECHNICAL REPORT 5. Report Date September 2008 Published: March Performing Organization Code 7. Author(s) Robert J. Benz, Adam M. Pike, Shamanth P. Kuchangi and Quinn Brackett 9. Performing Organization Name and Address Texas Transportation Institute The Texas A&M University System College Station, Texas Sponsoring Agency Name and Address Texas Department of Transportation Research and Technology Implementation Office P.O. Box 5080 Austin, Texas Performing Organization Report No. Report Work Unit No. (TRAIS) 11. Contract or Grant No. Project Type of Report and Period Covered Technical Report: September August Sponsoring Agency Code 15. Supplementary Notes Project performed in cooperation with the Texas Department of Transportation and the Federal Highway Administration. Project Title: Serviceable Pavement Marking Retroreflectivity Levels URL: Abstract This research addressed an array of issues related to measuring pavement markings retroreflectivity, factors related to pavement marking performance, subjective evaluation process, best practices for using mobile retroreflectometers, sampling pavement markings, and best practices for a Pavement Marking Management system. Tests conducted to assess subjective evaluation showed inconsistency in subjective retroreflectivity evaluation when compared between different evaluations, marking color, and retroreflectivity levels. Sensitivity testing on several factors that could potentially affect mobile retroreflectometer readings showed that distance from which the measurements are taken and position across the measurement window seemed to have the most significant impact on the mobile retroreflectivity measurements. The evaluation factors of data acquisition, vehicle speed, and small changes in measurement geometry made no practical difference to the measurement. However, constant speed provided best results. Based on the sensitivity testing this report enlists some best practices for mobile retroreflectometer measurements. A methodology for combining mobile retroreflectivity data with pavement information and plotting a map, color coded based on pavement marking retroreflectivity level using GIS, are demonstrated in this project. This report also provides discussion on other best practices for sampling and Pavement Marking Management system. 17. Key Words Serviceable Pavement Marking, Pavement Marking Performance, Retroreflectivity, Pavement Marking Evaluation, Visual Inspection, Mobile Retroreflectometer, Sensitivity Testing, Calibration Best Practices, Pavement Marking Management System, Pavement Marking Information System, GIS, Sampling Methods 19. Security Classif.(of this report) Unclassified Form DOT F (8-72) Reproduction of completed page authorized 20. Security Classification (of this page) Unclassified 18. Distribution Statement No restrictions. This document is available to the public through NTIS: National Technical Information Service Springfield, Virginia No. of Pages Price
2
3 SERVICEABLE PAVEMENT MARKING RETROREFLECTIVITY LEVELS: TECHNICAL REPORT by Robert J. Benz, P.E. Research Engineer Texas Transportation Institute Adam M. Pike Associate Transportation Researcher Texas Transportation Institute Shamanth P. Kuchangi Assistant Transportation Researcher Texas Transportation Institute and Quinn Brackett Senior Research Scientist Texas Transportation Institute Report Project Project Title: Serviceable Pavement Marking Retroreflectivity Levels Performed in cooperation with the Texas Department of Transportation and the Federal Highway Administration September 2008 Published: March 2009 TEXAS TRANSPORTATION INSTITUTE The Texas A&M University System College Station, Texas
4
5 DISCLAIMER This research was performed in cooperation with the Texas Department of Transportation (TxDOT) and the Federal Highway Administration (FHWA). The contents of this report reflect the views of the authors, who are responsible for the facts and the accuracy of the data presented herein. The contents do not necessarily reflect the official view or policies of the FHWA or TxDOT. This report does not constitute a standard, specification, or regulation. This report is not intended for construction, bidding, or permit purposes. The engineer in charge of the project was Robert J. Benz, P.E, # The United States Government and the State of Texas do not endorse products or manufacturers. Trade or manufacturers names appear herein solely because they are considered essential to the object of this report. v
6 ACKNOWLEDGMENTS This project was conducted in cooperation with the Texas Department of Transportation and the U.S. Department of Transportation, Federal Highway Administration. The authors wish to acknowledge the following individuals, without whose insight and assistance the successful completion of the first portion of this research project would not have been possible: Mr. Richard Kirby, P.E., Texas Department of Transportation, Construction Division, Project Director; Mr. Carlos Ibarra, P.E., Texas Department of Transportation, Atlanta District, Project Advisor; Mr. Wally Shaw, Texas Department of Transportation, Houston District, Project Advisor; Mr. Wade Odell, P.E., Texas Department of Transportation, Research and Technology Implementation Office, Austin, Research Engineer; Mr. Roy Wright, P.E., Texas Department of Transportation, Abilene District, Director of Transportation Operations; Mr. James Keener, Texas Department of Transportation, Houston District, Traffic Engineering Division, Special Events Coordinator; Mr. John Bassett, P.E., Texas Department of Transportation, Austin, Construction Division; and Mr. Richardo Castaneda, P.E., Texas Department of Transportation, San Antonio District. The authors would also like to acknowledge the assistance of Paul Carlson, Greg Davis, Gene Hawkins, Dillon Funkhouser, Eun Sug Park, and Derek Ladd of the Texas Transportation Institute (TTI) at various stages of the project. vi
7 TABLE OF CONTENTS Page LIST OF FIGURES... ix LIST OF TABLES... xi CHAPTER 1. INTRODUCTION BACKGROUND Factors and Issues with Measurement OVERVIEW... 2 CHAPTER 2. METHODOLOGY Task 1. State-of-Practice Review Task 2. Subjective Retroreflectivity Rating Evaluation Task 3. Mobile Measurements and Best Practices Task 4. Pavement Marking Management System Best Practices Task 5. Summary of Findings and Recommendations... 7 CHAPTER 3. LITERATURE REVIEW Pavement Marking Materials Paints Thermoplastic Preformed Tape Epoxy Other Materials Usage and Costs Pavement Marking Usage Pavement Marking Evaluation Techniques Visual Inspections Handheld Retroreflectometers Mobile Retroreflectometers Aspects of Pavement Marking Visibility Retroreflectivity Contrast Ratio Measurement Geometry Factors Affecting Retroreflectivity and Marking Visibility Driver Age Pavement Marking Contrast Pavement Marking Beads Retroreflective Raised Pavement Markers Headlamp Illumination Width of Marking Pavement Marking Management Systems Minimum Retroreflectivity of Traffic Signs Minimum Retroreflectivity of Pavement Markings Mobile Retroreflectometers Technical Details of Mobile Retroreflectometers Operational Details Reported on Mobile Retroreflectometers Comparison Between Mobile and Handheld Retroreflectometers Issues Reported with Mobile Retroreflectometers CHAPTER 4. SUBJECTIVE RETROREFLECTIVITY RATING EVALUATION Current Practices in Retroreflectivity Assessment vii
8 4.1 First Study on Subjective Retroreflectivity Rating Assessment Subjective Retroreflectivity Test Procedure Comparison of Subjective Ratings to Measured Mobile Readings Comparison of Retroreflectivity Ratings by Pavement and Marking Characteristics Individual Retro-Rating Analysis Comparison of Rating Factors Used for the Test Second Night Subjective Retroreflectivity Test Test Procedure Individual Retroreflectivity Assessment: Before-After Analysis Before-After Analysis of Average Subjective Retroreflectivity Subjective Retroreflectivity Assessment Trend by Pavement Marking Color Discussion Comparison of Handheld and Mobile Retroreflectometer Readings CHAPTER 5. MOBILE MEASUREMENTS AND BEST PRACTICES Sensitivity Analysis of Major Variables Static Testing Dynamic Testing Combined Static and Dynamic Testing Limitations to the Sensitivity Analysis of the Major Variables Operational Best Practices Developing a Decision Model for Managing Pavement Marking Replacement Introduction Objective Method Suggested Sampling Plan Methodology Procedure Analysis and Results CHAPTER 6. PAVEMENT MARKING MANAGEMENT SYSTEM BEST PRACTICES Introduction Retroreflectivity Data File Headers Prototype in Automation GIS Procedures Overview What Is Needed Retroreflectivity Data File Preparation Adding Retroreflectivity Points to GIS Locate Features Along a Route CHAPTER 7. SUMMARY OF FINDINGS AND RECOMMENDATIONS Findings Recommendations REFERENCES APPENDIX A: NIGHT RETROREFLECTIVITY RATING FORM... A-1 APPENDIX B: DETAILED ANALYSIS OUTPUT... B-1 APPENDIX C: INDIVIDUAL RETRO-RATING GRAPHS... C-1 APPENDIX D: INDIVIDUAL RETROREFLECTIVITY ASSESSMENT BEFORE AND AFTER TRAINING... D-1 viii
9 LIST OF FIGURES Page Figure 1. Pavement Marking Retroreflection Figure 2. Standard 30-Meter Geometry for Retro Measurement (10) Figure 3. Diagrammatic Representation of Laserlux Unit (10) Figure 4. Correlation between Measured Retro Values and Subjective Retro-ratings Figure 5. Retroreflectivity Rating Trend Figure 6. Retro Rating by Pavement Color Figure 7. Contrast Rating by Pavement and Marking Color Figure 8. Individual Retro-ratings for Subject Figure 9. Individual Retro-ratings for Subject Figure 10. Average Rating of Different Factors Used in the Study Figure 11. Retroreflectivity Assessment Graph for Participant # Figure 12. Retroreflectivity Assessment Graph for Participant # Figure 13. Retroreflectivity Assessment Trend for Yellow Markings Figure 14. Retroreflectivity Assessment Trend for White Markings Figure 15. Comparison of Mobile and Handheld Retroreflectivity Measurements from Night Study Figure 16. Measurement Distance Testing Figure 17. Temperature Characterization Testing Figure 18. Temperature Compensation Testing Figure 19. Linearity Testing Figure 20. Right Side Static Position Testing Figure 21. Left Side Static Position Testing Figure 22. Visual of the Laser Pattern Figure 23. Dynamic Position Testing Figure 24. Nighttime Oncoming Vehicle Testing Figure 25. Predictive Retroreflectivity Model Based on Marking Age and Traffic Volume Figure 26. Prototype Menu Driven Retroreflectivity Data File Header Input Screen Figure 27. Flowchart Showing High Level of Automation Figure 28. Coordinate System Import Screen Figure 29. ArcView XY Data Screen Figure 30. Saving Layer Dialog Box Figure 31. Export of the Point File as a Layer Figure 32. Locate Features Along Routes Tool Figure 33. Importing Retro Route File Figure B-1. Comparison of Mobile Measurements with Human Judgment by Color Ratings... B-3 Figure B-2. Comparison of Mobile Measurements with Human Judgment by Contrast Ratings... B-3 Figure B-3. Comparison of Mobile Measurements with Human Judgment by Overall Quality Ratings... B-4 Figure B-4. Pavement Marking Rating Trend Analysis by Average Color Ratings... B-4 Figure B-5. Pavement Marking Rating Trend Analysis by Average Contrast Ratings... B-5 ix
10 LIST OF FIGURES (cont.) Page Figure B-6. Pavement Marking Rating Trend Analysis by Overall Quality Ratings... B-5 Figure C-1. Individual Retro-Ratings for Subject 1... C-3 Figure C-2. Individual Retro-Ratings for Subject 2... C-3 Figure C-3. Individual Retro-Ratings for Subject 3... C-4 Figure C-4. Individual Retro-Ratings for Subject 4... C-4 Figure C-5. Individual Retro-Ratings for Subject 5... C-5 Figure C-6. Individual Retro-Ratings for Subject 6... C-5 Figure C-7. Individual Retro-Ratings for Subject 7... C-6 Figure C-8. Individual Retro-Ratings for Subject 8... C-6 Figure D-1. Retroreflectivity Assessment Graph for Participant 1... D-3 Figure D-2. Retroreflectivity Assessment Graph for Participant 2... D-3 Figure D-3. Retroreflectivity Assessment Graph for Participant 3... D-4 Figure D-4. Retroreflectivity Assessment Graph for Participant 4... D-4 Figure D-5. Retroreflectivity Assessment Graph for Participant 5... D-5 Figure D-6. Retroreflectivity Assessment Graph for Participant 6... D-5 Figure D-7. Retroreflectivity Assessment Graph for Participant 7... D-6 Figure D-8. Retroreflectivity Assessment Graph for Participant 8... D-6 Figure D-9. Retroreflectivity Assessment Graph for Participant 9... D-7 Figure D-10. Retroreflectivity Assessment Graph for Participant D-7 Figure D-11. Retroreflectivity Assessment Graph for Participant D-8 x
11 LIST OF TABLES Page Table 1. Factors Affecting Pavement Marking Performance Table 2. Pavement Marking Material Types Used by Transportation Agencies (4) Table 3. Pavement Marking Materials and Overall Usage (6) Table 4. Pavement Marking Cost and Service Life (7) Table 5. Factors Affecting Retroreflectivity in Pavement Markings (10) Table 6. Illuminance on Pavement Marking by Headlight Type (13) Table 7. Factors and Criteria Used in TARVIP Model Table 8. Minimum Retroreflectivity Values (in mcd/m 2 /lux) Derived from TARVIP (38) Table 9. Recommended Minimum Retroreflectivity Values (in mcd/m 2 /lux) (38) Table 10. Summary of TxDOT Districts Pavement Marking Evaluation Table 11. Test Pavement Marking Segments Table 12. Summary of Retroreflectivity Rating and Mobile Retroreflectivity Values for Each Segment Table 13. Difference between Individual Ratings and Average Retroreflectivity Rating Table 14. Difference between Individual Ratings and Mobile Retroreflectivity Values Table 15. Before-After Retroreflectivity Assessment Statistics for All Participants Table 16. Before-After Retroreflectivity Assessment Statistics for Experienced Participants Table 17. Before-After Retroreflectivity Assessment Statistics for Inexperienced Participants. 54 Table 18. Height Setup Testing Table 19. Acquisition Frequency Testing Table 20. Speed of Data Collection Testing Table 21. Individual Trials on Several Lines Table 22. Multiple Trials on Same Double Line Table 23. All Signal to Noise Ratio Trials Table 24. Signal to Noise Ratio Average Values Table 25. Dynamic Overhead Lighting Testing Table 26. Static Night Testing Table 27. Static/Dynamic Simulated Traffic Testing Table A Project Demo and Night-Time Pavement Marking Evaluation... A-3 xi
12
13 CHAPTER 1. INTRODUCTION 1.0 BACKGROUND Crash statistics from the National Highway Traffic Safety Administration (NHTSA) have shown that fatal crashes are three to four times more likely to occur during nighttime than during daytime (1). The crash statistics show that about half of the almost 40,000 motor vehicle fatalities each year occur at night. Many preventable causes contribute to nighttime traffic crashes such as driving under the influence of drugs or alcohol, distracted driving, run off the road crashes, etc. Limited nighttime visibility is one cause of nighttime crashes. Improving the visibility of the roadway or the roadway path is a vital aspect that could possibly reduce the number of nighttime crashes. Overhead lighting, retroreflective signing, and retroreflective markings are ways that roadway delineation can be improved. Major highways and city streets in urban areas commonly have overhead lighting. Using luminary poles and high-mast lighting can be very effective in lighting the road and the right of way in urban areas. Retroreflective signing and markings are common traffic control devices on all roads. Both overhead lighting and retroreflective pavement markings have been proven to improve the overall safety of the roadway. In 1993, Congress issued a mandate to define minimum levels of retroreflectivity for signs and markings. While the minimum retroreflectivity rulemaking for signing has been established, pavement marking retroreflectivity rulemaking has yet to be established. Management of signs and pavement markings is essential as they are an important part of the roadway infrastructure. The useful life of a pavement markings ranges from less than 1 year up to 8 years and in some cases even longer. The lifespan of a marking is influenced by a variety of variables related to marking type and environmental conditions. Many new pavement marking materials are being developed for use on all pavement surfaces. The cost and performance of pavement markings and their relationship with driver safety and comfort make the research into their management vital Factors and Issues with Measurement Several states have researched and developed Pavement Marking Management systems to improve the management of this vital asset. TxDOT has two programs for assessing pavement 1
14 marking condition on a statewide basis: Texas Maintenance Assessment Program (TxMAP) and Texas Traffic Assessment Program (TxTAP). Each program uses subjective judgments of a sample of markings in each district to represent the condition of markings throughout the district. Because pavement markings are only a small part of these assessment programs, the subjective ratings may not be entirely accurate in identifying roadways with poor markings. The subjective nature of these measurements can lead to varying or even contradictory results. Estimated retroreflectivity levels and the general marking condition are the measurers used to indicate pavement marking performance during these subjective assessments. Actual quantitative measures of pavement marking performance variables are more desirable than qualitative assessments. Pavement marking width and lane line length are variables that can easily be measured. Color, contrast, and presence of the marking are also important variables but currently these variables are not quantitatively measured on a routine basis. Retroreflectivity is the major variable of a markings nighttime performance, but is not quantitatively measured as a standard practice. The costs and time associated with quantitative measurements has led many states to rely solely on subjective measures of pavement marking performance. Pavement marking performance can be broken into two main categories: visibility factors and durability factors. Table 1 lists some of the major factors for each category. Table 1. Factors Affecting Pavement Marking Performance. Visibility Factors Contrast Retroreflectivity Presence Pavement Texture Pavement Color Marking Color Marking Type Marking Size Headlamp Type Viewing Geometry Ambient Lighting Conditions Durability Factors Marking Material Marking Thickness Pavement Type Pavement Texture Traffic Volume Weather Maintenance Activities Marking Location (Edgeline, Centerline, Lane line) Roadway Geometry (Horizontal Curves, Weaving Areas, etc.) 1.1 OVERVIEW Good pavement markings are necessary for the traveling public s safety. Effectively managing pavement makings is a difficult process. There are few quantitative procedures and requirements to determine adequacy or serviceability of pavement marking. Retroreflectivity is 2
15 the main measurement to determine adequate or serviceable pavement markings. Current qualitative evaluation procedures such as visual inspection are subjective in nature and may produce varying results. Current quantitative measurements using handheld retroreflectometers can be slow and costly. Mobile retroreflectometers have been developed in recent years to safely collect large amounts of retroreflective data quickly. Mobile retroreflectometers without proper calibration practices and improper measurement techniques can result in erroneous and inconsistent data, leading to distrust in a very useful tool among State DOTs. In an effort to improve accuracy and confidence in the mobile data, TxDOT worked with TTI to establish the Mobile Retroreflectivity Certification Program. TxDOT then required certification for any contractor using a mobile retroreflectometer for retroreflectivity data collection. All TxDOT contractors must also meet all requirements in Special Specification 8094, which covers mobile retroreflectivity data collection for pavement markings (2). The basic concept of the certification program is to provide a quantitative basis for evaluating the ability of a contractor to accurately measure the retroreflectivity of long-line pavement markings. A contractor who desires to be certified sends the personnel and equipment to the TTI certification course. The closed course consists of numerous pavement markings of various colors, patterns, and retroreflectivity levels. The contractor is required to measure a selection of lines on the certification course and a selection of lines on open roads surrounding the facility. All the markings measured by the contractor with the mobile retroreflectometer are then measured by TTI using a handheld retroreflectometer to determine the official values of the markings. TTI compares the handheld measurements to the mobile measurement values and determines whether the mobile readings are within ±15 percent, which is the maximum allowable difference for certification. The certification program tests the ability of contractor s initial setup and calibration and their ability to properly use the mobile retroreflectometer to take measurements. However, the certification program is not able to take into consideration several variables that may change over the course of a day of measurements (e.g., change in temperature, ambient light conditions). Also most contractors getting the certification adopt their own unscientific and non-uniform methods to setup the mobile unit. Currently there is little scientific guidance or uniform/best procedures with TxDOT and/or contractors using mobile retroreflectometers such as: properly setting up and operating the mobile retroreflectometer, 3
16 sampling the data, and interpreting the large quantity of data obtained from a mobile retroreflectometer. Handheld retroreflectometers are simple to use on small pavement marking samples, easy to calibrate, and external factors have less influence on measurements taken with handled devices. As such, handheld retroreflectometers are fairly accurate and have been considered as a benchmark for retroreflectivity measurements. However, there has been no correlation with the data collected from handheld and mobile retroreflectometers and how the mobile retroreflectometer readings relate to visual evaluations. This has been a concern or inhibiting factor for TxDOT and other state DOTs to use mobile retroreflectometers. This research focused on some of the above mentioned concerns with practical use of mobile retroreflectometers and pavement marking evaluation methods. The primary goals of this project were to address the following issues: adequacy of pavement marking performance characteristics; accuracy of existing pavement marking retroreflectivity measurement evaluation criteria (visual inspection); correlation between data from handheld and mobile retroreflectometers; best practices for calibrating and using mobile retroreflectivity devices, including a recommended sampling methodology; and best practices to handle a large amount of pavement marking data and manage pavement markings as a system. 4
17 CHAPTER 2. METHODOLOGY This project focused on developing recommendations and best practices for mobile measurements, sampling methodology, and Pavement Marking Management systems. The project work was divided into five major tasks, within which there were several subtasks. This chapter provides a brief description of each of these major tasks. 2.0 TASK 1. STATE-OF-PRACTICE REVIEW The researchers conducted a comprehensive literature search to identify publications on previous studies and existing practices related to pavement marking types, pavement marking retroreflectivity, retroreflectivity measurement techniques, minimum retroreflectivity values for pavement markings, and Pavement Marking Management. This search used all available bibliographic resources including the internet and various catalogs and databases such as Texas A&M University s Sterling C. Evans Library local library database, Online Computer Library Center database, National Technical Information System, and Transportation Research Information Service. The researchers selected key words and word combinations to conduct a systematic search of these databases. After identifying potential literature sources, researchers acquired and reviewed those abstracts for applicability to the project. Those documents identified as being of interest were obtained for incorporation into the literature review. Some of the major factors affecting the pavement marking performance were identified from literature, and a brief discussion on those factors is provided. Background information on retroreflectivity and current available techniques for retroreflectivity assessment are briefed. Significant differences between handheld and mobile retroreflectometers as listed in various literature were compiled. Also minimum retroreflectivity research conducted throughout the nation and elsewhere identifies the range of minimum retroreflectivity value to lie between 80 to 150 mcd/m 2 /lux. Factors affecting minimum retroreflectivity values, such as driver age, pavement marking color, etc. were identified from literature. Chapter 3 of this report provides more details on this effort. 2.1 TASK 2. SUBJECTIVE RETROREFLECTIVITY RATING EVALUATION In this task researchers compared subjective retroreflectivity assessment with measured retroreflectivity values. The purpose of this task was to find how well the subjective evaluation 5
18 correlated with the actual measurements. This task involved two subtasks. First, researchers compiled the existing pavement marking retroreflectivity evaluation practices adopted by various districts in TxDOT. Almost all the districts primarily relied on subjective visual inspection for evaluating retroreflectivity, and some districts did indicate a concern over the consistency of visual evaluations. Only a couple of districts used quantitative measurements in addition to visual evaluation. A few of the districts were considering using mobile retroreflectometers for evaluation and wanted to see how it worked for districts that were currently using mobile retroreflectometers. The second subtask involved comparing the subjective evaluation and measured retroreflectivity. This was achieved by conducting two night tests with participants from TxDOT and TTI. The first test was conducted entirely on open roads whereas the second test was conducted entirely on a closed experimental course set up. Researchers correlated the subjective rating with the actual retroreflectivity values. Also several trend analyses were conducted to see how well the subjective ratings followed the actual retroreflectivity trend. Researchers carried out trend analysis for different pavement marking colors, pavement type, etc. Retroreflectivity data were collected using both handheld and mobile retroreflectometers, which enabled researchers to compare measurements taken from handheld and mobile retroreflectometers. In the second night test, researchers tried to capture the effect of minimal training on subjective evaluation. Chapter 4 of this report presents the compilation of the current practices in pavement marking retroreflectivity assessment adopted by all 25 TxDOT districts. This chapter also provides details of the two night tests where subjective evaluation was compared with actual measured retroreflectivity values. 2.2 TASK 3. MOBILE MEASUREMENTS AND BEST PRACTICES In this task researchers conducted a sensitivity testing of a mobile retroreflectometer. This sensitivity testing sought to quantify the effect of several factors on retroreflectivity measurements taken using mobile retroreflectometers. Some variables used to test the sensitivity of mobile retroreflectometers are: internal temperature, measurement geometry, 6
19 lateral position, speed, ambient light, and signal to noise ratio. This task involved controlled dynamic and static experiments using a Laserlux vanmounted mobile retroreflectometer. Discussion on major variables that affect mobile retroreflectivity measurements and the resulting calibration requirements, data collection methods, and data output requirements are documented as best practices. This task also provides a proof of concept for sampling methodology to select roadways for retroreflectivity evaluation. Chapter 5 of this report provides more details on the mobile measurement best practices and sampling methodology. 2.3 TASK 4. PAVEMENT MARKING MANAGEMENT SYSTEM BEST PRACTICES TxDOT has many different databases that track a host of variables. These databases use a variety of referencing systems that can potentially be used to track, relate and manage different types of markings on different types of pavements, under different environmental and traffic conditions. Using these databases as one system provides TxDOT with the information to make informed decisions on past marking performance to predict future results. New technologies may also provide a means to improve pavement marking retroreflectivity measurement, along with a series of best measurement practices. This task investigated the ability to link existing databases with pavement and markings information. Researchers also developed recommendations and prototypes on elements to include, data file setup, format, etc., that will be useful to automate the data aggregation and display. Processing techniques and methodology to display the retroreflectivity data on GIS maps and provide drill down detail allowing the user the ability to glace at a map to determine the conditions over an entire district to the detailed readings of a specific segment of roadway. Chapter 6 of this report provides more detail on this task. 2.4 TASK 5. SUMMARY OF FINDINGS AND RECOMMENDATIONS A comparison of handheld and mobile retroreflectometer readings showed a close correlation between the two sets of data. This indicates that mobile retroreflectometers, when 7
20 properly calibrated and used, can record accurate measurements. The subjective retroreflectivity analysis indicated that there was some correlation between visual evaluation and actual measurements, but the trend was not consistent. Minimal training provided to participants did not show any consistent improvement in their visual evaluations based on the small sample of test subjects. The sensitivity analysis conducted on various factors influencing mobile retroreflectometers showed that some factors had greater influence on mobile retroreflectometer readings than others. Distance from which the measurements are taken and position across the measurement window seemed to have the most significant impact on the mobile retroreflectivity measurements. Of the evaluating factors data acquisition frequency, vehicle speed, and small changes in measurement geometry made no practical difference to the mobile measurements. Ambient lighting too did not have any significant impact on the mobile measurements. However, constant speed (without much acceleration/deceleration) was found to provide best results. A fairly simple and useful approach to Pavement Marking Management System (PMMS) is described in this project. There were numerous benefits to linking the Pavement Management Information System (PMIS) database to the retroreflectivity readings such as deriving pavement marking degradation curve, visual Geographic Information Systems (GIS) maps of state of pavement markings, and reducing the processing time by automating these procedures. Chapter 7 provides a summary of the tasks completed and provides a detailed list on the major findings from each of the tasks. The chapter also provides recommendations for implementation and areas of further study. 8
21 CHAPTER 3. LITERATURE REVIEW Nighttime visibility of traffic signs and pavement makings are necessary to delineate the roadway to provide guidance for drivers and safe operation of traffic. Signs and markings are valuable devices intended to improve motorists safety and need to be maintained for maximum benefits where installed. Retroreflectivity, an important property of signs and pavement markings, allows motorists to more easily see these devices at night. In the early 1990s, Congress mandated that the Secretary of Transportation revise the Manual on Uniform Traffic Control Devices (MUTCD), published by the Federal Highway Administration (FHWA), to include minimum retroreflectivity standards that need to be maintained for all pavement marking and signs on public roads (3). This chapter presents a brief review of some of the related topics concerned with retroreflectivity of pavement markings and minimum retroreflectivity standards for traffic control devices. This chapter starts with a brief introduction to various aspects related to pavement markings and their retroreflectivity, followed by a time-line presentation of the minimum retroreflectivity implementation efforts that traffic signs have undergone. The next section discusses some of the research efforts undertaken in establishing the minimum retroreflectivity for pavement markings. The final section reviews the effectiveness of mobile retroreflectometers in measuring the retroreflectivity of pavement markings and highlights some of the practical issues in the use of mobile retroreflectometers. 3.0 PAVEMENT MARKING MATERIALS Many pavement marking materials are used around the country for various reasons. Table 2 provides a comprehensive list of pavement marking materials (4). The table also provides the total number of agencies that at the time were using a particular marking material and the percentage of agencies by category. Some of the commonly used pavement marking materials like waterborne paints, solvent paints, thermoplastic, tapes, and others are discussed in this section. Advantages and disadvantages of these pavement marking materials will also be discussed. 9
22 Table 2. Pavement Marking Material Types Used by Transportation Agencies (4). Type of Markings Longitudinal Markings Waterborne paints Thermoplastic Performed tape flat Performed tape profiled Epoxy Conventional solvent paint Methyl methacrylate Thermoplastic profiled Polyester Polyurea Cold applied plastic Experimental Green lite powder Polyester profiled Tape (removable) HD-21 Pavement Markers Raised retroreflective Recessed retroreflective Snowplowable retroreflective Non-retroreflective Transportation Agencies Reporting Using the Marking Material Total State Canadian Country City (51) a % b (37) a % b (5) a % b (5) a % b (4) a % b a Number of transportation agencies that responded to survey. b Percentage of the responding agencies reporting using the marking material Paints One of the most widely used pavement marking materials is waterborne paint. Waterborne paints are the least expensive pavement marking material available and are environmental friendly, with less Volatile Organic Compound (less than the permissible limit of 150 g/l of VOC) and easily disposable. Conventional solvent paints, though more durable than waterborne paints, have high VOC content and have seen diminishing use after the introduction of new regulations by the Environmental Protection Agency (EPA). Another advantage of waterborne paints is that they can be applied with greater thickness when compared to solvent based paints. Waterborne paints are usually sprayed using a striping truck and the thickness of paint application can be varied using truck speed or outflow rate (5). Higher thickness of waterborne paints can hold larger glass beads which can be more efficient in terms of visibility (retroreflectivity) during wet-night conditions. Waterborne paints perform similarly on asphalt and concrete pavements, but the durability of waterborne paints has been a common complaint of many state agencies. Waterborne paints wear off quickly and lose their retroreflectivity sooner than other pavement 10
23 marking materials when exposed to high traffic conditions. For the above reason, waterborne paints are typically used for temporary pavement markings or in areas with low traffic volumes, unless restriped at least annually. Also, due to the short service life of waterborne markings, several state agencies prefer to repaint the waterborne markings on a fixed schedule rather than restriping based on quantitative measures (4) Thermoplastic Thermoplastic is also another widely used pavement marking material due to its moderate cost and long durability. Glass beads form one of the components of thermoplastics along with binder, pigment, and other fillers. Thermoplastics are environmental friendly with low VOC content. Thermoplastics are applied using various methods like box or ribbon extrusion, or spray. TxDOT most commonly uses the spray applied thermoplastic (5). The majority of pavement markings in Texas are thermoplastic. Reapplication of thermoplastics over older thermoplastic pavement markings does not require the removal of the old marking. Thermoplastics perform well on asphalt pavements, but not as well on concrete pavements. It is reported that many state agencies have discontinued the use of thermoplastic pavement markings on concrete pavements. Thermoplastics tend to crack away from concrete resulting in reduced retroreflectivity and durability of the marking Preformed Tape Tape based pavement markings are factory manufactured with glass beads built into the tape. New tapes typically have a higher initial retroreflectivity than standard markings. Tapes are used in limited conditions due to their high cost, but many tapes come with a warranty on their performance. Tapes are typically used on concrete surfaces and in high traffic areas. There are two application methods for preformed tape, the inlaid and overlaid methods. The inlaid method is used on new roadway surfaces and is usually the preferred application. The overlaid method is used on preexisting road surfaces. In the case of overlaid tape, surface preparation and primers may be recommended for proper bonding (5). Tapes generally have a life span of four to eight years, and the life span differs based on the type of tape and roadway conditions. Proper application of tapes seems to have stringent requirements such as proper pavement and air temperature, curing time, use of quality adhesives, etc. However, many state 11
24 agencies feel that advantages of using tape in certain situations outweighs the application and cost requirements Epoxy Epoxy paint is a durable pavement marking material that has good adhesion to both asphalt and concrete pavements. Epoxies are comprised of two components that are mixed on site during application. The first component of epoxy contains resin, pigment, extenders, and fillers, while the second component contains a catalyst to accelerate the setting and reduce drying time. Glass beads are sometimes premixed in the first component and are applied on top of the pavement marking stripes while still wet. Epoxy markings have moderate cost and an expected service life of two to four years. Though it is also noted in some studies that epoxy paints discolor with age when exposed to intense ultraviolet rays, many agencies prefer epoxy paints on concrete pavements with high traffic volumes due to its durability and cost. Epoxies are applied using special equipment, mounted on a truck where both components are mixed at a certain temperature, and sprayed onto the pavement (4) Other Materials Methyl methacrylate is another durable pavement marking, but its use has been very limited in United States except for Alaska. Methyl methacrylate has less stringent requirements for application compared to previously discussed materials, i.e., it can be applied in very cool conditions. This material bonds well with asphalt and concrete. Polyurea is a newer pavement marking material claimed to be durable and effective on both asphalt and concrete pavements. This material has not been popular among most state agencies surveyed due to the need for special equipment required for application and higher cost compared to other materials Usage and Costs The South Carolina Department of Transportation conducted a survey, where transportation agencies in all 50 states, including Puerto Rico and District of Columbia were asked their overall preferences for pavement marking materials, and their preference of interstate pavement marking materials. Table 3 presents a summary of the responses from 29 participating agencies for the usage of various marking materials (6). The results from the survey concur with 12
25 the discussion provided on various pavement marking materials earlier in this section. Table 4 presents the cost and service life comparison of each of the above discussed pavement marking materials (7). The table provides the installation cost, service life, and life cycle cost of each marking type for white and yellow markings. It can be seen that waterborne paint has the least installation and life-cycle cost, but also lowest average service life. This lower service life will require more frequent restriping of the markings and should be considered for safety and logistical purposes. It should also be noted that though installation costs are the same for a marking material when compared between white and yellow markings, the life-cycle costs are different for white and yellow markings for the same marking material. Table 3. Pavement Marking Materials and Overall Usage (6). Marking Material Overall Interstate Water-based paint Solvent-based pain Tape Thermoplastic Epoxy Other 90% 38% 66% 76% 55% 10% 38% 3% 21% 34% 28% 10% Table 4. Pavement Marking Cost and Service Life (7). Material White Waterborne paint Epoxy Methyl methacrylate Methyl methacrylate - profiled Polyester Preformed tape profiled Thermoplastic Thermoplastic profiled Yellow Epoxy Methyl methacrylate Methyl methacrylate - profiled Polyester Preformed tape profiled Thermoplastic Thermoplastic profiled Pavement Marking Installation Cost ($/ft) Pavement Marking Service Life (months) Life-Cycle Cost to Provide Pavement Marking ($/ft/yr) Typical Range Typical Range Typical Range
26 3.1 PAVEMENT MARKING USAGE Pavement marking usage can be broadly classified as how the markings are used (laid out) on the road. Possible marking uses would be longitudinal, transverse, symbols, words, and special markings. One major concern with degrading retroreflectivity of pavement markings arises in the case of longitudinal markings that are used for delineating the traffic in different directions or along the same direction. Poor visibility of longitudinal pavement markings can be a contributing factor in vehicular crashes. Longitudinal pavement markings can be further classified as centerline markings, edgeline markings, and lane line markings. Centerline markings are used to separate traffic flowing in opposing directions and are always yellow in color. Centerline markings can be either a lane line (also called skip or broken lines) or a double line with a combination of broken and solid lines. Edgelines are solid yellow or solid white line and are used to mark the edge of the travel lane. Lane lines are used to mark lanes along a single direction when multiple lanes exist. Lane lines are always white in color and are typically a broken line unless passing is not permitted. Also white dotted lane lines are sometimes used in merging areas to delineate merging lanes (8). 3.2 PAVEMENT MARKING EVALUATION TECHNIQUES The following discussion provides the pros and cons on various pavement marking evaluation techniques Visual Inspections Visual inspection is a subjective technique used to evaluate the quality of a marking. The goal of the inspection is to make sure that the marking is providing adequate retroreflectivity and presence. Pavement Marking Management systems typically involve both daytime and nighttime visual inspections. Pavement markings are more adequately evaluated with a visual inspection at night versus the day because the ability of the marking to retroreflect light can be seen by how much of the headlamp light is reflected back toward the vehicle. Even at night though, the evaluation is still subjective and the quality of the marking will differ depending on the opinion of the observer. Visual inspections are usually recommended on a yearly basis (5). 14
27 Visual inspections have several advantages such as: simple and fast, low cost, no special equipment, and very little impact on traffic while conducting the inspection. The downside of visual inspection is that it is subjective in nature, and results may vary widely from one evaluator to another. Also visual inspection results may vary depending on the contrast between pavement marking and the pavement. For example, two white-colored pavement markings having the same retroreflectivity values, one on a concrete pavement and the other on an asphalt pavement, could be perceived differently by the evaluator. The pavement marking on darker pavement could be perceived as brighter than the pavement marking on the lighter pavement. Thus, visual inspections are prone to human error, are hard to verify for correctness, and therefore are not the most reliable technique to produce consistent results Handheld Retroreflectometers Handheld retroreflectometers provide one means of obtaining a quantitative measure of pavement marking retroreflectivity. A handheld retroreflectometer is a small unit that is manually placed and moved along a line while collecting retroreflectivity readings. Handheld retroreflectometers can normally be operated by a single person, but additional crew would be required if a lane closure is necessary or for watching for traffic if a lane closure is not provided (6). Advantages of handheld retroreflectometers are: simple calibration process, operation requires little training, consistent and reliable data collection, and less expensive to purchase and maintain compared to mobile retroreflectometers. 15
28 Disadvantages of handheld retroreflectometers are: may require lane closures to take measurements (especially for lane lines, may lead to unsafe situations as the operator is exposed to traffic, fewer samples can be collected in a given time, and measuring long lengths of pavement markings can be time consuming and costly Mobile Retroreflectometers Mobile retroreflectometer provide another means of obtaining a quantitative measure of pavement marking retroreflectivity. Mobile retroreflectometers are mounted to the side of a vehicle and collect retroreflectivity as the vehicle drives down the road. An operator inside the vehicle controls the retroreflectometer and monitors the data collection via the connected computer software. Mobile retroreflectometers themselves are about four times as expensive as a handheld retroreflectometer, but this does not include the cost of the necessary computer system or vehicle to use. Mobile retroreflectometers also require more training and maintenance than handheld retroreflectometers. Mobile retroreflectivity training is necessary if high quality data are to be collected. Mobile retroreflectometers do have several advantages over handheld retroreflectometers. Mobile retroreflectometers can measure much larger samples over a much longer length of road in a quicker ammount of time than by just using a handheld retroreflectometer. The large quantity of data that mobile units can capture make them an effective tool in developing programs like a Pavement Marking Management system. Because the mobile retroreflectometer can be mounted on a vehicle, mobile retroreflectivity data collection does very little to disrupt traffic while taking measurements, and lane closures are not required. Mobile retroreflectometers typically require a two person team to collect data, one for driving the instrumented vehicle and the other for operating the software. Since the data collection team will be inside the vehicle for the most part, there are fewer safety concerns in operating mobile retroreflectometers as compared to handheld retroreflectometers. Mobile retroreflectometers are sensitive to several factors that have much less impact on handheld retroreflectometers thus the need for proper training. Factors such as environmental conditions, measurement geometry, calibration procedures, software operation, and driving precision all can effect the quality of the data. 16

29 3.3 ASPECTS OF PAVEMENT MARKING VISIBILITY Retroreflectivity, contrast between pavement marking and the road surface, and viewing angle (measurement geometry) are some of the important aspects for good visibility of pavement marking. This section provides a brief description of each of the above aspects Retroreflectivity Retroreflectivity is a property of a material where incident light is reflected back towards its source. Retroreflectivity makes a material appear bright when light illuminates it. The higher the retroreflectivity of a material, the higher the percentage of light reflected back to the source and the brighter the material appears. Coefficient of retroreflected luminance (R L ) is the most common measure used to describe the retroreflectivity of pavement markings. Coefficient of retroreflected luminance is typically expressed in units of mcd/m 2 /lux. Retroreflectometers are able to measure retroreflectivity by illuminating a marking with a known amount of light and measuring how much of that light is returned to the unit. Figure 1 shows how glass beads embedded in a pavement marking material retroreflect light. Figure 1. Pavement Marking Retroreflection Contrast Ratio Contrast between the pavement marking and the road surface is an important factor for visibility of pavement markings. Daytime contrast is a comparison of the color contrast between the marking and the road surface. The nighttime contrast ratio (CR) is relationship between the 17
30 retroreflectivity of the pavement marking as compared to that of the surrounding road surface (see the following equation) (6). CR R L( Marking ) R R L( Pavement Surface) L( Pavement Surface) Measurement Geometry The currently accepted geometry for measuring pavement marking retroreflectivity is a 30-meter geometry. As shown in Figure 2, the 30-meter geometry has an observation angle of 1.05 degrees and an entrance angle of degrees (co-entrance angle of 1.24 degrees). European Committee for Normalization (CEN) initially set the standard 30-meter geometry, and it is described in ASTM E 1710 (9). Prior to the early 90s, studies measuring retroreflectivity have been found to use various geometries, such as 12 or 15-meter. Since a change in geometry results in significant change in the readings, measurements made using different geometries are not precisely comparable. However with the establishment of the 30-meter geometry standard, a more consistent comparison of measurements will be possible. Such a standard is also necessary in order to establish minimum retroreflectivity values for pavement markings. Figure 2. Standard 30-Meter Geometry for Retro Measurement (10). Retroreflectometers, both handheld and mobile, use a scaled version of the 30-meter geometry. The reduced scale is compliant with the 30-meter standards, in terms of maintaining all the required angles, but typically performs measurements at a distance much shorter than 18
31 30-meters. Mobile units for instance measure at a distance of 10 meters, and handheld units generally measure within one meter. Retroreflectometer manufacturers adopted a reduced scale for practical reasons and for the fact that there would be less interference to the incident and reflected light when taking field measurements with the reduced scale (10). 3.4 FACTORS AFFECTING RETROREFLECTIVITY AND MARKING VISIBILITY This section provided discussion on some factors that affect pavement marking visibility. These factors need to be accounted for when assessing the retroreflectivity and retroreflectivity requirements of pavement markings. Some of the other factors that have been reported to influence pavement marking visibility but are not discussed are: pavement wear, pavement marking presence, centerline configuration, lateral separation between double lines, retroreflective area in the pavement marking, windshield transmission, driver workload, weather conditions, and traffic volume. For a given marking, retroreflectivity depends on the number of beads present, composition of the beads, surface condition of the beads, embedment depth of the beads, and binder material used. Pavement markings typically have their highest retroreflectivity shortly after they are applied and excess beads have been removed by traffic, assuming proper marking application. In some cases markings degrade extremely fast if beads were not embedded enough, because traffic quickly dislodges the beads. In other cases the beads may be over embedded causing a low initial retroreflectivity that may increase as the beads become more exposed. Typically retroreflectivity decreases over time for several reasons; the following are several examples: glass beads get dislodged due to traffic, degradation of binder due to oxidation and ultraviolet sunlight resulting in bead loss, 19
32 changes in pavement marking color due to fading pigments, brittleness of binders can result in detachment of binders along with glass beads from the pavement surface, snowplowing can also result in significant loss or scraping of glass beads and can also result in binder detachment, and markings become dirty and rain is not sufficient to clean them. Not all pavement marking retroreflectivity decreases at the same rate or even in the same manner. Some markings may exhibit a linear degradation in retroreflectivity, while others may exhibit more of an exponentially decreasing retroreflectivity. Table 5 presents the components of pavement markings, the factors of these components that influence retroreflectivity, and the resulting effect of those characteristics (10). Table 5. Factors Affecting Retroreflectivity in Pavement Markings (10). Factor Characteristic of Factor Factor Effects Glass Beads Amount and Dispersion Amount: bead surface area for retroreflectance Dispersion: scattering of reflection between beads Embedment Depth Surface area available for retroreflectance, adhesion to binder material Refractive Index Amount of light directed to reflecting binder surface Size Surface area for retroreflection, wet weather performance Clarity Diffusion of light within the bead Roundness Direction of retroreflection Binding Color White typically reflects more than yellow Material Type Some materials are more durable and reflective than others Thickness Marking longevity Other Factors Wet Markings Pavement Surface Roughness Refractive index is changed and specula reflection is increased, reducing retroreflectivity Material adhesion and shadowing of beads in the valleys Dirt or Other Obscuring Material Type of Retroreflectometer Used for Measurement Any object obscuring the light hitting the marking will reduce retroreflectivity Ability to reproduce measurements varies between instruments Driver Age With an increase in age, the human eye needs more illumination to view an object due to a thickening and yellowing of the cornea. Therefore older drivers need a more retroreflective 20
33 marking in order to see a pavement marking from the same distance as a younger driver. Consequently, the age of a driver influences marking visibility and minimum retroreflectivity requirements to provide an adequate pavement marking. Several studies have considered driver age in arriving at minimum retroreflectivity values; many are described in Section 3.7. A study by the Virginia Transportation Research Center (VTRC) distinguished age groups above 65 and below 65 years. The VTRC report concludes that subjects above 65 years were generally unsatisfied with pavement marking brightness that was acceptable to subjects below 65 years (11) Pavement Marking Contrast A pavement marking evaluation study for the Minnesota Department of Transportation reported that there was not a good correlation between the public perception of pavement markings and measured retroreflectivity. One of the missing components cited in the study for not obtaining a good correlation was contrast. Contrast between the roadway surface and the pavement marking plays a significant role in the visibility of pavement markings. The study found that pavement markings on a dark bituminous pavement surface were rated consistently as very good or excellent by the subjects even though the retroreflectivity of the lines did not justify this high rating (12) Pavement Marking Beads Glass beads are an important component that provides retroreflective properties to pavement markings. Several factors related to glass beads influence the retroreflectivity of pavement markings and the longevity of the retroreflectivity. Some of these include bead size, bead properties, mixture of beads, quantity of beads, bead coatings, and embedment depth. In pavement marking applications smaller beads tend to be easier to install and are less likely to encounter bead loss than larger bead applications. Larger beads are often recommended though because they are more likely to perform well in wet conditions and can provide higher retroreflectivity levels when properly installed. A double drop system of a mixture of large and small beads provides benefits of both bead types. Optimal bead embedment depth ranges from 55 to 60 percent of bead diameter (13). Bead properties like refraction index (RI), bead shape (roundness), and surface characteristics influence the retroreflective ability of beads embedded in 21
34 the pavement markings. Usually round beads with smooth surface are found to have a better retroreflective property than of other bead shape and surface characteristics. The optimal RI in dry conditions is approximately 1.9 and higher than that for wet conditions. Some wet reflective beads are in the 2.4 to 2.5 RI range Retroreflective Raised Pavement Markers Retroreflective raised pavement markers (RRPMs) are highly retroreflective markers that are used to supplement normal pavement markings. Studies conducted to determine minimum retroreflectivity of pavement markings have found that with use of adequate RRPMs (at least three in view), the necessary pavement marking retroreflectivity is less than if no RRPMs are present (14, 15, 16). TTI research also found that new RRPMs have an average end detection distance of over 200 ft more than the next best pavement marking material studied under rainy conditions (17) Headlamp Illumination The position of the driver and headlamps influences the viewing geometry of pavement markings. Height of the headlamps above the pavement surface affects the entrance angle. Vertical separation between the headlamp and the driver s eye position affects the observation angle. The height of the driver s eye above the pavement surface determines the projected marking area visible to the driver. In a study conducted by the Virginia Tech Transportation Institute, pavement marking detection distances were increased by as much as 50 percent when viewed from semi truck verses a sedan (18). A study by the University of Michigan also reported a 19 percent increase in the pavement marking detection distance when the distance between the headlamp and drivers height was increased from 0.6 m to 1.2 m (19). Taken together, these studies show that truck drivers should have better visibility than car drivers. A study using Exact Road Geometry Output software has reported the differences in illumination with use of different headlamps. Table 6 presents the reported results (13). From the table it can be seen that newer headlamps have higher illuminance compared to the older headlamps. Drivers using newer headlamps would most likely have better visibility of pavement markings compared to those using older headlights with lower illuminance. This is due to a higher illuminance of the newer headlamps, resulting in a more light being reflected back. 22
35 Table 6. Illuminance on Pavement Marking by Headlight Type (13). Headlamp Edgeline Illuminance on Pavement Marking (lux) Centerline 30 m 60 m 100 m 150 m 30 m 60 m 100 m 150 m 2A CARTS UMTRI UMTRI *Lane width = 12ft Width of Marking The width of the pavement marking has been found to be a factor that may influence the visibility distance and minimum required retroreflectivity. Research is somewhat inconclusive but studies have found that with wider pavement markings, preview time is reduced, and the minimum required retroreflectivity is decreased. A study conducted by Lundkvist et al. showed that there is a consistent increase in visibility distance when a 6-inch wide marking is used instead of a 4-inch wide markings for speeds ranging from 40 to 70 mph (20). Another study reported by Gibbons indicates that wider pavement markings results in increased visibility distance, however the report also claims that at some critical width, that has yet to be determined, the benefits of increased visibility is limited (21). A review by Debaillon et al. pointed to several studies that experimented with wider pavement markings, indicating inconclusive results on the benefits of wider pavement markings (14). 3.5 PAVEMENT MARKING MANAGEMENT SYSTEMS A Pavement Marking Management system is an advanced method of maintaining and monitoring pavement markings. A PMMS can take many forms from a basic system that only monitors a few aspects of the markings to a comprehensive system that monitors everything possible. Several states have begun using a PMMS in an attempt to improve their marking systems and reduce expenditures on pavement markings (7, 22, 23, 24, 25, 26, 27, 28). A PMMS may be necessary when minimum maintained retroreflectivity levels of pavement markings are implemented. The main goal of a PMMS is to improve decision making with regards to pavement markings. Using the PMMS, decision makers can prioritize the restriping of roads, the best 23
36 products to put on certain roadway classifications, and anticipate future marking expenditures. These decisions are aided by the data input into the PMMS. Typical inputs into the systems are as follows (7, 22, 25): installation information, o location and quantity, o date, o marking binder type, o marking bead type, o contractor, o cost, traffic volumes, retroreflectivity data, and visual assessment (presence). The installation information and periodic updates to the retroreflectivity data are the main components of the PMMS. Using this information, degradation curves can be created to determine an expected life of the marking and to determine when a marking is no longer adequate. Retroreflectivity data can be gathered either by handheld or mobile measurements. Handheld measurements will not provide as much data as mobile measurements but can be used if mobile data are not available. When large quantities of data are needed or data are needed on high volume roads, a mobile system will likely be the most effective means of retroreflectivity data collection. A nighttime visual assessment of the markings may also be used if actual measurements of retroreflectivity are not available. A nighttime visual assessment would be considered the minimum information needed to determine the markings nighttime effectiveness. Missouri has already seen positive effects from their PMMS (22, 26). They have been able to monitor different products and track the retroreflectivity degradation and life span. This has lead to improved striping policy and the reduction in the amount of times certain roads are striped, saving money. The safety implication of maintaining all markings to an acceptable level has not been documented, but ensures that all markings meet a minimum maintained retroreflectivity level will be necessary when the final rule is implemented. 24
37 3.6 MINIMUM RETROREFLECTIVITY OF TRAFFIC SIGNS Following the congressional mandate to implement minimum retroreflectivity levels, there has been considerable progress in research as well as implementation of minimum retroreflectivity standards for traffic signs. This section documents the timeline of progress in the path to implementation of minimum retroreflectivity for traffic signs. Carlson and Hawkins have documented more details on the significant research results that were carried out regarding minimum retroreflectivity for traffic signs prior to the Congressional mandate and post mandate (29). A summary of the timeline for the implementation of minimum retroreflectivity for signs is as follows (30) Center for Auto Safety petition FHWA to established reflectivity standards for traffic signs and pavement markings Congressional mandate to revise MUTCD to include minimum retroreflectivity standards for signs and markings Initial research on minimum retroreflectivity for traffic signs AASHTO task force review issues on presenting minimum retroreflectivity values in MUTCD and agency liability issues Updated research on overhead and street name signs. New headlamps accommodated in research. More workshops conducted Rule proposed (NPA) to include in MUTCD, methods to maintain minimum retroreflectivity for traffic signs Comments solicited for the proposed rule (about 350 comments received from state agencies, transportation organizations, and individuals) Supplemental rule proposed (SNPA) based on the comments to include in MUTCD, minimum retroreflectivity values and the methods to maintain retroreflectivity above the minimum values Comments solicited for SNPA till November 2006 (received 121 letters containing approximately 550 individual comments) January 22, 2008, final rule effective. 25
38 A glimpse at the above timeline shows the length of time that passed for the rule on minimum retroreflectivity for traffic signs. This gives an estimate of the possible time the pavement marking minimum retroreflectivity might take to be implemented. 3.7 MINIMUM RETROREFLECTIVITY OF PAVEMENT MARKINGS Traffic signs have now complied with Congress s mandate on minimum retroreflectivity levels, but pavement markings are just now in the initial stages of addressing this mandate. The slower progress for pavement markings is likely due to the inherent difficulty in designing appropriate experiments to determine minimum retroreflectivity and the variables that influence marking visibility. Many of the early research studies that were carried out regarding retroreflectivity of pavement markings were difficult to adopt due to varied geometry that was used in measuring retroreflectivity. However, standardization in measurement geometry by ASTM has provided a standard platform to assess pavement marking retroreflectivity. Several studies over the last couple decades have looked at minimum retroreflectivity levels (12, 21, 29, 31, 32, 33, 34, 35, 36, 37, 38), and several of these studies are discussed below. Zwahlen and Schnell conducted some of the early research to determine the minimum retroreflectivity with standard 30-meter geometry (33). The FHWA funded development of a computer model, Computer-Aided Road-Marking Visibility Evaluator (CARVE), to determine visibility requirements. In 2000, a study was reported to determine the minimum in-service retroreflectivity using an improvised CARVE model (34). The CARVE model in this study uses 30-meter geometry, with an observation angle of 1.05 and entrance angle of The study focused on determining the minimum retroreflectivity of pavement markings with and without RRPMs. This study was conducted for two headlights with two representative age groups: 22 years and 62 years old. The improvised CARVE model used in this study used a preview distance of 3.65 seconds for sections without RRPMs and 2.0 seconds for sections with RRPMs. Minimum retroreflectivity values for all scenarios of different headlights, age groups, and presence of RRPMs were presented as a function of speed, ranging from 25 mph to 75 mph. The study by Zwhalen and Schnell recommends a minimum retroreflectivity of 340 mcd/m 2 /lux for white edgelines and about 260 mcd/m 2 /lux for yellow lines (34). A 2002 study sponsored by the New Jersey Department of Transportation evaluated the state s 3-year fixed time restriping strategy to see if it was consistent with the actual service life 26
39 of the pavement markings (35). Two kinds of data were collected for this study. Retroreflective data for pavement markings were collected on approximately 600 line miles on south New Jersey highways using a mobile Laserlux retroreflectometer. The New Jersey driving public collected the second, subjective visibility data by driving on a 32 mile road circuit at night. An interviewer who drove along with the subject asked questions on the brightness and visibility of the pavement markings. There were 72 subjects involved in this study with equal proportion of male and females. The study indicated that there was no significant variation on the rating between genders. The study also looked into the ratings by age group. The study found a significant difference in visual rating for the three different age groups, less than 35 years, years, and greater than 55 years. Older groups had a lower average rating when compared to younger groups. A strong correlation was found between measured retroreflectivity and night time visibility ratings. The study concluded that a minimum retroreflectivity threshold for restriping was found to be between mcd/m 2 /lux. Anything below 70 mcd/m 2 /lux was unacceptable by all age groups for all types of pavement markings. However, yellow pavement markings had the highest minimum retroreflectivity rated value. Raters above 55 years required retroreflectivity of at least 165 mcd/m 2 /lux for yellow centerlines and 160 mcd/m 2 /lux for lane lines. An experimental study conducted on an expressway in Korea published in 2006 evaluated driver satisfaction with markings of various retroreflectivity levels (36). Road marking tapes 15 centimeters (5.9 inches) wide of white and yellow colors were installed on a 7.7 kilometer (4.8 miles) long section of test bed, which consisted of both concrete and asphalt surfaces. The retroreflectivity of the installed tapes ranged from mcd/m 2 /lux. There were 49 participants in the study with twice as many males as females, and one third of the participants were above the age of 50. Dynamic tests were conducted to see how well the pavement markings were detected. Static tests were conducted to grade the brightness of the road marking tapes. Based on the test results, retroreflectivity values greater than 134 mcd/m 2 /lux for white markings and 104 mcd/m 2 /lux for yellow markings were found to be satisfactory by 90 percent of the participants (36). Because older drivers have diminished visual acuity, they are critical in determining the minimum retroreflectivity for night driving. There has been an increase in the percentage of 27
40 older drivers in United States. Studies have reported that a 62 year old represents the 85 th percentile licensed drivers and about 95 th percentile of night time driver population (34, 35). With the increasing age of the driving population there is an emphasis on research results with minimum retroreflectivity values where older drivers are involved. The University of North Carolina reported a study to determine the minimum retroreflectivity specifically for older drivers (37). Data were collected from 65 subjects, of which 30 were males and 35 females. Average age of the drivers was 62.2 years. This study reports that 85 percent of the drivers felt that 100 mcd/m 2 /lux or more was adequate. In this study an adjustment factor of 1.21 was derived to compensate for reduced retroreflectivity due to unclean headlight and windshield conditions. Considering the adjustment factor, 121 mcd/m 2 /lux was suggested as the minimum retroreflectivity value for any roadway marking (37). However, in this study there was no distinction made based on marking color or type (broken or continuous). Also this study did not consider weather conditions, such as dry or wet weather in determining the minimum retroreflectivity. Most of the research on minimum retroreflectivity of pavement markings seems to range from mcd/m 2 /lux. Factors, such as traffic speed, lighting, and age of driver, influence the minimum retroreflectivity values that drivers require for adequate visibility. Also to be considered is the pavement marking color, the presence of RRPMs, and wet weather conditions. Updates to the earlier recommended minimum levels for pavement marking retroreflectivity were reported in 2007 (38). Earlier recommended values were based on the CARVE computer model, while the updated recommendation of minimum pavement marking retroreflectivity is based on the Target Visibility Predictor (TARVIP) model. The Operator Performance Laboratory group at The University of Ohio developed the TARVIP model. TARVIP has several advancements compared to the CARVE model. Some of the new factors included in the TARVIP model that were of importance to the updated minimum retroreflectivity recommendations were: (38) pavement marking configuration, pavement surface type, vehicle speed, vehicle type (headlights), and presence of RRPMs. 28
41 The TARVIP model was calibrated with updated and latest available datasets of the above mentioned factors to ensure the most accurate minimum retroreflectivity values were derived. For establishing the minimum pavement marking retroreflectivity, specific criteria were used in the TARVIP model. Table 7 summarizes these criteria. Table 7. Factors and Criteria Used in TARVIP Model. Factor Pavement surface type Pavement marking configurations Vehicle types Operating speeds Roadway lighting Pavement marking materials Vehicle headlamp Preview time Driver age RRPMs Criteria Old concrete and old asphalt were used Following three configurations were used: * Single white dashed line to left of vehicle * Single yellow dashed line to left of vehicle * Single yellow dashed line to left of vehicle with a solid white edgeline to right Two vehicle types with dimension of: * 1998 Chevrolet Lumina * 1986 Freightliner * 40 MPH * 55 MPH * 70 MPH Dark roadway used Alkyd paint and beads 2004 UMTRI 50 th percentile market weighted 2.2 seconds 62 years Absent and present, both scenarios considered Table 8 presents the minimum pavement marking retroreflectivity values derived for all combinations of the above mentioned criteria. The study showed that fully marked roads had much lower requirements in terms of minimum retroreflectivity. Vehicles with higher eye position of the driver from the ground level, and lower speeds required lower values of required minimum retroreflectivity. As a recommendation for minimum levels of pavement marking retroreflectivity, the study put forth a table of minimum retroreflectivity values based on roadway marking configuration, travel speed, and presence of RRPMs. Table 9 presents the recommended values. 29
42 Table 8. Minimum Retroreflectivity Values (in mcd/m 2 /lux) Derived from TARVIP (38). Table 9. Recommended Minimum Retroreflectivity Values (in mcd/m 2 /lux) (38). Roadway Marking Configuration Without RRPMs < 50 mi/h mi/h > 70 mi/h With RRPMs Fully marked roadways (with centerline, lane lines and/or edgeline, as needed) Roadways with centerlines only *Applies to both yellow and white pavement markings. 3.8 MOBILE RETROREFLECTOMETERS Mobile retroreflectometers are of practical importance for implementation of minimum retroreflectivity standards for pavement markings and for effective Pavement Marking Management systems. Mobile retroreflectometers take constant retroreflective readings while driving down the road, and thus are able to obtain a greater sample size of the pavement markings measured than can be obtained using a handheld retroreflectometer in a given span of 30

43 time. The mobile retroreflectometer as compared to a handheld retroreflectometer allows for more readings on more roads in a safer mobile environment Technical Details of Mobile Retroreflectometers The Laserlux is the most common form of mobile retroreflectometer. The Laserlux uses a scanning laser unit, and the retroreflected laser light is received by optical sensors and processed to obtain information on the retroreflectivity value (39). Figure 3 shows a diagrammatic representation of the internals of a Laserlux mobile retroreflectometer. Another mobile unit is the Ecodyn mobile retroreflectometer. The Ecodyn uses a metallic iodide lamp and a set of lenses to emit light beams, and an electronic system with amplifiers and filters are used to detect retroreflected light (40). An evaluation study claims Ecodyn can acquire data at every 0.4 meter intervals irrespective of speed. It is also claimed that Ecodyn requires less calibration as it not necessary to calibrate differently for white and yellow markings, an advantage over the Laserlux (40). However, since Ecodyn machines are rarely used in the United States, no significant studies report on its performance characteristics or usage. Therefore, all the references of mobile retroreflectometers later in this report will refer to the Laserlux device, unless specifically mentioned otherwise. Figure 3. Diagrammatic Representation of Laserlux Unit (10). 31
44 3.8.2 Operational Details Reported on Mobile Retroreflectometers Studies using the Laserlux have found several advantages over visual evaluation or handheld systems. A study conducted by Florida Department of Transportation (10, 41) on Mobile Retroreflectivity Testing for a Pavement Marking Management System reported that the Laserlux can collect more than 1000 data points per mile in less than a minute with scans per second. In each scan the laser has capability of scanning a width of 1.1 m, and in each scan 200 discrete measurements can be obtained with about 25 of those measurements on the pavement marking itself (assuming a 4-inch wide marking). The scan width of the Laserlux can accommodate some wandering in vehicle movement. Operationally, use of mobile retroreflectometers can provide a safer environment for operating staff when compared to handheld retroreflectometers, since mobile retroreflectometers do not require personnel outside the vehicle during data collection. Also, the use of mobile units does not induce delay to motorists at the surveying site, and can avoid lane closures, especially when measuring center and lane lines (41) Comparison Between Mobile and Handheld Retroreflectometers Many agencies currently only conduct minimal handheld retroreflectivity data collection if they collect any at all. With the increasing need to monitor retroreflectivity, plans to use mobile retroreflectometers have been increasing. In this section, comparisons between mobile retroreflectometers and handheld retroreflectometers have been provided. Handheld retroreflectometers had exclusively been used to measure pavement marking retroreflectivity prior to the introduction of the mobile device. As a result of longer and more frequent use, handheld retroreflectometers have standards for measurement and are inherently easier to calibrate and conduct measurements, resulting in more accurate readings than mobile retroreflectometers. In testing, good comparisons between handheld and mobile retroreflectivity data have been found. Several studies have compared retroreflectivity data gathered by handheld and mobile retroreflectometers (35, 42, 43, 44). The findings from these studies indicate that retroreflectivity values within 20 percent can be expected when comparing handheld and mobile values assuming both retroreflectometers are properly calibrated. With a better understanding of variables that may affect the mobile readings, the difference between handheld and mobile values can consistently be less than 20 percent. In practice though, users often find it difficult to 32
45 obtain consistent and accurate results using mobile retroreflectometers (35, 45). This is because there is very little guidance on standard practices for calibration and the operation of mobile retroreflectometers. Handheld retroreflectometers are relatively easy to operate and need very little training prior to use. Mobile retroreflectometers are sensitive to various factors and need skillful technicians to accurately calibrate and operate the instrument for accurate measurements. On the downside, due to lack of sufficient guidance on calibration of mobile units, many agencies and personnel feel that mobile retroreflectometers are less accurate when compared to handheld retroreflectometers. Experience, proper calibration, and following proper techniques can result in data that are accurate and consistent. Actual comparisons between handheld and mobile data are documented as part of this study in Section 4.3. In terms of safety, mobile retroreflectometers are found to be safer to operate than handheld retroreflectometers. As mentioned previously, since mobile retroreflectometers do not require any personnel to be on the road during measurement, there is much less of a safety threat to the staff collecting the data. Depending on the calibration protocol and accuracy checks, mobile values may be compared to handheld measurements on similar lines which would require the data collectors to be on the road for a short time. These checks though can be conducted on lower volume roads reducing the threat of interaction with traffic. Also, since mobile data collection does not require stopping to take measurements along the road way, it is unlikely that vehicular collisions would occur due to retroreflectivity measurement in progress. This is especially an advantage when taking retroreflectivity measurements on high speed or high volume roadways. Handheld retroreflectometers need very little time to setup the instrument for taking readings, compared to the calibration requirements for mobile retroreflectometers. On the other hand, operationally, mobile retroreflectometers are much more time efficient and can cover longer stretches of pavement markings than handheld retroreflectometers. While handheld retroreflectometers need to be stationary to take measurements, mobile retroreflectometers are able to take measurements traveling at highway speeds. The cost of a handheld retroreflectometer is less initially and over time when compared to a mobile retroreflectometer. Handheld retroreflectometers are approximately in the range of $12,000 to $25,000 per unit depending on the model, while mobile retroreflectometers can 33
46 roughly cost $80,000 for the retroreflectometer itself and up to $200,000 for the entire package necessary to conduct mobile retroreflectivity data collection (mobile retroreflectometer, van, computer system, and other accessories). Mobile retroreflectometers require more maintenance than handheld retroreflectometers to make sure that everything is working properly due to the additional moving parts and being in the harsh environment of measuring off the side of a vehicle throwing things out of alignment. Though owning and operating mobile retroreflectometers is more expensive, the increased productivity and safety will likely offset these costs (43) Issues Reported with Mobile Retroreflectometers Although mobile retroreflectometers have many advantages, there have been some calibration related concerns with the use of mobile retroreflectometers (46). These concerns are a major issue because if the data provided by mobile retroreflectometers are not accurate then any advantage they have will not matter. A study conducted by Washington State Transportation Research Center reported variability in measurements across the lanes sections with similar AADT and variation in measurements when repeated over the same section of pavement marking on the same day (45). Some studies have also made effort to quantify the variation in measurements. Repeatability and reproducibility are two measures of variation in retroreflectivity measurements. Repeatability refers to the ability of a mobile retroreflectometer to produce consistent reading when conditions of measurement are not changed. Reproducibility is the ability of different mobile retroreflectometers to produce consistent readings when measuring the same markings. A manufacturer at a Canadian facility conducted a repeatability testing using a Laserlux found a 5 percent variance over three runs (47). Tests conducted by the FHWA with three Laserlux instruments found repeatability to be within a 10 percent variation (48). Another evaluation study conducted by Highway Innovative Technology Evaluation Center (HITEC) reported variations due to specific conditions in temperature and humidity. Tests conducted by HITEC in an environmental chamber have shown to have reproducibility with a variation of about 25 percent. In the repeatability tests, maximum variation of about 8 percent was reported under high temperature and high humidity conditions for mobile retroreflectometers (39). 34
47 The variation in measurement with mobile retroreflectometers can to some extent be attributed to the inherent variation of the pavement marking material and sample size. It should also be noted that a significant amount of variation in mobile retroreflectivity reading can be attributed to the sensitivity of mobile retroreflectometers to various conditions. Some possible reasons for variation in mobile retroreflectivity data are listed below (10, 41, 44, 45, 46, 49): conditions at time of calibration may not reflect true field conditions, poor calibration standards and procedures, misalignment of mobile retroreflectometers internal parts, oscillation of the laser scan, improperly set thresholds during calibration and operation, sensitivity of the mobile retroreflectometer to internal temperature, background measurement noise, number of samples collected for averaging, ambient lighting at night and clouds or sun during the day, speed of data collection, difficulty measuring low retroreflectivity markings, measurement position across the laser scan, vehicle dynamics, and roadway geometry affecting measurement geometry. Although some of the studies that have used mobile retroreflectometers have put forth possible reasons for the variations observed in the measurements, little effort has been made in quantifying the effect of some of the stated reasons for variation. The University of North Florida and the Florida Department of Transportation have conducted extensive research into the temperature sensitivity of the Laserlux retroreflectometer (49). Testing determined that the likely cause of the temperature sensitivity was in the optical filters that the Laserlux uses to filter out ambient light. Two sets of filters were tested, and each set experienced a different effect from the temperature increase. When one set was heated from 20 C to 40 C, the retroreflectivity continuously increased as the temperature increase, resulting in a 30 percent increase in retroreflectivity. The second set showed an increase and then a decrease in retroreflectivity as the temperature increased. The results of this testing prompted the manufacturer to include a 35
48 user adjustable algorithm in the software to help compensate for the effects of temperature change. When using the algorithm, the temperature sensitivity was reduced to ±5 percent over the 20 C range. Another way to compensate for temperature changes is to install a thermostat controlled thermoelectric cooler on the mobile retroreflectometer to keep it at a relatively constant temperature. Continued testing of variables that may impact mobile retroreflectivity is needed to improve the accuracy and repeatability of mobile retroreflectivity data collection. This research will attempt to address many of the possible sources of variation to see their effects and possible ways to avoid any impact that they may have. 36
49 CHAPTER 4. SUBJECTIVE RETROREFLECTIVITY RATING EVALUATION Traditionally, most districts within TxDOT subjectively evaluate pavement markings to recommend if the pavement marking retroreflectivity level is adequate or if it needs to be restriped. These subjective evaluations of pavement markings have several short comings; some of them are: bias based on the evaluators experience, training, and visual capabilities; less than systematic management of pavement markings; inconsistent and unrepeatable results; and potentially, inefficient allocation of funds for restriping. However, the bias introduced in the subjective rating of pavement markings has not been quantified for TxDOT to get an estimate of the extent of induced bias in subjective evaluation. Quantifying any potential biases caused by using subjective ratings could be useful in improving the subjective evaluation through training, which would lead to more effective fund allocation. This chapter provides some insights on the accuracy of subjective retroreflectivity evaluation. The first section summarizes the current practice of pavement marking retroreflectivity evaluation adopted by all the 25 TxDOT districts. The second section provides a quantitative assessment of subjective evaluation as obtained from the first night retroreflectivity testing. The third section provides further insights on subjective evaluation as obtained from a second night study, specifically the effect of minimal training on subjective evaluations. A final section provides a quantitative comparison of handheld and mobile retroreflectometer readings taken at several pavement marking sections. 4.0 CURRENT PRACTICES IN RETROREFLECTIVITY ASSESSMENT Researchers conducted a phone survey to identify the current practices in pavement marking retroreflectivity assessment in all the 25 TxDOT districts. Operations and/or maintenance staff in each TxDOT district were contacted and the following information was sought: assessment methods used for pavement marking retroreflectivity, frequency of assessment, 37
50 if they possess a handheld or mobile retroreflectometer, and pavement marking restriping practices. Table 10 summarizes information obtained from all the districts. Almost all the districts primarily relied on visual inspection for pavement marking retroreflectivity assessment. The frequency of assessment was typically one to two assessments per year. Eleven out of 25 districts indicated that they had a bi-annual visual inspection program in place, while three districts indicated that they had yearly assessment program. The rest of the districts visually inspected the pavement markings on an as-needed basis or whenever they received public complaints. Some of the districts that had yearly or bi-yearly assessment program indicated that in addition to their scheduled assessment, they also performed visual assessments on an asneeded basis. Two districts indicted the recent use of a mobile retroreflectometer to assess the pavement markings in conjunction with visual inspection. Both the Abilene and Atlanta districts indicated that they had a contract for collection of the mobile retroreflectivity data on their roads. The Beaumont district indicated that they were considering a contract for mobile retroreflectivity assessment, but were waiting to see the results of mobile retroreflectivity assessments from other districts. Two districts have had contracts with mobile retroreflectivity contractors for warranty pavement markings (Houston and San Antonio). Only the Abilene district indicated a regular use of a handheld retroreflectometer in conjunction with visual inspections. Several districts are using warranty pavement markings, and provisions are made in those warranties to measure the retroreflectivity on a periodic basis. Some districts use mobile retroreflectometers to measure warranty markings, initial retroreflectivity readings, and after visual inspection and/or public complaint. The use of mobile retroreflectivity readings is expected to increase as initial retroreflectivity readings are being required. Austin was the only district that indicated use of TxTAP information to assess their pavement markings in conjunction with visual inspections. Table 10 also indicates the information obtained on pavement marking restriping practices adopted by some districts. 38
51 Table 10. Summary of TxDOT Districts Pavement Marking Evaluation and Restriping Practices. TxDOT Districts Visual Inspection Pavement Marking Evaluation Methods Handheld Retroreflectometer Mobile Retroreflectometer Abilene Yearly and as needed Yes Recent contract Amarillo 6 months Atlanta 6 months Recent contract Austin 6 months Considering a As Needed Beaumont contract Brownwood 6 months Bryan Yearly Maintenance contract Childress Cyclic basis Corpus Christie 6 months Maintenance contract Dallas 6 months Maintenance contract El Paso Yes Yes Ft Worth 6 months As Needed Contract in the past Thermoplastic changed every 6 months and Tape Houston changed every 3 years 6 months (day & Laredo night inspection) Maintenance contract Yearly on thermo Lubbock and polyurea Lufkin As Needed Odessa 6 months Maintenance contract Paris Yearly and as needed Restriping job done each year Pharr Maintenance contract San Angelo Yearly (day & night inspection) Markings replaced on cyclic basis San Antonio Performance based contract Tyler 6 months Waco As Needed Maintenance contract Wichita Falls Along with sign inspection Markings replaced on cyclic basis Yoakum 6 months and as needed 4.1 FIRST STUDY ON SUBJECTIVE RETROREFLECTIVITY RATING ASSESSMENT Pavement Marking Re- Striping Practice This section provides the results of a study that was conducted to evaluate the subjective ratings against measured retroreflectivity at several test segments. The following are the objectives of the analysis: compare handheld and mobile retroreflectometer readings, 39
52 compare subjective ratings and measured retroreflectivity readings, conduct a trend analysis of subjective ratings by pavement and marking characteristics, and check for consistency in subjective rating and determine factors that could affect subjective ratings Subjective Retroreflectivity Test Procedure Researchers conducted a subjective retroreflectivity assessment test to determine how the members of this research project subjectively rate pavement marking lines as compared to the measured retroreflectivity. The group that participated in this study consisted of eight people with different experience levels in assessing pavement marking retroreflectivity. The test was conducted between 9:00 PM and 10:30 PM on a pre-selected route in the Bryan/College Station area. Before the start of the test, the group was briefed about the test procedure and the test questionnaire was explained. A sample test questionnaire is attached in Appendix A of this memorandum. The evaluating group was driven in three separate cars along the test course, with each car following at a long enough distance to ensure that the headlights of one car do not influence the visibility of the evaluators in the car ahead. The course consisted of 16 sample locations ranging from a tenth of a mile to half of a mile in length. The sample pavement markings for the test consisted of edgelines, centerlines, and lane lines with a mix of white and yellow color markings on several pavement types such as concrete, asphalt, and seal coat. Researchers had measured all the test sites with handheld and mobile retroreflectometers prior to the subjective evaluations, but the measured values were not informed to the evaluators. Table 11 lists all the sites evaluated in this test. The groups were informed of the upcoming test segment as they were driven along the test course and were asked rate the pavement marking segment for the following characteristics: marking color, marking contrast with the surrounding pavement, marking retroreflectivity, and overall condition of the marking. 40
53 The test pavement marking segments were rated for the four factors listed above on a scale from 1 to 5, with 1 being poor and 5 being excellent. The raters were also asked to provide additional comments on the test segments. Table 11. Test Pavement Marking Segments. Segment # Road Segment Line Type Marking Color Pavement Type 1 SH 47 N Edgeline White Light Asphalt 2 SH 21 W Edgeline White Light Seal Coat 3 SH 21 W Bridge Edgeline White Concrete 4 FM 50 S Edgeline White Dark Seal Coat 5 FM 50 S Center Yellow Dark Seal Coat 6 FM 50 S Edgeline White Dark Seal Coat 7 SH 60 E Edgeline White Light Seal Coat 8 Victoria Center Yellow Concrete 9 Graham Edgeline White Concrete 10 Victoria Edgeline White Concrete 11 SH 40 SE Edgeline White Asphalt 12 SH 40 SE Center Yellow Asphalt 13 SH 40 SE Center Yellow Asphalt 14 WD Fitch E Lane Lines White Concrete 15 WD Fitch E Edgeline White Concrete 16 SH 6 West Edgeline White Dark Seal Coat Comparison of Subjective Ratings to Measured Mobile Readings Researchers conducted an analysis to assess how closely human judgment correlates with the quantitative retroreflectivity measurements. Researchers compared the mobile retroreflectivity measurements with the subjective ratings of the evaluated characteristics. Table 12 provides a summary of the mobile retroreflectivity values and the average retroreflectivity ratings for each segment. Figure 4 shows the correlation with an R 2 value of 0.74 between mobile retroreflectivity measurements and subjective retroreflectivity ratings. A linear relationship explains about 74 percent of the variation in the mobile measurements between measured retroreflectivity values and subjective retroreflectivity ratings. As it can be seen from Figure 4, there is less scattering around the retro trend line for retroreflectivity values below 300 mcd/m 2 /lux. However, the scattering is greater for retro values above 300 mcd/m 2 /lux. Correlation analysis of measured retroreflectivity values with color, contrast, and overall quality resulted in similar correlations, 0.77, 0.71, and 0.68, respectively. Appendix B presents the graphs of the correlation analysis for color, contrast and overall quality. 41
54 Table 12. Summary of Retroreflectivity Rating and Mobile Retroreflectivity Values for Each Segment. Segment # Pavement type Line Location Average: Retro Std Dev: Retro Mobile Retro Rating Rating Values(mcd/m 2 /lux) 1 Light asphalt Edgeline Light Seal Coat Edgeline Concrete Edgeline Dark Seal Coat Edgeline Dark Seal Coat Center Dark Seal Coat Edgeline Light Seal Coat Edgeline Concrete Center Concrete Edgeline Concrete Edgeline Asphalt Edgeline Asphalt Center Asphalt Center (sect 2) Concrete Lane Lines Concrete Edgeline Dark Seal Coat Edgeline Comparison of Mobile Measurements with Human Judgement Mobile Retro Values R^2 = Retroreflectivity Ratings Retroreflectivity Retro Linear Trendline Figure 4. Correlation between Measured Retro Values and Subjective Retro-ratings. 42
55 In addition to the correlation analysis, researchers also looked for any trends in the retroreflectivity rating data. In this analysis, the researchers compared the average retroreflectivity rating trend with the actual measured retroreflectivity trend at each test segment. Figure 5 shows the trend analysis of the subjective retroreflectivity rating against measured retroreflectivity. The horizontal axis in Figure 5 shows the segment numbers arranged in ascending order of measured retroreflectivity values as obtained from a mobile unit (note that mobile values are factored by 100 to get to the same scale as ratings), and the vertical axis shows the average retroreflectivity ratings (average of individual ratings). The trend lines for measured values and retroreflectivity ratings are obtained by taking the moving average of consecutive readings Retro rating Segment Number Mobile Retro/100 Retro Rating Retro Rating Trend Mobile Retro Trend Figure 5. Retroreflectivity Rating Trend. The trend analysis shows some trends in the ratings when compared to the retroreflectivity levels. For all retroreflectivity levels above 235 mcd/m 2 /lux, the rating is always between 3 and 4, whereas for retroreflectivity levels below 235 the ratings are always 3 or less. Also for retroreflectivity levels above 235 mcd/m 2 /lux, the rating is inconsistent in trend. Three of the four segments measuring less than 121 mcd/m 2 /lux received ratings of less than 2. There 43
56 were a few segments such as segment numbers 6, 11, and 13 where it seems like the difference between mobile retroreflectivity values and retroreflectivity rating values are higher than at other segments. The analysis (described in the next section) will explore any influence of marking and pavement type on the retroreflectivity rating Comparison of Retroreflectivity Ratings by Pavement and Marking Characteristics Researchers were interested to determine if the pavement and marking characteristics had any influence in the subjective rating. Figure 6 shows a plot of retroreflectivity ratings for each test segment by pavement color, and Figure 7 shows the contrast rating for different combinations of pavement and marking color. The results indicate that dark pavements had a higher contrast rating than light pavements for markings with similar retroreflectivity levels. This typically resulted in retroreflectivity ratings that were higher for markings on dark colored pavements as compared to light colored pavements with similar retroreflectivity levels. This indicates that the contrast of the marking with the surrounding pavement can influence the subjective retroreflectivity rating of markings. Retro Rating by Pavement Color 5 Average Retro Rating Segment Number Dark Pavement Light Pavement Mobile Retro/100 Figure 6. Retro Rating by Pavement Color. 44
57 Contrast Rating by Pavement & Marking Classification Average Contrast Rating Segment Number Dark Pavement & White Marking Light Pavement & White Marking Mobile Retro/100 Dark Pavement & Yellow Marking Light Pavement & Yellow Marking Figure 7. Contrast Rating by Pavement and Marking Color Individual Retro-Rating Analysis Researchers analyzed the retro-ratings provided by each test participant individually. This analysis was done to find the difference: between individual ratings and the average retroreflectivity ratings, and between individual retroreflectivity ratings and mobile retroreflectivity values. Table 13 shows the difference between individual ratings and average retroreflectivity ratings for all test segments. A negative value for the difference in ratings indicates that the subject underrated the marking retroreflectivity in comparison with the average rating for a given segment, while a positive value indicated that the subject over rated the marking retroreflectivity when compared to the average rating. The deviation for each participant was added up to compare the total deviation between all participants. 45
58 Table 13. Difference between Individual Ratings and Average Retroreflectivity Rating. Segment # Subject1 Delta Subject2 Delta Difference between Individual and Average Retroreflectivity Rating Subject3 Subject4 Subject5 Subject6 Delta Delta Delta Delta Subject7 Delta Subject8 Delta Absolute Total Table 14 shows the difference between individual ratings and the measured retroreflectivity values for all test segments. A negative value for the difference in ratings indicates that the subject underrated the marking retroreflectivity in comparison with the measured mobile retroreflectivity value for a given segment, while a positive value indicated that the subject over rated the marking retroreflectivity when compared to the mobile retroreflectivity values. The absolute value of deviations from the mobile retroreflectivity values for each participant was added up. Figures 8 and 9 show the comparison of individual ratings with average ratings and mobile retroreflectivity values for two of the test participants. The individual retroreflectivity rating graphs and the above two tables show that subjective ratings can significantly vary from individual to individual. The data also indicate that some evaluators were more consistent with the group and more consistent with the measured retroreflectivity than others. It is unknown if training the participants would improve the variation found in the subjective rating. Appendix C presents the rest of the individual rating graphs. 46
59 Table 14. Difference between Individual Ratings and Mobile Retroreflectivity Values. Segment # Subject1 Delta Difference between Individual Rating and Mobile Retroreflectivity/100 Subject2 Subject3 Subject4 Subject5 Subject6 Subject7 Delta Delta Delta Delta Delta Delta Subject8 Delta Absolute Total Individual Retro Ratings 5 Retro Rating Segment Number Subject1 Average Mobile/100 Figure 8. Individual Retro-ratings for Subject 1. 47
60 Individual Retro Ratings 5 Retro Rating Segment Number Subject7 Average Mobile/100 Figure 9. Individual Retro-ratings for Subject Comparison of Rating Factors Used for the Test Although most of the results presented in this report are of retroreflectivity ratings, other factors such as color, contrast, and overall appearance were hypothesized to closely follow the tends shown by retroreflectivity ratings. Figure 10 shows average rating of different factors for each site. The ratings were found to be acceptably consistent between all factors. Subjective rating can be biased by the individual evaluating the pavement markings. However if handheld or mobile retroreflectometers are not available for use, subjective rating could be used provided the evaluator is well trained or if multiple evaluators view each location and average ratings are reported. Although this study provided some insights on subjective rating accuracy, a limited amount of data prohibited researchers from analyzing some trends that were expected to be observed. Also the participants in this study were not specifically trained to assess the retroreflectivity of pavement markings, but were familiar with retroreflectivity of pavement markings. The lack of training could have resulted in some inconsistent rating trends. 48
61 Average Ratings by Variable Retro Rating Mobile Retro/100 Color Contrast Retroreflectivity Overall Quality & Appearance Figure 10. Average Rating of Different Factors Used in the Study. 4.2 SECOND NIGHT SUBJECTIVE RETROREFLECTIVITY TEST The second subjective retroreflectivity assessment test intended to assess the rating ability of the participants and to see if minimal training improved the participant s assessment abilities. This section provides details on the test procedure and the analyses that were carried out to identify trends and reliability of subjective evaluations Test Procedure In this night test there were 11 participants of varied level of experience with respect to retroreflectivity assessment. All the participants in this study rode as passengers in a group of three or four participants in a TTI car and viewed a series of markings around the runways at the Texas A&M Riverside Campus. The study course had 12 different sections of test markings, each section being about 100 feet in length. The markings included yellow and white markings of varying retroreflectivity levels. The retroreflectivity of the test markings varied from 88 to 684 mcd/m 2 /lux. The participants were not informed of the retroreflectivity values until after the test was complete. 49
62 As the participants passed through the test markings along the route, the test vehicles stopped at two locations prior to the markings so that the markings could be viewed from a stationary location and at slow a speed when traveling between the locations. The test vehicle stopped at a distance of 210 feet and at 30-meters (98.4 feet). The 30-meter location was to represent a similar geometry to that at which the pavement marking retroreflectivity is measured. The 210- foot location was the distance at which a driver would have a 2.2 second preview time of the marking when traveling at 65mph. The participants were asked to rate the markings that they see on a scale of 1 to 5, with 1 implying immediate replacement required and 5 implying like new. Participants were also asked to estimate the retroreflectivity levels of the markings. Once a group of participants had finished assessing all the test markings, they were taken to a different location for a brief training session on pavement marking retroreflectivity levels. The training area consisted of a two sets of markings. The first set had eight yellow lines of varying retroreflectivity levels and the second set had eight white lines of varying retroreflectivity levels. A car with a group of participants was parked in line with the markings at a distance of 30-meters from the markings. Initially the participants were asked to rank order the markings in order of highest to lowest retroreflectivity. Later the participants were handed a sheet with the actual measured retroreflectivity values of the training sets and were asked to get familiar with the test set and their corresponding retroreflectivity values. After completing the training, participants were again driven along the test course to re-assess the 12 test markings, which they had earlier rated Individual Retroreflectivity Assessment: Before-After Analysis Retroreflectivity assessment of the test markings for each individual before training and after training was compared. Figures 11 and 12 show typical retroreflectivity estimate results of an experienced assessor and an inexperienced assessor respectively. In Figures 11 and 12, the black line indicates the actual measured retroreflectivity, the blue line indicated the assessed subjective retroreflectivity before the training, and the pink line indicated the assessed subjective retroreflectivity after the training. Individual retroreflectivity assessment data showed a lot of inconsistency in terms of if training helped test participants to assess the markings better. Some individuals did better overall after training, some got worse, and others had no change overall. However a majority of the participants did get closer to the actual retroreflectivity after training 50
63 in the case of the test marking which had the highest retroreflectivity (684 mcd/m 2 /lux). Individual retroreflectivity assessment of other participants is provided in Appendix D of this report. The estimated pavement marking retroreflectivity levels and the rating of the markings followed a similar trend. Particpant# 5 Retro Assessment Before Training After Training Actual Retro Retroreflectivity Figure 11. Retroreflectivity Assessment Graph for Participant #5. Participant# 6 Retro Assessment Before Training After Training Actual Retro Retroreflectivity Figure 12. Retroreflectivity Assessment Graph for Participant #6. 51
64 4.2.3 Before-After Analysis of Average Subjective Retroreflectivity A before-after comparison was also conducted on the average retroreflectivity assessment. Table 15 shows the percentage difference from the actual retroreflectivity for before training and after training assessment period. Tables 16 and 17 show similar statistics with participants segregated as experienced and inexperienced, respectively. Participants who had previous experience dealing with pavement marking retroreflectivity were classified as experience and others as inexperienced. Comparison of standard deviations before and after training did not show improvement as a result of training at many test sections for the experienced participants, on the other hand the training seemed to positively affect the inexperienced participants by lowering the standard deviation between their estimates. Also, the comparison of average subjective retroreflectivity with the actual retroreflectivity did not show any consistent improvement after training Subjective Retroreflectivity Assessment Trend by Pavement Marking Color In this analysis a trend chart was developed depicting the actual retroreflectivity trend and subjective retroreflectivity trends before and after training. These trend charts were developed separately for yellow markings and white markings as shown in Figures 13 and 14. For yellow markings, the subjective retroreflectivity trend was consistently higher than the actual retroreflectivity. Comparing the subjective retroreflectivity trend before and after training, it can be seen that the after training trend closely follows the before training trend at least for sections less than 150 mcd/m 2 /lux. The difference being that the retroreflectivity was assessed much higher after training than before training. This indicates that the minimal training provided did not influence the relative assessment capabilities of the participants. In the case of white markings, subjective retroreflectivity assessment before training showed to underestimate marking with retroreflectivity less than 120 mcd/m 2 /lux and greater than 250 mcd/m 2 /lux, and anything between 120 to 250 mcd/m 2 /lux was overestimated. With white markings too, the training provided did not influence the relative assessment of retroreflectivity and only resulted in participants assessing the markings at a higher retroreflectivity value than they had assessed before training. 52
65 Table 15. Before-After Retroreflectivity Assessment Statistics for All Participants. Average Retro Std Deviation for Subj R etro Difference in Retro % Difference Section# Marking T ype Actual Retro Before training After Training Before training After Training Before Actual After Actual Before Actual After Actual 9 Yellow % 5% 6 White % 33% 4Double Yellow % 13% 7 Yellow % 42% 5 White % 18% 12 Yellow % 11% 9 White % 10% 3 Yellow % 22% 1 Yellow % 57% 7 White % 11% 11 White % 82% 1 White % 63% 10 Double Yellow % 26% 2 White % 35% 12 White % 21% 5 Yellow % 6% 8 White % 8% Table 16. Before-After Retroreflectivity Assessment Statistics for Experienced Participants. Average Retro Std Deviation for Subj Retro Difference in Retro % Difference Section# Marking Type Actual Retro Before training After Training Before training After Training Before Actual After Actual Before Actual After Actual 9 Yellow % 9% 6 White % 49% 4Double Yellow % 48% 7 Yellow % 53% 5 White % 15% 12 Yellow % 19% 9 White % 7% 3 Yellow % 51% 1 Yellow % 77% 7 White % 25% 11 White % 124% 1 White % 57% 10 Double Yellow % 63% 2 White % 48% 12 White % 15% 5 Yellow % 18% 8 White % 6% 53
66 Table 17. Before-After Retroreflectivity Assessment Statistics for Inexperienced Participants. Average Retro Std Deviation for Subj R etro Difference in Retro % Difference Section# Marking T ype Actual Retro Before training After Training Before training After Training Before Actual After Actual Before Actual After Actual 9 Yellow % 20% 6 White % 63% 4Double Yellow % 78% 7 Yellow % 61% 5 White % 42% 12 Yellow % 25% 9 White % 4% 3 Yellow % 75% 1 Yellow % 94% 7 White % 37% 11 White % 159% 1 White % 52% 10 Double Yellow % 93% 2 White % 59% 12 White % 10% 5 Yellow % 27% 8 White % 5% 54
67 Retro Trend: All Participants - Yellow Markings Measured Retro Subj Retro Before Subj Retro After Retroreflectivity Y 4DY 7Y 12Y 3Y 1Y 10DY 5Y Section# Figure 13. Retroreflectivity Assessment Trend for Yellow Markings. Retro Trend: All Participants - White Markings Measured Retro Subj Retro Before Subj Retro After Retroreflectivity W 5W 9W 7W 11W 1W 2W 12W 8W Section# Figure 14. Retroreflectivity Assessment Trend for White Markings. 55
68 4.2.5 Discussion Data analyzed from the second night retroreflectivity test indicate that minimal training provided to the participants did not seem to improve the participants evaluation of pavement marking retroreflectivity. On contrary to what was expected, the participants actually overestimated the retroreflectivity values of the test sections by a larger amount after the training. Some of the possible reasons for such unexpected results could be due to: inadequate training (not enough time and too many training lines), training cautioned the participants rather than educating them, and training and actual assessment not done under same environment. The rank order of the training markings provided consistent and accurate results from all participants. This indicates that when markings of varying retroreflectivity levels are placed side by side that subjects can accurately rank order them from best to worst. In evaluation of the other test markings and evaluating markings on actual roads, there is only a single marking of a given color so comparisons cannot be made. The lack of other markings and standards to indicate what a good marking should look like can lead to inconsistent results. As such from this test no conclusion can be drawn on the impact of the training on accuracy of subjective evaluations. Subjective rating can be biased by the individual evaluating the pavement markings. However if handheld or mobile retroreflectometers are not available for use, subjective rating could be used provided the evaluator is well trained or if multiple evaluators view each location and average ratings are reported. 4.3 COMPARISON OF HANDHELD AND MOBILE RETROREFLECTOMETER READINGS Utilizing information learned from the mobile retroreflectometer testing (Report Section 5), the researchers conducted a comparison of mobile retroreflectivity data collection to handheld retroreflectivity data collection. The pavement marking retroreflectivity data collection was conducted on 14 different sections of road. The length of each road section varied between 0.05 and 0.48 miles long. The average section length was 0.31 miles. These sections represented the typical road surface types in Texas (i.e., asphalt, Portland cement concrete, and seal coat) and the typical range of pavement marking retroreflectivities. The road sections used for the mobile 56
69 versus handheld retroreflectivity comparison are the same sections used for the first night study described in Report Section 4.1. The researchers collected all mobile and handheld retroreflectivity data on the same day so that environmental factors and traffic conditions would not be a factor. The researchers collected the mobile retroreflectivity data at the posted speed (30-70 mph) along the entire length of the test sections. The researchers calibrated the mobile retroreflectometer once for each color prior to going out and collecting data at all the sites of that color. The researchers conducted handheld data collection along the second half of each section, except for the shorter sections where it was conducted along the whole length. The researchers collected a minimum of 16 handheld measurements for each section. The researchers compared the data from the handheld readings to the mobile readings along the same part of each section, i.e., if the whole section was measured with a handheld retroreflectometer the mobile value for the whole section was used, or if handheld data were only collected on the second half of a section then only the second half of the mobile values were used. Figure 15 displays the average retroreflectivity values from the mobile and handheld data collection. Two linear regression lines are also on the figure indicating two best fit scenarios. If the two devices matched each other perfectly a linear regression would have a slope of one, a y-intercept of zero, and R 2 value of one. The dashed line represents a best fit linear regression that has the highest coefficient of determination. The R 2 value indicates a very high correlation between the two values, meaning that the two values follow a similar trend. The slope of and the y-intercept of indicate that there is a slight bias between the two devices. Even with this bias the percent difference is less than 4 percent for value ranging from 135 to 550. The solid line represents a best fit linear regression that has the y-intercept set at zero. The R 2 value though slightly lower than the best fit regression line still indicates a very high correlation between the two values. The slope of indicates that the two devices are very similar in their results. Since the y-intercept was forced through the zero point, the percent difference anywhere on the line is constant at about 2 percent. The results from this evaluation indicate a very strong correlation between the handheld and mobile measurements. Not only is the correlation strong, but the magnitude of the values are also very close as indicated by the less than 4 percent difference. With proper equipment setup, 57
70 calibration, and testing procedures, accurate mobile retroreflectivity data can be collected across a variety or retroreflectivity and road surface types. 500 Mobile Retroreflectivity (mcd/m 2 /lux) Dashed Line y = x R 2 = Solid Line y = x R 2 = Handheld Retroreflectivity (mcd/m 2 /lux) Figure 15. Comparison of Mobile and Handheld Retroreflectivity Measurements from Night Study 1. 58
71 CHAPTER 5. MOBILE MEASUREMENTS AND BEST PRACTICES The future of mobile retroreflectivity data collection will rely on the ability of the users to collect accurate and reliable data. The ability of TxDOT to plan and monitor mobile retroreflectivity data collection will impact the results and the ability of the data to meet TxDOT s needs. An understanding of the mobile retroreflectivity equipment, data collection process, and resulting data are imperative for both planning and monitoring data collection to ensure that the appropriate measures are taken to provide the best data possible. This chapter will evaluate the impact that several variables have on mobile retroreflectivity data collection and will also recommend the best methods to limit the impact of the influencing variables. This chapter will also evaluate different sampling methods for collection of retroreflectivity data. 5.0 SENSITIVITY ANALYSIS OF MAJOR VARIABLES The objective of this section is to evaluate the ability of the Laserlux mobile retroreflectometer to accurately measure the retroreflectivity of pavement markings by conducting a series of tests evaluating several variables that may affect the accuracy of the data collected by the retroreflectometer. The literature review and experiences using the mobile retroreflectometer provided the researchers with numerous variables to evaluate. The magnitude of the impact of the variables can be found through testing, so isolation of the variables as best as possible is critical to determine the true impact. The initial data collection towards this effort was conducted in a controlled environment to isolate the variables that impact the quality and accuracy of the data collection process. Measurements were taken while only varying a single variable and holding the other variables as constant as possible. Variables that cannot be isolated were evaluated in a manner that limits the impact of the other variables. Quantification and verification of the effects of these factors are necessary for two reasons. The first is to develop best practices for calibration and operation of mobile retroreflectometers. The second is to scientifically arrive at correction factors that can be applied to the measurements when any deviation from the standard calibration is noticed while measuring retroreflectivity with mobile retroreflectometers. Measurements made on pavement markings are inherently variable due to variability along the pavement marking. Small movements of a retroreflectometer along a marking will yield differing retroreflectivity results. The researchers attempted to measure the marking in similar locations and to select markings 59
72 that had a small variation along their length to minimize the natural marking variability as much as possible Static Testing Static testing of the mobile retroreflectometer was carried out inside a large garage to reduce any effects of changing sunlight conditions and to minimize temperature changes due to the sun. This environment provided the best setup for minimizing variables other than those being evaluated. The mobile retroreflectometer was mounted to the vehicle as it would normally be for data collection. All data were collected without anyone inside the vehicle so that the platform would not move at all during the data collection. Pavement marking panels measuring 4 ft in length were used as the test markings Measurement Geometry The researchers conducted testing of improperly setting up the retroreflectometer to the 30-meter geometry to evaluate two different variables. The first variable the researchers tested was the effect of not properly setting the height on the retroreflectometer when setting up. The second variable the researchers evaluated was the effect of varying the measurement distance from the mobile retroreflectometer. To test the effect of not properly setting the height, the researchers set up the mobile retroreflectometer in the standard position and then made minor adjustment to test varying conditions. The conditions that were tested as follows: correct setup, 0.25 inches high, 0.5 inches high, 0.25 inches low, 0.5 inches low, front 0.25 inches low, front 0.25 inches high, back 0.25 inches low, and back 0.25 inches high. After setting up the retroreflectometer to the given condition, the laser was positioned on the test panel at the 10-meter mark by using the computer controlled adjustable tilt motor. The retroreflectivity of the panel at the geometry being evaluated was then measured. Table 18 shows the results of the testing. Comparing the eight setups to the standard setup with the correct geometry yielded some significant results. In several cases the difference was found to be statistically significant at a 0.05 level of confidence. Though there were significant differences, the magnitude of the differences ranged from 0 to 6.2 percent. These differences are not really practical though since measuring the marking in a slightly different position could account for the change. The 60
73 differences were not always consistent (note the differences measuring at the correct geometry), which also indicates that the measurement location on the stripe may have changed slightly between each of the different setups. Table 18. Height Setup Testing. Setup Conditions Retroreflectivity correct geometry inch high front and back inch high front and back inch low front and back inch low front and back 499 correct geometry 520 Front.25 low, back correct 525 Front.25 high, back correct 504 Front correct, back.25 low 520 Front correct, back.25 high 515 To test the effect of measurement distance, the researchers set up the mobile retroreflectometer in the standard position and then made adjustments to the distance at which the retroreflectometer was measuring the marking. The marking was measured at 7.5, 8, 9, 10 (standard distance), 11, 12, and 13 meters. At each measurement distance, the pavement marking sample was moved, and the laser was repositioned at the center of the marking. Figure 16 displays the results of the measurement distance testing. There is a consistent relationship between measurement distance and retroreflectivity level, which is that as measurement distance increases retroreflectivity deceases. This effect shows a significant difference between measurement distances. The researchers believe that the internal user adjustable tilt motor that positions the laser is able to compensate for the small differences in the setup geometry that were tested. When the geometry was changed either up or down, the laser was then adjusted in the opposite direction to keep the reading at the 10-meter mark. The results of this testing did not result in practical differences when considering the inherent variability of the marking. In contrast, when measuring the marking at the incorrect distance, significant differences were found. This means that when setting up the retroreflectometer it is imperative to setup on a level area and to ensure that the laser is positioned on the marking at exactly 10 meters. 61
74 Retroreflectivity (mcd/m 2 /lux) Measurement Distance (meters) Figure 16. Measurement Distance Testing Temperature The researchers conducted an evaluation of the impact of internal retroreflectometer temperature. The retroreflectometer itself will heat up if the laser is continuously on, but the impact of the sun and external temperature are the major sources of internal heating. Since the retroreflectometer is attached to the outside of the vehicle, on sunny days the exterior of the retroreflectometer box will heat up causing the internal components to heat up as well. The effect of this internal heating is a major cause of concern in Texas where large temperature differences and a hot summer sun can cause large internal temperature changes. The researchers conducted this study in two steps. The first step was to determine the impact of the temperature change on the retroreflectometer. The second was to use the temperature compensation algorithm that is built into the retroreflectometer software and the results of our temperature testing to try and compensate for the temperature effect. The first step was carried out in multiple phases to see how consistent the effects of temperature change were. Figure 17 displays the results of the temperature testing. Initially the retroreflectometer was set up at the correct geometry in the garage location to reduce the effects of other variables. The retroreflectometer exterior was then heated with a kerosene space heater so that the internal temperature would increase. Tests 1 and 2 were both conducted in this 62
75 manner. Tests 6 and 5 were the cooling of the retroreflectometer back to the ambient room temperature after heating the unit from Tests 1 and 2. For Tests 3 and 4 conducted outside during the hottest part of the day, the sun heated the retroreflectometer while it collected data Retroreflectivity Temperature ( C) Test 1 Test 2 Test 3 Test 4 Test 5 Cooling Test 6 Cooling Figure 17. Temperature Characterization Testing. The results from the characterizing of the retroreflectometer were averaged to determine the difference as the temperature changes. The red line in Figure 18 displays this average. These differences were input into the temperature compensation algorithm that is in the software for the retroreflectometer. The compensation requires the input of temperature differences at 5 degree intervals, where all temperatures are in degrees Celsius. The temperature range in the compensation is between 5 C and 50 C. The data from the characterization allowed for accurate inputs of correction values between 25 C and 40 C. The values outside of our testing were extrapolated based on an assumption that the data would follow a similar pattern. The researchers then tested the temperature sensitivity of the retroreflectometer with the temperature compensation turned on. The retroreflectometer was placed outside and allowed to heat by the sun. The results of the data collected with the compensation can be seen in 63
76 Figure 18. The red line represents the average retroreflectivity values across the temperatures tested without the compensation. The blue line represents the data with the compensation on. The purple line represents the data from one of the individual trials without the compensation when the retroreflectometer was heated outside. The retroreflectivity level of the marking measured was 450 mcd/m 2 /lux. Figure 18 clearly indicates that the compensation greatly improved the ability of the mobile retroreflectometer to accurately measure the pavement marking as the temperature increased Retroreflectivity With Compensation Without Compensation Average Without Compensation Test Temperature ( C) Figure 18. Temperature Compensation Testing. Over the temperature range tested without compensation, the temperature lowered the average retroreflectivity by over 14 percent. With the compensation over the range that had accurate compensation values, the maximum difference was less than 3 percent. For the temperature values outside of those during the temperature characterization without the compensation, the results of the compensation were not as good. The difference at the maximum temperature tested was 8 percent with the compensation on. The researchers feel that 64
77 modifications to the compensation values that were outside of those originally tested will be able to correct for this difference if tested again. The researchers found that the temperature compensation that is built into the software is able to greatly reduce the effect of temperature change on the accuracy of the retroreflectivity data. A large range of temperatures needs to be tested to ensure that the compensation values input are correct. Also, an external thermoelectric cooler with a thermostat control that is built onto the retroreflectometer is a viable means to control the temperature of the retroreflectometer and thus account for changing temperatures Linearity The researchers conducted linearity testing of the mobile retroreflectometer to evaluate the effect of calibrating on a marking of a certain value and then measuring markings of differing values. The researchers tested three different scenarios in which the mobile retroreflectometer was calibrated at a low (145 mcd/m 2 /lux), medium (346 mcd/m 2 /lux), and high (761 mcd/m 2 /lux) retroreflectivity level. The mobile retroreflectometer was calibrated on a panel that was measured with the handheld retroreflectometer at the previously listed values. After each calibration of the retroreflectometer, eight pavement markings of varying retroreflectivity levels were measured. The retroreflectivity output from the mobile retroreflectometer was compared to the value measured with a handheld retroreflectometer. Figure 19 displays the results of the testing. Examining the data indicates that there is an effect from calibrating on a marking that has a different retroreflectivity level than the markings that are being measured. The data from the high retroreflectivity markings were skewing the regression lines and were not included, only the markings with more typical retroreflectivity levels were included. Figure 18 displays that the correlation between the handheld measurements of the panels and the mobile measurements was very good in all three conditions. The slope of the regression lines indicates the effect of the varying calibration levels. The closer the slope is to 1, the closer to linear the retroreflectometer measures markings of differing retroreflectivity levels. When calibrated with a low retroreflectivity marking and then measuring a range of typical retroreflectivity markings, the mobile retroreflectometer is approximately 6 percent high. When calibrated with a medium retroreflectivity marking and then measuring a range of typical 65
78 retroreflectivity markings, the mobile retroreflectometer is approximately 2 percent low. When calibrated with a high retroreflectivity marking and then measuring a range of typical retroreflectivity markings, the mobile retroreflectometer is approximately 17 percent low. The results from this evaluation indicate that to achieve the best data, calibration should be conducted on a marking that has a relatively similar retroreflectivity value as those that are being measured. Mobile Retroreflectivity (mcd/m 2 /lux) Low Calibration Middle Calibration High Calibration Middle Calibration y = 0.981x R 2 = Low Calibration y = x R 2 = High Calibration y = x R 2 = Handheld Retroreflectivity (mcd/m 2 /lux) Figure 19. Linearity Testing Dynamic Testing The researchers conducted dynamic testing of the mobile retroreflectometer on State Highway 21 (SH21) and State Highway 47 (SH47) in Bryan, TX. The mobile retroreflectometer was mounted to the vehicle as it would normally be for data collection. Dynamic testing was conducted at highway speeds unless otherwise noted. Though not ideal for isolating variables, dynamic testing was the only means to evaluate some of the sources of possible variation. 66
79 Acquisition Rate The researchers conducted evaluation of acquisition rate, the distance over which the mobile retroreflectivity data are averaged in the software. The software has the ability to average data over a distance as short as miles up to any length entered. The acquisition rate data were collected on 2-mile long section of SH21. This road was selected because it had a 2-mile long section of straight roadway with a continuous edgeline to collect data on. The acquisition rate data were collected in a loop on each side of the road. There are two values for each acquisition rate, one corresponding to the average of all readings in each direction. Prior to each run, the acquisition rate was set to the desired level and then the entire 4-mile loop was measured with the data collection vehicle traveling at approximately 65 miles per hour. Table 19 displays the results from the acquisition rate testing. Table 19. Acquisition Frequency Testing. Acquire Westbound Eastbound Frequency N Avg StDev N Avg StDev 0.01 mi mi mi mi mi mi mi The values indicated are the average value for all the readings in the section. The shorter acquisition rates had more segments within the 2-mile long section whereas the 1-mile acquisition rate only had two segments along each 2-mile long stretch of road. The results from the seven different acquisition rates did not produce a consistent trend or any average values that could be considered practically different. The standard measurement acquisition rate is 0.1 miles, and none of the readings varied greatly from this value indicting that acquisition rate has little impact on the overall results. The average standard deviation was not consistently impacted by the acquisition rate either. It should also be noted that it seems that fewer readings are collected when the acquire frequency is longer. The researchers were unable to determine why fewer data points were collected, as data collection speeds were similar. The major impact of using a longer acquire frequency is that the data are not as detailed, because they are averaged 67
80 over a longer length. The use of a shorter acquisition length allows for a more detailed look at the retroreflectivity along the marking for a given length. The results of this testing indicate that a shorter acquisition rate will yield a very similar average retroreflectivity to a longer acquisition rate Data Collection Speed The researchers conducted evaluation of measurement speed (vehicle speed) to evaluate the effect of changing speeds. The researchers conducted the speed testing on a 1-mile long section of SH47. This road was selected because it had a continuous solid edgeline to measure along the 1-mile section. This section also has a relatively low traffic volume; therefore our data collection would be less likely to impede traffic (70 mph posted speed limit) causing a safety concern. The measurement speed data were collected in a loop on each side of the road so there are two values for each speed. Two loops were made for each speed and the values were averaged. Prior to each run, the cruise control was set to the desired speed and it was maintained through the test section. Table 20 displays the results from the measurement speed testing. There were no practical differences in the average retroreflectivity values at the different speeds. The difference between the different speeds was that at higher speeds less data are collected. Since the mobile retroreflectometer collects so much data, the reduced number of data points had little impact on the average readings or the standard deviation. Table 20. Speed of Data Collection Testing. Speed Southbound Northbound (mph) N Avg StDev N Avg StDev All Since two runs were made at each speed, the repeatability of the data was also evaluated. The maximum difference between two runs at the same speed and in the same direction was less than 6 percent and the average difference for the six speed/section combinations was just over 3 percent. This indicates a good repeatability of the mobile retroreflectometer over our test sections. 68
81 Double Line Data Collection The researchers conducted an evaluation of the comparison between the data collected on double yellow centerlines. The goal of this evaluation was to determine if the retroreflectometer was able to measure both markings the same number of times. Questions have been brought up in the past that the number of right data points were much less than the number of left data points. To determine the impact on the number of data points when measuring a double yellow centerline, the researchers measured seven sets of double yellow lines that were straight. The straight markings allowed the researcher to make sure that they were evenly measuring both markings the entire length of the line. The lines measured were each approximately half a mile long. Table 21 displays the results of the double line evaluation. The data indicate that the number of right data points is always less than the number of left data points. One of the reasons for this is that the retroreflectometer software defaults readings to the left unless it sees two lines. There are times when measuring a double line that the retroreflectometer only picks up one of the lines with its scan and thus it gets read as a left point. The percent right point s column indicates the percent ratio of right points compared to left points. Most of the percentages are around 90 percent or higher. Line 4 had 77 percent the number of right points as it did left. The researchers think that the higher standard deviation of the right line, along with the retroreflectivity not being high, may have contributed to the lower number of right readings because the retroreflectometer may not have picked up both lines on every scan of the laser. Table 21. Individual Trials on Several Lines. Line Left Points Left Avg Left StDev Right Points Right Avg Right StDev Percent Right Points Based on the results of the individual line trial, the researchers attempted to further understand how the retroreflectometer reads double lines. The researchers measured a double 69
82 line that had good retroreflectivity on the left line and lower retroreflectivity on the right line. This line was measured three times to test the repeatability of the readings. Table 22 provides the results of the three runs. All three trials had a similar number of points and similar retroreflectivities of both lines. Comparing the number of left points to right points, there are approximately 70 percent the number of right points as compared to the left. This result was similar to Line 4 from Table 21. The researchers attribute this difference to the high retroreflectivity of the left line and the lower retroreflectivity of the right line. The high retroreflectivity will almost always get read as a left point, whereas the lower retroreflectivity line will have more times when the line is not read, resulting in fewer points. Table 22. Multiple Trials on Same Double Line. Trial Left Points Left Avg Left StDev Right Points Right Avg Right StDev Avg In addition to retroreflectivity and standard deviation differences between the lines accounting for a difference in the number of data points, there are two other factors not associated with the retroreflectometer that will contribute to a difference. These factors are vehicle wander and roadway geometry. The retroreflectometer has a scan width of approximately 1.1 meters that can help compensate for vehicle wander, but often times the vehicle will wander far enough away that it will not read both line at the same time. When the data collection vehicle wanders and only one of the lines are read, it is defaulted to the left position. The horizontal roadway geometry also plays a factor in that left and right curves make it more difficult to stay on the marking, especially since the retroreflectometer measures 10 meters out in front of the vehicle. The number of right data points is affected by the ability of the driver to keep both lines in the measurement window and the ability of the retroreflectometer to pickup both lines with each of its measurement scans. Data showing only 75 percent as many right points as left are not unrealistic, and depending on road conditions as few as 50 percent right points are not totally unreasonable for some segments. 70
83 Signal to Noise Ratio The researchers conducted an evaluation of the signal to noise ratio to determine its effect and what may be an appropriate level to set it at. The signal to nose ratio (SNR) is a user-entered value in the retroreflectometer software that determines what the software measures as the minimum acceptable retroreflectivity value. The software considers the SNR value and the background noise the retroreflectometer is reading to determine the minimum values it will accept. An SNR value that is too low will allow too many low false retroreflectivity readings that can be attributed to road noise. An SNR value that is too high can possibly throw out actual retroreflectivity values of the marking being measured. The SNR testing was conducted on a mile-long section of SH47 southbound edgeline. Three passes were conducted on the mile long section at each of the five SNR values. Table 23 provides the results of each pass. Table 24 provides the average value at each SNR. Table 23 indicates that the repeatability of the retroreflectometer is good. Table 24 provides an indication of the impact of the SNR value on the average data. As the SNR value is raised, the average retroreflectivity value increases and the standard deviation decreases. This is due to the software not accepting as many low data points from the background road noise. As the SNR increase, it will get to a point where it is only accepting valid retroreflectivity readings that are from the pavement marking. For the marking that was measured, an SNR value of 3 to 3.5 was acceptable. For lower retroreflectivity pavement markings, a lower SNR value may be needed to ensure that all the pavement marking retroreflectivity values are accepted. 71
84 Table 23. All Signal to Noise Ratio Trials. Trial SNR Value Average Retroreflectivity Average StDev Table 24. Signal to Noise Ratio Average Values. SNR Average Retroreflectivity Average StDev Combined Static and Dynamic Testing The combined static and dynamic testing was performed on variables that were best evaluated in both conditions. The data were collected in the same manner as the individual static and dynamic data collections Measurement Position The researchers evaluated the effect that the measurement position has on the retroreflectivity value. This testing was conducted in two phases; phase 1 was without compensation, and phase 2 was with the compensation. The mobile retroreflectometers software has a user adjustable compensation to correct for retroreflectivity differences across the measurement window. After the first phase of testing, the compensation was adjusted to best fit the retroreflectometers profile. The static measurement position testing was conducted with the 72
85 mobile retroreflectometer mounted on both sides of the vehicle since the alignment of the system was found to be slightly different on each side. The researchers conducted the dynamic testing with the retroreflectometer mounted only on the right side of the vehicle. When the retroreflectometer is mounted on the left side of the vehicle, the center of the measurement is at position 80, whereas on the right side it is at position 100. This is a situation that is unique to the research team s data collection vehicle due to the mounting brackets that connect to the vehicle being slightly different. Static measurements on the left side were taken at positions 20, 50, 80, 110, and 140. Static measurements off the right side were taken at positions 20, 60, 100, 140, and 180. To take the measurements at each location, the pavement marking sample was moved to the position and centered on the laser. The laser was not moved during the testing. Figure 20 (right side data) and Figure 21 (left side data) provide the results of both phases of testing. Figure 22 provides an indication as to the difference in alignment and a reason for the sharper drop off in the right half of the measurement when positioned on the left side. The arc of the laser scan is symmetric when mounted on the right side (figure inset), but when mounted on the left it is more of a check mark shape. This check mark shape is the result of the base plate that the retroreflectometer mounts to not being perfectly level. The outside portion of the plate sits slightly lower than the inside portion causing the left part of the laser to hit the ground earlier than the right side. This check mark causes a greater drop off on the right hand side of the measurement since the laser is further away than it would be if it were symmetric. Overall on both sides as the measurement location moves away from the center the retroreflectivity decreases. This is caused in part due to the laser being further away producing a lower retroreflectivity level (see measurement geometry section), and the measurement being more offset reducing the signal. With this knowledge of the retroreflectivity levels across the measurement window, the compensation was set to try and adjust the values. 73
86 Unit Mounted on the Right Side Percent of the Center Position No Compensation With Compensation Position Figure 20. Right Side Static Position Testing. Unit Mounted on the Left Side Percent of the Center Position No Compensation With Compesation Position Figure 21. Left Side Static Position Testing. 74

87 Figure 22. Visual of the Laser Pattern. With no compensation correction and the retroreflectometer mounted on the right side, the outside measurements were 65 percent and 62 percent of the center measurement. With compensation they were 94 percent and 101 percent of the center measurement. With no compensation correction and the retroreflectometer mounted on the left side, the outside measurements were 81 percent and 68 percent of the center measurement. With compensation they were 93 percent and 101 percent of the center measurement. The evaluation clearly shows a significant impact on the retroreflectivity reading as the location moves away from the center. The compensation provided by the software provides much more accurate data across the measurement window. A second evaluation of the static measurement position testing was conducted approximately nine months after the initial evaluation. The second evaluation tested to see if there were any changes to the alignment of the system. The second evaluation results were nearly identical to the first evaluation with and without the compensation. 75
88 In addition to the static testing, a dynamic test was also conducted to see how the retroreflectometer data differ across the measurement window when collecting data. The researchers collected data on a mile-long segment of SH47 edgeline. The data were collected while driving down the road so the measurement position was not always at the exact location that is indicated, but the data were collected as close to the indicated position as possible. Data were collected near the center position, near measurement position 150, and near measurement position 50. The researchers summarized the dynamic data like the static data, comparing the outside measurements to the center position. Figure 23 indicates the results of the testing with and without compensation. The retroreflectometer behaved differently in the dynamic test from the static test. The dynamic measurements made near position 50 were approximately 8 percent higher than the center position without compensation, whereas during the static testing they were around 10 percent lower. The dynamic measurements made near position 150 were approximately 55 percent lower than the center position without compensation, whereas during the static testing they were approximately 25 percent lower. The change in percent difference required the adjustment of the compensation to properly account for the changes. Even with the changes, like the static testing the compensation greatly increases the accuracy of the retroreflectometer. The researchers believe that the difference between the static and dynamic tests is due to the weight distribution in the vehicle during the dynamic testing. The static testing did not have any people in the vehicle whereas the dynamic test did. This could influence the pattern of the laser as was seen when comparing the right and left side during the static testing. Either way though with proper testing the measurement position compensation provides for much more accurate data across the measurement window. Even with the assistance of the position compensation the goal should be to maintain a consistent position on the line near the center of the measurement window. 76
89 1.2 Percent of the Center Position Without Compensation With Compensation Measurement Position Figure 23. Dynamic Position Testing Nighttime Data Collection The researchers conducted several night tests of the mobile retroreflectometer to evaluate the effect of external light sources on the accuracy of the mobile retroreflectivity data. Both static and dynamic tests were performed to determine the effects of opposing vehicles, vehicles going the same direction, and overhead lighting. The dynamic overhead lighting test was conducted on SH47 along a mile-long stretch that had continuous overhead lighting along the last half. The static testing was conducted outdoors at the TTI/TxDOT mobile retroreflectivity certification course. Overhead lighting was evaluated by measuring the section of road with handheld retroreflectometers during the day to determine the retroreflectivity of the marking along both the lit and unlit sections. That night mobile retroreflectivity readings of the marking were collected by driving through the lit and unlit sections five times each. Table 25 provides the results of the overhead lighting testing. The retroreflectivity in the two sections was slightly different so the handheld and mobile data were adjusted in the second section so that the 77
90 handheld values would be the same. This makes for an easier comparison between the mobile values in the two sections. The handheld and mobile values were within 10 percent in each section, but more importantly for this testing is that the mobile values in the unlit area and in the lit area differed by less than 1 percent. This would indicate a minimal impact from the overhead lighting. Table 25. Dynamic Overhead Lighting Testing. Overhead Lighting Test Measurement Condition Average Retroreflectivity No Lighting With Overhead Lighting Handheld Mobile Trial Mobile Trial Mobile Trial Mobile Trial Mobile Trial Average Mobile Trial To evaluate the effect of oncoming vehicles at night when measuring yellow centerline markings, the mobile retroreflectometer was mounted on the left side of the vehicle. The mobile retroreflectometer was aimed at a marking, and a vehicle was positioned in the opposite lane and left stationary facing the mobile retroreflectometer. Figure 24 shows the setup for the left side testing. The first test was to evaluate the effect of calibrating with the measurement vehicle lights on or off. The second and third tests were conducted with the measurement vehicle lights on low and with the opposing vehicles lights on. The vehicles placed in the opposing lane had differing headlights. One vehicle had halogen headlights whereas the other had xenon headlights. Table 26 shows the results of the left side testing. There is a more noticeable effect between measurement vehicle lights off and measurement vehicle lights on than there is with adding opposing vehicle lights. This would indicate that calibrating with the measurement vehicle lights on is the best way to get an accurate calibration when calibrating at night. The effect of the opposing vehicle headlights was about 1 percent, which is not a significant or practical difference. The mobile retroreflectometer was also mounted on the right side of the vehicle to evaluate the effect of oncoming vehicles and same direction vehicles at night when measuring 78

91 white pavement markings. The mobile retroreflectometer was aimed at a marking, and a vehicle was positioned in the opposite lane facing the retroreflectometer or adjacent to the mobile retroreflectometer facing the same direction and left stationary. The first tests were to evaluate the effect of calibrating with the measurement vehicle lights on or off. The second and third tests were conducted with the measurement vehicle lights on low and with the other vehicles lights on. Table 26 shows the results of the right side testing. Again it can be seen that there is a noticeable effect between no measurement vehicle lights and measurement vehicle lights on. This would indicate that calibrating with the measurement vehicle lights on is the best way to get an accurate calibration when calibrating at night. The effect of the opposing vehicles headlights was about 5 percent and the adjacent vehicles headlights was about 2 percent. Neither difference was considered to be a practical difference. Figure 24. Nighttime Oncoming Vehicle Testing. 79
92 Table 26. Static Night Testing. Mounted on Left Side of Van (Positioned for Measuring Yellow Marking) Measurement Condition Average Retroreflectivity No Van Lights 485 Just Van Lights (Low) 468 Car 1 Oncoming (Xenon headlamps) 470 Car 2 Oncoming (Halogen headlamps) 473 Mounted on Right Side of Van (Positioned for Measuring White Marking) Measurement Condition Average Retroreflectivity No Van Lights 503 Just Van Lights (High) 517 Just Van Lights (Low) 521 Car 1 Beside (Xenon headlamps) 509 Car 1 Oncoming (Xenon headlamps) 494 To further simulate measuring markings on the road at night when there is opposing traffic, the researchers left the measurement vehicle and mobile retroreflectometer in a stationary position and drove the two vehicles that were used in the static testing past the mobile retroreflectometer as if they were oncoming traffic. The test was conducted for 15 minutes with no traffic and then 15 minutes with the two vehicles continuously driving past the stationary retroreflectometer and marking that was being measured. Over the 15 minutes each vehicle made 30 passes at varying speeds. This resulted in a simulated traffic volume of approximately 11,000 vehicles per day. Table 27 shows the results from the simulated oncoming traffic test. The results were similar to the left side testing, where opposing lights had a very little impact on the retroreflectivity level. The effect of the opposing lights was not practically different and for most roads, the nighttime traffic volumes will be less than what was simulated resulting in even less of an effect. Table 27. Static/Dynamic Simulated Traffic Testing. Simulated Traffic Testing Measurement Condition Average Retroreflectivity Without Traffic 354 With Traffic Limitations to the Sensitivity Analysis of the Major Variables This research attempted to evaluate the impact of several major variables on the accuracy of mobile retroreflectometer data. Even with the steps taken and the variables evaluated, there 80
93 are still limitations within the evaluation. Limitations of the evaluations and unexplored variables are described in this section. The researchers conducted the evaluation of the variables in as controlled of an environment as possible to reduce the influence of other variables, so that the variable being evaluated was the only one influencing the retroreflectometer. Though every attempt was made to reduce variables other than those being tested at the time, other variables may have affected the results. Due to the researcher s inability to perfectly isolate the variable being evaluated, the impact of other variables is a limiting factor in the evaluations. As previously mentioned, pavement markings are inherently variable due to variability along the pavement marking. Small movements of a retroreflectometer along a marking will yield differing retroreflectivity results. The researchers attempted to measure the marking in similar locations and to select markings that had a small variation along their length to minimize the natural marking variability as much as possible. Even minimizing the variability, it still exists and can influence the results. The temperature evaluation was limited in respect to the range of temperatures evaluated. The temperatures evaluated ranged from 25 to 45 degrees Celsius. Operating temperatures during the winter in Texas will often be as low as degrees Celsius, and summer operating temperatures may get close to 50 degree Celsius. Further analysis of the temperature effects and compensation effects at the ends of the temperature range should be conducted. The researchers expect that the compensation algorithm will provide good correction to the retroreflectivity values as long as the correction factors are the proper value. The double line evaluation compared readings on straight lines. Many double yellow situations occur on roadway segments with horizontal curvature. An evaluation of the true impact on measurements around curves is necessary to determine the impact on the number of data points on both the right and left line and to evaluate the impact of the vehicle body role on the retroreflectivity readings. The impact of body roll and the number of right and left points will be vehicle and driver specific. The signal to noise ratio was tested for a low retroreflectivity marking, but the marking still had an adequate level of retroreflectivity. SNR testing on very low retroreflectivity lines and on various surface types may be necessary to determine the best SNR values to use on low retroreflectivity markings with varying background noise conditions. Also the evaluation of 81
94 SNR on lane lines may provide some additional insight into the effect of SNR on the retroreflectivity data collection. The measurement position evaluation appears to be different when measuring in a static and dynamic condition. The measurement position evaluation also appears to be different on each side of the vehicle. Dynamic testing on both sides of the vehicle is necessary to ensure that the correct compensation values are used when the retroreflectometer is positioned on each side of the vehicle. The measurement position evaluations will be unique to each vehicle setup. The night testing evaluation was limited to simulated traffic to reduce the impact of other variables that were difficult to measure. A night evaluation in actual traffic on a representative roadway and daytime collection in the same area could provide a better idea of the impact of collecting retroreflectivity data at night. Along the same lines as the night testing, the impact of measurements made in sunny versus measurements made in cloudy conditions is an area where evaluation is necessary. The ability to quantify and control sunlight conditions makes this evaluation difficult and may limit the repeatability of the evaluation. The reproducibility of the variable evaluations and collected data were impossible to evaluate as only one retroreflectometer was available for testing. Many variables are retroreflectometer and/or vehicle specific, therefore specific testing should be conducted on each mobile retroreflectometer and vehicle setup. Testing of all vehicles and their retroreflectometers is the only way to ensure that the impact of the variables is properly accounted for either by compensation or data collection techniques. 5.1 OPERATIONAL BEST PRACTICES The researcher s second effort under the mobile retroreflectometer evaluation is documenting the best practices with regards to the operation of the mobile retroreflectometer. The lessons learned while collecting data during the variable evaluations and data collection under real world conditions provide the basis for the best practice recommendations. This documentation of best practices will be most useful to TxDOT staff and contractors using mobile retroreflectometers and could potentially be used to develop specifications for retroreflectivity data collection contracts. A separate deliverable P1 (50) will document all the best practices with regards to mobile retroreflectometers; this section will only outline the operational 82
95 best practices. The operational best practices are described in separate deliverable in the following order: Equipment, o Mobile Vehicle, o Mobile Retroreflectometer, o Handheld Retroreflectometer, Setup and Calibration, o Measurement Geometry, o Calibration Panel, o Measurement Linearity, o Calibration, o Calibration/Dynamic Check, Accounting for Measurement Variables, o General Software Setup, o Data Collection Speed, o Data Collection Acquire Frequency, o Signal to Noise Ratio and RRPM Level, o Unit Operating Temperature, o Measurement Position, o Double Line Data Collection, o Nighttime Data Collection, Equipment Testing, and o Compensation Testing. 5.2 DEVELOPING A DECISION MODEL FOR MANAGING PAVEMENT MARKING REPLACEMENT Introduction Logic and experience suggest that degradation in retroreflectivity of pavement markings is a result of the age of the marking and wear caused by vehicle tires. There are other factors that potentially influence the variability of the degradation process such as initial marking quality, application techniques, bead systems used, road surface type, marking location, and climate. In 83
96 order to develop a model that would allow maintenance personnel to predict the point at which a length of pavement marking should be replaced, it is necessary to examine the relationship between age and tire wear and to examine the influence of other factors. In the stylized depiction of the predictive model presented in Figure 25, as age and volume increase, retroreflectivity decreases. The red line represents a threshold of acceptable retroreflectivity, thought to be about 100 mcd/m 2 /lux. Retroreflectivity values above this line would be less than 100 mcd/m 2 /lux and those below the threshold line would be greater. The actual location of the red line is dependent on all the variables that impact the retroreflectivity of the pavement markings. Until collection of large volumes of data on roads in a given area, the location of the red line should be based on experience and expectations. Figure 25 also shows a dashed orange line that parallels the red threshold line. This line represents a subjective value that might be used to trigger planning for measurements and/or to schedule restriping jobs before the threshold of degradation is reached. Such a model would allow a means of deciding when retroreflectivity measurements would need to be taken to confirm the need to replace a section of pavement marking, and/or an approximation of when markings should be restriped. Figure 25. Predictive Retroreflectivity Model Based on Marking Age and Traffic Volume Objective The objective of this process is to develop regression models of the influence of age and tire wear on the retroreflectivity of pavement markings. Should data for other independent 84
97 variables be conveniently available, these factors will be considered for inclusion in the regression models developed Method District information files will be used to develop a list of potential segments of pavement markings to be measured for the development of regression models. At a minimum, the information required for potential selection of a segment will be age of the pavement marking and per lane volume for the roadway on which the marking is installed. If information concerning marking type, function, and roadway type are available, these data will be collected as well (see the discussion below) Independent Variables. The primary variables of interest include: 1. Age four bins of ages will be used. a. 1 to <3 years, b. 3 to <5 years, c. 5 to <7 years, and d. greater than 7 years. 2. Volume five bins of volumes will be used. a. less than 2 thousand vehicles per lane, b. 2 to <4 thousand vehicles per lane, c. 4 to <6 thousand vehicles per lane, d. 6 to <8 thousand vehicles per lane, and e. greater than 10 thousand vehicles per lane. If available, the following will be collected: 3. Type of Marking four types will be considered. a. thermoplastic, b. paint, c. tape, and d. epoxy/polyurea. 4. Marking Function three types of functions will be considered. a. edge marking, 85
98 b. centerline, and c. lane line marking. 5. Pavement Type three types of pavement will be considered. a. concrete, b. asphalt, and c. seal coat. 6. Pavement Area Function three types of areas will be considered. a. tangent sections, b. horizontal curve sections, and c. weaving sections Dependent Variable The dependent variable will be the retroreflectivity of 0.1-mile segments of pavement markings as measured by a mobile retroreflectometer. The average of multiple retroreflectivity readings will be used to represent the retroreflectivity of the entire segment Sample Size The levels of the age and volume independent variables form a 4x5 matrix of twenty cells. A sample of average retroreflectivity measurements for five, 0.1-mile segments of pavement marking will be taken for each of these cells. This sample of 100 measurements would be taken for one level of each of the other independent variables. Thus, the 100 measurements of 0.1-mile segments would need to be replicated for each level of marking type, marking function, pavement type, and pavement area function Suggested Sampling Plan Methodology Due to limited resources it may be necessary to only collect retroreflectivity data on a limited number of roadways. Several steps to reduce the quantity of the data collection are available. It is the general premise to reduce the quantity of roads to be measured based upon expectations of the quality of the markings and planned use of the resulting retroreflectivity data. Additional factors to reduce the data collection in a given district are based on roadways that meet the following criteria. Data on these roadways do not need to be collected for replacement of the marking purposes, but should be collected if degradation modeling is an objective: 86
99 newly striped roadways (less than 12 months old, or longer for low ADT roads), roads that are to be resurfaced within the next year, roads where the markings receive a visual score of good or excellent, and roads where the modeled retroreflectivity fall well within the acceptable levels Procedure In order to assess the feasibility of obtaining the necessary data and to test the significance of the regression model methodology, the initial data collection effort should be concentrated on obtaining retroreflectivity measurements for a single type of pavement marking, performing one function on a single type of pavement. For example, the 4x5 age/volume cells should be populated with retroreflectivity measurements taken for 100, 0.1-mile segments of thermoplastic centerline marking on asphalt pavement Analysis and Results Once the initial data are collected, a multiple regression model can be developed that describes the relationship between age and volume for a particular type of pavement marking, performing a specific function on one type of pavement. If the age and volume independent variables account for a significant portion of the variation in the retroreflectivity values of the dependent variable, then the process can be replicated for the other levels of the independent variable. While it is possible to combine all levels of all independent variables into a single multiple regression model, it might be difficult to obtain data to fill all of the cells required. Further, it is preferable to validate the procedure and the methodology with a smaller, more manageable study before proceeding. 87
100
101 CHAPTER 6. PAVEMENT MARKING MANAGEMENT SYSTEM BEST PRACTICES 6.0 INTRODUCTION Retroreflectivity data can be used to determine if the markings are meeting minimum installed retroreflectivity levels or minimum maintained retroreflectivity levels. The retroreflectivity data can also be used to prioritize roads for restriping based on measured retroreflectivity levels. Based on input from TxDOT staff, a variety of display mechanisms would be useful for displaying the resulting data from mobile retroreflectivity data collection. Mapping and graphing the data can be useful tools for visualizing the markings retroreflectivity level. Mapping data from numerous roads can provide a view of the overall quality of the pavement markings. The data can also simply be viewed in spreadsheet format and analyzed as described in the previous section. Roadways could then be rank-ordered based on retroreflectivity averages and any other criteria, such as roadway classification or ADT, and striping plans could then be prioritized based on the retroreflectivity summary list. The retroreflectivity data can also be used with previous data to create degradation curves for the markings in an effort to better estimate the expected life of the markings in various conditions. Color-coded sections on a map can display retroreflectivity data based on retroreflectivity level. Color coding could be as follows: adequate (above 150 mcd/m 2 /lux), needing attention in the near future (100 mcd/m 2 /lux to 150 mcd/m 2 /lux), and needing replacement (below 100 mcd/m 2 /lux). These maps would provide a quick, clear view of what areas need the most attention and overall pavement marking conditions. The color coding and retroreflectivity levels can be adjusted to include different and/or more/fewer levels. A common problem with mobile retroreflectivity data is the quantity of data that can be captured and the number of associated data files. Increasing the acquire frequency to a longer length will decrease the number of individual data points on a road but will not reduce the number of files, and the increased length decreases the ability to look at small segments. Tools are needed for processing, viewing, analyzing, and displaying the retroreflectivity information. Tools to manage the data and extract the desired results from the data are the key to creating useful information from large amounts of data. The following sections outline processes and prototype tools to aid in these efforts. More sophisticated analyses and linkages to other TxDOT 89

102 databases will be beneficial to provide decision makers with the ability to make informed decisions and better manage the states pavement marking assets. 6.1 RETROREFLECTIVITY DATA FILE HEADERS The current version of the Laserlux software does not contain any fixed fields that will enable ease of automation. Nor does the software contain a menu system to allow the user to enter various preloaded roadway and marking information. To automate the processing of data files, some information is needed about the file on the road segment on which the data are being collected. Figure 26 shows a prototype menu-driven application that will enable the labeling of data files. This prototype allows users to put data files in a directory and then systematically label those files. Ideally, the user would complete this process at the end of the day when routes and details are fresh in their memory. A TxDOT district office will typically select a sample of roads to be measured with most of the roadway, section, and marking information available. In addition to the roadway descriptive elements, the TxDOT control section milepost, Texas Reference Marker number, and other terminology will typically be with these data. A standard spreadsheet format that would feed the menu system is assumed and/or could be easily developed. Pull-down menus provide consistent spelling, naming, etc. Once the file has consistent header information, the ability to batch process an unlimited number of files is possible. Figure 26. Prototype Menu Driven Retroreflectivity Data File Header Input Screen. 90
103 The attributes that are labeled are as follows with examples given: Roadway Name (Katy Freeway, TxDOT Name- IH0010); Roadway Type (Main Lanes, Frontage Road, Arterial, etc.); Roadway Lane Number (what lane is being measured); Travel Direction (NB, SB, EB, WB); Section Limits (IH 610 to BW8); Section Length (6.21 miles); Marking Type (Edgeline, Centerline, Lane Line); Marking Color (Yellow or White); Type of Material if known (Thermoplastic, Tape, etc.); Pavement Type (Concrete, Asphalt, Seal Coat, etc.); Pavement Condition (wet, dry, dirty, etc.); Weather (sunny, overcast, night, etc.); and Other (other informational fields and or comments fields). The envisioned automation process is outlined in Figure 27. These steps consist of documenting the retroreflectivity data file, batching the retroreflectivity files together, and mapping the data using GIS. Once the retroreflectivity data is linked to the TxDOT roadway network, a vast array of analysis can be performed by linking to TxDOT databases such as the Pavement Management Information System. These procedures could also be developed for the handheld data files. 6.2 PROTOTYPE IN AUTOMATION Once the header information is consistent, a number of quality assurance and quality control steps can be completed. In addition the files can be aggregated into a single file and or database that will allow more efficient access to the information. The process of gathering the files involves opening each file and pulling the data into a single file or database, associating the retroreflectivity data to the roadway link, marker type, color, etc. This process could also be done by linking tables in a relational database. In addition to providing ease of access to the retroreflectivity data, using one file simplifies the GIS process that is described below. The process to pull the retroreflectivity files into GIS is fairly involved. However, batching or grouping the files limits the number times the 91
104 process is required to be performed. There are steps that could be run to automate the process further and as the process evolves these procedures and techniques will be refined. Figure 27. Flowchart Showing High Level of Automation. 6.3 GIS PROCEDURES The following subsections provide procedures to import the retroreflectivity data files, plot the points on a GIS map, and link the data to the corresponding roadway sections. 92
105 6.3.1 Overview Mapping of the retroreflectivity data is relatively straight forward but fairly involved. Moderate GIS and Spreadsheet experience is desirable. The process involves several steps in both GIS and Spreadsheet programs. These steps are listed below and described in detail later in the following section. Retroreflectivity Data File Preparation, o Adding columns, o Defining roadway name, o Removing degree symbol, o Adding offset distance, o Adding snap distance, o Format columns, Adding Retroreflectivity Points to GIS, o Set frame properties (select a coordinate system), o Add retroreflectivity points using XY data, o Assign a coordinate system, o Save points as a layer, Add the District DFO (Distance From Origin), o Add the features to your map, o Set the coordinate system, Locate Features Along a Route, o Use the ArcToolbox\Linier Referencing Tools\Locate Features Along a Routes, Add Column in Excel, o Add column for From DFO, o Rename column To DFO, o Copy data from ToDFO to column FromDFO and down one row, o Develop a latitude and longitude for the first segment, Make a Route Event Layer, o Use the ArcToolbox\Linier Referencing Tools\Make a Route Event Layer, and o Create or import symbology for layer. 93
106 6.3.2 What Is Needed The following files and program add-ons are needed to perform the following procedures: District route map DFO (GIS data files), ArcView with the Linier Referencing features (add-ons loaded), and Retroreflectivity data files. If data from more than one roadway type of a named road are being collected, these sections may need to be processed separately. For instance if you are collecting retroreflectivity data on the main lanes and on the frontage roads the data may need to be run separately or offsets on the display will need to be large enough otherwise the points or lines will plot on top of each other. Quality Assurance Quality Control A quick check to compare the number of retroreflectivity points (from the retroreflectivity data file) match the number of points obtained and plotted by ArcView. The number of points should match. An alternative check would be to look at the points versus the line segments to determine why these points are not being read. Questions to ask are: Is the snap tolerance too small or too large? Are the data points on concurrent named routes? Document other checks when looking at the data Retroreflectivity Data File Preparation This procedure prepares the retroreflectivity data file to be pulled into ArcGIS. Several items will be done at this point to simplify steps later. Open the retroreflectivity data file in Excel. Remove the degree symbols from the Latitude and Longitude columns using search and replace (potential for automation). Format both these columns as a number and use six or more decimal places. Insert a column called RTE_NM (Route Name) this corresponds to the field in the DFO layer. 94
107 Name the route on each row in the RTE_NM column just created. Ensure route name is consistent with the GIS DFO layer (route name is a two letter designation and four numbers, i.e., FM0529). You may also want to add a column called SNAP. This is the distance used by the Route Event Layer Tool to determine the radius from the point which a route will be selected, typically 100 ft. This is a snap tolerance distance. If some points do not show up this distance may need to be set to 200 ft. It is also helpful to add a column called OFFSET which is the distance from the centerline the data will be plotted. These values may be negative for westbound and southbound, positive for eastbound and northbound. Format the time to a 24-hour clock time. Name Range: Highlight the data area (exclude header) then name the section something descriptive such as (route name_travel direction_type of marking_marking color (FM0529_EB_SK_WT) (this process works for Excel 2007). For Excel 2003: Delete the header data. Enter a logical file name for the exported data such as FM0529_EB_SK_WT.dbf. Save as a DBF IV (FM0529_EB_SK_WT) file and close Adding Retroreflectivity Points to GIS The first step will be to open ArcGIS and set the frame properties, primarily setting the coordinate system to state plane NAD 83. The retroreflectivity data points will need to be added and saved as a layer so they will be plotted on the map. The points are then associated or linked to a line segment or route. The procedures are outlined below illustrated with figures. Open ArcGIS. Set Frame properties (define the coordinate system). o Right click the layers on the far left frame and scroll down to properties. o In the data frame properties window, select the Coordinate System tab as shown in Figure 28. o Select Geographic Coordinate System\North America\North American Datum This will set the coordinate system for the map. 95
108 Add Retroreflectivity Points to the GIS map (file that was made in previous section). o Select the Tools\Add XY data and the dialog box shown in Figure 29 will show up. o Use the Browse button to select the file created in Excel. o The X and Y field should be filled in with Longitude and Latitude; if not select them. o Set coordinate system by pressing the Edit button at the bottom and filling in the appropriate fields (see Figure 29). It is typically easiest to Import the coordinate system by clicking Import and then select a file with a known coordinate system such as the District DFO file, or you can use the same procedures used to define the coordinate system for the layers. o Click Apply then OK you will need to click OK on the original box as well. The points should then be added to your map. o You will then need to save these points as a layer. Simply click on the layer then right click and Data / Export. Figures 30 and 31 shows the dialog box and naming convention used. A detailed name with the route name, direction of travel, marking type, marking color, and that these are events or points. The events label is important because several files with the same type of name will be created and will be distinguished by points, events, and line. o The layer will automatically be added to the map. Add District DFO Layer (get the TxDOT name and location). Click the plus sign or add feature, locate the file, and add the layer (Ensure that the layer is in NAD 83). In the left window click on layers\ right click Properties\Coordinate System\Predefined\ Geographic Coordinate System\North America\North American Datum Click Apply and OK. 96


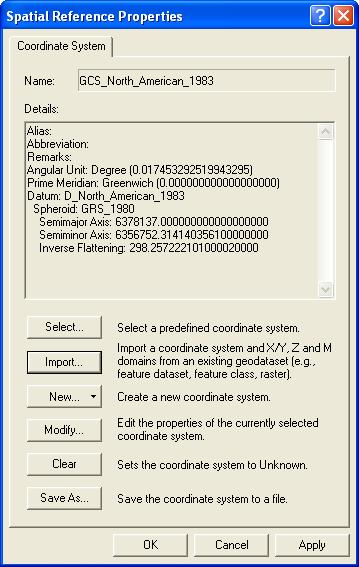
109 Figure 28. Coordinate System Import Screen. 97


110 Figure 29. ArcView XY Data Screen. 98
111 Figure 30. Saving Layer Dialog Box. Figure 31. Export of the Point File as a Layer Locate Features Along a Route Next you will want to associate the two files (the point layer and the District DFO layer). This process creates an Event Table that shows the distances along routes where the point data are located. Click ArcTool box (little red toolbox)\ Linier Referencing Tools\Locate Features Along Routes as shown in Figure 32. This will create an output file that can be DBF XLS or other. 99
 and inserting a column called FromDFO. Then copy the data from the TODFO, move to the FromDFO and down one cell and paste the numbers.")
.")
112 Figure 32. Locate Features Along Routes Tool. Once you have the dbf or xls file you will need to create a TO and FROM set of latitude longitudes. This creates a TO FROM link. This is done by opening this dbf file (in Excel or Access) and inserting a column called FromDFO. Then copy the data from the TODFO, move to the FromDFO and down one cell and paste the numbers. Save the file which will then be pulled back into ArcView. To obtain the first number in the column, subtract the change rate 1/10 mile and paste it in the DFO column. The steps are outlined below. Open the file just created. Inset a column and name it From DFO. Copy the ToDFO to the new column and down one row. Calculate the distance for the first segment (use the 1/10 mile). Save the file as a dbf. Back in ArcView, the dbf file just created will be pulled in using the ArcToolbox\ Linear Referencing Tools\ Make Route Event Layer. The Routes feature is the District DFO layer and use the Route Identifier Field RTE_NM. The dbf file you just created is inserted in the Input Event Table location as shown in Figure 33. Be sure to select the offset field which will allow ArcView to use the field to offset the lines from the centerline. 100


113 Figure 33. Importing Retro Route File. It is useful to display this new linier feature using colors. This can be done by right clicking the layer, then select Properties\Symbology\Import Symbology. You can import the symbology from a previous legend or you can create one using the quantities/graduated colors and define the values you desire. It is suggested that you use below 100 for red 101 to 150 as yellow and above 150 as green. Note: Older versions of ArcView will only use dbf; however, newer versions can pull in Excel Files. 101
CHAPTER ONE INTRODUCTION
 5 CHAPTER ONE INTRODUCTION Pavement markings are an important means of communicating information to drivers. There are many differences in pavement marking practices among state and local transportation
INVESTIGATE THE ABILITY TO DETERMINE PAVEMENT MARKING RETROREFLECTIVITY
 INVESTIGATE THE ABILITY TO DETERMINE PAVEMENT MARKING RETROREFLECTIVITY Evaluate the Advanced Mobile Asset Collection (AMAC) Mobile Pavement Marking Retroreflectivity Measurement System Report prepared
SPECIAL SPECIFICATION 8625 All-Weather Traffic Markings
 2004 Specifications CSJ 6203-45-001, 6225-40-001 & 0045-02-031 SPECIAL SPECIFICATION 8625 All-Weather Traffic Markings 1. Description. This work will consist of furnishing and installing a wet reflective
SPECIAL SPECIFICATION 6110 Reflectorized Pavement Markings with Retroreflective Requirements
 2004 Specifications SPECIAL SPECIFICATION 6110 Reflectorized Pavement Markings with Retroreflective Requirements 1. Description. Furnish and place reflectorized pavement markings of the types, colors,
SPECIAL SPECIFICATION 6003 Reflectorized Pavement Markings with Retroreflective Requirements
 2004 Specifications CSJ's 0005-11-003 & 6120-02-001 SPECIAL SPECIFICATION 6003 Reflectorized Pavement Markings with Retroreflective Requirements 1. Description. Furnish and place reflectorized pavement
SWARCO INDUSTRIES, INC. SWARCOTHERM THERMOPLASTIC PAVEMENT MARKING COMPOUND. SWARCO I First in Traffic Solutions.
 SWARCO INDUSTRIES, INC. SWARCOTHERM THERMOPLASTIC PAVEMENT MARKING COMPOUND SWARCO I First in Traffic Solutions. SWARCO is not only a leading thermoplastic manufacturer but we are the oldest U.S. operating
STATE OF OHIO DEPARTMENT OF TRANSPORTATION SUPPLEMENT 1047 PAVEMENT MARKING MATERIALS PRODUCT EVALUATION AND APPROVAL PROCESS.
 STATE OF OHIO DEPARTMENT OF TRANSPORTATION SUPPLEMENT 1047 PAVEMENT MARKING MATERIALS PRODUCT EVALUATION AND APPROVAL PROCESS October 17, 2014 1047.01 Description 1047.02 Submittal Procedures 1047.03 NTPEP
STATE OF OHIO DEPARTMENT OF TRANSPORTATION SUPPLEMENT 1047 PAVEMENT MARKING MATERIALS PRODUCT EVALUATION AND PREQUALIFICATION PROCESS.
 STATE OF OHIO DEPARTMENT OF TRANSPORTATION SUPPLEMENT 1047 PAVEMENT MARKING MATERIALS PRODUCT EVALUATION AND PREQUALIFICATION PROCESS July 21, 2017 1047.01 Description 1047.02 Submittal Procedures and
FDOT and NTPEP Pavement Marking Materials Test Decks
 FDOT and NTPEP Pavement Marking Materials Test Decks Project Overview FDOT Office State Materials Office Report Number EXP-I-4 Authors Nikita L. Reed Date of Publication March 2017 About NTPEP The National
APPLICATION SPECIFICATION CONVENTIONAL PAVEMENT MARKING MATERIALS 3 MINUTE DRY ALKYD AND HIGH SOLIDS LATEX
 APPLICATION SPECIFICATION CONVENTIONAL PAVEMENT MARKING MATERIALS 3 MINUTE DRY ALKYD AND HIGH SOLIDS LATEX Values stated in the International System of Units SI apply only to projects to be constructed
Implementation of a Pavement Marking Management Program in Florida
 Implementation of a Pavement Marking Management Program in Florida NESMEA 2013 Presentation Outline Pavement Marking Information Current Re-Striping Determinations Mobile Retroreflectivity Unit (MRU) MRU
Importance of Pavement Marking Retroreflectivity Standards
 Importance of Pavement Marking Retroreflectivity Standards Paul Carlson, Ph.D., P.E. Research Engineer Texas A&M Transportation Institute Texas A&M University TTI s Visibility Research Laboratory Research
Texas Transportation Institute The Texas A&M University System College Station, Texas
 Technical Report Documentation Page 1. Report No. FHWA/TX-06/5-1757-01-1 4. Title and Subtitle SUPPORT FOR THE IMPLEMENTATION OF A LONGITUDINAL JOINT DENSITY SPECIFICATION FOR HOT-MIX ASPHALT CONCRETE
Pavement Marking Life Cycle Cost Analysis. Kevin Lacy, PE
 Pavement Marking Life Cycle Cost Analysis Kevin Lacy, PE Overview NC pavement markings include paint, thermoplastic, cold applied plastic, and polyurea. Cold applied plastic is only used in select locations.
806 - DURABLE PAVEMENT MARKING SECTION 806 DURABLE PAVEMENT MARKING
 SECTION 806 DURABLE PAVEMENT MARKING 806.1 DESCRIPTION Prepare the pavement and apply the pavement markings as shown in the Contract Documents. When rumble strips are to be constructed on the project,
Sign Retroreflectivity Requirements in the MUTCD. Final Rule. MUTCD Changes. Conducting Visual Nighttime Inspections. University of Kentucky
 Sign Retroreflectivity Requirements in the MUTCD Eric Green, MSCE, PE, GISP Kentucky Transportation Center Final Rule Published on Dec 21, 2007 Vol 72, No. 245 Revision #2 of the 2003 Edition of the MUTCD
Technical Report Documentation Page 2. Government Accession No. 3. Recipient's Catalog No.
 1. Report No. FHWA/TX-15/5-9049-03-7 4. Title and Subtitle INSTALLATION OF DYNAMIC TRAVEL TIME SIGNS AND EFFORTS TO OBTAIN AND TEST A GRAPHICAL ROUTE INFORMATION PANEL (GRIP) SIGN IN AUSTIN Technical Report
Special Specification 6148 Inverted Profile Pavement Marking (Audible)
") Special Specification Inverted Profile Pavement Marking (Audible) 1. DESCRIPTION 2. MATERIALS Furnish and install an Inverted Profile Pavement Marking (Audible) that is hot applied to the pavement surface.
Special Specification Inverted Profile Pavement Marking (Audible) 1. DESCRIPTION 2. MATERIALS Furnish and install an Inverted Profile Pavement Marking (Audible) that is hot applied to the pavement surface.
Development of a Presence Assessment Tool for Iowa s Pavement Marking Management System
 Development of a Presence Assessment Tool for Iowa s Pavement Marking Management System Final Report May 2011 Sponsored by Iowa Department of Transportation University Transportation Centers Program, U.S.
SPECIAL SPECIFICATION 6149 Multipolymer Pavement Markings (MPM)
") 2004 Specifications CSJ s 0197-02-097, 0502-01-183 & 2374-03-068 SPECIAL SPECIFICATION 6149 Multipolymer Pavement Markings (MPM) 1. Description. Provide MPM on pavement surfaces shown on the plans to meet
2004 Specifications CSJ s 0197-02-097, 0502-01-183 & 2374-03-068 SPECIAL SPECIFICATION 6149 Multipolymer Pavement Markings (MPM) 1. Description. Provide MPM on pavement surfaces shown on the plans to meet
PAVEMENT MARKINGS. Regulatory + Coloured + Specialty
 PAVEMENT MARKINGS Regulatory + Coloured + Specialty 2 The way society moves through the world should be an afterthought Ennis-Flint traffic safety products help save lives, prevent injuries and reduce
State Freeways/Expressways State Highways Roundabouts Special Markings Notes
 State Freeways/Expressways State Highways Roundabouts Special Markings Notes Alabama (Tape on concrete surfaces) (Tape on concrete surfaces) We have none at this time but would be same as left (Tape on
Field Evaluation Of Pavement Marking Materials
 NTPEP Committee Work Plan for Field Evaluation Of Pavement Marking Materials NTPEP Designation: PMM-17-01 National Transportation Product Evaluation Program 444 North Capitol Street N. W., Suite 249 Washington,
Evaluating the Effectiveness of Temporary Work-Zone Pavement Marking Products
 Evaluating the Effectiveness of Temporary Work-Zone Pavement Marking Products Final Report July 2012 Sponsored by Smart Work Zone Deployment Initiative (TPF-5(081)) Federal Highway Administration (InTrans
research report Virginia Transportation Research Council Final Report VTRC 09-R24 MICHAEL D. FONTAINE, Ph.D., P.E. Senior Research Scientist
 Final Report VTRC 09-R24 Virginia Transportation Research Council research report Synthesis of Benefits and Costs of Alternative Lane Marking Strategies http://www.virginiadot.org/vtrc/main/online_reports/pdf/09-r24.pdf
Evaluation of Double Drop Beads Pavement Edge Lines
 Evaluation of Double Drop Beads Pavement Edge Lines By Dr. Jay K. Lindly (Principal Investigator) and Ms. Ayse Narci Department of Civil, Construction, and Environmental Engineering The University of Alabama
CONSTRUCTION SPECIFICATION FOR PAVEMENT MARKING
 ONTARIO PROVINCIAL STANDARD SPECIFICATION METRIC OPSS 532 JUNE 1991 CONSTRUCTION SPECIFICATION FOR PAVEMENT MARKING 532.01 SCOPE 532.02 REFERENCES 532.03 DEFINITIONS TABLE OF CONTENTS 532.04 SUBMISSION
MINNESOTA DEPARTMENT OF TRANSPORTATION Engineering Services Division Technical Memorandum No T-02 October 30, 2014
 MINNESOTA DEPARTMENT OF TRANSPORTATION Engineering Services Division Technical Memorandum No. 14-11-T-02 To: From: Subject: Electronic Distribution Recipients Jon M. Chiglo, P.E. Division Director, Engineering
CONSTRUCTION SPECIFICATION FOR PAVEMENT MARKING
 ONTARIO PROVINCIAL STANDARD SPECIFICATION METRIC OPSS 710 NOVEMBER 2010 CONSTRUCTION SPECIFICATION FOR PAVEMENT MARKING TABLE OF CONTENTS 710.01 SCOPE 710.02 REFERENCES 710.03 DEFINITIONS 710.04 DESIGN
Technical Report Documentation Page 2. Government Accession No. 3. Recipient s Catalog No. 1. Report No. FHWA/TX-04/4128-2
 1. Report No. FHWA/TX-04/4128-2 4. Title and Subtitle COUNTERMEASURES FOR WRONG-WAY MOVEMENT ON FREEWAYS: GUIDELINES AND RECOMMENDED PRACTICES 7. Author(s) Scott A. Cooner, A. Scott Cothron, and Steven
Iowa Pavement Marking Management System: Initial Phases
 Iowa Pavement Marking Management System: Initial Phases Neal R. Hawkins Center for Transportation Research and Education Iowa State University 2900 S. Loop Drive, Suite 3100 Ames, IA 50010 hawkins@iastate.edu
Decision Support Tool for Nighttime Construction and Air Quality - User s Guide
 Product 0-6864-P1 Decision Support Tool for Nighttime Construction and Air Quality - User s Guide Project 0-6864 Project Title: Investigate the Air Quality Benefits of Nighttime Construction in Non-Attainment
Selecting a Method to Comply with the Requirements for Traffic Sign Retroreflectivity
 Selecting a Method to Comply with the Requirements for Traffic Sign Retroreflectivity James W. Ellison, P.E. Consulting Traffic Engineer Federal Way, WA The Complexity of Sign Retroreflectivity Driver
VERMONT AGENCY OF TRANSPORTATION Research and Development Section Research Report
 VERMONT AGENCY OF TRANSPORTATION Research and Development Section Research Report EPOPLEX GLOMARC 90 POLYUREA PAVEMENT MARKING Report 2015 02 January 2015 EPOPLEX GLOMARC 90 POL YUREA PAVEMENT MARKING
PAVEMENT MARKINGS. F. Grooves Cut for Pavement Markings, Symbols, and Legends
 PAVEMENT MARKINGS PART 1 - GENERAL 1.01 SECTION INCLUDES A. Permanent Pavement Markings, Symbols, and Legends B. Removable Pavement Markings, Symbols, and Legends C. Temporary Delineators D. Raised Pavement
AMENDMENTS Manual of STANDARD SPECIFICATIONS. Adopted by Standard Specifications Committee. Amendment. No. 7. Published by
 AMENDMENTS to 2012 Manual of STANDARD SPECIFICATIONS Adopted by Standard Specifications Committee Amendment No. 7 Published by Utah LTAP Center Utah State University 8305 Old Main Hill Logan UT 84322-8205
KENTUCKY TRANSPORTATION CENTER
 Research Report KTC-11-22/SPR330-07-2I KENTUCKY TRANSPORTATION CENTER EVALUATION OF LONG-TERM PAVEMENT MARKING PERFORMANCE OUR MISSION We provide services to the transportation community through research,
Section 811. PERMANENT PAVEMENT MARKINGS
 811.01 Section 811. PERMANENT PAVEMENT MARKINGS 811.01. Description. This work consists of providing and applying retroreflective permanent pavement markings in accordance with the Michigan Manual on Uniform
1. Report No. 5. Report Date Published: January Performing Organization Code. 8. Performing Organization Report No.
 Technical Report Documentation Page 1. Report No. 2. Government Accession No. 3. Recipient's Catalog No. FHWA/TX-14/0-6705-1 4. Title and Subtitle EVALUATING THE EFFECTIVENESS OF PERFORMANCE BASED PAVEMENT
DEPARTMENT OF THE ARMY U.S. ARMY CORPS OF ENGINEERS 441 G STREET, NW WASHINGTON, DC
 DEPARTMENT OF THE ARMY U.S. ARMY CORPS OF ENGINEERS 441 G STREET, NW WASHINGTON, DC 20314-1000 REPLY TO ATTENTION OF S: 30 September 2014 CECW-CO 3 0 December 20 11 MEMORANDUM FOR MSC and District Chiefs,
Specification for Durable, All Weather, Preformed, Patterned Pavement Markings. 3M Stamark High Performance All Weather Tape Series 380AW
 Specification for Durable, All Weather, Preformed, Patterned Pavement Markings 3M Stamark High Performance All Weather Tape Series 380AW March 2016 (SP380AW) Market Test Specification For Durable, All
10/23/08. Sign reflectivity rule & the Private sector. Illinois Traffic Engineering & Safety Conference
 Sign reflectivity rule & the Private sector Illinois Traffic Engineering & Safety Conference 10/23/08 Michael Conoscenti President 1740 Internationale Pkwy Woodridge, IL 60517 630-972-7770 x1011 mike@westernremac.com
KANSAS DEPARTMENT OF TRANSPORTATION SPECIAL PROVISION TO THE STANDARD SPECIFICATIONS, EDITION 2015
 Sheet 1 of 10 KANSAS DEPARTMENT OF TRANSPORTATION SPECIAL PROVISION TO THE STANDARD SPECIFICATIONS, EDITION 2015 Delete SECTION 806 and replace with the following: SECTION 806 DURABLE PAVEMENT MARKING
2nd RESUBMITTAL. Texas Transportation Institute The Texas A&M University System College Station, Texas
 1. Report No. FHWA/TX-07/0-5457-1 2. Government Accession No. 3. Recipient's Catalog No. 4. Title and Subtitle PRELIMINARY RESULTS OF REPEATABILITY AND SENSITIVITY STUDY ON OVERLAY TESTER FOR CRACK SEALANTS
2.0 MATERIALS AND REQUIRED PROPERTIES
 March 28, 2001 Supersedes January 28, 1993 SPECIFICATIONS NO. 1 PATTERNED PREFORMED POLYMER PAVEMENT MARKING TAPE WITH IMPROVED RETENTION OF REFLECTIVITY FOR LINES AND SELECTED SYMBOLS AND LEGENDS 1.0
PAVEMENT MARKINGS. Presented by: Tom Clayton Director of Training and Member Services CAPA/RMAEC
 PAVEMENT MARKINGS Presented by: Tom Clayton Director of Training and Member Services CAPA/RMAEC ASPHALT SURFACES There are different types and textures of asphalt surfaces in which markings are applied.
DEPARTMENT OF TRANSPORTATION
 Gregory A. Whirley Commissioner January 10, 2014 DEPARTMENT OF TRANSPORTATION 1401 EAST BROAD STREET RICHMOND, VIRGINIA 23219-2000 Order No.: D46 Route: Various Project: (NFO)0000-96A-207, N501-N504 FHWA:
Technical Report Documentation Page 2. Government Accession No. 3. Recipient's Catalog No. 1. Report No. FHWA/TX-12/
 1. Report No. FHWA/TX-12/9-1001-2 4. Title and Subtitle EVALUATION OF TRAFFIC CONTROL DEVICES, YEAR 3 Technical Report Documentation Page 2. Government Accession No. 3. Recipient's Catalog No. 5. Report
TigerPrints. Clemson University. Joseph Robertson Clemson University,
 Clemson University TigerPrints All Theses Theses 12-2011 A METHODOLOGY FOR ESTIMATING AND COMPARING THE LIFECYCLES OF HIGH-BUILD AND CONVENTIONAL WATERBORNE PAVEMENT MARKINGS ON PRIMARY AND SECONDARY ROADS
CTRE DURABLE, COST-EFFECTIVE PAVEMENT MARKINGS PHASE I: SYNTHESIS OF CURRENT RESEARCH FINAL REPORT
 DURABLE, COST-EFFECTIVE PAVEMENT MARKINGS PHASE I: SYNTHESIS OF CURRENT RESEARCH FINAL REPORT Sponsored by the Iowa Department of Transportation and the Iowa Highway Research Board Iowa DOT Project TR-454
Texas Transportation Institute The Texas A&M University System College Station, Texas
 1. Report No. FHWA/TX-09/0-4701-5 2. Government Accession No. 3. Recipient's Catalog No. 4. Title and Subtitle EVALUATION OF TRAFFIC CONTROL DEVICES: FIFTH-YEAR ACTIVITIES Technical Report Documentation
Road Markings for Machine Vision NCHRP Project (6) Update to AASHTO SCOTE June 2016
 Update to AASHTO SCOTE June 2016") Road Markings for Machine Vision NCHRP Project 20-102(6) Update to AASHTO SCOTE June 2016 NCHRP Project 20-102 Impacts of Connected Vehicles and Automated Vehicles on State and Local Transportation Agencies
Road Markings for Machine Vision NCHRP Project 20-102(6) Update to AASHTO SCOTE June 2016 NCHRP Project 20-102 Impacts of Connected Vehicles and Automated Vehicles on State and Local Transportation Agencies
TABLE OF CONTENTS. Background... 3 Purpose of Document Types of Materials... 4 Material Attributes... 6 Retroreflectivity... 9 Durability...
 TABLE OF CONTENTS EXECUTIVE SUMMARY... 1 INTRODUCTION... 3 Background... 3 Purpose of Document... 3 MATERIALS... 4 Types of Materials... 4 Material Attributes... 6 Retroreflectivity... 9 Durability...
TXDOT SIGNING AND MARKINGS REVIEW OF MATERIALS & PRACTICES
 TXDOT SIGNING AND MARKINGS REVIEW OF MATERIALS & PRACTICES Table of Contents 1 2 3 4 5 6 7 Introduction Traffic Marking Specifications Traffic Marking Practices Signing Specifications Retroreflective Sheeting
90 th Annual T.H.E. Conference. Sign Retroreflectivity. Mike Staggs Mobility & Safety Team Leader Federal Highway Admin. - Ilinois
 90 th Annual T.H.E. Conference Sign Retroreflectivity Mike Staggs Mobility & Safety Team Leader Federal Highway Admin. - Ilinois Overview Retroreflectivity What is it? Materials - How do retroreflective
Great Plains Waste Management Conference April 18, 2013 MUTCD MUTCD. Why Do We Install Signs? MUTCD
 Great Plains Waste Management Conference April 18, 2013 Retroreflectivity Assessment and Management Methods Presented by Don Neary Nebraska LTAP Starting at age 20, the amount of light needed to see an
PAVEMENT MARKING, METHYL METHACRYLATE
 PAVEMENT MARKING, METHYL METHACRYLATE PART 1 GENERAL 1.1 SECTION INCLUDES A. Methods and materials for installing durable colored pavement marking materials, consisting of anti-slip treated methyl methacrylate.
GIS USE IN PAVEMENT MARKING AND SIGN MANAGEMENT: AN INTEGRATED APPROACH
 GIS USE IN PAVEMENT MARKING AND SIGN MANAGEMENT: AN INTEGRATED APPROACH Omar Smadi 1, Zachary Hans 2, and Neal Hawkins 3 ABSTRACT Geographic information system (GIS) technology is a key component of all
Student Services & Classroom Addition
 SECTION 321723 - PAVEMENT MARKINGS PART 1 GENERAL 1.1 RELATED DOCUMENTS A. Drawings and general provisions of the Contract, including General and Supplementary Conditions and Division 01 Specification
Texas Transportation Institute The Texas A&M University System College Station, Texas
 1. Report No. FHWA/TX-05/9-8132-3 4. Title and Subtitle TESTING AND EVALUATION OF THE FLORIDA F SHAPE RIDGE RAILWITH REDUCED DECK THICKNESS 2. Government Accession No. 3. Recipient's Catalog No. 5. Report
MATERIAL SPECIFICATION FOR PREFORMED PLASTIC PAVEMENT MARKING TAPE
 ONTARIO PROVINCIAL STANDARD SPECIFICATION METRIC OPSS 1715 FEBRUARY 1991 MATERIAL SPECIFICATION FOR PREFORMED PLASTIC PAVEMENT MARKING TAPE 1715.01 SCOPE 1715.02 REFERENCES 1715.03 DEFINITIONS 1715.05
ITEM 666 REFLECTORIZED PAVEMENT MARKINGS
 ITEM 666 REFLECTORIZED PAVEMENT MARKINGS 666.1. Description. This Item shall govern for furnishing and placing reflectorized pavement markings of the types, colors, shapes, sizes, widths, and thickness
RAILING DESIGN FOR NEW TRUSS BRIDGES. Texas Transportation Institute The Texas A&M University System College Station, Texas
 1. Report No. FHWA/TX-05/0-4419-4 4. Title and Subtitle RAILING DESIGN FOR NEW TRUSS BRIDGES 2. Government Accession No. 3. Recipient's Catalog No. Technical Report Documentation Page 5. Report Date October
TECHNICAL REPORT STANDARD TITLE PAGE 1. Report No. 2. Government Accession No. 3. Recipient's Catalog No.
 TECHNICAL REPORT STANDARD TITLE PAGE 1. Report No. 2. Government Accession No. 3. Recipient's Catalog No. FHWA-TX-79-SS15. 14 4. Title and Subtitle 5, Report Date Maintenance Pavement Crack Repair Using
1\L\TF:Rit\LS & IH: SI~ ARCII RESEARCH UPDATI 3M STAMARK WET REFLECTIVE TAPE SERIES 820
 1\L\TF:Rit\LS & IH: SI~ ARCII ~ewed by1{. ~ Dona~athrop, P.E. Materials and Research Engineer RESEARCH UPDATI Prepared by: Kat Patterson if November 29,2004 u 2004-2 REFERENCES Work Plan No. 2002-R-7 INTRODUCTION
!_()~p~ WWiam E Ahearn, P.E. Materials and Research Engineer. Pavement Marking Durability Statewide Final Report. March 2007.
~p~ WWiam E Ahearn, P.E. Materials and Research Engineer. Pavement Marking Durability Statewide Final Report. March 2007.") Pavement Marking Durability Statewide Final Report March 2007 Report 2007-3 State ofvennont Agency of Transportation Materials and Research Section Prepared By: Reviewed By:!_()~p~ WWiam E Ahearn, P.E.
Pavement Marking Durability Statewide Final Report March 2007 Report 2007-3 State ofvennont Agency of Transportation Materials and Research Section Prepared By: Reviewed By:!_()~p~ WWiam E Ahearn, P.E.
Evaluation of Sign Sheeting Service Life in Wyoming
 PAPER #-0 Evaluation of Sign Sheeting Service Life in Wyoming by Adam M. Pike, P.E. (Corresponding Author) Assistant Research Engineer Signs and Marking Program Texas A&M Transportation Institute TAMU
Texas Transportation Institute The Texas A&M University System College Station, Texas
 1. Report No. FHWA/TX-01/4190-4 4. Title and Subtitle EMISSIONS DUE TO CONSTRUCTION EQUIPMENT AND TRAFFIC DELAYS TASK 6: CONTRIBUTION OF VEHICULAR EMISSIONS CAUSED BY REDUCTION IN CAPACITY DURING ROADWAY
May 2004 Traffic Control 600-i. Table of Contents 601 WORK ZONE TRAFFIC CONTROL DESCRIPTION OF WORK
 DIVISION 600 Traffic Control SOUTH CAROLINA DEPARTMENT OF TRANSPORTATION May 2004 May 2004 Traffic Control 600-i Section Table of Contents Page 601 WORK ZONE TRAFFIC CONTROL...601-1 601.1 DESCRIPTION
Stamark Liquid Pavement Marking Series 1500
 3 Stamark Liquid Pavement Marking Series 1500 Market Test Product Bulletin 1500 March 2004 Replaces PB 1500 dated February 2002 Description 3M Stamark Liquid Pavement Marking (LPM) Series 1500 is designed
CHARLEVOIX COUNTY CHARLEVOIX COUNTY ROAD COMMISSION BOARD 2018 ANNUAL PAVEMENT MARKINGS BID
 CHARLEVOIX COUNTY CHARLEVOIX COUNTY ROAD COMMISSION BOARD 2018 ANNUAL PAVEMENT MARKINGS BID NOTICE TO BIDDERS The Charlevoix County Road Commission invites qualified contractors to bid on the annual requirement
research report Analysis of the Mechanistic-Empirical Pavement Design Guide Performance Predictions: Influence of Asphalt Material Input Properties
 Final Report VTRC 11-R3 Virginia Transportation Research Council research report Analysis of the Mechanistic-Empirical Pavement Design Guide Performance Predictions: Influence of Asphalt Material Input
Evaluation of Flexible Delineator Posts
 Transportation Kentucky Transportation Center Research Report University of Kentucky Year 1990 Evaluation of Flexible Delineator Posts Kenneth R. Agent Jerry G. Pigman University of Kentucky, ken.agent@uky.edu
KANSAS DEPARTMENT OF TRANSPORTATION SPECIAL PROVISION TO THE STANDARD SPECIFICATIONS, 1990 EDITION
 Sheet 1 of 6 KANSAS DEPARTMENT OF TRANSPORTATION SPECIAL PROVISION TO THE STANDARD SPECIFICATIONS, 1990 EDITION SECTION TRAFFIC CONTROL Page 628, subsection.01. Delete the following bid items: Advance
SPECIAL SPECIFICATION 7270 High Build Paint
 2004 Specifications CSJ 6147-86-001 SPECIAL SPECIFICATION 7270 High Build Paint 1. Description. A. This work shall consist of furnishing and installing a multiple component, retroreflective traffic marking
Field Guide on. Safe Maintenance and. Work Zone Operations
 Field Guide on Installation and Removal of Temporary Traffic Control for Safe Maintenance and Work Zone Operations August 2008 Introduction This field guide provides field personnel with introductory guidance
CE marking. Nordisk vägmarkeringskonferens, Finland Rovaniemi
 CE marking Nordisk vägmarkeringskonferens, Finland Rovaniemi 8.-9.2.2011 Timeframe Draft standards sent to UAP Deadline supporting standards 2011-03-21 Deadline product standards 2011-07-01 Next WG2 meeting
Implementation, Training, and Outreach for MnDOT Pavement Marking Tool - Phase II
 Implementation, Training, and Outreach for MnDOT Pavement Marking Tool - Phase II Omar Smadi, Principal Investigator Center for Transportation Research and Education Iowa State University October 2012
PRELIMINARY REVIEW COPY
 PRELIMINARY REVIEW COPY 1. Report No. FHWA/TX-06/0-5176-S Technical Report Documentation Page 2. Government 3. Recipient s Catalog No. Accession No. 4. Title and Subtitle Conversion of Volunteer-Collected
Transportation Research Forum
 Transportation Research Forum Methodologies to Predict Service Lives of Pavement Marking Materials Author(s): Yunlong Zhang and Dongfeng Wu Source: Journal of the Transportation Research Forum, Vol. 45,
20. Security Classif.(of this page) Unclassified
 Unclassified") 1. Report No. FHWA/TX-09/0-6023-1 Technical Report Documentation Page 2. Government Accession No. 3. Recipient's Catalog No. 4. Title and Subtitle SYNTHESIS ON CONSTRUCTION UNIT COST DEVELOPMENT: TECHNICAL
1. Report No. FHWA/TX-09/0-6023-1 Technical Report Documentation Page 2. Government Accession No. 3. Recipient's Catalog No. 4. Title and Subtitle SYNTHESIS ON CONSTRUCTION UNIT COST DEVELOPMENT: TECHNICAL
TECHNICAL REPORT STANDARD TITLE PAGE J. Repo,t No. 2. Govf'rnmen' Accession No. 3. RecIpIent's Catalog No.
 TECHNICAL REPORT STANDARD TITLE PAGE J. Repo,t No. 2. Govf'rnmen' Accession No. 3. RecIpIent's Catalog No. FHWA/TX-420-3F- vol.3 4. T.lle "nd Subtitl.. --------.l---------- ---rrs.-r~.:-:-po-rt:--;d:;--o-:--t.-----------
Form DOT F (8-72) Technical Report Documentation Page 2. Government Accession No. 3. Recipient's Catalog No. 1. Report No.
 Technical Report Documentation Page 2. Government Accession No. 3. Recipient's Catalog No. 1. Report No.") 1. Report No. TX-00/2962-S 4. Title and Subtitle EVALUATION OF FLUORESCENT ORANGE SIGNS Technical Report Documentation Page 2. Government Accession No. 3. Recipient's Catalog No. 5. Report Date October
1. Report No. TX-00/2962-S 4. Title and Subtitle EVALUATION OF FLUORESCENT ORANGE SIGNS Technical Report Documentation Page 2. Government Accession No. 3. Recipient's Catalog No. 5. Report Date October
Questionnaire Survey for Current Practices in Roadway Safety Hardware Asset Management at State Transportation Agencies
 MRUTC Project 8-7: A Methodology for Integrating Roadway Safety Hardware Management into the Overall Highway Asset Management Program Questionnaire Survey for Current Practices in Roadway Safety Hardware
Accelerated Sign Inventory and Management
 2015 The AASHTO Subcommittee on Maintenance (SCOM), Des Moines, Iowa Accelerated Sign Inventory and Management Erany Robinson-Perry Assistant State Maintenance Engineer Georgia Department of Transportation
KANSAS DEPARTMENT OF TRANSPORTATION SPECIAL PROVISION TO THE STANDARD SPECIFICATIONS, 1990 EDITION
 Sheet 1 of 6 KANSAS DEPARTMENT OF TRANSPORTATION SPECIAL PROVISION TO THE STANDARD SPECIFICATIONS, 1990 EDITION SECTION TRAFFIC CONTROL Page 628, subsection.01. Delete the following bid items: Advance
Mobile Work Zones. Traffic Control in Short Duration / Guidelines for M0WING ZONE AHEAD WORK ROAD SHOULDER WORK RIGHT LANE CLOSED AHEAD SIGNAL AHEAD
 M0WING ZONE ROAD WORK AHEAD SHOULDER WORK RIGHT LANE CLOSED AHEAD SIGNAL WORK AHEAD Guidelines for Traffic Control in Short Duration / Mobile Work Zones Guidelines for Traffic Control in Short Duration
CHAPTER 16: TRAFFIC. In either situation, the plan must contain the detail for the interim pavement markings.
 CHAPTER 16: TRAFFIC ADVANCE WARNING SIGN SPACING The Advance Warning Sign Spacing for 0-30 mph has been reduced from 300 feet to 100 feet. This is more in line with the Federal MUTCD and accounts for more
SECTION 905 TRAFFIC SIGNS, STRIPING AND RAISED MARKERS
 SECTION 905 TRAFFIC SIGNS, STRIPING AND RAISED MARKERS Delete this Section in its entirety and replace with the following: SECTION 905 TRAFFIC SIGNS, STRIPING AND RAISED MARKERS 905-1 DESCRIPTION: This
Night Work Specification
 1.0 HOURS OF WORK Night Work Specification Night time hours are defined as per the Tender documents. 2.0 TRAFFIC CONTROL PLAN Prior to the start of work the Contractor shall submit 4 bound copies of a
ARBN PRODUCT INDEX
 ARBN 26 008 776 243 PRODUCT INDEX TRAFFIC PAINTS 1. Waterbased Road Marking 201 White 2. Waterbased Road Marking 301 HD White 3. Waterbased Road Marking 401 HR White 4. Waterbased Road Marking RF6040 White
CEDAR RAPIDS METROPOLITAN AREA STANDARD SPECIFICATIONS FOR PUBLIC IMPROVEMENTS April 2003
 SECTION 02850 PAVEMENT MARKINGS PART 1 GENERAL 1.01 - Section Includes A. Traffic Paint. B. Thermoplastic Reflectorized Pavement Markings. C. Permanent Marking Tape. D. Preformed Polymer Marking Material
ARBN PRODUCT INDEX
 ARBN 26 008 776 243 PRODUCT INDEX TRAFFIC PAINTS 1. Waterbased Road Marking 201 White 2. Waterbased Road Marking 301 HD White 3. Waterbased Road Marking 401 HD White 4. Waterbased Road Marking RF6040 White
KANSAS DEPARTMENT OF TRANSPORTATION SPECIAL PROVISION TO THE STANDARD SPECIFICATIONS, 1990 EDITION
 Sheet 1 of 7 KANSAS DEPARTMENT OF TRANSPORTATION SPECIAL PROVISION TO THE STANDARD SPECIFICATIONS, 1990 EDITION SECTION TRAFFIC CONTROL Page 628, subsection.01. Delete the following bid items: Advance
Author Justin Jackson Student Center for Transportation Research and Education, Iowa State University
 NIGHTTIME ROAD CONSTRUCTION: CURRENT ISSUES Author Justin Jackson Student Center for Transportation Research and Education, Iowa State University Center for Transportation Research and Education Iowa State
KENTUCKY TRANSPORTATION CENTER
 Research Report KTC-08-20/FR155-06-1F KENTUCKY TRANSPORTATION CENTER EXPERIMENTAL CONCRETE COATING APPLICATION ON THE MEDIAN BARRIER OF I-65 IN LOUISVILLE OUR MISSION We provide services to the transportation
KU Design Guidelines APPENDIX II PERMEABLE BITUMINOUS PAVEMENT
 PERMEABLE BITUMINOUS PAVEMENT PART 1: GENERAL 1.01. RELATED DOCUMENTS: A. Drawings and general provisions of Contract, including Special Requirements General Conditions and Division 1 Specifications Sections,
MATERIAL SPECIFICATION FOR THERMOPLASTIC PAVEMENT MARKING MATERIALS
 ONTARIO PROVINCIAL STANDARD SPECIFICATION METRIC OPSS 1713 FEBRUARY 1991 MATERIAL SPECIFICATION FOR THERMOPLASTIC PAVEMENT MARKING MATERIALS 1713.01 SCOPE 1713.02 REFERENCES 1713.03 DEFINITIONS 1713.05
Report. Interim THE MARKING M ATERIAL IN VIRGINIA. Application-- --The. Eric. Paltell Graduate Student Author. University of Virginia)
") EVALUATION OF EPOXY THERMOPLASTIC THE MARKING M ATERIAL IN VIRGINIA PAVEMENT opinions, findings, and conclusions expressed in this ( are those of the author and not necessarily those of report Highway
EVALUATION OF EPOXY THERMOPLASTIC THE MARKING M ATERIAL IN VIRGINIA PAVEMENT opinions, findings, and conclusions expressed in this ( are those of the author and not necessarily those of report Highway