ASSIGNMENT SUBMISSION FORM
|
|
|
- Eileen Black
- 6 years ago
- Views:
Transcription
1 ASSIGNMENT SUBMISSION FORM Course Name Section Project Report : Forecasting Analytics : A : Inventory Management through Sales Forecasting PGID Name of the Member Anand Abhishek Bharath Sankaran Mayank Thapliyal Rohan Chakraborty Urvashi Surana Sunil Varun Madnani

2 Forecasting Analytics- Group A2 PROJECT TITLE: Inventory Management at Nestle through Sales Forecasting EXECUTIVE SUMMARY: Problem Description: FMCG companies like Nestle face trouble in forecasting demand for smaller regions which comprises nearly 50% of their business and is highly critical. This is due to high volatility in demand. Due to this problem more often than not the sales force in these regions face a situation wherein they are either short of inventory and unable to meet demand or have piled up inventory at warehouses. A model that effectively forecasts sales can be tested on a small region (in this case Ferozpur sales zone) which if successful can later be deployed to other smaller regions which can be highly beneficial in management of inventory and thus production. Brief Description of Data: The data has been sourced from Nestle SDS software (ERP system).the dataset obtained contains daily bill-wise product-wise sales and retailer-wise product wise sales at a distributor level for the time period Jan 2012 to Jan We have considered the top 6 products in different product categories of Nestle based on Sales volumes, i.e., Maggi, Eclairs, Nescafe Coffee Classic, Everyday daily whitener, Munch & Cerelac. Since the data is actual company sales data and Nestle has a very robust reporting mechanism, therefore the data was accurate & complete (except for 2 values which possibly got lost while extracting the data from the system. We manually confirmed those two values through the system and updated them). Data is consistent, unique and timely, i.e., it is in ascending order, there are no duplicate time stamps and they match the precision of a calendar. Charts (Various products plotted against time): Monthly data

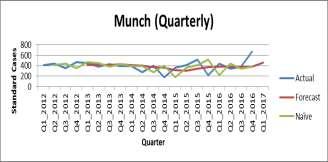
3 Quarterly data Final Forecasting Model: The final model is a tool that is able to forecast the sales of top 6 products by choosing the method most suited for forecasting sales for that product. The manager will need to input the product name in the model and the model will use historical data to come up with the forecast. The most suited model is determined based on the predictive accuracy (the one with least expected error in forecasting) of the method on a product time series. The overall performance of the model as compared to the benchmark is 12-15% better in terms of % error. Conclusion: Based on our analysis, we found that: 1. Quarterly forecasting performs much better on predictive accuracy as compared to monthly forecasting (Refer Exhibit 1). 2. Use of different forecasting models to estimate sales for different products gives maximum predictive accuracy. 3. Predictive power of some models might be impacted by lack of sales promotion and marketing campaign information. 4. The forecasts for the month of Feb 17, Mar 17 and Apr 17 have been provided in Exhibit 2 Recommendations: 1. We should go ahead with quarterly forecasting as it provides a better estimate. 2. Forecasting horizon should not be more than one quarter as it is a learning based model.
4 3. Predictive power of the model should be improved by taking into account the effect of sales and marketing initiatives along with other external factors (macroeconomic, competitor strategy). TECHNICAL SUMMARY: Data Preparation: Initially we received the bill-wise data at daily level. We then aggregated the data as per product category at monthly and quarterly level using the tool Spotfire. We took the top products across six different product categories as per sales volume in Firozpur sales zone in Punjab. These top six products across categories are Maggi (snacks), Nescafe classic (beverages), Everyday Daily Whitener (dairy), Cerelac (infant nutrition), Munch (chocolate), and Eclairs (confectionaries). However, one of these products (Maggi) was hit by a lawsuit controversy in May 2015 and hence was withdrawn by Nestle in the June, After thorough quality and process check the product was relaunched in November, However, as Firozpur sales region is small so the product was relaunched in this area by the end of March. In order to compensate for this unforeseen event, we imputed the affected data of this duration in our dataset by comparing with the sales of previous year in the same period and thus finally multiplying with a correction factor (depending on the growth/de-growth rate observed in sales data till April, 2015 over the previous year). There were also four outliers in the entire dataset. After investigation it was determined that these values were either due to unavailability (shortage) of the product or due to flooding of the product in the market in the subsequent period. These values were corrected for by taking average of the shortage + flooding sales values. Preliminary Analysis of the Dataset: The plots were visualized using Tableau and the analysis are summarized as below: COMPONENTS TREND SEASONALITY LEVEL MAGGI NO NO CERELAC Slightly downward linear trend NO EVERYDAY WHITENER Downward Linear trend NO ECLAIRS Linear NO NESCAFE COFFEE NO YES(Quarterly & Monthly) MUNCH Polynomial of degree two. NO
5 Methods Employed: Other than naïve prediction, which we used as a benchmark to compare other method s performance, we deployed different methods based on individual time-series components observed. For all methods the forecasting horizon used was three months for monthly data and 1 quarter for quarterly data. The methods used have been summarized below: 1). Moving Averages: Wherever we did not observe any seasonality or trend in the dataset we used this method. The method uses trailing moving averages method to forecast. Values of intervals tried were 2, 4, 8 for quarterly data and 2, 4, 8, 12 for monthly data. 2). Exponential Smoothing: Again whenever no trend or seasonality was observed we applied this method. The default Alpha (0.2) and optimized Alpha values were tried. The optimized model performed worse for all different products. 3). Double Exponential Smoothing/Holt s Method: If a time series had trend but no seasonality, this method was applied. The default Alpha (0.2) & Beta (0.15) and optimized Alpha & Beta values were tried. In one case the optimized model performed better but on checking the RMSE values there was a hint of overfitting, so it was ignored. 4). Holt-Winters Method: If a time series had both seasonality and trend we employed this method. The default Alpha (0.2), Beta (0.15), Gamma (0.05) and optimized values of these were also tried. The optimized model performed worse. 5). Multi Linear Regression (MLR): This method was applied to all product datasets. If the trend observed was linear the t variable was used to capture trend. If the trend was polynomial another variable t 2 was used for capturing trend. To capture seasonality, if present, we used a dummy variable based on seasonality. For example, if there was a monthly seasonality, 12 dummy variables were used. 6). MLR + AR: This method was used whenever, the residuals for training set in MLR output had autocorrelation. Depending on the dataset and autocorrelation observed AR (1) and AR (2) was used in pairing with MLR. 7). Neural Networks: This method involves using a input layer, a few hidden layers and an output layer connected to each other through different functions and weights. For our estimations we used 1 hidden layer and tried different node values like 4, 6, 12, 25. The best output amongst these were obtained when node values in hidden layer were 25.
6 Performance Measure: We have used MAPE (Mean Absolute Percentage Error) as our performance measure as it can be compared over different models even if the two models have different actual values. RMSE for the same MAPE is higher for data with higher actual values. MAPE is free of scale effects of actual value. Thus, it provides us the benefit of being able to compare quarterly data forecasts against monthly data forecasts. Benchmark: For all the six products we used naïve prediction as our benchmark to compare different models and hence the best fit. The predictive performance on training, validation set and forecast for Naïve as compared to a few of the models is shown in the appendix in Exhibit 2 charts.


7 APPENDIX: Exhibit 1: PREDICTIVE ACCURACY - QUARTERLY V/S MONTHLY: Exhibit 2: FORECASTED DATA ALONG WITH CHARTS: Month on month Forecasts Quarterly Forecast


8
9 ACF Exhibit 3: ACF plots (Wherever applicable) NESCAFE ACF ACF Plot for Residuals Lags ACF UCI LCI ECLAIRS ACF CERELAC ACF MAGGI ACF EVERYDAY ACF MUNCH ACF
Sales Forecast for Rossmann Stores SUBMITTED BY: GROUP A-8
 Sales Forecast for Rossmann Stores SUBMITTED BY: GROUP A-8 Executive Summary: a. Problem description: Business Problem: Rossman is Germany s second largest drug store chain with more than 1000 stores across
Forecasting fruit demand: Intelligent Procurement
 2012 Forecasting fruit demand: Intelligent Procurement FCAS Final Project Report Predict fruit sales for a 2 day horizon to efficiently manage procurement logistics. Dinesh Ganti(61310071) Rachna Lalwani(61310845),
ASSIGNMENT SUBMISSION FORM
 Course Name: Assignment Title: Submitted by: ASSIGNMENT SUBMISSION FORM Treat this as the first page of your assignment FCAS Group Member Name Sanchit Garg 61310634 Ankur Pandey 61310573 Mohammad Shahid
Forecasting Daily Number of User Problem Reports of Junyi Academy for Efficient Staff Allocation
 Forecasting Daily Number of User Problem Reports of Junyi Academy for Efficient Staff Allocation Group 7 104078515 Chiali 104078509 Sherry 105078514 Elisa 105078502 Emily 2017.1.3 Background Junyi Academy
Forecasting product demand for a retail chain to reduce cost of understocking and overstocking Group B5
 Forecasting product demand for a retail chain to reduce cost of understocking and overstocking Group B5 Konpal Agrawal 61910895 Prakash Sarangi 61910902 Rahul Anand 61910361 Raj Mukul Dave 61910269 Ramchander
Silky Silk & Cottony Cotton Corp
 Silky Silk & Cottony Cotton Corp Business Optimization Exercise 2/9/2012 Data_Miners_Anonymous Naveen Kumar 61210144 Akshay Sethi 61210413 Karthik Vemparala 61210505 Sruthi Yalaka 61210416 Contents Executive
Business Analytics Using Forecasting (Fall 2016) Final Report
 Final Report") Business Analytics Using Forecasting (Fall 2016) Final Report Cultivating talents for actual needs : Forecasting numbers of patients as reference for medical profession enrollment Team 3 Yu-Chu Shih Tzu-Han
Business Analytics Using Forecasting (Fall 2016) Final Report Cultivating talents for actual needs : Forecasting numbers of patients as reference for medical profession enrollment Team 3 Yu-Chu Shih Tzu-Han
Forecasting the revenue generated by ATM / CARD / CASH for EZTABLE to identify the potential / actual revenue from different payment systems.
 Forecasting the revenue generated by ATM / CARD / CASH for EZTABLE to identify the potential / actual revenue from different payment systems. Team #6 Member Sean, Xie 103078517 Sam, Wang 103078502 Lydia,
Predicting Average Basket Value
 Predicting Basket Value Business Analytics Using Data Mining Group 9A Aashish Sharma: 61310403 Abhishek Agrawal: 61310548 Saurabh Malhotra: 61310161 Madhav Pathak: 61310330 Madhur Chadha: 61310185 Table
Forecasting Intermittent Demand Patterns with Time Series and Machine Learning Methodologies
 Forecasting Intermittent Demand Patterns with Time Series and Machine Learning Methodologies Yuwen Hong, Jingda Zhou, Matthew A. Lanham Purdue University, Department of Management, 403 W. State Street,
Electric Forward Market Report
 Mar-01 Mar-02 Jun-02 Sep-02 Dec-02 Mar-03 Jun-03 Sep-03 Dec-03 Mar-04 Jun-04 Sep-04 Dec-04 Mar-05 May-05 Aug-05 Nov-05 Feb-06 Jun-06 Sep-06 Dec-06 Mar-07 Jun-07 Sep-07 Dec-07 Apr-08 Jun-08 Sep-08 Dec-08
Variable Selection Of Exogenous Leading Indicators In Demand Forecasting
 Variable Selection Of Exogenous Leading Indicators In Demand Forecasting Yves R. Sagaert, El-Houssaine Aghezzaf, Nikolaos Kourentzes, Bram Desmet Department of Industrial Management, Ghent University 24/06/2015
Managers require good forecasts of future events. Business Analysts may choose from a wide range of forecasting techniques to support decision making.
 Managers require good forecasts of future events. Business Analysts may choose from a wide range of forecasting techniques to support decision making. Three major categories of forecasting approaches:
Decision 411: Class 12
 Decision 411: Class 12 Automatic forecasting software Political & ethical issues in forecasting Automatic forecasting software Most major statistical & database packages include wizards for automatic forecasting:
COORDINATING DEMAND FORECASTING AND OPERATIONAL DECISION-MAKING WITH ASYMMETRIC COSTS: THE TREND CASE
 COORDINATING DEMAND FORECASTING AND OPERATIONAL DECISION-MAKING WITH ASYMMETRIC COSTS: THE TREND CASE ABSTRACT Robert M. Saltzman, San Francisco State University This article presents two methods for coordinating
Choosing the Right Type of Forecasting Model: Introduction Statistics, Econometrics, and Forecasting Concept of Forecast Accuracy: Compared to What?
 Choosing the Right Type of Forecasting Model: Statistics, Econometrics, and Forecasting Concept of Forecast Accuracy: Compared to What? Structural Shifts in Parameters Model Misspecification Missing, Smoothed,
Linking Forecasting with Operations and Finance. Bill Tonetti November 15, 2017 IIF Foresight Practitioner Conference
 Linking Forecasting with Operations and Finance Bill Tonetti November 15, 2017 IIF Foresight Practitioner Conference About the Speaker Bill Tonetti Founding Member, Foresight Practitioner Advisory Board
Demand Forecasting for Materials to Improve Production Capability Planning in BASF
 Demand Forecasting for Materials to Improve Production Capability Planning in BASF Team 6 Raden Agoeng Bhimasta, Dana Tai, Daniel Viet-Cuong Trieu, Will Kuan National Tsing-Hua University About BASF BASF
A Comparative Study of Different Statistical Techniques Applied to Predict Share Value of State Bank of India (SBI)
") A Comparative Study of Different Statistical Techniques Applied to Predict Share Value of State Bank of India (SBI) Hota H.S., Sahu Pushpanjali Abstract. Prediction of share value is one of the critical
A Comparative Study of Different Statistical Techniques Applied to Predict Share Value of State Bank of India (SBI) Hota H.S., Sahu Pushpanjali Abstract. Prediction of share value is one of the critical
In-depth Analytics of Pricing Discovery
 In-depth Analytics of Pricing Discovery Donald Davidoff, D2 Demand Solutions Annie Laurie McCulloh, Rainmaker LRO Rich Hughes, RealPage Agenda 1. Forecasting Forecasting Model Options Principles of Forecasting
Machine Learning Models for Sales Time Series Forecasting
 Article Machine Learning Models for Sales Time Series Forecasting Bohdan M. Pavlyshenko SoftServe, Inc., Ivan Franko National University of Lviv * Correspondence: bpavl@softserveinc.com, b.pavlyshenko@gmail.com
INTRODUCTION BACKGROUND. Paper
 Paper 354-2008 Small Improvements Causing Substantial Savings - Forecasting Intermittent Demand Data Using SAS Forecast Server Michael Leonard, Bruce Elsheimer, Meredith John, Udo Sglavo SAS Institute
Improved demand forecasts at the last mile can save millions of dollars. Using big data and advanced analytics to drive supply chain efficiency
 Improved demand forecasts at the last mile can save millions of dollars Using big data and advanced analytics to drive supply chain efficiency November, 2017 3 Over the years, the focus of health supply
Forecasting Seasonal Footwear Demand Using Machine Learning. By Majd Kharfan & Vicky Chan, SCM 2018 Advisor: Tugba Efendigil
 Forecasting Seasonal Footwear Demand Using Machine Learning By Majd Kharfan & Vicky Chan, SCM 2018 Advisor: Tugba Efendigil 1 Agenda Ø Ø Ø Ø Ø Ø Ø The State Of Fashion Industry Research Objectives AI In
IBM SPSS Forecasting 19
 IBM SPSS Forecasting 19 Note: Before using this information and the product it supports, read the general information under Notices on p. 108. This document contains proprietary information of SPSS Inc,
Forecasting models for short and long term gas price
 Forecasting models for short and long term gas price A Data Science point of view 2nd AIEE Energy Symposium, Rome, Italy November 3, 2017 Introduction Macroeconomic, Energy Analysis and Forecasting (MEAF)
Forecasting Software
 Appendix B Forecasting Software B1 APPENDIX B Forecasting Software Good forecasting software is essential for both forecasting practitioners and students. The history of forecasting is to a certain extent
FOR RELEASE: 10:00 A.M. AEDT, WEDNESDAY, DECEMBER 24, 2014
 FOR RELEASE: 10:00 A.M. AEDT, WEDNESDAY, DECEMBER 24, 2014 The Conference Board Australia Business Cycle Indicators SM THE CONFERENCE BOARD LEADING ECONOMIC INDEX (LEI) FOR AUSTRALIA AND RELATED COMPOSITE
Forecasting Australian GDP Growth: A Mixed-Frequency Approach
 Forecasting Australian GDP Growth: A Mixed-Frequency Approach - Australian Conference of Economists - Mark Phoon (KPMG Economics) July 19-21, 2017 1 2 3 4 Paper explores whether forecasts of Australian
DEPARTMENT OF QUANTITATIVE METHODS & INFORMATION SYSTEMS
 DEPARTMENT OF QUANTITATIVE METHODS & INFORMATION SYSTEMS Time Series and Their Components QMIS 320 Chapter 5 Fall 2010 Dr. Mohammad Zainal 2 Time series are often recorded at fixed time intervals. For
Predicting Customer Purchase to Improve Bank Marketing Effectiveness
 Business Analytics Using Data Mining (2017 Fall).Fianl Report Predicting Customer Purchase to Improve Bank Marketing Effectiveness Group 6 Sandy Wu Andy Hsu Wei-Zhu Chen Samantha Chien Instructor:Galit
Predictive Analytics
 Predictive Analytics Mani Janakiram, PhD Director, Supply Chain Intelligence & Analytics, Intel Corp. Adjunct Professor of Supply Chain, ASU October 2017 "Prediction is very difficult, especially if it's
DEMAND FORECASTING FOR FERTILIZERS A TACTICAL PLANNING FRAMEWORK FOR INDUSTRIAL USE
 Demand Forecasting for Fertilizers A Tactical Planning Framework for Industrial Use Proceedings of AIPA 2012, INDIA 123 DEMAND FORECASTING FOR FERTILIZERS A TACTICAL PLANNING FRAMEWORK FOR INDUSTRIAL USE
In Chapter 3, we discussed the two broad classes of quantitative. Quantitative Forecasting Methods Using Time Series Data CHAPTER 5
 CHAPTER 5 Quantitative Forecasting Methods Using Time Series Data In Chapter 3, we discussed the two broad classes of quantitative methods, time series methods and causal methods. Time series methods are
The next release is scheduled for Thursday, December 8, 2011 at 10:00 A.M. (KST) In the U.S Wednesday, December 7, 2011 at 8:00 P.
 In the U.S Wednesday, December 7, 2011 at 8:00 P.") FOR RELEASE: 10:00 A.M. KST, THURSDAY, NOVEMBER 10, 2011 The Conference Board Korea Business Cycle Indicators SM THE CONFERENCE BOARD LEADING ECONOMIC INDEX (LEI) FOR KOREA AND RELATED COMPOSITE ECONOMIC
FOR RELEASE: 10:00 A.M. KST, THURSDAY, NOVEMBER 10, 2011 The Conference Board Korea Business Cycle Indicators SM THE CONFERENCE BOARD LEADING ECONOMIC INDEX (LEI) FOR KOREA AND RELATED COMPOSITE ECONOMIC
THE ROLE OF NESTED DATA ON GDP FORECASTING ACCURACY USING FACTOR MODELS *
 Andrejs Bessonovs University of Latvia, Latvia THE ROLE OF NESTED DATA ON GDP FORECASTING ACCURACY USING FACTOR MODELS * Abstract The paper studies an impact of nested macroeconomic data on Latvian GDP
Incorporating macro-economic leading indicators in inventory management
 ISIR 16 Presentation: Leading Indicators to Management Incorporating macro-economic leading indicators in inventory management Yves R. Sagaert, Stijn De Vuyst, Nikolaos Kourentzes, El-Houssaine Aghezzaf,
Preface to the third edition Preface to the first edition Acknowledgments
 Contents Foreword Preface to the third edition Preface to the first edition Acknowledgments Part I PRELIMINARIES XXI XXIII XXVII XXIX CHAPTER 1 Introduction 3 1.1 What Is Business Analytics?................
HKU announces 2016 Q3 HK Macroeconomic Forecast
 HKU announces 2016 Q3 HK Macroeconomic Forecast July 7, 2016 The of the Hong Kong Institute of Economics and Business Strategy at the University of Hong Kong (HKU) released its quarterly Hong Kong Macroeconomic
Getting the best out of forecasting software
 Getting the best out of forecasting software Robert Fildes Professor, Department of Management Science Centre for Marketing Analytics and Forecasting Nikolaos Kourentzes Professor, Department of Management
Planning and Sourcing
 Planning and Sourcing Sales Forecast Accuracy A Lot of Talk, but Is There Enough Action? Facilitated by Matt Wilkerson and Colin Maxwell September 9-10, 2008 New Orleans, LA Session Content Analysis of
Review of PG&E Home Energy Reports Initiative Evaluation. CPUC Energy Division Prepared by DNV KEMA, Inc
 Review of PG&E Home Energy Reports Initiative Evaluation CPUC Energy Division Prepared by DNV KEMA, Inc. 5-31-2013 Table of Contents DNV KEMA Energy & Sustainability 1. Introduction... 1-1 2. Background...
Getting the best out of forecasting software
 Getting the best out of forecasting software Robert Fildes Professor, Department of Management Science Centre for Marketing Analytics and Forecasting Nikolaos Kourentzes Professor, Department of Management
The next release is scheduled for Friday, August 15, 2014 at 10:00 A.M. (KST) In the U.S Thursday, August 14, 2014 at 9:00 P.M.
 In the U.S Thursday, August 14, 2014 at 9:00 P.M.") FOR RELEASE: 10:00 A.M. KST, FRIDAY, JULY 11, 2014 The Conference Board Korea Business Cycle Indicators SM THE CONFERENCE BOARD LEADING ECONOMIC INDEX (LEI) FOR KOREA AND RELATED COMPOSITE ECONOMIC INDEXES
FOR RELEASE: 10:00 A.M. KST, FRIDAY, JULY 11, 2014 The Conference Board Korea Business Cycle Indicators SM THE CONFERENCE BOARD LEADING ECONOMIC INDEX (LEI) FOR KOREA AND RELATED COMPOSITE ECONOMIC INDEXES
FOR RELEASE: 10:00 A.M. AEDT, WEDNESDAY, NOVEMBER 18, 2015
 FOR RELEASE: 10:00 A.M. AEDT, WEDNESDAY, NOVEMBER 18, 2015 The Conference Board Australia Business Cycle Indicators SM THE CONFERENCE BOARD LEADING ECONOMIC INDEX (LEI) FOR AUSTRALIA AND RELATED COMPOSITE
Big Data, Smart Energy, and Predictive Analytics. Dr. Rosaria Silipo Phil Winters
 Big Data, Smart Energy, and Predictive Analytics Dr. Rosaria Silipo Phil Winters Hot Topics Telemetry Data Time Series Analysis SENSIBLE usages of Big Data Measurable / Applied to the Business Use public
FORECASTING ANALYSIS OF CONSUMER GOODS DEMAND USING NEURAL NETWORKS AND ARIMA
 International Journal of Technology (2015) 5: 872-880 ISSN 2086-9614 IJTech 2015 FORECASTING ANALYSIS OF CONSUMER GOODS DEMAND USING NEURAL NETWORKS AND ARIMA Arian Dhini 1*, Isti Surjandari 1, Muhammad
Forecasting Survey. How far into the future do you typically project when trying to forecast the health of your industry? less than 4 months 3%
 Forecasting Forecasting Survey How far into the future do you typically project when trying to forecast the health of your industry? less than 4 months 3% 4-6 months 12% 7-12 months 28% > 12 months 57%
I N S I G H T S I N T O I N D I G O S J O U R N E Y & K E Y S A P F & R C A PA B I L I T I E S J U LY 6,
 I N S I G H T S I N T O I N D I G O S J O U R N E Y & K E Y S A P F & R C A PA B I L I T I E S J U LY 6, 2 0 1 6 Indigo 1 Indigo $850+ M Revenue Last Fiscal Year Print General Merchandise Toys Trade Books
Econometric Forecasting in a Lost Profits Case
 Econometric Forecasting in a Lost Profits Case I read with interest the recent article by A. Frank Adams, III, Ph.D., in the May /June 2008 issue of The Value Examiner1. I applaud Dr. Adams for his attempt
Improving forecast quality in practice
 Improving forecast quality in practice Robert Fildes (Lancaster Centre for Forecasting) Fotios Petropoulos (Cardiff Business School) Panel Discussion Agenda The Forecasting Process Dimensions of quality
How to Analyze and Improve the Accuracy of Veterinary Inventory Demand Forecasting
 How to Analyze and Improve the Accuracy of Veterinary Inventory Demand Forecasting Jorge L. Colón, DVM, MBA Author s address: Jorge L. Colón, DVM, PLLC, PO Box 11631, Lexington, KY 40576; email: jorgecolondvm@me.com.
Choosing Smoothing Parameters For Exponential Smoothing: Minimizing Sums Of Squared Versus Sums Of Absolute Errors
 Journal of Modern Applied Statistical Methods Volume 5 Issue 1 Article 11 5-1-2006 Choosing Smoothing Parameters For Exponential Smoothing: Minimizing Sums Of Squared Versus Sums Of Absolute Errors Terry
Targeting, valuing, segmenting and loyalty techniques
 MIKEGRIGSBY ADVANCED CUSTOMER ANALYTICS Targeting, valuing, segmenting and loyalty techniques MARKETING SCIENCE SERIES A KoganPage CONTENTS 01 Overview 1 What is retail? 1 What is analytics? 2 Who is this
Modeling of electricity consumption in one of the world s most populous cities Jakarta, Indonesia
 Modeling of electricity consumption in one of the world s most populous cities Jakarta, Indonesia Angreine Kewo Supervisors: Per Sieverts Nielsen, Xiufeng Liu 1 Agenda About my PhD project The 1st paper
Vipul Mehra December 22, 2017
 Forecasting USD to INR foreign exchange rate using Time Series Analysis techniques like HoltWinters Simple Exponential Smoothing, ARIMA and Neural Networks Vipul Mehra December 22, 2017 Abstract Forecasting
Wind Update. Renewable Energy Integration Lessons Learned. March 28, 2012
 Wind Update Renewable Energy Integration Lessons Learned March 28, 212 Contents Summary Review of Historical Wind Growth and Output Impact of Wind on Operations Wind Curtailments Dispatchable Intermittent
Leveraging Smart Meter Data & Expanding Services BY ELLEN FRANCONI, PH.D., BEMP, MEMBER ASHRAE; DAVID JUMP, PH.D., P.E.
 ASHRAE www.ashrae.org. Used with permission from ASHRAE Journal. This article may not be copied nor distributed in either paper or digital form without ASHRAE s permission. For more information about ASHRAE,
Forecasting & Replenishment with IBM DIOS. Dynamic Inventory Optimization Solution
 Forecasting & Replenishment with IBM DIOS Dynamic Inventory Optimization Solution Retail Business is getting Bigger, Faster, Better... My Business is Growing: More Products More Stores Higher Sales My
ERCOT in 2018: Challenges & Opportunities
 ERCOT in 2018: Challenges & Opportunities Bill Magness President & CEO ERCOT Texas-Germany Bilateral Dialogue on Challenges and Opportunities in the Electricity Market February 27, 2108 What is ERCOT?
Sample Report Market Sensitivity 30 Year, Fixed, Conforming Mortgages
 Sample Report Market Sensitivity 30 Year, Fixed, Conforming Mortgages DATA is for informational purposes and is not specific to any bank 2010 Heitman Analytics 1 Executive Summary Determine the relationship
Aggregate Planning and S&OP
 Aggregate Planning and S&OP 13 OUTLINE Global Company Profile: Frito-Lay The Planning Process Sales and Operations Planning The Nature of Aggregate Planning Aggregate Planning Strategies 1 OUTLINE - CONTINUED
SAP APO DP (Demand Planning) Sample training content and overview.. All rights reserved Copyright 2005 TeknOkret Services. All Rights Reserved.
 Sample training content and overview.. All rights reserved Copyright 2005 TeknOkret Services. All Rights Reserved.") SAP APO DP (Demand Planning) Sample training content and overview Sample course content Demand Planning Concepts Importance of Demand Planning SAP APO Demand Planning terminology APO Data structure: Source
SAP APO DP (Demand Planning) Sample training content and overview Sample course content Demand Planning Concepts Importance of Demand Planning SAP APO Demand Planning terminology APO Data structure: Source
Forecasting for Short-Lived Products
 HP Strategic Planning and Modeling Group Forecasting for Short-Lived Products Jim Burruss Dorothea Kuettner Hewlett-Packard, Inc. July, 22 Revision 2 About the Authors Jim Burruss is a Process Technology
FOR RELEASE: 10:00 A.M. AEDT, TUESDAY, NOVEMBER 18, 2014
 FOR RELEASE: 10:00 A.M. AEDT, TUESDAY, NOVEMBER 18, 2014 The Conference Board Australia Business Cycle Indicators SM THE CONFERENCE BOARD LEADING ECONOMIC INDEX (LEI) FOR AUSTRALIA AND RELATED COMPOSITE
THE CONFERENCE BOARD LEADING ECONOMIC INDEX (LEI) FOR THE EURO AREA AND RELATED COMPOSITE ECONOMIC INDEXES FOR APRIL
 FOR THE EURO AREA AND RELATED COMPOSITE ECONOMIC INDEXES FOR APRIL") FOR RELEASE: 9:30 A.M. (ET), THURSDAY, MAY 28, 2015 The Conference Board Euro Area Business Cycle Indicators SM THE CONFERENCE BOARD LEADING ECONOMIC INDEX (LEI) FOR THE EURO AREA AND RELATED COMPOSITE
FOR RELEASE: 9:30 A.M. (ET), THURSDAY, MAY 28, 2015 The Conference Board Euro Area Business Cycle Indicators SM THE CONFERENCE BOARD LEADING ECONOMIC INDEX (LEI) FOR THE EURO AREA AND RELATED COMPOSITE
Improving the Usability of Demand Planning Solutions SAP APO
 Improving the Usability of Demand Planning Solutions SAP APO April 25, 2014 Mark Chockalingam Demand Planning LLC 2014 Demand Planning LLC 1 Outline About Demand Planning LLC Demand Planning LLC Client
FOR RELEASE: 10:00 A.M. AEST, WEDNESDAY, SEPTEMBER 23, 2015
 FOR RELEASE: 10:00 A.M. AEST, WEDNESDAY, SEPTEMBER 23, 2015 The Conference Board Australia Business Cycle Indicators SM THE CONFERENCE BOARD LEADING ECONOMIC INDEX (LEI) FOR AUSTRALIA AND RELATED COMPOSITE
A Parametric Bootstrapping Approach to Forecast Intermittent Demand
 Proceedings of the 2008 Industrial Engineering Research Conference J. Fowler and S. Mason, eds. A Parametric Bootstrapping Approach to Forecast Intermittent Demand Vijith Varghese, Manuel Rossetti Department
FOR RELEASE: 10:00 A.M. (MADRID TIME), WEDNESDAY, APRIL 16, 2014
, WEDNESDAY, APRIL 16, 2014") FOR RELEASE: 10:00 A.M. (MADRID TIME), WEDNESDAY, APRIL 16, 2014 The Conference Board Spain Business Cycle Indicators SM THE CONFERENCE BOARD LEADING ECONOMIC INDEX (LEI) FOR SPAIN AND RELATED COMPOSITE
FOR RELEASE: 10:00 A.M. (MADRID TIME), WEDNESDAY, APRIL 16, 2014 The Conference Board Spain Business Cycle Indicators SM THE CONFERENCE BOARD LEADING ECONOMIC INDEX (LEI) FOR SPAIN AND RELATED COMPOSITE
APPLICATION OF TIME-SERIES DEMAND FORECASTING MODELS WITH SEASONALITY AND TREND COMPONENTS FOR INDUSTRIAL PRODUCTS
 International Journal of Mechanical Engineering and Technology (IJMET) Volume 8, Issue 7, July 2017, pp. 1599 1606, Article ID: IJMET_08_07_176 Available online at http://www.iaeme.com/ijmet/issues.asp?jtype=ijmet&vtype=8&itype=7
2 CDM Adjustment for the Load Forecast for Distributors 2 1 Accuracy of the Load Forecast and Variance Analysis 3 1 Distribution and Other Revenue
 Page of Exhibit Tab Schedule Appendix Contents Operating Revenue Load and Revenue Forecasts Multivariate Regression Model CDM Adjustment for the Load Forecast for Distributors Accuracy of the Load Forecast
FOR RELEASE: 10:00 A.M. AEDT, TUESDAY, MARCH 24, 2015
 FOR RELEASE: 10:00 A.M. AEDT, TUESDAY, MARCH 24, 2015 The Conference Board Australia Business Cycle Indicators SM THE CONFERENCE BOARD LEADING ECONOMIC INDEX (LEI) FOR AUSTRALIA AND RELATED COMPOSITE ECONOMIC
What will be the Impact on the US Domestic Heating Pellet Sector of a Positive Oil Shock?
 What will be the Impact on the US Domestic Heating Pellet Sector of a Positive Oil Shock? By William Strauss, PhD, President, FutureMetrics October 26, Crude oil prices have dropped rapidly in recent months.
Next-generation forecasting is closer than you might think
 White Paper Powerfully Simple Next-generation forecasting is closer than you might think Surrounded by an explosion of data, most forecasting systems can t leverage it. Here s how you can. Joseph Shamir
The next release is scheduled for Wednesday, August 14, 2013 at 10:00 A.M. (JST) In the U.S Tuesday, August 13, 2013 at 9:00 P.
 In the U.S Tuesday, August 13, 2013 at 9:00 P.") FOR RELEASE: 10:00 A.M. JST, WEDNESDAY, JULY 10, 2013 The Conference Board Japan Business Cycle Indicators SM THE CONFERENCE BOARD LEADING ECONOMIC INDEX (LEI) FOR JAPAN AND RELATED COMPOSITE ECONOMIC
FOR RELEASE: 10:00 A.M. JST, WEDNESDAY, JULY 10, 2013 The Conference Board Japan Business Cycle Indicators SM THE CONFERENCE BOARD LEADING ECONOMIC INDEX (LEI) FOR JAPAN AND RELATED COMPOSITE ECONOMIC
Aggregate Planning (session 1,2)
") Aggregate Planning (session 1,2) 1 Outline The Planning Process The Nature of Aggregate Planning Aggregate Planning Strategies Capacity Options Demand Options Mixing Options to Develop a Plan Methods for
Aggregate Planning (session 1,2) 1 Outline The Planning Process The Nature of Aggregate Planning Aggregate Planning Strategies Capacity Options Demand Options Mixing Options to Develop a Plan Methods for
FOLLOW-UP NOTE ON MARKET STATE MODELS
 FOLLOW-UP NOTE ON MARKET STATE MODELS In an earlier note I outlined some of the available techniques used for modeling market states. The following is an illustration of how these techniques can be applied
Economic sentiment indicators
 January The economic sentiment indicator continues to improve Sentiment in industry the main driver: encouraging order books, ongoing destocking Unemployment fears fading UK services confidence jumps up
Forecasting Tax Revenue at the U.S. Department of the Treasury with FocalPoint TaxInsight. Leading the way in tax analytics
 Forecasting Tax Revenue at the U.S. Department of the Treasury with FocalPoint TaxInsight Leading the way in tax analytics Accurate forecasting of tax revenues can help Federal and State Government Agencies
A NEW COINCIDENT INDICATOR FOR THE PORTUGUESE PRIVATE CONSUMPTION*
 A NEW COINCIDENT INDICATOR FOR THE PORTUGUESE PRIVATE CONSUMPTION* António Rua** 1. INTRODUCTION As it is well known, private consumption plays a major role in overall economic activity (1). Therefore,
Zehai Zhou Department of FEMIS, University of Houston-Downtown One Main Street, Houston, TX 77002, USA
 Analysis of U.S. E-Commerce Sales Using Winters Method Zehai Zhou Department of FEMIS, University of Houston-Downtown One Main Street, Houston, TX 77002, USA Abstract More than three billion people around
The next release is scheduled for September 20, 2018, Thursday at 10 A.M. ET. FOR RELEASE: 10:00 A.M. ET, Friday, August 17, 2018
 FOR RELEASE: 10:00 A.M. ET, Friday, August 17, 2018 The Conference Board U.S. Business Cycle Indicators SM THE CONFERENCE BOARD LEADING ECONOMIC INDEX (LEI) FOR THE UNITED STATES AND RELATED COMPOSITE
Flash Estimates for Short Term Indicators - Data cleaning with X12 Arima
 Markus Froehlich, Alexander Kowarik Statistics Austria Work Session on Statistical Data Editing Budapest, 14-16 September 2015 Flash Estimates for Short Term Indicators - Data cleaning with X12 Arima Froehlich,
XGBOOST AS A TIME-SERIES FORECASTING TOOL
 XGBOOST AS A TIME-SERIES FORECASTING TOOL Filip Wójcik Objectivity Digital Transformation Specialists PhD Student on a Wroclaw University of Economics filip.wojcik@outlook.com Agenda 01 02 03 What is XGboost
Correlation and Instance Based Feature Selection for Electricity Load Forecasting
 Correlation and Instance Based Feature Selection for Electricity Load Forecasting Irena Koprinska a, Mashud Rana a, Vassilios G. Agelidis b a School of Information Technologies, University of Sydney, Sydney,
The next release is scheduled for Wednesday, December 11, 2013 at 10:00 A.M. (JST) In the U.S Tuesday, December 10, 2013 at 8:00 P.
 In the U.S Tuesday, December 10, 2013 at 8:00 P.") FOR RELEASE: 10:00 A.M. JST, THURSDAY, NOVEMBER 14, 2013 The Conference Board Japan Business Cycle Indicators SM THE CONFERENCE BOARD LEADING ECONOMIC INDEX (LEI) FOR JAPAN AND RELATED COMPOSITE ECONOMIC
FOR RELEASE: 10:00 A.M. JST, THURSDAY, NOVEMBER 14, 2013 The Conference Board Japan Business Cycle Indicators SM THE CONFERENCE BOARD LEADING ECONOMIC INDEX (LEI) FOR JAPAN AND RELATED COMPOSITE ECONOMIC
An evaluation of simple forecasting model selection rules
 MPRA Munich Personal RePEc Archive An evaluation of simple forecasting model selection rules Robert Fildes and Fotios Petropoulos Lancaster University Management School April 2013 Online at http://mpra.ub.uni-muenchen.de/51772/
The next release is scheduled for Wednesday, June 12, 2013 at 10:00 A.M. (JST) In the U.S Tuesday, June 11, 2013 at 9:00 P.M (ET)
 In the U.S Tuesday, June 11, 2013 at 9:00 P.M (ET)") FOR RELEASE: 10:00 A.M. JST, FRIDAY, MAY 10, 2013 The Conference Board Japan Business Cycle Indicators SM THE CONFERENCE BOARD LEADING ECONOMIC INDEX (LEI) FOR JAPAN AND RELATED COMPOSITE ECONOMIC INDEXES
FOR RELEASE: 10:00 A.M. JST, FRIDAY, MAY 10, 2013 The Conference Board Japan Business Cycle Indicators SM THE CONFERENCE BOARD LEADING ECONOMIC INDEX (LEI) FOR JAPAN AND RELATED COMPOSITE ECONOMIC INDEXES
EnterpriseOne JDE5 Forecasting PeopleBook
 EnterpriseOne JDE5 Forecasting PeopleBook May 2002 EnterpriseOne JDE5 Forecasting PeopleBook SKU JDE5EFC0502 Copyright 2003 PeopleSoft, Inc. All rights reserved. All material contained in this documentation
Principles of Operations Management: Concepts and Applications Topic Outline Principles of Operations Planning (POP)
") Principles of Operations Management: Concepts and Applications Topic Outline Principles of Operations Planning (POP) Session 1: Operation Management Foundations Describe how today s business trends are
Principles of Operations Management: Concepts and Applications Topic Outline Principles of Operations Planning (POP) Session 1: Operation Management Foundations Describe how today s business trends are
Trend-Cycle Forecasting with Turning Points
 7 Trend-Cycle Forecasting with Turning Points The only function of economic forecasting is to make astrology look respectable. EZRA SOLOMON (1920 2002), although often attributed to JOHN KENNETH GALBRAITH
IBP Special Topic Webinar Statistical Forecasting
 IBP Special Topic Webinar Statistical Forecasting Customer Tod Stenger and Anna Linden February 17, 2016 Agenda Forecasting Processes What can IBP do? Demonstration What is in each IBP module Wrap-up 2016
MODELING OF EXPORTS IN ALBANIA
 MODELING OF EXPORTS IN ALBANIA Prof. Assoc. Dr. Alma Braimllari (Spaho) Applied Mathematics Department, Faculty of Natural Sciences, University of Tirana, (Albania) ABSTRACT Exports of goods represent
LECTURE 8: MANAGING DEMAND
 LECTURE 8: MANAGING DEMAND AND SUPPLY IN A SUPPLY CHAIN INSE 6300: Quality Assurance in Supply Chain Management 1 RESPONDING TO PREDICTABLE VARIABILITY 1. Managing Supply Process of managing production
HKU announces 2018 Q1 HK Macroeconomic Forecast 1
 Q Q2 Q3 Q4 2Q 2Q2 2Q3 2Q4 3Q 3Q2 3Q3 3Q4 4Q 4Q2 4Q3 4Q4 5Q 5Q2 5Q3 5Q4 6Q 6Q2 6Q3 6Q4 7Q 7Q2 7Q3 7Q4 8Q year-on-year percentage HKU announces 208 Q HK Macroeconomic Forecast January 0, 208 The of the Hong
Determining the Forecasting Model on Inventory, Planning and Control for the Laser Fastec Lamination Core Production
 Determining the Forecasting Model on Inventory, Planning and Control for the Laser Fastec Lamination Core Production Abdul Talib Bon 1 & Shahrul Azman Ismail 2 Faculty of Technology Management and Business,
Forecasting with Seasonality Version 1.6
 Forecasting with Seasonality Version 1.6 Dr. Ron Tibben-Lembke Sept 3, 2006 Forecasting with seasonality and a trend is obviously more difficult than forecasting for a trend or for seasonality by itself,
New Clustering-based Forecasting Method for Disaggregated End-consumer Electricity Load Using Smart Grid Data
 New Clustering-based Forecasting Method for Disaggregated End-consumer Electricity Load Using Smart Grid Data Peter Laurinec, and Mária Lucká 4..7 Slovak University of Technology in Bratislava Motivation