In-depth Analytics of Pricing Discovery
|
|
|
- Melinda Rich
- 6 years ago
- Views:
Transcription

1 In-depth Analytics of Pricing Discovery Donald Davidoff, D2 Demand Solutions Annie Laurie McCulloh, Rainmaker LRO Rich Hughes, RealPage
2 Agenda 1. Forecasting Forecasting Model Options Principles of Forecasting Forecasting Methods Time Series Models Forecast Accuracy 2. Assessing Amenity Values 3. Procedurally Generated Content 4. Analyzing Performance Methodology Revenue Performance Intangible Benefits


 = 1 out of 6 = 1 6 Both")


3 Results Results Forecast Model Options and Design 1. Forecasting Model Options 2. Principles of Forecasting 3. Forecasting Methods 4. Time Series Models 5. Forecast Accuracy Question: You are handed one die and one quarter. What s the probability of rolling a 6 and getting a heads at the same time? Theoretical Probability: Experimental Probability: Coin: P(heads) Dice: P(6) = 1 head on a 2 sided coin = 1 out of 2 = 1 2 = 1 side out of 6 sides of a die (1,2,3,4,5,6) = 1 out of 6 = 1 6 Both Heads and a 6 together: = P(heads) * P(6) = 1 2 * 1 6 = 1 or 8.3% 12 Identify a trial: One trial consists of flipping a coin once and rolling a die once Conduct 25 trials and record your data in the table below: Trial Coin T T T H T T T T H T T T T Die Head & 6 N N N Y N N N N N N N N N Trial Coin H H H H T H H T T H H H Die Head & 6 N N N N N N N N N N N N Legend: Coin: H = Heads, T = Tails Die: 1,2,3,4,5,6 = number rolled on the die Head & 6: Y : Heads & 6 occurred, N: All other results Results: 1 trial out of 25 resulted in a heads and a 6 = 1/25 Therefore, P(heads,6) = 4%

4 Principles of Forecasting 1. Forecasting Model Options 2. Principles of Forecasting 3. Forecasting Methods 4. Time Series Models 5. Forecast Accuracy Forecasts contain risk and uncertainty - they are rarely perfect Some characteristics of the data used to forecast can improve accuracy Grouping of Data Forecast Accuracy Quantity of Data Forecast Accuracy Recent Data Forecast Accuracy Forecasts should be systematically evaluated over time for accuracy

5 Principle of Aggregating Data 1. Forecasting Model Options 2. Principles of Forecasting 3. Forecasting Methods 4. Time Series Models 5. Forecast Accuracy Since many times we must forecast off of sparse data, what are some of the ways we aggregate data in our revenue management forecasts? - Lease type Conventional New & Renewal, Affordable, Student, etc. - Lead Source ILS Vendor, Craig s List, Property Website, Outdoor, etc. - Unit types - Lease terms - Week types - Move-in weeks - Clustered communities - Market Need enough observations/transactions to have predictive capabilities


6 Forecasting Methods 1. Forecasting Model Options 2. Principles of Forecasting 3. Forecasting Methods 4. Time Series Models 5. Forecast Accuracy Qualitative Methods - Educated guesses based on human judgement and opinion - Subjective and nonmathematical Quantitative Methods - Based on mathematics - Consistent and objective - Only as good as the data on which they are based Executive Opinion Market Research Delphi Method Time Series Models Causal Models Associative Models
7 Time Series Model 1. Forecasting Model Options 2. Principles of Forecasting 3. Forecasting Methods 4. Time Series Models 5. Forecast Accuracy Many of the forecasts used in revenue management leverage time series models Time series models use historical data as the basis for estimating future outcomes - Moving average - Weighted moving average - Kalman filtering - Exponential smoothing - Autoregressive moving average (ARMA) - Extrapolation - Linear prediction - Trend estimation - Growth curve - Autoregressive integrated moving average (ARIMA)
8 Time Series Examples 1. Forecasting Model Options 2. Principles of Forecasting 3. Forecasting Methods 4. Time Series Models 5. Forecast Accuracy Uniform distribution between 1 and 2 Increasing trend Quadratic growth trend Seasonal Model
9 Time Series Problem - Seasonality 1. Forecasting Model Options 2. Principles of Forecasting 3. Forecasting Methods 4. Time Series Models 5. Forecast Accuracy A community manager must develop forecasts for the next year s quarterly or seasonal leads. The community has collected quarterly lead data for the past two years. She has forecast total leads for next year to be What is the forecast for each quarter or season of next year?
10 Time Series Problem 2-period Moving Average 1. Calculate the average leads per season for each of the past two years 2. Calculate a seasonal index for each season of the year 3. Average the indices by season 4. Calculate the average leads per season for next year by using total forecast leads for the next year divided by the number of seasons 5. Multiply next year s average seasonal leads by each average seasonal index to get forecasted leads per season Quarter Index Index Avg. Index Fall 1900? 1900??? Winter 1400? 1700??? Spring 2300? 2200??? Summer 2400? 2600??? 2016 Total =8000/ =1900/ =1900/ =2250* =( )/2 =8400/ =9000/ Average??? 1. Forecasting Model Options 2. Principles of Forecasting 3. Forecasting Methods 4. Time Series Models 5. Forecast Accuracy

11 Time Series Problem Solution 1. Forecasting Model Options 2. Principles of Forecasting 3. Forecasting Methods 4. Time Series Models 5. Forecast Accuracy Quarter Index Index Avg. Index 2016 Fall Winter Spring Summer Total Average
12 Seasonality Factor How this applies? 1. Forecasting Model Options 2. Principles of Forecasting 3. Forecasting Methods 4. Time Series Models 5. Forecast Accuracy Bedroom Seasonality Factors Week 1X1
13 Measuring Forecasting Accuracy 1. Forecasting Model Options 2. Principles of Forecasting 3. Forecasting Methods 4. Time Series Models 5. Forecast Accuracy Forecasts are never perfect The forecast error is the difference between the actual value and the forecast value for the corresponding period E t = A t - F t where E is the forecast error at period t, A is the actual value at period t, and F is the forecast for period t. Measures of aggregate error: - Mean Absolute Error (MAE) or Mean Absolute Deviation (MAD) - Mean Absolute Percentage Error (MAPE) or Mean Absolute Percentage Deviation (MAPD) - Mean Squared Error (MSE) or Mean Squared Prediction Error (MSPE) - Cumulative Forecast Error (CFE)
14 Forecast Accuracy Problem 1. Forecasting Model Options 2. Principles of Forecasting 3. Forecasting Methods 4. Time Series Models 5. Forecast Accuracy An asset manager is measuring the accuracy of her forecasts using data from the past 5 Thursdays. Forecast Actual Difference Average difference = ( )/5 = -0.2 Is this an accurate forecast?
15 MAE: Mean Absolute Error 1. Forecasting Model Options 2. Principles of Forecasting 3. Forecasting Methods 4. Time Series Models 5. Forecast Accuracy Forecast Actual Difference Absolute Difference MAE 4.2
16 MAPE: Mean Absolute Percent Error 1. Forecasting Model Options 2. Principles of Forecasting 3. Forecasting Methods 4. Time Series Models 5. Forecast Accuracy Forecast Actual Difference Absolute Difference % of Actual % % % % % MAPE 11.1%

17 Key Questions when Measuring Accuracy 1. Forecasting Model Options 2. Principles of Forecasting 3. Forecasting Methods 4. Time Series Models 5. Forecast Accuracy Week Type Unit Category Level of Granularity Lease Term Category Number of Days Out Move-in Week Measure accuracy where the forecast has the best potential for performing well Etc. Measure accuracy with appropriate lead time so that your yielding decisions will have value Too far out: - Decisions mean little - Typically less accurate Too close in: - Decisions made too late
18 Using T-tests to Assess Unit Amenity Values The Problem: how do we know whether our unit amenities are priced too high or too low (or just right)? The Solution: Use Days on Market (DOM) as a proxy for market response and assess how statistically significantly different the average DOM is for leases with versus without the amenity Application: Any individual or bundle of unit-level amenities including renovations


19 Example 1 T-test examines whether 2 samples are different; commonly used with small sample sizes First two parameters are the ranges of the two samples Third parameter is set to 1 for one-tailed distribution and 2 for two-tailed Fourth parameter is set to 1 for paired data, 2 for equal variance and 3 for unequal variance Conclusion: PRICED RIGHT

20 Example 2 BA Minor BA Partial Kitchen Appliance Kitchen Partial BA Full Kitchen Full LseCount AvgDOM No Amenity No Amenity No Amenity No Amenity No Amenity No Amenity No Amenity No Amenity No Amenity 175 No Amenity No Amenity No Amenity 150 No Amenity No Amenity No Amenity No Amenity No Amenity No Amenity No Amenity No Amenity No Amenity No Amenity Grand Total Only 3 bundles can be analyzed BA partial and Kitchen partial (26) BA full and Kitchen full (65) No renovations (12)

21 Example 2 Conclusion: PARTIALS PRICED OK; FULL RENO PRICED TOO HIGH
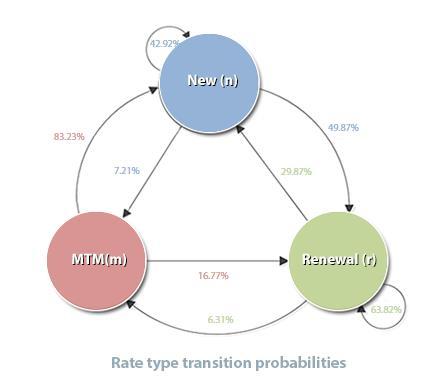
22 0,1,1,2,3,5,8,13,21,34,55

23


24

25


26 Rules Old Data New Data


27
28


29 "the map is not the territory"...no matter how many instances of white swans we may have observed, this does not justify the conclusion that all swans are white.
30 Probability 16% 14% 12% 10% 8% 6% Actual Distribution 4% 2% 0% Sum of 3 Dice Mean = 10.5 Standard deviation = 2.96
31 Average Days vacant Distribution Kolmogorov Smirnov Statistic Chi-Squared Statistic Parameters Dagum k= alpha= beta= Burr k= a= b= Weibull a=1.259 b= Perason alpha1=1.553 alpha2= beta=2091.8
32 Occupancy Distribution Kolmogorov Smirnov Statistic Chi-Squared Statistic Parameters Burr k= alpha=15.96 beta= Weibull alpha= beta= Gumbel Min sigma= mu= Pert m= a= b=100.43
33 Analyzing Performance: Measurement Methodology 1. Methodology 2. Performance Results 3. Intangible Benefits 1. Measure Rental Revenue Account for both rent and occupancy - Method 1 Month End Financials - Method 2 RPU (Revenue per Unit) 2. Incorporate a Benchmark Before and After - Pre vs. Post Revenue Management 3 rd party market data Test vs. Control Data Set 3. Measure over Time Revenue management is a marathon, not a sprint 4. Account for the Intangibles
34 Method 1 - Month End Financials 1. Methodology 2. Performance Results 3. Intangible Benefits July Aug Sept Oct Nov Dec Jan Feb Mar Apr May June Baseline July Aug Sept Market Rent $883,825 $884,575 $884,575 $884,575 $884,575 $884,635 $884,635 $885,850 $885,050 $885,050 $885,075 $878,940 $878,955 $878,980 $878,965 Vacancy Loss ($100,575) ($105,145) ($113,045) ($124,755) ($129,710) ($138,758) ($145,801) ($148,955) ($152,526) ($132,854) ($116,498) ($112,907) ($101,941) ($97,407) ($94,924) Loss to Lease ($16,966) ($15,784) ($14,793) ($13,518) ($12,378) ($11,836) ($11,221) ($11,301) ($10,686) ($10,975) ($10,126) ($10,084) ($9,965) ($10,897) ($14,484) Gain to Lease $110 $125 $105 $230 $100 $100 $110 $135 $135 $110 $110 $5,890 $5,885 $6,413 $6,250 Concessions - Renewals ($31,629) ($34,866) ($36,552) ($14,469) ($10,343) ($13,925) ($12,010) ($3,110) ($7,820) ($17,015) ($22,490) ($19,290) ($31,230) ($24,030) ($34,430) Concessions ($11,412) ($12,225) ($18,875) ($11,826) ($19,769) ($22,280) ($19,241) ($4,880) ($6,440) ($21,082) ($15,620) ($19,947) ($22,206) ($19,699) ($15,447) Month to Month Fee $0 $0 $0 $0 $0 $0 $0 $0 $0 $0 $0 $0 $0 $0 $0 Short Term Monthly Fee $775 $1,115 $64 $701 $843 $835 $706 $590 $500 $400 $675 $770 $970 $990 $1,463 Total Rev $724,128 $717,795 $701,479 $720,938 $713,318 $698,771 $697,178 $718,329 $708,213 $703,634 $721,126 $723,372 $712,357 $720,468 $734,350 $727,393 YOY -0.5% 2.3% 3.7% Measure the month end revenue line items that Rev Mgmt can directly impact: Market Rent Vacancy Loss Loss & Gain to Lease Concessions New & Renewal Month to Month and Short Term Lease Fees Don t incorporate line items that Rev Mgmt cannot control like Bad Debt, Write Offs, etc

35 Method 2 Revenue per Unit (RPU) 1. Methodology 2. Performance Results 3. Intangible Benefits
 vs.")
 Avg Net Rental Income -")
36 % of Index Analyzing Performance: Incorporate a Benchmark 1. Methodology 2. Performance Results 3. Intangible Benefits Test (Rev Mgmt) vs. Control (No Rev Mgmt) 102% 100% 98% 96% 94% 92% 90% 88% 86% Baseline July Aug Sept Oct Avg Net Rental Income - Test (Rev Mgmt) Avg Net Rental Income - Control (No Rev Mgmt)

37 Analyzing Performance: Account for the Intangibles 1. Methodology 2. Performance Results 3. Intangible Benefits Steady pricing with measured market response Strategic approach to pricing with more attention and visibility to amenity-based pricing Better, more consistent insight into competitive market space Movement away from market rent and toward net effective pricing
38 Thank you!
Forecasting Survey. How far into the future do you typically project when trying to forecast the health of your industry? less than 4 months 3%
 Forecasting Forecasting Survey How far into the future do you typically project when trying to forecast the health of your industry? less than 4 months 3% 4-6 months 12% 7-12 months 28% > 12 months 57%
Report to the Finance Committee Comprehensive Annual Financial Report. Prepared by the Office of Finance April 2016
 Report to the Finance Committee 2015 Comprehensive Annual Financial Report Prepared by the Office of Finance April 2016 Audit Opinion date April 11, 2016 Unmodified or clean audit opinion on financial
Forecasting for Short-Lived Products
 HP Strategic Planning and Modeling Group Forecasting for Short-Lived Products Jim Burruss Dorothea Kuettner Hewlett-Packard, Inc. July, 22 Revision 2 About the Authors Jim Burruss is a Process Technology
ERCOT in 2018: Challenges & Opportunities
 ERCOT in 2018: Challenges & Opportunities Bill Magness President & CEO ERCOT Texas-Germany Bilateral Dialogue on Challenges and Opportunities in the Electricity Market February 27, 2108 What is ERCOT?
R o l l i n g F o r e c a s t i n g :
 R o l l i n g F o r e c a s t i n g : A Strategy for Effective Financial Management July 24, 2014 Kentucky HFMA 2014 Kaufman, Hall & Associates, Inc. All rights reserved. 0 Agenda Overview of Rolling Forecast
Integrating the planning of sporadic and slow-moving parts within the normal planning process
 Demand Planning Integrating the planning of sporadic and slow-moving parts within the normal planning process Managing the forecasts for sporadic and/or slow-moving parts within normal business forecasting
Electric Forward Market Report
 Mar-01 Mar-02 Jun-02 Sep-02 Dec-02 Mar-03 Jun-03 Sep-03 Dec-03 Mar-04 Jun-04 Sep-04 Dec-04 Mar-05 May-05 Aug-05 Nov-05 Feb-06 Jun-06 Sep-06 Dec-06 Mar-07 Jun-07 Sep-07 Dec-07 Apr-08 Jun-08 Sep-08 Dec-08
APPLICATION OF TIME-SERIES DEMAND FORECASTING MODELS WITH SEASONALITY AND TREND COMPONENTS FOR INDUSTRIAL PRODUCTS
 International Journal of Mechanical Engineering and Technology (IJMET) Volume 8, Issue 7, July 2017, pp. 1599 1606, Article ID: IJMET_08_07_176 Available online at http://www.iaeme.com/ijmet/issues.asp?jtype=ijmet&vtype=8&itype=7
Impact of Consumption Demand Data on DLA Forecast Accuracy
 Impact of Consumption Demand Data on DLA Forecast Accuracy Presented By Vivek Kumar Robert Lo Linda Tsang Project Advisor: Robin Roundy Project Sponsor: Eric Gentsch 1 Agenda Background Study Objectives
Selection of a Forecasting Technique for Beverage Production: A Case Study
 World Journal of Social Sciences Vol. 6. No. 3. September 2016. Pp. 148 159 Selection of a Forecasting Technique for Beverage Production: A Case Study Sonia Akhter**, Md. Asifur Rahman*, Md. Rayhan Parvez
Energy Market Outlook
 Kyle Cooper, (713) 248-3009, Kyle.Cooper@iafadvisors.com Week Ending November 17, 2017 Please contact me to review a joint RBN Energy daily publication detailing natural gas fundamentals. Price Action:
FINANCE AND STRATEGY PRACTICE CFO EXECUTIVE BOARD. Safeguarding Supply. Protecting the Enterprise from Unforeseen Supply Chain Risks
 FINANCE AND STRATEGY PRACTICE CFO EXECUTIVE BOARD Safeguarding Supply Protecting the Enterprise from Unforeseen Supply Chain Risks KEY TAKEAWAYS: SAFEGUARDING SUPPLY 1 Focus Finance s involvement in supply
Energy Market Outlook
 Kyle Cooper, (713) 248-3009, Kyle.Cooper@iafadvisors.com Week Ending November 24, 2017 Please contact me to review a joint RBN Energy daily publication detailing natural gas fundamentals. Price Action:
IAF Advisors Energy Market Outlook Kyle Cooper, (713) , October 31, 2014
 , October 31, 2014") IAF Advisors Energy Market Outlook Kyle Cooper, (713) 722 7171, Kyle.Cooper@IAFAdvisors.com October 31, 2014 Price Action: The December contract rose 17.5 cents (4.7%) to $3.873 on a 33.3 cent range. Price
IAF Advisors Energy Market Outlook Kyle Cooper, (713) 722 7171, Kyle.Cooper@IAFAdvisors.com October 31, 2014 Price Action: The December contract rose 17.5 cents (4.7%) to $3.873 on a 33.3 cent range. Price
TRACKING THE GAS TEMPERATURE EFFECT IN A DISTRIBUTION SYSTEM
 TRACKING THE GAS TEMPERATURE EFFECT IN A DISTRIBUTION SYSTEM Eric Kelner, P.E. - Letton-Hall Group, San Antonio, TX Bryan Niebergall, P.E. - Questar Gas, Salt Lake City, UT AGA Operations Conference, Nashville,
Dynamic Reallocation of Portfolio Funds
 Complete Perspective. Smart Decisions. #StrategicPMO Dynamic Reallocation of Portfolio Funds Ben Chamberlain Chief Product & Marketing Officer Ben.Chamberlain@umt360.com Agenda What s wrong with traditional
Central vs. Distributed Stocks: Trends in Logistic Network Design
 Central vs. Distributed Stocks: Trends in Logistic Network Design Northeast Supply Chain Conference Cambridge, MA 2004 Bruce True, Welch s and Michael Watson, Logic Tools 1 Agenda Introduction to Network
EVALUATION OF THE IMPACT OF SUB METERING ON MULTI RESIDENTIAL ELECTRICITY CONSUMPTION AND THE POTENTIAL ECONOMIC AND ENVIRONMENTAL IMPACT ON ONTARIO
 EVALUATION OF THE IMPACT OF SUB METERING ON MULTI RESIDENTIAL ELECTRICITY CONSUMPTION AND THE POTENTIAL ECONOMIC AND ENVIRONMENTAL IMPACT ON ONTARIO Prepared for: EnerCare Connections Inc. Navigant Consulting
ASSIGNMENT SUBMISSION FORM
 ASSIGNMENT SUBMISSION FORM Course Name Section Project Report : Forecasting Analytics : A : Inventory Management through Sales Forecasting PGID Name of the Member 1. 61710012 Anand Abhishek 2. 61710773
Administration Division Public Works Department Anchorage: Performance. Value. Results.
 Administration Division Anchorage: Performance. Value. Results. Mission Provide administrative, budgetary, fiscal, and personnel support to ensure departmental compliance with Municipal policies and procedures,
PI as a Utility- Scale PV Monitoring Platform
 PI as a Utility- Scale PV Monitoring Platform Presented by Steve Hanawalt, President Outline State of the Market Issues and Challenges Potential Solutions Benefits Summary and Q&A 2 Outline State of the
Leveraging Smart Meter Data & Expanding Services BY ELLEN FRANCONI, PH.D., BEMP, MEMBER ASHRAE; DAVID JUMP, PH.D., P.E.
 ASHRAE www.ashrae.org. Used with permission from ASHRAE Journal. This article may not be copied nor distributed in either paper or digital form without ASHRAE s permission. For more information about ASHRAE,
Management Systems. Linkage. 26 March Text #ICANN49
 Management Systems Linkage 26 March 2014 Agenda Introduction /Overview Strategy Strategic & Financial Planning Implementation Operating Plan Budget / Cost Mgmt. Project Portfolio Mgmt. People Performance
Chapter 5 Evaluating Classification & Predictive Performance
 Chapter 5 Evaluating Classification & Predictive Performance Data Mining for Business Intelligence Shmueli, Patel & Bruce Galit Shmueli and Peter Bruce 2010 Why Evaluate? Multiple methods are available
NATIONAL GRID. NTS Shrinkage Incentive Methodology Statement Submitted for Approval
 NATIONAL GRID NTS Shrinkage Incentive Methodology Statement Submitted for Approval April 2016 ABOUT THIS DOCUMENT This document describes the methodology that National Grid Gas plc ( National Grid ) in
Coachella Valley Median Detached Home Price Mar Mar 2017
 Median Price $450,000 $400,000 Coachella Valley Median Detached Home Price Mar 2002 - Mar 2017 $335,000 $366,285 $350,000 $300,000 $250,000 $200,000 $150,000 CV Detached Median Price 4% growth curve Summary
ANNUAL QUALITY REPORT
 REPUBLIC OF SLOVENIA ANNUAL QUALITY REPORT FOR THE SURVEY MONTHLY REPORT ON SERVICE ACTIVITIES AND MONTHLY REPORT ON WHOLESALE TRADE FOR Prepared by: Barbara Troha Ažbe, Rudi Seljak Date: March 2014 1/12
APICS PRINCIPLES OF OPERATIONS MANAGEMENT TOPIC OUTLINE CONCEPTS AND APPLICATIONS
 APICS PRINCIPLES OF OPERATIONS MANAGEMENT TOPIC OUTLINE CONCEPTS AND APPLICATIONS About this Topic Outline This outline details the concepts and applications coved in all five of the APICS Principles of
Aggregate Planning and S&OP
 Aggregate Planning and S&OP 13 OUTLINE Global Company Profile: Frito-Lay The Planning Process Sales and Operations Planning The Nature of Aggregate Planning Aggregate Planning Strategies 1 OUTLINE - CONTINUED
Call Center Benchmark India
 Call Center Benchmark India Outsourced Call Centers Report Contents Benchmarking Overview Page 2 KPI Statistics and Quartiles Page 8 Benchmarking Scorecard and Rankings Page 13 Detailed Benchmarking Data
Cold climate performance study of 89 wind farms,
 Cold climate performance study of 89 wind farms, 2009-2016 CanWEA Operations and Maintenance Summit January 31, 2018 Ryan Kilpatrick, M.E.Sc., P.Eng. Safety message You can never be too prepared! 2 Background
Energy Market Outlook
 Kyle Cooper, (713) 248-3009, Kyle.Cooper@iafadvisors.com Week Ending January 5, 2018 Please contact me to review a joint RBN Energy daily publication detailing natural gas fundamentals. Price Action: The
Forecasting Workshop: Intermittent Demand Forecasting
 Workshop: Intermittent Demand Recent Advances in Intermittent Demand John Boylan j.boylan@lancaster.ac.uk Professor of Business Analytics Intermittent Demand Recent Advances by John Boylan ( ) Practical
Santa Claus rally could help corn Be ready to sell brief rallies when they come By Bryce Knorr, senior grain market analyst
 Santa Claus rally could help corn Be ready to sell brief rallies when they come By Bryce Knorr, senior grain market analyst Rallies are always possible in corn, even in down markets. Trouble is, they don
Outlook for Natural Gas Demand for Winter
 Outlook for Natural Gas Demand for 2010-2011 Winter Energy Ventures Analysis, Inc. (EVA) Overview Natural gas demand this winter is projected to be about 295 BCF, or 2.5 percent, above demand levels recorded
Inventory Control in Supply Chain Management: Concept and Workshop
 .. Inventory Control in Supply Chain Management: Concept and Workshop Oran Kittithreerapronchai 1 1 Department of Industrial Engineering, Chulalongkorn University Bangkok 10330 THAILAND last updated: November
Chapter 5 Demand Forecasting
 Chapter 5 Demand Forecasting TRUE/FALSE 1. One of the goals of an effective CPFR system is to minimize the negative impacts of the bullwhip effect on supply chains. 2. The modern day business environment
Electricity Supply. Monthly Energy Grid Output by Fuel Type (MWh)
") For the first quarter of 2015, Ontario experienced overall demand that was typical for the province in winter, and strong generator output. Demand for Ontario electricity increased as a result of cold
For the first quarter of 2015, Ontario experienced overall demand that was typical for the province in winter, and strong generator output. Demand for Ontario electricity increased as a result of cold
Modeling Your Water Balance
 Modeling Your Water Balance Purpose To model a soil s water storage over a year Overview Students create a physical model illustrating the soil water balance using glasses to represent the soil column.
Antti Salonen KPP227 KPP227 1
 KPP227 KPP227 1 What is Aggregate Planning? Aggregate (or intermediate-term) planning is the process of determining a company s aggregate plan = production plan. The aggregate plan specifies how the company
Italy July August 2016
 Italy Cooperation partner Italy: invidis research 2016 IT 400 en Continuous high volatility in the Digital Signage sentiment in Italy 100 80 60 40 20 0-20 -40-60 -80-100 positive slightly positive 31,20
Chapter 3 Sales forecasting
 Chapter 3 Sales forecasting Nature and purpose of sales forecasting It would not be hard to be a successful business person if you had a crystal ball and could look into the future. If you knew which products
Seasonal ladjustment of Economic Time Series
 Seasonal ladjustment of Economic Time Series Revenue Estimating Training Workshop Retreat October 30, 2012 Office of Economic & Demographic Research 1 What Is a Time Series? A time series is a sequence
Impacts of the EU ETS on Electricity Prices
 Impacts of the EU ETS on Electricity Prices Prof. P. Capros E3Mlab - NTUA, kapros@central.ntua.gr Presented to Final Meeting of ETRES - Life Project Athens, March 31, 2006 The EU ETS - definition Cap and
WIND RESOURCE & ENERGY YIELD ASSESSMENT PRESENTATION
 ASX Release 17 January 2007 WIND RESOURCE & ENERGY YIELD ASSESSMENT PRESENTATION Babcock & Brown Wind Partners (ASX: BBW) has today released to the market a wind resource and energy yield assessment presentation
Dairy Outlook. January By Jim Dunn Professor of Agricultural Economics, Penn State University. Market Psychology
 Dairy Outlook January 2015 By Jim Dunn Professor of Agricultural Economics, Penn State University Market Psychology Dairy prices have fallen in the past month, especially butter prices. The dollar is still
Case Study on Inventory Management Improvement
 DE GRUYTER OPEN Information Technology and Management Science doi: 1.1515/itms-215-14 Case Study on Inventory Management Improvement Darya Plinere 1, Arkady Borisov 2 1, 2 Riga Technical University Abstract
Commodity Price Prediction using An Artificial Prediction Market based Approach
 Commodity Price Prediction using An Artificial Prediction Market based Approach Rohith D. Vallam Ramasuri Narayanam Gyana R. Parija July 18 th, 2017 Agenda Prediction Markets: Introduction Problem Definition
Improving forecast quality in practice
 Improving forecast quality in practice Robert Fildes (Lancaster Centre for Forecasting) Fotios Petropoulos (Cardiff Business School) Panel Discussion Agenda The Forecasting Process Dimensions of quality
PORTFOLIO OPTIMIZATION MODEL FOR ELECTRICITY PURCHASE IN LIBERALIZED ENERGY MARKETS
 PORTFOLIO OPTIMIZATION MODEL FOR ELECTRICITY PURCHASE IN LIBERALIZED ENERGY MARKETS Edwin Castro CNEE Guatemala Viena, september 2009 What is the reason to develop this model? In our own electricity market
FEDERAL RESERVE statistical release
 FEDERAL RESERVE statistical release G.17 (419) For release at 9:15 a.m. (EDT) August 17, 2017 INDUSTRIAL PRODUCTION AND CAPACITY UTILIZATION Industrial production rose 0.2 percent in July following an
Inventory Management for the Reduction of Material Shortage Problem for Pasteurized Sugarcane Juice: The Case of a Beverage Company
 Inventory Management for the Reduction of Material Shortage Problem for Pasteurized Sugarcane Juice: The Case of a Beverage Company Roongrat Pisuchpen Faculty of Engineering, Industrial Engineering, Kasetsart
China Nickel Industry Chain Analysis,
 Shanghai Metals Market The Leading Metals Information Provider in China China Nickel Chain Analysis, -212 Hot topic The analysis on supply and demand balance of nickel in The forecast of the price trend
Further Analyses of the Exercise and Cost Impacts of Market Power In California s Wholesale Energy Market
 Further Analyses of the Exercise and Cost Impacts of Market Power In California s Wholesale Energy Market March 2001 Prepared by Eric Hildebrandt, Ph.D. Department of Market Analysis California Independent
Predictive Conversations
 Predictive Conversations Measuring Word of Mouth and Predicting Business Outcomes Ed Keller, CEO Rick Larkin, VP Analytics August 11, 2017 MASB Opening thoughts Intrinsically people know conversations
A NEW COINCIDENT INDICATOR FOR THE PORTUGUESE ECONOMY*
 A NEW COINCIDENT INDICATOR FOR THE PORTUGUESE ECONOMY* António Rua** 1. INTRODUCTION * The views expressed in this article are those of the author and not necessarily those of the Banco de Portugal. The
ABB ServicePro 4.0 Service Management System
 ABB ServicePro 4.0 Service Management System Presented by Paul Radcliffe PS Service June 6, 2014 Slide 1 Questions customers ask How successful is my maintenance program? - Am I performing the right PM
What tools can we use to help us decide when to enter and when to exit a hedge? (Or, or for that matter, when to enter and exit any trade.
 Motivation for Fundamental and Technical Analysis What tools can we use to help us decide when to enter and when to exit a hedge? (Or, or for that matter, when to enter and exit any trade.) So, how do
5 Star London Hotels - Example Report
 5 Star London Hotels - Example Report January 2018 CONTENTS Your Benchmark Report Website Traffic Conversion Rates Ecommerce Performance AdWords Spend Your Traffic Index Your Conversion Rate Index Your
Rainwater harvesting for stormwater management Proof that it works
 Rainwater harvesting for stormwater management Proof that it works Richard Kellagher, Juan Gutierrez Andres, Aurelie Gerolin 1 (1) Centre d Etudes Techniques de l Equipement HR FWR Wallingford 3/11/2011-2011
MEASURES FOR EXCELLENCE. Telecom Software Benchmarks. 10 Years Apart
 MEASURES FOR EXCELLENCE Telecom Software Benchmarks Years Apart 1992-2002 Copyright J.W.E Greene QUANTITATIVE SOFTWARE MANAGEMENT LTD 7 Rue Fenoux 41A Aynhoe Road 75015 Paris Internet: qsm.europe@pobox.com
Changes in Water Use under Regional Climate Change Scenarios (Project 4263) 2013 Water Research Foundation. ALL RIGHTS RESERVED.
 2013 Water Research Foundation. ALL RIGHTS RESERVED.") Changes in Water Use under Regional Climate Change Scenarios (Project 4263) www.waterrf.org Advances in Water Research Changes in Water Use under Regional Climate Change Scenarios Project 4263 Presentation
Changes in Water Use under Regional Climate Change Scenarios (Project 4263) www.waterrf.org Advances in Water Research Changes in Water Use under Regional Climate Change Scenarios Project 4263 Presentation
Leading KPIs of Positive Financial Performance. Presented by: Hugh Shaw, Ventera Corporation Bill Riviere, Unanet
 Leading KPIs of Positive Financial Performance Presented by: Hugh Shaw, Ventera Corporation Bill Riviere, Unanet Introduction Hugh Shaw (Ventera Corporation) Bill Riviere (Unanet) 2 KPI Introduction Monitoring
Wind Workshop. Technical Characterization: Dependable Capacity & Firm Energy 10:00-10:30am
 Wind Workshop Technical Characterization: Dependable Capacity & Firm Energy 10:00-10:30am Objective of this session: Understand BC Hydro s definitions and calculation methodology of dependable capacity
Extreme Agile Implementation and Creating a Value Delivery Office
 Extreme Agile Implementation and Creating a Value Delivery Office Anup Deshpande Sr. Leader of Agile Portfolio Management 1 COPYRIGHT 2017 Anup Deshpande. ALL RIGHTS RESERVED For Informational Purposes
COMPARATIVE ANALYSIS OF MONTHLY REPORTS ON THE OIL MARKET
 COMPARATIVE ANALYSIS OF MONTHLY REPORTS ON THE OIL MARKET Summary findings from a comparison of data and forecast on the oil market by the International Energy Agency, and Organization of the Petroleum
U.S. Hotel Industry Performance
 U.S. Hotel Industry Performance Jan D. Freitag Senior Vice President jan@str.com @jan_freitag 2016 STR, Inc. All Rights Reserved. Any reprint, use or republication of all or a part of this presentation
Using Weather Forecasting For Decision Tools For Animal Agriculture
 Using Weather Forecasting For Decision Tools For Animal Agriculture Steve Buan National Weather Service Minnkota Agri-Builders and Equipment Suppliers Association 11 March 2016 Cattle Heat Stress Forecast
Alternative Seasonality Detectors Using SAS /ETS Procedures Joseph Earley, Loyola Marymount University, Los Angeles
 Alternative Seasonality Detectors Using SAS /ETS Procedures Joseph Earley, Loyola Marymount University, Los Angeles ABSTRACT Estimating seasonal indices is an important aspect of time series analysis.
Reliability Improvement using Defect Elimination
 Reliability Improvement using Defect Elimination A Three-Prong Approach The Keystone to Safe, Reliable, Profitable Production Michael Voigt 2006 KBC. All Rights Reserved. 1 Introduction Michael Voigt 19
with Dr. Maria Rey-Marston Lecturer, Georgia Tech Supply Chain & Logistics Institute Managing Partner, MRM+ Partners LLP
 1 Webinar: Measuring & Managing Supply Chain Performance with Dr. Maria Rey-Marston Lecturer, Georgia Tech Supply Chain & Logistics Institute Managing Partner, MRM+ Partners LLP MEASURING AND MANAGING
12% 16% Faster full resolution time. Faster first reply time. Customers who use analytics are more responsive and effective
 INSIGHTS Customers who use analytics are more responsive and effective The average full resolution time is 60 hours. 16% means a savings of over 9 hours per ticket 12% 16% Faster first reply time Faster
Executive summary. Butter prices at record levels
 June 2017 Executive summary Butter prices at record levels South African milk production growth disappointed in the first five months of 2017. Total production during this period is marginally lower than
Leading Indicators for Systems Engineering Effectiveness Presentation for NDIA SE Conference October 28, 2009
 Leading Indicators for Systems Engineering Effectiveness Presentation for NDIA SE Conference October 28, 2009 Garry Roedler Lockheed Martin 1 Growing Interest in SE Effectiveness Questions about the effectiveness
Introduction. Barbara Wheeler, PMP
 AGENDA Introduction Company History Overview RTM / Arby s Merger Disparate Systems Oracle Ebusiness Suite Integration Benefits of an ERP System Wendy s Integration Approach Goals of the Merger 2010 Projects
Spreadsheets in Education (ejsie)
") Spreadsheets in Education (ejsie) Volume 2, Issue 2 2005 Article 5 Forecasting with Excel: Suggestions for Managers Scott Nadler John F. Kros East Carolina University, nadlers@mail.ecu.edu East Carolina
Spreadsheets in Education (ejsie) Volume 2, Issue 2 2005 Article 5 Forecasting with Excel: Suggestions for Managers Scott Nadler John F. Kros East Carolina University, nadlers@mail.ecu.edu East Carolina
MANAGERIAL ECONOMICS WILEY A JOHN WILEY & SONS, INC., PUBLICATION. A Mathematical Approach
 MANAGERIAL ECONOMICS A Mathematical Approach M. J. ALHABEEB L. JOE MOFFITT Isenberg School of Management University of Massachusetts Amherst, MA, USA WILEY A JOHN WILEY & SONS, INC., PUBLICATION PREFACE
Organic Produce. Data Ending 28 th February 16
 Organic Produce Data Ending 28 th February 16 SUMMARY In the latest quarter Organic Produce has reached its highest level in both Value and Volume, following an overall strong 2015. During 2015 Organic
IBM SPSS Forecasting 19
 IBM SPSS Forecasting 19 Note: Before using this information and the product it supports, read the general information under Notices on p. 108. This document contains proprietary information of SPSS Inc,
Customer Pay. A Government / Industry Partnership. Presented to the NDIA/DSCC Land & Maritime Symposium By Ed Peters President AM General Defense
 Customer Pay A Government / Industry Partnership Presented to the NDIA/DSCC Land & Maritime Symposium By Ed Peters President AM General Defense HMMWV Products HUMMER H1 HUMMER H2 6.5 Liter Business Units
Contents in Brief. Preface
 Contents in Brief Preface Page v PART 1 INTRODUCTION 1 Chapter 1 Nature and Scope of Managerial Economics and Finance 3 Chapter 2 Equations, Graphs and Optimisation Techniques 21 Chapter 3 Demand, Supply
Estimation, Forecasting and Overbooking
 Estimation, Forecasting and Overbooking Block 2 Zaenal Akbar (zaenal.akbar@sti2.at) Copyright 2008 STI INNSBRUCK Agenda Topics: 1. Estimation and Forecasting 2. Overbooking Tuesday, 21.03.2017 1 146418
Cattle Outlook. January, 2018
 Cattle Outlook January, 2018 Cattle Outlook January 2018 In This Issue: Supply Fundamentals Demand Fundamentals Summary 2 Historical Price Reference Where are Cattle Prices Currently, And Where are they
The next release is scheduled for Thursday, December 8, 2011 at 10:00 A.M. (KST) In the U.S Wednesday, December 7, 2011 at 8:00 P.
 In the U.S Wednesday, December 7, 2011 at 8:00 P.") FOR RELEASE: 10:00 A.M. KST, THURSDAY, NOVEMBER 10, 2011 The Conference Board Korea Business Cycle Indicators SM THE CONFERENCE BOARD LEADING ECONOMIC INDEX (LEI) FOR KOREA AND RELATED COMPOSITE ECONOMIC
FOR RELEASE: 10:00 A.M. KST, THURSDAY, NOVEMBER 10, 2011 The Conference Board Korea Business Cycle Indicators SM THE CONFERENCE BOARD LEADING ECONOMIC INDEX (LEI) FOR KOREA AND RELATED COMPOSITE ECONOMIC
Getting Started with OptQuest
 Getting Started with OptQuest What OptQuest does Futura Apartments model example Portfolio Allocation model example Defining decision variables in Crystal Ball Running OptQuest Specifying decision variable
Presentation for the Local Government Commission and the Community Environmental Council. July 13, 2007
 Community Choice Aggregation Presentation for the Local Government Commission and the Community Environmental Council July 13, 2007 1 Community Choice Aggregation (CCA) CCA Legislation (AB117) allows cities
Misleading Statistic?
 Are Policies to Encourage WindEnergyPredicated on a Misleading Statistic? Kevin F. Forbes The Center for the Study of Energy and Environmental Stewardship Department of Business and Economics The Catholic
Third Quarter 2017 Conference Call
 Third Quarter 2017 Conference Call October 24, 2017 Forward-Looking Statements This presentation contains forward-looking statements. Actual results may differ materially from results anticipated in the
Structure your Service Department to be
 Structure your Service Department to be Profitable Don Tipton November 5, 2015 The Service Department from the Owner/General Manager s perspective: Service can be a strange and foreign world However, it
The Confluence Model. Presentation to Modeling and Forecasting Working Group January 21, 2015
 The Confluence Model Presentation to Modeling and Forecasting Working Group January 21, 2015 Introductions Presenter: Gary Fiske Working Group Water Department staff Objective: Penetrate the Black Box
Climate Change & Urbanization Have Changed River Flows in Ontario
 Climate Change & Urbanization Have Changed River Flows in Ontario by Trevor Dickinson & Ramesh Rudra Water Resources Engineering University of Guelph Acknowledgements Agencies NSERC, OMAF & Environment
The next release is scheduled for Friday, August 15, 2014 at 10:00 A.M. (KST) In the U.S Thursday, August 14, 2014 at 9:00 P.M.
 In the U.S Thursday, August 14, 2014 at 9:00 P.M.") FOR RELEASE: 10:00 A.M. KST, FRIDAY, JULY 11, 2014 The Conference Board Korea Business Cycle Indicators SM THE CONFERENCE BOARD LEADING ECONOMIC INDEX (LEI) FOR KOREA AND RELATED COMPOSITE ECONOMIC INDEXES
FOR RELEASE: 10:00 A.M. KST, FRIDAY, JULY 11, 2014 The Conference Board Korea Business Cycle Indicators SM THE CONFERENCE BOARD LEADING ECONOMIC INDEX (LEI) FOR KOREA AND RELATED COMPOSITE ECONOMIC INDEXES
Panorama WRHA Public Health Staff Development December 10 & 11,
 Panorama WRHA Public Health Staff Development December 10 & 11, 2013 --------------------------------------------- Presentation Overview Panorama Overview Change Management Principles Change Readiness
CREDIT RISK MODELLING Using SAS
 Basic Modelling Concepts Advance Credit Risk Model Development Scorecard Model Development Credit Risk Regulatory Guidelines 70 HOURS Practical Learning Live Online Classroom Weekends DexLab Certified
For Bandon Utilities Commission
 For Bandon Utilities Commission July 12, 2017 Profile BPA, a component of the U.S. Department of Energy, is a non-profit and self-funded power marketing administration in the Pacific Northwest. Congress
Terms of Reference Governance Committee
 1. Purpose Terms of Reference Governance Committee The Governance Committee is responsible for ensuring that BC Assessment and its Board develop and implement an effective approach to corporate governance.
WEATHER-ADJUSTED PERFORMANCE GUARANTEES
 WEATHER-ADJUSTED PERFORMANCE GUARANTEES Matt Hollingsworth Clean Power Research Napa, CA 94559 matthol@cleanpower.com Jeff Ressler Clean Power Research Napa, CA 94559 jressler@cleanpower.com Richard Perez
Achieving World Class Safety Performance Through Metrics
 Session No. 710 Achieving World Class Safety Performance Through Metrics Introduction John W. Russell, MS, PE, CSP, CPE, CPEA, ARM, PCMH Technical Director Liberty Mutual Group Irving, TX Metrics are a
Επιχειρησιακή Συνέχεια και Εφοδιαστική Αλυσίδα, 14 Οκτωβρίου Moving ahead in a changing environment
 Moving ahead in a changing environment Changes in consumer behavior and their effect on customer service levels Change of customer requirements to smaller quantities and shorter delivery times due to:
Water Supply Board Briefing. Water Operations Department March 22, 2016
 Water Supply Board Briefing Water Operations Department March 22, 2016 Water Supply Briefing California Water Supply District Water Supply Water Supply Projections Water Supply Schedule 2 California Water