PAN Nanofibers and Nanofiber Reinforced Composites
|
|
|
- Roxanne Weaver
- 6 years ago
- Views:
Transcription

1 University of Nebraska - Lincoln DigitalCommons@University of Nebraska - Lincoln Mechanical (and Materials) Engineering -- Dissertations, Theses, and Student Research Mechanical & Materials Engineering, Department of Summer PAN Nanofibers and Nanofiber Reinforced Composites Cheng Ren University of Nebraska-Lincoln, chengren@huskers.unl.edu Follow this and additional works at: Part of the Mechanics of Materials Commons, Nanoscience and Nanotechnology Commons, Other Engineering Science and Materials Commons, and the Polymer and Organic Materials Commons Ren, Cheng, "PAN Nanofibers and Nanofiber Reinforced Composites" (2013). Mechanical (and Materials) Engineering -- Dissertations, Theses, and Student Research This Article is brought to you for free and open access by the Mechanical & Materials Engineering, Department of at DigitalCommons@University of Nebraska - Lincoln. It has been accepted for inclusion in Mechanical (and Materials) Engineering -- Dissertations, Theses, and Student Research by an authorized administrator of DigitalCommons@University of Nebraska - Lincoln.
2 PAN NANOFIBERS AND NANOFIBER REINFORCED COMPOSITES by Cheng Ren A THESIS Presented to the Faculty of The Graduate College at the University of Nebraska In Partial Fulfillment of Requirements For the Degree of Master of Science Major: Mechanical Engineering and Applied Mechanics Under the Supervision of Professor Yuris Dzenis Lincoln, Nebraska August, 2013
3 PAN NANOFIBERS AND NANOFIBER REINFORCED COMPOSITES Cheng Ren, M.S. University of Nebraska, 2013 Adviser: Yuris Dzenis Nanomaterials play an important role in the development of nanotechnology. They possess unique mechanical, physical, and chemical properties coupled with small size and ultrahigh surface area that can provide critical advantages for applications. Continuous nanofibers attract special interest due to their dual nano-macro nature and ability to bridge scales. Nanofibers are being considered for a broad range of applications spanning advanced filters, separation membranes, ultrasensitive sensors, micro/nano actuators, nanoprobes, tissue engineering scaffolds, protective and smart closing, and multifunctional composites. Most of these applications require certain mechanical properties and robustness. However, the literature on the mechanical behavior of nanofibers and their assemblies and composites is very sparse. The objective of this thesis was to manufacture and study the mechanical behavior of nanofiber networks and nanofiber reinforced composites with several nanofiber orientation distributions. Uniform diameter ployacrylonitrile (PAN) nanofibers were manufactured using electrospinning technique. In order to find the optimum manufacturing conditions, the effects of several electrospinning process parameters on PAN nanofiber diameters and orientation distributions were analyzed systematically experimentally. Nanofiber morphologies were examined and statistically quantified by scanning electron microscopy. Non-linear mechanical properties of single nanofibers and aligned and random nanofiber networks
4 were investigated and compared. Aligned and random PAN nanofiber reinforced composites were fabricated and their anisotropic fracture properties were evaluated experimentally for the first time. It was shown that a small amount of nanofiber reinforcement produced significant improvements in fracture toughness of epoxy-based nanocomposites. The results of this study can be used in the development of nanofibrous materials and applications requiring a degree of mechanical robustness.
5 iv ACKNOWLEDGEMENTS There are many friends, colleagues and family that I would like to thank for their continued support and guidance during my graduate studies. First and foremost, I would like to express my sincere appreciation to my adviser, Prof. Yuris Dzenis, for his guidance, advice and support of this research over the past few years. I would like to thank Prof. Li Tan, Prof. Jung Yul Lim for serving on my supervisory committee. Their thoughtful suggestions of this thesis are greatly appreciated. Specially, I would like to thank Dr. Xiangfa Wu, Dr. Yongkui Wen, Dr. Xi Ren and Dr. Alexander Goponenko for their patient training and help to setup experiments. I would like to thank Ms. Yan Zou and Mr. Yong Liu for their assistance in this research. I would also like to thank all the past and current members of Prof. Dzenis group: Dr. Zhenyu Li, Dr. Yong Chen, Dr. Lihua Liu, Dr. Anastasia Desyatova, Dr. Alexey Kamenskiy, Dr. Yury Salkovskiy, Mr. Mikhail Kartashov, Mr. Chad Peterson, Mr. John Hannappel, Ms. Kazi Israt Jahan, Mr. Mohammad Nahid Andalib, Mr. Dimitry Papkov, and Mr. Kaspars Maleckis. You have had an impact on my graduate experience both individually and collectively. Many thanks go to all faculty, staff, and students in the Department of Mechanical and Materials Engineering at University of Nebraska-Lincoln. I would like to thank all of the grants and findings for making the research in this thesis possible. This research was supported by NSF, ARO, AFOSR, and NRI grants to
6 v Prof. Dzenis. Last but not least, I dedicate this work to my family. For my parents Xingwu Ren and Anyang Li, who supported and encouraged me throughout the process of my pursuing the M.S. degree. For my husband Zhen Li, I never would have achieved this without his love. He has always been there for me when I needed it most.
7 vi TABLE OF CONTENTS List of Figures... ix List of Tables...xv Chapter 1: Introduction Nanotechnology Nanomaterials Nanocomposites Electrospinning History Electrospinning Process Mechanisms of Electrospinning Advantages of Electrospinning Electrospun Nanofibers Applications of Electrospun Nanofibers Aligned Electrospun Nanofibers Mechanical Properties of Nanofibers, Nanofiber Assemblies, and Nanofiber Reinforced Composites Summary and Problem Formulation...18 Chapter 2: PAN Nanofiber Manufacturing Experimental PAN Solution Preparation Electrospinning Setup Evaluation of Electronspun Nanofiber Morphologies SEM Sample Preparation SEM Images Electrospinning Parameters...39
8 vii Spinnability and Diameter of PAN Nanofibers in Different Manufacturing Conditions Effects of Electrospinning Parameters on Nanofiber Diameter Applied Voltage PAN Solution Concentration Thermal Analysis of Electrospun Nanofibers Conclusions...53 Chapter 3: PAN Nanofiber Networks Aligned Nanofibers Manufacturing Effects of Electrospinning Parameters Effect of Collector Gap Size on Diameter and Orientation of Aligned Nanofibers Effect of Collector Gap Size on Aligned Nanofibers Diameter Effect of Collector Gap Size on Aligned Nanofibers Orientation Distribution Effect of Manufacturing Duration on Aligned Nanofiber Orientation Calculation of Orientation Parameters Equivalent Thickness Measurement of Polymer Nanofiber Sheet Mechanical Properties of PAN Nanofibers Tensile Testing Single PAN Nanofiber Testing Aligned PAN Nanofiber Network Testing Fiber Network Manufactured in 1 Hour Fiber Network Manufactured in 2 Hours Random Nanofiber Networks Comparison of Mechanical Properties of Nanofiber Networks Conclusions...85 Chapter 4: PAN Nanofiber Reinforced Composites...86
9 viii 4.1 Composites Manufacturing Materials Molding Curing Cycle PAN Nanofiber Reinforced Composites Aligned PAN Nanofiber Reinforced Composites Random PAN Nanofiber Reinforced Composites Evaluation of Fiber Mass Fraction: V m Fracture Analysis of PAN Nanofiber Reinforced Composites Selected Specimen Geometry and Data Reduction Method Tensile Testing Fracture Properties of Testing Materials [0] nanocomposites [90] nanocomposites Random Nanofiber Reinforced Composites Pure Epoxy Data Summary and Analysis SEM Images of Fracture Surface Conclusions Chapter 5: Summary and Conclusions Bibliography Appendix: Diameter Distributions of PAN Nanofibers...122
10 ix LIST OF FIGURES Figure 1.1: Publications related to nanotechnology from 2000 to Data is from Web of Science. Figure 1.2: Smart clothing runway show and SEM image of cloth fiber with coated nanoparticles Figure 1.3: Illustration of the usage of polymer nanocomposites parts Figure 1.4: Publications related to electrospinning from 2000 to Data is from Web of Science. Figure 1.5: A setup for electrospinning Figure 1.6: Photographs illustrating the instability region of an electrospun liquid jet. The capture time was on two different time scales: A. 1/250 s, and B. 18 ns, respectively. Figure 1.7: Publication search on electrospun nanofiber/nanofibers from the Web of Science Figure 1.8: SEM images of nanofibers Figure 1.9: Application of nanofibers in filtration Figure 1.10: Nanoreinforcement between plies of the traditional composites laminates Figure 1.11: Setup for generating aligned nanofibers Figure 1.12: Comparison of specific strength and specific energy to failure of as-spun PAN nanofibers (diamonds) with typical values for commercial and developmental fibers and materials Figure 2.1: DMF solution (left) and PAN powder (right) Figure 2.2: PAN solution: (a) before stirring and heating; (b) after mixing
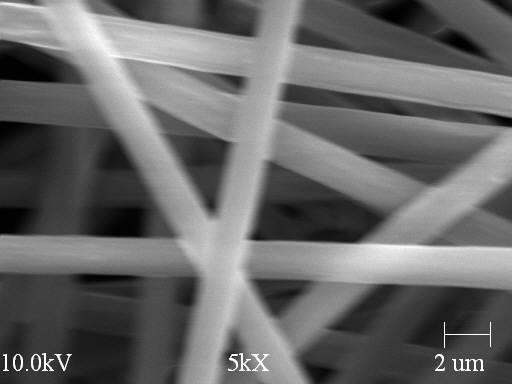
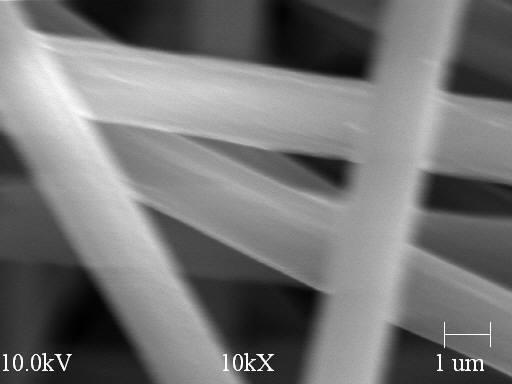
11 x Figure 2.3: Electrospinning setup Figure 2.4: SEM samples Figure 2.5: SEM images of 10% PAN nanofibers manufactured in (a) 8kV; (b) 9kV; (c) 10kV; (d) 11kV; (e) 12kV; (f) 13kV Figure 2.6: SEM images of 11% PAN nanofibers manufactured in (a) 9kV; (b) 10kV; (c) 11kV; (d) 12kV; (e) 13kV; (f) 14kV Figure 2.7: SEM images of 12% PAN nanofibers manufactured in (a) 8kV; (b) 9kV; (c) 10kV Figure 2.8: SEM images of 13% PAN nanofibers manufactured in (a) 11kV; (b) 12kV; (c) 13kV; (d) 14kV; (e) 15kV Figure 2.9: SEM images of 14% PAN nanofibers manufactured in (a) 9kV; (b) 10kV; (c) 11kV; (d) 12kV Figure 2.10: Beaded electrospun PAN nanofibers Figure 2.11: Effect of applied voltage on nanofiber diameter (a) 10% PAN; (b) 11% PAN; (c) 12% PAN; (d) 13% PAN; (e) 14% PAN Figure 2.12: Effect of PAN solution concentration on nanofiber diameter (a) 9kV; (b) 10kV; (c) 11kV; (d) 12kV; (e) 13kV Figure 2.13: The Perkin-Elmer Pyris TGA-7 Figure 2.14: SEM image of electrospun PAN nanofibers tested in TGA Figure 2.15: TGA curves of selected electrospun PAN nanofibers Figure 3.1: Electrospinning setup for manufacturing aligned PAN nanofibers Figure 3.2: An example of aligned PAN nanofibers produced by the gap method Figure 3.3: SEM images of aligned PAN nanofibers manufactured with 2cm gap size
12 xi Figure 3.4: SEM images of aligned PAN nanofibers manufactured with 3cm gap size Figure 3.5: SEM images of aligned PAN nanofibers manufactured with 4cm gap size Figure 3.6: SEM images of aligned PAN nanofibers manufactured with 5cm gap size Figure 3.7: SEM images of aligned PAN nanofibers manufactured with 6cm gap size Figure 3.8: Diameter distribution of aligned PAN nanofibers manufactured with 2cm gap size Figure 3.9: Diameter distribution of aligned PAN nanofibers manufactured with 3cm gap size Figure 3.10: Diameter distribution of aligned PAN nanofibers manufactured with 4cm gap size Figure 3.11: Diameter distribution of aligned PAN nanofibers manufactured with 5cm gap size Figure 3.12: Diameter distribution of aligned PAN nanofibers manufactured with 6cm gap size Figure 3.13: Diameter of aligned PAN nanofibers manufactured with different gap size Figure 3.14: Schematic definition of 0 degree orientation of aligned nanofibers Figure 3.15: An example of aligned PAN nanofibers with 0 degree direction indicated by an arrow Figure 3.16: SEM image and orientation distribution of aligned PAN nanofibers manufactured with 2cm gap Figure 3.17: SEM image and orientation distribution of aligned PAN nanofibers manufactured with 3cm gap Figure 3.18: SEM image and orientation distribution of aligned PAN nanofibers manufactured with 4cm gap
13 xii Figure 3.19: SEM image and orientation distribution of aligned PAN nanofibers manufactured with 5cm gap Figure 3.20: SEM image and orientation distribution of aligned PAN nanofibers manufactured with 6cm gap Figure 3.21: SEM image of aligned PAN nanofibers manufactured in 1 hour (left) and 2 hours (right) Figure 3.22: f P values of aligned nanofibers with different manufacturing gap size Figure 3.23: g P values of aligned nanofibers with different manufacturing gap size Figure 3.24: NANO UTM Testing System by Agilent Figure 3.25: Representative strain-stress curves of single PAN nanofibers Figure 3.26: SEM images of single PAN nanofibers with diameters: (a) 420 nm (b) 375 nm Figure 3.27: Effect of single nanofiber diameter on strength Figure 3.28: Tensile testing of aligned PAN nanofibers Figure 3.29: Representative strain-stress curves of aligned PAN nanofiber network manufactured in 1 hour Figure 3.30: Representative strain-stress curves of aligned PAN nanofiber network manufactured in 2 hours Figure 3.31: SEM images of random PAN nanofiber network Figure 3.32: Tensile testing of random PAN nanofiber network Figure 3.33: Representative strain-stress curves of random PAN nanofiber network Figure 3.34: Strength of aligned (manufactured in 1 hour and 2 hours) and random PAN nanofiber network
14 xiii Figure 3.35: Young s Modulus of aligned (manufactured in 1 hour and 2 hours) and random PAN nanofiber network Figure 3.36: Toughness of aligned (manufactured in 1 hour and 2 hours) and random PAN nanofiber network Figure 4.1: Jeffamine D-400 (left) and EPON Resin 828 (right) Figure 4.2: Hot-Press: CARVER; model 2699, S/N Figure 4.3: Example of aligned PAN nanofiber reinforced composites Figure 4.4: Example of random PAN nanofiber reinforced composites Figure 4.5: Fracture modes Figure 4.6: Double edge notch test specimen Figure 4.7: Specimen design of double edge notch test (left) and an experimental sample (right) Figure 4.8: MICROTEST 200N tensile stage Figure 4.9: Representative strain-stress curves of [0] nanocomposites Figure 4.10: Representative strain-stress curves of [90] nanocomposites Figure 4.11: Representative strain-stress curves of random nanofiber reinforced composites Figure 4.12: Representative strain-stress curves of pure epoxy Figure 4.13: Fracture strength of [0] nanocomposites, [90] nanocomposites, random nanofiber reinforced composites and pure epoxy Figure 4.14: Young s Modulus of [0] nanocomposites, [90] nanocomposites, random nanofiber reinforced composites and pure epoxy Figure 4.15: Critical stress intensity factor of [0] nanocomposites, [90] nanocomposites,
15 xiv random nanofiber reinforced composites and pure epoxy Figure 4.16: SEM images of fracture surface of [0] nanocomposites Figure 4.17: SEM images of fracture surface of [90] nanocomposites Figure 4.18: SEM images of fracture surface of random nanofiber reinforced composites Figure 6.1: 10% PAN nanofibers manufactured in (a) 8kV; (b) 9kV; (c) 10kV; (d) 11kV; (e) 12kV; (f) 13kV Figure 6.2: 11% PAN nanofibers manufactured in (a) 9kV; (b) 10kV; (c) 11kV; (d) 12kV; (e) 13kV; (f) 14kV Figure 6.3: 12% PAN nanofibers manufactured in (a) 8kV; (b) 9kV; (c) 10k Figure 6.4: of 13% PAN nanofibers manufactured in (a) 11kV; (b) 12kV; (c) 13kV; (d) 14kV; (e) 15kV Figure 6.5: Diameter distribution of 14% PAN nanofibers manufactured in (a) 9kV; (b) 10kV; (c) 11kV; (d) 12kV
16 xv LIST OF TABLES Table 2.1: Spinnability and diameters of electrospun PAN nanofibers fabricated using different manufacturing conditions Table 2.2: Diameter and standard deviation of 10% PAN nanofibers manufactured with different applied voltage Table 2.3: Diameter and standard deviation of 11% PAN nanofibers manufactured with different applied voltage Table 2.4: Diameter and standard deviation of 12% PAN nanofibers manufactured with different applied voltage Table 2.5: Diameter and standard deviation of 13% PAN nanofibers manufactured with different applied voltage Table 2.6: Diameter and standard deviation of 14% PAN nanofibers manufactured with different applied voltage Table 2.7: Manufacturing conditions of electrospun PAN nanofibers tested in TGA Table 3.1: Manufacturing conditions for aligned PAN nanofibers Table 3.2: Average diameter and standard deviation of aligned PAN nanofibers manufactured with different gap size Table 3.3: Manufacturing conditions for aligned PAN nanofibers Table 3.4: f P and Table 3.5: f P and g P values of aligned nanofibers with different manufacturing gap size g P values of aligned nanofibers with different manufacturing duration Table 3.6: Weight/area and computed equivalent thickness of aligned PAN nanofibers manufactured during different durations
17 xvi Table 3.7: Loading conditions of UTM tests Table 3.8: Manufacturing conditions for single PAN nanofiber Table 3.9: Mechanical properties of single PAN nanofiber Table 3.10: Mechanical properties of aligned PAN nanofiber network manufactured in 1 hour Table 3.11: Mechanical properties of aligned PAN nanofiber network manufactured in 2 hours Table 3.12: Manufacturing conditions for random PAN nanofiber network Table 3.13: Mechanical properties of random PAN nanofiber network Table 3.14: Mechanical properties of aligned (manufactured in 1 hour and 2 hours) and random PAN nanofiber network Table 4.1: Manufacturing conditions for aligned PAN nanofibers Table 4.2: Manufacturing conditions of random PAN nanofibers Table 4.3: Fracture properties of [0] nanocomposites Table 4.4: Fracture properties of [90] nanocomposites Table 4.5: Fracture properties of random nanofiber reinforced composites Table 4.6: Fracture properties of pure epoxy Table 4.7: Fracture poperties of [0] nanocomposites, [90] nanocomposites, random nanofiber reinforced composites and pure epoxy
18 1 CHAPTER 1 INTRODUCTION 1.1 Nanotechnology Nanoscale science and technology is a relatively new area of research. It focuses on things that are measured in nanometers. In the past several decades, scientists have developed tools and methods that help better understanding the fundamental aspects of the world [1-3]. A nanometer is a billionth of a meter. The great potential of nanoscale objects stems from their tiny size. Things have different properties at the nanoscale, which allows scientists and engineers to create new materials and devices [4-7]. Nanotechnology is the manipulation of matter with at least one dimension sized from 1 to 100 nanometers (nm), as defined by the National Nanotechnology Initiative [10]. The structures at nanoscale behave differently from atoms or bulk materials. The reasons are quantum effects, size effects, and large surface-to-volume ratio or interfaceto-volume ratio [11-13]. It is possible to control properties of materials (mechanical, thermal, electrical, magnetic, optical etc.) by changing their nanoscale structure. Materials which are developed at nanoscale usually have some superior properties as compared with general materials. These high-performance materials can be used in a variety of new products. For example, the high surface-to-volume ratio of nanomaterials
![2 can be used in composites, chemical reactions, drug delivery, and energy storage. Nanosized catalysts will increase the efficiency of chemical reactions [14-16].](/docs-images/74/71084066/images/19-0.jpg "Nanotechnology is expected to significantly redevelop existing technologies and create new industries.")
19 2 can be used in composites, chemical reactions, drug delivery, and energy storage. Nanosized catalysts will increase the efficiency of chemical reactions [14-16]. Nanotechnology is expected to significantly redevelop existing technologies and create new industries. The fields of science that are involved in nanotechnology are diverse and very broad and include surface science, organic chemistry, molecular biology, semiconductor physics, microfabrication, etc. [17]. Major research areas are synthesis, characterization and integration of nanomaterials. A great demand for the nanotechnology research (Figure 1.1) and development of new nanomaterials is fueled by the broad variety of potential applications in both industry and military [18-20]. Governments have invested billions of dollars in research on nanotechnology [21-24]. As reported in April 2012, the USA has invested 3.7 billion dollars through its National Nanotechnology Initiative, while the European Union has invested 1.2 billion and Japan has invested 750 million dollars [25]. Figure 1.1: Publications related to nanotechnology from 2000 to Data is from Web of Science.
20 3 1.2 Nanomaterials Nanomaterials are an important subset of nanotechnology. A nanomaterial is a material with at least one dimension less than 100 nm [26]. The definition of a nanomaterial from European Commission on 18 October 2011 is as follows: A natural, incidental or manufactured material containing particles, in an unbound state or as an aggregate or as an agglomerate and where, for 50% or more of the particles in the number size distribution, one or more external dimensions is in the size range 1 nm to 100 nm. In specific cases and where warranted by concerns for the environment, health, safety or competitiveness the number size distribution threshold of 50% may be replaced by a threshold between 1 and 50%. [27] Nanomaterials have many unique features such as unique physical and chemical properties, small size coupled with high specific surface area, and quantum confinement. Scientists create useful materials, devices and systems through control of matter in the nanometer length scale and explore novel properties and phenomena developed at that scale [32]. Nanomaterials can be classified as zero-dimensional nanomaterials (i.e. nanoparticles, nanoclusters and nanodots), one-dimensional nanomaterials (i.e. nanofibers, nanotubes and nanowires) and two-dimensional nanomatierals (i.e. nanoplatelets and nanofilms) [28-30]. Figure 1.2A shows models wearing garments made of fibers coated with nano-sized bits of metal. SEM image of these fibers is shown in Figure 1.2B. As a result of the nanoparticle coating, the clothes were resistant to dirt, allergens and even broke down
![4 harmful pollution before it reaches the wearer's skin [31]. Figure 1.2: Smart clothing runway show and SEM image of cloth fiber with coated nanoparticles [31] 1.](/docs-images/74/71084066/images/21-0.jpg "3 Nanocomposites Conventional composites are solid materials composed of two or more constituents combined to offer users the specific properties they required.")
21 4 harmful pollution before it reaches the wearer's skin [31]. Figure 1.2: Smart clothing runway show and SEM image of cloth fiber with coated nanoparticles [31] 1.3 Nanocomposites Conventional composites are solid materials composed of two or more constituents combined to offer users the specific properties they required. Usually, they are composed of a matrix and reinforcements of different types. Nanocomposites are composites where at least one constituent has at least one dimension smaller than 100 nm [33]. Natural nanocomposites can be found in the

22 5 structure of the abalone shell and bone. Nanocomposites can be classified as polymer matrix nanocomposites, metal matrix nanocomposites and ceramic matrix nanocompostes, based on the type of matrix. Compared to conventional composites, interphases in nanocomposites play a dominant role and affect their macroscopic properties. The reinforcing material can be made up of nanomaterial in zero, one or two dimensional form [34,35]. The area of the interface between the matrix and reinforcement phase(s) is significantly larger than that of conventional composites. The applications of nanocomposites include structural materials with improved mechanical properties, electronic materials, magnetic materials, biomedical materials, photonics, high-performance coating and catalysts [36-39]. Figure 1.3 illustrates the usage of polymer nanocomposites parts in a Toyota motor vehicle. The main advantages for using polymer nanocomposite parts in the automotive industry are: reducing vehicle's weight, improving engine efficiency, saving fuel, increasing safety [41]. Figure 1.3: Illustration of the usage of polymer nanocomposites parts [41]
23 6 Currently, one-dimensional (1D) and two-dimensional (2D) nanomaterials attract high interest for use as nanoreinforcement in nanocomposites. 1D carbon nanotubes show high promise, but their processing into nanocomposites has not yet been successful due to their discontinuity [40]. Polymer nanofibers can be continuous and their high mechanical and other properties show big advantages over nanoreinforcement [39]. The current experimental and theoretical works on polymer nanocomposites mainly focus on relationships between effective properties (such as modulus and thermomechanical characteristics) and properties of constituents (polymer matrix and reinforcement), volume fraction of components, shape and arrangement of reinforcement, and interaction between matrix and reinforcement [42]. Limited research has been performed on mechanical properties of random nanofiber reinforced polymer nanocomposites, however aligned nanofiber reinforced polymer nanocomposites have not yet been investigated. 1.4 Electrospinning Electrospinning, also known as electrostatic spinning, is a method to produce superfine fibers with diameters from less than 10 nm to over 1 μm [43]. Conventional mechanical fiber spinning techniques cannot produce fibers with diameters smaller than 2 μm [56]. Electrospinning has gained increased attention in the last decade due to a surging interest in nanotechnology (Figure 1.4). With the help of electrical charge, this process can draw very fine fibres from a liquid and does not require the use of

24 7 coagulation chemistry or high temperatures. It is considered the simplest and most effective technology to produce continuous polymer nanofibers from polymer solutions or melts in high electric fields [44-46]. Figure 1.4: Publications related to electrospinning from 2000 to Data is from Web of Science History The origin of electrospinning as a viable fiber spinning technique can be traced back to 1900s. In 1914, John Zeleny published an article on electrified jet [47]. A series of patents from Anton Formhals were awarded later. The first patent related to the process for producing polymer filaments using electric charges appeared in 1934 [48]. In 1939, Formhals refined the previous method to give more drying time for the electrospun fibers [49-51]. In 1940, he patented another approach to produce composite fiber webs from multiple polymers and fiber substrates by electrostatically spinning polymer fibers on a moving base substrate [52]. In the 1960s, fundamental studies on the jet forming process
25 8 were initiated by Taylor. His finding was later referred to by other researchers as the Taylor Cone. In 1971, electrospun acrylic nanofibers with diameters ranging from 500 to 1100 nm were produced by Baumgarten [53]. However, it was not until two decades later that the great application potential of nanofibers in different areas has been realized [54]. Research on nanofibers gained a milestone with the work of Doshi and Reneker [55]. Recently, over 200 universities and research institutes were studying various aspects of the electrospinning process worldwide [60]. In Dzenis group, there is intensive ongoing research work on electrospinning, including process analysis and modeling, nanofiber testing and optimization, design, modeling, and experimental evaluation of nanofiber applications [56-59] Electrospinning Process A typical electrospinning process setup is shown in Figure 1.5. It consists of three major components: a high-voltage power supply, a spinneret (a metallic needle) and a collector (a grounded conductor) [61]. The polymer solution is contained in a syringe. In order to get a constant and controllable solution feed rate, a syringe pump should be used. The collector can be made of any shape for specific requirements, such as a flat plate, rotating drum, etc.
![9 Figure 1.5: A setup for electrospinning [61] The drop of polymer solution at the nozzle will become highly electrified, when a high voltage is applied.](/docs-images/74/71084066/images/26-0.jpg "The range of voltage is usually from 1 kv to 30 kv.")
26 9 Figure 1.5: A setup for electrospinning [61] The drop of polymer solution at the nozzle will become highly electrified, when a high voltage is applied. The range of voltage is usually from 1 kv to 30 kv. There are two types of electrostatic forces involved in electrospinning: the electrostatic Coulombic repulsion between the charges embedded in different jet segments and the guiding electric force applied by the external electric field [62-64]. When the strength of electric field reaches a critical value required to overcome the surface tension of the liquid, a jet of liquid is ejected from the nozzle. As the jet travels through the atmosphere, the solvent evaporates. As a result, a long and thin thread can be generated on the collecting device [65-67]. The charged fibers are often in a random nonwoven mat form. The following parameters and processing variables affect the electrospinning process [68]: (1) System parameters such as molecular weight, molecular-weight distribution and conformation (branched, linear, etc.) of the polymer and various properties of solution
27 10 like concentration, conductivity and surface tension. (2) Process parameters such as strength of applied electric field, feeding rate, concentration of polymer solution, distance between the needle and collector, needle gauge, spinning environment (temperature, humidity and air velocity in the chamber) and finally motion of target screen Mechanisms of Electrospinning Although the setup for electrospinning is straightforward, the spinning mechanism is rather complicated [61]. As the techniques improved, recent experimental observations demonstrated that the thinning of a jet during electrospinning is mainly caused by the bending instability [72-75]. However, before 1999, it was believed that a single jet splitting or splaying into multiple thin fiber filaments due to radial charge repulsion was the spinning mechanism [69-71]. Figure 1.6A illustrates the photograph of a spinning jet [76]. It shows that the jet flew away from the droplet in a nearly straight line and then became unstable. The instability region appears to be composed of multiple jets that led early researchers to believe that the original liquid jet splits into multiple branches. Figure 1.6B establishes however that the conical envelope contains only a single bending thread [77]. This photo was taken by using high-speed photography, while conventional photography (Fig. 1.6A) could not properly resolve this due to high velocities of the moving bent jet segments [61].
![11 Figure 1.6: Photographs illustrating the instability region of an electrospun liquid jet [61]. The capture time was on two different time scales: A. 1/250 s, and B. 18 ns, respectively. 1.4.](/docs-images/74/71084066/images/28-0.jpg "4 Advantages of Electrospinning Compared to most bottom-up methods, the major advantage of this top-down process is relatively low cost. The resulting nanofibers are often uniform and continuous.")
28 11 Figure 1.6: Photographs illustrating the instability region of an electrospun liquid jet [61]. The capture time was on two different time scales: A. 1/250 s, and B. 18 ns, respectively Advantages of Electrospinning Compared to most bottom-up methods, the major advantage of this top-down process is relatively low cost. The resulting nanofibers are often uniform and continuous. Electrospinnging can be used to generate nanofibers from hundreds of polymers. So, this process has unique potential for producing cost-effective continuous nanofibers and manufacturing of two- and three-dimensional nanofiber assemblies [56]. 1.5 Electrospun Nanofibers Fiber mechanical properties are known to substantially improve with a decrease in the fiber diameter [79-83]. Nanofibers prepared by electrospinning are continuous fibers with diameters between 2 nm and 5000 nm. They are usually characterized by solid
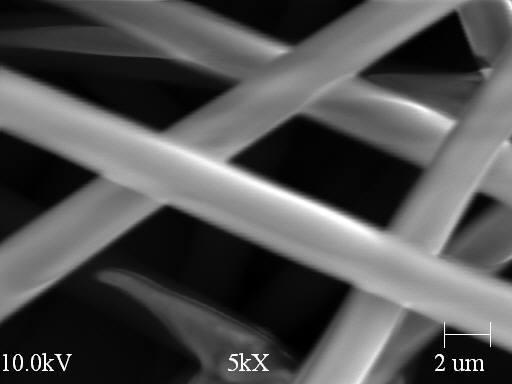
29 12 interior and smooth surface and are expected to possess high axial strength. Nanofibres provide a connection between the nanoscale world and the macroscale world, since their diameters are in the nanometer range and the length is continuous (i.e. theoretically infinite) [84]. At present, nanofibers are attracting very high interest (Figure 1.7) due to their remarkable micro and nano structural characteristics, high porosity and inherently large total surface area. Figure 1.7: Publication search on electrospun nanofiber/nanofibers from the Web of Science Figure 1.8 SEM images illustrate various types of electrospun nanofibers: (A) comparison of commercial advanced carbon fiber (one of the smallest advanced fibers) and electrospun continuous nanofibers, (B) vapor-grown carbon nanofibers, (C) uniform electrospun carbon nanofibers, (D) highly aligned nanofibers, (E) aligned and orthogonal nanofibers, (F) cross section of nanocrystalline zirconia nanofiber. [56]
![13 Figure 1.8: SEM images of nanofibers [56] 1.5.1 Applications of Electrospun Nanofibers Electrospun nanofibers are currently considered for a broad variety of applications.](/docs-images/74/71084066/images/30-0.jpg "The following applications are examples: Medical: artificial organ components, tissue engineering [85,86], implant material [87,88], drug delivery [89,90], wound dressing, medical textile materials.")
30 13 Figure 1.8: SEM images of nanofibers [56] Applications of Electrospun Nanofibers Electrospun nanofibers are currently considered for a broad variety of applications. The following applications are examples: Medical: artificial organ components, tissue engineering [85,86], implant material [87,88], drug delivery [89,90], wound dressing, medical textile materials. Protective materials: sound absorption materials, protective clothing [91,92] for chemical and biological warfare agents protection, sensor applications [93] for detecting chemical agents. Textile: sport apparels, sport shoes, climbing, rainwear, outerwear garments, baby diapers. Filtration (Figure 1.9): air, oil, fuel filters for automotive, filters for beverage, pharmacy, medical applications. [94] Energy generation: electrostatic dissipation, solar sails, electromagnetic interference shielding, photovoltaic device, fabrication of tiny electronic devices.
![14 [47] Figure 1.9: Application of nanofibers in filtration In limited laboratory studies to date, nanofibers have been used as reinforcement in composite materials.](/docs-images/74/71084066/images/31-0.jpg "Because of the high surface to volume ratio, use of nanofibers in composites may significantly increase the interaction between the fibers and the matrix material [73].")
31 14 [47] Figure 1.9: Application of nanofibers in filtration In limited laboratory studies to date, nanofibers have been used as reinforcement in composite materials. Because of the high surface to volume ratio, use of nanofibers in composites may significantly increase the interaction between the fibers and the matrix material [73]. In Dzenis group, nanofibers were applied as nanoreinforcement between plies of the traditional advanced composites laminates to improve interlaminar fracture toughness and suppress delamination (Figure 1.10). It was reported that nanofibers could significantly reinforce and toughen interfaces in advanced laminated composites [95].
![15 Figure 1.10: Nanoreinforcement between plies of the traditional composites laminates [95] 1.5.2 Aligned Electrospun Nanofibers Because of the jet bending instability, electrospun nanofibers are normally produced as randomly oriented structures in the form of nonwoven mats.](/docs-images/74/71084066/images/32-0.jpg "As discussed earlier, these nanofibers can be applied in many areas, such as: medical, textile, filtration, protective materials, and energy generation.")
32 15 Figure 1.10: Nanoreinforcement between plies of the traditional composites laminates [95] Aligned Electrospun Nanofibers Because of the jet bending instability, electrospun nanofibers are normally produced as randomly oriented structures in the form of nonwoven mats. As discussed earlier, these nanofibers can be applied in many areas, such as: medical, textile, filtration, protective materials, and energy generation. However, in many applications, such as composite reinforcement and device manufacture, highly ordered structures are desired. Recent studies have shown that aligned nanofiber sheets have improved mechanical properties compared to randomly oriented nanofibers [96-98]. Several approaches have been tried to generate aligned electrospun fibers, including: spinning onto a rotating drum or onto the sharp edge of a thin rotating wheel, using an auxiliary electrode or electrical field, quickly oscillating a grounded frame within the jet, and using a metal frame as a collector [99,100]. These methods still need to be further developed to optimize the degree of alignment. In Xia s group, a simple method for producing aligned nanofibers was demonstrated [101]. The grounded collector was
33 16 replaced by two conductive collectors separated by a gap as shown in Figure Figure 1.11: Setup for generating aligned nanofibers [101] The mechanism of alignment in the latter method can be ascribed to electrostatic interactions [102]. The gap changes the structure of the external electric field and creates electrostatic forces promoting jet segment orientation and resulting in nanofibers spanning the gap Mechanical Properties of Nanofibers, Nanofiber Assemblies, and Nanofiber Reinforced Composites Mechanical properties of nanofibers are important for many applications. So far, most studies focused on bundles of nanofibers [108]. Only limited numbers of studies were conducted on individual nanofibers.

34 17 In general, it can be expected that nanofiber strength and modulus would increase with their diameter decrease. This is due to better structural alignment and reduced size and probability of flaws in finer fibers. In most structural materials and fibers, the properties of strength and toughness are mutually exclusive [109]. Usually, increased strength is accompanied with decreased toughness. In a recent breakthrough from Dzenis group, it was shown that nanofibers toughness can also increase [108]. Figure 1.12 compares strength and toughness of as-spun PAN nanofibers with properties of some commercial and developmental fibers and structural materials [108]. It can be seen that the properties of most structural materials and fibers are within the shaded area, showing the trade-off relationship between strength and toughness. Ultrafine electrospun nanofibers exhibited extremely high strength, modulus and toughness simultaneously. (The arrow color density indicates nanofiber diameter values.) This discovery has high potential for structural and composite applications of nanofibers. Figure 1.12: Comparison of specific strength and specific energy to failure of as-spun
35 PAN nanofibers (diamonds) with typical values for commercial and developmental fibers and materials [108] 18 Despite the importance, mechanical properties of nanofiber networks and nanofiber reinforced composites have not yet been systematically studied. Mechanical behavior of networks, although builds on single fiber properties, is much more complex as it may involve several non-linear effects such as evolution of nanofiber orientation, contact and nanofiber breaks accumulation, etc. This behavior needs to be better understood for nanofiber applications. 1.6 Summary and Problem Formulation Electrospinning provides a simple, straightforward, effective method for producing continuous nanofibers. Electrospun nanofibers have attracted large attention in recent years, due to their remarkable micro and nano structural characteristics, high porosity and inherently large total surface area. They are being considered for many applications including medical, textile, filtration, protective materials, and energy generation. Research interest in aligned oriented nanofibers is growing because of the requirements for highly ordered nanofiber assemblies in many applications. However, reaching high alignment degree is still a big challenge for electrospinning and nanofiber researchers. Also, there is limited published work focused on mechanical properties of nanofiber mats and no comparative studies of random and aligned nanofiber
36 19 assemblies have been found in the literature. Mechanical properties of nanofibers and nanofiber reinforced composites are important for most applications and need to be better understood. So far, there was no systematic experimental study of nanofiber composites. In particular, there have been no studies on their anisotropic fracture properties. Based on the review above, the following objectives of this research were formulated: Fabricate continuous, uniform diameter ployacrylonitrile (PAN) nanofibers using electrospinning technique. Study effects of electrospinning process parameters on nanofiber diameter, uniformity, and orientation. Analyze and compare mechanical behavior of single nanofibers, and aligned and random nanofiber networks. Investigate fracture properties of aligned and random nanofiber reinforced nanocomposites.
37 20 CHAPTER 2 PAN NANOFIBER MANUFACTURING There are several parameters affecting electrospinning process. In order to find the optimal manufacturing conditions for electrospinning, we need to better understand the effects of these parameters. In this chapter, fine, continuous, uniform diameter ployacrylonitrile (PAN) nanofibers without beads were manufactured using electrospinning technique. The effect of the electrospinning process parameters on PAN nanofiber diameter was analyzed systematically experimentally. 2.1 Experimental PAN Solution Preparation Because of its good properties, PAN is one of the most extensively used polymers in many areas such as in composite fabrics and materials, tissue engineering, protective clothing, filtration, and biomedical application [43]. In this study, PAN solution was prepared by mixing PAN powder with dimethylformamide (DMF). Both PAN and DMF were products of SIGMA-ALDRICH with product numbers and D
. Figure 2.1: DMF solution (left) and PAN powder (right)")
38 21 Average molecular weight of PAN was 150,000. Solutions were prepared in the range of concentrations from 6% to 16%. Corning stirrer hot plate with stirring-level 5 and heating-level 2.5 was used and mixing duration was 12 hours. The well dissolved solutions were transparent and had a light yellow color as shown in Figure 2.2(b). Figure 2.1: DMF solution (left) and PAN powder (right)
 before stirring and heating; (b) after mixing (b) 2.1.")


39 22 (a) Figure 2.2: PAN solution: (a) before stirring and heating; (b) after mixing (b) Electrospinning Setup The basic setup for electrospinning consists of three major components: a highvoltage power supply, a spinneret and a collector. The spinneret is connected to syringe in which the polymer solution is hosted. With the use of a syringe pump, the solution can be fed through the spinneret at a constant and controllable rate. In this study, the setup included a direct current (DC) power supply, a high voltage transformer, a syringe with a metallic needle, and a large aluminum plate collector

40 23 (Figure 2.3). The DC supply was connected to high voltage transformer with the output voltage ranging from 0 to 30 kv. Positive high voltage source was used to charge the spinneret, whereas the negative voltage was used to charge the collector. The range of applied voltage in this study was from 7 kv to 20 kv. The distance between the spinneret and the collector was 24 cm. The feed rate of the solution was kept constant at 5 ml/h using the controlled syringe micropump. Figure 2.3: Electrospinning setup 2.2 Evaluation of Electronspun Nanofiber Morphologies Nanofiber morphologies were examined by scanning electron microscopy (JEOL JSM-840A SEM).

41 SEM Sample Preparation A piece of nanofiber sheet was adhered onto the SEM stage with conductive tape (Figure 2.4). To observe nanofiber clearly, a thin gold layer was deposited on the surface of each nanofiber sample. Figure 2.4: SEM samples SEM Images
")


42 25 (a) (b)
")


43 26 (c) (d)
")


44 27 (e) (f)


 8kV; (b)")
 11kV; (e)")
45 Figure 2.5: SEM images of 10% PAN nanofibers manufactured in (a) 8kV; (b) 9kV; (c) 10kV; (d) 11kV; (e) 12kV; (f) 13kV 28 (a)
")


46 29 (b) (c)
")


47 30 (d) (e)


 9kV; (b)")
 12kV; (e)")
48 31 (f) Figure 2.6: SEM images of 11% PAN nanofibers manufactured in (a) 9kV; (b) 10kV; (c) 11kV; (d) 12kV; (e) 13kV; (f) 14kV
")

49 32 (a) (b)


50 33 (c) Figure 2.7: SEM images of 12% PAN nanofibers manufactured in (a) 8kV; (b) 9kV; (c) 10kV
")


51 34 (a) (b)
")


52 35 (c) (d)


 11kV;")
")
53 36 (e) Figure 2.8: SEM images of 13% PAN nanofibers manufactured in (a) 11kV; (b) 12kV; (c) 13kV; (d) 14kV; (e) 15kV
")

54 37 (a) (b)
")


55 38 (c) (d)
56 Figure 2.9: SEM images of 14% PAN nanofibers manufactured in (a) 9kV; (b) 10kV; (c) 11kV; (d) 12kV Electrospinning Parameters There are several parameters which can effect on the electrospinning process and resulting nanofibers. These include distance between the needle and collector, solution feed rate, solution concentration and applied voltage. Nanofiber diameter can vary depending on the nanomanufacturing conditions Spinnability and Diameter of PAN Nanofibers in Different Manufacturing Conditions In this study, two parameters were fixed. One was the distance between needle and collector which was 24 cm. Another was PAN solution feed rate which was 5 ml/h. Two parameters were varied. The PAN solution concentration varied form 6 % to 16 % and the applied voltage varied from 7 kv to 20 kv. Spinnability and diameters of electrospun PAN nanofibers produced in different manufacturing conditions are summarized in Table 2.1. Average diameters with standard deviations are shown in Table 2.2 to Table 2.6 respectively. And computed diameter distributions are shown in Appendix.
57 40 Table 2.1: Spinnability and diameters of electrospun PAN nanofibers fabricated using different manufacturing conditions
.")
![It has been stated that the formation of beads is influenced mainly by the viscoelasticity of the solution, charge density carried by the jet, and the surface tension of the solution [110].](/docs-images/74/71084066/images/58-1.jpg "Figure 2.10: Beaded electrospun PAN nanofibers 8kV 9kV 10kV 11kV 12kV 13kV Diameter (nm) 680 1370 730 590 480 830 Standard Deviation 50 460 130 110 60 210 Table 2.")
58 41 In the Table 2.1, Difficult to collect means liquid jet could not reach the collector due to the low applied voltage. When applied voltage was too high, fluffy fibers were observed. When fibers had some beads as illustrated in Figure 2.10, we considered the fibers to be not good (for our study). It has been stated that the formation of beads is influenced mainly by the viscoelasticity of the solution, charge density carried by the jet, and the surface tension of the solution [110]. Figure 2.10: Beaded electrospun PAN nanofibers 8kV 9kV 10kV 11kV 12kV 13kV Diameter (nm) Standard Deviation Table 2.2: Diameter and standard deviation of 10% PAN nanofibers manufactured with different applied voltage
59 42 9kV 10kV 11kV 12kV 13kV 14kV Diameter (nm) Standard Deviation Table 2.3: Diameter and standard deviation of 11% PAN nanofibers manufactured with different applied voltage 8kV 9kV 10kV Diameter (nm) Standard Deviation Table 2.4: Diameter and standard deviation of 12% PAN nanofibers manufactured with different applied voltage 11kV 12kV 13kV 14kV 15kV Diameter (nm) Standard Deviation Table 2.5: Diameter and standard deviation of 13% PAN nanofibers manufactured with different applied voltage
60 Diameter of 10% PAN Nanofiber (nm) 43 10kV 11kV 12kV 13kV Diameter (nm) Standard Deviation Table 2.6: Diameter and standard deviation of 14% PAN nanofibers manufactured with different applied voltage Effects of Electrospinning Parameters on Nanofiber Diameter Applied Voltage We manufactured good quality PAN nanofibers with PAN solution concentrations ranging from 10% to 14% and found that when keeping other parameters constant, diameter of PAN nanofibers decreased when the applied voltage increased Voltage (kv) (a)
61 44 Diameter of 11% PAN Nanofiber (nm) Voltage (kv) (b) (c)
62 45 (d) (e) Figure 2.11: Effect of applied voltage on nanofiber diameter (a) 10% PAN; (b) 11% PAN; (c) 12% PAN; (d) 13% PAN; (e) 14% PAN
63 PAN Solution Concentration We manufactured good quality PAN nanofibers under applied voltage ranging from 9 kv to 13 kv and found that when keeping other parameters constant, diameter of PAN nanofiber increased as PAN solution concentration increased. (a)
64 47 (b) (c)
65 48 (d) (e) Figure 2.12: Effect of PAN solution concentration on nanofiber diameter (a) 9kV; (b) 10kV; (c) 11kV; (d) 12kV; (e) 13kV

66 Thermal Analysis of Electrospun Nanofibers Thermogravimetric analysis was used to determine residual solvent concentration in electrospun nanofibers. The Perkin-Elmer Pyris TGA-7 shown in Figure 2.13 was used for thermogravimetric analysis. Figure 2.13: The Perkin-Elmer Pyris TGA-7 The following testing method was used in this analysis: 1. Hold for 10 min at 25 C 2. Heat from 25 C to 100 C at 10 C/min 3. Heat from 100 C to 250 C at 2 C/min 4. Cool from 250 C to 25 C at 20 C/mi
67 50 We selected electrospun PAN nanofiber manufactured in 12 kv and with 10% PAN solution as our samples in this test. Manufacturing conditions are shown in Table 2.7. Because PAN nanofibers manufactured in these conditions have the smallest diameter and smallest standard deviation. According to the previous diameter studies, average diameter of the PAN nanofiber was 480 nm with standard deviation 58 nm. These selected electrospun PAN nanofibers with manufacturing conditions shown in Table 2.7 were further used in the experimental research described in Chapters 3 and 4 below. Distance between Needle and Collector Speed of Jet 24 cm 5 ml/h PAN Solution Concentration 10% Applied Voltage 12 kv Table 2.7: Manufacturing conditions of electrospun PAN nanofibers tested in TGA
68 51 Figure 2.14: SEM image of electrospun PAN nanofibers tested in TGA TG curves of as-spun electrospun PAN nanofibers recorded in nitrogen atmosphere are shown in Figure (a)
69 52 (b) Figure 2.15: TGA curves of selected electrospun PAN nanofibers (c) The average weight percentage of solvent is 3.69% with standard deviation 0.05% as shown in Figure There are 3.69% solvent (DMF) in PAN as-spun nanofibers. So, the portion of PAN is 100% % = 96.31%. Therefore, we can find that the PAN nanofiber has extremely small amount of residual solvent (DMF).
70 Conclusions In this chapter, continuous, uniform diameter PAN nanofibers were manufactured using electrospinning technique. Systematic experimental studies of the effects of process parameters on nanofiber spinnability and diameter were conducted. Range of parameters producing good quality fibers was identified. The following conclusions are drawn based on these studies: Higher applied voltage and lower PAN solution concentration produced electrospun nanofibers with smaller diameters. Thermal analysis showed that a small amount of solvent (3.69%) was present in PAN nanofibers. Best processing conditions were selected for the subsequent studies described in the following chapters.
71 54 CHAPTER 3 PAN NANOFIBER NETWORKS 3.1 Aligned Nanofibers Manufacturing In many applications, well aligned and highly ordered materials are required. It is therefore desirable to control the orientation of nanofibers. Our group has been involved in related research topics since Aligned nanofibers were successfully collected by several methods, including the gap method utilized further in this Chapter. In the gap method setup for manufacturing aligned PAN nanofibers, the single collector used in Chapter 2 was replaced by two plates (Figure 3.1). All other devices were the same as in the electrospnning setup for random PAN nanofibers production described in Chapter 2. An example of aligned PAN nanofibers is given in Figure 3.2.


72 55 Figure 3.1: Electrospinning setup for manufacturing aligned PAN nanofibers Figure 3.2: An example of aligned PAN nanofibers produced by the gap method
73 Effects of Electrospinning Parameters In this research, effects of two manufacturing parameters were investigated: one was collector gap size and another was manufacturing duration Effect of Collector Gap Size on Diameter and Orientation of Aligned Nanofibers The gap size between two collector parts can vary in the electrospinning process for manufacturing aligned nanofibers. In general, both diameters and orientation of nanofibers can be affected. Variation of these two outputs with the gap size is examined separately below Effect of Collector Gap Size on Aligned Nanofibers Diameter In this study, gap size between the two collector parts was varied in the range from 2cm to 6cm. All other process parameters were kept constant (Table 3.1). Resulting PAN nanofibers were examined by SEM, their diameters were measured, and diameter distributions computed.

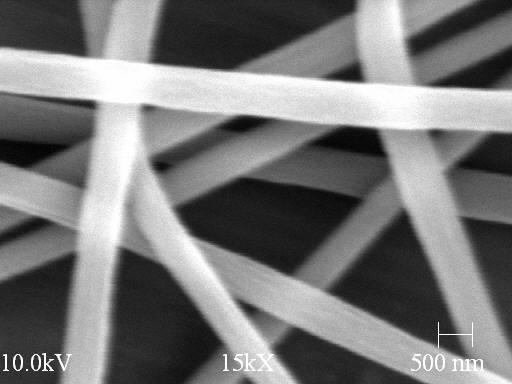
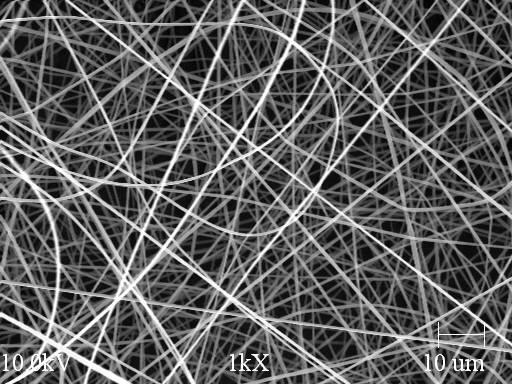
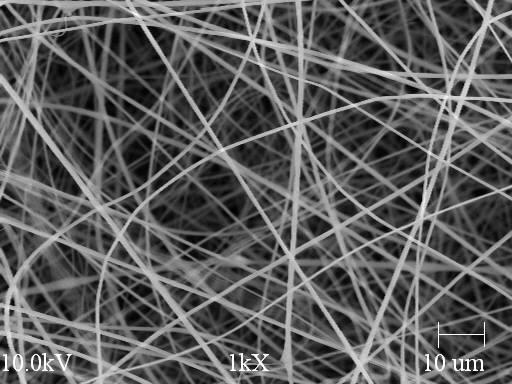
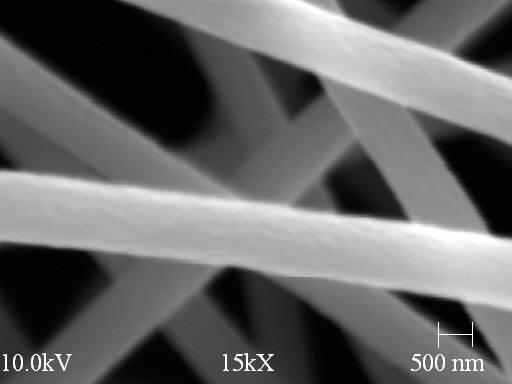
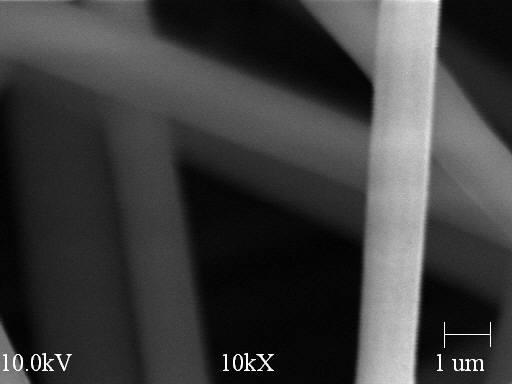
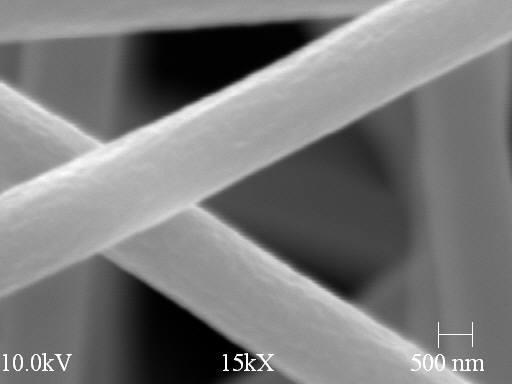
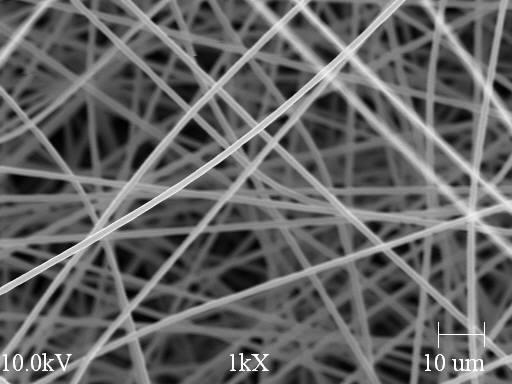
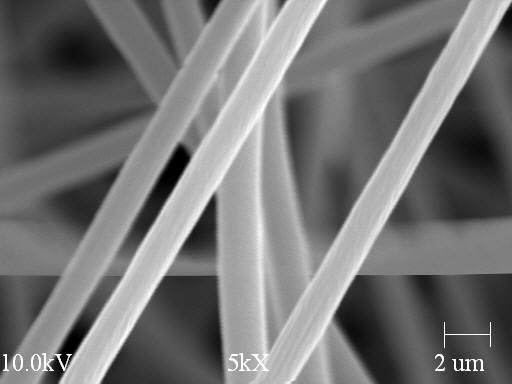
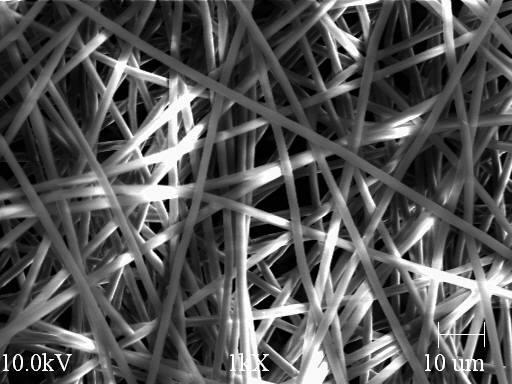
74 57 Distance between Needle and Collector Solution Feed Rate 24 cm 5 ml/h PAN Solution Concentration 10% Applied Voltage Manufacturing Duration Collector Gap Size 12 kv 1 hour 2 cm to 6 cm Table 3.1: Manufacturing conditions for aligned PAN nanofibers SEM images of aligned PAN nanofibers manufactured with different gap size are shown in Figures 3.3 to 3.7. More than 200 nanofibers were measured for diameters of each gap size. Computed diameter distributions are presented in Figures 3.8 to Figure 3.3: SEM images of aligned PAN nanofibers manufactured with 2cm gap size


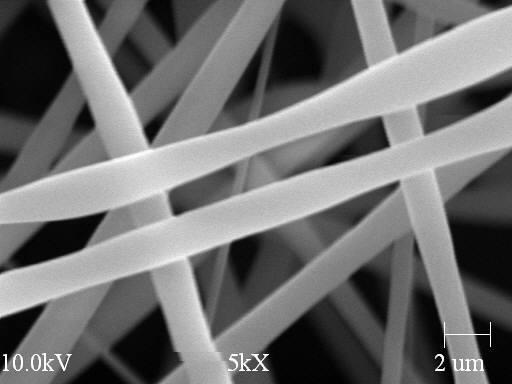
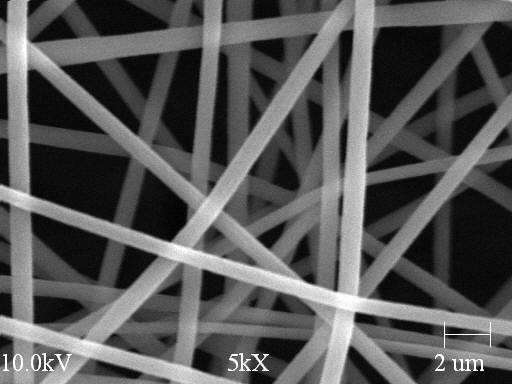
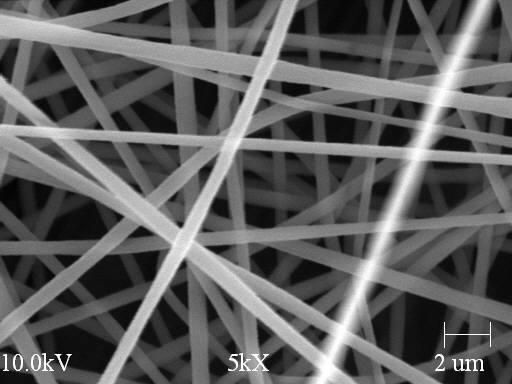
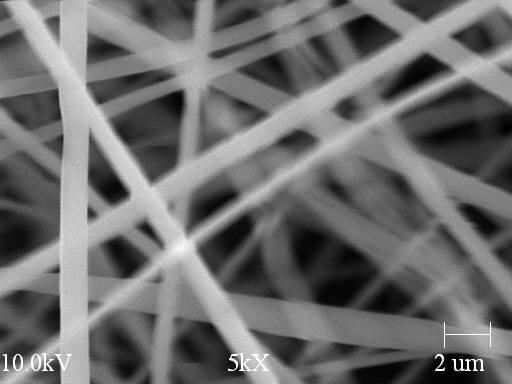
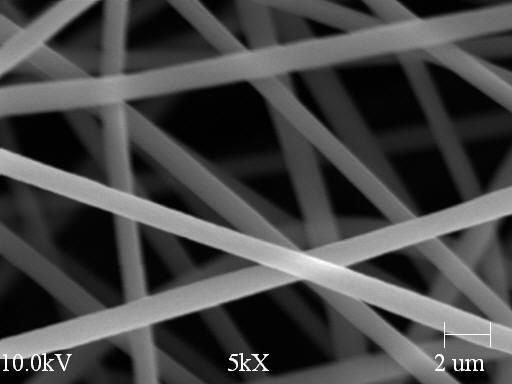
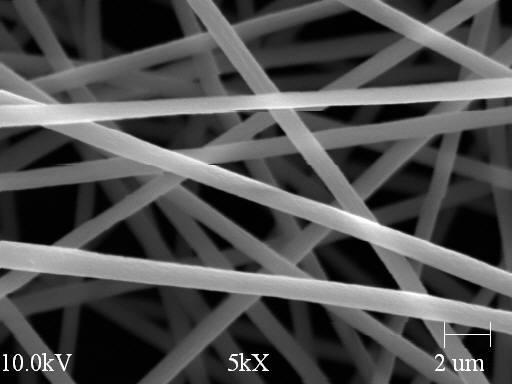
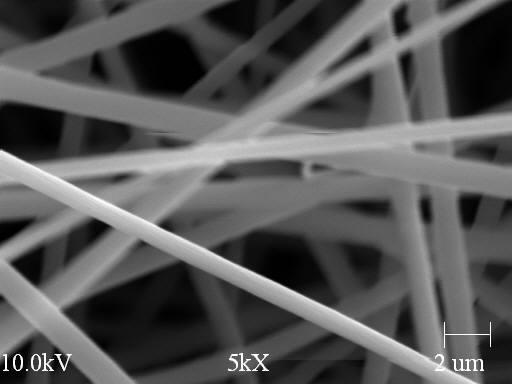
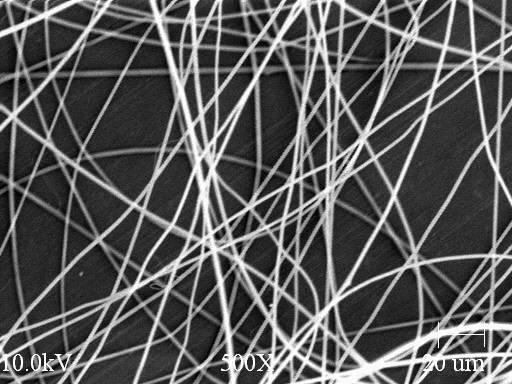
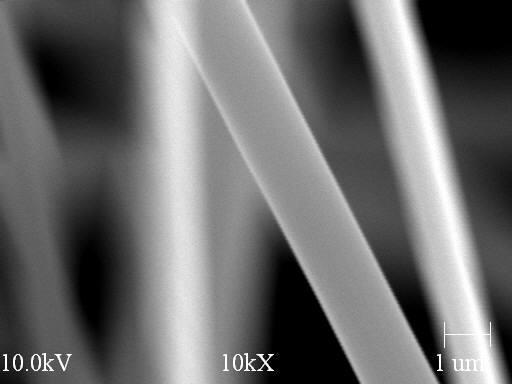
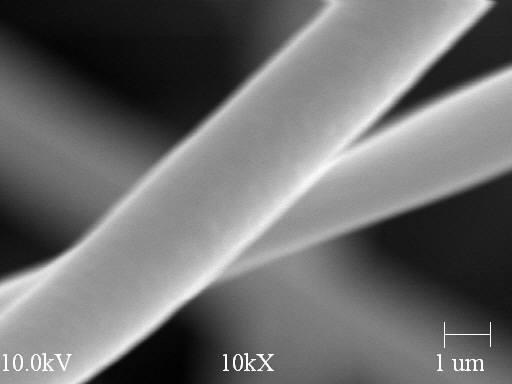
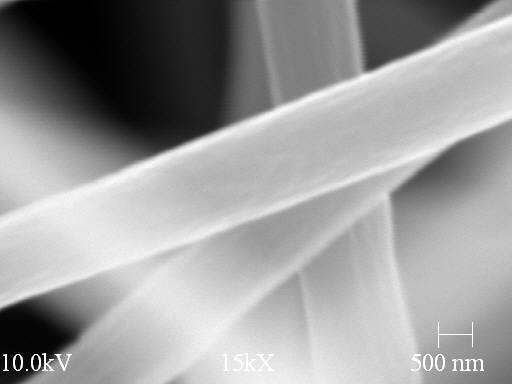
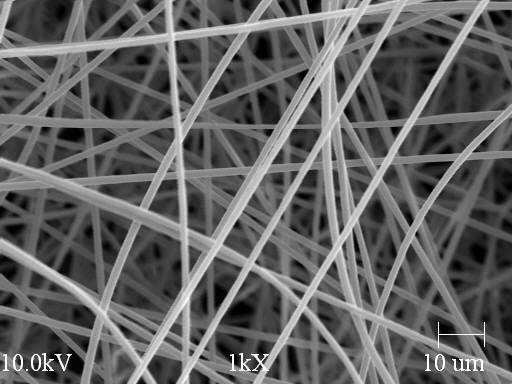
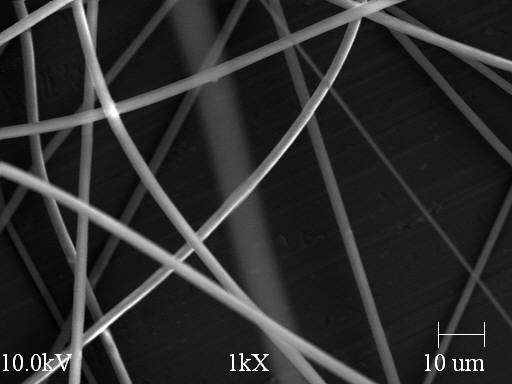
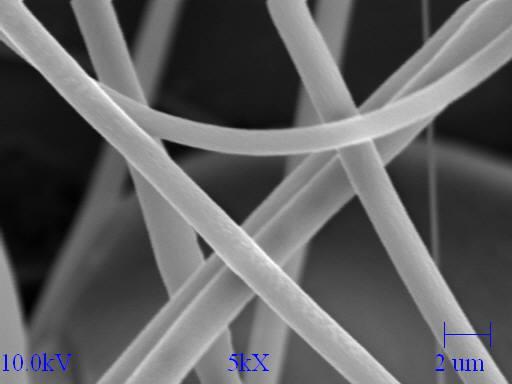
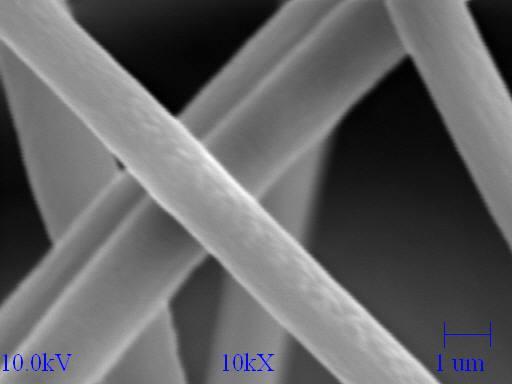
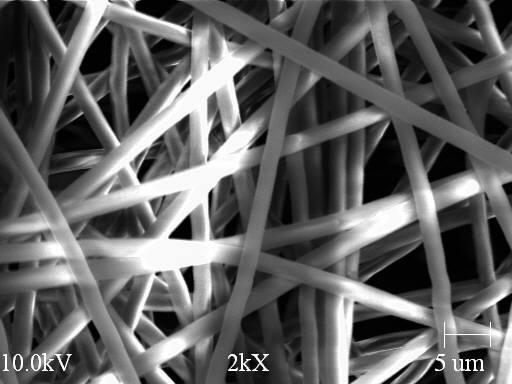
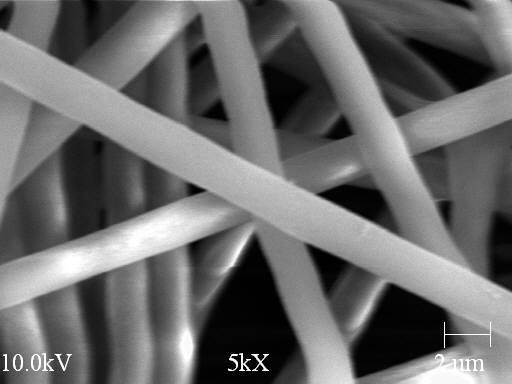
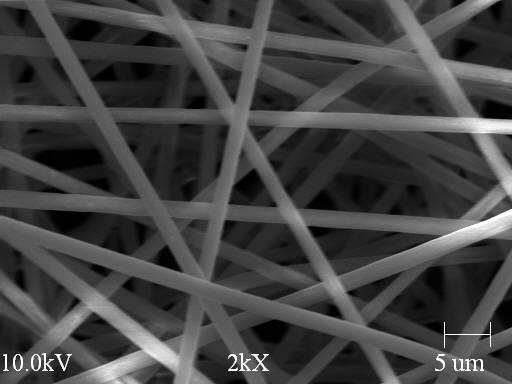
75 58 Figure 3.4: SEM images of aligned PAN nanofibers manufactured with 3cm gap size Figure 3.5: SEM images of aligned PAN nanofibers manufactured with 4cm gap size Figure 3.6: SEM images of aligned PAN nanofibers manufactured with 5cm gap size
 50 40 Amount (%) 30 20 10 0 400")
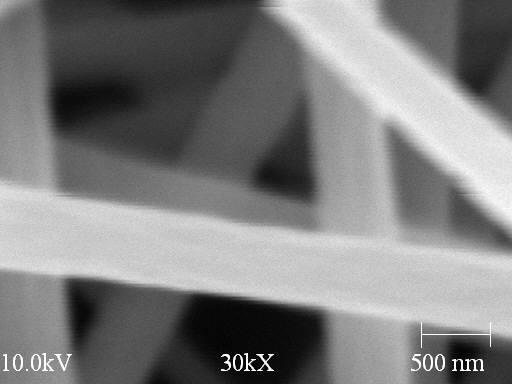
76 59 Figure 3.7: SEM images of aligned PAN nanofibers manufactured with 6cm gap size 60 Aligned PAN Nanofiber (2cm) Amount (%) Nanofiber Diameter (nm) Figure 3.8: Diameter distribution of aligned PAN nanofibers manufactured with 2cm gap size
77 60 60 Aligned PAN Nanofiber (3cm) Amount (%) Nanofiber Diameter (nm) Figure 3.9: Diameter distribution of aligned PAN nanofibers manufactured with 3cm gap size Aligned PAN Nanofiber (4cm) 30 Amount (%) Nanofiber Diameter (nm) Figure 3.10: Diameter distribution of aligned PAN nanofibers manufactured with 4cm gap size
78 61 60 Aligned PAN Nanofiber (5cm) Amount (%) Nanofiber Diameter (nm) Figure 3.11: Diameter distribution of aligned PAN nanofibers manufactured with 5cm gap size 50 Aligned PAN Nanofiber (6cm) 40 Amount (%) Nanofiber Diameter (nm) Figure 3.12: Diameter distribution of aligned PAN nanofibers manufactured with 6cm gap size
 630 640 760 810 850 Standard Deviation 150 110 300 70 90 Table 3.")
79 62 Average diameters and corresponding standard deviations are given in Table 3.2. As the gap size between the two collector parts increased, aligned nanofiber diameter increased (Figure 3.13). 2cm 3cm 4cm 5cm 6cm Diameter (nm) Standard Deviation Table 3.2: Average diameter and standard deviation of aligned PAN nanofibers manufactured with different gap size Figure 3.13: Diameter of aligned PAN nanofibers manufactured with different gap size Effect of Collector Gap Size on Aligned Nanofibers Orientation Distribution Various gap sizes produce different electric field distributions, which can result in different degrees of nanofiber alignment.

80 63 In the gap methods for manufacturing aligned nanofibers, two rectangular plates act as a collector. Most nanofibers would align between the two plates. To determine fiber orientation distribution, 0 degree was defined as shown below in Figure An example SEM image of aligned PAN nanofibers with the 0 direction indicated by an arrow is presented in Figure collectors 0 degree aligned nanofibers Figure 3.14: Schematic definition of 0 degree orientation of aligned nanofibers
81 64 0 degree Figure 3.15: An example of aligned PAN nanofibers with 0 degree direction indicated by an arrow SEM images similar to the one shown in Figure 3.15 were analyzed and orientation distributions of aligned PAN nanofibers manufactured with different gap size were calculated. For each gap size, more than 250 nanofibers were measured to get the orientation distribution. The results are presented in Figures 3.16 to Based on the analysis of SEM imagines, we found that nanofiber alignment increased with the increasing gap size. A quantitative evaluation of nanofiber alignment would be introduced in section
82 degree Amount (%) Theta (degree) Figure 3.16: SEM image and orientation distribution of aligned PAN nanofibers manufactured with 2cm gap degree Amount (%) Theta (degree) Figure 3.17: SEM image and orientation distribution of aligned PAN nanofibers manufactured with 3cm gap
83 degree Amount (%) Theta (degree) Figure 3.18: SEM image and orientation distribution of aligned PAN nanofibers manufactured with 4cm gap degree Amount (%) Theta (degree) Figure 3.19: SEM image and orientation distribution of aligned PAN nanofibers manufactured with 5cm gap
84 degree Amount (%) Theta (degree) Figure 3.20: SEM image and orientation distribution of aligned PAN nanofibers manufactured with 6cm gap Effect of Manufacturing Duration on Aligned Nanofiber Orientation Due to non-perfect conductivity of electrospun nanofibers, they carry residual charges after deposition onto collector. These residual charges will interact with the charges carried by the upcoming jets/fibers during continuous deposition. These charge interactions can disturb the static external electric field configuration and can reduce the resulting nanofiber alignment. So far, no published work was found to study the relationship between manufacturing duration and nanofiber alignment. SEM images of aligned PAN nanofibers manufactured in 1 hour and 2 hours are presented in Figure Comparison shows that when other parameters are kept constant, increased manufacturing duration results in significantly reduced alignment. Quantitative evaluation of nanofiber alignment will be performed in section

85 68 Distance between Needle and Collector Solution Feed Rate 24 cm 5 ml/h PAN Solution Concentration 10% Applied Voltage Manufacturing Duration Collector Gap Size 12 kv 1 hour & 2 hours, respectively 3 cm Table 3.3: Manufacturing conditions for aligned PAN nanofibers Figure 3.21: SEM image of aligned PAN nanofibers manufactured in 1 hour (left) and 2 hours (right) Calculation of Orientation Parameters [103,107] The orientation of fibers can be described by fiber orientation distribution function ( ). This function defined as the probability, P, of finding a fiber between 1 and 2 is given by
86 69 P( 2) 1 1 ( ) d In order to describe the orientation of nanofibers quantitatively, two orientation parameters were introduced: 2 f P 2 2 cos 1 g P 4 8 cos 3 / 5 where m m cos cos ( ) d m=2,4 0 These orientation parameters vary from f P = g P = 1 for perfect alignment of nanofibers to f P = g = 0 for random nanofiber distribution. P Orientation parameters, f P and g P, calculated based on experimental observations are shown in Table 3.4 and Table 3.5. Orientation parameters increased with the increasing gap size. Conversely, orientation parameters decreased with the increasing manufacturing duration. These results matched the qualitative observation on SEM images in and cm 3 cm 4 cm 5 cm 6 cm f P g P Table 3.4: f P and g P values of aligned nanofibers with different manufacturing gap size
87 70 Figure 3.22: f P values of aligned nanofibers with different manufacturing gap size Figure 3.23: g P values of aligned nanofibers with different manufacturing gap size 1 hour 2 hours f P g P Table 3.5: f P and g P values of aligned nanofibers with different manufacturing duration
88 Equivalent Thickness Measurement of Polymer Nanofiber Sheet The thickness of nanofiber sheets is in the micron scale. It is challenging to measure it as the nanofiber layer is soft and the boundaries of the sheet are not well defined for application of optical methods. At the same time, sheet thickness is necessary for evaluation of mechanical characteristics, such as average macroscopic stress. In this research, equivalent thickness of polymer layer was introduced and used for that purpose. This parameter was calculated using following equation: weight / area t PAN where t is equivalent (solid) thickness of PAN nanofiber sheet PAN is density of PAN powder weight/area ratio of aligned PAN nanofiber sheet manufactured in 1 hour was 0.778*10-6 g/mm 2 weight/area ratio of aligned PAN nanofiber sheet manufactured in 2 hours was 1.600*10-6 g/mm 2 Computed equivalent thickness of aligned nanofiber networks is presented in Table 3.6. These results were applied to determine cross-sectional area for stress analysis in the following tensile testing study.
89 72 1 hour 2 hours weight/area (g/mm 2 ) 0.778* *10-6 thickness (mm) 0.662* *10-3 Table 3.6: Weight/area and computed equivalent thickness of aligned PAN nanofibers manufactured during different durations 3.4 Mechanical Properties of PAN Nanofibers Tensile Testing The NANO UTM Testing System shown in Figure 3.24 was used in the tensile testing. This universal testing machine (UTM) provides a superior means of nanomechanical characterization. This state-of-the-art UTM offers high sensitivity over a large strain. Mechanical properties such as strain, tensile strength and yield stress, were captured. The system software allowed real-time experimental data analysis and visualization.

90 73 Figure 3.24: NANO UTM Testing System by Agilent Same loading conditions were applied in all tensile testing by using UTM, as shown in Table 3.7. Delta Extension for Data 0.01 mm Strain Rate 5*10-3 1/s Relaxation Hold Time Nominal Gage Length Tension Trigger Max. Strain 5 s 15 mm for networks 5 un 3 mm/mm Table 3.7: Loading conditions of UTM tests In the following study, single PAN nanofibers, aligned PAN nanofiber networks and random PAN nanofiber networks were tested to compare their mechanical properties.
91 Single PAN Nanofiber Testing Manufacturing conditions for single nanofiber are shown in Table 3.8. Distance between Needle and Collector Solution Feed Rate 24 cm 5 ml/h PAN Solution Concentration 10% Applied Voltage 12 kv Table 3.8: Manufacturing conditions for single PAN nanofiber 40 tests were applied to calculate the average and standard deviation. Strength (MPa) Young s Modulus (MPa) Toughness (MPa) Average Standard Deviation Table 3.9: Mechanical properties of single PAN nanofiber Strain-Stress curves:

92 75 Figure 3.25: Representative strain-stress curves of single PAN nanofibers SEM images were used to determine diameters of single nanofibers. (a)

93 76 (b) Figure 3.26: SEM images of single PAN nanofibers with diameters: (a) 420 nm (b) 375 nm As presented in Figure 3.27, strength of single nanofiber increased, when nanofiber diameter decreased. Figure 3.27: Effect of single nanofiber diameter on strength


94 Aligned PAN Nanofiber Network Testing In this study, aligned PAN nanofiber networks manufactured in 1 hour and 2 hours respectively were tested. These were the same networks in previous section Same manufacturing and testing conditions were applied for two types of nanofiber sheets. Figure 3.34 illustrates the process of tensile testing using UTM. Figure 3.28: Tensile testing of aligned PAN nanofibers Fiber Network Manufactured in 1 Hour Tensile testing results of aligned nanofiber network are presented in Table tests were applied to calculate the average and standard deviation. Strain-stress curves are
95 78 shown in Figure Strength (MPa) Young s Modulus (MPa) Toughness (MPa) Average Standard Deviation Table 3.10: Mechanical properties of aligned PAN nanofiber network manufactured in 1 hour Strain-Stress curves: Figure 3.29: Representative strain-stress curves of aligned PAN nanofiber network manufactured in 1 hour
96 Fiber Network Manufactured in 2 Hours Tensile testing results of aligned nanofiber network are presented in Table tests were applied to calculate the average and standard deviation. Strain-stress curves are shown in Figure Strength (MPa) Young s Modulus (MPa) Toughness (MPa) Average Standard Deviation Table 3.11: Mechanical properties of aligned PAN nanofiber network manufactured in 2 hours Strain-Stress curves:
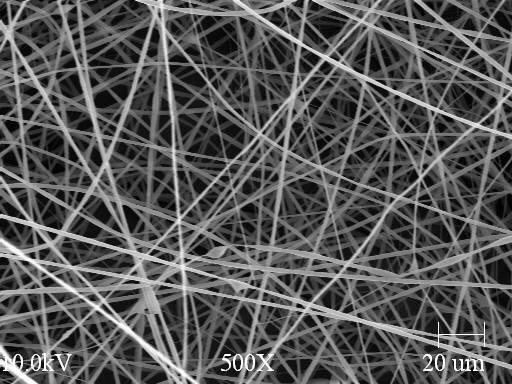
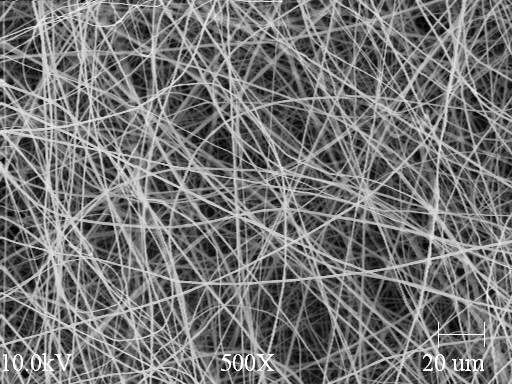
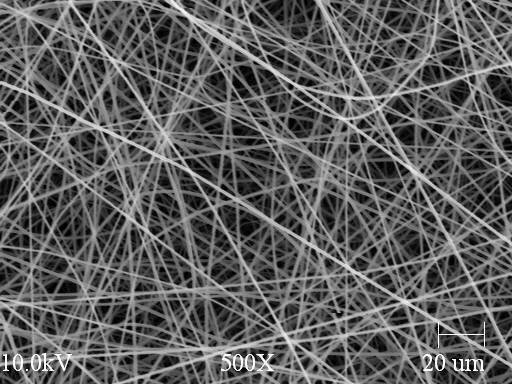
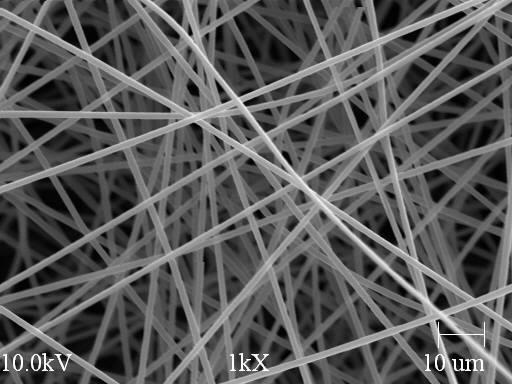
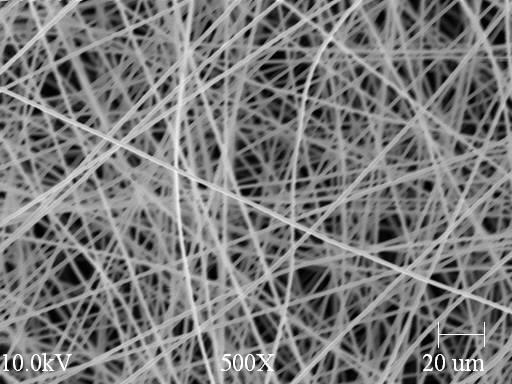
97 80 Figure 3.30: Representative strain-stress curves of aligned PAN nanofiber network manufactured in 2 hours Random Nanofiber Networks Manufacturing conditions for random nanofibers networks are shown in Table Manufacturing conditions were the same as for single nanofibers and aligned nanofiber networks fabrication. Distance between Needle and Collector Solution Feed Rate 24 cm 5 ml/h PAN Solution Concentration 10% Applied Voltage 12 kv Table 3.12: Manufacturing conditions for random PAN nanofiber network SEM images of tested random nanofiber network are shown in Figure Average diameter of nanofiber is 480 nm with standard deviation 60.


98 81 Figure 3.31: SEM images of random PAN nanofiber network Figure 3.32: Tensile testing of random PAN nanofiber network
99 82 Tensile testing results for random nanofiber network are presented in Table tests were applied to calculate the average and standard deviation. Strain-stress curves are shown in Figure Strength (MPa) Young s Modulus (MPa) Toughness (MPa) Average Standard Deviation Table 3.13: Mechanical properties of random PAN nanofiber network Strain-Stress curves: Figure 3.33: Representative strain-stress curves of random PAN nanofiber network
100 Comparison of Mechanical Properties of Nanofiber Networks Tensile testing results are presented in Table 3.14 for three types of nanofiber networks. Aligned nanofiber network manufactured in 1 hour has the highest value of strength and Young s modulus, while lowest value of toughness. On the contrary, random nanofiber network has the highest value in toughness, but lowest value in both strength and Young s modulus. Strength (MPa) Young s Modulus (MPa) Toughness (MPa) Aligned 1hour Aligned 2hours Random Table 3.14: Mechanical properties of aligned (manufactured in 1 hour and 2 hours) and random PAN nanofiber network Figure 3.34: Strength of aligned (manufactured in 1 hour and 2 hours) and random PAN
 and random PAN nanofiber network Figure 3.")
101 84 nanofiber network Figure 3.35: Young s Modulus of aligned (manufactured in 1 hour and 2 hours) and random PAN nanofiber network Figure 3.36: Toughness of aligned (manufactured in 1 hour and 2 hours) and random PAN nanofiber network
102 Conclusions In this chapter, aligned electrospun PAN nanofibers were manufactured using gap method. Effects of manufacturing parameters on nanofiber diameters and alignment were studied. Mechanical properties of single nanofibers and nanofiber networks were evaluated by tensile testing using NANO UTM nanomechanics testing system. Main conclusions are as follows: Smaller gap distance between two collectors resulted in smaller diameters of aligned nanofibers. Nanofiber alignment decreased with the gap size decrease or manufacturing duration increase. Aligned PAN nanofiber networks had highest mechanical strength and modulus along the fiber direction. However, random network exhibited highest toughness.
103 86 CHAPTER 4 PAN NANOFIBER REINFORCED COMPOSITES 4.1 Composites Manufacturing Materials In this study, nanofibers were used as nanoreinforcement in polymer composites. Epoxy Resin EPON 828 was used as a matrix for composite fabrication. This resin has extended curing cycle and moderate viscosity. Jeffamine D-400 was used as curing agent [29]. The weight ratio of EPON Resin 828 and Jeffamine D-400 was 5/3. For example, 5 g EPON Resin 828 mixed with 3 g Jeffamine D-400. Corning stirrer with stirring-level 1 and no heat was used for 30 minutes to mix the matrix components.

104 87 Figure 4.1: Jeffamine D-400 (left) and EPON Resin 828 (right) Molding Nanocomposites were manufactured by curing nanofiber sheets infiltrated by liquid epoxy resin. The process started with assembling a molding stack consisting of a layer of release film, infiltrated PAN nanofiber sheets, and another layer of release film. In this study, Teflon films were used as release films. Number of nanofiber sheets was 2 for random and 10 for aligned nanofiber reinforced composites. release film nanofiber sheets with matix release film

105 Curing Cycle The Hot-Press: CARVER (model 2699, S/N ; CARVER, INC) shown in Figure 4.2 was used for curing. Figure 4.2: Hot-Press: CARVER; model 2699, S/N In the manufacturing process, the following curing sequence was used. (1) Assemble the infiltrated nanofiber sheets and insert the stack into the hot-press. (2) Turn air and vacuum on to establish the contact pressure of 75 psi. (3) Set the temperature to 176 F. (4) When 176 F is reached, wait for 2 hours. (5) Ramp temperature to 248 F. (6) When 248 F is reached, wait for 2 hours. (7) Turn off the heat, air and vacuum.
106 89 (8) Remove the composite the next day PAN Nanofiber Reinforced Composites Aligned PAN Nanofiber Reinforced Composites In the aligned PAN nanofiber reinforced composites, aligned PAN nanofibers were used as reinforcement material. The manufacturing conditions for the aligned PAN nanofibers are shown in Table 4.1. Distance between Needle and Collector Solution Feed Rate 24 cm 5 ml/h PAN Solution Concentration 10% Applied Voltage Manufacturing Duration Collector Gap Distance 12 kv 1 hour 3 cm Table 4.1: Manufacturing conditions for aligned PAN nanofibers The molding stack for manufacturing aligned PAN nanofiber reinforced composites was: release film aligned nanofiber sheets with matix release film

107 An example of aligned PAN nanofiber reinforced composites is shown in Figure 4.3. The sample is a thin film (Average of thickness was mm), nearly transparent. 90 Figure 4.3: Example of aligned PAN nanofiber reinforced composites Random PAN Nanofiber Reinforced Composites In the random PAN nanofiber reinforced composites, random PAN nanofibers were used as reinforcement material. The manufacturing conditions of the random PAN nanofiber are shown in Table 4.2 below.
108 91 Distance between Needle and Collector Speed of Jet 24 cm 5 ml/h PAN Solution Concentration 10% Applied Voltage Manufacturing Duration 12 kv 30 min Table 4.2: Manufacturing conditions of random PAN nanofibers The molding stack for manufacturing random PAN nanofiber reinforced composites was: release film random nanofiber sheets with matix release film An example of random PAN nanofiber reinforced composite is shown in Figure 4.4. The sample was a thin film (Average thickness was mm), nearly transparent similar to the aligned PAN nanofiber reinforced composite shown previously in Figure 4.3.

109 92 Figure 4.4: Example of random PAN nanofiber reinforced composites 4.2 Evaluation of Fiber Mass Fraction: V m Fiber mass fraction is the weight of fiber in a cured composite. It is one of the most important factors which determine the mechanical characteristics of a composite material. In this research, the fiber volume fraction was calculated as: V m = (weight/area of nanofibers) / (weight/area of composites) Weight/area ratios for PAN nanofibers and composites were measured on at least twenty samples and average values were calculated. For aligned PAN nanofiber reinforced composites, the average weight/area of nanofibers was 7.778*10-6 g/mm 2, and the average weight/area of composites was
110 *10-4 g/mm 2. So, according to the formula, V m = 5.44% was obtained. For random PAN nanofiber reinforced composites, the average weight/area of nanofibers was 4.784*10-6 g/mm 2, and the average weight/area of composites was *10-4 g/mm 2. So, V m = 2.39% for random PAN nanofiber reinforced composites. In this study, aligned and random PAN nanofiber reinforced composites were manufactured under the same manufacturing conditions, however, aligned nanofiber reinforced composites had higher fiber mass fraction than random nanofiber reinforced composites. The difference is most likely due to the difference in packing density of the two nanofiber families. It was shown that aligned fibers have higher packing density (and volume fraction in composites) compared to random fibers. [104,105] 4.3 Fracture Analysis of PAN Nanofiber Reinforced Composites Opening or Peel Mode (Mode I), Forward Sliding Shear Mode (Mode II) and Tearing Mode (Mode III), are three basic fracture modes (Figure 4.5). Figure 4.5: Fracture modes
111 Double edge notch test [106] was used in this fracture analysis, which is Mode I test. The specimen in the test is shown in Figure Figure 4.6: Double edge notch test specimen [106] In this test, Critical Stress Intensity Factor K I can be calculated as K I a * F( a/ b) max where F( a / b) 2b a tan a 2b The stress is in the cross-section between two notches. I. Numerical values of F(a/b) Bowie s results (h/b = 3.0, mapping function method) have 1% accuracy and Yamamoto s results (h/b = 2.75, finite element method) have 0.5% accuracy for 0.2 < a/b
112 95 < 0.9 (Figure 4.7). (Bowie 1964a, Yamamoto 1972) II. Empirical Formulas The following review of empirical models lists the proposed formulas and presents brief evaluation of their a) Accuracy and b) Method of derivation and reference. F( a / b) 2b a tan a 2b a. Better than 5% for a/b > 0.4 b. Approximation by periodic crack solution, Irwin 1957 F 2 3 ( a / b) ( a / b) 1.197( a / b) 1.930( a / b) a. Better than 2% for a/b < 0.7 b. Least square fitting to Bowie s results, Brown ( a / b) 0.015( a / b) F( a / b) 1 a / b a. Better than 2% for any a/b b. Asymptotic Approximation, Benthem ( a / b) 3 F( a / b) ( cos a ) 2b 2b a tan a 2b 4 a. 0.5% for any a/b b. Modification of Irwin s interpolation formula, Tada 1973
. Specimens were cut by an extremely sharp scissors. Compare to Figure 4.6, in the specimen, a = 2 mm, b = 4 mm. A sample of testing specimen is shown in Figure 4.7 (right).")
113 ( a / b) 0.205( a / b) 0.471( a / b) F( a / b) 1 a / b a. 0.5% for any a/b b. Modification of Benthem s formula, Tada ( a / b) Selected Specimen Geometry and Data Reduction Method The specimen was designed as shown in Figure 4.7 (left). Specimens were cut by an extremely sharp scissors. Compare to Figure 4.6, in the specimen, a = 2 mm, b = 4 mm. A sample of testing specimen is shown in Figure 4.7 (right). 2 mm 8 mm 20 mm Figure 4.7: Specimen design of double edge notch test (left) and an experimental sample (right) For selected specimen with a = 2 mm and b = 4 mm, the value of F(a/b) was calculated as

114 97 F( a / b) 2b a tan a 2b 2(4) (2) tan (2) 2(4) 4 tan The value of Critical Stress Intensity Factor K I was further calculated as K I a * F( a/ b) max *(2*10 ) * F ( a/ b) 0. 3 max max Tensile Testing The tensile testing of nanofiber reinforcement composites specimens was performed using computerized MICROTEST 200N tensile stage (Figure 4.8) by Deben UK Limited. Figure 4.8: MICROTEST 200N tensile stage
115 98 In this tensile testing, four materials were studied. Aligned PAN nanofiber reinforced composites were tested in two directions, i.e. with fibers oriented along the loading direction (0-degree or [0]) and in the perpendicular to loading direction (90-degree or [90]). The other two materials were random PAN nanofiber reinforced composites and pure epoxy made with the matrix used in of composites (Average thickness was mm.) Fracture Properties of Testing Materials Fracture strength, Young s modulus and critical stress intensity factor were obtained from the tests [0] nanocomposites At least 20 samples were tested to obtain average of fracture strength, Young s modulus and critical stress intensity factor. Fracture Strength (MPa) Young s Modulus (MPa) Critical Stress Intensity Factor (MPa*m 1/2 ) Average Standard Deviation Table 4.3: Fracture properties of [0] nanocomposites
116 99 Strain-stress curves of [0] nanocomposites (Figure 4.9) are shown below. Figure 4.9: Representative strain-stress curves of [0] nanocomposites [90] nanocomposites At least 20 samples were tested to obtain average of fracture strength, Young s modulus and critical stress intensity factor.
117 100 Fracture Strength (MPa) Young s Modulus (MPa) Critical Stress Intensity Factor (MPa*m 1/2 ) Average Standard Deviation Table 4.4: Fracture properties of [90] nanocomposites Strain-stress curves of [90] nanocomposites (Figure 4.10) are shown below.
118 101 Figure 4.10: Representative strain-stress curves of [90] nanocomposites Random Nanofiber Reinforced Composites At least 20 samples were tested to obtain average of fracture strength, Young s modulus and critical stress intensity factor. Fracture Strength (MPa) Young s Modulus (MPa) Critical Stress Intensity Factor (MPa*m 1/2 ) Average Standard Deviation Table 4.5: Fracture properties of random nanofiber reinforced composites Strain-stress curves of random nanofiber reinforced composites (Figure 4.11) are shown below.
119 102 Figure 4.11: Representative strain-stress curves of random nanofiber reinforced composites
120 Pure Epoxy At least 20 samples were tested to obtain average of fracture strength, Young s modulus and critical stress intensity factor. Fracture Strength (MPa) Young s Modulus (MPa) Critical Stress Intensity Factor (MPa*m 1/2 ) Average Standard Deviation Table 4.6: Fracture properties of pure epoxy Strain-stress curves of pure epoxy (Figure 4.12) are shown below.
121 104 Figure 4.12: Representative strain-stress curves of pure epoxy Data Summary and Analysis All data for fracture poperties of four materials are listed in Table 4.7 below. [0] nanofiber reinforced composite had the highest fracture properties of the four materials, i.e. it had the highest value of fracture strength, Young s modulus and critical stress intensity factor. However, the same composite tested in 90 direction (labeled [90] nanofiber reinforced composite) exhibited the lowest mechanical properties. This is similar to the existing advanced composites reinforced with conventional fibers. Their high mechanical anisotropy necessitates their application in the form of stacked composite laminates with unidirectional reinforced plies. Similar approach might be used with aligned nanofiber composites. Significant mechanicanical anisotropy of aligned nanofiber composites is demonstrated in this work for the first time. Random nanofiber reinforced composite had the second highest property values, which were better than the properties of the pure epoxy matrix. Note that the mass fraction of nanofibers was very low in all nanofiber composites tested, compared to the typical high fraction of fibers in conventional composites. This
122 105 indicates that mechanical properties of nanofiber composites can be further significantly improved. In addition, use of optimized nanofibers such as the nanofibers with simultaneously high strength, modulus, and toughness that were recently developed by Dzenis group, holds further promise for high-performance nanofiber reinforced composites. Fracture Strength (MPa) Young s Modulus (MPa) Critical Stress Intensity Factor (MPa*m 1/2 ) [0] [90] Random Pure Epoxy Table 4.7: Fracture poperties of [0] nanocomposites, [90] nanocomposites, random nanofiber reinforced composites and pure epoxy
123 106 Figure 4.13: Fracture strength of [0] nanocomposites, [90] nanocomposites, random nanofiber reinforced composites and pure epoxy Figure 4.14: Young s Modulus of [0] nanocomposites, [90] nanocomposites, random nanofiber reinforced composites and pure epoxy
124 107 Figure 4.15: Critical stress intensity factor of [0] nanocomposites, [90] nanocomposites, random nanofiber reinforced composites and pure epoxy SEM Images of Fracture Surface SEM images of facture surface of [0] nanocomposites, [90] nanocomposites and random nanofiber reinforced composites are given in Figure 4.16 (a), (b); Figure 4.17 (a), (b) and Figure 4.18 (a), (b), respectively. Figure 4.16 (a) shows nanofibers oriented perpendicular to fracture surface while Figure 4.17 (a) shows nanofibers mostly perpendicular to the fracture surface. SEM images of random nanofiber composite shown in Figure 4.18 (a) contain a mixture of nanofibers with different orientation. In Figure 4.16 (b), Figure 4.17 (b) and Figure 4.18 (b), one can find that some nanofibers were pulled out from the matrix -- a possible mechanism of toughening.


![of [0]](/docs-images/74/71084066/images/125-3.jpg)
125 108 (a) Figure 4.16: SEM images of fracture surface of [0] nanocomposites (b)


![of [90]](/docs-images/74/71084066/images/126-3.jpg)
126 109 (a) Figure 4.17: SEM images of fracture surface of [90] nanocomposites (b)


127 110 (a) (b) Figure 4.18: SEM images of fracture surface of random nanofiber reinforced composites 4.4 Conclusions In this chapter, aligned and random PAN nanofiber reinforced composites were manufactured under the same manufacturing conditions. Fiber mass fraction was measured. Tensile tests were performed to investigate fracture properties of nanofiber reinforced composites. Main conclusions are as follows: Aligned PAN nanofiber reinforced composites had higher value of fiber mass fraction compared to random nanofiber composites. PAN nanofibers significantly increased mechanical properties of nanocomposites, especially along the fiber direction. All three measured mechanical parameters, i.e. strength, modulus, and critical stress intensity factor were the highest for the aligned sample in the fiber direction. Mechanical properties in the perpendicular to fiber direction were inferior to those
Centrifugal spinning of nanofiber webs - A parameter study of a novel spinning process
 Centrifugal spinning of nanofiber webs - A parameter study of a novel spinning process Jonas Engström Senior scientist at Swerea IVF. Finished his PhD in 2006 with a thesis titled Functional compolymers
Nanodiamond-Polymer Composite Fibers and Coatings
 Nanodiamond-Polymer Composite Fibers and Coatings Yury Gogotsi et al. A.J. Drexel Nanotechnology Institute and Department of Materials Science and Engineering Drexel University, Philadelphia, Pennsylvania
Manipulation of the electric field of electrospinning system to produce polyacrylonitrile nanofiber yarn
 Manipulation of the electric field of electrospinning system to produce polyacrylonitrile nanofiber yarn Date Submitted 22 December 2005, Date Accepted 15 June 2006 F. Dabirian 1, Y. Hosseini 2 and S.
Comparison between Electrospun and Bubbfil-spun Polyether Sulfone Fibers
 ISSN 1517-7076 artigo 11564 pp.363-369, 2014 Comparison between Electrospun and Bubbfil-spun Polyether Sulfone Fibers Ya Li 1,2, Rou-xi Chen 1,2, Fu-Juan Liu 1,2 1 National Engineering Laboratory for Modern
Fiber spinning of biopolymers containing nanowhiskers : Possibilities and challenges
 Fiber spinning of biopolymers containing nanowhiskers : Possibilities and challenges Aji P. Mathew and Kristiina Oksman Wood and Bionanocomposites, Division of Materials Science Luleå University of Technology,
ELECTROSPUN NANOFIBER PROCESS CONTROL
 CELLULOSE CHEMISTRY AND TECHNOLOGY Received April 26, 2010 ELECTROSPUN NANOFIBER PROCESS CONTROL University of Guilan, P.O. Box 3756, Rasht, Iran Fiber diameter is an important structural characteristic
CNT Reinforced Nanocomposite Fiber Fabrication for Undergraduate Students
 CNT Reinforced Nanocomposite Fiber Fabrication for Undergraduate Students 1 Asmatulu, R., 1 Khan, W., and 2 Yildirim, M.B. Abatract 1 Department of Mechanical Engineering, Wichita State University 1845
Supporting Information
 Electronic Supplementary Material (ESI) for Nanoscale. This journal is The Royal Society of Chemistry 2018 Supporting Information High performance electronic devices based on nanofibers via crosslinking
Effect of Target Shapes on Distribution of Polyacrylonitrile Nanofibers Prepared by Electrospinning Process
 109 Effect of Target Shapes on Distribution of Polyacrylonitrile Nanofibers Prepared by Electrospinning Process Bussarin Ksapabutr *, Chaowat Waikru and Manop Panapoy Department of Materials Science and
Investigation into Electrospun LaMnO 3 Nanofibres
 Universities Research Journal 2011, Vol. 4, No. 4 Investigation into Electrospun LaMnO 3 Nanofibres Zin Min Myat 1, Than Than Win 2 and Yin Maung Maung 3 Abstract This paper aims to prepare nanofibres
ELECTROSPINNING OF POLYACRYLONITRILE NANOFIBERS. by Sandip Basu
 ELECTROSPINNING OF POLYACRYLONITRILE NANOFIBERS by Sandip Basu Department of Textile Technology Submitted in fulfilment of the requirements of the degree of Doctor of Philosophy to the Indian Institute
Electret Polyvinylidene Fluoride Nanofibers Hybridized by Polytetrafluoroethylene Nanoparticles for High-Efficiency Air Filtration
 Supporting Information Electret Polyvinylidene Fluoride Nanofibers Hybridized by Polytetrafluoroethylene Nanoparticles for High-Efficiency Air Filtration Shan Wang,,, Xinglei Zhao,,, Xia Yin,*,, Jianyong
Micro/Nano Mechanical Systems Lab Class#16
 Microsystems Laboratory Micro/Nano Mechanical Systems Lab Class#16 Liwei Lin Professor, Dept. of Mechanical Engineering Co-Director, Berkeley Sensor and Actuator Center The University of California, Berkeley,
Nanofibers and Nanocomposites for aerospace applications. Prof. Yuntian Zhu Dept. of Materials Science and Engineering
 Nanofibers and Nanocomposites for aerospace applications Prof. Yuntian Zhu Dept. of Materials Science and Engineering 20µm NC STATE UNIVERSITY Nano for Safety and Environment Nanofiber Filtration: Clean
Catherine G. Reyes, Anshul Sharma and Jan P.F. Lagerwall. July 18, Complete description of experimental details
 Non-electronic gas sensor from electrospun mats of liquid crystal core fibers for detecting volatile organic compounds at room temperature: Supplemental Online Material Catherine G. Reyes, Anshul Sharma
Hydrodynamics of Drop Impact and Spray Cooling through Nanofiber Mats
 Hydrodynamics of Drop Impact and Spray Cooling through Nanofiber Mats Y. Chan Department of Chemical Engineering, University of Massachusetts Amherst, Amherst, MA 01003 F. Charbel Department of Mechanical
HIGH THROUGHPUT NANOFIBER PRODUCTION BY ROTATION- AIDED NEEDLELESS ELECTROSPINNING Kolos Molnár 1,2*, Tibor Czigány 1,2
 HIGH THROUGHPUT NANOFIBER PRODUCTION BY ROTATION- AIDED NEEDLELESS ELECTROSPINNING Kolos Molnár 1,2*, Tibor Czigány 1,2 1 Department of Polymer Engineering, Faculty of Mechanical Engineering, Budapest
Supporting Information
 Supporting Information In situ Active Poling of Nanofibers Network for Gigantically Enhanced Particulate Filtration Chun Xiao Li,, Shuang Yang Kuang,, Yang Hui Chen,, Zhong Lin Wang,,,#, Congju Li, and
FLUIDNATEK CUTTING EDGE ELECTROSPINNING & ELECTROSPRAYING DEVICES
 FLUIDNATEK CUTTING EDGE ELECTROSPINNING & ELECTROSPRAYING DEVICES by THE FLUIDNATEK TOOLS we create the future USE CASES FLUIDNATEK Lab Tools are research instruments designed for the fabrication of small
WOVEN FABRIC CREATED BY NANOFIBROUS YARNS
 WOVEN FABRIC CREATED BY NANOFIBROUS YARNS Jiří Chvojka a, Martina Pokorná b, David Lukáš a a Technical University of Liberec, Faculty of Textile Engineering, Department of Nonwovens, Studentska 2., 461
E-TEAM. Characterisation of Polyamide 6 Nanofibres. European Masters in Textile Engineering. Özgür Ceylan. Promoter: Karen De Clerck.
 Association of Universities for Textiles E-TEAM European Masters in Textile Engineering Characterisation of Polyamide 6 Nanofibres Özgür Ceylan Promoter: Karen De Clerck Ghent University Academic year:
Advanced Materials for Thermal Management of Electronic Packaging
 Xingcun Colin Tong Advanced Materials for Thermal Management of Electronic Packaging Sprin ger Contents 1 Thermal Management Fundamentals and Design Guides in Electronic Packaging 1 Rationale of Thermal
Electrospinning and Porosity Measurements of Nylon- 6/Poly(ethylene oxide) Blended Nonwovens
 Blended Nonwovens") Electrospinning and Porosity Measurements of Nylon- 6/Poly(ethylene oxide) Blended Nonwovens Margaret W. Frey, Ph.D. 1 and Lei Li, Ph.D. 1 1 Department of Textiles and Apparel, Cornell University, Ithaca
Electrospinning and Porosity Measurements of Nylon- 6/Poly(ethylene oxide) Blended Nonwovens Margaret W. Frey, Ph.D. 1 and Lei Li, Ph.D. 1 1 Department of Textiles and Apparel, Cornell University, Ithaca
Development of the fabrication process of carbon nanotube reinforced polylactide acid nanofiber and evaluation of its mechanical properties
 Composites: Advances in Manufacture and Characterisation 1 Development of the fabrication process of carbon nanotube reinforced polylactide acid nanofiber and evaluation of its mechanical properties K.
New Breakthroughs in Water Purification
 Fiber Nanofiber d 300nm Functionalized soft matter: Using plastics, instead of expensive ceramic materials Nanofiber Technology & Molecular Engineering for Environment: Application to Water Purification
Electrospun Nanofibers as Separators in Li-ion in Batteries. Dr. Cagri Tekmen Elmarco Ltd., Sekido, Tama, Sekido Bld 4F, Tokyo , Japan
 Electrospun Nanofibers as Separators in Li-ion in Batteries Dr. Cagri Tekmen Elmarco Ltd., 3-4-1 Sekido, Tama, Sekido Bld 4F, Tokyo 206-0011, Japan 1. Introduction One-dimensional (1D) nanostructures -having
Mechanical performance of bacterial cellulose nanofibre-reinforced epoxy composites
 High Performance Structure and Materials VI 379 Mechanical performance of bacterial cellulose nanofibre-reinforced epoxy composites H. Takagi1, A. N. Nakagaito1 & K. Uchida2 1 2 Institute of Technology
Nanotechnology Principles, Applications, Careers, and Education. Copyright 2011 The Pennsylvania State University
 Nanotechnology Principles, Applications, Careers, and Education Copyright 2011 The Pennsylvania State University Outline What are the principles of nanotechnology? What are some applications? What kind
Supporting Information
 Supporting Information Novel Interwoven Polymer Composites via Dual- Electrospinning with Shape Memory/Self-healing Properties Jaimee M. Robertson, Hossein Birjandi Nejad, Patrick T. Mather* Syracuse Biomaterials
A Belt-like superfine film fabricated by bubble-electrospinning Hao Dou 1,a, Bao-qi Zuo 1
 Advanced Materials Research Online: 2013-11-21 ISSN: 1662-8985, Vol. 843, pp 82-85 doi:10.4028/www.scientific.net/amr.843.82 2014 Trans Tech Publications, Switzerland A Belt-like superfine film fabricated
Enhancement of connectivity and flux pinning in MgB2 superconducting bulks and wires
 University of Wollongong Research Online University of Wollongong Thesis Collection 1954-2016 University of Wollongong Thesis Collections 2009 Enhancement of connectivity and flux pinning in MgB2 superconducting
National Center for Nanoscience and Technology, China
 National Center for Nanoscience and Technology, China National Center for Nanoscience and Technology, China (NCNST) is co-founded by the Chinese Academy of Sciences and Ministry of Education, on December
AC : NANOENGINEERING OF STRUCTURAL MATERIALS
 AC 2007-2018: NANOENGINEERING OF STRUCTURAL MATERIALS Ajit Kelkar, North Carolina A&T State University Dr. Ajit D.Kelkar is a Director of Computational Science and Engineering and Professor of Mechanical
Nanofibrillated Cellulose Fibers:
 Nanofibrillated Cellulose Fibers: Where Size Matters in Opening New Markets to Nanofiber Usage Presentation to 2008 TAPPI Nanotechnology Conference June 25-27, 27, 2008 St Louis, MO By E.C. Homonoff, R.E.
Quantitative analysis of human mesenchymal stem cell alignment by electrospun polymer nanofibrous scaffolds
 Quantitative analysis of human mesenchymal stem cell alignment by electrospun polymer nanofibrous scaffolds Nicole Green 1, Joel Wise 2, Dr. Michael Cho 2, Dr. Constantine Megaridis 3 1 Department of Chemical
β Silicon Carbide Coated MWCNTs Reinforced Polyetherimide Nanocomposites
 β Silicon Carbide Coated MWCNTs Reinforced Polyetherimide Nanocomposites β Silicon Carbide Coated MWCNTs Reinforced Polyetherimide Nanocomposites Nitin Nagar, K.N. Pandey *, Pratibha Singh, Vishal Verma,
Influence of alkali treatment on the properties of the Vietnamese bagasse fiber
 Volume 02 - Issue 12 December 2017 PP. 14-18 Influence of alkali treatment on the properties of the Vietnamese bagasse fiber Bach Trong Phuc 1, Nguyen Thanh Liem 1 1 (Polymer Center, Hanoi University of
INFLUENCE OF THE SURFACE MORPHOLOGY AT SPECIFIC SURFACE AREA OF MICROFIBRES MADE FROM POLY (L-LACTIDE) MACAJOVÁ Eva
 MACAJOVÁ Eva") INFLUENCE OF THE SURFACE MORPHOLOGY AT SPECIFIC SURFACE AREA OF MICROFIBRES MADE FROM POLY (L-LACTIDE) MACAJOVÁ Eva Department of Material Science, Technical University of Liberec, Liberec, Czech Republic,
INFLUENCE OF THE SURFACE MORPHOLOGY AT SPECIFIC SURFACE AREA OF MICROFIBRES MADE FROM POLY (L-LACTIDE) MACAJOVÁ Eva Department of Material Science, Technical University of Liberec, Liberec, Czech Republic,
Bridging Nanoscience and Manufacturing
 Bridging Nanoscience and Manufacturing Xiaochun Li Professor and Raytheon Chair in Manufacturing Department of Mechanical and Aeropsace Engineering UCLA Bridging Nanoscience and Manufacturing Penetration
Verifying the electrostatic theory of whiskers University of Toledo
 Verifying the electrostatic theory of whiskers University of Toledo 1 E h Electrostatic theory of metal whiskers in 1 slide d F hd pe h d E hd h E 3 2 hd h E L h 3 2 0 2 2 0 2 2 0 2 ( d L E ) h d EL 2
Mechanical and Tribological Properties of Epoxy Nanocomposites
 Chapter 7 Mechanical and Tribological Properties of Epoxy Nanocomposites 7.1 Introduction This chapter discusses the mechanical and tribological properties of silicon dioxide (SiO 2 ) and alumina (Al 2
The Preparation of C/Ni Composite Nanofibers with Pores by Coaxial Electrospinning
 2016 International Conference on Intelligent Manufacturing and Materials (ICIMM 2016) ISBN: 978-1-60595-363-2 The Preparation of C/Ni Composite Nanofibers with Pores by Coaxial Electrospinning Yiqiang
Polyacrylonitrile nanofibre yarn; electrospinning and their post-drawing behaviour
 Polyacrylonitrile nanofibre yarn; electrospinning and their post-drawing behaviour by Zhigang Xie (B. Eng) Submitted in fulfilment of the requirements of the degree of Master of Philosophy Deakin University
Electrospinning and Polarization of PVDF Fiber Mats for Adsorption of NaCl
 The University of Akron IdeaExchange@UAkron Honors Research Projects The Dr. Gary B. and Pamela S. Williams Honors College Electrospinning and Polarization of PVDF Fiber Mats for Adsorption of NaCl Michael
Development of Piezoelectric Nanocomposites for Energy Harvesting and Self-Sensing
 Development of Piezoelectric Nanocomposites for Energy Harvesting and Self- Kenneth J. Loh Assistant Professor Department of Civil & Environmental Engineering University of California, Davis The Applied
Structural Composite Materials
 Structural Composite Materials F.C. Campbell The Materials Information Society ASM International Materials Park, Ohio 44073-0002 www.asminternational.org Contents Preface About the Author xi xv Chapter
ENCHANCEMENT OF MECHANICAL PROPERTIES OF CAST NANO CABONS REINFORCED A356 ALUMINIUM MATRIX COMPOSITES
 THE 19 TH INTERNATIONAL CONFERENCE ON COMPOSITE MATERIALS ENCHANCEMENT OF MECHANICAL PROPERTIES OF CAST NANO CABONS REINFORCED A356 ALUMINIUM MATRIX COMPOSITES S.-B. Lee 1*, J.-W. Yi 1, B.M. Jung 1, and
CONTENTS. Figures... Introduction Conclusion Appendix A: Technology and Applied R&D Needs for Electrical Energy Storage...
 CONTENTS Page Figures... Abbreviations, Acronyms, and Initialisms... Executive Summary of the DOE Basic Energy Sciences Workshop... v vii ix Introduction... 1 Basic Research Needs for Electrical Energy
Preparation of Polyacrylonitrile Nanofibers by Solution Blowing Process
 Preparation of Polyacrylonitrile Nanofibers by Solution Blowing Process Xupin Zhuang, Kaifei Jia, Bowen Cheng, Ketian Guan, Weimin Kang, Yuanlin Ren Tianjin Polytechnic University, Tianjin CHINA Correspondence
So What Is Nanotechnology
 So What Is Nanotechnology Science of Technology 2011 Project Lead The Way, Inc. What Is Nanotechnology? Nanotechnology allows the manipulation of atoms or molecules to create or modify materials at the
Improvement in the mechanical properties of light curing epoxy resin with micro-fibrillated cellulose
 Natural Filler and Fibre Composites: Development and Characterisation 95 Improvement in the mechanical properties of light curing epoxy resin with micro-fibrillated cellulose Y. Ohnishi, T. Fujii & K.
STUDIES ON DRY-JET-WET SPINNING OF POLY(LACTIC ACID) FILAMENT AND ITS KNITTING. Doctor of Philosophy
 FILAMENT AND ITS KNITTING. Doctor of Philosophy") STUDIES ON DRY-JET-WET SPINNING OF POLY(LACTIC ACID) FILAMENT AND ITS KNITTING By NILESH S. REVAGADE Department of Textile Technology Submitted In fulfillment of the requirements of the degree of Doctor
STUDIES ON DRY-JET-WET SPINNING OF POLY(LACTIC ACID) FILAMENT AND ITS KNITTING By NILESH S. REVAGADE Department of Textile Technology Submitted In fulfillment of the requirements of the degree of Doctor
Mater. Res. Soc. Symp. Proc. Vol Materials Research Society
 Mater. Res. Soc. Symp. Proc. Vol. 940 2006 Materials Research Society 0940-P13-12 A Novel Fabrication Technique for Developing Metal Nanodroplet Arrays Christopher Edgar, Chad Johns, and M. Saif Islam
THROUGH-THICKNESS MELDING OF ADVANCED CFRP FOR AEROSPACE APPLICATIONS
 THROUGH-THICKNESS MELDING OF ADVANCED CFRP FOR AEROSPACE APPLICATIONS RJ Caspe, VL Coenen, A Nesbitt, RJ Day and AN Wilkinson Northwest Composites Centre University of Manchester, Paper Science Building,
CHARACTERISTICS OF ELASTOMERIC NANOFIBER MEMBRANES PRODUCED BY ELECTROSPINNING
 CHARACTERISTICS OF ELASTOMERIC NANOFIBER MEMBRANES PRODUCED BY ELECTROSPINNING Yoshihiro Yamashita*, Akira Tanaka* and Frank Ko** *Department of Materials Science, The University of Shiga Prefecture 5
CELLULOSE/POLYSULFONE NANOCOMPOSITES. Graduate Student: Sweda Noorani. Advisors: Dr John Simonsen Dr Sundar Atre
 CELLULOSE/POLYSULFONE NANOCOMPOSITES Graduate Student: Sweda Noorani Advisors: Dr John Simonsen Dr Sundar Atre OSU Oregon State University Corvallis,Oregon INTRODUCTION CONTENTS EXPERIMENTAL METHODS RESULTS
Design, Fabrication, and Testing of an Electrospinning Apparatus for the Deposition of PMMA Polymer for Biomedical Applications
 Inquiry: The University of Arkansas Undergraduate Research Journal Volume 12 Article 11 Fall 2011 Design, Fabrication, and Testing of an Electrospinning Apparatus for the Deposition of PMMA Polymer for
Reduced Viscosity Nanotechnology Leading to Enhanced Mechanical Properties and Lower Viscosity for Improving Infusion Processing of Composites
 Reduced Viscosity Nanotechnology Leading to Enhanced Mechanical Properties and Lower Viscosity for Improving Infusion Processing of Composites W. H. Katie Zhong, PhD Westinghouse Distinguished Professor
Carbon-fiber Reinforced Concrete with Short Aramid-fiber Interfacial Toughening
 2016 International Conference on Electronic Information Technology and Intellectualization (ICEITI 2016) ISBN: 978-1-60595-364-9 Carbon-fiber Reinforced Concrete with Short Aramid-fiber Interfacial Toughening
Articular Cartilage Engineering Using Human Mesenchymal Stem Cells and Nanostructured Biomaterials
 Articular Cartilage Engineering Using Human Mesenchymal Stem Cells and Nanostructured Biomaterials REU Participant: Nicole Green 1 Advisors: Joel Wise 2, Dr. Michael Cho 2, Dr. Constantine Megaridis 3
Improvement in the mechanical properties of light curing epoxy resin with MFC (Micro-Fibrillated Cellulose)
") High Performance Structures and Materials IV 139 Improvement in the mechanical properties of light curing epoxy resin with MFC (Micro-Fibrillated Cellulose) Y. Ohnishi 1, T. Fujii 2 & K. Okubo 2 1 Graduate
High Performance Structures and Materials IV 139 Improvement in the mechanical properties of light curing epoxy resin with MFC (Micro-Fibrillated Cellulose) Y. Ohnishi 1, T. Fujii 2 & K. Okubo 2 1 Graduate
Micro-Tensile Behavior of AA7020/Carbon Black Nanoparticle Metal Matrix Composites
 Research Inventy: International Journal of Engineering And Science Vol.6, Issue 8 (September 2016), PP -36-40 Issn (e): 2278-4721, Issn (p):2319-6483, www.researchinventy.com Micro-Tensile Behavior of
SIZE EFFECTS OF SIC PARTICLES ON MECHNICAL PROPERTIES OF CAST CARBON NANOFIBERS REINFORCED AZ91 MAGNESIUM COMPOSITES
 THE 19 TH INTERNATIONAL CONFERENCE ON COMPOSITE MATERIALS SIZE EFFECTS OF SIC PARTICLES ON MECHNICAL PROPERTIES OF CAST CARBON NANOFIBERS REINFORCED AZ91 MAGNESIUM COMPOSITES S.-K. Lee 1, S.-B. Lee 1*,
Polymer Nanofiber-Guided Uniform Lithium Deposition for Battery Electrodes
 Polymer Nanofiber-Guided Uniform Lithium Deposition for Battery Electrodes Zheng Liang, Guangyuan Zheng, Chong Liu, Nian Liu, Weiyang Li, Kai Yan, Hongbin Yao, Po-Chun Hsu, Steven Chu, and Yi Cui *,, Department
Introduction to Composites
 Section 1 Introduction to Composites By definition, composite materials are formed from two or more materials that have quite different properties. The resultant material has a heterogeneous microstructure
DIRECT MEASUREMENT ON FRACTURE TOUGHNESS OF CARBON FIBER ABSTRACT
 DIRECT MEASUREMENT ON FRACTURE TOUGHNESS OF CARBON FIBER Yasuo Kogo 1, Yuta Imafuku 2, and Shinji Ogihara 3 1 Dept. of Materials Science, Tokyo University of Science, 2641, Yamazaki, Noda, Chiba 278-8510,
Analysis and design of composite structures
 Analysis and design of composite structures Class notes 1 1. Introduction 2 Definition: composite means that different materials are combined to form a third material whose properties are superior to those
EE 45X Biomedical Nanotechnology. Course Proposal
 EE 45X Biomedical Nanotechnology 1 Introduction Jie Chen ECERF W6-019 492-9820 jchen@ece.ualberta.ca Oct. 15, 2008 The purpose of this document is to propose a new course in the area of Biomedical Nanotechnology
Nanoparticle Shape Effects on Sintering Temperatures
 1 Nanoparticle Shape Effects on Sintering Temperatures Prepared by: Ryan Foy Advisors: Dr. Jon Kellar Assistant REU Site Director, Department of Materials and Metallurgical Engineering Dr. Michael West
Versatile Core-Sheath Biofibers using Coaxial Electrospinning
 Mater. Res. Soc. Symp. Proc. Vol. 1094 2008 Materials Research Society 1094-DD06-02 Versatile Core-Sheath Biofibers using Coaxial Electrospinning Daewoo Han 1, Steven T. Boyce 2, and Andrew J. Steckl 1
Interfacial state and characteristics of cold-sprayed copper coatings on aluminum substrate
 IOP Conference Series: Materials Science and Engineering OPEN ACCESS Interfacial state and characteristics of cold-sprayed copper coatings on aluminum substrate To cite this article: Yuichiro Yamauchi
Influence of Angle Ply Orientation on Tensile Properties of Carbon/Glass Hybrid Composite
 Journal of Minerals and Materials Characterization and Engineering, 2013, 1, 231-235 http://dx.doi.org/10.4236/jmmce.2013.15036 Published Online September 2013 (http://www.scirp.org/journal/jmmce) Influence
Moving toward Sustainability
 Nanotechnology and the Environment: Moving toward Sustainability Barbara Karn, PhD Health and Environment Organization April 17, 2012 A bit of history Nanotechnology is enabled Nanotechnology is recognized
Xantu.Layr nanofibre interleaving veils provide a technological leap forward for the toughening of high performance composites.
 Continuous Nanofibre. Performance composites Xantu.Layr nanofibre interleaving veils provide a technological leap forward for the toughening of high performance composites. Xantu.Layr enhances composite
Polyamide 6 Fibers with Superior Mechanical Properties : TPU Coating Techniques
 Transaction Polyamide 6 Fibers with Superior Mechanical Properties : TPU Coating Techniques Baiju John 1, Suguru Motokucho 2, Ken Kojio 2, and Mutsuhisa Furukawa 1 1 Division of Materials Science, Graduate
Novel concept of rechargeable battery using iron oxide nanorods. anode and nickel hydroxide cathode in aqueous electrolyte
 Supplementary Information for: Novel concept of rechargeable battery using iron oxide nanorods anode and nickel hydroxide cathode in aqueous electrolyte Zhaolin Liu *, Siok Wei Tay and Xu Li Institute
Energy Dissipation Mechanism Based Materials and Materials Systems Design
 Energy Dissipation Mechanism Based Materials and Materials Systems Design Wing Kam Liu w-liu@northwestern.edu Walter P. Murphy Professor of Mechanical and Civil Engineering President, International Association
Progress on Cellulose Nanofiber-filled Thermoplastic Composites
 Progress on Cellulose Nanofiber-filled Thermoplastic Composites Douglas J. Gardner, Yousoo Han, Alper Kiziltas, and Yucheng Peng University of Maine Advanced Structures and Composites Center Orono, Maine
CRYSTALLOGRAPHIC MATCHING EFFECT IN SELF-INDUCED NANOHYBRID SHISH-KEBAB STRUCTURE OF POLY E-CAPROLACTONE)
") CRYSTALLOGRAPHIC MATCHING EFFECT IN SELF-INDUCED NANOHYBRID SHISH-KEBAB STRUCTURE OF POLY E-CAPROLACTONE) Xiaofeng Wang, 1,2 Yanhong Gao, 2,3 Yiyang Xu, 1,2 Xuyan Li, 1,2 Lin Jiang, 2,3 Qian Li, 1,2* 1
CRYSTALLOGRAPHIC MATCHING EFFECT IN SELF-INDUCED NANOHYBRID SHISH-KEBAB STRUCTURE OF POLY E-CAPROLACTONE) Xiaofeng Wang, 1,2 Yanhong Gao, 2,3 Yiyang Xu, 1,2 Xuyan Li, 1,2 Lin Jiang, 2,3 Qian Li, 1,2* 1
SHORT FIBER INTERFACIAL TOUGHENING FOR COMPOSITE-FOAM SANDWICH Z. Sun 1,2, S.Y. Sun 1,2, S.S. Shi 1,2, H.R. Chen 1*, X.Z. Hu 2*
 SHORT FIBER INTERFACIAL TOUGHENING FOR COMPOSITE-FOAM SANDWICH Z. Sun 1,2, S.Y. Sun 1,2, S.S. Shi 1,2, H.R. Chen 1*, X.Z. Hu 2* 1 State Key Laboratory of Structural Analysis for Industrial Equipment, Dalian
Preparation of Electrospun Piezoelectric Polyvinylidene Fluoride Nanofibers
 Preparation of Electrospun Piezoelectric Polyvinylidene Fluoride Nanofibers Jerrell Walker, Electrical Engineering student at the University of Pennsylvania, SUNFEST Fellow Dr. Jorge J. Santiago - Aviles,
EQUIPMENT FOR OBTAINING NANOFIBERS THROUGH THE ELECTROSPINNING SYSTEM
 International Journal of Modern Manufacturing Technologies ISSN 2067 3604, Vol. IIII, No. 2 / 2011 105 EQUIPMENT FOR OBTAINING NANOFIBERS THROUGH THE ELECTROSPINNING SYSTEM Roxana Scârlet 1, Liliana-Rozemarie
Supporting Information
 Copyright WILEY-VCH Verlag GmbH & Co. KGaA, 69469 Weinheim, Germany, 2013. Supporting Information for Adv. Mater., DOI: 10.1002/adma.201300794 Highly Stretchable Patterned Gold Electrodes Made of Au Nanosheets
MORPHOLOGY CONTROLLED ELECTROSPUN POLY(VINYL PYRROLIDONE) FIBERS: EFFECTS OF ORGANIC SOLVENT AND RELATIVE HUMIDITY
 FIBERS: EFFECTS OF ORGANIC SOLVENT AND RELATIVE HUMIDITY") Journal of Materials Science and Engineering with Advanced Technology Volume 2, Number 1, 2010, Pages 97-112 MORPHOLOGY CONTROLLED ELECTROSPUN POLY(VINYL PYRROLIDONE) FIBERS: EFFECTS OF ORGANIC SOLVENT
Journal of Materials Science and Engineering with Advanced Technology Volume 2, Number 1, 2010, Pages 97-112 MORPHOLOGY CONTROLLED ELECTROSPUN POLY(VINYL PYRROLIDONE) FIBERS: EFFECTS OF ORGANIC SOLVENT
Hierarchical Sensing System Combining Optical Fiber Network and Distributed Built-In CVM Sensors: Delamination Monitoring of CFRP Structure
 6th European Workshop on Structural Health Monitoring - Tu.4.A.3 More info about this article: http://www.ndt.net/?id=14116 Hierarchical Sensing System Combining Optical Fiber Network and Distributed Built-In
Nanotechnology Solutions for Energy
 Nanotechnology Solutions for Energy - Innovation and Sustainable Development with nanotechnology - Professor Rüdiger Iden Polymer Research BASF Aktiengesellschaft Definition Nanotechnology We define nanoscience
LOW TEMPERATURE PHOTONIC SINTERING FOR PRINTED ELECTRONICS. Dr. Saad Ahmed XENON Corporation November 19, 2015
 LOW TEMPERATURE PHOTONIC SINTERING FOR PRINTED ELECTRONICS Dr. Saad Ahmed XENON Corporation November 19, 2015 Topics Introduction to Pulsed Light Photonic sintering for Printed Electronics R&D Tools for
along the dashed line in Supplementary Fig. 1c and the thickness of CaCO3 nanoplatelets is ~320 nm.
 d 4 Height (nm) 3 2 1 32nm 1 2 3 4 Distance( m) Supplementary Figure 1 Characterization of as synthesized CaCO 3 nanoplatelets. (a) SEM image, (b) XRD pattern, (c) Typical AFM image of a single CaCO3 nanoplatelet,
Preparation and Characterization of PVA/Boron Polymer Produced by an Electrospinning Technique.
 e-polymers 2007, no. 133 http://www.e-polymers.org ISSN 1618-7229 Preparation and Characterization of PVA/Boron Polymer Produced by an Electrospinning Technique. I. Uslu, 1 H. Daştan, 1 A. Altaş, 1 A.
What is Nano? Nanoscale = billionths (10-9 ) Nano in Therapeutics 10/04/ billion components 8 inch diameter
 Nano in Therapeutics 10/04/ billion components 8 inch diameter") Nano Robots that can sail through your blood Capture and Kill foreign objects?? What is Nano? SANYAL SCI 102 Nanoscale = billionths (10-9 ) Nano in Therapeutics Drugs: up to ~10 nm Example: Insulin Surgery:
Nano Robots that can sail through your blood Capture and Kill foreign objects?? What is Nano? SANYAL SCI 102 Nanoscale = billionths (10-9 ) Nano in Therapeutics Drugs: up to ~10 nm Example: Insulin Surgery:
Supporting Information for Sub-1 nm Nanowire Based Superlattice Showing High Strength and Low Modulus Huiling Liu,, Qihua Gong, Yonghai Yue,*,
 Supporting Information for Sub-1 nm Nanowire Based Superlattice Showing High Strength and Low Modulus Huiling Liu,, Qihua Gong, Yonghai Yue,*, Lin Guo*, and Xun Wang*, *To whom correspondence should be
1. 3 Extrusion molding
 1. 3 Extrusion molding 9 Extrusion is a widely used technique, both in the field of traditional and technical ceramics. This method allows the continuous manufacture of products with a constant cross-
DEVELOPMENT OF NANOFIBERS REINFORCED POLYMER COMPOSITE FOR SPACE APPLICATION
 DEVELOPMENT OF NANOFIBERS REINFORCED POLYMER COMPOSITE FOR SPACE APPLICATION H.M.S. Iqbal, S.Bhowmik, R.Benedictus Faculty of Aerospace Engineering, Delft University of Technology Kluyverweg 1, 2629 HS,
Mechanical Behavior of Glass Fiber Reinforced Polymer Pultruded Composite Gratings
 Modern Mechanical Engineering, 213, 3, 142-146 Published Online November 213 (http://www.scirp.org/journal/mme) http://dx.doi.org/1.4236/mme.213.342 Mechanical Behavior of Glass Fiber Reinforced Polymer
Investigation of Electrospinning with the Use of a Multi-jet Electrospinning Head
 Wacław Tomaszewski, Marek Szadkowski Institute of Chemical Fibres ul. M.Skłodowskiej-Curie 19/27, 90-570 Łódź, Poland e-mail: kangurek@iwch.lodz.pl Investigation of Electrospinning with the Use of a Multi-jet
Continuous Synthesis of Carbon Nanoclusters Using Well-Controlled Thermal Plasmas
 Continuous Synthesis of Carbon Nanoclusters Using Well-Controlled Thermal Plasmas T. Ohishi*, Y. Yoshihara and O. Fukumasa Graduate School of Science and Engineering, Yamaguchi University, 2-16-1 Tokiwadai,
Superhydrophobic Nanocomposites Coating Using Electrospinning Technique on Different Materials
 Superhydrophobic Nanocomposites Coating Using Electrospinning Technique on Different Materials Prof. Dr. Balkees Mohammed Diaa University of Technology, Baghdad, Iraq. Hassan Talal Jaafar University of
New developments to Capture the Manufacturing Process of Composite Structures in LS-DYNA
 New developments to Capture the Manufacturing Process of Composite Structures in LS-DYNA Gregor Knust, Thomas Klöppel, André Haufe, Christian Liebold DYNAmore GmbH, Stuttgart Oasys LS-DYNA Users Meeting
Specimen Preparation Technique for a Microstructure Analysis Using the Focused Ion Beam Process
 Specimen Preparation Technique for a Microstructure Analysis Using the Focused Ion Beam Process by Kozue Yabusaki * and Hirokazu Sasaki * In recent years the FIB technique has been widely used for specimen
ON MINIMISING THE OBTRUSIVITY OF AN OPTICAL FIBRE SENSOR WITH RESPECT TO MATRIX CRACKING
 ON MINIMISING THE OBTRUSIVITY OF AN OPTICAL FIBRE SENSOR WITH RESPECT TO MATRIX CRACKING E.N. Barton 1, S.L. Ogin 1, A.M.Thorne 2 and G.T. Reed 3 1 School of Mechanical and Material Engineering 2 School